Embed Size (px)
Citation preview

Q U A R T E R L Y S T A T E M E N T
of the BayWa Group1 January until 30 September 2017
C O N T A C TBayWa AG Investor Relat ions Arabel lastr . 4 81925 Munich, Germany i [email protected] www.baywa.com

Quarterly Statement of the BayWa Group for the Period from 1 January to
30 September 2017
Further rise in full-year earnings expected
➢ All three core operating segments – Agriculture, Energy and Building Materials –
increase revenues and earnings year on year
➢ Significant improvement in operating performance despite negative one-off effects
in € million Q3/17 Q3/16 % 9M/17 9M/16 %
Revenues 3,936.3 3,982.9 - 1.2 11,980.3 11,439.3 4.7
EBIT 17.5 30.1 - 41.9 90.3 85.4 5.7
The international trading and services group BayWa is reporting an increase in revenues to
around €12.0 billion (9M/2016: €11.4 billion) in the first nine months of the current financial
year. Earnings before interest and tax of €90.3 million were 5.7% up year on year as at
30 September 2017. This improvement in earnings was carried by all three core operating
segments. In terms of agriculture, the extremely positive development of agricultural
equipment business overcompensated in particular for the weather-related losses in fruit
trading. In addition, the BayWa Agricultural Sales (BAV) business unit closed this year’s
harvest quarter up on the previous year, as did grain and oilseed trading activities, in spite of
restructuring costs. This marks a continuation of the recovery observed in the Agriculture
Segment, which is likely to make further gains in the final quarter. The Energy Segment
benefited both from higher volumes of fuel sales and the further expansion of renewable
energy project and service business. The increase in revenues and earnings in the Building
Materials Segment was predominantly due to an increase in the volume of building materials
sales caused by general economic conditions.
Highlights in the third quarter of 2017
– Expansion of renewable energy business in Australia with the acquisition of wind park
developer Future Energy and the opening of a new site in Melbourne.
– Acquisition of a 51% stake in Landhandel Knaup GmbH, Borchen-Alfen.
– Acquisition of a majority stake of 51% in Vista Geowissenschaftliche Fernerkundung
GmbH, Munich, a service development firm for satellite applications.
– Selection of the start-ups taking part in this year’s Acceleration Programme organised by
Agro Innovation Lab (joint innovation platform run by BayWa and RWA).
1

BayWa Group: Earnings Development from 1 January to 30 September 2017
➢ The revenues of the BayWa Group came to €11,980.3 million in the first nine months of
the 2017 financial year, increasing by €541.0 million, or 4.7%, year on year.
➢ Other operating income of the BayWa Group stood at €109.8 million, down €18.0 million
on the previous year. This fall was largely due to lower income from price gains.
➢ The cost of materials rose by €398.0 million, or 3.8%, in the reporting period and
therefore by a disproportionately lower margin compared to revenues. As a consequence,
the gross profit generated by the BayWa Group in the period from January to September
increased by €107.9 million, or 9.3%, to €1,274.2 million.
➢ The rise in personnel expenses by €45.3 million, or 7.0%, to €694.1 million was primarily
due to the additional business activities resulting from companies acquired in the current
and previous financial years, as well as the rise in the number of employees, particularly
in the Agriculture and Energy Segments.
➢ At €97.8 million, depreciation and amortisation of property, plant and equipment and intangible assets was slightly up on the previous year’s figure of €91.9 million.
➢ Other operating expenses increased by €35.4 million, or 9.8%, year on year to €394.9
million. This increase was primarily due to the rise in expenses for IT equipment, fleet and
maintenance costs and increased expenses for advertising.
➢ The result of operating activities generated in the first nine months of the year stood at
€87.3 million, up €21.3 million, or 32.3%, on the previous year’s figure.
➢ The €16.4 million fall in the result of participating interests was due to declines in
shares recognised at equity (down by €13.9 million) and in other income from
shareholdings (down by €2.5 million) and is largely affected by the disposal of several
shareholdings in the financial year, but also by effects in the previous year.
➢ The BayWa Group’s EBIT came to €90.3 million in the first three quarters of 2017.
Compared to the previous year, this equates to a rise of €4.9 million, or 5.7%.
➢ Net interest amounted to €–52.1 million and remained almost on a par with the previous
year’s figure.
➢ Considering tax expenses of €10.2 million, the BayWa Group generated a net result of
€28.0 million (9M/2016: €25.0 million) in the first nine months of the current financial year.
2
BayWa Group: Assets Development from 1 January to 30 September 2017
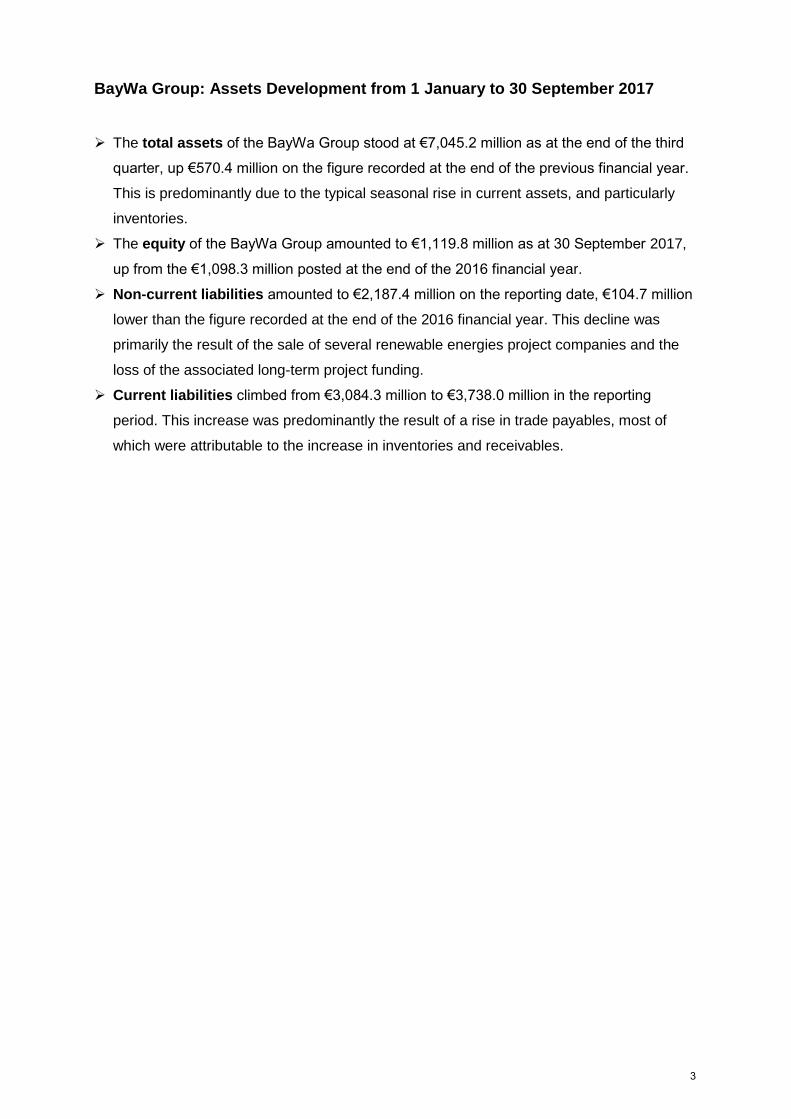
➢ The total assets of the BayWa Group stood at €7,045.2 million as at the end of the third
quarter, up €570.4 million on the figure recorded at the end of the previous financial year.
This is predominantly due to the typical seasonal rise in current assets, and particularly
inventories.
➢ The equity of the BayWa Group amounted to €1,119.8 million as at 30 September 2017,
up from the €1,098.3 million posted at the end of the 2016 financial year.
➢ Non-current liabilities amounted to €2,187.4 million on the reporting date, €104.7 million
lower than the figure recorded at the end of the 2016 financial year. This decline was
primarily the result of the sale of several renewable energies project companies and the
loss of the associated long-term project funding.
➢ Current liabilities climbed from €3,084.3 million to €3,738.0 million in the reporting
period. This increase was predominantly the result of a rise in trade payables, most of
which were attributable to the increase in inventories and receivables.
3
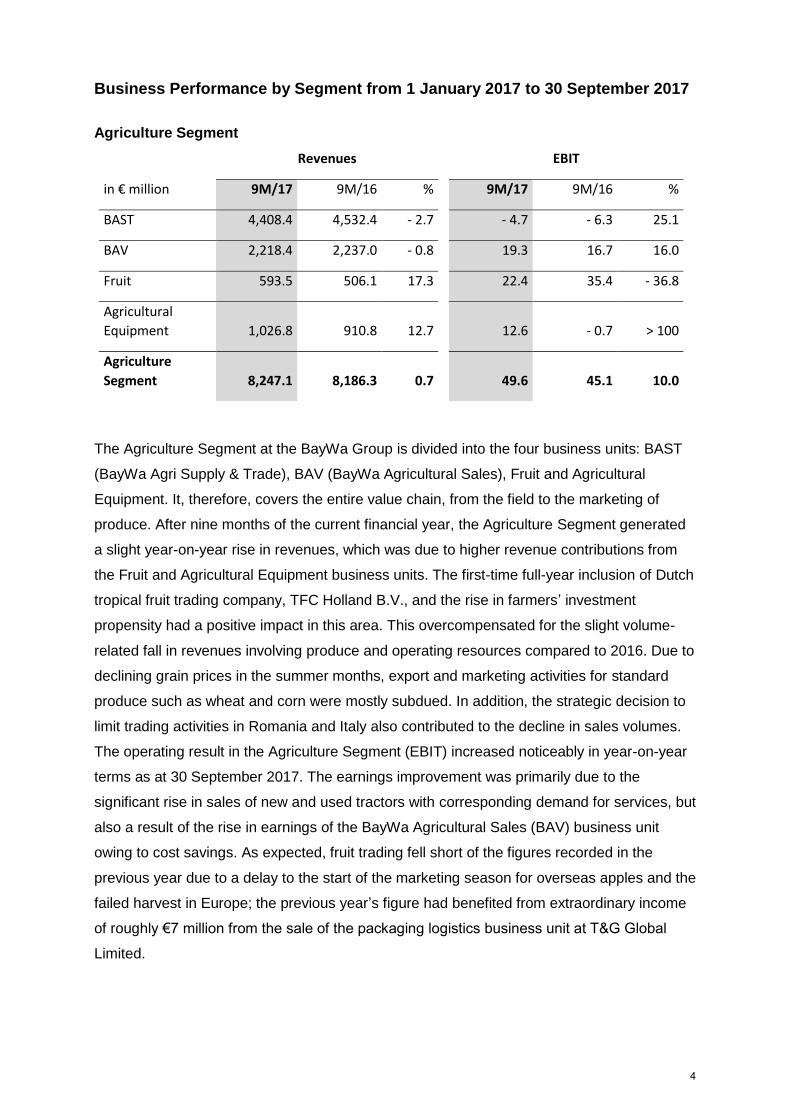
Business Performance by Segment from 1 January 2017 to 30 September 2017
Agriculture Segment
Revenues EBIT
in € million 9M/17 9M/16 % 9M/17 9M/16 %
BAST 4,408.4 4,532.4 - 2.7 - 4.7 - 6.3 25.1
BAV 2,218.4 2,237.0 - 0.8 19.3 16.7 16.0
Fruit 593.5 506.1 17.3 22.4 35.4 - 36.8
Agricultural
Equipment 1,026.8 910.8 12.7 12.6 - 0.7 > 100
Agriculture
Segment 8,247.1 8,186.3 0.7 49.6 45.1 10.0
The Agriculture Segment at the BayWa Group is divided into the four business units: BAST
(BayWa Agri Supply & Trade), BAV (BayWa Agricultural Sales), Fruit and Agricultural
Equipment. It, therefore, covers the entire value chain, from the field to the marketing of
produce. After nine months of the current financial year, the Agriculture Segment generated
a slight year-on-year rise in revenues, which was due to higher revenue contributions from
the Fruit and Agricultural Equipment business units. The first-time full-year inclusion of Dutch
tropical fruit trading company, TFC Holland B.V., and the rise in farmers’ investment
propensity had a positive impact in this area. This overcompensated for the slight volume-
related fall in revenues involving produce and operating resources compared to 2016. Due to
declining grain prices in the summer months, export and marketing activities for standard
produce such as wheat and corn were mostly subdued. In addition, the strategic decision to
limit trading activities in Romania and Italy also contributed to the decline in sales volumes.
The operating result in the Agriculture Segment (EBIT) increased noticeably in year-on-year
terms as at 30 September 2017. The earnings improvement was primarily due to the
significant rise in sales of new and used tractors with corresponding demand for services, but
also a result of the rise in earnings of the BayWa Agricultural Sales (BAV) business unit
owing to cost savings. As expected, fruit trading fell short of the figures recorded in the
previous year due to a delay to the start of the marketing season for overseas apples and the
failed harvest in Europe; the previous year’s figure had benefited from extraordinary income
of roughly €7 million from the sale of the packaging logistics business unit at T&G Global
Limited.
4
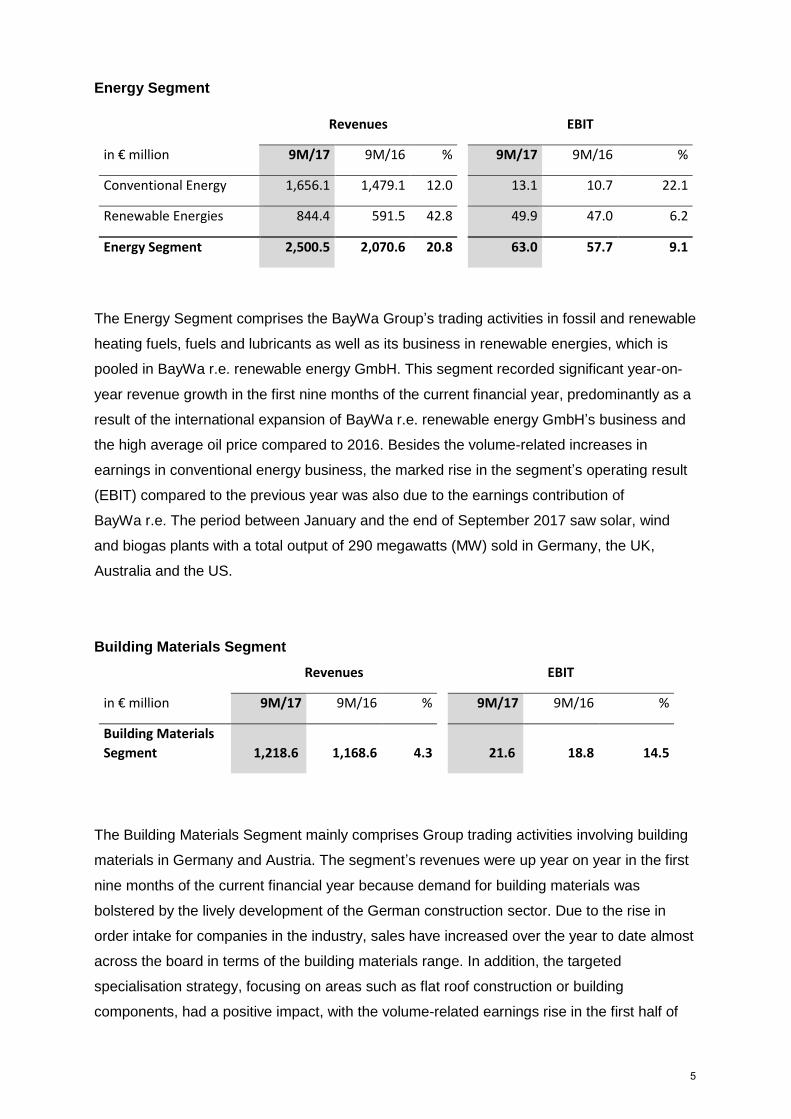
Energy Segment
Revenues EBIT
in € million 9M/17 9M/16 % 9M/17 9M/16 %
Conventional Energy 1,656.1 1,479.1 12.0 13.1 10.7 22.1
Renewable Energies 844.4 591.5 42.8 49.9 47.0 6.2
Energy Segment 2,500.5 2,070.6 20.8 63.0 57.7 9.1
The Energy Segment comprises the BayWa Group’s trading activities in fossil and renewable
heating fuels, fuels and lubricants as well as its business in renewable energies, which is
pooled in BayWa r.e. renewable energy GmbH. This segment recorded significant year-on-
year revenue growth in the first nine months of the current financial year, predominantly as a
result of the international expansion of BayWa r.e. renewable energy GmbH’s business and
the high average oil price compared to 2016. Besides the volume-related increases in
earnings in conventional energy business, the marked rise in the segment’s operating result
(EBIT) compared to the previous year was also due to the earnings contribution of
BayWa r.e. The period between January and the end of September 2017 saw solar, wind
and biogas plants with a total output of 290 megawatts (MW) sold in Germany, the UK,
Australia and the US.
Building Materials Segment
Revenues EBIT
in € million 9M/17 9M/16 % 9M/17 9M/16 %
Building Materials
Segment 1,218.6 1,168.6 4.3 21.6 18.8 14.5
The Building Materials Segment mainly comprises Group trading activities involving building
materials in Germany and Austria. The segment’s revenues were up year on year in the first
nine months of the current financial year because demand for building materials was
bolstered by the lively development of the German construction sector. Due to the rise in
order intake for companies in the industry, sales have increased over the year to date almost
across the board in terms of the building materials range. In addition, the targeted
specialisation strategy, focusing on areas such as flat roof construction or building
components, had a positive impact, with the volume-related earnings rise in the first half of
5

the year able to be increased further in the summer months. As a result, the segment’s
operating result (EBIT) was significantly up on the previous year’s figure as at 30 September
2017.
Innovation & Digitalisation Segment
Revenues EBIT
in € million 9M/17 9M/16 % 9M/17 9M/16 %
Innovation &
Digitalisation
Segment 4.8 4.4 9.8 - 7.9 - 6.2 - 27.6
The new Innovation & Digitalisation Segment, which was set up in the second half of 2016,
pools together all of the BayWa Group’s digital farming and e-business activities. The
significant increase in the segment’s revenues compared to the previous-year period after
the first nine months of 2017 was due to the broader range of products on offer and the
international expansion of sales activities in the summer months. Due to the year-on-year
increase in investments for the development of digital farming solutions and the new BayWa
Online World, the segment posted a €1.7 million decline in EBIT as at 30 September 2017,
as expected.
Other Activities
EBIT resulting from Other Activities, including transition, largely comprises Group
administration costs as well as consolidation effects and stood at €–36.0 million
(9M/2016: €–30.1 million) as at 30 September 2017. The year-on-year decline in earnings
was mostly due to delay effects. The final quarter is expected to provide significant relief in
this regard with one-off earnings.
6
Outlook
The outlook for the final quarter is positive for the BayWa Group’s core operating segments.
In terms of agricultural trading, high grain inventories are likely to benefit the BayWa Agri
Supply & Trade (BAST) business unit, with the global competitiveness of European quality
wheat forecast to improve over the course of the year and result in increased marketing
potential. With autumn seed-sowing delayed by weather conditions, the majority of seasonal
demand for operating resources is likely to shift into the autumn months. The Agritechnica
trade fair, which is set to be held in mid-November 2017, should have a positive impact on
agricultural equipment business and, as experience shows, usually leads to rising demand.
Fruit trading business will not be able to escape the effects of harvest losses in Germany and
Europe, as rising apple prices are not likely to fully compensate for declines in sales
volumes. Slight recovery effects are expected from overseas apple business through to the
end of the year. The Energy Segment should at least match the high level of full-year
earnings recorded in 2016, as BayWa r.e. has planned for further plant sales in Germany,
the UK, Italy and the US by the end of the year. The Big Timber wind park in the US, with a
total output of 25 MW, was sold in October. In addition, demand for heat energy carriers such
as heating oil and wood pellets is expected to rise in the upcoming winter months. In the
Building Materials Segment, the volume-related year-on-year revenue and earnings growth is
likely to continue through to the end of the year on the condition that construction activity is
not hampered by unusually poor weather conditions. All in all, the current underlying
conditions mean that significant year-on-year rises in revenues and earnings are achievable.
In addition, the Group is likely to receive extraordinary income from the marketing of the
BayWa high-rise complex in the final quarter.
The statements and figures forecast in this document are based on assumptions and are subject to unforeseeable risk. In as
much as the assumptions of the company should prove to be inaccurate, or should other unforeseeable risks occur, the
possibility of the net worth, financial position and earnings situation of the Group diverging negatively from the target figures
cited in this report should not be discounted.
Financial Calendar
Publication of the 2017 financial statements 29 March 2018, 10.00 am – Press Conference, Munich 29 March 2018, 4.00 pm – Analyst Conference, Frankfurt am Main
7
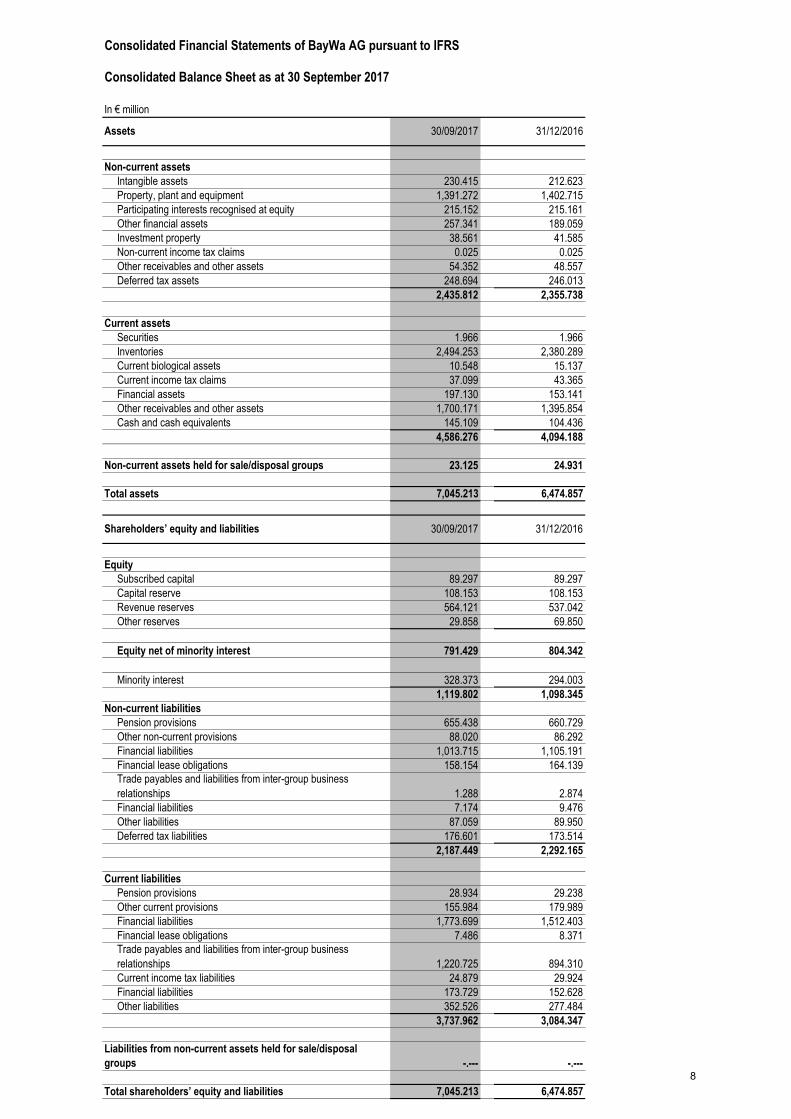
Consolidated Financial Statements of BayWa AG pursuant to IFRS
Consolidated Balance Sheet as at 30 September 2017
In € million
Non-current assets
Intangible assets 230.415 212.623
Property, plant and equipment 1,391.272 1,402.715
Participating interests recognised at equity 215.152 215.161
Other financial assets 257.341 189.059
Investment property 38.561 41.585
Non-current income tax claims 0.025 0.025
Other receivables and other assets 54.352 48.557
Deferred tax assets 248.694 246.013
2,435.812 2,355.738
Current assets
Securities 1.966 1.966
Inventories 2,494.253 2,380.289
Current biological assets 10.548 15.137
Current income tax claims 37.099 43.365
Financial assets 197.130 153.141
Other receivables and other assets 1,700.171 1,395.854
Cash and cash equivalents 145.109 104.436
4,586.276 4,094.188
Non-current assets held for sale/disposal groups 23.125 24.931
Total assets 7,045.213 6,474.857
Equity
Subscribed capital 89.297 89.297
Capital reserve 108.153 108.153
Revenue reserves 564.121 537.042
Other reserves 29.858 69.850
Equity net of minority interest 791.429 804.342
Minority interest 328.373 294.003
1,119.802 1,098.345
Non-current liabilities
Pension provisions 655.438 660.729
Other non-current provisions 88.020 86.292
Financial liabilities 1,013.715 1,105.191
Financial lease obligations 158.154 164.139
Trade payables and liabilities from inter-group business
relationships 1.288 2.874
Financial liabilities 7.174 9.476
Other liabilities 87.059 89.950
Deferred tax liabilities 176.601 173.514
2,187.449 2,292.165
Current liabilities
Pension provisions 28.934 29.238
Other current provisions 155.984 179.989
Financial liabilities 1,773.699 1,512.403
Financial lease obligations 7.486 8.371
Trade payables and liabilities from inter-group business
relationships 1,220.725 894.310
Current income tax liabilities 24.879 29.924
Financial liabilities 173.729 152.628
Other liabilities 352.526 277.484
3,737.962 3,084.347
Liabilities from non-current assets held for sale/disposal
groups -.--- -.---
Total shareholders’ equity and liabilities 7,045.213 6,474.857
31/12/2016
31/12/2016Shareholders’ equity and liabilities
Assets 30/09/2017
30/09/2017
8

Consolidated Financial Statements of BayWa AG pursuant to IFRS
Consolidated Income Statement for the period from 1 January to 30 September 2017
In € million
Revenues 3,807.873 4,236.133 3,936.335 11,980.341 3,468.398 3,988.022 3,982.872 11,439.292
Inventory changes 118.473 - 26.478 2.782 94.777 138.139 9.186 - 33.468 113.857
Other own work capitalised 1.885 1.663 2.313 5.861 2.024 1.943 - 0.026 3.941
Other operating income 28.990 41.037 39.810 109.837 38.346 48.899 40.590 127.835
Cost of materials - 3,566.953 - 3,779.508 - 3,570.156 - 10,916.617 - 3,308.647 - 3,595.951 - 3,614.034 - 10,518.632
Gross profit 390.268 472.847 411.084 1,274.199 338.260 452.099 375.934 1,166.293
Personnel expenses - 223.316 - 239.522 - 231.287 - 694.125 - 208.508 - 222.980 - 217.382 - 648.870
Depreciation and amortisation - 31.954 - 33.852 - 32.036 - 97.842 - 30.804 - 30.580 - 30.479 - 91.863
Other operating expenses - 127.842 - 136.664 - 130.412 - 394.918 - 110.796 - 134.973 - 113.774 - 359.543
Result of operating activities 7.156 62.809 17.349 87.314 - 11.848 63.566 14.299 66.017
Income from participating interests recognised at equity 0.147 1.670 0.548 2.365 - 1.563 2.573 15.212 16.222
Other income from shareholdings 0.734 0.247 - 0.394 0.587 0.971 1.552 0.634 3.157
Interest income 1.419 1.718 1.877 5.014 1.597 1.589 1.934 5.120
Interest expense - 18.633 - 20.429 - 18.058 - 57.120 - 19.081 - 20.130 - 17.905 - 57.116
Financial result - 16.333 - 16.794 - 16.027 - 49.154 - 18.076 - 14.416 - 0.125 - 32.617
Result of ordinary activities (EBT) - 9.177 46.015 1.322 38.160 - 29.924 49.150 14.174 33.400
Income tax 2.429 - 11.828 - 0.777 - 10.176 5.717 - 10.229 - 3.861 - 8.373
Net result for the period - 6.748 34.187 0.545 27.984 - 24.207 38.921 10.313 25.027
of which: profit share of minority interest 2.363 9.942 7.860 20.165 0.593 13.918 3.640 18.151
of which: due to shareholders of the parent company - 9.111 24.245 - 7.315 7.819 - 24.800 25.003 6.673 6.876
EBIT 8.037 64.726 17.503 90.266 - 12.440 67.691 30.145 85.396
EBITDA 39.991 98.578 49.539 188.108 18.364 98.271 60.624 177.259
Average number of shares 34,881,685 34,764,480
Basic earnings per share * (in €) 0.22 0.20
Diluted earnings per share * (in €) 0.22 0.20
2Q2016 3Q2016 01/01/ - 30/09/2016
* Basic earnings per share (EPS) are calculated by dividing the profit for the period attributable to shares (net of minority interest) by the average number of shares. So-
called potential shares (above all share options and convertible bonds), which can dilute earnings per share, were not issued, which means that diluted and basic
earnings per share are the same.
1Q2017 2Q2017 3Q2017 01/01/ - 30/09/2017 1Q2016
9