Embed Size (px)
Citation preview

BayWa GroupInterim Report as at 30 June 2010Conference Call, 5 August 2010
> Klaus Josef Lutz, Chief Executive Officer

Market developments in Q2/2010
AgricultureFirmer producer prices (milk and grain) brighten sentiment in the agricultural industry Solid business with subsequent collection and storage of grain; grain selling benefits from strong export b i ( k )
Building Materials
business (weak euro) Strong agricultural resources business despite late start to spring Economic barometer for the agriculture industry in an uptrend
Building MaterialsBusiness climate index (ifo) improved in the building trade Positive stimulus in housing construction (number of building permits on the rise)Seasonal catching-up effects in building materials trading
Volume-related sales of heating oil significantly lower than a year ago
Energy
Development of DIY & Garden Centres hampered by cold, wet weather in May
Volume related sales of heating oil significantly lower than a year agoPrivate household tank filling levels (oil) now below the level customary for the time of the year Economic recovery boosts lubricants businessSolar power business accelerates due to cuts in government-backed promotion of solar energy
2
Development of the Group
3
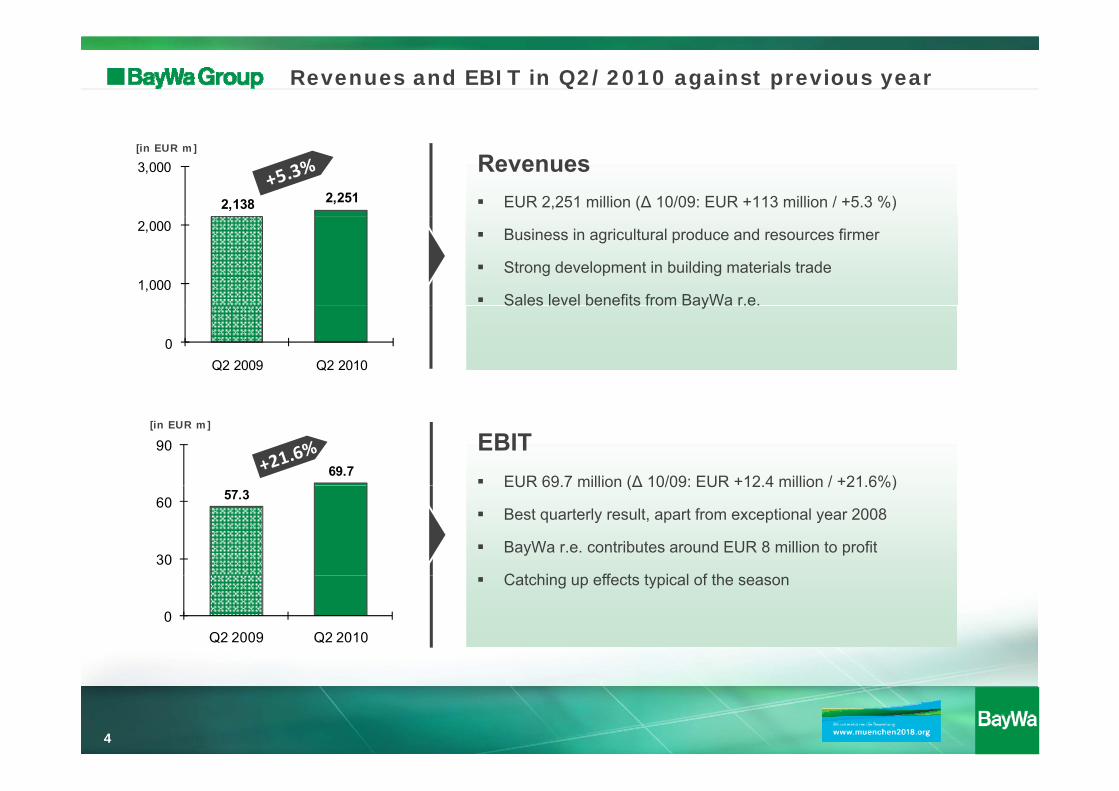
Revenues and EBIT in Q2/2010 against previous year
RevenuesEUR 2,251 million (∆ 10/09: EUR +113 million / +5.3 %) 2,138 2,251
3,000[in EUR m]
Business in agricultural produce and resources firmer
Strong development in building materials trade
Sales level benefits from BayWa r.e.1,000
2,000
y
0Q2 2009 Q2 2010
EBIT EUR 69.7 million (∆ 10/09: EUR +12.4 million / +21.6%)
69.7
90[in EUR m]
EUR 69.7 million (∆ 10/09: EUR 12.4 million / 21.6%)
Best quarterly result, apart from exceptional year 2008
BayWa r.e. contributes around EUR 8 million to profit
C t hi ff t t i l f th
57.3
30
60
Catching up effects typical of the season
0Q2 2009 Q2 2010
4

Year-on-year (Q2) comparison of EBIT
2006 2007 2008 2009 2010
Q2
[EUR m]
80.2
69.770
80
90
[EUR m]
60.1 60.257.3
40
50
60 Ø (Q2; 2006‐2010) = 65.5
10
20
30
0
10
5
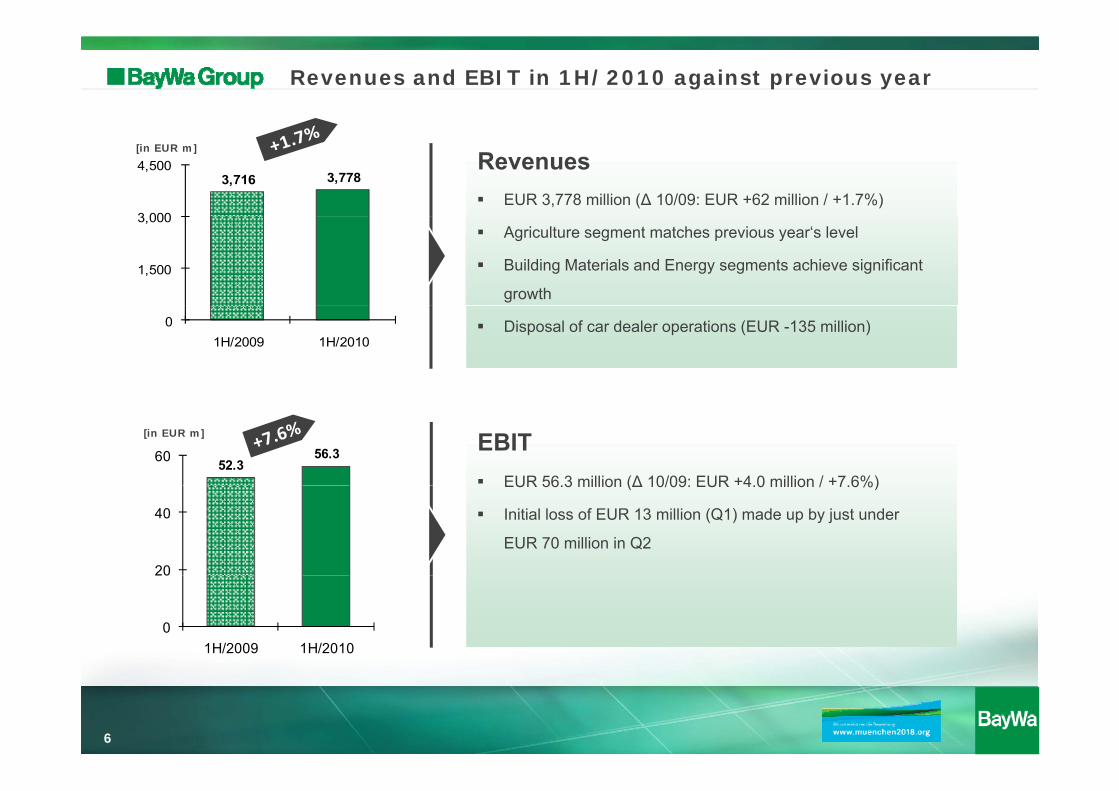
Revenues and EBIT in 1H/2010 against previous year
3,716 3,778
3 000
4,500 RevenuesEUR 3,778 million (∆ 10/09: EUR +62 million / +1.7%)
[in EUR m]
1,500
3,000Agriculture segment matches previous year‘s level
Building Materials and Energy segments achieve significant
growth
01H/2009 1H/2010
Disposal of car dealer operations (EUR -135 million)
EBIT EUR 56.3 million (∆ 10/09: EUR +4.0 million / +7.6%)
52.356.360
[in EUR m]
EUR 56.3 million (∆ 10/09: EUR 4.0 million / 7.6%)
Initial loss of EUR 13 million (Q1) made up by just under
EUR 70 million in Q2
20
40
0
20
1H/2009 1H/2010
6

Year-on-year comparison
in EUR m 1H/2007 1H/2008 1H/2009 1H/2010 ∆10/09 (%)
Revenues 3 414 9 4 381 0 3 716 3 3 777 7 1 7%Revenues 3,414.9 4,381.0 3,716.3 3,777.7 1.7%EBITDA 107.5 152.9 98.9 104.3 5.5%
% of revenues 3.1% 3.5% 2.7% 2.8%EBIT 62.7 107.5 52.3 56.3 7.6%
% of revenues 1.8% 2.5% 1.4% 1.5%EBT 39.2 79.7 30.5 35.9 17.7%
% of revenues 1.1% 1.8% 0.8% 0.9%
Consolidated net income 31.9 62.1 23.5 28.1 19.6%Tax rate 18.6% 22.1% 23.0% 21.7%
Share of minority interest 12.3 15.3 8.3 8.1 -2.4%yas % of net income 38.6% 24.6% 35.3% 28.8%
Share of owners of parent company 19.7 46.8 15.2 20.0 31.6%as % of net income 61.8% 75.4% 64.7% 71.2%
Earnings per share (EPS) in EUR 0.58 1.38 0.45 0.59 31.1%
7
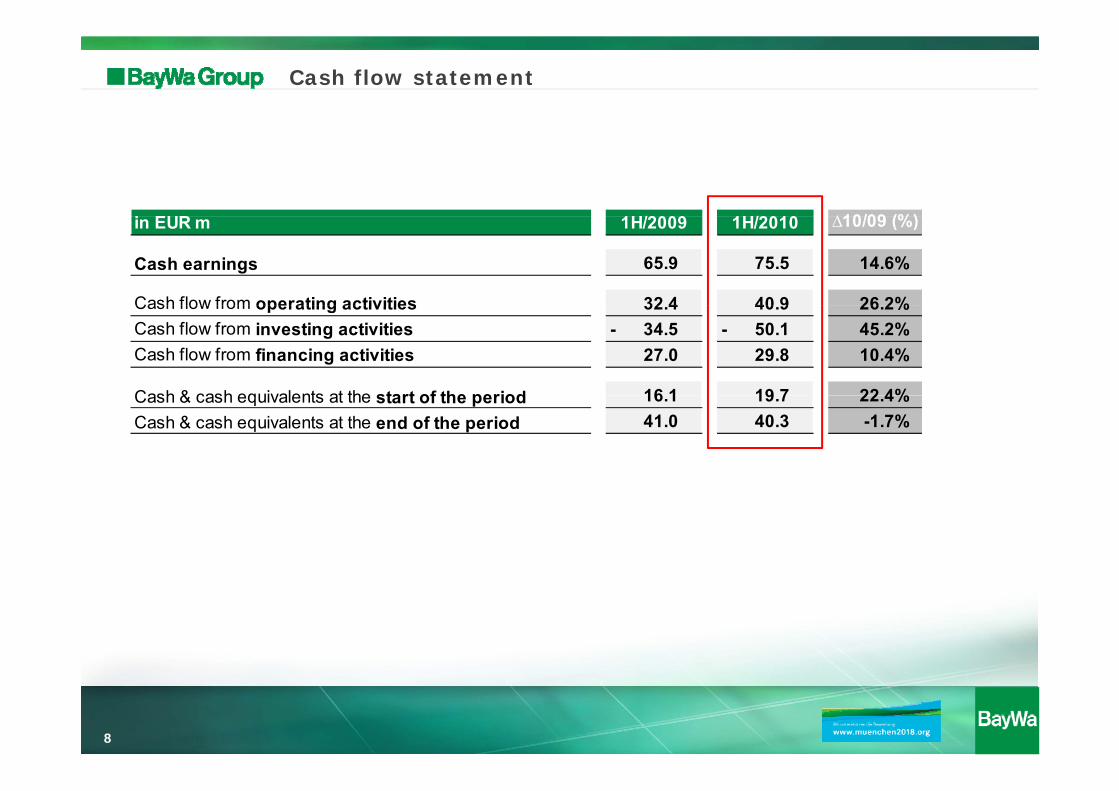
Cash flow statement
i EUR 1H/2009 1H/2010 ∆10/09 (%)in EUR m 1H/2009 1H/2010 ∆10/09 (%)
Cash earnings 65.9 75.5 14.6%
Cash flow from operating activities 32 4 40 9 26 2%Cash flow from operating activities 32.4 40.9 26.2%Cash flow from investing activities 34.5 - 50.1 - 45.2%Cash flow from financing activities 27.0 29.8 10.4%
Cash & cash equivalents at the start of the period 16 1 19 7 22 4%Cash & cash equivalents at the start of the period 16.1 19.7 22.4%Cash & cash equivalents at the end of the period 41.0 40.3 -1.7%
8
Development of the Segments
9

BayWa AgricultureSeeds
lFertilisersCrop protection GrainFeedstuffFeedstuffFruitAgricultural equipment
10

Development in 1H/2010
Development of operating resources
High demand for fertilisers at lower price levels Stable development in demand for seed and crop protection
Development of agricultural produce
From spring onwards, slight uptrend in grain prices Very good grain export business favoured by the weak euro Sound business in subsequent collection/storage of grainGrain speculation increases at the end of Q2 due to dry weather
Development of agricultural equipment
New orders above previous year‘s level (tractors)Above average demand for yard and barn equipment and facilities
11
Revenues and EBIT in 1H/2010 against previous year
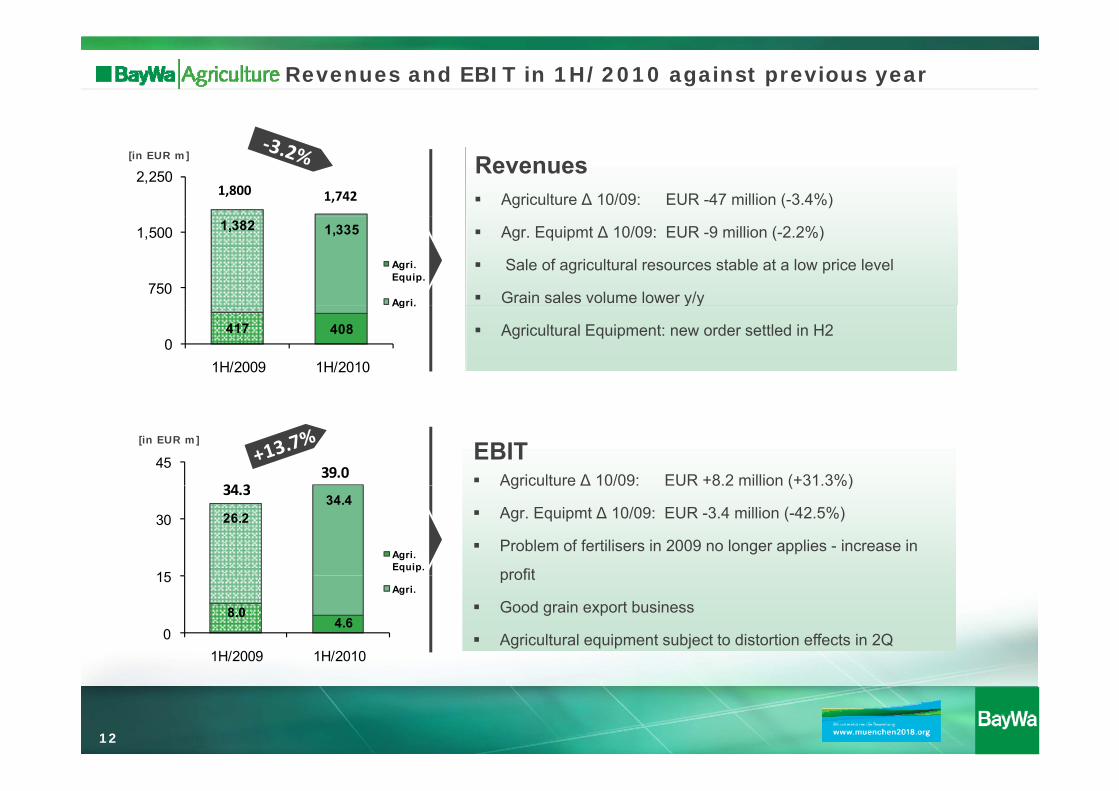
RevenuesAgriculture ∆ 10/09: EUR -47 million (-3.4%)
2,2501,800 1,742
[in EUR m]
Agr. Equipmt ∆ 10/09: EUR -9 million (-2.2%)
Sale of agricultural resources stable at a low price level
Grain sales volume lower y/y
1,382 1,335
750
1,500
Agri. Equip.
Agri. y y
Agricultural Equipment: new order settled in H2 417 4080
1H/2009 1H/2010
Agri.
EBIT Agriculture ∆ 10/09: EUR +8.2 million (+31.3%)
45
34 339.0
[in EUR m]
Agriculture ∆ 10/09: EUR 8.2 million ( 31.3%)
Agr. Equipmt ∆ 10/09: EUR -3.4 million (-42.5%)
Problem of fertilisers in 2009 no longer applies - increase in
profit
26.234.4
15
30
Agri. Equip.
34.3
profit
Good grain export business
Agricultural equipment subject to distortion effects in 2Q
8.04.6
0
15
1H/2009 1H/2010
Agri.
12

Year-on-year comparison
in EUR m 1H/2007 1H/2008 1H/2009 1H/2010 ∆10/09 (%)
Revenues 1,612.5 2,208.5 1,799.5 1,742.3 -3.2%EBITDA 61 8 103 2 53 5 58 5 9 3%EBITDA 61.8 103.2 53.5 58.5 9.3%
% of revenues 3.8% 4.7% 3.0% 3.4%EBIT 41.7 83.2 34.3 39.0 13.7%
% of revenues 2.6% 3.8% 1.9% 2.2%% of revenues 2.6% 3.8% 1.9% 2.2%EBT 27.5 65.5 19.9 26.3 32.2%
% of revenues 1.7% 3.0% 1.1% 1.5%
13
Price trend market prices
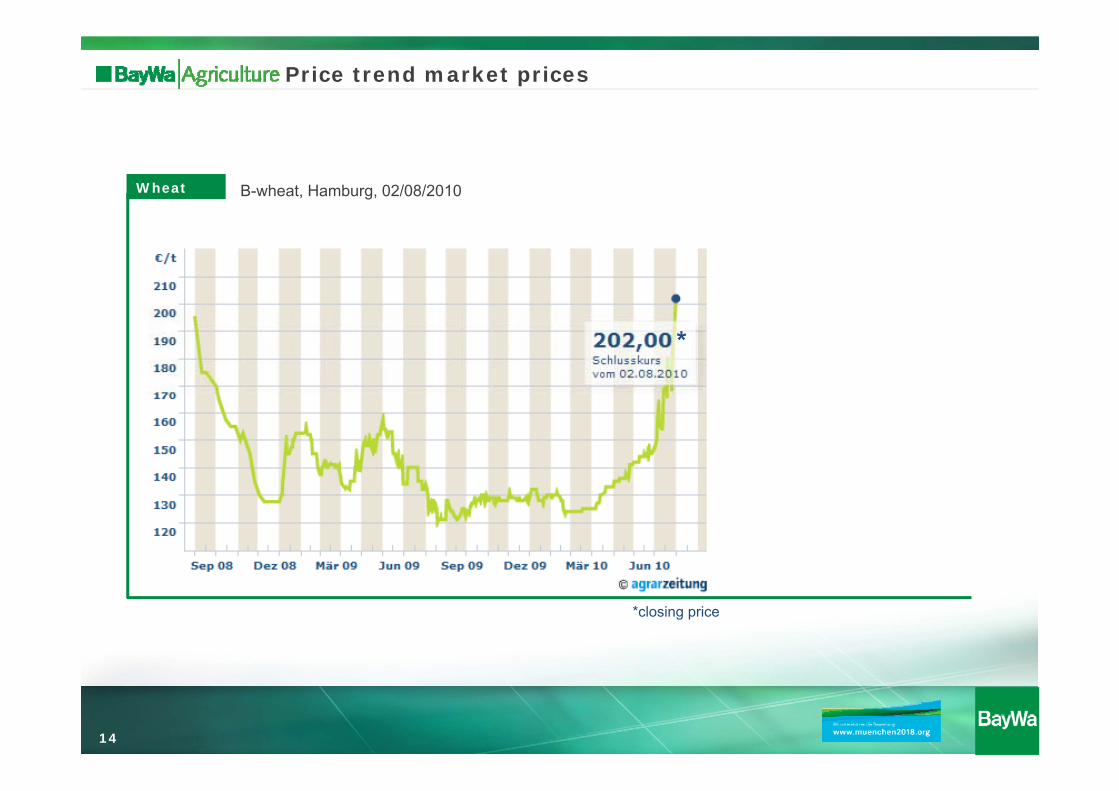
Wheat B-wheat, Hamburg, 02/08/2010
*
*
*closing price
14

Grain Balance - World
[in million t, wheat, rice, corn, barley, oat, rye, sorghum]
Szenario 2015/16 *10/11 09/10 08/09 07/08 06/07 05/06 04/05 03/04
P d kti 2 502 2 230 2 222 2 237 2 124 2 002 2 017 2 042 1 862Produktion 2.502 2.230 2.222 2.237 2.124 2.002 2.017 2.042 1.862Anfangsbestand 400 475 448 364 342 389 403 355 429Verfügbar 2.902 2.705 2.670 2.601 2.466 2.391 2.420 2.397 2.291Verbrauch 2.472 2.245 2.195 2.153 2.102 2.049 2.031 1.994 1.936
ProductionLevel at start of periodAvailableConsumption
Endbestand 430 460 475 448 364 342 389 403 355Bestände ./. Verbrauch in % 17 20 22 21 17 17 19 20 18Reichweite Endbestand
64 75 79 76 63 61 70 74 67
pLevel at end of PeriodInventory level ./. consumption in %
Reach at end of period in daysin Tagen 64 75 79 76 63 61 70 74 67Reach at end of period in days
07/2010; *2010/11 prognosis; Values partly estimatedS DRV ACTI S h h DOWJ B W
15
Source: DRV, ACTI Schumacher, DOWJones, BayWa

Price trend market prices
Urea CAN
Calcium ammonium nitrate ex Baltic Sea PortsGranulated urea ex Baltic Sea Ports Calcium ammonium nitrate ex Baltic Sea Ports, 22/07/2010
Granulated urea ex Baltic Sea Ports, 22/07/2010
**
*closing price *closing priceclosing price *closing price
16

BayWa Building Materials
Building Materials dDIY & Garden Centres
17
Development in 1H/2010
Development of Building Materials
Delayed start to the season due to long winter with heavy snowfall Modernisation and refurbishment activities in housing construction gaining momentumDevelopment of logistics services for third parties better than a year ago
Development of DIY and Garden Centres
Product mix having positive effectRenovated markets of Illertissen and Grafenau off to a good startGarden business suffers from cool spring
18
Revenues and EBIT in 1H/2010 against previous year
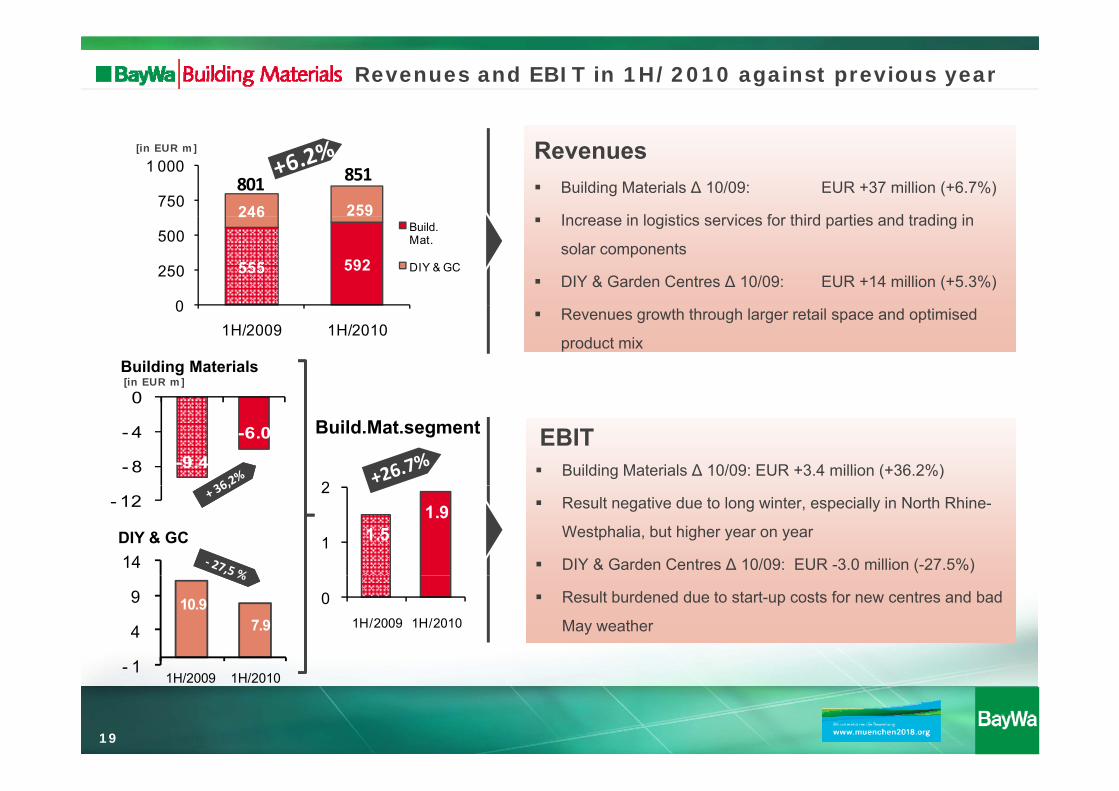
RevenuesBuilding Materials ∆ 10/09: EUR +37 million (+6.7%)
I i l i ti i f thi d ti d t di i246 259750
1 000 851801
[in EUR m]
Increase in logistics services for third parties and trading in
solar components
DIY & Garden Centres ∆ 10/09: EUR +14 million (+5.3%)555 592
246
0
250
500Build. Mat.
DIY & GC
Revenues growth through larger retail space and optimised
product mix
01H/2009 1H/2010
0
Building Materials[in EUR m]
EBIT Building Materials ∆ 10/09: EUR +3.4 million (+36.2%)-9.4
-6.0
- 8
- 4
0
2
Build.Mat.segment
Result negative due to long winter, especially in North Rhine-
Westphalia, but higher year on year
DIY & Garden Centres ∆ 10/09: EUR -3.0 million (-27.5%)
- 12
141.5
1.9
1
2
DIY & GC
Result burdened due to start-up costs for new centres and bad
May weather 10.9
7.9
1
4
9 01H/2009 1H/2010
19
- 11H/2009 1H/2010

Year-on-year comparison
in EUR m 1H/2007 1H/2008 1H/2009 1H/2010 ∆10/09 (%)
Revenues 806.6 831.2 800.5 851.3 6.3%EBITDA 23 2 24 0 18 4 16 1 -12 5%EBITDA 23.2 24.0 18.4 16.1 -12.5%
% of revenues 2.9% 2.9% 2.3% 1.9%EBIT 8.5 8.7 1.5 1.9 26.7%
% of revenues 1 1% 1 1% 0 2% 0 2%% of revenues 1.1% 1.1% 0.2% 0.2%EBT 1.6 1.7 4.3 - 3.7 - -14.0%
% of revenues 0.2% 0.2% -0.5% -0.4%
20

BayWa EnergyFuel
lHeating oilLubricantsSolid biofuelsBayWa r eBayWa r.e
21

Development in 1H/2010
Development of energy (conventional)Development of energy (conventional)
Fuel: private household tank filling levels now below the average customary for this time of the year Mineral oil: development of margins still stable Development of lubricants business above previous year due to economic influences
Development of BayWa r.e
BayWa r.e’s strategy paying offSolar power business accelerates due to cuts in government-backed promotion of solar energy at mid-year Sale of La Benate Wind Park in FranceSale of La Benate Wind Park in France Tender for Spain‘s largest and most powerful rooftop solar power plant (Barcelona harbour)
22

Revenues and EBIT in 1H/2010 against previous year
Energy (conventional) ∆ 10/09: EUR +58 million (+6.5%)
Price-induced increase in revenues in conventional trading
Revenues
149900
1 200
892
1,099
[in EUR m]
g
BayWa r.e: EUR +149 million
Solar power boom due to lowering of feed in tariffs at mid
892 950
0
300
600
900
renewable Energies
Energy
Solar power boom due to lowering of feed-in tariffs at mid-
year drives BayWa r.e‘s business0
1H/2009 1H/2010
EBIT Energy (conventional) ∆ 10/09: EUR -11.6 million (-84.7%)
14
19
13.7
[in EUR m]
Decline is volume induced; lack of demand for heating oil due
to households covering their requirements in 2009 at low prices 13.7 9.3
4
9
14
renewable Energies
Energy
11.4
BayWa r.e: EUR +9.3 million
MHH Solartechnik‘s contribution to profit approx. EUR 8 million 2.1
‐ 1
4
1H/2009 1H/2010
23

Year-on-year comparison
in EUR m 1H/2007 1H/2008 1H/2009 1H/2010 ∆10/09 (%)
Revenues 795.7 1,075.5 892.4 1,099.0 23.2%EBITDA 4 4 9 4 17 9 17 8 -0 6%EBITDA 4.4 9.4 17.9 17.8 -0.6%
% of revenues 0.6% 0.9% 2.0% 1.6%EBIT 0.7 5.7 13.7 11.4 -16.8%
% of revenues 0 1% 0 5% 1 5% 1 0%% of revenues 0.1% 0.5% 1.5% 1.0%EBT 0.5 5.8 13.3 10.1 -24.1%
% of revenues 0.1% 0.5% 1.5% 0.9%
24

BayWa Other Activities Food production
25

Revenues and EBIT in 1H/2010 against previous year
RevenuesYbbstaler: EUR 51 million224
300[in EUR m]
Frisch & Frost: EUR 34 million
∆ 10/09: EUR -139 million (-62.1%)
Revenues decline owing to disposal of car dealer operations85100
200
Revenues decline owing to disposal of car dealer operations
as from 01/10/200901H/2009 1H/2010
EBIT ∆ 10/09: EUR +1.2 million (+42.9%)
4 0
6[in EUR m]
Slight improvement in profit due to cost reductions2.8
4.0
2
4
01H/2009 1H/2010
26
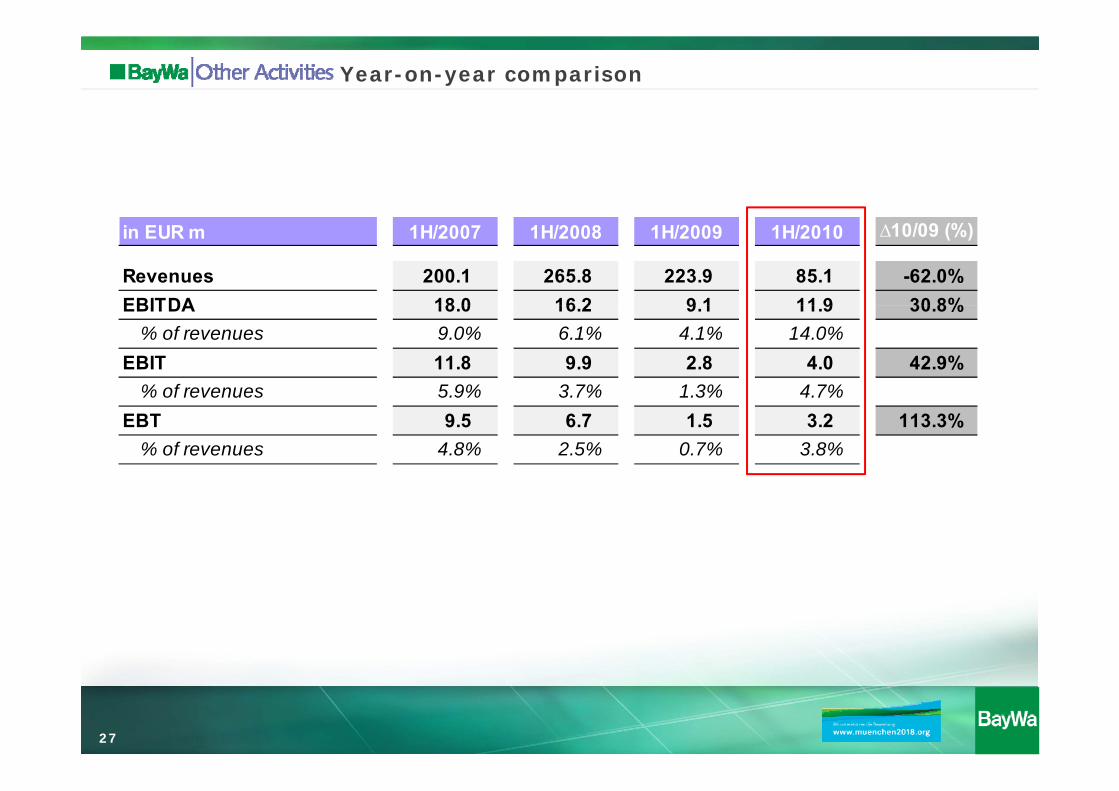
Year-on-year comparison
in EUR m 1H/2007 1H/2008 1H/2009 1H/2010 ∆10/09 (%)
Revenues 200.1 265.8 223.9 85.1 -62.0%EBITDA 18 0 16 2 9 1 11 9 30 8%EBITDA 18.0 16.2 9.1 11.9 30.8%
% of revenues 9.0% 6.1% 4.1% 14.0%EBIT 11.8 9.9 2.8 4.0 42.9%
% of revenues 5 9% 3 7% 1 3% 4 7%% of revenues 5.9% 3.7% 1.3% 4.7%EBT 9.5 6.7 1.5 3.2 113.3%
% of revenues 4.8% 2.5% 0.7% 3.8%
27
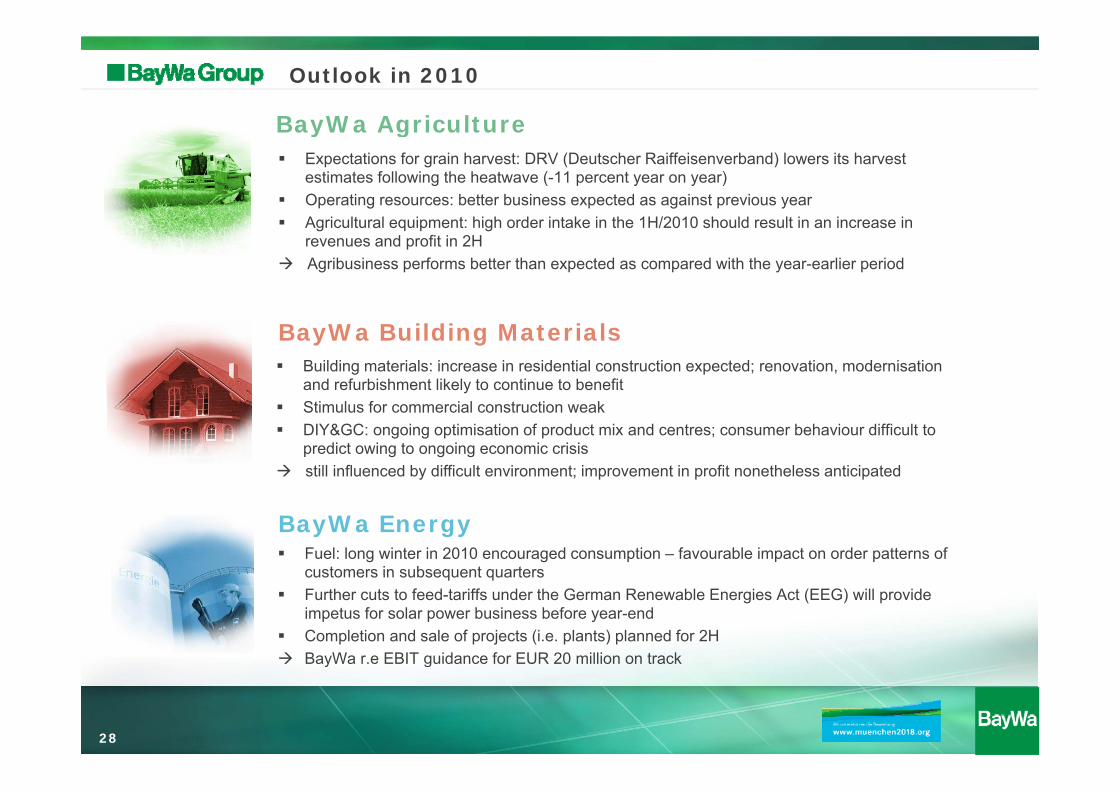
BayWa Agriculture
Outlook in 2010
Expectations for grain harvest: DRV (Deutscher Raiffeisenverband) lowers its harvest estimates following the heatwave (-11 percent year on year) Operating resources: better business expected as against previous year
BayWa Agriculture
Agricultural equipment: high order intake in the 1H/2010 should result in an increase in revenues and profit in 2H Agribusiness performs better than expected as compared with the year-earlier period
BayWa Building MaterialsBuilding materials: increase in residential construction expected; renovation, modernisation and refurbishment likely to continue to benefit Stimulus for commercial construction weak DIY&GC: ongoing optimisation of product mix and centres; consumer behaviour difficult to predict owing to ongoing economic crisis still influenced by difficult environment; improvement in profit nonetheless anticipated
BayWa EnergyFuel: long winter in 2010 encouraged consumption – favourable impact on order patterns of customers in subsequent quarterscustomers in subsequent quarters Further cuts to feed-tariffs under the German Renewable Energies Act (EEG) will provide impetus for solar power business before year-end Completion and sale of projects (i.e. plants) planned for 2H BayWa r.e EBIT guidance for EUR 20 million on track
28
y g

The BayWa ShareThe BayWa Share
29
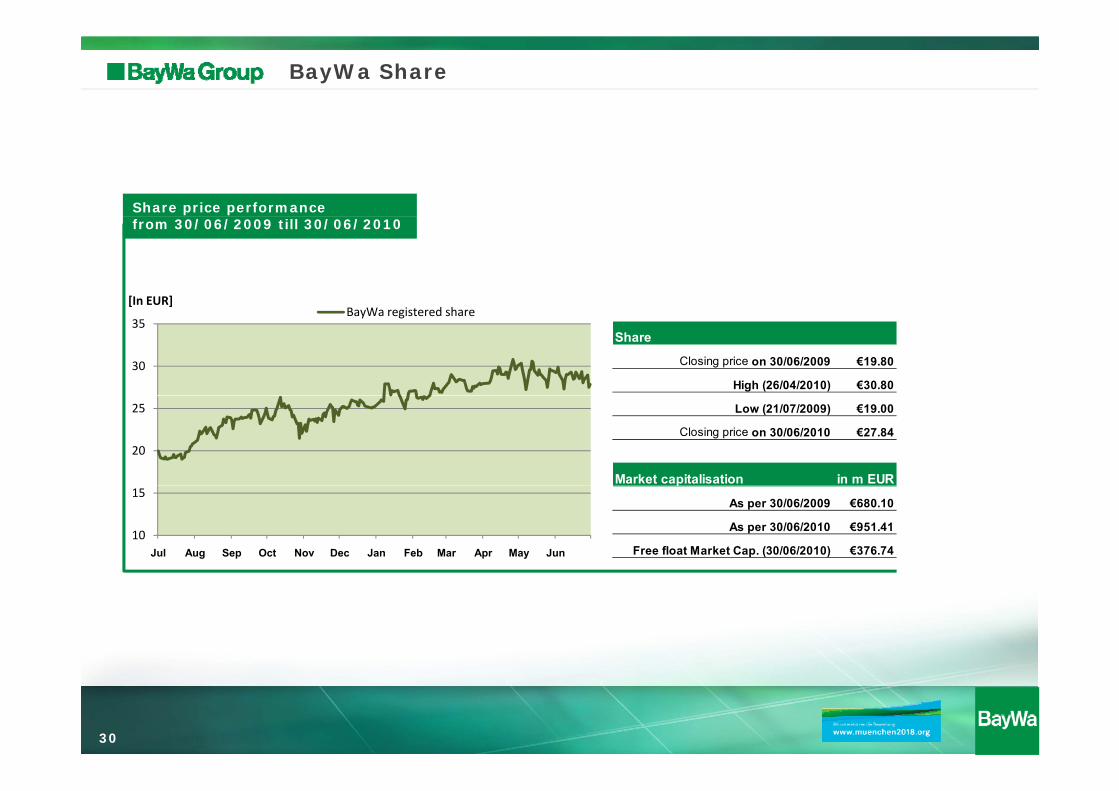
BayWa Share
Share price performance
[In EUR]
from 30/06/2009 till 30/06/2010
[ ]
30
35BayWa registered share
Share
Closing price on 30/06/2009 €19.80
High (26/04/2010) €30.80
20
25 Low (21/07/2009) €19.00
Closing price on 30/06/2010 €27.84
Market capitalisation in m EUR
10
15
Jul Aug Sep Oct Nov Dec Jan Feb Mar Apr May Jun
p
As per 30/06/2009 €680.10
As per 30/06/2010 €951.41
Free float Market Cap. (30/06/2010) €376.74
30

BayWa Share 2010
More information on the BayWa share and share capitalJune 2010
Shareholder structure as per 30/06/2010
Raiffeisen Agrar Invest GmbH
Free float
Stock exchanges Frankfurt, Munich, Xetra
Segment Official Market/Prime Standard
Stock exch. index MDAX (Sec. code no. 519406)
25.12
39.55
Free floatISIN DE0005194062
Share capital EUR 87,307,622.40
Number of shares 34,104,540
Denomination No-par value shares with an arithmetical portion of
35.33
Bayerische
Denomination No par value shares with an arithmetical portion of EUR 2.56 each in the share capital
Securitisation In the form of a global certificate deposited with Clearstream Banking AG. Shareholders participate as co-owners corresponding to the number of shares held (collective custody account)Bayerische
Raiffeisen‐Beteiligungs AG
shares held (collective custody account)
31
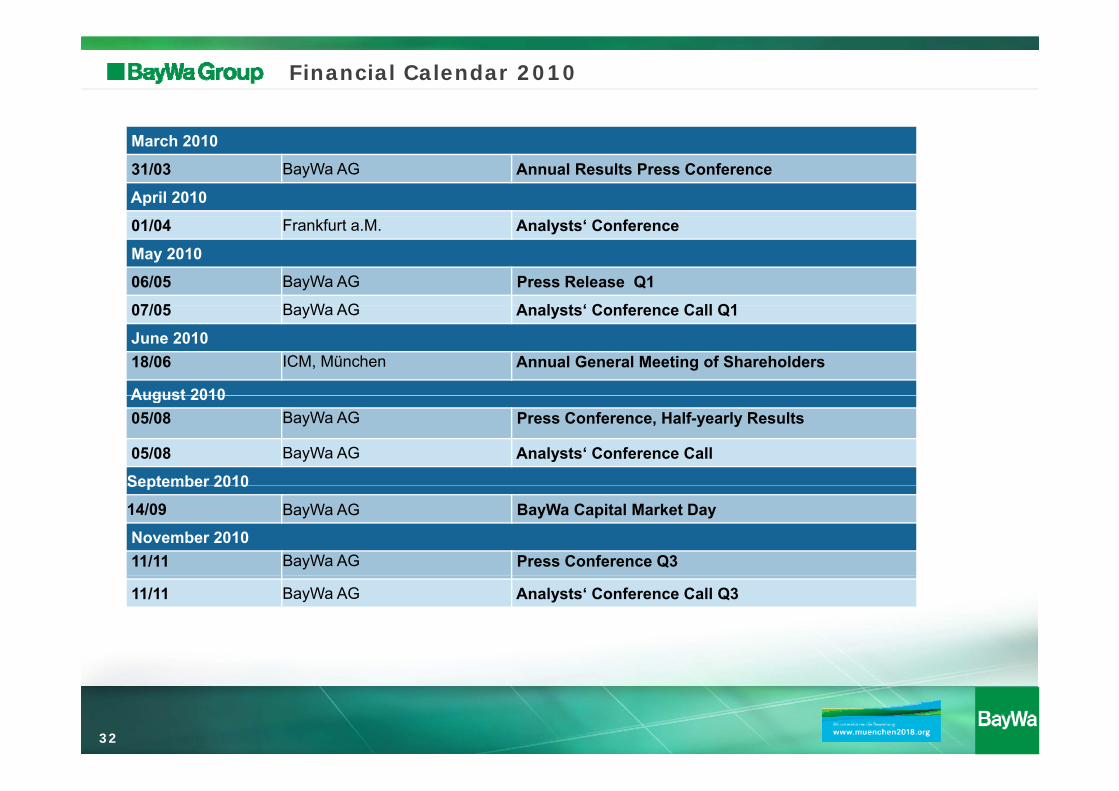
Financial Calendar 2010
March 2010
31/03 BayWa AG Annual Results Press Conference
April 2010
01/04 Frankfurt a.M. Analysts‘ Conference
May 2010
06/05 BayWa AG Press Release Q1
07/05 B W AG A l t ‘ C f C ll Q107/05 BayWa AG Analysts‘ Conference Call Q1
June 201018/06 ICM, München Annual General Meeting of Shareholders
August 2010August 201005/08 BayWa AG Press Conference, Half-yearly Results
05/08 BayWa AG Analysts‘ Conference Call
September 2010September 2010
14/09 BayWa AG BayWa Capital Market Day
November 201011/11 BayWa AG Press Conference Q3
11/11 BayWa AG Analysts‘ Conference Call Q3
32

Investor Relations contact
Investor Relations Manager
Josko RadeljicArabellastr. 4D-81925 München
Phone: 0049 / 89 / 92 22 - 38 87Fax: 0049 / 89 / 92 12 - 38 87
E-Mail: [email protected]
33
Disclaimer
The information in this presentation is partly made up of forward-looking statements which are based on assumptions and are subject to unforeseeable risks.In as much as the assumptions on the successful integration of acquisitions and on the internal growth of the company should prove to be inaccurate, or should other unforeseeable risks occur, the possibility of the assets, financial position and results of operations of the Group diverging negatively from the target figures cited in thisoperations of the Group diverging negatively from the target figures cited in this presentation should not be discounted.BayWa AG can therefore undertake no guarantee that the actual development of the net worth, financial position and results of operations of the Group will concur with the target figures described in this presentation
34