Embed Size (px)
Citation preview
LEADERSHIP SERIES
QuarterlyMarket Update
PRIMARY CONTRIBUTORS
Lisa Emsbo-MattinglyDirector of Asset Allocation Research
Dirk Hofschire, CFASVP, Asset Allocation Research
Jake Weinstein, CFAResearch Analyst, Asset Allocation Research
Ryan Carrigan, CFAResearch Analyst, Asset Allocation Research
FOURTH QUARTER 2019
Asset Markets3.
Table of Contents
Market Summary1.
Economy/Macro Backdrop2.
Long-Term Themes4.

Market Summary
SU
MM
AR
Y
MACRO
4
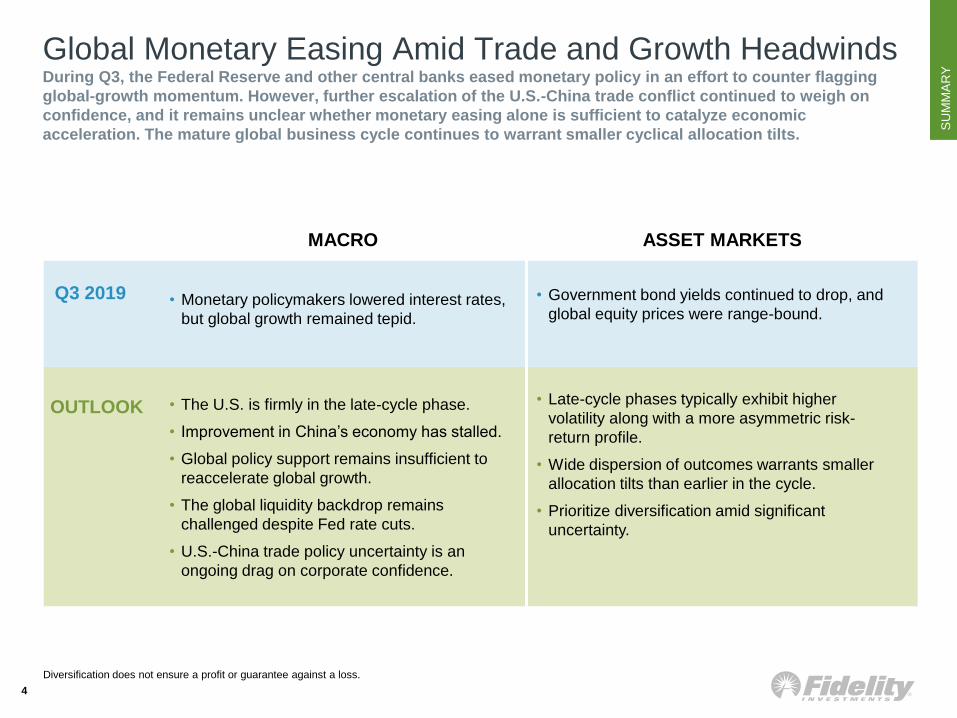
• Monetary policymakers lowered interest rates,
but global growth remained tepid.
• Government bond yields continued to drop, and
global equity prices were range-bound.
ASSET MARKETS
Q3 2019
OUTLOOK • The U.S. is firmly in the late-cycle phase.
• Improvement in China’s economy has stalled.
• Global policy support remains insufficient to
reaccelerate global growth.
• The global liquidity backdrop remains
challenged despite Fed rate cuts.
• U.S.-China trade policy uncertainty is an
ongoing drag on corporate confidence.
• Late-cycle phases typically exhibit higher
volatility along with a more asymmetric risk-
return profile.
• Wide dispersion of outcomes warrants smaller
allocation tilts than earlier in the cycle.
• Prioritize diversification amid significant
uncertainty.
Diversification does not ensure a profit or guarantee against a loss.
Global Monetary Easing Amid Trade and Growth HeadwindsDuring Q3, the Federal Reserve and other central banks eased monetary policy in an effort to counter flagging
global-growth momentum. However, further escalation of the U.S.-China trade conflict continued to weigh on
confidence, and it remains unclear whether monetary easing alone is sufficient to catalyze economic
acceleration. The mature global business cycle continues to warrant smaller cyclical allocation tilts.
SU
MM
AR
Y
-2
0
2
4
6
8
10
12
14
1946 1950 1954 1958 1962 1966 1970 1974 1978 1982 1986 1990 1994 1998 2002 2006 2010 2014 2018
5
Q3 2019 (%) YTD (%) Q3 2019 (%) YTD (%)
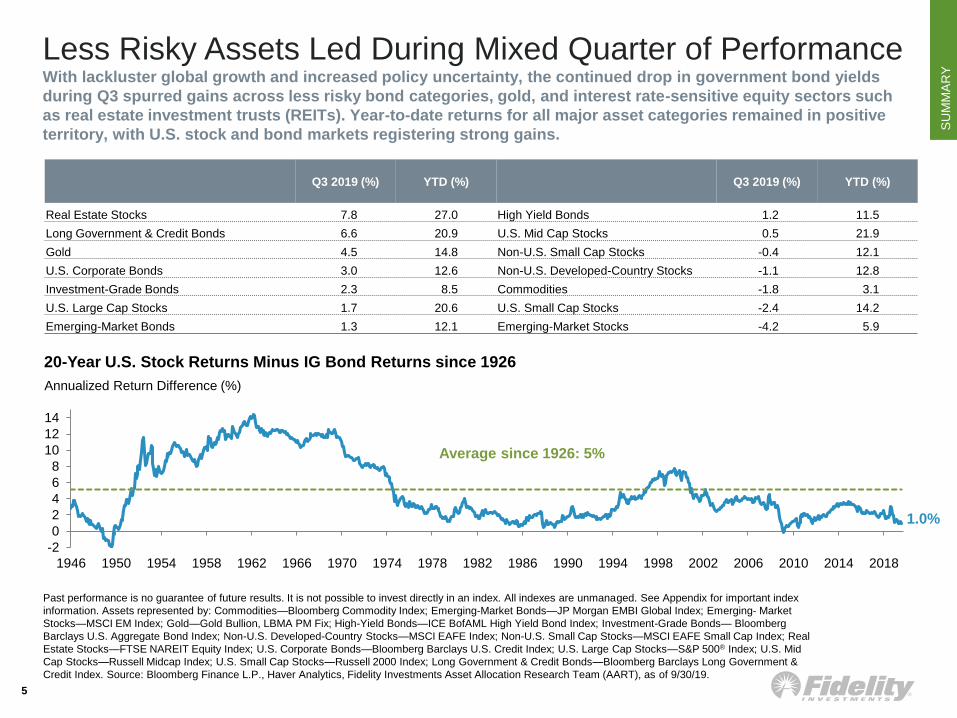
Real Estate Stocks 7.8 27.0 High Yield Bonds 1.2 11.5
Long Government & Credit Bonds 6.6 20.9 U.S. Mid Cap Stocks 0.5 21.9
Gold 4.5 14.8 Non-U.S. Small Cap Stocks -0.4 12.1
U.S. Corporate Bonds 3.0 12.6 Non-U.S. Developed-Country Stocks -1.1 12.8
Investment-Grade Bonds 2.3 8.5 Commodities -1.8 3.1
U.S. Large Cap Stocks 1.7 20.6 U.S. Small Cap Stocks -2.4 14.2
Emerging-Market Bonds 1.3 12.1 Emerging-Market Stocks -4.2 5.9
20-Year U.S. Stock Returns Minus IG Bond Returns since 1926
Annualized Return Difference (%)
Past performance is no guarantee of future results. It is not possible to invest directly in an index. All indexes are unmanaged. See Appendix for important index
information. Assets represented by: Commodities—Bloomberg Commodity Index; Emerging-Market Bonds—JP Morgan EMBI Global Index; Emerging- Market
Stocks—MSCI EM Index; Gold—Gold Bullion, LBMA PM Fix; High-Yield Bonds—ICE BofAML High Yield Bond Index; Investment-Grade Bonds— Bloomberg
Barclays U.S. Aggregate Bond Index; Non-U.S. Developed-Country Stocks—MSCI EAFE Index; Non-U.S. Small Cap Stocks—MSCI EAFE Small Cap Index; Real
Estate Stocks—FTSE NAREIT Equity Index; U.S. Corporate Bonds—Bloomberg Barclays U.S. Credit Index; U.S. Large Cap Stocks—S&P 500® Index; U.S. Mid
Cap Stocks—Russell Midcap Index; U.S. Small Cap Stocks—Russell 2000 Index; Long Government & Credit Bonds—Bloomberg Barclays Long Government &
Credit Index. Source: Bloomberg Finance L.P., Haver Analytics, Fidelity Investments Asset Allocation Research Team (AART), as of 9/30/19.
Average since 1926: 5%
1.0%
Less Risky Assets Led During Mixed Quarter of PerformanceWith lackluster global growth and increased policy uncertainty, the continued drop in government bond yields
during Q3 spurred gains across less risky bond categories, gold, and interest rate-sensitive equity sectors such
as real estate investment trusts (REITs). Year-to-date returns for all major asset categories remained in positive
territory, with U.S. stock and bond markets registering strong gains.
SU
MM
AR
Y
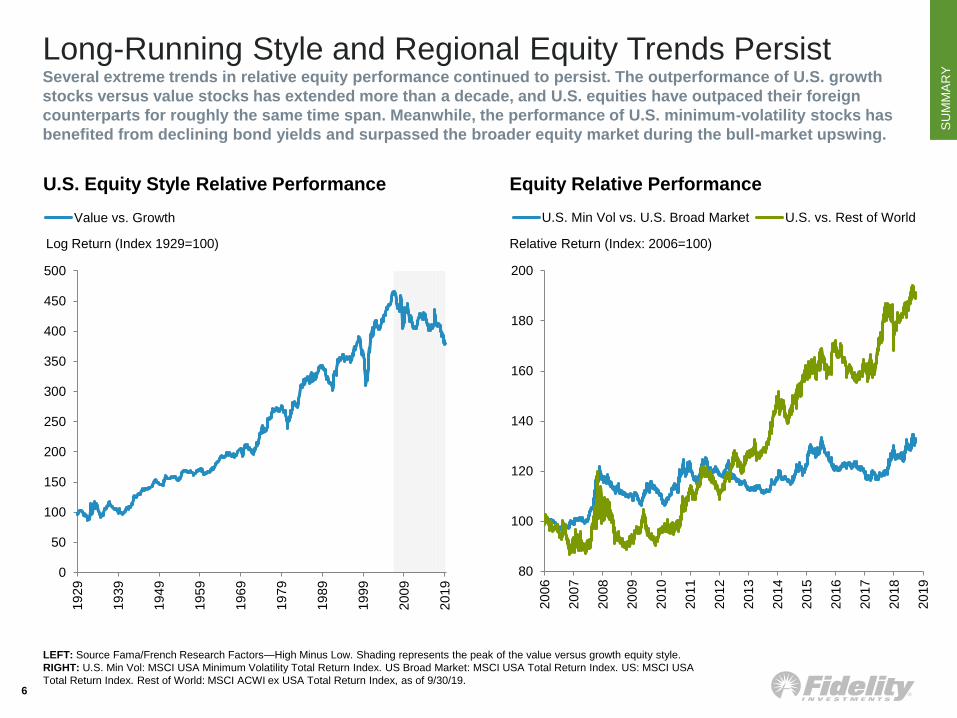
LEFT: Source Fama/French Research Factors—High Minus Low. Shading represents the peak of the value versus growth equity style.
RIGHT: U.S. Min Vol: MSCI USA Minimum Volatility Total Return Index. US Broad Market: MSCI USA Total Return Index. US: MSCI USA
Total Return Index. Rest of World: MSCI ACWI ex USA Total Return Index, as of 9/30/19.6
Equity Relative Performance
80
100
120
140
160
180
200
20
06
20
07
20
08
20
09
20
10
20
11
20
12
20
13
20
14
20
15
20
16
20
17
20
18
20
19
U.S. Min Vol vs. U.S. Broad Market U.S. vs. Rest of World
0
50
100
150
200
250
300
350
400
450
500
19
29
19
39
19
49
19
59
19
69
19
79
19
89
19
99
20
09
20
19
Value vs. Growth
Log Return (Index 1929=100) Relative Return (Index: 2006=100)
U.S. Equity Style Relative Performance
Long-Running Style and Regional Equity Trends PersistSeveral extreme trends in relative equity performance continued to persist. The outperformance of U.S. growth
stocks versus value stocks has extended more than a decade, and U.S. equities have outpaced their foreign
counterparts for roughly the same time span. Meanwhile, the performance of U.S. minimum-volatility stocks has
benefited from declining bond yields and surpassed the broader equity market during the bull-market upswing.
SU
MM
AR
Y
-0.6
-0.2
0.5
1.7
-1.0%
-0.5%
0.0%
0.5%
1.0%
1.5%
2.0%
2.5%
3.0%
3.5%
Germany Japan UK U.S.
5-Year Range 1 Year Ago 9/30/19
-0.25%
0.25%
0.75%
1.25%
1.75%
2.25%
2.75%
3.25%
3.75%
Sep-2
015
Jan-2
016
Ma
y-2
016
Sep-2
016
Jan-2
017
Ma
y-2
017
Sep-2
017
Jan-2
018
Ma
y-2
018
Sep-2
018
Jan-2
019
Ma
y-2
019
Sep-2
019
Inflation Expectations Real Yields Nominal Yield
7
Yield
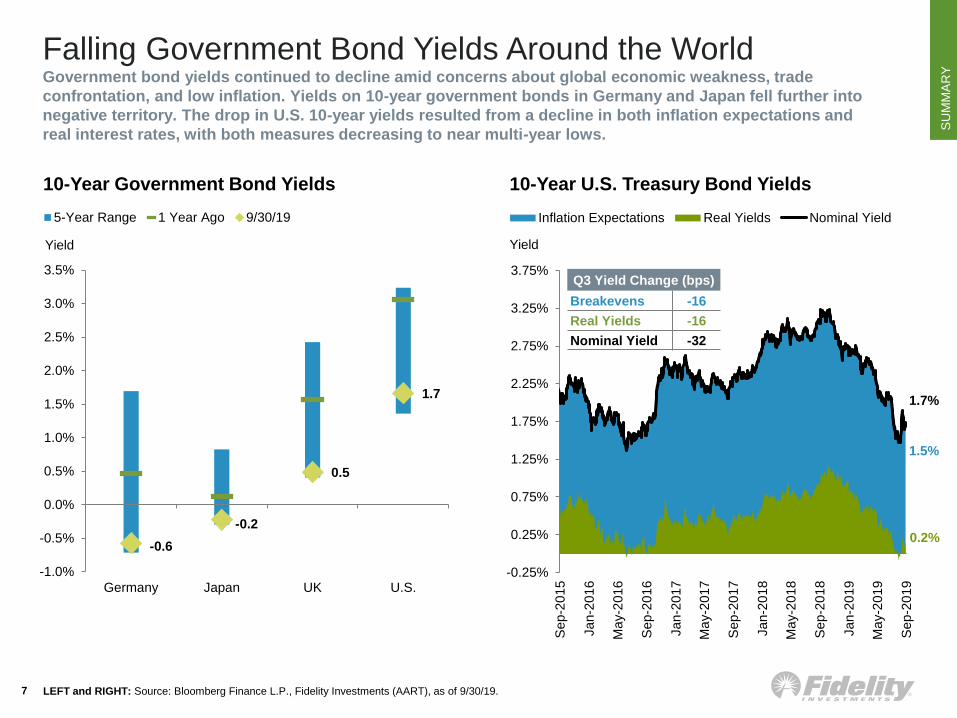
LEFT and RIGHT: Source: Bloomberg Finance L.P., Fidelity Investments (AART), as of 9/30/19.
10-Year U.S. Treasury Bond Yields
Yield
10-Year Government Bond Yields
1.5%
0.2%
1.7%
Q3 Yield Change (bps)
Breakevens -16
Real Yields -16
Nominal Yield -32
Falling Government Bond Yields Around the WorldGovernment bond yields continued to decline amid concerns about global economic weakness, trade
confrontation, and low inflation. Yields on 10-year government bonds in Germany and Japan fell further into
negative territory. The drop in U.S. 10-year yields resulted from a decline in both inflation expectations and
real interest rates, with both measures decreasing to near multi-year lows.
Economy/Macro Backdrop
EC
ON
OM
Y
9
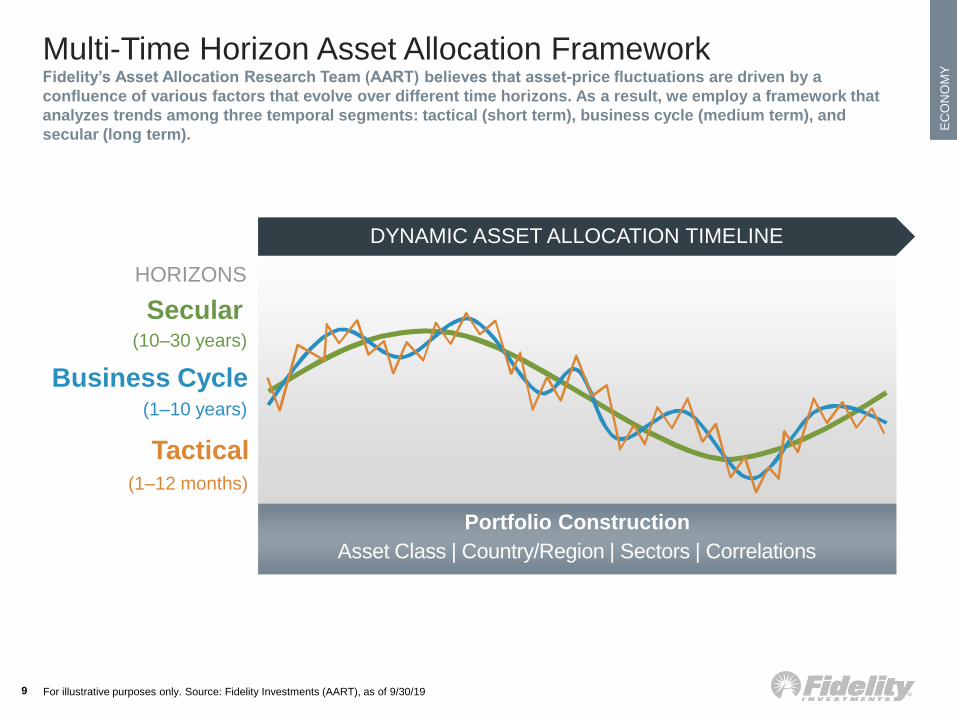
DYNAMIC ASSET ALLOCATION TIMELINE
Business Cycle
(10–30 years)
Secular
HORIZONS
(1–10 years)
Tactical(1–12 months)
Portfolio Construction
Asset Class | Country/Region | Sectors | Correlations
For illustrative purposes only. Source: Fidelity Investments (AART), as of 9/30/19
Multi-Time Horizon Asset Allocation FrameworkFidelity’s Asset Allocation Research Team (AART) believes that asset-price fluctuations are driven by a
confluence of various factors that evolve over different time horizons. As a result, we employ a framework that
analyzes trends among three temporal segments: tactical (short term), business cycle (medium term), and
secular (long term).
EC
ON
OM
Y
10
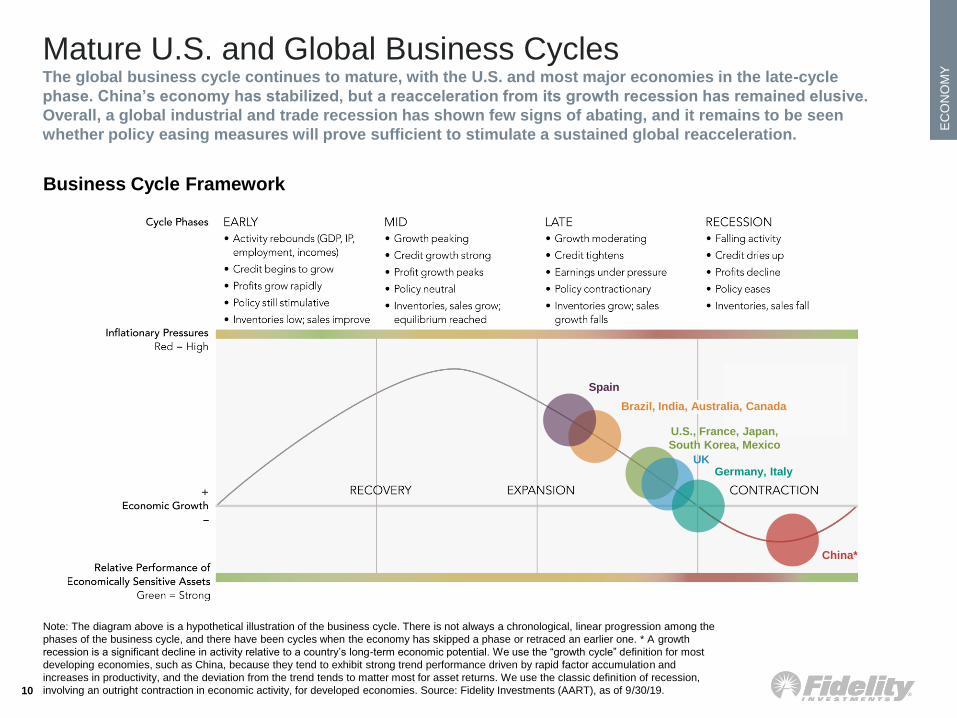
Note: The diagram above is a hypothetical illustration of the business cycle. There is not always a chronological, linear progression among the
phases of the business cycle, and there have been cycles when the economy has skipped a phase or retraced an earlier one. * A growth
recession is a significant decline in activity relative to a country’s long-term economic potential. We use the “growth cycle” definition for most
developing economies, such as China, because they tend to exhibit strong trend performance driven by rapid factor accumulation and
increases in productivity, and the deviation from the trend tends to matter most for asset returns. We use the classic definition of recession,
involving an outright contraction in economic activity, for developed economies. Source: Fidelity Investments (AART), as of 9/30/19.
Business Cycle Framework
Mature U.S. and Global Business CyclesThe global business cycle continues to mature, with the U.S. and most major economies in the late-cycle
phase. China’s economy has stabilized, but a reacceleration from its growth recession has remained elusive.
Overall, a global industrial and trade recession has shown few signs of abating, and it remains to be seen
whether policy easing measures will prove sufficient to stimulate a sustained global reacceleration.
Germany, Italy
China*
Brazil, India, Australia, Canada
Spain
U.S., France, Japan,
South Korea, Mexico
UK
EC
ON
OM
Y
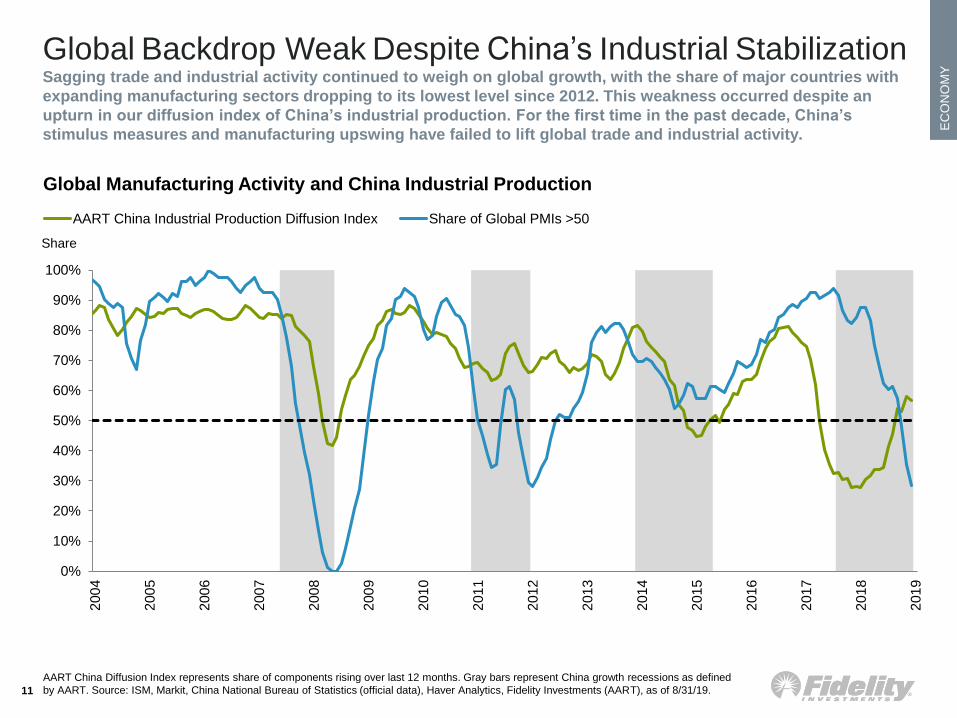
AART China Diffusion Index represents share of components rising over last 12 months. Gray bars represent China growth recessions as defined
by AART. Source: ISM, Markit, China National Bureau of Statistics (official data), Haver Analytics, Fidelity Investments (AART), as of 8/31/19.11
0%
10%
20%
30%
40%
50%
60%
70%
80%
90%
100%
200
4
200
5
200
6
200
7
200
8
200
9
201
0
201
1
201
2
201
3
201
4
201
5
201
6
201
7
201
8
201
9
AART China Industrial Production Diffusion Index Share of Global PMIs >50
Global Manufacturing Activity and China Industrial Production
Share
Global Backdrop Weak Despite China’s Industrial StabilizationSagging trade and industrial activity continued to weigh on global growth, with the share of major countries with
expanding manufacturing sectors dropping to its lowest level since 2012. This weakness occurred despite an
upturn in our diffusion index of China’s industrial production. For the first time in the past decade, China’s
stimulus measures and manufacturing upswing have failed to lift global trade and industrial activity.
EC
ON
OM
Y
-20%
-10%
0%
10%
20%
30%
40%
50%
60%
10%
15%
20%
25%
30%
35%
20
07
20
08
20
09
20
10
20
11
20
12
20
13
20
14
20
15
20
16
20
17
20
18
20
19
Total Credit Growth Housing Sales
12
China Credit and Property Market
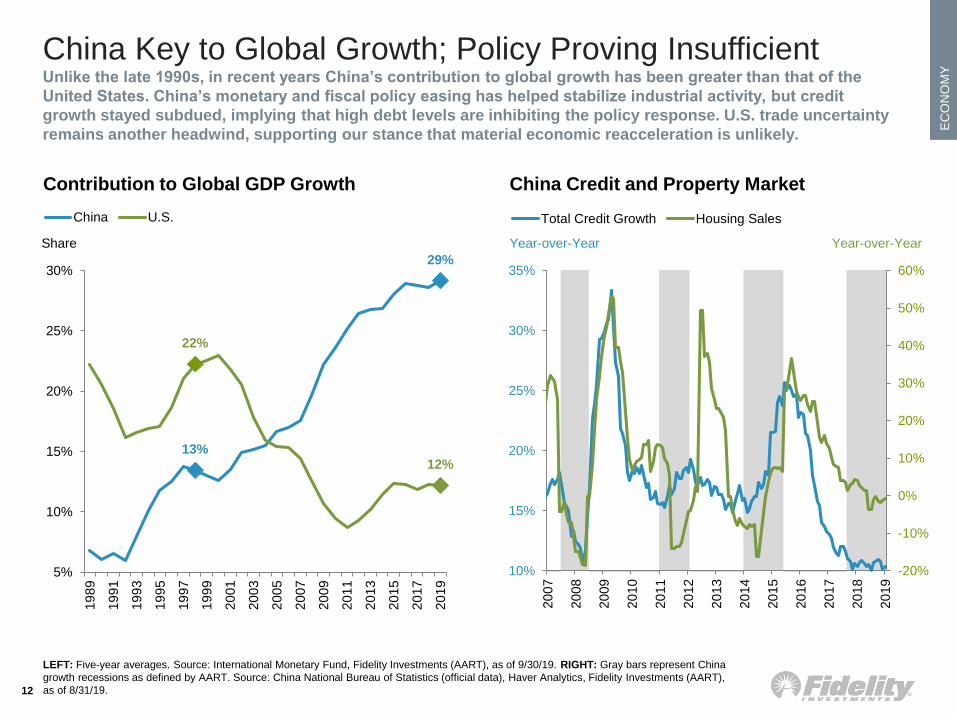
LEFT: Five-year averages. Source: International Monetary Fund, Fidelity Investments (AART), as of 9/30/19. RIGHT: Gray bars represent China
growth recessions as defined by AART. Source: China National Bureau of Statistics (official data), Haver Analytics, Fidelity Investments (AART),
as of 8/31/19.
Year-over-Year Year-over-Year
13%
29%
22%
12%
5%
10%
15%
20%
25%
30%
19
89
19
91
19
93
19
95
19
97
19
99
20
01
20
03
20
05
20
07
20
09
20
11
20
13
20
15
20
17
20
19
China U.S.
Contribution to Global GDP Growth
Share
China Key to Global Growth; Policy Proving InsufficientUnlike the late 1990s, in recent years China’s contribution to global growth has been greater than that of the
United States. China’s monetary and fiscal policy easing has helped stabilize industrial activity, but credit
growth stayed subdued, implying that high debt levels are inhibiting the policy response. U.S. trade uncertainty
remains another headwind, supporting our stance that material economic reacceleration is unlikely.
EC
ON
OM
Y
0%
5%
10%
15%
20%
25%
30%
Germ
any
Sw
ede
n
S. K
ore
a
UK
Ca
nad
a
Me
xic
o
Japa
n
Ch
ina
U.S
.
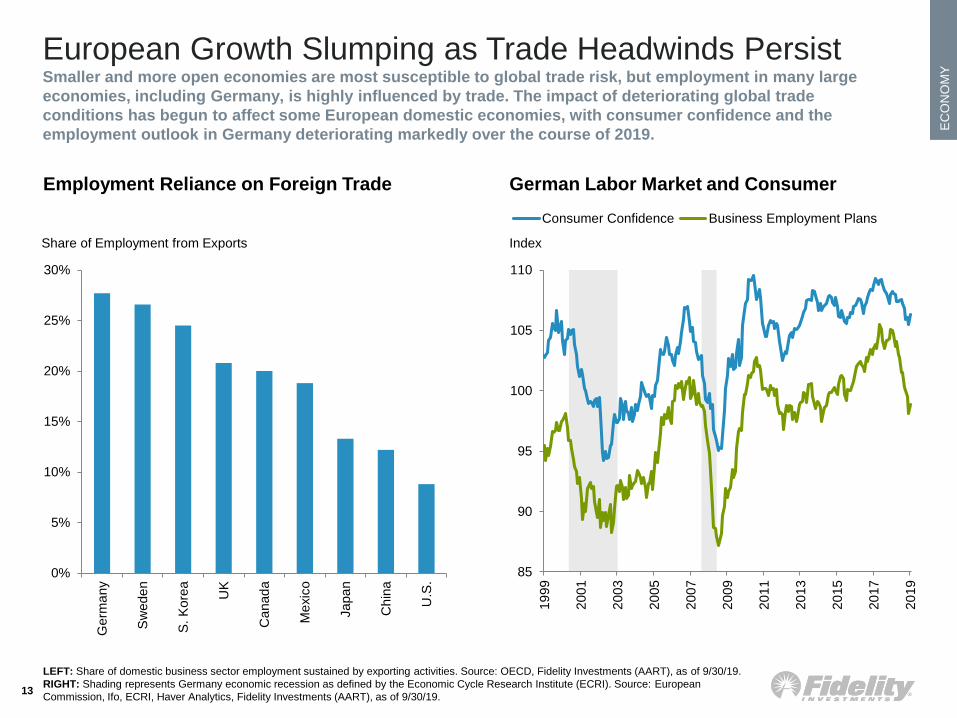
LEFT: Share of domestic business sector employment sustained by exporting activities. Source: OECD, Fidelity Investments (AART), as of 9/30/19.
RIGHT: Shading represents Germany economic recession as defined by the Economic Cycle Research Institute (ECRI). Source: European
Commission, Ifo, ECRI, Haver Analytics, Fidelity Investments (AART), as of 9/30/19.13
Employment Reliance on Foreign Trade
Share of Employment from Exports
0
0
85
90
95
100
105
110
19
99
20
01
20
03
20
05
20
07
20
09
20
11
20
13
20
15
20
17
20
19
Consumer Confidence Business Employment Plans
Index
German Labor Market and Consumer
European Growth Slumping as Trade Headwinds PersistSmaller and more open economies are most susceptible to global trade risk, but employment in many large
economies, including Germany, is highly influenced by trade. The impact of deteriorating global trade
conditions has begun to affect some European domestic economies, with consumer confidence and the
employment outlook in Germany deteriorating markedly over the course of 2019.
EC
ON
OM
Y
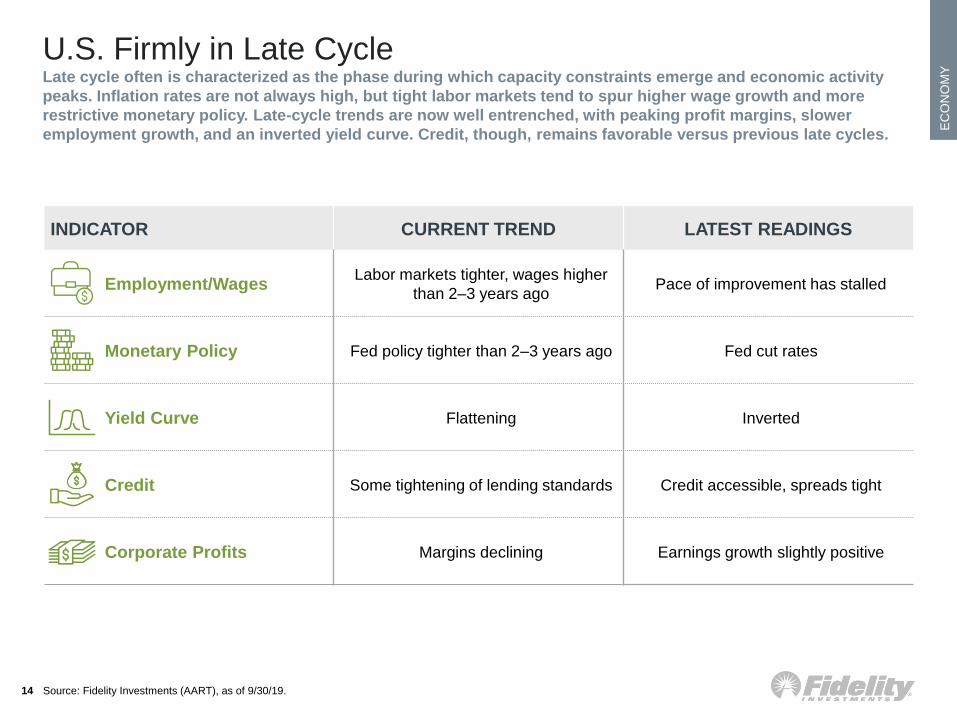
INDICATOR CURRENT TREND LATEST READINGS
Employment/WagesLabor markets tighter, wages higher
than 2–3 years agoPace of improvement has stalled
Monetary Policy Fed policy tighter than 2–3 years ago Fed cut rates
Yield Curve Flattening Inverted
Credit Some tightening of lending standards Credit accessible, spreads tight
Corporate Profits Margins declining Earnings growth slightly positive
Source: Fidelity Investments (AART), as of 9/30/19.14
U.S. Firmly in Late CycleLate cycle often is characterized as the phase during which capacity constraints emerge and economic activity
peaks. Inflation rates are not always high, but tight labor markets tend to spur higher wage growth and more
restrictive monetary policy. Late-cycle trends are now well entrenched, with peaking profit margins, slower
employment growth, and an inverted yield curve. Credit, though, remains favorable versus previous late cycles.
EC
ON
OM
Y
0-80%
-60%
-40%
-20%
0%
20%
40%
60%
19
68
19
71
19
74
19
77
19
80
19
83
19
86
19
89
19
92
19
95
19
98
20
01
20
04
20
07
20
10
20
13
20
16
20
19
Conference Board Survey
85
90
95
100
105
110
115
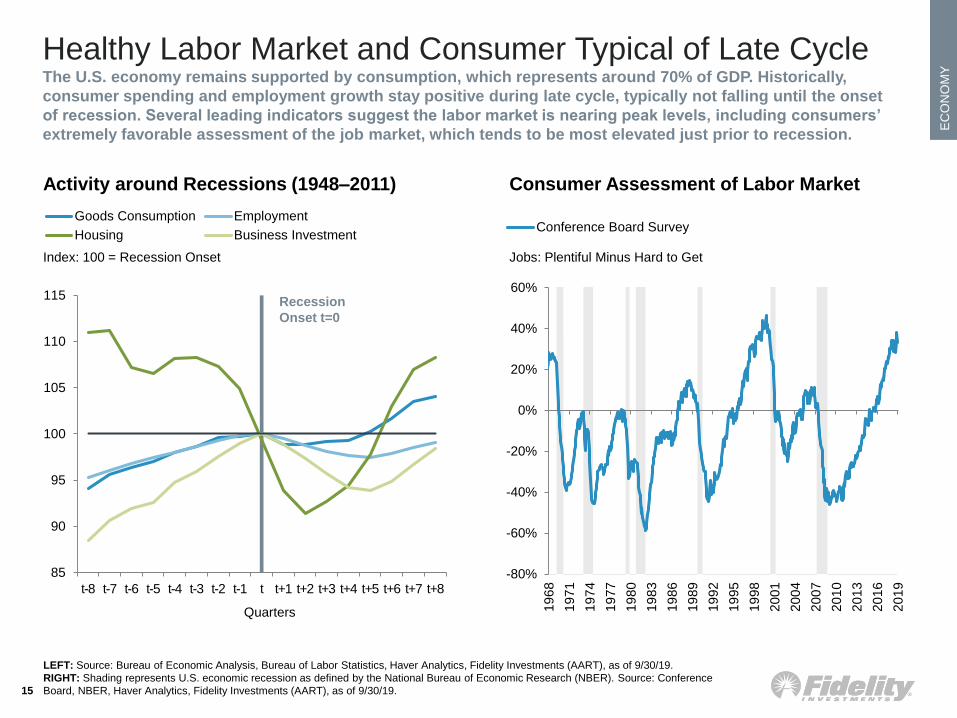
t-8 t-7 t-6 t-5 t-4 t-3 t-2 t-1 t t+1 t+2 t+3 t+4 t+5 t+6 t+7 t+8
Goods Consumption Employment
Housing Business Investment
LEFT: Source: Bureau of Economic Analysis, Bureau of Labor Statistics, Haver Analytics, Fidelity Investments (AART), as of 9/30/19.
RIGHT: Shading represents U.S. economic recession as defined by the National Bureau of Economic Research (NBER). Source: Conference
Board, NBER, Haver Analytics, Fidelity Investments (AART), as of 9/30/19.15
Jobs: Plentiful Minus Hard to Get
Consumer Assessment of Labor Market
Recession
Onset t=0
Quarters
Activity around Recessions (1948–2011)
Index: 100 = Recession Onset
Healthy Labor Market and Consumer Typical of Late CycleThe U.S. economy remains supported by consumption, which represents around 70% of GDP. Historically,
consumer spending and employment growth stay positive during late cycle, typically not falling until the onset
of recession. Several leading indicators suggest the labor market is nearing peak levels, including consumers’
extremely favorable assessment of the job market, which tends to be most elevated just prior to recession.
EC
ON
OM
Y
35
40
45
50
55
60
65
-80%
-60%
-40%
-20%
0%
20%
40%
60%
80%
20
06
20
07
20
08
20
09
20
10
20
11
20
12
20
13
20
14
20
15
20
16
20
17
20
18
20
19
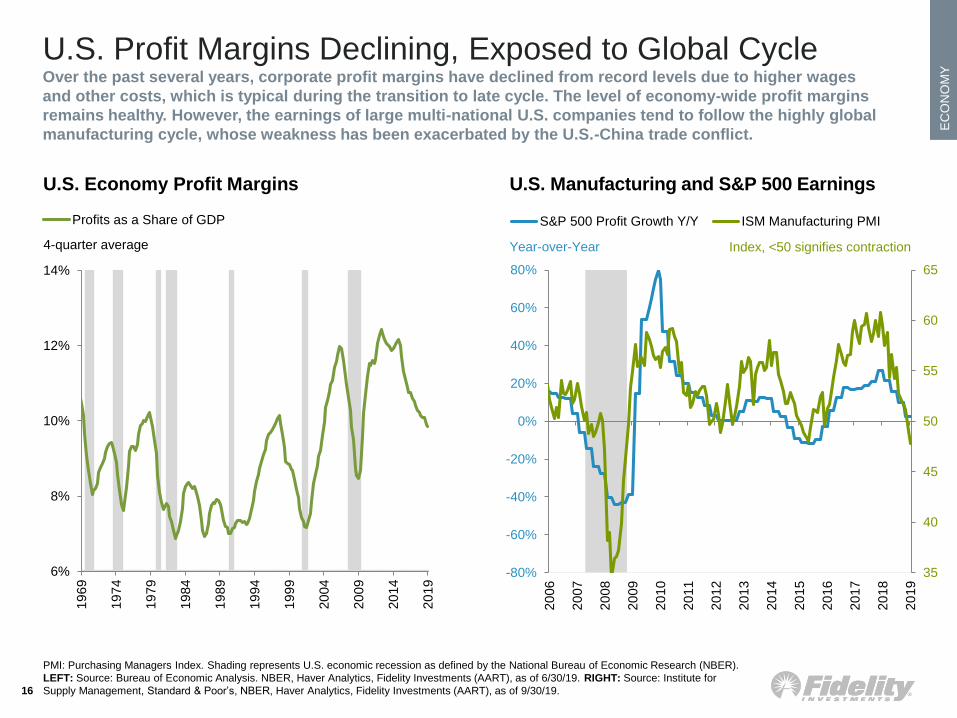
S&P 500 Profit Growth Y/Y ISM Manufacturing PMI
PMI: Purchasing Managers Index. Shading represents U.S. economic recession as defined by the National Bureau of Economic Research (NBER).
LEFT: Source: Bureau of Economic Analysis. NBER, Haver Analytics, Fidelity Investments (AART), as of 6/30/19. RIGHT: Source: Institute for
Supply Management, Standard & Poor’s, NBER, Haver Analytics, Fidelity Investments (AART), as of 9/30/19.16
6%
8%
10%
12%
14%
19
69
19
74
19
79
19
84
19
89
19
94
19
99
20
04
20
09
20
14
20
19
Profits as a Share of GDP
U.S. Economy Profit Margins
4-quarter average
U.S. Manufacturing and S&P 500 Earnings
Year-over-Year Index, <50 signifies contraction
U.S. Profit Margins Declining, Exposed to Global CycleOver the past several years, corporate profit margins have declined from record levels due to higher wages
and other costs, which is typical during the transition to late cycle. The level of economy-wide profit margins
remains healthy. However, the earnings of large multi-national U.S. companies tend to follow the highly global
manufacturing cycle, whose weakness has been exacerbated by the U.S.-China trade conflict.
EC
ON
OM
Y
17
LEFT and RIGHT: Core CPI: Consumer Price Index excluding food and energy. Source: Bureau of Labor Statistics, Haver Analytics, Fidelity
Investments (AART), as of 8/31/19.
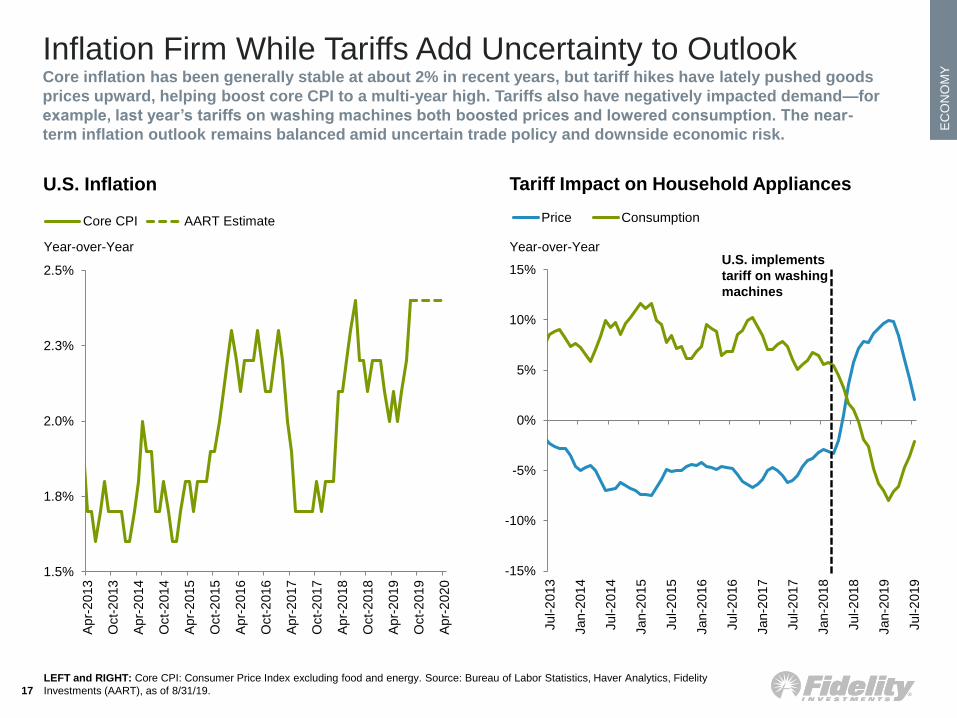
U.S. Inflation
Year-over-Year
Tariff Impact on Household Appliances
-15%
-10%
-5%
0%
5%
10%
15%
Jul-2
013
Jan-2
014
Jul-2
014
Jan-2
015
Jul-2
015
Jan-2
016
Jul-2
016
Jan-2
017
Jul-2
017
Jan-2
018
Jul-2
018
Jan-2
019
Jul-2
019
Price Consumption
Year-over-Year
1.5%
1.8%
2.0%
2.3%
2.5%
Apr-
2013
Oct-
2013
Apr-
2014
Oct-
2014
Apr-
2015
Oct-
2015
Apr-
2016
Oct-
2016
Apr-
2017
Oct-
2017
Apr-
2018
Oct-
2018
Apr-
2019
Oct-
2019
Apr-
2020
Core CPI AART Estimate
U.S. implements
tariff on washing
machines
Inflation Firm While Tariffs Add Uncertainty to OutlookCore inflation has been generally stable at about 2% in recent years, but tariff hikes have lately pushed goods
prices upward, helping boost core CPI to a multi-year high. Tariffs also have negatively impacted demand—for
example, last year’s tariffs on washing machines both boosted prices and lowered consumption. The near-
term inflation outlook remains balanced amid uncertain trade policy and downside economic risk.
EC
ON
OM
Y
0.1-4%
-3%
-2%
-1%
0%
1%
2%
3%
4%
5%
6%
19
65
19
68
19
71
19
74
19
77
19
80
19
83
19
86
19
89
19
92
19
95
19
98
20
01
20
04
20
07
20
10
20
13
20
16
20
19
10-Year Minus 3-Month Yield
18
U.S. Treasury Yield Curve
Yield Spread
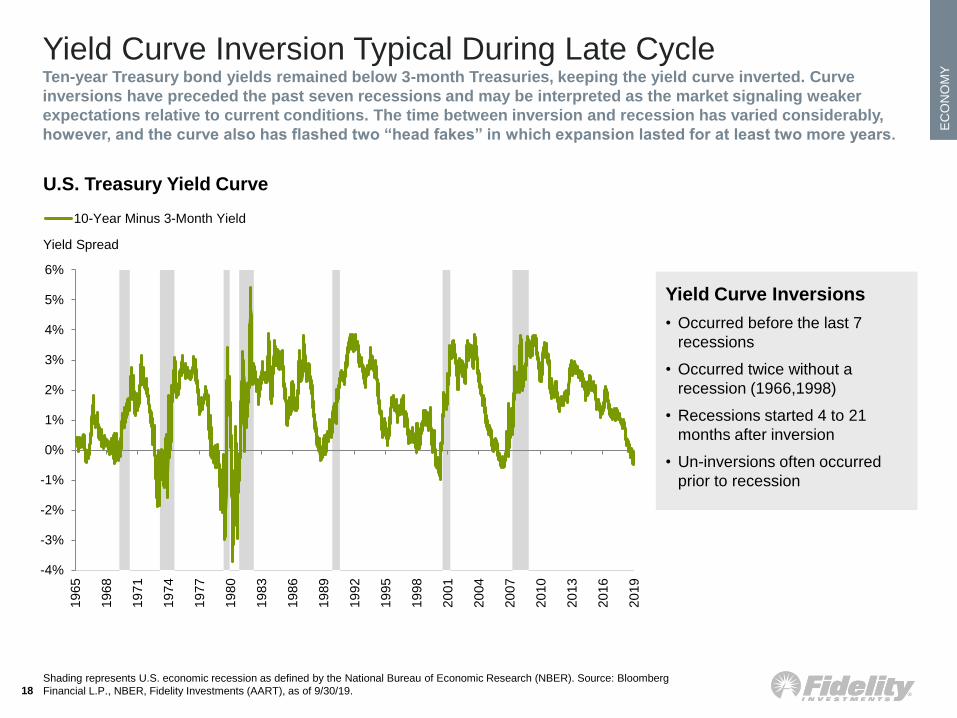
Yield Curve Inversions
• Occurred before the last 7
recessions
• Occurred twice without a
recession (1966,1998)
• Recessions started 4 to 21
months after inversion
• Un-inversions often occurred
prior to recession
Shading represents U.S. economic recession as defined by the National Bureau of Economic Research (NBER). Source: Bloomberg
Financial L.P., NBER, Fidelity Investments (AART), as of 9/30/19.
Yield Curve Inversion Typical During Late CycleTen-year Treasury bond yields remained below 3-month Treasuries, keeping the yield curve inverted. Curve
inversions have preceded the past seven recessions and may be interpreted as the market signaling weaker
expectations relative to current conditions. The time between inversion and recession has varied considerably,
however, and the curve also has flashed two “head fakes” in which expansion lasted for at least two more years.
EC
ON
OM
Y
-200
-100
0
100
200
300
400
500
600
700
Mid-Cycle Late-Cycle
High Yield OAS
19
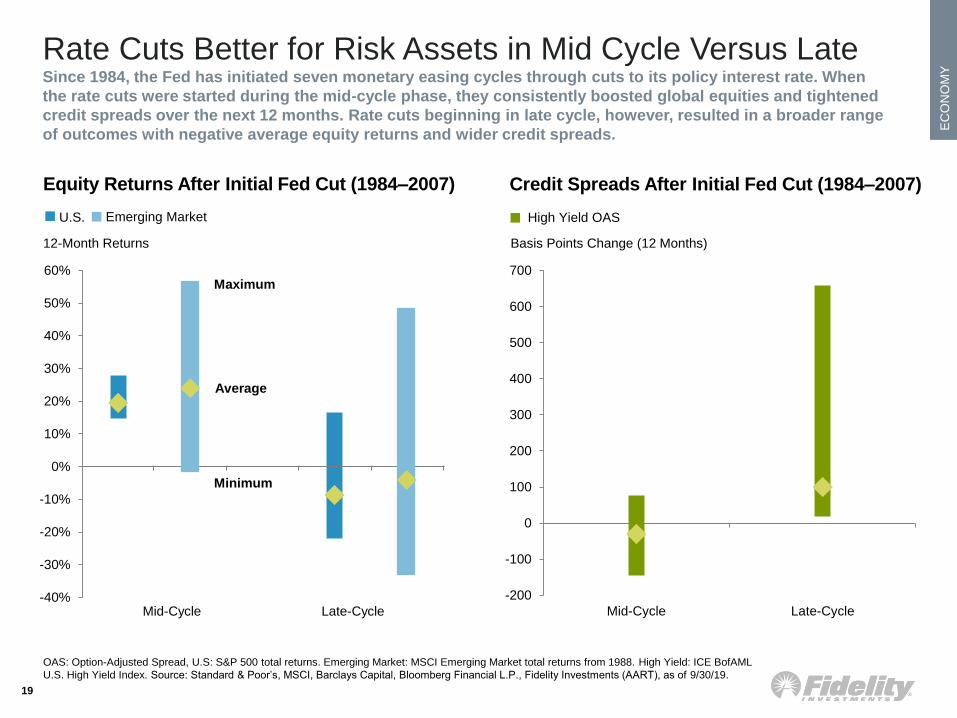
Credit Spreads After Initial Fed Cut (1984–2007)
Basis Points Change (12 Months)
OAS: Option-Adjusted Spread, U.S: S&P 500 total returns. Emerging Market: MSCI Emerging Market total returns from 1988. High Yield: ICE BofAML
U.S. High Yield Index. Source: Standard & Poor’s, MSCI, Barclays Capital, Bloomberg Financial L.P., Fidelity Investments (AART), as of 9/30/19.
-40%
-30%
-20%
-10%
0%
10%
20%
30%
40%
50%
60%
U.S. Emerging Market
Equity Returns After Initial Fed Cut (1984–2007)
Maximum
Minimum
Average
12-Month Returns
Mid-Cycle Late-Cycle
U.S.
Rate Cuts Better for Risk Assets in Mid Cycle Versus LateSince 1984, the Fed has initiated seven monetary easing cycles through cuts to its policy interest rate. When
the rate cuts were started during the mid-cycle phase, they consistently boosted global equities and tightened
credit spreads over the next 12 months. Rate cuts beginning in late cycle, however, resulted in a broader range
of outcomes with negative average equity returns and wider credit spreads.
EC
ON
OM
Y
-$2,500
-$2,000
-$1,500
-$1,000
-$500
$0
$500
$1,000-$1,000
-$500
$0
$500
$1,000
$1,500
$2,000
$2,500
Jan-2
014
Jul-2
014
Jan-2
015
Jul-2
015
Jan-2
016
Jul-2
016
Jan-2
017
Jul-2
017
Jan-2
018
Jul-2
018
Jan-2
019
Jul-2
019
Jan-2
020
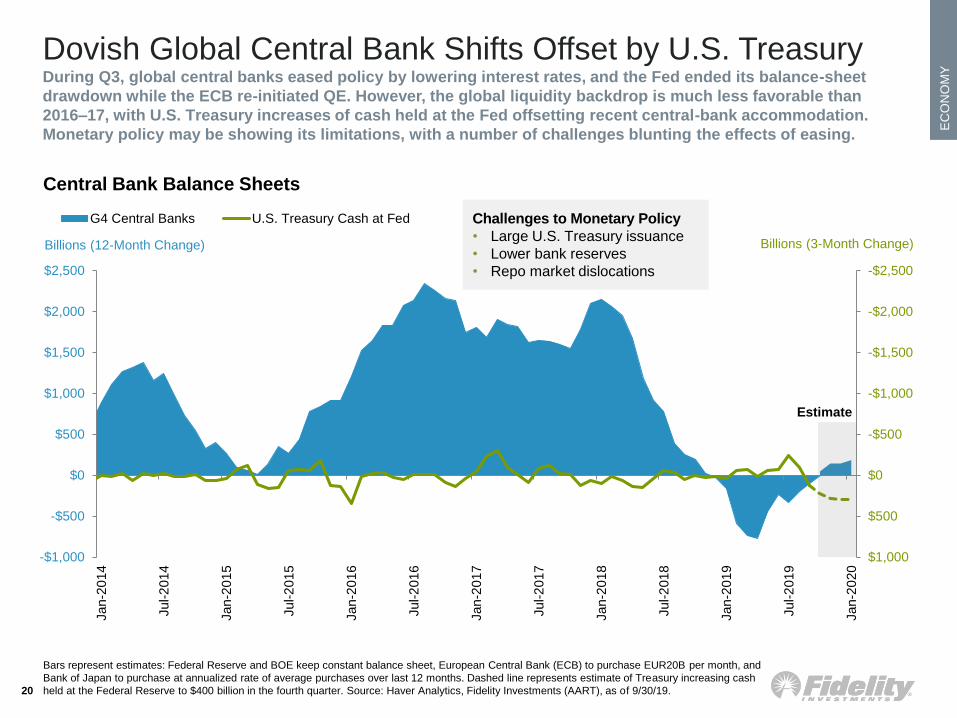
G4 Central Banks U.S. Treasury Cash at Fed Challenges to Monetary Policy
• Large U.S. Treasury issuance
• Lower bank reserves
• Repo market dislocations
20
Billions (12-Month Change)
Bars represent estimates: Federal Reserve and BOE keep constant balance sheet, European Central Bank (ECB) to purchase EUR20B per month, and
Bank of Japan to purchase at annualized rate of average purchases over last 12 months. Dashed line represents estimate of Treasury increasing cash
held at the Federal Reserve to $400 billion in the fourth quarter. Source: Haver Analytics, Fidelity Investments (AART), as of 9/30/19.
Central Bank Balance Sheets
Estimate
Dovish Global Central Bank Shifts Offset by U.S. TreasuryDuring Q3, global central banks eased policy by lowering interest rates, and the Fed ended its balance-sheet
drawdown while the ECB re-initiated QE. However, the global liquidity backdrop is much less favorable than
2016–17, with U.S. Treasury increases of cash held at the Fed offsetting recent central-bank accommodation.
Monetary policy may be showing its limitations, with a number of challenges blunting the effects of easing.
Billions (3-Month Change)
EC
ON
OM
Y
21RIGHT: Shaded areas are announced changes as of 9/30/19. Source: Peterson Institute for International Economics, Fidelity
Investments (AART) as of 9/30/19.
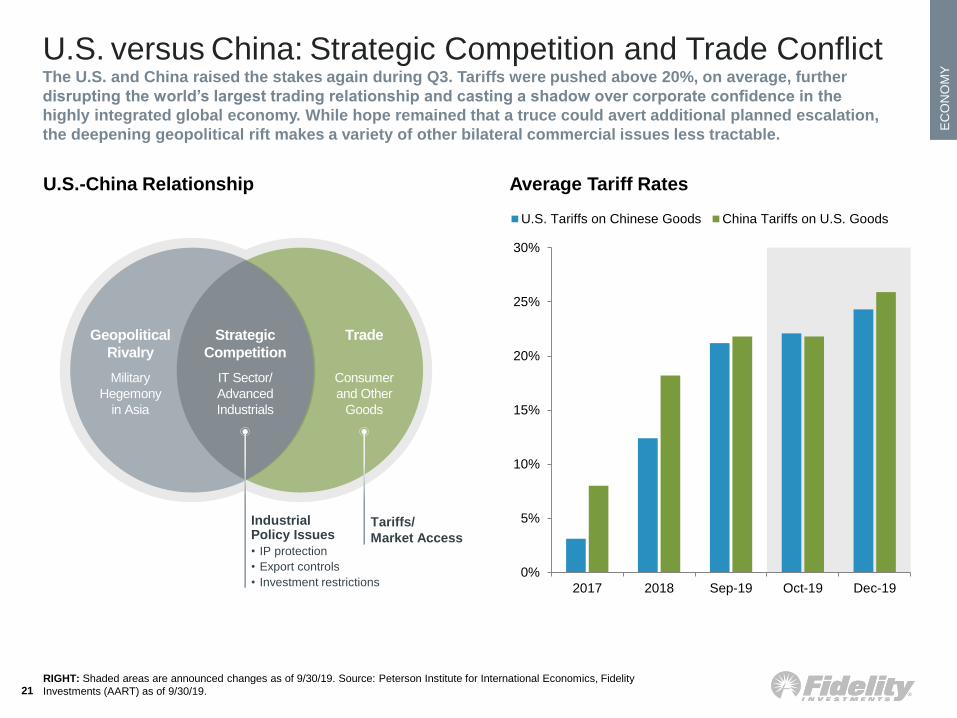
U.S.-China Relationship
Geopolitical
Rivalry
Trade
Tariffs/
Market Access
Industrial Policy Issues
• IP protection
• Export controls
• Investment restrictions
Strategic
Competition
Average Tariff Rates
Military
Hegemony
in Asia
IT Sector/
Advanced
Industrials
Consumer
and Other
Goods
0%
5%
10%
15%
20%
25%
30%
2017 2018 Sep-19 Oct-19 Dec-19
U.S. Tariffs on Chinese Goods China Tariffs on U.S. Goods
U.S. versus China: Strategic Competition and Trade ConflictThe U.S. and China raised the stakes again during Q3. Tariffs were pushed above 20%, on average, further
disrupting the world’s largest trading relationship and casting a shadow over corporate confidence in the
highly integrated global economy. While hope remained that a truce could avert additional planned escalation,
the deepening geopolitical rift makes a variety of other bilateral commercial issues less tractable.
EC
ON
OM
Y
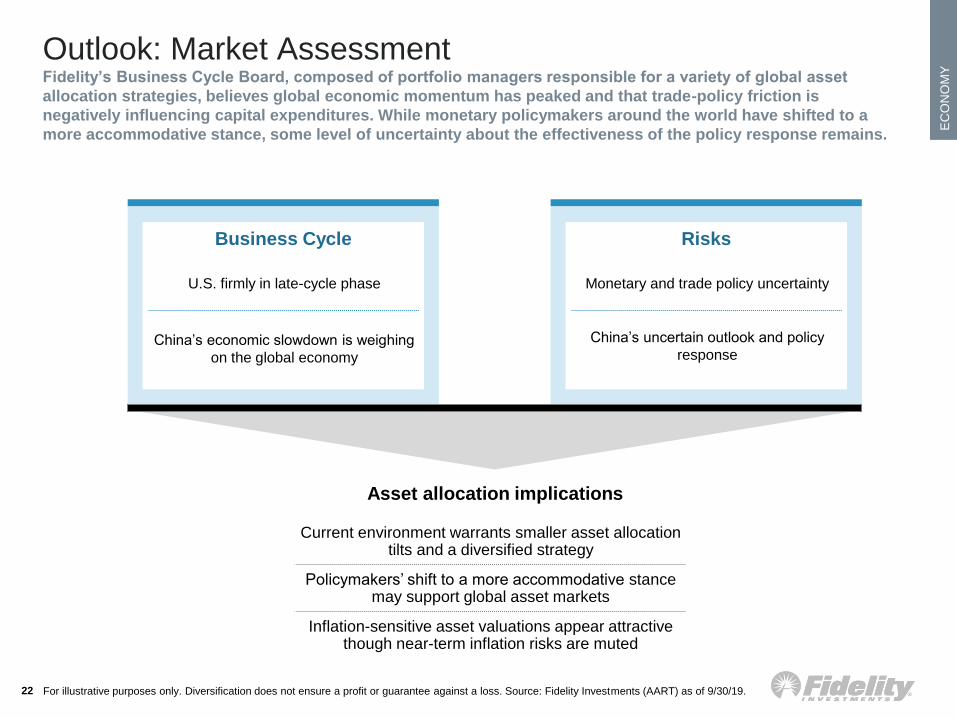
Risks
22
Business Cycle
Asset allocation implications
U.S. firmly in late-cycle phase
China’s economic slowdown is weighing
on the global economy
Current environment warrants smaller asset allocation tilts and a diversified strategy
Policymakers’ shift to a more accommodative stance may support global asset markets
Inflation-sensitive asset valuations appear attractive though near-term inflation risks are muted
For illustrative purposes only. Diversification does not ensure a profit or guarantee against a loss. Source: Fidelity Investments (AART) as of 9/30/19.
Monetary and trade policy uncertainty
China’s uncertain outlook and policy
response
Outlook: Market AssessmentFidelity’s Business Cycle Board, composed of portfolio managers responsible for a variety of global asset
allocation strategies, believes global economic momentum has peaked and that trade-policy friction is
negatively influencing capital expenditures. While monetary policymakers around the world have shifted to a
more accommodative stance, some level of uncertainty about the effectiveness of the policy response remains.

Asset Markets
AS
SE
T M
AR
KE
TS
EM: Emerging Markets. EMEA: Europe, the Middle East, and Africa. For indexes and other important information used to represent above asset
categories, see Appendix. Past performance is no guarantee of future results. It is not possible to invest directly in an index. All indexes are
unmanaged. Sector returns represented by S&P 500 sectors. Sector investing involves risk. Because of its narrow focus, sector investing may be
more volatile than investing in more diversified baskets of securities. Source: Bloomberg, Fidelity Investments (AART), as of 9/30/19.24
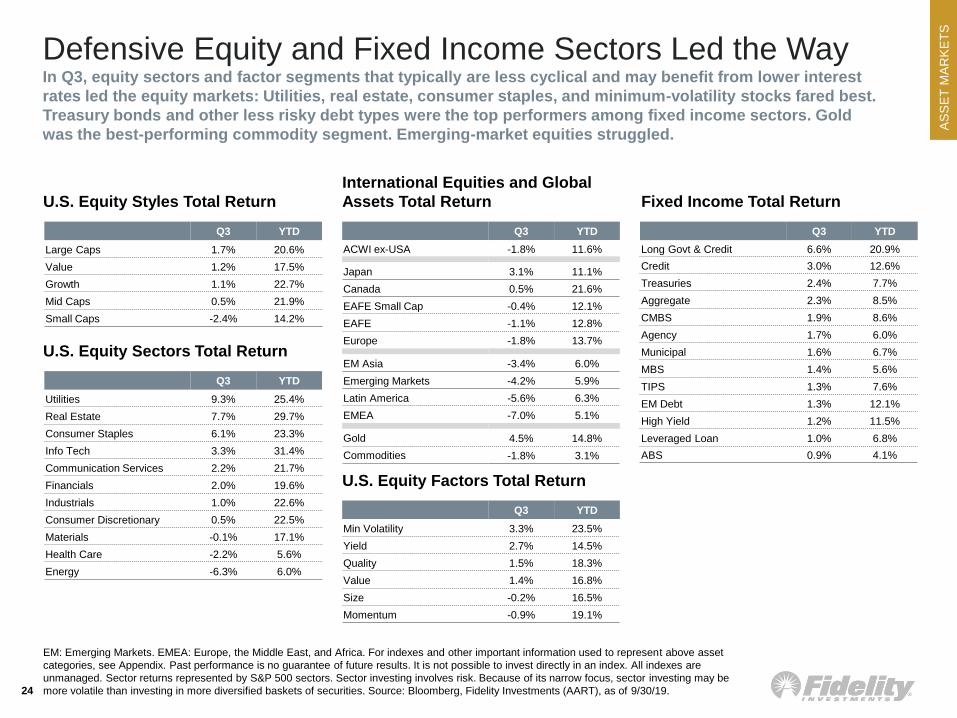
U.S. Equity Styles Total Return
International Equities and Global
Assets Total Return
U.S. Equity Sectors Total Return
Q3 YTD
Large Caps 1.7% 20.6%
Value 1.2% 17.5%
Growth 1.1% 22.7%
Mid Caps 0.5% 21.9%
Small Caps -2.4% 14.2%
Q3 YTD
Utilities 9.3% 25.4%
Real Estate 7.7% 29.7%
Consumer Staples 6.1% 23.3%
Info Tech 3.3% 31.4%
Communication Services 2.2% 21.7%
Financials 2.0% 19.6%
Industrials 1.0% 22.6%
Consumer Discretionary 0.5% 22.5%
Materials -0.1% 17.1%
Health Care -2.2% 5.6%
Energy -6.3% 6.0%
Q3 YTD
ACWI ex-USA -1.8% 11.6%
Japan 3.1% 11.1%
Canada 0.5% 21.6%
EAFE Small Cap -0.4% 12.1%
EAFE -1.1% 12.8%
Europe -1.8% 13.7%
EM Asia -3.4% 6.0%
Emerging Markets -4.2% 5.9%
Latin America -5.6% 6.3%
EMEA -7.0% 5.1%
Gold 4.5% 14.8%
Commodities -1.8% 3.1%
Fixed Income Total Return
Q3 YTD
Long Govt & Credit 6.6% 20.9%
Credit 3.0% 12.6%
Treasuries 2.4% 7.7%
Aggregate 2.3% 8.5%
CMBS 1.9% 8.6%
Agency 1.7% 6.0%
Municipal 1.6% 6.7%
MBS 1.4% 5.6%
TIPS 1.3% 7.6%
EM Debt 1.3% 12.1%
High Yield 1.2% 11.5%
Leveraged Loan 1.0% 6.8%
ABS 0.9% 4.1%
Q3 YTD
Min Volatility 3.3% 23.5%
Yield 2.7% 14.5%
Quality 1.5% 18.3%
Value 1.4% 16.8%
Size -0.2% 16.5%
Momentum -0.9% 19.1%
U.S. Equity Factors Total Return
Defensive Equity and Fixed Income Sectors Led the WayIn Q3, equity sectors and factor segments that typically are less cyclical and may benefit from lower interest
rates led the equity markets: Utilities, real estate, consumer staples, and minimum-volatility stocks fared best.
Treasury bonds and other less risky debt types were the top performers among fixed income sectors. Gold
was the best-performing commodity segment. Emerging-market equities struggled.
AS
SE
T M
AR
KE
TS
0%
10%
20%
Stocks High Yield Commodities Investment-Grade Bonds
25
Diversification does not ensure a profit or guarantee against a loss. Past performance is no guarantee of future results. It is not possible to
invest directly in an index. All indexes are unmanaged. Asset class total returns are represented by indexes from the following sources: Fidelity
Investments, Morningstar, and Bloomberg Barclays. Fidelity Investments source: a proprietary analysis of historical asset class performance,
which is not indicative of future performance.
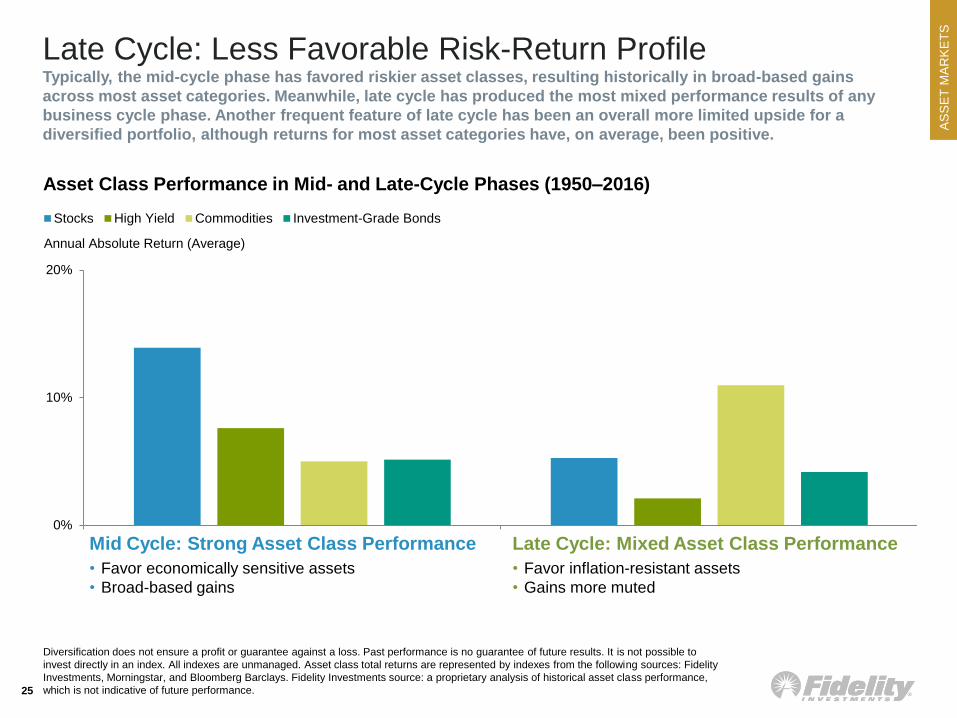
Asset Class Performance in Mid- and Late-Cycle Phases (1950–2016)
Annual Absolute Return (Average)
Mid Cycle: Strong Asset Class Performance
• Favor economically sensitive assets
• Broad-based gains
Late Cycle: Mixed Asset Class Performance
• Favor inflation-resistant assets
• Gains more muted
Late Cycle: Less Favorable Risk-Return ProfileTypically, the mid-cycle phase has favored riskier asset classes, resulting historically in broad-based gains
across most asset categories. Meanwhile, late cycle has produced the most mixed performance results of any
business cycle phase. Another frequent feature of late cycle has been an overall more limited upside for a
diversified portfolio, although returns for most asset categories have, on average, been positive.
AS
SE
T M
AR
KE
TS
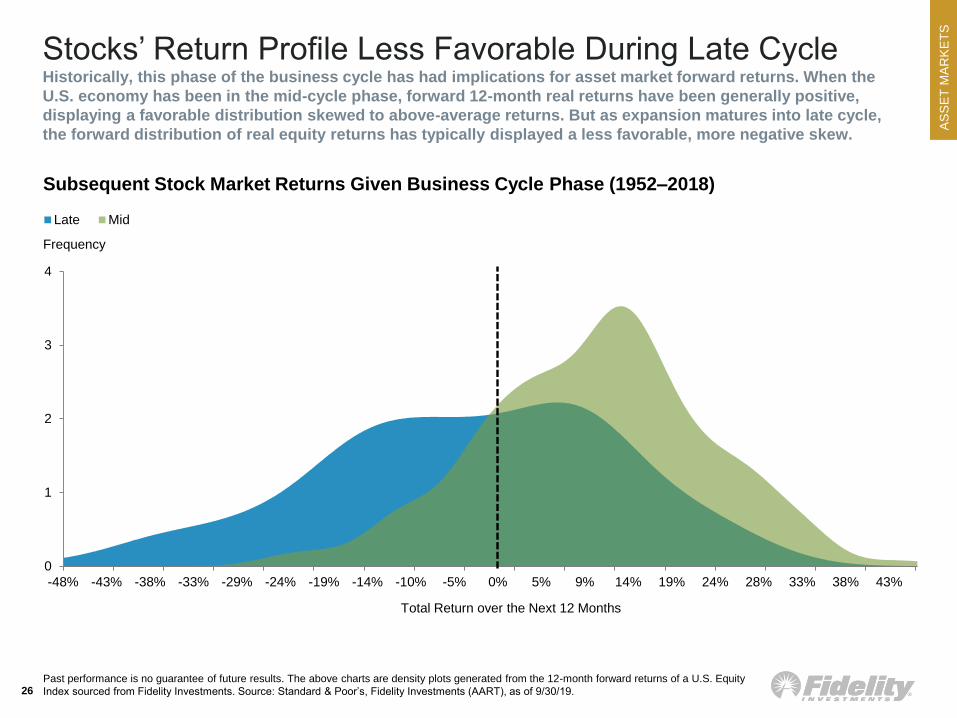
Stocks’ Return Profile Less Favorable During Late CycleHistorically, this phase of the business cycle has had implications for asset market forward returns. When the
U.S. economy has been in the mid-cycle phase, forward 12-month real returns have been generally positive,
displaying a favorable distribution skewed to above-average returns. But as expansion matures into late cycle,
the forward distribution of real equity returns has typically displayed a less favorable, more negative skew.
26
0
1
2
3
4
-48% -43% -38% -33% -29% -24% -19% -14% -10% -5% 0% 5% 9% 14% 19% 24% 28% 33% 38% 43%
Late Mid
Subsequent Stock Market Returns Given Business Cycle Phase (1952–2018)
Past performance is no guarantee of future results. The above charts are density plots generated from the 12-month forward returns of a U.S. Equity
Index sourced from Fidelity Investments. Source: Standard & Poor’s, Fidelity Investments (AART), as of 9/30/19.
Frequency
Total Return over the Next 12 Months
AS
SE
T M
AR
KE
TS
Past performance is no guarantee of future results. It is not possible to invest directly in an index. All indexes are unmanaged.
TIPS: Treasury Inflation-Protected Securities. Hit Rate: frequency of one asset class outperforming another. Results are the difference between total
returns of the respective periods represented by indexes from the following sources: Fidelity Investments, Morningstar, and Bloomberg Barclays.
Fidelity Investments source: proprietary analysis of historical asset class performance, which is not indicative of future performance, as of 6/30/19.27
0%
10%
20%
30%
40%
50%
60%
70%
80%
90%
100%
TIPS vs.IG Bonds
Commodities vs.U.S. Equities
Mid Late
Hit Rate
Relative Asset Performance by Cycle Phase (1950–2016) U.S. Treasury Breakeven Inflation Rates
1.0%
1.2%
1.4%
1.6%
1.8%
2.0%
2.2%
2.4%
2.6%
2.8%
20
09
20
10
20
11
20
12
20
13
20
14
20
15
20
16
20
17
20
18
20
19
10 Year LT Average (Since 1998)
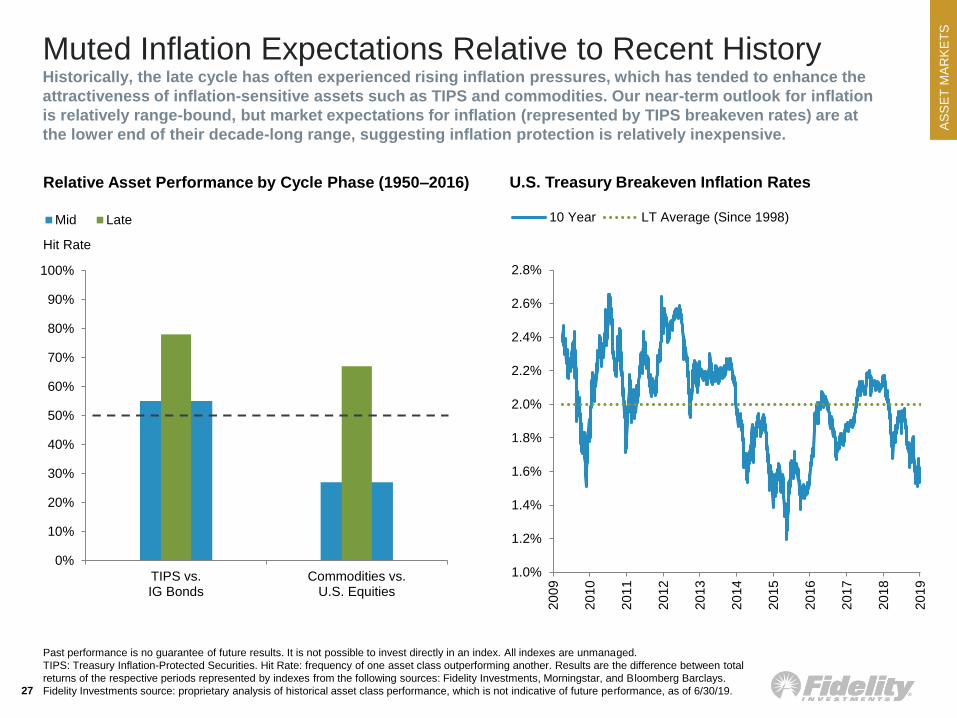
Muted Inflation Expectations Relative to Recent HistoryHistorically, the late cycle has often experienced rising inflation pressures, which has tended to enhance the
attractiveness of inflation-sensitive assets such as TIPS and commodities. Our near-term outlook for inflation
is relatively range-bound, but market expectations for inflation (represented by TIPS breakeven rates) are at
the lower end of their decade-long range, suggesting inflation protection is relatively inexpensive.
AS
SE
T M
AR
KE
TS
-20%
-10%
0%
10%
20%
30%
40%
2012 2013 2014 2015 2016 2017 2018
U.S. DM EM
Change (Year-over-Year)
28Past performance is no guarantee of future results. DM: Developed Markets. EM: Emerging Markets. EPS: Earnings per share. Forward EPS:
Next 12 months expectations. Source: MSCI, Bloomberg Financial L.P., Fidelity Investments (AART), as of 9/30/19.
Global EPS Growth (Trailing 12 Months)
Forward
EPS
8.5% 7.8%5.1%
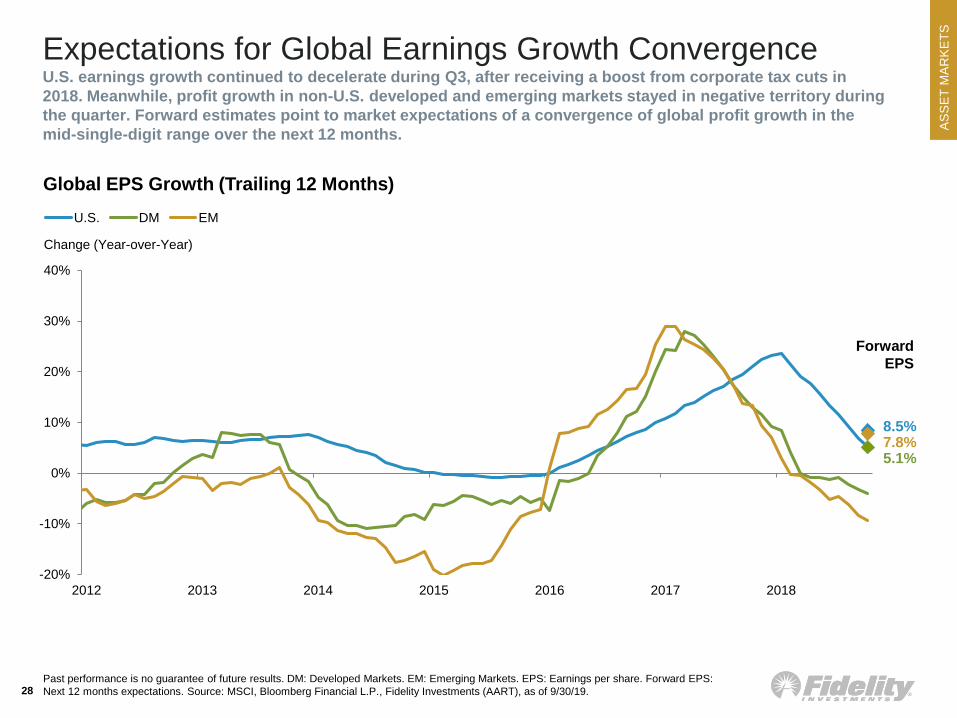
Expectations for Global Earnings Growth ConvergenceU.S. earnings growth continued to decelerate during Q3, after receiving a boost from corporate tax cuts in
2018. Meanwhile, profit growth in non-U.S. developed and emerging markets stayed in negative territory during
the quarter. Forward estimates point to market expectations of a convergence of global profit growth in the
mid-single-digit range over the next 12 months.
AS
SE
T M
AR
KE
TS
5
10
15
20
25
30
2004 2005 2006 2007 2008 2009 2010 2011 2012 2013 2014 2015 2016 2017 2018 2019
DM Trailing P/E EM Trailing P/E U.S. Trailing P/E
Forward
P/E
29
Global Market P/E Ratios
Ratio
DM: Developed Markets. EM: Emerging Markets. Past performance is no guarantee of future results. It is not possible to invest directly in an index. All
indexes are unmanaged. See Appendix for important index information. Price-to-earnings ratio (P/E): stock price divided by earnings per share. Also
known as the multiple, P/E gives investors an idea of how much they are paying for a company’s earnings power. Long-term average P/E for Emerging
Markets includes data for 1988–2017. Long-term average P/E for Developed Markets includes data for 1973–2016, U.S. 1926–2017. Foreign
Developed—MSCI EAFE Index, Emerging Markets—MSCI EM Index. Source: Bloomberg Financial L.P., Fidelity Investments (AART) as of 9/30/19.
DM Long-Term Average
U.S. Long-Term Average
EM Long-Term Average
Forward P/E
U.S.
DMEM
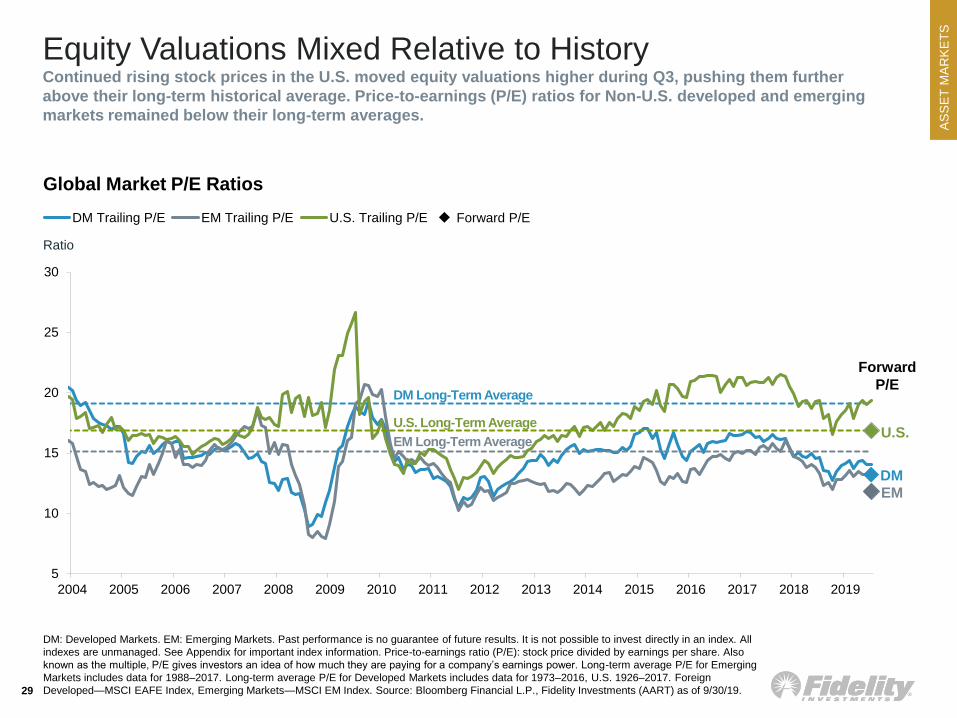
Equity Valuations Mixed Relative to HistoryContinued rising stock prices in the U.S. moved equity valuations higher during Q3, pushing them further
above their long-term historical average. Price-to-earnings (P/E) ratios for Non-U.S. developed and emerging
markets remained below their long-term averages.
AS
SE
T M
AR
KE
TS
-40%
-30%
-20%
-10%
0%
10%
20%
GBP JPY MXN CAD EUR CNY0
10
20
30
40
50
60
Ru
ssia
Turk
ey
South
Kore
a
Ch
ina
Ita
ly
Japa
n
Spain
EM
UK
Germ
any
DM
Me
xic
o
Bra
zil
Fra
nce
Austr
alia
Ca
nad
a
Indon
esia
Phili
ppin
es
India
U.S
.
Cyclical P/Es
30
DM: Developed Markets. EM: Emerging Markets. Past performance is no guarantee of future results. It is not possible to invest directly in an index. All
indexes are unmanaged. See Appendix for important index information. LEFT: Price-to-earnings (P/E) ratio (or multiple): stock price divided by
earnings per share, which indicates how much investors are paying for a company’s earnings power. Five-year peak earnings are adjusted for
inflation. Source: FactSet, countries’ statistical organizations, Haver Analytics, Fidelity Investments (AART), as of 8/31/19. RIGHT: GBP—British
pound; MXN—Mexican peso; JPY—Japanese yen; EUR—euro; CAD—Canadian dollar. Source: Federal Reserve Board, Haver Analytics, Fidelity
Investments (AART), as of 9/30/19.
8/31/19 20-Year Range
Valuation of Major Currencies vs. USD
Valuation of Real Exchange Rates
Expensive vs. $
Cheap vs. $
Price/5-Year Peak Real Earnings
Last 12-Month Range 9/30/19
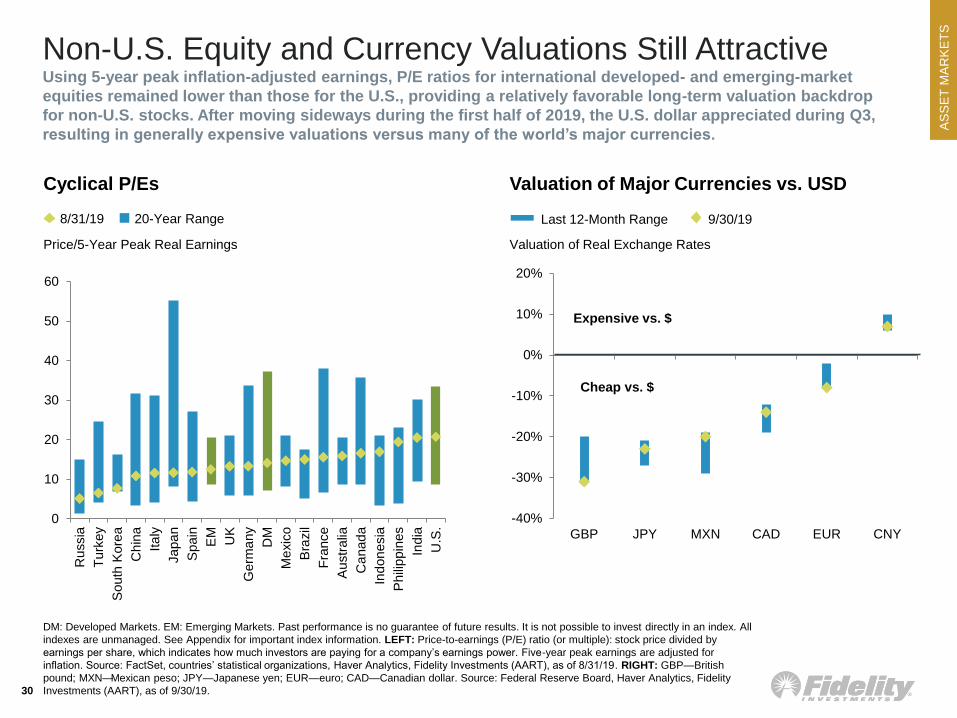
Non-U.S. Equity and Currency Valuations Still AttractiveUsing 5-year peak inflation-adjusted earnings, P/E ratios for international developed- and emerging-market
equities remained lower than those for the U.S., providing a relatively favorable long-term valuation backdrop
for non-U.S. stocks. After moving sideways during the first half of 2019, the U.S. dollar appreciated during Q3,
resulting in generally expensive valuations versus many of the world’s major currencies.
AS
SE
T M
AR
KE
TS
0%
4%
8%
12%
16%
1 2 3 4 5
Current
ERP: 3.8%
Equity Risk Premium Relation to Equities
(1926–2019)
Price-to-earnings ratio (P/E): stock price divided by earnings per share. Source: Fidelity Investments, Robert Shiller, Standard & Poor’s,
Bloomberg Barclays, Haver Analytics, Fidelity Investments (AART), as of 9/3019.31
0%
4%
8%
12%
16%
1 2 3 4 5
Current
P/E: 19.3
P/E Relation to Equities (1926–2019)
4-Quarter Forward S&P500 Average Return4-Quarter Forward S&P500 Average Return
Correlation
1-year 10-year
0.4 0.6
Correlation
1-year 10-year
0.2 0.3
Expensive
Quintile
Cheap Expensive
Quintile
Cheap
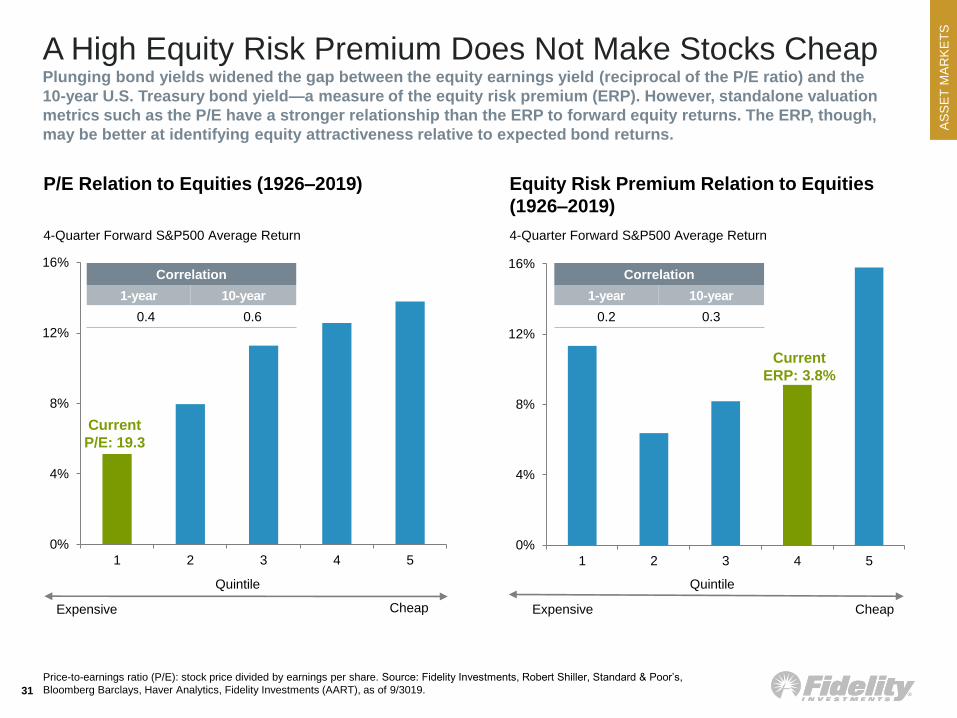
A High Equity Risk Premium Does Not Make Stocks CheapPlunging bond yields widened the gap between the equity earnings yield (reciprocal of the P/E ratio) and the
10-year U.S. Treasury bond yield—a measure of the equity risk premium (ERP). However, standalone valuation
metrics such as the P/E have a stronger relationship than the ERP to forward equity returns. The ERP, though,
may be better at identifying equity attractiveness relative to expected bond returns.
AS
SE
T M
AR
KE
TS
32
Past performance is no guarantee of future results. Sectors as defined by GICS. White line is a theoretical representation of the business cycle as it
moves through early, mid, late, and recession phases. Green and red shaded portions above respectively represent over- or underperformance
relative to the broader market; unshaded (white) portions suggest no clear pattern of over- or underperformance. Double +/– signs indicate that the
sector is showing a consistent signal across all three metrics: full-phase average performance, median monthly difference, and cycle hit rate.
A single +/– indicates a mixed or less consistent signal. Return data from 1962 to 2016. Source: Fidelity Investments (AART), as of 9/30/19.
Business-Cycle Approach to Sectors
SectorEARLY CYCLE
Rebounds
MID CYCLE
Peaks
LATE CYCLE
Moderates
RECESSION
Contracts
Financials +Real Estate ++ --Consumer Discretionary ++ - --Information Technology + + -- --Industrials ++ --Materials + -- ++Consumer Staples ++ ++Health Care -- ++ ++Energy -- ++Communication Services + -Utilities -- - + ++
Economically sensitive sectors
may tend to outperform, while
more defensive sectors have
tended to underperform.
Making marginal portfolio
allocation changes to manage
drawdown risk with sectors
may enhance risk-adjusted
returns during this cycle.
Defensive and inflation-
resistant sectors tend to
perform better, while more
cyclical sectors
underperform.
Since performance is generally
negative in recessions,
investors should focus on the
most defensive, historically
stable sectors.
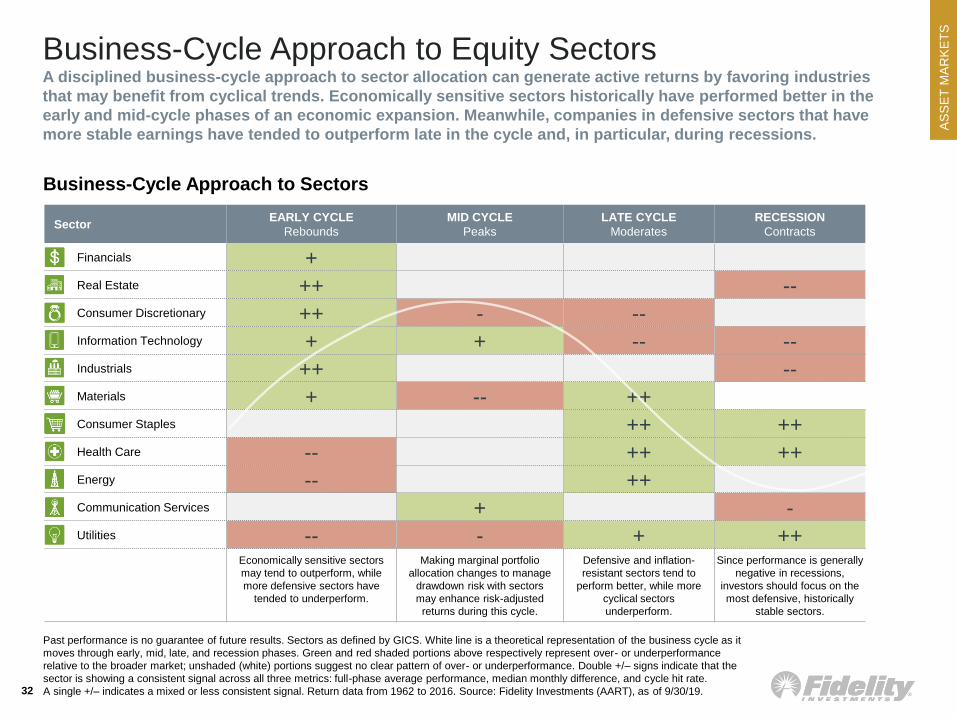
Business-Cycle Approach to Equity SectorsA disciplined business-cycle approach to sector allocation can generate active returns by favoring industries
that may benefit from cyclical trends. Economically sensitive sectors historically have performed better in the
early and mid-cycle phases of an economic expansion. Meanwhile, companies in defensive sectors that have
more stable earnings have tended to outperform late in the cycle and, in particular, during recessions.
AS
SE
T M
AR
KE
TS
33
Past performance is no guarantee of future results. It is not possible to invest directly in an index. All indexes are unmanaged. See Appendix for
important index information. Percentile ranks of yields and spreads based on historical period from 1993 to 2019. MBS: mortgage-backed
security. Source: Bloomberg Barclays, Bank of America Merrill Lynch, JP Morgan, Fidelity Investments (AART), as of 9/30/19.
13%
7%
0%
6% 6%3%
37%
48%
60%
45%
37%
32%
0%
10%
20%
30%
40%
50%
60%
70%
80%
90%
100%
0%
1%
2%
3%
4%
5%
6%
7%
8%
U.S. AggregateBond
MBS Long Gov/Credit CorporateInvestment Grade
CorporateHigh Yield
Emerging-MarketDebt
Fixed Income Yields and Spreads (1993–2019)
Yield Yield and Spread Percentiles
Credit SpreadTreasury Rates Spread PercentileYield Percentile
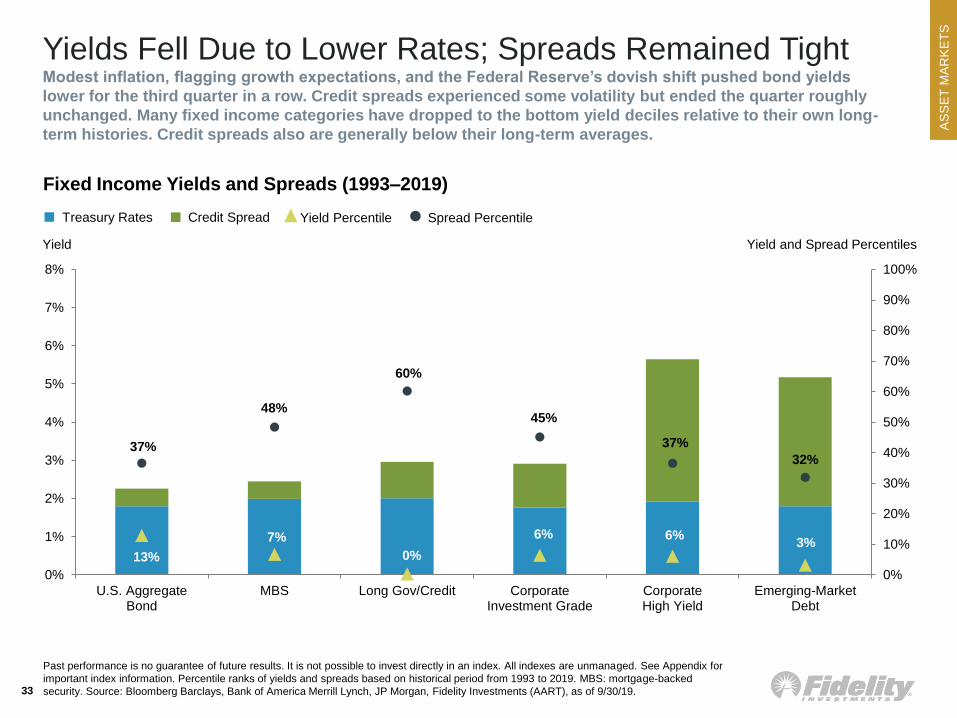
Yields Fell Due to Lower Rates; Spreads Remained TightModest inflation, flagging growth expectations, and the Federal Reserve’s dovish shift pushed bond yields
lower for the third quarter in a row. Credit spreads experienced some volatility but ended the quarter roughly
unchanged. Many fixed income categories have dropped to the bottom yield deciles relative to their own long-
term histories. Credit spreads also are generally below their long-term averages.

Long-Term Themes
LO
NG
-TE
RM
35
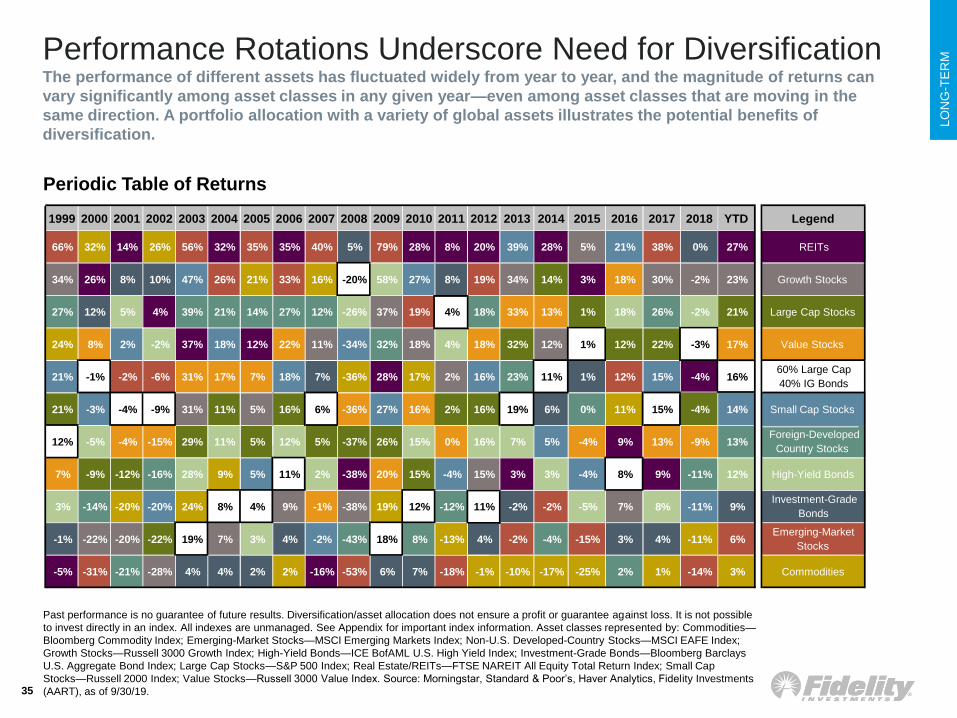
Performance Rotations Underscore Need for DiversificationThe performance of different assets has fluctuated widely from year to year, and the magnitude of returns can
vary significantly among asset classes in any given year—even among asset classes that are moving in the
same direction. A portfolio allocation with a variety of global assets illustrates the potential benefits of
diversification.
Periodic Table of Returns
Past performance is no guarantee of future results. Diversification/asset allocation does not ensure a profit or guarantee against loss. It is not possible
to invest directly in an index. All indexes are unmanaged. See Appendix for important index information. Asset classes represented by: Commodities—
Bloomberg Commodity Index; Emerging-Market Stocks—MSCI Emerging Markets Index; Non-U.S. Developed-Country Stocks—MSCI EAFE Index;
Growth Stocks—Russell 3000 Growth Index; High-Yield Bonds—ICE BofAML U.S. High Yield Index; Investment-Grade Bonds—Bloomberg Barclays
U.S. Aggregate Bond Index; Large Cap Stocks—S&P 500 Index; Real Estate/REITs—FTSE NAREIT All Equity Total Return Index; Small Cap
Stocks—Russell 2000 Index; Value Stocks—Russell 3000 Value Index. Source: Morningstar, Standard & Poor’s, Haver Analytics, Fidelity Investments
(AART), as of 9/30/19.
1999 2000 2001 2002 2003 2004 2005 2006 2007 2008 2009 2010 2011 2012 2013 2014 2015 2016 2017 2018 YTD Legend
66% 32% 14% 26% 56% 32% 35% 35% 40% 5% 79% 28% 8% 20% 39% 28% 5% 21% 38% 0% 27% REITs
34% 26% 8% 10% 47% 26% 21% 33% 16% -20% 58% 27% 8% 19% 34% 14% 3% 18% 30% -2% 23% Growth Stocks
27% 12% 5% 4% 39% 21% 14% 27% 12% -26% 37% 19% 4% 18% 33% 13% 1% 18% 26% -2% 21% Large Cap Stocks
24% 8% 2% -2% 37% 18% 12% 22% 11% -34% 32% 18% 4% 18% 32% 12% 1% 12% 22% -3% 17% Value Stocks
21% -1% -2% -6% 31% 17% 7% 18% 7% -36% 28% 17% 2% 16% 23% 11% 1% 12% 15% -4% 16%60% Large Cap
40% IG Bonds
21% -3% -4% -9% 31% 11% 5% 16% 6% -36% 27% 16% 2% 16% 19% 6% 0% 11% 15% -4% 14% Small Cap Stocks
12% -5% -4% -15% 29% 11% 5% 12% 5% -37% 26% 15% 0% 16% 7% 5% -4% 9% 13% -9% 13%Foreign-Developed
Country Stocks
7% -9% -12% -16% 28% 9% 5% 11% 2% -38% 20% 15% -4% 15% 3% 3% -4% 8% 9% -11% 12% High-Yield Bonds
3% -14% -20% -20% 24% 8% 4% 9% -1% -38% 19% 12% -12% 11% -2% -2% -5% 7% 8% -11% 9%Investment-Grade
Bonds
-1% -22% -20% -22% 19% 7% 3% 4% -2% -43% 18% 8% -13% 4% -2% -4% -15% 3% 4% -11% 6%Emerging-Market
Stocks
-5% -31% -21% -28% 4% 4% 2% 2% -16% -53% 6% 7% -18% -1% -10% -17% -25% 2% 1% -14% 3% Commodities
LO
NG
-TE
RM
5%
10%
15%
20%
25%
19
61
19
64
19
67
19
70
19
73
19
76
19
79
19
82
19
85
19
88
19
91
19
94
19
97
20
00
20
03
20
06
20
09
20
12
20
15
20
18
Global Imports/GDP
36
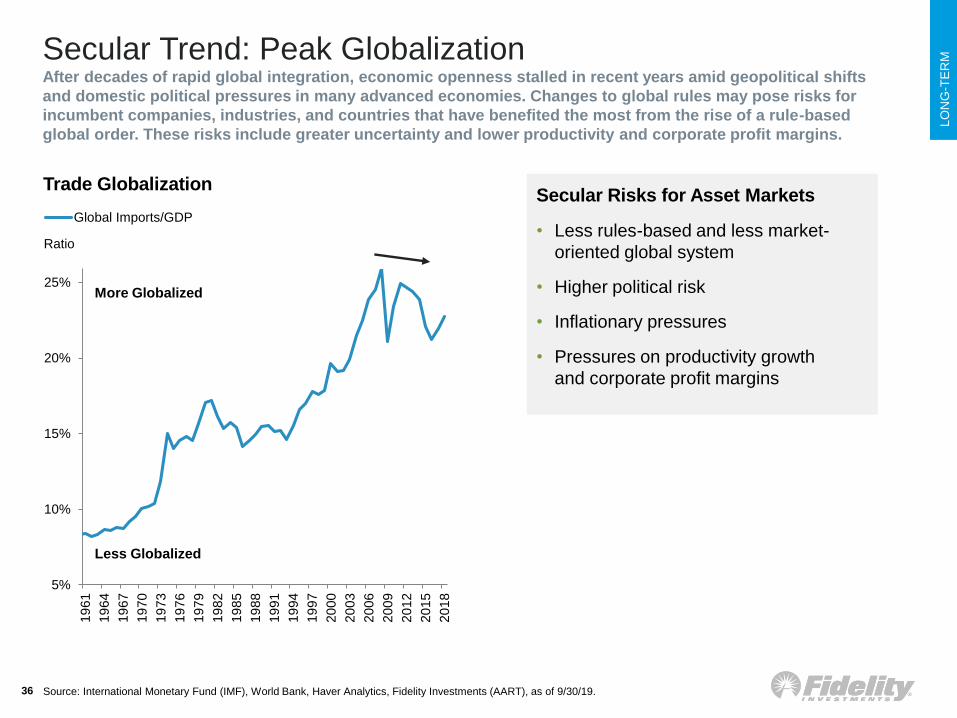
Secular Trend: Peak GlobalizationAfter decades of rapid global integration, economic openness stalled in recent years amid geopolitical shifts
and domestic political pressures in many advanced economies. Changes to global rules may pose risks for
incumbent companies, industries, and countries that have benefited the most from the rise of a rule-based
global order. These risks include greater uncertainty and lower productivity and corporate profit margins.
Trade Globalization
Less Globalized
More Globalized
Ratio
Secular Risks for Asset Markets
• Less rules-based and less market-
oriented global system
• Higher political risk
• Inflationary pressures
• Pressures on productivity growth
and corporate profit margins
Source: International Monetary Fund (IMF), World Bank, Haver Analytics, Fidelity Investments (AART), as of 9/30/19.
LO
NG
-TE
RM
0%
1%
2%
3%
4%
5%
6%
7%
8%
9%
10%
Ita
ly
Spain
Japa
n
Germ
any
Ne
therl
and
s
Fra
nce
Ca
nad
a
UK
Austr
alia
Sw
ede
n
South
Kore
a
U.S
.
Ru
ssia
Turk
ey
Bra
zil
Tha
iland
Ch
ina
Me
xic
o
Co
lom
bia
Peru
South
Afr
ica
Ma
laysia
Phili
ppin
es
Indon
esia
India
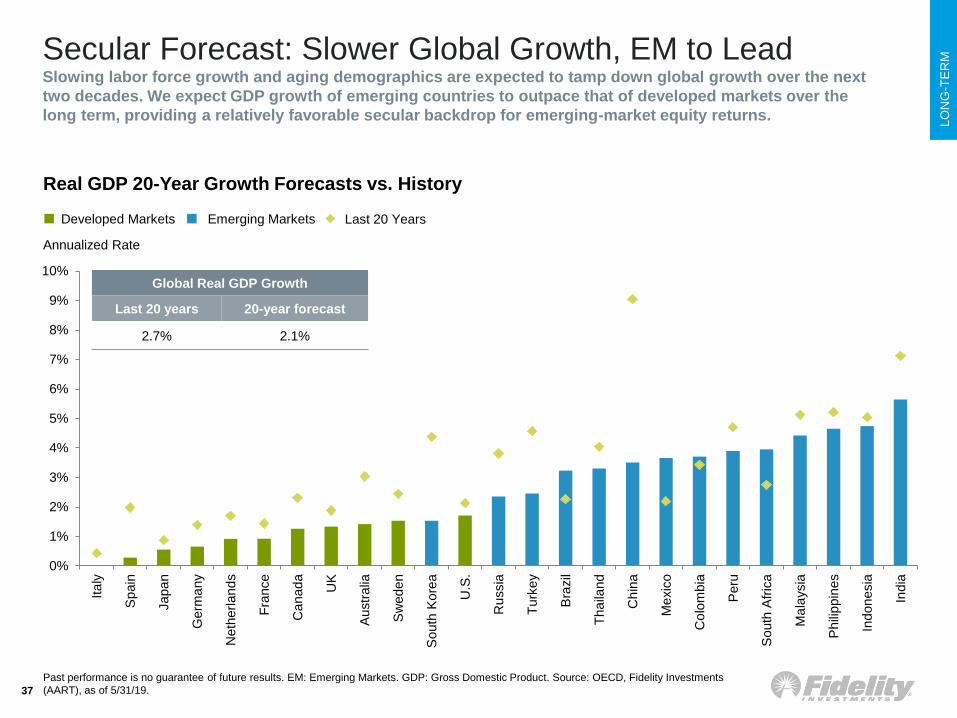
Secular Forecast: Slower Global Growth, EM to LeadSlowing labor force growth and aging demographics are expected to tamp down global growth over the next
two decades. We expect GDP growth of emerging countries to outpace that of developed markets over the
long term, providing a relatively favorable secular backdrop for emerging-market equity returns.
37
Annualized Rate
Past performance is no guarantee of future results. EM: Emerging Markets. GDP: Gross Domestic Product. Source: OECD, Fidelity Investments
(AART), as of 5/31/19.
Developed Markets Emerging Markets Last 20 Years
Global Real GDP Growth
Last 20 years 20-year forecast
2.7% 2.1%
Real GDP 20-Year Growth Forecasts vs. History
LO
NG
-TE
RM
0.0%
0.5%
1.0%
1.5%
2.0%
2.5%
3.0%
3.5%
4.0%
4.5%
19
69
19
71
19
73
19
75
19
77
19
79
19
81
19
83
19
85
19
87
19
89
19
91
19
93
19
95
19
97
19
99
20
01
20
03
20
05
20
07
20
09
20
11
20
13
20
15
20
17
20
19
Labor Force Productivity Real GDP
38
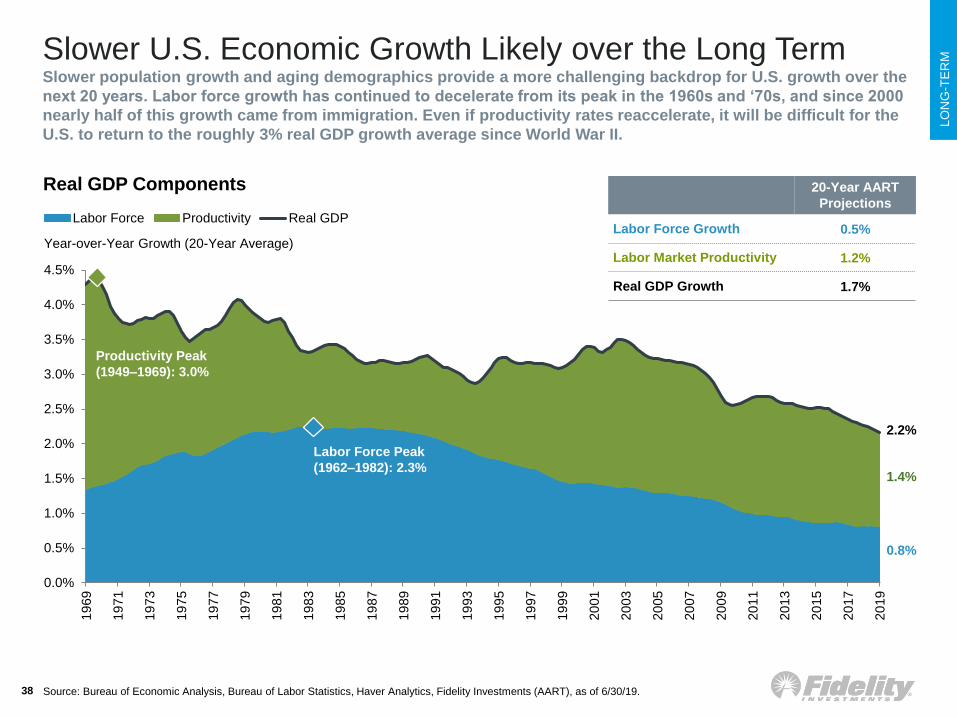
Real GDP Components
Year-over-Year Growth (20-Year Average)
0.8%
1.4%
2.2%
Labor Force Peak
(1962–1982): 2.3%
Productivity Peak
(1949–1969): 3.0%
20-Year AART
Projections
Labor Force Growth 0.5%
Labor Market Productivity 1.2%
Real GDP Growth 1.7%
Source: Bureau of Economic Analysis, Bureau of Labor Statistics, Haver Analytics, Fidelity Investments (AART), as of 6/30/19.
Slower U.S. Economic Growth Likely over the Long TermSlower population growth and aging demographics provide a more challenging backdrop for U.S. growth over the
next 20 years. Labor force growth has continued to decelerate from its peak in the 1960s and ‘70s, and since 2000
nearly half of this growth came from immigration. Even if productivity rates reaccelerate, it will be difficult for the
U.S. to return to the roughly 3% real GDP growth average since World War II.
LO
NG
-TE
RM
0%
2%
4%
6%
8%
10%
12%
14%
16%
18%
0% 2% 4% 6% 8% 10% 12% 14% 16% 18%
GDP Growth (20-Year Average)
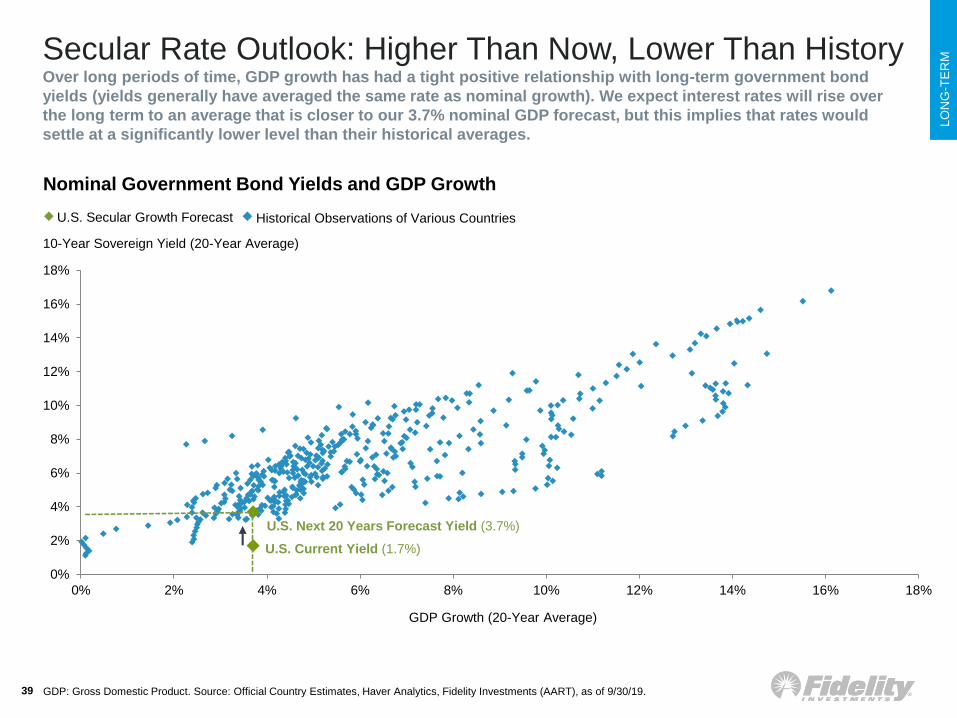
U.S. Current Yield (1.7%)
U.S. Next 20 Years Forecast Yield (3.7%)
39 GDP: Gross Domestic Product. Source: Official Country Estimates, Haver Analytics, Fidelity Investments (AART), as of 9/30/19.
U.S. Secular Growth Forecast
Nominal Government Bond Yields and GDP Growth
10-Year Sovereign Yield (20-Year Average)
Historical Observations of Various Countries
Secular Rate Outlook: Higher Than Now, Lower Than HistoryOver long periods of time, GDP growth has had a tight positive relationship with long-term government bond
yields (yields generally have averaged the same rate as nominal growth). We expect interest rates will rise over
the long term to an average that is closer to our 3.7% nominal GDP forecast, but this implies that rates would
settle at a significantly lower level than their historical averages.
LO
NG
-TE
RM
40
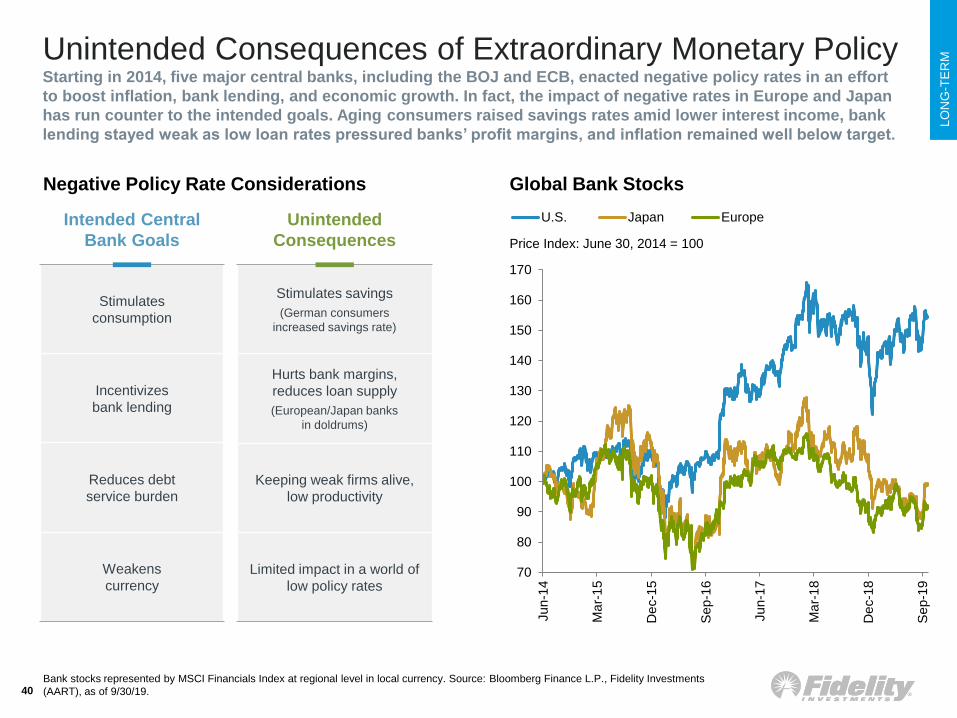
Stimulates
consumption
Incentivizes
bank lending
Reduces debt
service burden
Weakens
currency
Intended Central
Bank Goals
Stimulates savings
(German consumers
increased savings rate)
Hurts bank margins,
reduces loan supply
(European/Japan banks
in doldrums)
Keeping weak firms alive,
low productivity
Limited impact in a world of
low policy rates
Unintended
Consequences Price Index: June 30, 2014 = 100
Global Bank StocksNegative Policy Rate Considerations
Bank stocks represented by MSCI Financials Index at regional level in local currency. Source: Bloomberg Finance L.P., Fidelity Investments
(AART), as of 9/30/19.
Unintended Consequences of Extraordinary Monetary PolicyStarting in 2014, five major central banks, including the BOJ and ECB, enacted negative policy rates in an effort
to boost inflation, bank lending, and economic growth. In fact, the impact of negative rates in Europe and Japan
has run counter to the intended goals. Aging consumers raised savings rates amid lower interest income, bank
lending stayed weak as low loan rates pressured banks’ profit margins, and inflation remained well below target.
70
80
90
100
110
120
130
140
150
160
170
Jun-1
4
Ma
r-1
5
De
c-1
5
Sep-1
6
Jun-1
7
Ma
r-1
8
De
c-1
8
Sep-1
9
U.S. Japan Europe
LO
NG
-TE
RM
0.5%
1.0%
1.5%
2.0%
2.5%
3.0%
20
06
20
07
20
08
20
09
20
10
20
11
20
12
20
13
20
14
20
15
20
16
20
17
20
18
20
19
Fed Inflation Target 20-Year Inflation Swap PCE
41
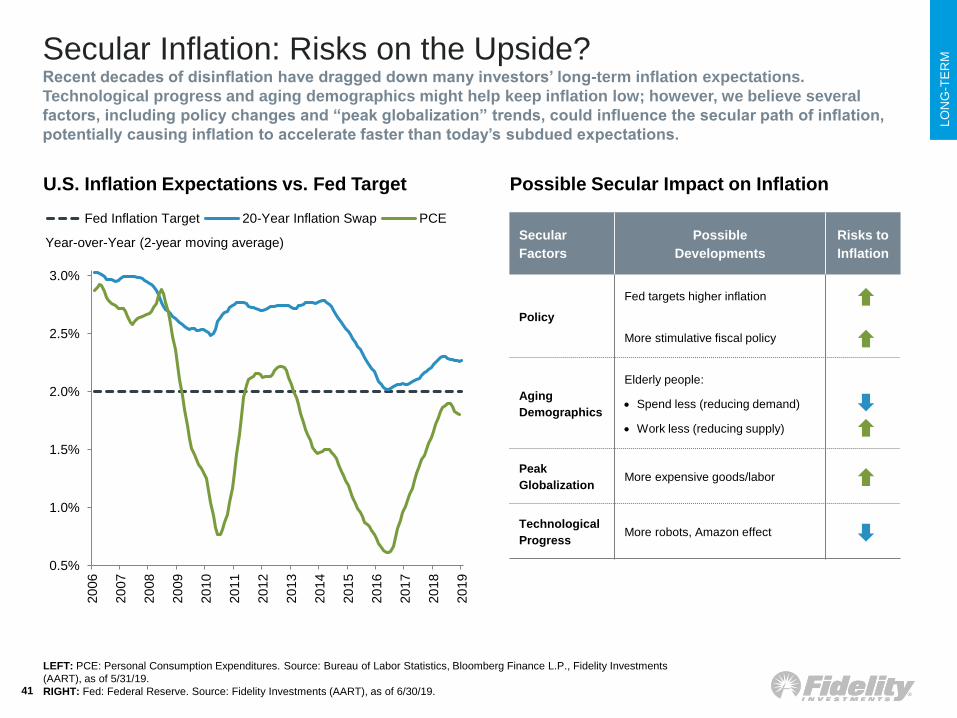
Secular Inflation: Risks on the Upside?Recent decades of disinflation have dragged down many investors’ long-term inflation expectations.
Technological progress and aging demographics might help keep inflation low; however, we believe several
factors, including policy changes and “peak globalization” trends, could influence the secular path of inflation,
potentially causing inflation to accelerate faster than today’s subdued expectations.
Secular
Factors
Possible
Developments
Risks to
Inflation
Policy
Fed targets higher inflation
More stimulative fiscal policy
Aging
Demographics
Elderly people:
• Spend less (reducing demand)
• Work less (reducing supply)
Peak
GlobalizationMore expensive goods/labor
Technological
ProgressMore robots, Amazon effect
U.S. Inflation Expectations vs. Fed Target Possible Secular Impact on Inflation
LEFT: PCE: Personal Consumption Expenditures. Source: Bureau of Labor Statistics, Bloomberg Finance L.P., Fidelity Investments
(AART), as of 5/31/19.
RIGHT: Fed: Federal Reserve. Source: Fidelity Investments (AART), as of 6/30/19.
Year-over-Year (2-year moving average)
LO
NG
-TE
RM
65%
67%
69%
71%
73%
75%
77%
79%
81%
83%
85%
600
800
1000
1200
1400
1600
1800
2000
2200
2400
2600
2800
3000
Jun-0
0
Jun-0
1
Jun-0
2
Jun-0
3
Jun-0
4
Jun-0
5
Jun-0
6
Jun-0
7
Jun-0
8
Jun-0
9
Jun-1
0
Jun-1
1
Jun-1
2
Jun-1
3
Jun-1
4
Jun-1
5
Jun-1
6
Jun-1
7
Jun-1
8
Jun-1
9
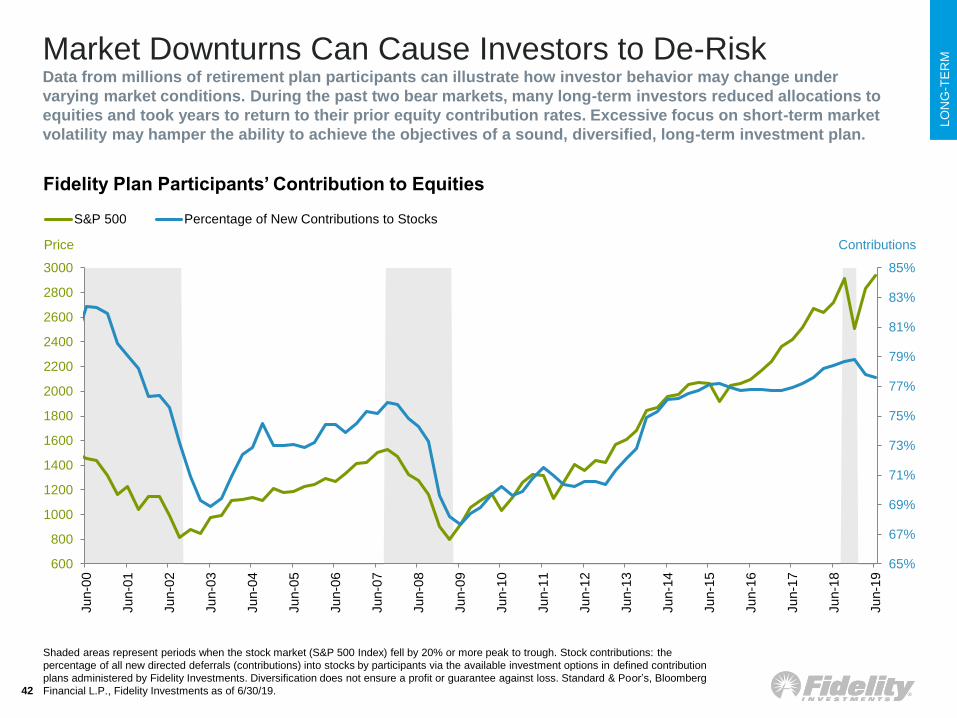
S&P 500 Percentage of New Contributions to Stocks
Shaded areas represent periods when the stock market (S&P 500 Index) fell by 20% or more peak to trough. Stock contributions: the
percentage of all new directed deferrals (contributions) into stocks by participants via the available investment options in defined contribution
plans administered by Fidelity Investments. Diversification does not ensure a profit or guarantee against loss. Standard & Poor’s, Bloomberg
Financial L.P., Fidelity Investments as of 6/30/19.
Price
42
Contributions
Fidelity Plan Participants’ Contribution to Equities
Market Downturns Can Cause Investors to De-RiskData from millions of retirement plan participants can illustrate how investor behavior may change under
varying market conditions. During the past two bear markets, many long-term investors reduced allocations to
equities and took years to return to their prior equity contribution rates. Excessive focus on short-term market
volatility may hamper the ability to achieve the objectives of a sound, diversified, long-term investment plan.
LO
NG
-TE
RM
43
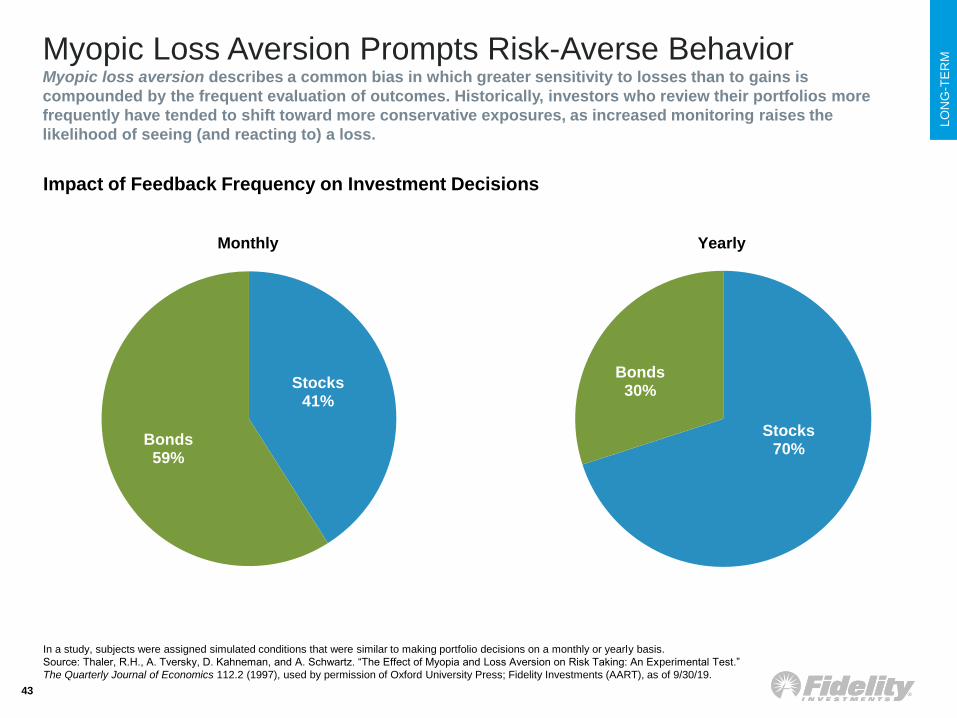
Myopic Loss Aversion Prompts Risk-Averse BehaviorMyopic loss aversion describes a common bias in which greater sensitivity to losses than to gains is
compounded by the frequent evaluation of outcomes. Historically, investors who review their portfolios more
frequently have tended to shift toward more conservative exposures, as increased monitoring raises the
likelihood of seeing (and reacting to) a loss.
Impact of Feedback Frequency on Investment Decisions
Monthly Yearly
In a study, subjects were assigned simulated conditions that were similar to making portfolio decisions on a monthly or yearly basis.
Source: Thaler, R.H., A. Tversky, D. Kahneman, and A. Schwartz. “The Effect of Myopia and Loss Aversion on Risk Taking: An Experimental Test.”
The Quarterly Journal of Economics 112.2 (1997), used by permission of Oxford University Press; Fidelity Investments (AART), as of 9/30/19.
Stocks70%
Bonds30%
Stocks41%
Bonds59%

44
Appendix: Important InformationInformation presented herein is for discussion and illustrative purposes only and is not a
recommendation or an offer or solicitation to buy or sell any securities. Views expressed are as
of the date indicated, based on the information available at that time, and may change based on
market and other conditions. Unless otherwise noted, the opinions provided are those of the
authors and not necessarily those of Fidelity Investments or its affiliates. Fidelity does not
assume any duty to update any of the information.
Information provided in this document is for informational and educational purposes only. To the
extent any investment information in this material is deemed to be a recommendation, it is not
meant to be impartial investment advice or advice in a fiduciary capacity and is not intended to
be used as a primary basis for you or your client's investment decisions. Fidelity and its
representatives may have a conflict of interest in the products or services mentioned in this
material because they have a financial interest in them, and receive compensation, directly or
indirectly, in connection with the management, distribution, and/or servicing of these products or
services, including Fidelity funds, certain third-party funds and products, and certain investment
services.
Investment decisions should be based on an individual’s own goals, time horizon, and tolerance
for risk. Nothing in this content should be considered to be legal or tax advice, and you are
encouraged to consult your own lawyer, accountant, or other advisor before making any
financial decision. These materials are provided for informational purposes only and should not
be used or construed as a recommendation of any security, sector, or investment strategy.
Fidelity does not provide legal or tax advice and the information provided herein is general in
nature and should not be considered legal or tax advice. Consult with an attorney or a tax
professional regarding your specific legal or tax situation.
Past performance and dividend rates are historical and do not guarantee
future results.
Investing involves risk, including risk of loss.
Diversification does not ensure a profit or guarantee against loss.
Index or benchmark performance presented in this document does not reflect the deduction of
advisory fees, transaction charges, and other expenses, which would reduce performance.
Indexes are unmanaged. It is not possible to invest directly in an index.
Although bonds generally present less short-term risk and volatility than stocks, bonds do
contain interest rate risk (as interest rates rise, bond prices usually fall, and vice versa) and the
risk of default, or the risk that an issuer will be unable to make income or principal payments.
Additionally, bonds and short-term investments entail greater inflation risk—or the risk that the
return of an investment will not keep up with increases in the prices of goods and services—
than stocks. Increases in real interest rates can cause the price of inflation-protected debt
securities to decrease.
Stock markets, especially non-U.S. markets, are volatile and can decline significantly in
response to adverse issuer, political, regulatory, market, or economic developments. Foreign
securities are subject to interest rate, currency exchange rate, economic, and political risks, all
of which are magnified in emerging markets.
The securities of smaller, less well-known companies can be more volatile than those of larger
companies.
Growth stocks can perform differently from the market as a whole and from other types of
stocks, and can be more volatile than other types of stocks. Value stocks can perform differently
from other types of stocks and can continue to be undervalued by the market for long periods
of time.
Lower-quality debt securities generally offer higher yields but also involve greater risk of default
or price changes due to potential changes in the credit quality of the issuer. Any fixed income
security sold or redeemed prior to maturity may be subject to loss.
Floating rate loans generally are subject to restrictions on resale, and sometimes trade
infrequently in the secondary market; as a result, they may be more difficult to value, buy, or
sell. A floating rate loan may not be fully collateralized and therefore may decline significantly
in value.
The municipal market can be affected by adverse tax, legislative, or political changes, and by
the financial condition of the issuers of municipal securities. Interest income generated by
municipal bonds is generally expected to be exempt from federal income taxes and, if the bonds
are held by an investor resident in the state of issuance, from state and local income taxes.
Such interest income may be subject to federal and/or state alternative minimum taxes.
Investing in municipal bonds for the purpose of generating tax-exempt income may not be
appropriate for investors in all tax brackets. Generally, tax-exempt municipal securities are not
appropriate holdings for tax-advantaged accounts such as IRAs and 401(k)s.
The commodities industry can be significantly affected by commodity prices, world events,
import controls, worldwide competition, government regulations, and economic conditions.
The gold industry can be significantly affected by international monetary and political
developments, such as currency devaluations or revaluations, central bank movements,
economic and social conditions within a country, trade imbalances, or trade or currency
restrictions between countries.
Changes in real estate values or economic downturns can have a significant negative effect on
issuers in the real estate industry.
Leverage can magnify the impact that adverse issuer, political, regulatory, market, or economic
developments have on a company. In the event of bankruptcy, a company’s creditors take
precedence over the company’s stockholders.

45
Appendix: Important InformationMarket Indexes
Index returns on slide 24 represented by: Growth—Russell 3000® Growth Index; Large
Caps—S&P 500® index; Mid Caps—Russell MidCap® Index; Small Caps—Russell 2000®
Index; Value - Russell 3000® Value Index; ACWI ex USA—MSCI All Country World Index
(ACWI); Canada—MSCI Canada Index; Commodities—Bloomberg Commodity Index;
EAFE—MSCI EAFE (Europe, Australasia, Far East) Index; EAFE Small Cap—MSCI EAFE
Small Cap Index; EM Asia—MSCI Emerging Markets Asia Index; EMEA (Europe, Middle
East, and Africa)—MSCI EM EMEA Index; Emerging Markets (EM)—MSCI EM Index;
Europe—MSCI Europe Index; Gold—Gold Bullion Price, LBMA PM Fix; Japan—MSCI
Japan Index; Latin America—MSCI EM Latin America Index; ABS (Asset-Backed
Securities)—Bloomberg Barclays ABS Index; Agency—Bloomberg Barclays U.S. Agency
Index; Aggregate—Bloomberg Barclays U.S. Aggregate Bond Index; CMBS (Commercial
Mortgage-Backed Securities)—Bloomberg Barclays Investment-Grade CMBS Index;
Credit—Bloomberg Barclays U.S. Credit Bond Index; EM Debt (Emerging-Market Debt)—
JP Morgan EMBI Global Index; High Yield—ICE BofAML U.S. High Yield Index; Leveraged
Loan—S&P/LSTA Leveraged Loan Index; Long Government & Credit (Investment-
Grade)—Bloomberg Barclays Long Government & Credit Index; MBS (Mortgage-Backed
Securities)—Bloomberg Barclays MBS Index; Municipal—Bloomberg Barclays Municipal
Bond Index; TIPS (Treasury Inflation-Protected Securities)—Bloomberg Barclays U.S.
TIPS Index; Treasuries—Bloomberg Barclays U.S. Treasury Index.
Bloomberg Barclays ABS Index is a market value-weighted index that covers fixed-rate
asset-backed securities with average lives greater than or equal to one year and that are
part of a public deal; the index covers the following collateral types: credit cards, autos,
home equity loans, stranded-cost utility (rate-reduction bonds), and manufactured housing.
Bloomberg Barclays CMBS Index is designed to mirror commercial mortgage-backed
securities of investment-grade quality (Baa3/BBB-/BBB- or above) using Moody’s, S&P,
and Fitch, respectively, with maturities of at least one year. Bloomberg Barclays Long
U.S. Government Credit Index includes all publicly issued U.S. government and corporate
securities that have a remaining maturity of 10 or more years, are rated investment-grade,
and have $250 million or more of outstanding face value.
Bloomberg Barclays Municipal Bond Index is a market value-weighted index of
investment-grade municipal bonds with maturities of one year or more. Bloomberg
Barclays U.S. Agency Bond Index is a market value-weighted index of U.S. Agency
government and investment-grade corporate fixed-rate debt issues. Bloomberg Barclays
U.S. Aggregate Bond is a broad-based, market value-weighted benchmark that measures
the performance of the investment-grade, U.S. dollar-denominated, fixed-rate taxable bond
market. Bloomberg Barclays U.S. Credit Bond Index is a market value-weighted index of
investment-grade corporate fixed-rate debt issues with maturities of one year or more.
Bloomberg Barclays U.S. MBS Index is a market value-weighted index of fixed-rate
securities that represent interests in pools of mortgage loans, including balloon mortgages,
with original terms of 15 and 30 years that are issued by the Government National
Mortgage Association (GNMA), the Federal National Mortgage Association (FNMA), and
the Federal Home Loan Mortgage Corp. (FHLMC).
Bloomberg Barclays U.S. Treasury Inflation-Protected Securities (TIPS) Index
(Series-L) is a market value-weighted index that measures the performance of inflation-
protected securities issued by the U.S. Treasury. Bloomberg Barclays U.S. Treasury
Bond Index is a market value-weighted index of public obligations of the U.S. Treasury
with maturities of one year or more. Bloomberg Commodity Index measures the
performance of the commodities market. It consists of exchange traded futures contracts
on physical commodities that are weighted to account for the economic significance and
market liquidity of each commodity.
Dow Jones U.S. Total Stock Market IndexSM is a full market capitalization-weighted index
of all equity securities of U.S.-headquartered companies with readily available price data.
FTSE® National Association of Real Estate Investment Trusts (NAREIT®) All REITs
Index is a market capitalization-weighted index that is designed to measure the
performance of all tax-qualified REITs listed on the NYSE, the American Stock Exchange,
or the NASDAQ National Market List. FTSE® NAREIT® Equity REIT Index is an
unmanaged market value-weighted index based on the last closing price of the month for
tax-qualified REITs listed on the New York Stock Exchange (NYSE).
ICE BofAML U.S. High Yield Index is a market capitalization-weighted index of U.S. dollar-
denominated, below-investment-grade corporate debt publicly issued in the U.S. market.
JPM® EMBI Global Index, and its country sub-indexes, tracks total returns for the U.S.
dollar-denominated debt instruments issued by emerging-market sovereign and quasi-
sovereign entities, such as Brady bonds, loans, and Eurobonds.
MSCI All Country World Index (ACWI) is a market capitalization-weighted index designed to
measure the investable equity market performance for global investors of developed and
emerging markets. MSCI ACWI (All Country World Index) ex USA Index is a market
capitalization-weighted index designed to measure the investable equity market performance for
global investors of large and mid cap stocks in developed and emerging markets, excluding the
United States.
MSCI Emerging Markets (EM) Index is a market capitalization-weighted index that is designed
to measure the investable equity market performance for global investors in emerging markets.
MSCI EM Asia Index is a market capitalization-weighted index designed to measure equity
market performance in Asia. MSCI EM Europe, Middle East, and Africa (EMEA) Index is a
market capitalization-weighted index that is designed to measure the investable equity market
performance for global investors in the emerging-market countries of Europe, the Middle East,
and Africa. MSCI EM Latin America Index is a market capitalization-weighted index that is
designed to measure the investable equity market performance for global investors in the
emerging-market countries of Latin America.
MSCI Europe, Australasia, Far East Index (EAFE) is a market capitalization-weighted index
that is designed to measure the investable equity market performance for global investors in
developed markets, excluding the U.S. and Canada. MSCI EAFE Small Cap Index is a market
capitalization-weighted index that is designed to measure the investable equity market
performance of small cap stocks for global investors in developed markets, excluding the U.S.
and Canada.
Market Indexes (continued)
MSCI Europe Index is a market capitalization-weighted index that is designed to measure the
investable equity market performance for global investors of the developed markets in Europe.
MSCI Canada Index is a market capitalization-weighted index designed to measure equity
market performance in Canada. MSCI Japan Index is a market capitalization-weighted index
designed to measure equity market performance in Japan.
Russell 2000® Index is a market capitalization-weighted index designed to measure the
performance of the small cap segment of the U.S. equity market. It includes approximately
2,000 of the smallest securities in the Russell 3000 Index. Russell 3000® Index is a market
capitalization-weighted index designed to measure the performance of the 3,000 largest
companies in the U.S. equity market. Russell 3000 Growth Index is a market capitalization-
weighted index designed to measure the performance of the broad growth segment of the U.S.
equity market. It includes those Russell 3000 Index companies with higher price-to-book ratios
and higher forecasted growth rates. Russell 3000 Value Index is a market capitalization-
weighted index designed to measure the performance of the small to mid cap value segment of
the U.S. equity market. It includes those Russell 3000 Index companies with lower price-to-book
ratios and lower forecasted growth rates. Russell MidCap® Index is a market capitalization-
weighted index designed to measure the performance of the mid cap segment of the U.S.
equity market. It contains approximately 800 of the smallest securities in the Russell 1000 Index.
The S&P 500® is a market capitalization-weighted index of 500 common stocks chosen for
market size, liquidity, and industry group representation to represent U.S. equity performance.
S&P 500 is a registered service mark of The McGraw-Hill Companies, Inc., and has been
licensed for use by Fidelity Distributors Corporation and its affiliates.
The Sectors and Industries are defined by Global Industry Classification Standards
(GICS®), except where noted otherwise. S&P 500 sectors are defined as follows:
Consumer Discretionary—companies that tend to be the most sensitive to economic
cycles. Consumer Staples—companies whose businesses are less sensitive to economic
cycles. Energy—companies whose businesses are dominated by either of the following
activities: the construction or provision of oil rigs, drilling equipment, and other energy-
related services and equipment, including seismic data collection; or the exploration,
production, marketing, refining, and/or transportation of oil and gas products, coal, and
consumable fuels. Financials—companies involved in activities such as banking,
consumer finance, investment banking and brokerage, asset management, insurance and
investments, and mortgage real estate investment trusts (REITs). Health Care—
companies in two main industry groups: health care equipment suppliers, manufacturers,
and providers of health care services; and companies involved in research, development,
production, and marketing of pharmaceuticals and biotechnology products. Industrials—
companies that manufacture and distribute capital goods, provide commercial services and
supplies, or provide transportation services. Information Technology—companies in
technology software and services and technology hardware and equipment. Materials—
companies that engage in a wide range of commodity-related manufacturing. Real
Estate—companies in real estate development, operations, and related services, as well
as equity REITs. Communication Services—companies that facilitate communication and
offer related content through various media; it includes media companies moved from
Consumer Discretionary and internet services companies moved from Information
Technology. Utilities—companies considered electric, gas, or water utilities, or that operate
as independent producers and/or distributors of power.
Standard & Poor’s/Loan Syndications and Trading Association (S&P/LSTA)
Leveraged Performing Loan Index is a market value-weighted index designed to
represent the performance of U.S. dollar-denominated institutional leveraged performing
loan portfolios (excluding loans in payment default) using current market weightings,
spreads, and interest payments.
Other Indexes
The Consumer Price Index (CPI) is a monthly inflation indicator that measures the
change in the cost of a fixed basket of products and services, including housing, electricity,
food, and transportation.
The London Bullion Market Association (LBMA) publishes the international benchmark
price of gold in USD, twice daily. The LBMA Gold price auction takes place by ICE
Benchmark Administration (IBA) at 10:30 and 15:00 with the price set in U.S. dollars per
fine troy ounce.
Definitions
Correlation coefficient measures the interdependencies of two random variables that
range in value from −1 to +1, indicating perfect negative correlation at −1, absence of
correlation at 0, and perfect positive correlation at +1.
Price-to-Earnings (P/E) ratio is the ratio of a company’s current share price to its current
earnings, typically trailing 12-months earnings per share. A Forward P/E calculation will
typically use an average of analysts’ published estimates of earnings for the next 12
months in the denominator.
Excess return is the amount by which a portfolio’s performance exceeds its benchmark,
net (in the case of the analysis in this article) or gross of operating expenses, in
percentage points.
Option-Adjusted Spread (OAS) is the measurement of the spread between a fixed-
income security’s rate and the risk-free rate of return, which is adjusted to take into
account any embedded options.
46
Appendix: Important Information

47
Appendix: Important InformationThe Chartered Financial Analyst® (CFA®) designation is offered by CFA Institute. To
obtain the CFA charter, candidates must pass three exams demonstrating their
competence, integrity, and extensive knowledge in accounting, ethical and professional
standards, economics, portfolio management, and security analysis, and must also have
at least four years of qualifying work experience, among other requirements.
Third-party marks are the property of their respective owners; all other marks are the
property of FMR LLC.
Fidelity Institutional Asset Management® (FIAM®) provides registered investment
products via Fidelity Investments Institutional Services Company, Inc. and institutional
asset management services through FIAM LLC or Fidelity Institutional Asset
Management Trust Company.
Personal and Workplace investment products are provided by Fidelity Brokerage
Services LLC, Member NYSE, SIPC.
Fidelity Clearing & Custody Solutions® provides clearing, custody, or other brokerage
services through National Financial Services LLC or Fidelity Brokerage Services LLC,
(Members NYSE, SIPC).
901137.1.3
© 2019 FMR LLC. All rights reserved.


![Quarterly Update [Company Update]](https://img.pdfslide.us/doc/110x75/577cb4b01a28aba7118c9d76/quarterly-update-company-update-578abd0f0e24d.jpg)