Embed Size (px)
Citation preview

LEADERSHIP SERIES
QuarterlySector UpdatePRIMARY CONTRIBUTORS
Asset Allocation Research Team (AART)
Fidelity Management & Research Company, Equity Division
Fidelity SelectCo
FIRST QUARTER 2017
SE
CTO
R U
PD
ATE
2
What Is Fidelity’s Quarterly Sector Update?The Quarterly Sector Update, including the Sector Scorecard, represents input from three distinct Fidelity investment teams—each with unique insights about sector investing—to present a comprehensive view of the performance potential of the 11* major equity market sectors.
The Quarterly Sector Update is intended as a tool for investors to set context and perspective when evaluating the current state of market sectors. It isnot meant to serve as a direct prediction regarding the future performance of any economic or financial market, nor to predict or guarantee future investment performance of any sort. *On Aug. 31, 2016, Real Estate became the 11th market sector as defined by the Global Industry Classification Standard (GICS®).
The Sector Scorecard’s proprietary methodology measures the relative attractiveness of each sector against five key factors: business cycle, fundamentals, relative valuations,
momentum, and relative strength.
The investment teams whose members contribute to the Quarterly Sector Update include:
Fidelity SelectCo Fidelity Management &
Research Company, Equity Division
Asset Allocation Research Team
SE
CTO
R U
PD
ATE
3
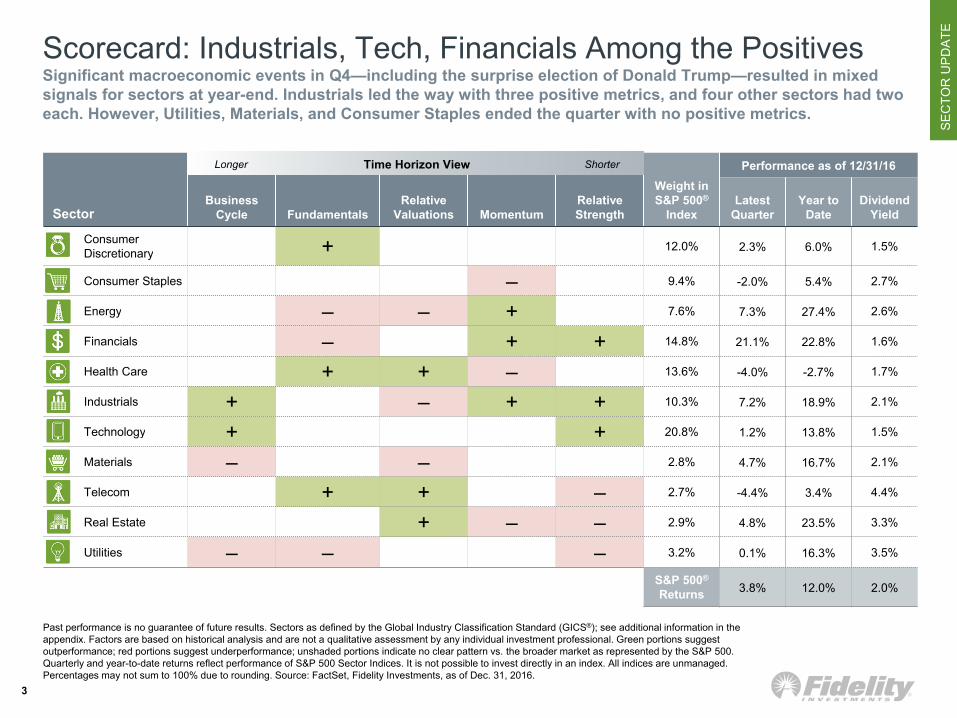
Scorecard: Industrials, Tech, Financials Among the PositivesSignificant macroeconomic events in Q4—including the surprise election of Donald Trump—resulted in mixed signals for sectors at year-end. Industrials led the way with three positive metrics, and four other sectors had two each. However, Utilities, Materials, and Consumer Staples ended the quarter with no positive metrics.
Past performance is no guarantee of future results. Sectors as defined by the Global Industry Classification Standard (GICS®); see additional information in the appendix. Factors are based on historical analysis and are not a qualitative assessment by any individual investment professional. Green portions suggest outperformance; red portions suggest underperformance; unshaded portions indicate no clear pattern vs. the broader market as represented by the S&P 500. Quarterly and year-to-date returns reflect performance of S&P 500 Sector Indices. It is not possible to invest directly in an index. All indices are unmanaged. Percentages may not sum to 100% due to rounding. Source: FactSet, Fidelity Investments, as of Dec. 31, 2016.
SectorBusiness
Cycle FundamentalsRelative
Valuations MomentumRelative Strength
Weight in S&P 500®
Index
Performance as of 12/31/16
LatestQuarter
Year to Date
Dividend Yield
Consumer Discretionary + 12.0% 2.3% 6.0% 1.5%
Consumer Staples – 9.4% -2.0% 5.4% 2.7%
Energy – – + 7.6% 7.3% 27.4% 2.6%
Financials – + + 14.8% 21.1% 22.8% 1.6%
Health Care + + – 13.6% -4.0% -2.7% 1.7%
Industrials + – + + 10.3% 7.2% 18.9% 2.1%
Technology + + 20.8% 1.2% 13.8% 1.5%
Materials – – 2.8% 4.7% 16.7% 2.1%
Telecom + + – 2.7% -4.4% 3.4% 4.4%
Real Estate + – – 2.9% 4.8% 23.5% 3.3%
Utilities – – – 3.2% 0.1% 16.3% 3.5%
S&P 500®
Returns 3.8% 12.0% 2.0%
Time Horizon View ShorterLonger

SE
CTO
R U
PD
ATE
4
Industries: Top Five & Bottom Five Performers This QuarterIn Q4, 49 of the 68 industries that comprise the MSCI USA Investable Market Index (IMI) had positive total returns, and 31 industries beat the broader market’s 4% gain (MSCI USA IMI). Three of the five best-performing industries came from the Financials sector, which gained more than 21% in Q4. Industries within the Health Care and Consumer Staples sectors struggled the most, as defensive sectors fell out of favor with investors.
Parent Index: MSCI USA IMI. Past performance is no guarantee of future results. Return data show total return. Source: Morningstar, FactSet, Fidelity Investments, as of Dec. 31, 2016.
Airlines
Thrifts & Mortgage Finance
Top Five Industries in Q4
Wireless Telecommunication Services
Consumer Finance
Bottom Five Industries in Q4Drivers
Rising interest rates and increased growth expectations
New administration may be amenable to more consolidation within the industry
Post-election rise in consumer confidence and higher interest rates
Drivers
Banks
Rising rates and growth expectations drove performance of diversified banks
30%
29%
22%
20%
20%
18%
16%
11%
8%
7%
Personal Products
Life Sciences Tools & Services
Health Care Equipment & Supplies
Household Products
Health Care Technology
Global macroeconomicheadwinds challenged multinationals that earn a large percentage of their sales abroad.
Rotation into other areas of the Health Care sector
Sector
Financials
Industrials
Financials
Telecom
Financials
Sector
Health Care
Consumer Staples
Health Care
Health Care
Consumer Staples
Rotation into other areas of the Health Care sector
Post-election rise in consumer confidence supported the outlook for air travel
Declines in valuations of health & beauty product providers
Rotation into other areas of the Health Care sector

U.S
. EQ
UIT
Y
5
Past performance is no guarantee of future results. Sectors as defined by GICS. LEFT: Unshaded (white) portions above suggest no clear pattern of over- or underperformance vs. broader market. Double +/– signs indicate that the sector is showing a consistent signal across all three metrics: full-phase average performance, median monthly difference, and cycle hit rate. A single +/– indicates a mixed or less consistent signal. Source: The Business Cycle Approach to Sector Investing, Fidelity Investments (AART), September 2014. RIGHT: Sources: Haver Analytics, Fidelity Investments, as of Nov. 30, 2016.
Business Cycle Approach to Sectors
Sector Early Mid Late Recession
Financials +Real Estate ++ --Consumer
Discretionary ++ --Technology + + -- --Industrials ++ + --Materials -- ++ -Consumer
Staples - + ++Health Care - ++ ++
Energy -- ++Telecom -- ++Utilities -- - + ++
Potential Earnings Drivers for Financials:• Regulatory relief• Rising rates boost lending profitability• Corporate tax reform
0.4
0.5
0.6
0.7
0.8
0.9
1.0
1.1
1.2
1962
1964
1967
1970
1972
1975
1978
1980
1983
1986
1988
1991
1994
1996
1999
2002
2004
2007
2010
2012
2015
Relative Price-to-Book of FinancialsRatio vs. Overall Market Price-to-Book Ratio
Business Cycle Considerations: FinancialsHistorically, Financials have not shown a consistent pattern of out- or underperformance vs. the overall market at this point in a business cycle. However, the potential for regulatory relief following the U.S. election, coupled with the recent increase in interest rates and steepening of the yield curve, may provide a fundamental earnings boost. On a price-to-book basis, Financials are roughly as cheap as they’ve ever been vs. the overall market.

SE
CTO
R U
PD
ATE
6
Fundamentals: Telecom, Discretionary, Health Care on TopTelecom fundamentals are strong based on earnings and EBITDA growth, but the data may be inflated by new accounting standards in the sector. Consumer Discretionary fundamentals rank high, and Health Care fundamentals remain solid despite recent performance struggles. Financials and Energy look weaker relative to other sectors, but their recent investment outperformance may be a sign of stronger fundamentals ahead.
EPS bars for Telecom (+96%) and Energy (-1110%) are broken to better demonstrate scale. Telecom EPS and EBITDA growth largely reflect an industry accounting change and is not representative of typical economic earnings growth. EPS = earnings per share. EBITDA = earnings before interest, taxes, depreciation, and amortization. The Financials and Real Estate sectors are not represented in the EBITDA Growth or Free-Cash-Flow Margin charts. See the Glossary and Methodology slide for further explanation. Source: FactSet, Fidelity Investments, as of Dec. 31, 2016.
Fundamentals: Strong and improving fundamentals historically have been an intermediate-term indicator of sector performance. Fundamental analysis gives
a view into how each sector is doing in terms of growth and profitability.
Return on Equity (Last 12 Months) Free-Cash-Flow Margin (Last 12 Months)
EBITDA Growth (Last 12 Months)EPS Growth (Last 12 Months)
-20%
0%
20%
Tele
com
Con
s. D
isc.
Rea
l Est
ate
Hea
lth C
are
Con
s. S
tpls
.
Indu
stria
ls
Tech
nolo
gy
Fina
ncia
ls
S&
P 5
00
Util
ities
Mat
eria
ls
Ene
rgy -40%
-30%-20%-10%
0%10%20%30%40%
Tele
com
Hea
lth C
are
Con
s. D
isc.
Con
s. S
tpls
.
Util
ities
S&
P 5
00
Tech
nolo
gy
Indu
stria
ls
Mat
eria
ls
Ene
rgy
0%
10%
20%
30%
Con
s. D
isc.
Con
s. S
tpls
.
Tech
nolo
gy
Indu
stria
ls
Mat
eria
ls
Hea
lth C
are
S&
P 5
00
Tele
com
Util
ities
Fina
ncia
ls
Rea
l Est
ate
Ene
rgy
-10%
0%
10%
20%
30%
Tech
nolo
gy
S&
P 5
00
Hea
lth C
are
Tele
com
Indu
stria
ls
Mat
eria
ls
Con
s. S
tpls
.
Con
s. D
isc.
Ene
rgy
Util
ities

SE
CTO
R U
PD
ATE
7
Relative Valuations: Health Care and Real Estate LeadAlong with strong fundamentals, Health Care has attractive relative valuations based on its high earnings and free-cash-flow yields. Telecom had negative investment performance in Q4 but maintained strong relative valuation levels overall. The absolute returns for Industrials (+19%), Energy (+27%), and Materials (+17%) all beat the S&P 500 in 2016, but their valuations are still below the level of most other sectors.
Forward earnings yield reflects analysts’ published earnings-per-share estimates for the next 12 months, divided by market price per share; it is the inverse of the price-to-earnings (P/E) ratio. Free-cash-flow yield reflects free cash flow divided by market price per share; it is the inverse of the price-to-free-cash-flow ratio. During periods of extreme earnings volatility, metrics like earnings yield may not be indicative of market consensus of valuations. Financials and Real Estate not represented in the Free-Cash-Flow Yield chart; see Glossary and Methodology slide for explanation. Source: FactSet, Fidelity Investments, as of Dec. 31, 2016.
Relative Valuations: On their own, valuations are not necessarily the best indicator of sector performance, but when combined with other factors, valuations can be
a useful tool in determining the risk-and-reward profile.
0.00.20.40.60.81.01.21.41.61.82.0
Con
s. D
isc.
Con
s. S
tpls
.
Ene
rgy
Fina
ncia
ls
Hea
lth C
are
Indu
stria
ls
Tech
nolo
gy
Mat
eria
ls
Rea
l Est
ate
Tele
com
Util
ities
10-Year Range (excl. top & bottom 5%) Current Historical Average
Free-Cash-Flow YieldEarnings Yield
Relative Forward Earnings Yield to S&P 500 Index (%)
-1.0-0.50.00.51.01.52.02.53.03.5
Con
s. D
isc.
Con
s. S
tpls
.
Ene
rgy
Hea
lth C
are
Indu
stria
ls
Tech
nolo
gy
Mat
eria
ls
Tele
com
Util
ities
10-Year Range (excl. top & bottom 5%) Current Historical Average
Relative Free-Cash-Flow Yield to S&P 500 Index (%)
SE
CTO
R U
PD
ATE
8
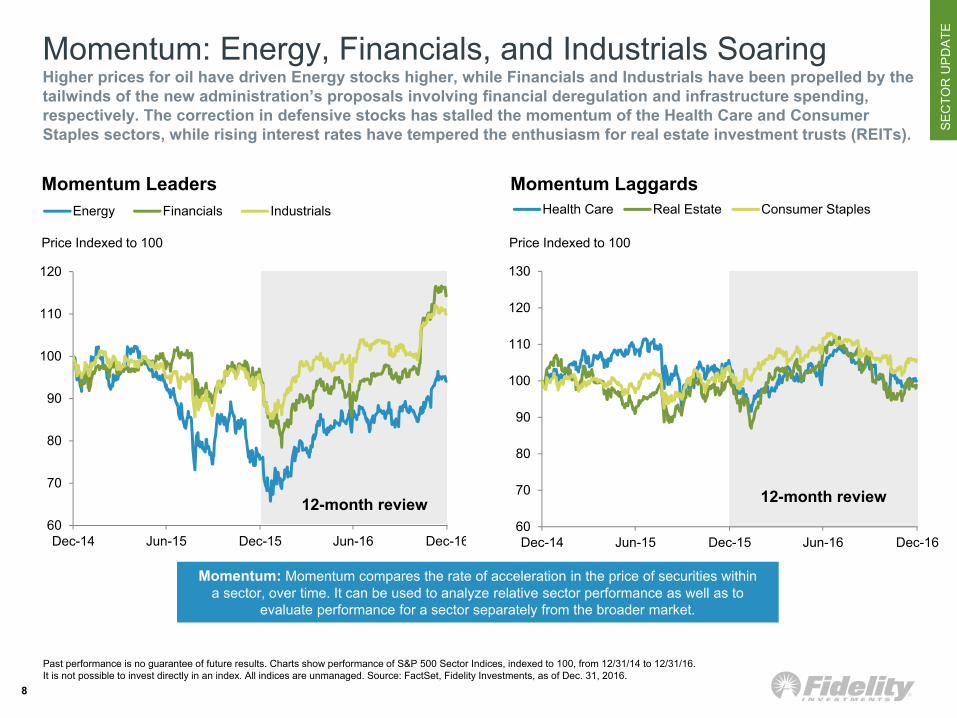
Momentum: Energy, Financials, and Industrials SoaringHigher prices for oil have driven Energy stocks higher, while Financials and Industrials have been propelled by the tailwinds of the new administration’s proposals involving financial deregulation and infrastructure spending, respectively. The correction in defensive stocks has stalled the momentum of the Health Care and Consumer Staples sectors, while rising interest rates have tempered the enthusiasm for real estate investment trusts (REITs).
Past performance is no guarantee of future results. Charts show performance of S&P 500 Sector Indices, indexed to 100, from 12/31/14 to 12/31/16.It is not possible to invest directly in an index. All indices are unmanaged. Source: FactSet, Fidelity Investments, as of Dec. 31, 2016.
Momentum: Momentum compares the rate of acceleration in the price of securities within a sector, over time. It can be used to analyze relative sector performance as well as to
evaluate performance for a sector separately from the broader market.
Momentum LaggardsMomentum Leaders
12-month review
Price Indexed to 100 Price Indexed to 100
12-month review60
70
80
90
100
110
120
Dec-14 Jun-15 Dec-15 Jun-16 Dec-16
Energy Financials Industrials
60
70
80
90
100
110
120
130
Dec-14 Jun-15 Dec-15 Jun-16 Dec-16
Health Care Real Estate Consumer Staples

SE
CTO
R U
PD
ATE
9
Relative Strength: Financials, Tech, and Industrials on TopFinancials had the highest level of relative strength compared to the S&P 500, earning most of its excess performance in Q4 after the election. Technology’s relative strength dipped a bit in Q4 as other sectors garnered attention, but still remains strong. Utilities, Real Estate, and Telecom suffered as bond proxies weakened.
Past performance is no guarantee of future results. Charts represent performance of specified S&P 500 Sector Indices relative to the broader S&P500 Index. It is not possible to invest directly in an index. All indices are unmanaged. Source: FactSet, Fidelity Investments, as of Dec. 31, 2016.
Relative Strength: This indicator compares the performance of each sector with the performance of the broad market based on changes in the ratio of the
securities’ respective prices over time.
Sectors Exhibiting Relative WeaknessSectors Exhibiting Relative Strength
6-month review
Price Relative to S&P 500 IndexPrice Relative to S&P 500 Index
6-month review
80
85
90
95
100
105
110
115
120
Dec-14 Jun-15 Dec-15 Jun-16 Dec-16
Financials Technology Industrials
80
85
90
95
100
105
110
115
120
Dec-14 Jun-15 Dec-15 Jun-16 Dec-16
Utilities Real Estate Telecom

SE
CTO
R U
PD
ATE
10
Potential Impact of Policy Changes on U.S. Equity SectorsA number of proposals that were touted on the campaign trail and that may be enacted in 2017 (and beyond) could be supportive for economic and stock market growth. Among the potential policy moves are corporate tax reform and tax cuts, a lighter touch on regulation for corporations, and stimulus through infrastructure spending. Below is a quick look at which sectors could benefit (designated by a “+”) from specific proposals.
For illustration only. Plus signs (+) indicate a positive consideration for the sector relative to other sectors (holding other variables constant). For all policies mentioned above, there are a number of ambiguities around policy specifics and timeline for implementation. Specifically, there is less conviction about fiscal stimulus due to the various methods for execution (infrastructure spending, lower personal taxes, defense spending, etc.), and the sector impact will likely play out over a period of years. Source: Fidelity Investments, as of Dec. 31, 2016.
After the Election: What Sectors Might Benefit From Policy Changes?
Cyclical Defensive
Policy
New President and/or
GOP Congress Support
Materials Tech Energy Industrials Cons Disc Financials Health
CareReal
EstateCons
Staples Telecom Utilities
Fiscal Stimulus New President + + + + + +
Financial Deregulation Both + +
Tax Cuts Both + + + + +
Fiscal Austerity GOP Congress + + + +
Other• Policy changes related to fair trade and stricter immigration are less clear in terms of equity sector implications,
although they may have material long-term impacts on the economy.• Additional policies not listed above (e.g., biotechnology and pharmaceutical drug pricing) may have material
effects on specific sectors (e.g., Health Care) but were omitted due to their relatively sector-specific impact.

SE
CTO
R U
PD
ATE
11
Taxes and Corporate Cash by SectorOne of the new administration's proposals is to decrease corporate taxes, which could potentially benefit some sectors that have a higher relative tax burden, such as Telecom and Utilities. Additionally, rising interest rates could allow for higher interest income on cash balances. A repatriation holiday could also create opportunities for companies holding cash overseas, although how these companies would deploy this cash is unknown.
Cash balances as of each company’s latest quarterly filing. Sectors defined as the GICS sectors of the S&P 500. Average tax rate is the average of the companies in each of the 11 sectors. Companies were included if their tax rate fell between 10% and 50% in order to exclude high or low tax rates due to accounting measures or one-time tax credits. Source: FactSet, Bloomberg Finance L.P., as of Dec. 14, 2016.
0
5
10
15
20
25
30
35
40
$-
$200,000
$400,000
$600,000
$800,000
$1,000,000
$1,200,000
$1,400,000
Tech
nolo
gy
Hea
lth C
are
Fina
ncia
ls
Indu
stria
ls
Con
s. D
isc.
Con
s. S
tpls
.
Ene
rgy
Mat
eria
ls
Util
ities
Tele
com
Rea
l Est
ate
Domestic Cash ($M) Foreign Cash ($M) Sector Average Tax Rate
Cash ($) Tax Rate (%)

SE
CTO
R U
PD
ATE
12
A Shift in Correlation Between and within SectorsA significant drop in correlations between sectors, which began around mid-year and accelerated after the election, may create sector allocation opportunities for investors. Additionally, lower intra-sector correlations in the S&P 500 overall and in eight of the 11 market sectors may create opportunities for active stock selection.
Sectors defined as GICS sectors of the S&P 500. Pre-election: 2016 year to date to Nov. 8. Post-election: Nov. 9, 2016 to Dec. 31, 2016. Daily returns used for correlation analysis. Average sector correlation is the average of a sector’s correlation with the 10 other sectors. Average intra-sector correlation is the average correlation of stocks within a sector with the remaining stocks in the sector. Correlation: the interdependence of two random variables that range in value from −1 to +1, indicating perfect negative correlation at −1, absence of correlation at 0, and perfect positive correlation at +1. Source: FactSet, as of Dec. 31, 2016.
0.00 0.20 0.40 0.60 0.80 1.00
Cons. Disc.
Cons. Stpls.
Energy
Financials
Health Care
Industrials
Technology
Materials
Real Estate
Telecom
Utilities
S&P 500
Pre-Election Post-Election
0.00 0.20 0.40 0.60 0.80 1.00
Cons. Disc.
Cons Stpls.
Energy
Financials
Health Care
Industrials
Technology
Materials
Real Estate
Telecom
Utilities
S&P 500
Pre-Election Post-Election
Average Intra-Sector Correlation Average Sector Correlation

SE
CTO
R U
PD
ATE
67%
33% 33%25%
42%
75%
67%
42%
75%
89%
25%
42%
58%
42%
50%
88%83%
67%
50%
25%
0%
10%
20%
30%
40%
50%
60%
70%
80%
90%
100%
CNS UTL TEL HTH TEC FIN CND ENE IND MAT
SECTOR PERFORMANCE BEFORE AND DURINGAverage Investment Recoveries, Dec. 1965 to Nov. 2016
Year Before During
Financials: Room to Run, or Is the Good News Priced in?Financials gained 18.5% between the election and year end, due largely to rising rates and a potentially less-strict regulatory backdrop. Can the rally continue? Yes, if financial deregulation does occur, banks should be more likely to lend. Higher loan growth has led to strong odds of outperformance for Financials over time.
78%74%
59%
50% 50% 50%45% 45%
41%36%
0%
10%
20%
30%
40%
50%
60%
70%
80%
90%
FIN CND TEL CNS MAT UTL ENE HTH TEC IND
HIGHER BANK WILLINGNESS TO LENDSector Odds of Outperformance, 1962 to Nov. 2016
13
Source: Haver Analytics, Fidelity Investments, as of Nov. 30, 2016. Past performance is no guarantee of future results.
Financials have had the highest odds of outperformance when banks increase their willingness to lend
Financials have traditionally had strong odds of outperformance leading up to and during investment recoveries
Con
s. S
tpls
.
Util
ities
Tele
com
Hea
lth C
are
Tech
nolo
gy
Fina
ncia
ls
Con
s. D
isc.
Ener
gy
Indu
stria
ls
Mat
eria
ls
Fina
ncia
ls
Con
s. D
isc.
Tele
com
Con
s. D
isc.
Mat
eria
ls
Util
ities
Ener
gy
Hea
lth C
are
Tech
nolo
gy
Indu
stria
ls

SE
CTO
R U
PD
ATESectors Poised to Benefit from an Infrastructure Boom
Though the timing is uncertain, the U.S. and China are expected to increase their infrastructure spending, which could boost revenues for multiple industries in the Industrials and Materials sectors. Those that would likely benefit are companies exposed to road & rail, commercial construction, and/or that have global exposure to new construction, such as large machinery makers and international conglomerates, to name a few.
14
Industrials & Materials companies likely to benefit from higher infrastructure spending
Infrastructure spending has begun to increase but remains below its pre-recession average U.S. Total Infrastructure Spending as a Fraction of GDP
0
20
40
60
80
100
120
140
160
180
0.0%
0.3%
0.6%
0.9%
1.2%
2000
2001
2002
2003
2004
2005
2006
2007
2008
2009
2010
2011
2012
2013
2014
2015
infrastructure spending as % of GDPtotal U.S. infrastructure spending ($B)
% GDP Total Spend ($B)
LEFT: Source: Bloomberg Finance L.P., U.S. Bureau of Economic Analysis, Fidelity Investments, as of Nov. 1, 2016. RIGHT: For illustrative purposes only. Source: MSCI, based on USA IMI Indexes, as of Dec. 31, 2016.
Industrials Companies exposed to capital goods segments,
like heavy machinery, building products and construction.
Transportation companies such as railroads.
Materials Metals and mining companies that provide steel,
copper, and aluminum to the construction industry. Aggregate companies that make construction
materials such as concrete and asphalt.
15
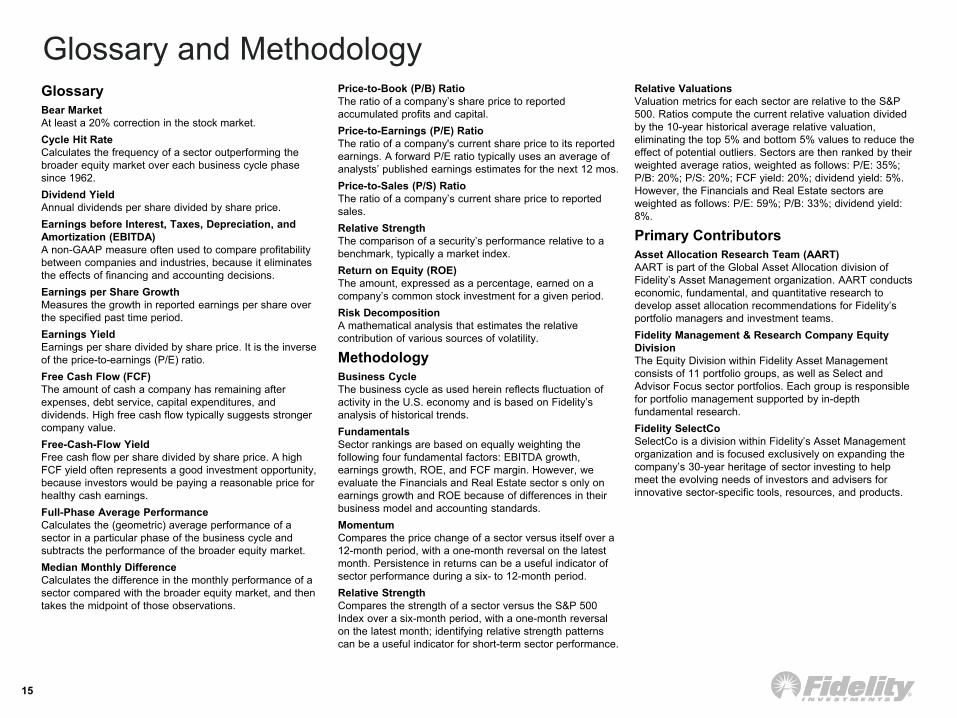
Glossary and MethodologyGlossaryBear MarketAt least a 20% correction in the stock market. Cycle Hit RateCalculates the frequency of a sector outperforming the broader equity market over each business cycle phase since 1962. Dividend YieldAnnual dividends per share divided by share price.Earnings before Interest, Taxes, Depreciation, and Amortization (EBITDA)A non-GAAP measure often used to compare profitability between companies and industries, because it eliminates the effects of financing and accounting decisions.Earnings per Share GrowthMeasures the growth in reported earnings per share over the specified past time period.Earnings YieldEarnings per share divided by share price. It is the inverse of the price-to-earnings (P/E) ratio.Free Cash Flow (FCF)The amount of cash a company has remaining after expenses, debt service, capital expenditures, and dividends. High free cash flow typically suggests stronger company value.Free-Cash-Flow YieldFree cash flow per share divided by share price. A high FCF yield often represents a good investment opportunity, because investors would be paying a reasonable price for healthy cash earnings.Full-Phase Average PerformanceCalculates the (geometric) average performance of a sector in a particular phase of the business cycle and subtracts the performance of the broader equity market. Median Monthly DifferenceCalculates the difference in the monthly performance of a sector compared with the broader equity market, and then takes the midpoint of those observations.
Price-to-Book (P/B) RatioThe ratio of a company’s share price to reported accumulated profits and capital.Price-to-Earnings (P/E) RatioThe ratio of a company's current share price to its reported earnings. A forward P/E ratio typically uses an average of analysts’ published earnings estimates for the next 12 mos.Price-to-Sales (P/S) RatioThe ratio of a company’s current share price to reported sales.Relative StrengthThe comparison of a security’s performance relative to a benchmark, typically a market index. Return on Equity (ROE)The amount, expressed as a percentage, earned on a company’s common stock investment for a given period.Risk DecompositionA mathematical analysis that estimates the relative contribution of various sources of volatility.
MethodologyBusiness CycleThe business cycle as used herein reflects fluctuation of activity in the U.S. economy and is based on Fidelity’s analysis of historical trends.FundamentalsSector rankings are based on equally weighting the following four fundamental factors: EBITDA growth, earnings growth, ROE, and FCF margin. However, we evaluate the Financials and Real Estate sector s only on earnings growth and ROE because of differences in their business model and accounting standards.MomentumCompares the price change of a sector versus itself over a 12-month period, with a one-month reversal on the latest month. Persistence in returns can be a useful indicator of sector performance during a six- to 12-month period.Relative StrengthCompares the strength of a sector versus the S&P 500Index over a six-month period, with a one-month reversal on the latest month; identifying relative strength patterns can be a useful indicator for short-term sector performance.
Relative ValuationsValuation metrics for each sector are relative to the S&P 500. Ratios compute the current relative valuation divided by the 10-year historical average relative valuation, eliminating the top 5% and bottom 5% values to reduce the effect of potential outliers. Sectors are then ranked by their weighted average ratios, weighted as follows: P/E: 35%; P/B: 20%; P/S: 20%; FCF yield: 20%; dividend yield: 5%. However, the Financials and Real Estate sectors areweighted as follows: P/E: 59%; P/B: 33%; dividend yield: 8%.
Primary ContributorsAsset Allocation Research Team (AART)AART is part of the Global Asset Allocation division of Fidelity’s Asset Management organization. AART conducts economic, fundamental, and quantitative research to develop asset allocation recommendations for Fidelity’s portfolio managers and investment teams. Fidelity Management & Research Company Equity DivisionThe Equity Division within Fidelity Asset Management consists of 11 portfolio groups, as well as Select and Advisor Focus sector portfolios. Each group is responsible for portfolio management supported by in-depth fundamental research. Fidelity SelectCo SelectCo is a division within Fidelity’s Asset Management organization and is focused exclusively on expanding the company’s 30-year heritage of sector investing to help meet the evolving needs of investors and advisers for innovative sector-specific tools, resources, and products.

16
Unless otherwise disclosed to you in providing this information, Fidelity is not undertaking to provide impartial investment advice, act as an impartial adviser, or to give advice in a fiduciary capacity.
Information presented herein is for discussion and illustrative purposes only and is not a recommendation or an offer or solicitation to buy or sell any securities. Views expressed are as of the date indicated, based on the information available at that time, and may change based on market and other conditions. Unless otherwise noted, the opinions provided are those of the authors and not necessarily those of Fidelity Investments or its affiliates. Fidelity does not assume any duty to update any of the information.
References to specific investment themes are for illustrative purposes only and should not be construed as recommendations or investment advice. Investment decisions should be based on an individual’s own goals, time horizon, and tolerance for risk.
This piece may contain assumptions that are “forward-looking statements,” which are based on certain assumptions of future events. Actual events are difficult to predict and may differ from those assumed. There can be no assurance that forward-looking statements will materialize or that actual returns or results will not be materially different from those described here.
Past performance is no guarantee of future results.
Investing involves risk, including risk of loss.
All indices are unmanaged. You cannot invest directly in an index. Index or benchmark performance presented in this document does not reflect the deduction of advisory fees, transaction charges, and other expenses, which would reduce performance.
Stock markets are volatile and can decline significantly in response to adverse issuer, political, regulatory, market, or economic developments.
Because of its narrow focus, sector investing tends to be more volatile than investments that diversify across many sectors and companies. Sector investing is also subject to the additional risks associated with its particular industry.
Business Cycle DefinitionThe typical Business Cycle depicts the general pattern of economic cycles throughout history, though each cycle is different. In general, the typical business cycle demonstrates the following:
Early-cycle: economy bottoms and picks up steam until it exits recession, then begins the recovery as activity accelerates. Inflationary pressures are typically low, monetary policy is accommodative, and the yield curve is steep.
Mid-cycle: economy exits recovery and enters into expansion, characterized by broader and more self-sustaining economic momentum but a more moderate pace of growth. Inflationary pressures typically begin to rise, monetary policy becomes tighter, and the yield curve experiences some flattening.
Late-cycle: economic expansion matures, inflationary pressures continue to rise, and the yield curve may eventually become flat or inverted. Eventually, the economy contracts and enters recession, with monetary policy shifting from tightening to easing.
Please note that there is no uniformity of time among phases, nor is the chronological progression always in this order. For example, business cycles have varied between one and 10 years in the U.S., and there have been examples when the economy has skipped a phase or retraced an earlier one.
Market IndicesThe FTSE NAREIT All Equity REITs Index is a market capitalization–weighted index that is designed to measure the performance of tax–qualified Real Estate Investment Trusts (REITs) that are listed on the New York Stock Exchange, the NYSE MKT LLC, or the NASDAQ National Market List with more than fifty percent of total assets in qualifying real estate assets secured by real property. Mortgage REITs are excluded.
The S&P 500® Index is a market capitalization–weighted index of 500 common stocks chosen for market size, liquidity, and industry group representation to represent U.S. equity performance. S&P 500 is a registered service mark of Standard & Poor’s Financial Services LLC. Sectors and industries are defined by the Global Industry Classification Standard (GICS).
The S&P 500 sector indices include the standard GICS sectors that make up the S&P 500 Index. The market capitalization of all S&P 500 sector indices together composes the market capitalization of the parent S&P 500 Index; each member of the S&P 500Index is assigned to one (and only one) sector.
MSCI USA Investable Market Index (IMI) is designed to measure the performance of the large-, mid-, and small-cap segments of the U.S. market. With 2,505 constituents, the index covers approximately 99% of the free-float-adjusted market cap in the U.S.
Sectors are defined as follows: Consumer Discretionary: companies that provide goods and services that people want but don’t necessarily need, such as televisions, cars, and sporting goods; these businesses tend to be the most sensitive to economic cycles. Consumer Staples: companies that provide goods and services that people use on a daily basis, like food, household products, and personal-care products; these businesses tend to be less sensitive to economic cycles. Energy: companies whose businesses are dominated by either of the following activities: the construction or provision of oil rigs, drilling equipment, or other energy-related services and equipment, including seismic data collection; or the exploration, production, marketing, refining, and/or transportation of oil and gas products, coal, and consumable fuels. Financials:companies involved in activities such as banking, consumer finance, investment banking and brokerage, asset management, insurance and investments, and real estate, including REITs.
Appendix

17
Health Care: companies in two main industry groups: health care equipment suppliers and manufacturers, and providers of health care services; and companies involved in the research, development, production, and marketing of pharmaceuticals and biotechnology products. Industrials: companies whose businesses manufacture and distribute capital goods, provide commercial services and supplies, or provide transportation services. Materials: companies that are engaged in a wide range of commodity-related manufacturing. Real Estate: companies in two main industry groups—real estate investment trusts (REITs), and real estate management & development companies. Technology: companies in technology software and services and technology hardware and equipment. Telecommunication Services: companies that provide communications services primarily through fixed-line, cellular, wireless, high bandwidth, and/or fiber-optic cable networks. Utilities: companies considered to be electric, gas, or water utilities, or companies that operate as independent producers and/or distributors of power.
Third-party marks are the property of their respective owners; all other marks are the property of FMR LLC.
If receiving this piece through your relationship with Fidelity Institutional Asset ManagementSM (FIAM), this publication is provided by Fidelity Investments Institutional Services Company, Inc..
If receiving this piece through your relationship with Fidelity Personal & Workplace Investing (PWI) or Fidelity Family Office Services (FFOS) this publication is provided through Fidelity Brokerage Services LLC, Member NYSE, SIPC.
If receiving this piece through your relationship with Fidelity Clearing and Custody Solutions or Fidelity Capital Markets, this publication is for institutional investor or investment professional use only. Clearing, custody or other brokerage services are provided through National Financial Services LLC or Fidelity Brokerage Services LLC, Member NYSE, SIPC.
785930.1.0
© 2017 FMR LLC. All rights reserved.
Appendix


![Quarterly Update [Company Update]](https://img.pdfslide.us/doc/110x75/577cb4b01a28aba7118c9d76/quarterly-update-company-update-578abd0f0e24d.jpg)