Embed Size (px)
Citation preview

South Africa March 2014
SABMiller plc Investor Relations Quarterly divisional seminar series

© SABMiller plc 2014
Forward looking statements
This presentation includes „forward-looking statements‟. These statements contain the words “anticipate”, “believe”, “intend”, “estimate”, “expect” and
words of similar meaning. All statements other than statements of historical facts included in this presentation, including, without limitation, those
regarding the Company‟s financial position, business strategy, plans and objectives of management for future operations (including development plans
and objectives relating to the Company‟s products and services) are forward-looking statements. Such forward-looking statements involve known and
unknown risks, uncertainties and other important factors that could cause the actual results, performance or achievements of the Company to be
materially different from future results, performance or achievements expressed or implied by such forward-looking statements. Such forward-looking
statements are based on numerous assumptions regarding the Company‟s present and future business strategies and the environment in which the
Company will operate in the future. These forward-looking statements speak only as at the date of this presentation. The Company expressly disclaims
any obligation or undertaking to disseminate any updates or revisions to any forward-looking statements contained herein to reflect any change in the
Company‟s expectations with regard thereto or any change in events, conditions or circumstances on which any such statement is based.
All references to “EBITA” in this presentation refer to earnings before interest, tax, amortisation of intangible assets and exceptional items. All
references to “organic” mean as adjusted to exclude the impact of acquisitions, while all references to “constant currency” mean as adjusted to exclude
the impact of movements in foreign currency exchange rates in the translation of our results.
1

© SABMiller plc 2014
SABMiller – a leading growth player in international beverages
World‟s 2nd largest brewer, superior revenue & profit growth, #1 or 2 in > 90% of markets
Leading brand portfolios and in-market engagement, driven by deep local insights
Building and broadening the beer category and its position within alcohol, aligned with diverse consumer tastes in both developed and emerging markets
Strategic partnerships with The Coca Cola Company, Castel, CRE, Efes
2
Total volumes
(306 m hl)*1
Group revenue
($34.5 bn) 1
EBITA
($6.4 bn) 1**
1 As at 31 March 2013 * Excludes contract brewing, includes soft drinks and other alcoholic beverages; ** Before corporate costs and excluding exceptional items
Latin America Africa Asia Pacific North America South Africa Europe
20%
17%
13%
16%
12% 22%
Strategic partnerships
23%
17%
15%
17%
11% 17%
32%
12% 12%
19%
12% 13%
1 As at 31 March 2013; * Excludes contract brewing, includes soft drinks and other alcoholic beverages; ** Before corporate costs and excluding exceptional items

SABMiller South Africa Overview Norman Adami

© SABMiller plc 2014
SAB‟s role is to provide strong, growing cash flow to SABMiller.
5-year horizon: Deliver increasing EBIT growth and margin expansion
Grow total portfolio volumes and mix
Improve working capital and management of the Balance Sheet
4

© SABMiller plc 2014
Virtuous cycle
Free up savings
and leverage
scale
Grow to expand
scale
Invest in
marketing and
Sales
5

© SABMiller plc 2014
Strategic accomplishments
6
6.9 7.8
8.8 9.7
F10 F11 F12 F13
SAB Ltd. EBITA (Rand billions) CAGR
12%

© SABMiller plc 2014
Strategic accomplishments – Beer South Africa
Realised >90% share of beer and growing
Managing societal headwinds
Created strong foundation for future growth
7

© SABMiller plc 2014
Strategic accomplishments – Soft-Drinks (ABI)
>91% value share and >88% volume share
Grew portfolio volume
– Sparkling growth 2.5% CAGR
– Stills contribution 7% of total
Created a strong foundation for long term growth and competitive advantage
8

© SABMiller plc 2014
Current challenges
Modest economic growth
Political and social uncertainty
Disposable income under pressure
Intensifying competition
Rand weakening
3.5%
2.5%
1.9%
2.7%
3.2% 3.5%
2011 2012 2013 2014 2015 2016
South African GDP growth
9 Source: Stats SA; Reuters EconoMeter, February 2014

© SABMiller plc 2014
Looking ahead we are optimistic
Steady economic growth long-term
Population growth and urbanization
Expansion of middle-class
Enhanced capability to compete and execute
SABMiller has proven adapt at operating in these circumstances
Part of a local and global system with new capabilities
10

© SABMiller plc 2014
A global system aligned for greater leverage
Focus on beer category growth
Leveraging scale
Stakeholder partnership
11

© SABMiller plc 2014
Refresh core lager across
markets
Increase premium mix
Accelerate global brands
Lead the development of
the beer category
Innovate across vibrant
spectrum of beer styles
Access more consumer
needs and occasions
Focus on further beer category growth
12
Expand and win in
soft-drinks
© SABMiller plc 2014
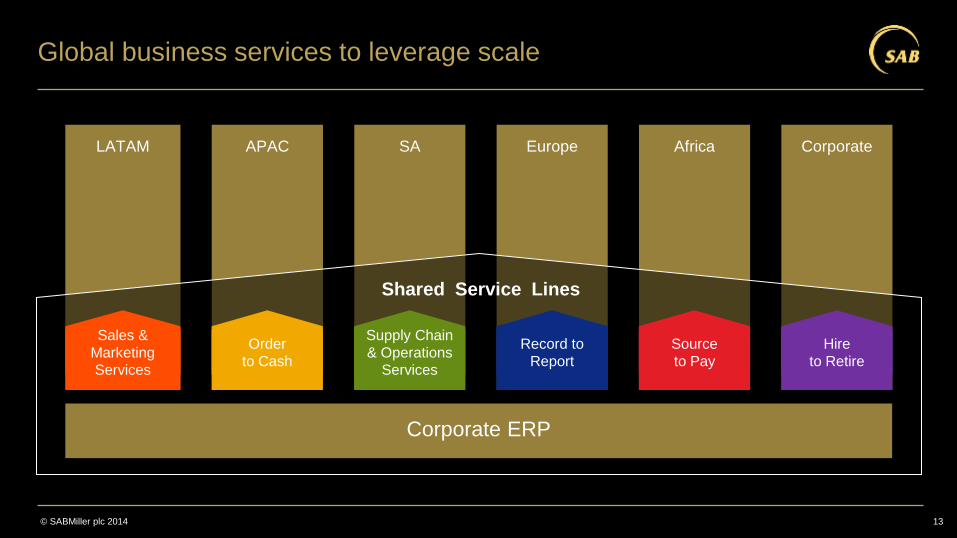
Global business services to leverage scale
13
LATAM APAC SA Africa Corporate Europe
Shared Service Lines
Corporate ERP
Order
to Cash
Supply Chain
& Operations
Services
Record to
Report
Source
to Pay
Hire
to Retire
Sales &
Marketing
Services

© SABMiller plc 2014
End-to-end supply chain optimisation
14
Procurement Distribution Suppliers Manufacturing
Demand and supply planning
Sales and operations planning
Innovation
Organisation, roles and skills
Processes, tools & systems
Performance measurement
Customers
Stimulate
innovation through
Technical insight
Drive functional
excellence
Sharpen focus
on the Consumer
& Customer

© SABMiller plc 2014
Procurement is a globally integrated function
Expanding category focus to in-directs
Spend under centralised management to increase to >80%
Specialist capabilities built at global and regional level
15

© SABMiller plc 2014
Creating value with non-alcoholic drinks
16
Across Africa, Central America, Central Asia (CCI) – Coca Cola bottlers (subs & assoc.) in 32 markets
Broader beverage scale advantages
© SABMiller plc 2014
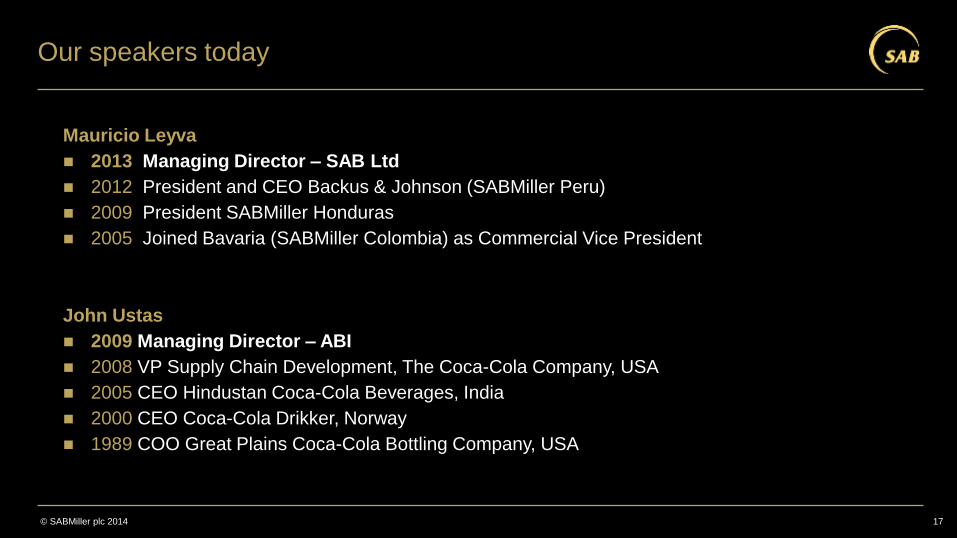
Our speakers today
John Ustas
2009 Managing Director – ABI
2008 VP Supply Chain Development, The Coca-Cola Company, USA
2005 CEO Hindustan Coca-Cola Beverages, India
2000 CEO Coca-Cola Drikker, Norway
1989 COO Great Plains Coca-Cola Bottling Company, USA
Mauricio Leyva
2013 Managing Director – SAB Ltd
2012 President and CEO Backus & Johnson (SABMiller Peru)
2009 President SABMiller Honduras
2005 Joined Bavaria (SABMiller Colombia) as Commercial Vice President
17

Beer South Africa Mauricio Leyva

© SABMiller plc 2014
Beer South Africa; indexed performance to F10, %
We have continued to deliver against our strategic priorities
Source: SAB internal data
100
110
120
130
140
150
F10 F11 F12 F13
CAGR %
F10 – F13
EBITA 12.0%
NPR 8.1%
Volume 1.9%
19

© SABMiller plc 2014
Our 5 thrust strategy continues to guide our actions
Fortify the foundation and
strengthen productivity edge Shape superior routes
to market
Engage the competition Ensure societal
leadership
Shaping the portfolio and ensure
key brands resonate
5
20

© SABMiller plc 2014
South Africa population & urbanisation evolution
M people, 2012 - 2022
We have a growing legal-drinking-age population with biggest increases in urban areas
Continued urbanisation
Growth of black middle-class
New needs and occasions
21
+0.6%
Non-metro
municipalities
2022
55.8
2.6 52.4
Metros 2012
0.7
East London (Buffalo City)
Cape Town
Port Elizabeth (Nelson Mandela Bay)
Bloemfonteing (Manguang)
Johannesburg
Durban (Ethekwini)
East Rand (Ekurhuleni)
Pretoria (Tshwane)
Source: SAB-South Africa; C-GIDD; Canback Dangel analysis

© SABMiller plc 2014
Socio-economic level distribution
Historic, adult population
Real GDP growth translating to improved income over long term
22
Sources: World Bank; C-GIDD; Canback Dangel analysis
High income looking to display wealth
Growing middle class with premium needs & occasions where they need to badge
Struggling lower income consumers with affordability needs
7.3
12.9
3.46.5
5.4
2011
LSM 7-8
3.1
LSM 1-4
2001
LSM 9-10
29.0
9.3
34.1
LSM 5-6
15.2

© SABMiller plc 2014
South African alcohol abstinence
%
And more women choosing to enjoy alcohol
New role for women in society
New mixed gender occasions
Opportunity for growth within beer
More participation in alcohol occasions outside of home
Opportunities outside traditional beer with sweeter profiles
23
52
79
65
48
75
62
49
67
58
Men Women Total
1995 2003 2013
49 48 52
Total
58 62
65
Female
67
75 79
Male
2013 2003 1995
Source: Library of Congress, Stats SA, WHO; Canback Dangel analysis

© SABMiller plc 2014
Broadening our competitive mindset to embrace total alcohol
“From winning in beer to winning with beer”
Through beer… flavoured beer… beer styles beyond lager…
VALUE SHARE OF TOTAL ALCOHOL BY CATEGORY
(% value) – SA 2013
Source: Nielsen, SAB internal data & IWSR
Cider /
Spirit coolers
54%
Beer
21%
Spirits
14%
Wine
11%
24

© SABMiller plc 2014
Our strategic intent is clear
25
Shaping the portfolio and ensure
key brands resonate
Strategic intent:
To reinforce and expand the category structure whilst increasing the demand and pricing power of our brands
Compete intensely with all forms of TAB by playing to our strengths and our competitors weakness
Create the customer service capability to capitalise on evolving market structures with segmented execution of differentiated services by class of trade
Leverage global skills and scale to improve margins through capturing efficiencies, eliminate waste and build world class capabilities
Take affirmative action with a positive impact on responsible drinking, responsible marketing and broad based economic empowerment
Engage the competition
Shape superior routes to market
Ensure societal leadership
Fortify the foundation and
strengthen productivity edge

© SABMiller plc 2014
< Our strategic intent is clear – video >
26

© SABMiller plc 2014
Romancing
Core Lager
Improving
Premium
Mix
Ensuring
Affordability
Extending
Refreshment
Occasions
e.g.,
Flavoured
Beers
Shape portfolio and ensure key brands resonate –
Our strategy is to reinforce and expand the category structure
27
Capturing
Wine and
Spirits
Occasions
e.g., New
Beer Styles
1
2
4
3 3
■ Further extend our clear market leadership
in core lager
■ Broader portfolio to appeal to new
consumers on more occasions
■ Manage beer‟s positioning among
stakeholders and communities as a
moderate drinking choice

© SABMiller plc 2014
Our three brands account for 100% share of the segment
Carling Black Label, Hansa Pilsener, and Castle Lager are South Africa‟s power brands
Taking convenience pack share
Keeping our core brands fresh and relevant
SAB NPR of
mainstream brands
F13 % of total NPR
Shape portfolio and ensure key brands resonate –
SAB‟s core brands drive category growth
28
Source: SAB internal data
25%
75%
Premium
Mainstream
3 year CAGR NPR
growth 8.1%

© SABMiller plc 2014
Shape portfolio and ensure key brands resonate –
SAB is the leader in premium brands with growing value share
SAB has a 62% volume share of premium and growing
Castle Lite and CMS are the #1 and #2 premium brands
SAB‟s brands are increasing price premium while competition discounts
Regaining convenience pack share led by innovation
Continued seeding global brands with pricing discipline
29
Source: Nielsen; SAB internal data
SAB share of
premium beers
Volume share %
59
53 54
56
62
F09 F10 F11 F12 F13

© SABMiller plc 2014
Shape portfolio and ensure key brands resonate –
Increased focus on FABs and expanding adjacencies
Dedicated team for 4 years with investment and innovation support
Introduced new sub category of flavoured beer in South Africa
Launched Redds bold crisp, introduced slim and 440ml cans
Expanding Brutal Fruit into new consumer segments
Category returning to growth with price index of 145-160 to beer
30
6.9%
7.3%
7.4%
7.6%
8.0%
F09 F10 F11 F12 F13
FABs CATEGORY SHARE OF TOTAL ALCOHOL (total RSA)
Source: Canback Dangel analysis
FABs category share of
total alcohol %
Total RSA
6.9%
7.3%
7.4%
7.6%
8.0%
F09 F10 F11 F12 F13

© SABMiller plc 2014
Shape portfolio and ensure key brands resonate –
Capturing wine and spirits occasions through innovation
Expand to other beer styles to address new drinking occasions
Product landscaping highlights “white spaces”
Greater distinction of intrinsic and functional benefits to target premium occasions
Building on serving and drinking rituals to appeal to new consumers
31
Illustrative
Resinous
Spicy
Green
Floral Citrus
Fruity
Malty
Cucumber
Fresh Grass
Rose
Violets Grapefruit Orange
Lemon
Lychee
Passion Fruit
Blackcurrant
Spicy hop
Red Apple Tropical Fruit
Green Apple
Banana
Pine, Cedar Malty
Chocolate
Grainy
Toffee
Burnt
Caramel
Warming
Body
Sweet
Bitter Ingredients
Colour
Carbonation
Smell
Style
Flavourings
Filtration / Pasteurisation
Fermentation
Bitterness / Sweetness
Alcohol level
Beer has many variables to drive differentiation Landscape and sensory maps
© SABMiller plc 2014
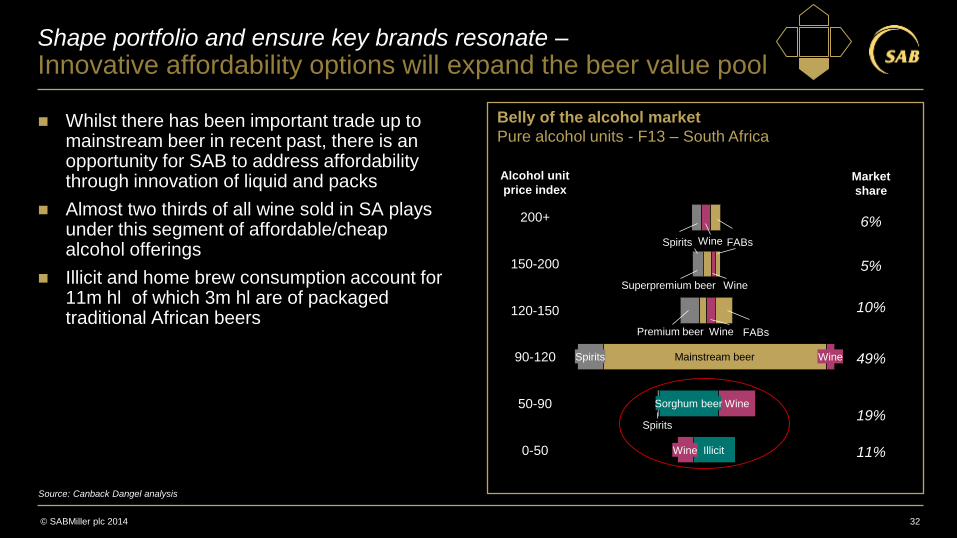
Belly of the alcohol market
Pure alcohol units - F13 – South Africa
Shape portfolio and ensure key brands resonate –
Innovative affordability options will expand the beer value pool
Whilst there has been important trade up to mainstream beer in recent past, there is an opportunity for SAB to address affordability through innovation of liquid and packs
Almost two thirds of all wine sold in SA plays under this segment of affordable/cheap alcohol offerings
Illicit and home brew consumption account for 11m hl of which 3m hl are of packaged traditional African beers
32
Wine
120-150
Spirits
0-50
Wine
150-200
50-90
Spirits 90-120
Wine Illicit
Premium beer
Wine
Sorghum beer
Mainstream beer
Spirits
Superpremium beer Wine
FABs
200+
Wine
Alcohol unit
price index Market
share
6%
5%
10%
49%
19%
11%
FABs
Source: Canback Dangel analysis

© SABMiller plc 2014
Engage the competition –
Focus to gain share of LAE with horizontal and vertical approach
SAB has above 90% market share of total beer
Gaining share of volume and value according to Nielsen off premise measures
Increasing share of premium, now 27% of total SAB portfolio mix
Focus on gaining share of LAE with premiumisation and exploring adjacencies
33
Population
Urban 18-24
0.6%
1.2%
Affluent 3.5%
POPULATION GROWTH OF
CONSUMER TYPE (Annual growth, F13-F23)
Source: World Bank; C-GIDD; SAB MMS; Canback Dangel Analysis
Illustrative
Population growth
of consumer type
Annual growth, F13-F23
3.5%
1.2%
0.6%
Affluent Urban Population
© SABMiller plc 2014
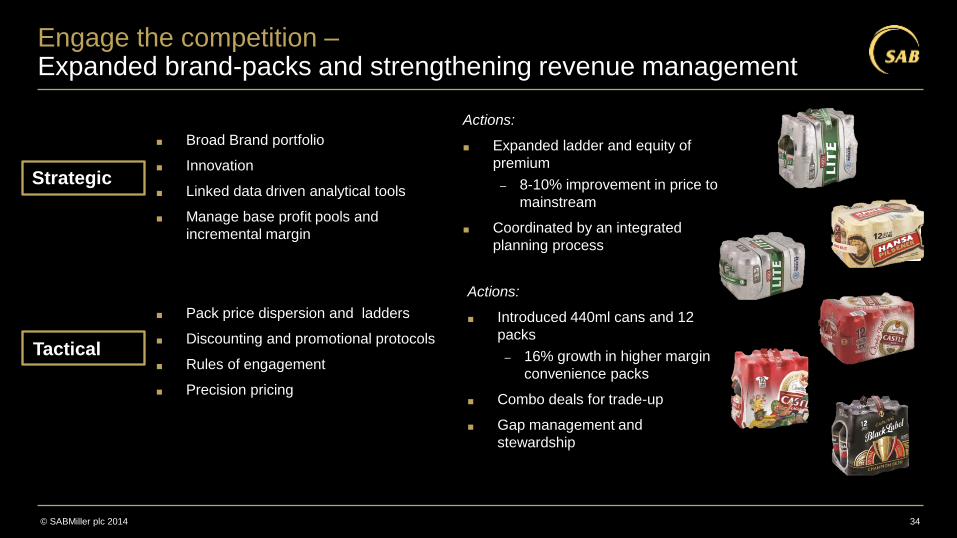
Engage the competition – Expanded brand-packs and strengthening revenue management
34
Strategic
Tactical
Actions:
■ Expanded ladder and equity of
premium
– 8-10% improvement in price to
mainstream
■ Coordinated by an integrated
planning process
■ Pack price dispersion and ladders
■ Discounting and promotional protocols
■ Rules of engagement
■ Precision pricing
Actions:
■ Introduced 440ml cans and 12
packs
– 16% growth in higher margin
convenience packs
■ Combo deals for trade-up
■ Gap management and
stewardship
■ Broad Brand portfolio
■ Innovation
■ Linked data driven analytical tools
■ Manage base profit pools and
incremental margin

© SABMiller plc 2014
Shape superior routes-to-market –
SAB‟s route-to-market stimulates growth by going wide and deep
Taking advantage of our unmatched footprint and frequency of distribution
Our bimodal RTM strategy focuses on increasing DSD of licensed outlets while addressing the informal market via IRDs
Factoring effectiveness through world class execution of trade service and
turn around times
Execute disciplined through-the-line activation of our brands to increase the power and consistency of our brand messaging
Driving profitable growth through differentiated and tailored service packages for each Class of Trade
Increasing feet on the street whilst building organisational capacity and capability
35 Source: SAB internal data
© SABMiller plc 2014
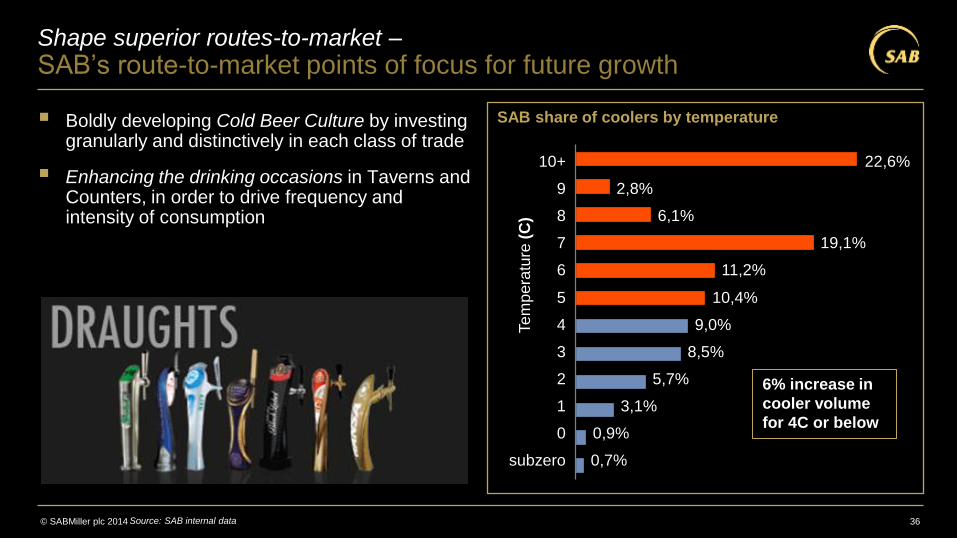
SAB share of coolers by temperature
Shape superior routes-to-market –
SAB‟s route-to-market points of focus for future growth
Boldly developing Cold Beer Culture by investing granularly and distinctively in each class of trade
Enhancing the drinking occasions in Taverns and Counters, in order to drive frequency and intensity of consumption
36
7 19,1%
8 6,1%
9 2,8%
10+ 22,6%
0
subzero 0,7%
0,9%
1 3,1%
2 5,7%
3 8,5%
4 9,0%
5 10,4%
6 11,2%
6% increase in
cooler volume
for 4C or below
Te
mp
era
ture
(C
) Source: SAB internal data

© SABMiller plc 2014
Outlet per capita
Per 10,000
Shape superior routes-to-market –
SAB‟s route-to-market points of focus for future growth
Ambitious Dinaledi and Inkanyezi trade loyalty programs to influence purchase patterns
Focus on nurturing licensing of outlets via compliance, recovery and expansion
37
NOR - Mpumalanga
EGL - East
4,4
ECR - South Coast
3,9
4,0
CAP - Cape Peninsula
CAP - Cape Inland
4,0 ECR - North Coast
4,5 ECR - Prospecton
ECR - Midlands 4,5
EGL - Jo‟burg Central 6,0
EGL - West 6,7
Nor - Odi 7,1
7,2
7,8
EGL - Isando 8,0
NOR - Tshwane 8,1
CEN - Highveld 8,3
CAP - Border 8,4
CEN - Central South 8,5
CAP - Eastern Province 8,6
CEN - North West 8,6
NOR - Limpopo 8,8
EGL - Soweto 9,4
CEN - Vaal Maluti 10,0
7 Average number of outlet per 10,000 people
Source: SAB internal data

© SABMiller plc 2014
Fortify the foundation and strengthen productivity edge –
Eliminating upstream waste fuels market investment
■ R2.6 billion in savings the past 5 years – virtuous cycle reinvestment in the market
■ Big 6 savings initiatives forecast to generate R2.3b NPV over future contract life (F13-F23)
■ Continuous fixed cost productivity
■ New malting capability being established and operational in July 2015 with an investment of R850m
■ Namibian Brewery to open in October 2014 with an investment of R425m
38
Big 6 are: maltings, hops, aluminium can convertion, glass , adjuncts, crowns
Virtuous cycle
5 yrs to F14
So
cie
tal
lea
de
rsh
ip
Ne
t sa
vin
g /
inve
stm
en
t
Su
pe
rio
r ro
ute
s
to m
ark
et
Bu
ild p
ort
folio
En
ga
ge
th
e
co
mp
etitio
n
Sta
bili
se
th
e
fou
nd
atio
n
Fre
igh
t
Fix
ed
co
st
sa
vin
gs

© SABMiller plc 2014
Fortify the foundation and strengthen productivity edge –
New opportunities as we leverage SABM‟s global system
Manufacturing efficiency, reliability and flexibility
Increasing use of global procurement capability
Optimisation of end to end Supply Chain
39
How it delivers value
Enables fully integrated supply organisation that can optimise along the entire supply chain
– Fewer warehouses and trucks required
– Continued distribution efficiencies
Shared Service Lines
Corporate ERP
Order
to Cash
Supply Chain
Ops Services
Record to
Report
Source
to Pay
Hire
to Retire
Sales &
Marketing
Services
Next steps
Functionalised supply organisation to include in-bound logistics through to customer delivery
Demand planning process capability built within Supply team
© SABMiller plc 2014
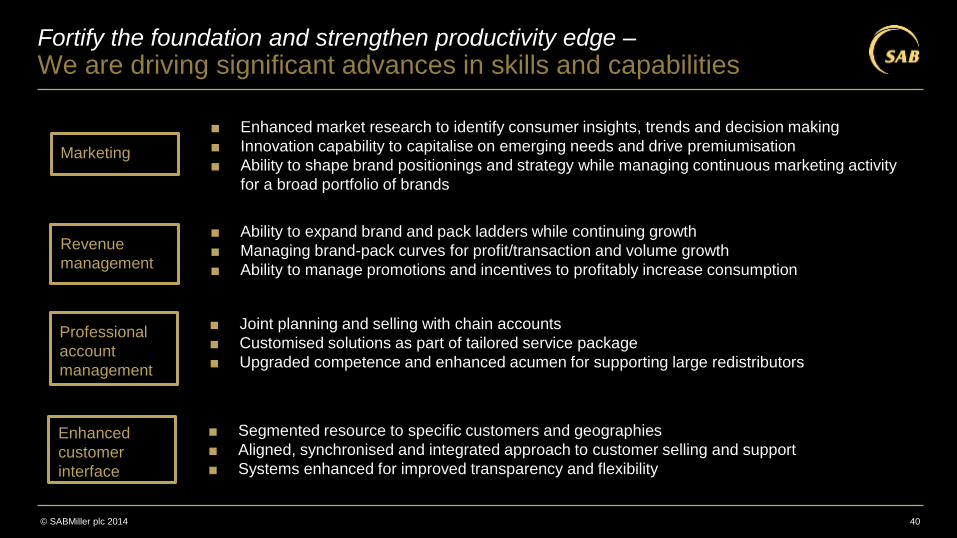
Fortify the foundation and strengthen productivity edge –
We are driving significant advances in skills and capabilities
40
■ Enhanced market research to identify consumer insights, trends and decision making
■ Innovation capability to capitalise on emerging needs and drive premiumisation
■ Ability to shape brand positionings and strategy while managing continuous marketing activity
for a broad portfolio of brands
Marketing
■ Ability to expand brand and pack ladders while continuing growth
■ Managing brand-pack curves for profit/transaction and volume growth
■ Ability to manage promotions and incentives to profitably increase consumption
Revenue
management
■ Joint planning and selling with chain accounts
■ Customised solutions as part of tailored service package
■ Upgraded competence and enhanced acumen for supporting large redistributors
Professional
account
management
■ Segmented resource to specific customers and geographies
■ Aligned, synchronised and integrated approach to customer selling and support
■ Systems enhanced for improved transparency and flexibility
Enhanced
customer
interface

© SABMiller plc 2014
Ensure societal leadership –
SAB continues to provide leadership in South Africa
Continue advancing broad based black economic empowerment: – Customer/employee share participation (Zenzele)
– Purchasing has directed R1.2b to emerging black suppliers annually
– BBBEE equity scorecard is at level 3
In partnership with law enforcement we trained around 20,000 Taverners in our responsible trading programs
Tightened SAB‟s internal codes and enhanced our outreach to NGOs and government
41

© SABMiller plc 2014
Ensure societal leadership –
Moving forward as a positive contributor and industry leader
Continue investing in promoting responsible sale and consumption of our products
Gain societal acceptance of beer consumption as a moderate alcohol drink
Take proactive steps to improve new BBBEE code score via employment equity and preferential procurement
Engage proactively with government to provide industry perspective on legislation and policy
42

© SABMiller plc 2014
In the coming years we have clear points of focus within the five thrusts
43
Manufacturing, procurement & leveraging scale
Winning in returnables, FABs and total alcohol
Romancing core lager, innovation & pricing
Enhancing the occasions and bimodal RTM
LTT, BBBEE and stakeholder relations 5

© SABMiller plc 2014
Our guiding principles
Growth
Untapped potential in alcohol
Enhancing the drinking occasions
Virtuous cycle for market facing investment
Leveraging our global scale
Trust
Underlies all of our relationships
Attention to detail, transparency and performance
Collaboration and being globally integrated
Accountability and delivery of commitments
Passion
Broaden our competitive mindset
Characteristics and leadership behaviours
We must be open and learn every day
How we do things is as important as what we do
44

© SABMiller plc 2014
Conclusion
45
SAB‟s strategy has delivered in the short term and is built for the long term
We see revenue and margin growth opportunities ahead
Refreshing and romancing core lager is at the heart of the business
Our broader portfolios will build the beer category, attracting more consumers on more occasions
We are increasingly leveraging our global skills and scale
We are strong, we are resilient, we are confident

Soft-Drinks South Africa John Ustas
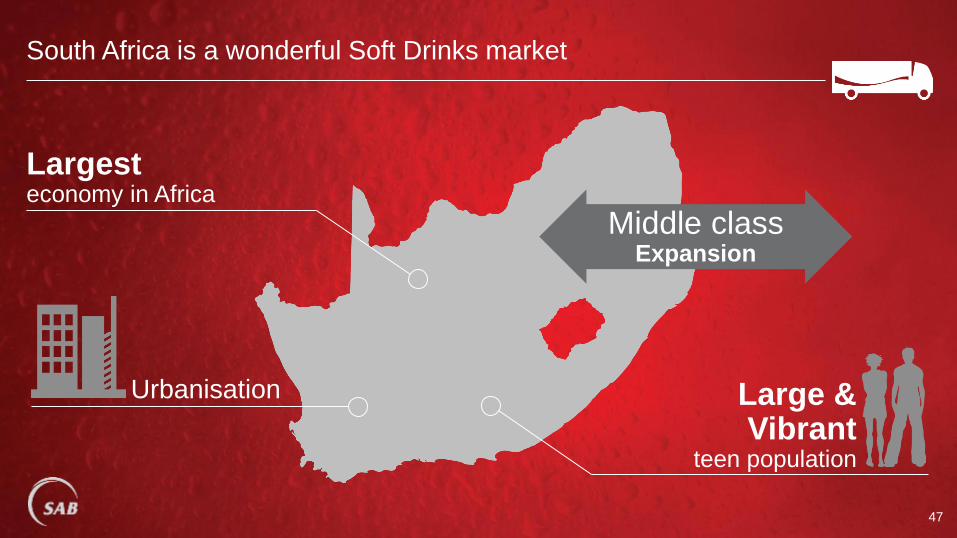
South Africa is a wonderful Soft Drinks market
Largest economy in Africa
Large & Vibrant
teen population
Middle class Expansion
Urbanisation
47

SABMiller‟s Soft-Drinks Division* is the largest Bottler in Africa
Coca-Cola brand love
* Amalgamated Beverage Industries
91% value share
5 of Top 5 brands
Water
Energy #1 Sports #2
48

ABI* has an advantaged infrastructure
* Amalgamated Beverage Industries
325 million unit case
274 per capita
91% market share
High-teens operating margins
475 million Unit case capacity
126,000 Coolers
90,000 Outlets serviced
3,700 Employees
600 Vehicles
21 Packaging Lines
5 Production facilities
ABI, 55 CCF, 26
PENBEV, 12
SHANDUKA, 7
Volume Contribution 2013 (%)
49

South Africa pop. Living standards
(24%)
(33%)
(43%)
South African Soft-Drinks market
has significant potential for development and growth
LSM
High LSM 7 – 10
Medium LSM 4 – 6
Low LSM 1 – 3
South Africa sparkling per Cap
451
290
189
Mexico sparkling per Cap
625
629
643 √
√ √ √
√ √
50

ABI‟s 2020 outlook – the market presents amazing growth potential
325
460
2013 2020
+5.0%
CAGR
+154 Volume (mUC)
74
78
2013 2020
+0.7%
CAGR
+4 Share (NARTD volume)
274
370
2013 2020
+4.4%
CAGR
+96 Per Capita (Sparkling Volume)
Includes stills 51
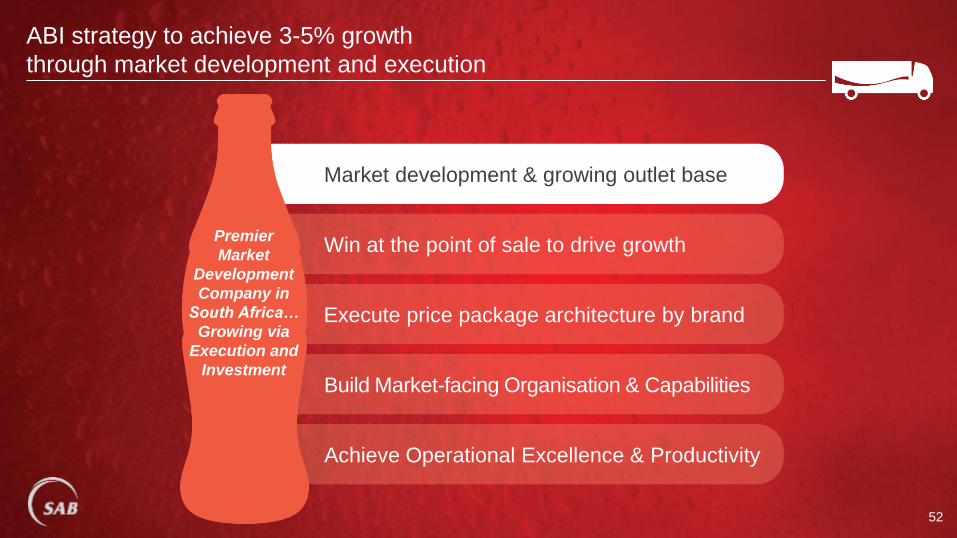
ABI strategy to achieve 3-5% growth
through market development and execution
52
Market development & growing outlet base
Execute price package architecture by brand
Build Market-facing Organisation & Capabilities
Achieve Operational Excellence & Productivity
Win at the point of sale to drive growth Premier
Market
Development
Company in
South Africa…
Growing via
Execution and
Investment

Market Development and growing outlet base – Modern Trade
Improving customer service to grow
Till-point fridges
to increase
transactions
Packaging and
merchandising
innovation for
trade-up
Displays to
increase
retailer stock
and purchase
frequency
53
Expanding
Modern Trade

Market development and growing outlet base –
Improving execution and growing the outlet base
506
756
2009 2013 2020
+50%
Sales feet on the street, ABI
(Total no of sales people)
54
≈1,500

Market Development and growing outlet base – Main Markets
Improving execution and growing the outlet base
55

Market Development and growing outlet base –
Flexible distribution system puts us closer to the customer
56
4 49
65 81
42
65
F11 F12 F13 F14 2020
Market Logistics Partner Strategic Distributors
Market Logistics Partners
Strategic Wholesalers
(# of)
≈350

ABI strategy to achieve 3-5% growth
through market development and execution
57
Market development & growing outlet base
Execute price package architecture by brand
Build Market-facing Organisation & Capabilities
Achieve Operational Excellence & Productivity
Win at the point of sale to drive growth Premier
Market
Development
Company in
South Africa…
Growing via
Execution and
Investment

Winning at the point of sale to drive growth –
Cold drink placements are fuelling growth
95
125
2009 2013 2020
41
50
2009 2013 2020
Coolers per 10k Population
+22%
Cooling Equipment in Trade (thousands)
82
58
+64%
250

Winning at the point of sale to drive growth –
Execution is key to growth
5,000
40,000
2009 2013 2020
Audited Outlets There are 5 key elements in RED
1
2 3
4
5
59
≈60,000

ABI strategy to achieve 3-5% growth
through market development and execution
60
Market development & growing outlet base
Execute price package architecture by brand
Build Market-facing Organisation & Capabilities
Achieve Operational Excellence & Productivity
Win at the point of sale to drive growth Premier
Market
Development
Company in
South Africa…
Growing via
Execution and
Investment

Executing our price package architecture by brand –
We are expanding our pack portfolio for growth and competitiveness
Compete more effectively
Expanding
2 litre to meet
consumer
needs in the
townships
Package Innovation
Driving transactions
440ml cans; 330ml PET;
300ml RGB
Building home inventory
12 pack cans
Expanding multi-serve
2.5 litre; 2.25 litre;
1.5 litre
Increasing affordability
2 litre
1.25 litre returnable
61

Sparkling
Juice
Waters
Energy
Sports
Iced Tea
Fruit/Veg Still Drinks
Executing our price package architecture by brand –
We are increasing focus on still beverage growth opportunities
36,409 9,679
4,100
4,428
941
748
853 4,055
Biggest Revenue
Producer
Juice = R89.53/UC
Sparkling = R58.74/UC
Restage Juice for Growth 1 2 DISRUPT by INNOVATING
BEYOND 100% & Nectars
3 Get our FAIR SHARE of the
large CORDIALS
market 4 DESIGN an
ADVANTAGED EXECUTION
strategy
5 LEVERAGE
JUICE in other categories RTD Tea Energy
1 Create a single
MOTHER BRAND
• System alignment
• Differentiated sensory
experience
• Cordials
• Tailored route-to-
market
Protect Share & Drive Growth 2 Drive Expansion of RTD Tea 3
RTD Tea Water + Enhanced
Sports
Energy 62
Premiumisation with Appletiser 4
Innovation 5

ABI strategy to achieve 3-5% growth
through market development and execution
63
Market development & growing outlet base
Win at the point of sale to drive growth
Build Market-facing Organisation & Capabilities
Achieve Operational Excellence & Productivity
Execute price package architecture by brand Premier
Market
Development
Company in
South Africa…
Growing via
Execution and
Investment

Building market-facing organisation and capabilities –
Capability building has been comprehensive
Comprehensive capability
and training programs for all sales levels Small store owner development programs
Sales force automation & productivity tools Flexible IT solutions for
exclusive distributors (MLPs)
Distribution routing & dispatching tools
Cold drink services
64

ABI strategy to achieve 3-5% growth
through market development and execution
65
Market development & growing outlet base
Win at the point of sale to drive growth
Build Market-facing Organisation & Capabilities
Achieve Operational Excellence & Productivity
Execute price package architecture by brand Premier
Market
Development
Company in
South Africa…
Growing via
Execution and
Investment

Achieving operational excellence and productivity –
Significant waste elimination
Rear-loading
trucks reduce
off-loading
time
Flexible
manufacturing
reduces
inventories
Increased
capacity and
new package
capability
Layer pickers
improve
speed and
accuracy
66

Achieving operational excellence and productivity –
Significant waste elimination (cont‟d)
65%
85%
Jan-12 Jan-13
Direct shipments (%)
103
-19 48
142 150
407
F10 F11 F12 F13 F14 F15
14.5
1.5
2009 2014
Out of stocks (%)
23
5
2012 2014
Depots and
Distribution Centres (#)
Productivity vs.
CPI: Logistics Cost (Rm)
67

This strategy is proving successful
against competition with sustained high market share
Share changes % (value share)
91.6% 91.2%
2010 2013
1 Pack-price architecture
2 Improvements in service
3 Better execution
4 Revenue growth management
Multiple actions to protect share
68

Near-term challenges are becoming evident
F12 F13 F14 F15 F16
Commodity Cost Inflation • Inflation hurting lower-end consumers
• Slow-down in PCE growth
• Increasing B-brand competition
• Social unrest approaching elections
• Increases in commodity costs:
− Resin
− Sugar
− Fuel
69

ABI is growing, and we expect our efforts to produce higher growth
rates going forward
3.5% 2.5%
1.8% 2.7%
3.2%
3.7%
F12 F13 F14 F15 F16 F17 2009 2013 2020
South African GDP Growth ABI growth acceleration
• Improved economic and social forecasts
• Route-to-market and strategy achieves scale
• Expansion in brand and package offering
2.5% 5%
70 Source: Reuters EconoMeter, February 2014

We have continued to deliver against our strategic priorities
150
140
130
120
110
100
F13 F12 F11
Indexed performance to F10 CAGR
F10-F13
EBITA 13.3%
Volume 2.5%
NPR 7.3%
F10
71

We believe in the Coca-Cola business in South Africa
Highest market share and margins Strong brands and growing market
Competitive advantage and efficient Proven strategy and management
Consistent
Performance
Top 5
brands
+91% Value
share
Market development
Pack-price strategy
Win at point-of-sale
Efficient operations
Market facing
72

SABMiller South Africa Conclusion Norman Adami

© SABMiller plc 2014
Summary
■ Understand the challenges and opportunities
■ Executing strategic priorities with intensity
■ Leveraging global scale and skill
Sustainable profitable growth
74

SABMiller South Africa Guidance Gary Leibowitz

© SABMiller plc 2014
Forward guidance
76
■ Volume growth
− Beer
− Soft-drinks
■ NPR per hl (cc)
− Beer
− Soft-Drinks
■ EBITA Margin
1-4%
3-5%
At CPI
Low single digits
20-50bps per year

Q&A