Embed Size (px)
Citation preview

QUARTERLY DISCLOSURE STATEMENT (UNAUDITED)
For the Period Ended September 30, 2016
This quarterly statement is being filed in accordance with the disclosure and compliance obligation related to the issuance of the series listed below. Issuer Bonds Series
North Carolina Medical Care Commission
Hospital Revenue Refunding Bonds (Fixed) 2010
Health Care Facilities Revenue Bonds (Fixed) 2012A
Health Care Facilities Revenue Refunding Bonds (Fixed) 2012B
Health Care Facilities Revenue Refunding Bonds (FRNs) 2012C
Health Care Facilities Revenue Bonds (DP) 2012D

QUARTERLY DISCLOSURE September 30, 2016
1
Comments below are based on combined results of Wake Forest Baptist Medical Center (“Wake Forest Baptist” or “WFB”) (including those entities not obligated on the Bonds) for the three months ended September 30, 2016. Effective March 26, 2011, North Carolina Baptist Hospital, Wake Forest University Health Sciences, and Wake Forest University Baptist Medical Center formed a single obligated group under the North Carolina Baptist Hospital Master Trust Indenture. As of September 30, 2016, the Combined Group generated in the aggregate 93.3% of Wake Forest Baptist’s unrestricted revenue, and the Combined Group owned in the aggregate 96.8% of Wake Forest Baptist’s unrestricted net assets.
QUARTERLY HIGHLIGHTS
Wake Forest Baptist is an integrated clinical, research and academic enterprise that includes a tertiary and quaternary acute care regional referral center with two additional hospital facilities totaling more than 1,000 acute care, rehab and psych beds, more than 1,000 employed physicians and major teaching and research operations.
Through first quarter of fiscal year 2017, Wake Forest Baptist reported a gain in unrestricted net assets of $26.4 million. This gain is comprised of operating income of $5.9 million (0.9% operating margin) and net non-operating gains of $20.5 million.
The sections below provide context regarding underlying financial performance for the three months ending September 30, 2016.
Revenues and Operating Performance
• Net Revenues: Total net revenues were $638.9 million, 12.7% higher than the prior year. Underlying patient revenues improved 11.3% over the same period last year due to yield improvements, clinical volume additions from Cornerstone, operating room volume increases, and slight growth in clinical volumes.
• Operating Performance: Operating income through the first quarter was $5.9 million or 0.9% compared to prior year of $12.6 million or 2.2%. Year-to-date operating EBIDA Margin was $43.3 million or 6.8% compared to prior year of $48.8 million or 8.6%. Excluding the planned $7.0 million loss from the recently acquired Cornerstone Health Care, LLC (a large physician practice), year-to-date operating income and EBIDA were $12.9 million (2.4% growth) and $50.3 million (3.1% growth) respectively. Operating results were driven primarily by volume growth in the clinical enterprise.
Utilization
Wake Forest Baptist generated overall clinical volume growth with a 3.3% year over year growth in case mix adjusted equivalent discharges (CMAEDs). In total, inpatient and observation services remained flat compared to prior year and the slight decline in inpatient volumes was due to the continued shift to observation services. These volumes combined with increased acuity levels, outpatient volumes, and operating room cases contributed to the year over year growth. Improving patient access and enhancing provider throughput continues to be an ongoing focus.
• Inpatient Utilization: System inpatient case mix adjusted discharges increased by 1.4% compared to prior year. This increase was primarily driven by increases in inpatient operating room cases and ambulatory clinic visits. Additionally, with an increased focus on access and the acquisition of Cornerstone Health Care, clinic visits increased 50.6% compared to prior year. Excluding the Cornerstone acquisition, clinic visits increased 3.7% compared to prior year.
• Surgical Volumes: Operating room cases across the health system increased by 3.4% over prior year, a 6.6% growth in inpatient cases and a 1.7% growth in the outpatient setting. Higher case volume was primarily driven by the expansion of ambulatory facilities and operating room capacity management strategies.

QUARTERLY DISCLOSURE September 30, 2016
2
• Emergency Department: System emergency department (ED) visits of 39,298 represented a 1.6% decrease compared to prior year. The expansion of Wake Forest Baptist multi-specialty clinics and urgent care centers (Clemmons, Davie, etc.) increased access points for care and provided appropriate care settings, while supporting overall growth. When combined, ED and urgent care visits increased 2.1% compared to prior year.
• Outpatient Volumes: Outpatient volumes continued to show strong growth with a 9.9% increase over the prior year. This growth is attributable to the acquisition of Cornerstone, improvements in ambulatory and diagnostics access, clinician and staff productivity, expansion of outpatient facilities, and pricing strategies.
Operational Performance / Efficiency
• Length of Stay: Average Length of Stay increased 3.7% during the first quarter compared to the prior year. This increase is primarily driven by an increase in the case mix as well as the continued shift of short stay patients from inpatient to observation services. Case Mix Adjusted Average Length of Stay was 2.97 days, compared to 2.94 days during the same period in the prior year, an increase of 1.0%. Overall, case mix index increased 2.6%, growing from 1.9423 to 1.9933.
• Productivity: Staffing productivity for system hospitals declined by 2.1% during the period compared to the prior year. Labor hours per CMAED were 93.3 paid hours, compared to 91.3 paid hours per CMAED during the same period in the prior year. This slight decline is a result of additional clinical staff to meet increasing patient demands.
Balance Sheet
• Liquidity: Balance sheet remains solid with Days Cash on Hand of 213 and Debt-to-Capitalization of 34.4%.
• Investment Performance: WFB had investment gains of $29.4 million in the first quarter of the fiscal year. WFB maintains a broadly diversified investment portfolio and continues to have a long-term perspective with regard to its investment activities.
• Debt Issuance: In November 2016, WFB issued $150 million of fixed rate, taxable bonds and structured the transaction with a 10-year bullet ($75 million) and a 30-year term bond ($75 million). The funds will be used to finance the costs of various capital expenditures, including the new inpatient tower at WFB-Davie Medical Center, as well as other eligible corporate purposes.
• Line of Credit: Wake Forest Baptist has an unsecured line of credit to provide up to $125 million for the working capital needs of the organization. As of September 30th, the facility had an outstanding balance of $24.7 million.
• Capital Expenditures: Capital expenditures through September 30th were $66.6 million and included the Davie inpatient bed tower, the Medical Education building, clinical equipment and other IT infrastructure upgrades.
QUARTERLY DISCLOSURE September 30, 2016
3
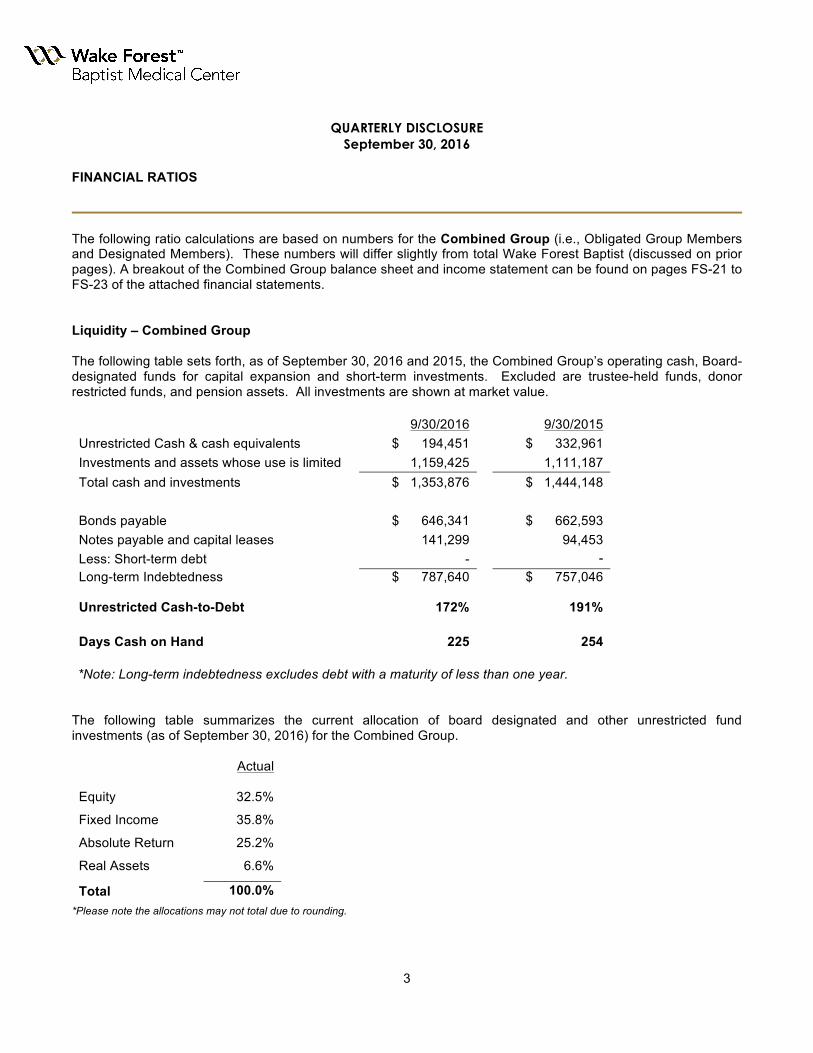
FINANCIAL RATIOS
The following ratio calculations are based on numbers for the Combined Group (i.e., Obligated Group Members and Designated Members). These numbers will differ slightly from total Wake Forest Baptist (discussed on prior pages). A breakout of the Combined Group balance sheet and income statement can be found on pages FS-21 to FS-23 of the attached financial statements. Liquidity – Combined Group The following table sets forth, as of September 30, 2016 and 2015, the Combined Group’s operating cash, Board-designated funds for capital expansion and short-term investments. Excluded are trustee-held funds, donor restricted funds, and pension assets. All investments are shown at market value. 9/30/2016 9/30/2015 Unrestricted Cash & cash equivalents $ 194,451 $ 332,961 Investments and assets whose use is limited 1,159,425 1,111,187 Total cash and investments $ 1,353,876 $ 1,444,148 Bonds payable $ 646,341 $ 662,593 Notes payable and capital leases 141,299 94,453 Less: Short-term debt - - Long-term Indebtedness $ 787,640 $ 757,046
Unrestricted Cash-to-Debt 172% 191% Days Cash on Hand 225 254
*Note: Long-term indebtedness excludes debt with a maturity of less than one year.
The following table summarizes the current allocation of board designated and other unrestricted fund investments (as of September 30, 2016) for the Combined Group.
Actual
Equity 32.5%
Fixed Income 35.8%
Absolute Return 25.2%
Real Assets 6.6%
Total 100.0% *Please note the allocations may not total due to rounding.
QUARTERLY DISCLOSURE September 30, 2016
4
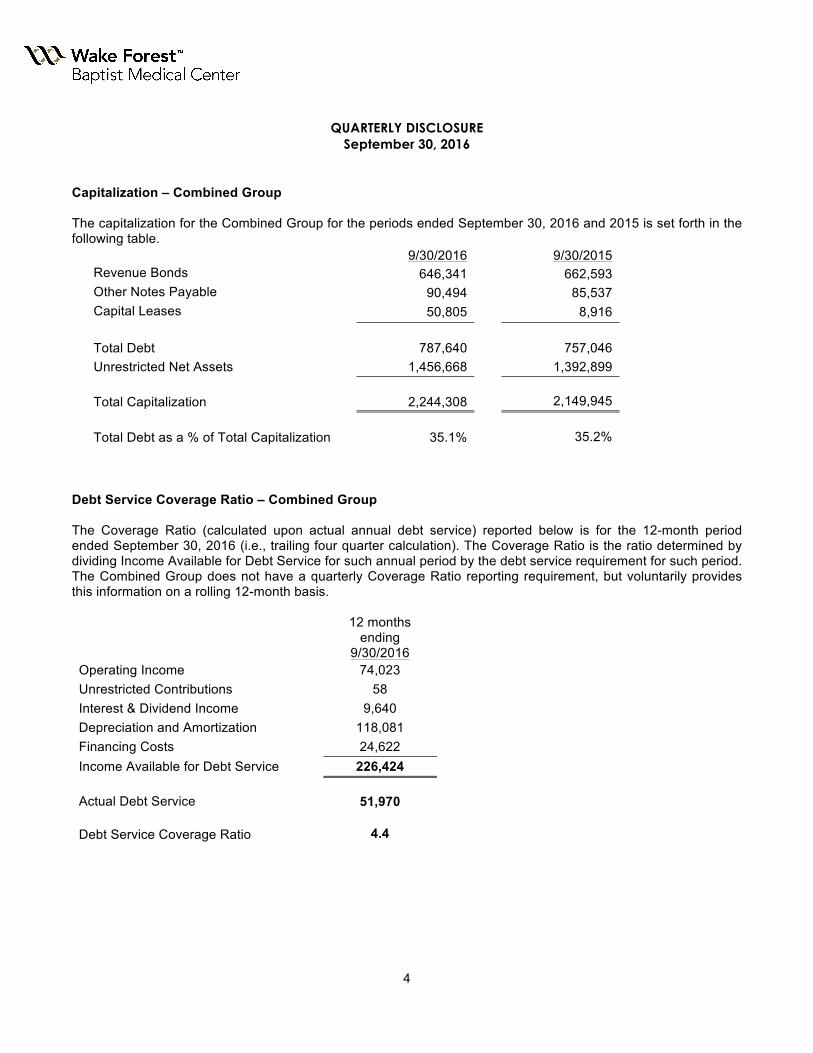
Capitalization – Combined Group The capitalization for the Combined Group for the periods ended September 30, 2016 and 2015 is set forth in the following table.
9/30/2016 9/30/2015 Revenue Bonds 646,341 662,593 Other Notes Payable 90,494 85,537 Capital Leases 50,805 8,916 Total Debt 787,640 757,046 Unrestricted Net Assets 1,456,668 1,392,899
Total Capitalization 2,244,308 2,149,945
Total Debt as a % of Total Capitalization 35.1% 35.2%
Debt Service Coverage Ratio – Combined Group The Coverage Ratio (calculated upon actual annual debt service) reported below is for the 12-month period ended September 30, 2016 (i.e., trailing four quarter calculation). The Coverage Ratio is the ratio determined by dividing Income Available for Debt Service for such annual period by the debt service requirement for such period. The Combined Group does not have a quarterly Coverage Ratio reporting requirement, but voluntarily provides this information on a rolling 12-month basis.
12 months
ending 9/30/2016
Operating Income 74,023 Unrestricted Contributions 58 Interest & Dividend Income 9,640 Depreciation and Amortization 118,081 Financing Costs 24,622 Income Available for Debt Service 226,424
Actual Debt Service 51,970
Debt Service Coverage Ratio 4.4

QUARTERLY DISCLOSURE September 30, 2016
5
UTILIZATION STATISTICS
Utilization Statistics – Combined Group Three Months Ended
9/30/2016 9/30/2015 % Chg from Prior Year
Case Mix Adjusted Equivalent Discharges 50,119 48,501 3.3% Patient Days 64,427 62,883 2.5% Inpatient Admissions 10,901 11,029 -1.2% Average Length of Stay 5.91 5.70 3.7% Average Length of Stay (Case Mix Adjusted) 2.97 2.94 1.0% Inpatient Operating Room Cases 4,089 3,837 6.6% Outpatient Operating Room Cases 7,449 7,326 1.7% Total Operating Room Cases 11,538 11,163 3.4% Emergency Department Visits 39,298 39,935 -1.6% Case Mix Index (all payors using Medicare weights) 1.9933 1.9423 2.6% RVUs 1,463,231 1,390,507 5.2%
CURRENT OPERATING PROFILE
The information in this disclosure describes an integrated clinical, research and academic enterprise headquartered in Winston-Salem, North Carolina, and commonly known as Wake Forest Baptist, which includes:
• an academic medical center, currently licensed for 885 acute care beds, which is a tertiary and quaternary acute care regional referral center with a service area population of approximately 2,500,000 (“WFB - Main Campus”);
• a hospital facility located approximately 26 miles south of WFB – Main Campus, in Lexington, North Carolina, currently licensed for 94 acute care beds (“WFB - Lexington Medical Center”);
• a hospital facility located approximately 25 miles southwest of WFB – Main Campus in Mocksville, North Carolina, currently licensed for 81 acute care beds ( “WFB - Davie Medical Center”);
• approximately 1,055 employed physicians;
• teaching and research operations; and
• a non-acute and ambulatory network with over 200 sites of patient care.
Wake Forest Baptist’s annual outpatient visits exceed 1.2 million. Its degree-granting educational programs annually train over 1,900 students in health care-related fields and it receives nearly $170 million annually in research funding from federal and state agencies, industry and other sources.

QUARTERLY DISCLOSURE September 30, 2016
6
Combined Group
The term “Wake Forest Baptist” refers to the entirety of the integrated clinical, research and academic enterprise described above, including the entities that own and operate the enterprise, which are:
• Wake Forest University Baptist Medical Center (“WFBMC”), North Carolina Baptist Hospital (“NCBH”) and Wake Forest University Health Sciences (“WFUHS,” and collectively with WFMBC and NCBH, the “Members of the Obligated Group”);
• the Designated Members, entities controlled by one or more Members of the Obligated Group and include WFB-Lexington Medical Center, WFB-Davie Medical Center, and 16 dialysis centers (such Designated Members and the Members of the Obligated Group are collectively referred to as the “Combined Group”), and
• all other entities and operations that are combined into the financial statements.
As of September 30, 2016, the Combined Group generated in the aggregate 93.3% of Wake Forest Baptist’s unrestricted revenue, and the Combined Group owned in the aggregate 96.8% of Wake Forest Baptist’s unrestricted net assets.
_________
Wake Forest University is not a Member of the Obligated Group under the Master Indenture and does not have any liability or obligation for the payment of debt service on the outstanding bonds nor is Wake Forest University part of the Combined Group or Wake Forest Baptist.
WAKEFORESTBAPTIST
Combined Financial Statements for North Carolina Baptist Hospital and Affiliates, Wake Forest University Health Sciences and Affiliates, and Wake Forest University Baptist Medical Center and Affiliates
For the Period Ended September 30, 2016 (Unaudited)

WAKEFORESTBAPTIST
CombinedFinancialStatements
PeriodEndedSeptember30,2016
TableofContents
CombinedFinancialStatements
Combined Balance Sheets ................................................................................................................... FS‐1
Combined Statements of Operations and Changes in Net Assets (Unaudited) .................................. FS‐2
Combined Statements of Cash Flows (Unaudited) .............................................................................. FS‐4
Selected Notes to Combined Financial Statements ............................................................................ FS‐5
OtherFinancialInformation
Combining Balance Sheet Information (Unaudited) ....................................................................... .. FS‐21
Combining Statement of Operations and Changes in Net Assets Information (Unaudited) .......................................................................... FS‐22

WAKEFORESTBAPTISTCombined Balance Sheets
Dollars in thousands.
See accompanying notes to the combined financial statements. FS‐1
(Unaudited) (Audited)September 30, June 30,
2016 2016
AssetsCurrent assets:
Cash and cash equivalents $ 207,461 $ 236,366 Patient receivables, net 251,373 243,530 Accounts, grants, and notes receivable, net 75,772 80,178 Other current assets 64,353 51,409
Total current assets 598,959 611,483
Accounts, grants, and notes receivable, less current portion, net 50,101 35,115
Investments and assets whose use is limited 1,429,460 1,504,291 Property and equipment, net 1,081,263 1,045,464 Goodwill 69,445 69,463 Other assets 14,413 22,564
Total assets $ 3,243,641 $ 3,288,380
Liabilities and Net AssetsCurrent liabilities:
Accounts payable and accruals $ 90,109 $ 172,529 Accrued employee compensation 171,378 180,848 Estimated third‐party payer settlements, net 83,942 90,258 Deferred revenue 58,319 64,774 Current portion of long‐term debt 27,398 26,397 Other current liabilities 66,807 56,562
Total current liabilities 497,953 591,368
Notes payable, capital leases, and line of credit,net of current portion 130,188 91,148
Bonds payable, net of current portion 630,621 630,907 Retirement benefits 134,303 131,983 Other long‐term liabilities, net of current portion 95,288 117,593
Total liabilities 1,488,353 1,562,999
Net assets:Unrestricted 1,505,323 1,478,972 Temporarily restricted 73,252 71,694 Permanently restricted 167,845 165,882
Total net assets attributableto Wake Forest Baptist 1,746,420 1,716,548
Noncontrolling interest in affiliates 8,868 8,833
Total net assets 1,755,288 1,725,381
Total liabilities and net assets $ 3,243,641 $ 3,288,380

WAKEFORESTBAPTISTCombined Statements of Operations and Changes in Net Assets (Unaudited)
Dollars in thousands.
See accompanying notes to the combined financial statements. FS‐2
Period Ended September 30,2016 2015
Operating revenues and supportPatient service revenue (net of contractual
allowances and discounts) $ 596,792 $ 532,232 Provision for bad debts (46,414) (37,550) Net patient service revenue 550,378 494,682
Gifts, grants, and contracts 43,299 44,220 Net student tuition and fees 8,561 8,568 Investment return designated for current operations 6,527 8,004 Other sources 23,296 5,353 Net assets released from restrictions 6,871 6,335
Total operating revenues and support 638,932 567,162
Operating expensesSalaries and wages 296,473 250,447 Employee benefits 70,431 54,592 Purchased services 66,573 65,023 Clinical and laboratory supplies 106,519 91,384 Other operating expenses 55,668 56,945 Depreciation and amortization 30,593 30,072 Financing costs 6,759 6,148
Total operating expenses 633,016 554,611
Operating excess of revenues and supportover expenses 5,916 12,551
Nonoperating gains (losses)Losses from equity‐method affiliates (2,814) (306) Net investment gains (losses) 22,830 (57,045) Net gain on interest rate swap valuation 193 650 Other 388 ‐
Excess (deficiency) of revenues and gains overexpenses and losses before noncontrolling interest 26,513 (44,150)

WAKEFORESTBAPTISTCombined Statements of Operations and Changes in Net Assets, continued (Unaudited)
Dollars in thousands.
See accompanying notes to the combined financial statements. FS‐3
Period Ended September 30,2016 2015
Excess (deficiency) of revenues and gains over expenses and losses before noncontrolling interest 26,513 (44,150)
Noncontrolling interest $ (35) $ ‐
Excess (deficiency) of revenues and gains over expensesand losses attributable to Wake Forest Baptist 26,478 (44,150)
Pension and postretirement‐related lossesother than net periodic cost (24) (24)
Other (103) (155)
Change in unrestricted net assets 26,351 (44,329)
Temporarily restricted net assetsContributions 4,989 7,102 Investment return designated for restricted purposes 1,838 1,557 Net assets released from restrictions (6,871) (6,335) Net investment gain (loss) 1,602 (2) Other ‐ (248)
Change in temporarily restricted net assets 1,558 2,074
Permanently restricted net assetsContributions 1,728 481 Investment return reinvested in principal 45 263 Net investment gain (loss) 190 (7,506) Other ‐ 1
Change in permanently restricted net assets 1,963 (6,761)
Change in net assets attributableto Wake Forest Baptist 29,872 (49,016)
Net assets at beginning of period 1,716,548 1,714,696
Net assets attributable to Wake Forest Baptist at end of period 1,746,420 1,665,680
Change in net assets attributable tononcontrolling interest 35 ‐
Net assets attributable to noncontrollinginterest at beginning of period 8,833 ‐
Total net assets at end of period $ 1,755,288 $ 1,665,680

WAKEFORESTBAPTISTCombined Statements of Cash Flows (Unaudited)
Dollars in thousands.
See accompanying notes to the combined financial statements. FS‐4
Period Ended September 30,2016 2015
Operating activities and gains and lossesChange in net assets $ 29,907 $ (49,016) Adjustments to reconcile change in net assets to
net cash (used in) provided by operating activities:Depreciation and amortization 30,593 30,072 Amortization of bond premium (286) (344) (Gains) losses in value of interest rate swaps, net (193) 650 Losses from equity‐method affiliates 2,814 307 Loss (gains) on disposal of property and equipment 219 (98) Gifts and other revenue restricted for long‐term investing (1,773) ‐ Investment (gains) losses, net (33,032) 57,046 Changes in operating assets and liabilities:
Patient receivables, net (7,843) (6,601) Estimated third‐party payer settlements, net (6,316) 2,493 Accounts, grants, and notes receivable, net (10,580) 20,158 Other current assets (12,944) (4,442) Other assets 8,151 20,226 Accounts payable and accruals (82,420) (70,091) Accrued employee compensation (9,470) 6,546 Deferred revenues (6,455) 11,417 Other current liabilities 10,245 8,116 Retirement benefits 2,320 758 Other long‐term liabilities (22,112) (11,051)
Net cash (used in) provided by operating activities (109,175) 16,146
Investing activitiesNet sales and purchases of investments 105,049 4,640 Net additions to property and equipment (66,593) (22,592)
Net cash provided by (used in) investing activities 38,456 (17,952)
Financing activitiesPrincipal payments on debt (10,084) (4,137) Proceeds from issuance of debt 50,125 ‐ Proceeds from private gifts restricted for long‐term investing 1,773 ‐
Net cash provided by (used in) financing activities 41,814 (4,137)
Decrease in cash and cash equivalents (28,905) (5,943) Cash and cash equivalents at beginning of period 236,366 341,756
Cash and cash equivalents at end of period $ 207,461 $ 335,813

WAKEFORESTBAPTISTSelected Notes to Combined Financial Statements
September 30, 2016 Dollars in thousands.
FS‐5
1. OrganizationandSummaryofSignificantAccountingPoliciesa. Description of the Organization
The combined financial statements of the entities collectively known as Wake Forest Baptist (WFB) were prepared to comply with the terms of a Master Trust Indenture (MTI) as well as to capture the entirety of WFB’s financial position and results of operations.
Effective July 1, 2010, the Boards of Wake Forest University Health Sciences (WFUHS), North Carolina Baptist Hospital (NCBH), Wake Forest University Baptist Medical Center (WFUBMC) and Wake Forest University (WFU) approved the Medical Center Integration Agreement (the Integration Agreement or MCIA). The Integration Agreement allows for the leveraging of the combined resources of NCBH and WFUHS to fulfill a single mission: improve health and optimize performance of the combined organizations, while balancing patient care, education and research. NCBH and WFU are the members of WFUBMC.
The Integration Agreement created an integrated academic medical center that combines clinical care, education and research under a single management and debt structure, collectively referred to as WFB, which is governed by the board of WFUBMC. One of the nation’s preeminent academic medical centers, WFB is an integrated health care system that operates over 40 subsidiaries. It provides a continuum of care that includes primary care centers, outpatient rehabilitation centers and dialysis centers. To ensure alignment across the organization, NCBH and WFUHS unrestricted operating income is shared equally between the entities. Although the entities will be operated to maximize value at the total WFB level, revenues, expenses, existing and new assets and debt will continue to be accounted for generally at the individual entity levels.
Effective March 26, 2011, NCBH, WFUHS, and WFUBMC formed a single obligated group (Obligated Group) under the existing MTI. The separate WFUHS master trust indenture was discharged and new obligations were issued to WFUHS obligation holders under the MTI. In addition, substantially all of the subsidiaries of NCBH, WFUHS, and WFUBMC were included in the single credit group (Combined Group) as Designated Members. Under the new credit structure, each member of the Obligated Group is jointly and severally liable for all debt and other obligations that are evidenced and secured under the MTI.
North Carolina Baptist Hopsital (NCBH) is a private, non‐profit institution dedicated to the provision of healthcare. NCBH, which is based in Winston‐Salem, North Carolina, consists of entities that provide services directly to patients and entities that support ancillary functions. NCBH consists of North Carolina Baptist Hospital, Davie County Emergency Health Corporation (DCH), CareNet, Inc. (CareNet), The Hawthorne Inn and Conference Center, Inc. (Hawthorne Inn), North Carolina Baptist Hospital Foundation (the Foundation), and Clemmons Medical Park LLC (CMP). NCBH owns a 50% equity interest in MedCost LLC (MedCost), a preferred provider organization which through the shared ownership agreements is accounted for as equity‐method investments in the combined financial statements. NCBH owns a 69.85% interest in Cornerstone Health Enablement Strategic Solutions, LLC (CHESS), which has been consolidated in the combined financial statements.

WAKEFORESTBAPTISTSelected Notes to Combined Financial Statements, continued
September 30, 2016 Dollars in thousands.
FS‐6
WFUHS, a wholly‐owned affiliate of WFU, based in Winston‐Salem, North Carolina, is a private, coeducational, non‐profit institution of higher education and research dedicated to medical and health education, healthcare, and biomedical research. WFUHS’ consolidated financial statements include the financial statements of WFUHS and its wholly owned affiliates, which are The Dialysis Centers of Wake Forest University (Dialysis); Wake Forest University Baptist Medical Center Community Physicians (Community Physicians); Wake Forest Ambulatory Ventures LLC; Wake Forest Innovation Quarter Development Co.; Wake Forest Innovation Quarter CDC; Wake Forest Innovation Quarter Management Co.; WFIQ Holdings, LLC; WFIQ Holdings II, LLC; WFIQ Holdings III, LLC; Seed Stage Associates, LLC; BRF – A 1, LLC; BRF Deck 1, LLC; and BRF – A 1a, LLC; and Childress Institute for Pediatric Trauma; North District Owners Association. NCBH and WFUHS each own a 50% equity interest in Dialysis Access Group of Wake Forest University, LLC (DAG) and in NCBH Outpatient Endoscopy Center, LLC, and The Medical Foundation of WFUHS & NCBH, and each own a 37.5% equity interest in Wake Forest Baptist Imaging, LLC (WFBI).
WFUBMC is the sole member of Lexington Medical Center (LMC), Northwest Community Care Network (NCCN), FaithHealthInnovations, Inc., and Cornerstone Health Care LLC (CHC).
All significant intercompany accounts and transaction have been eliminated in the combined financial statements.
b. Basis of Presentation
The combined financial statements for WFB have been prepared on the accrual basis of accounting in conformity with U.S. generally accepted accounting principles (GAAP). In accordance with Financial Accounting Standards Board (FASB) accounting standards for consolidated and combined financial statements, the financial statements and related notes are presented as combined statements due to the Integration Agreement. Intercompany transactions and balances are eliminated in combination.
Net assets and revenues, gains, and losses are classified based on the existence or absence of donor imposed restrictions. Accordingly, net assets of WFB and changes therein are classified and reported as follows:
Unrestricted Net Assets – Net assets that are not subject to donor imposed stipulations.
Temporarily Restricted Net Assets – Net assets subject to donor imposed stipulations that will be met by actions of WFB and/or by the passage of time.
Permanently Restricted Net Assets – Net assets subject to donor‐imposed stipulations that the assets be maintained permanently by WFB. Generally, the donors of these assets permit WFB to use all or part of the income earned on related investments for general or specific purposes.

WAKEFORESTBAPTISTSelected Notes to Combined Financial Statements, continued
September 30, 2016 Dollars in thousands.
FS‐7
Revenues are reported as increases in unrestricted net assets unless their use is limited by donor‐imposed restrictions. Contributions which impose restrictions that are met in the same fiscal year they are received are reported as increases in unrestricted net assets. Expenses are reported as decreases in unrestricted net assets. Gains and losses on investments and other assets or liabilities are reported as increases or decreases, respectively, in unrestricted net assets unless their use is restricted by explicit donor stipulations or by law. Expirations of restrictions on net assets (i.e., the donor‐stipulated purpose has been fulfilled and/or the stipulated time period has elapsed) are reported as reclassifications from temporarily restricted net assets to unrestricted net assets.
c. Cash Equivalents
Cash equivalents include highly liquid investments with original maturities at the date of purchase of three months or less and primarily consist of money market funds and bank accounts. WFB maintains cash balances at various financial institutions. The accounts are insured by the Federal Deposit Insurance Corporation up to $250,000. At times, the amounts on deposit with these financial institutions exceed the insured limit.
d. Investments and Assets Limited as to Use
Investments in debt and equity securities, inclusive of assets whose use is limited, are reported at fair value. Investments in joint ventures are accounted for using the equity method. Direct real estate investments are recorded at cost less accumulated depreciation.
Gains, losses, and investment income are included in excess (deficiency) of revenues and gains over expenses and losses unless their use is restricted by donor or law.
Investments in alternative investments may include derivative products that are reported at fair value. The investments may individually expose WFB to securities lending, short sales, and trading in futures and forward contract options, and other derivative products. WFB’s risk is limited to its carrying value of the instruments. These instruments can only be divested at specific times or based on specific triggering events.
WFB’s split‐interest agreements with donors consist primarily of irrevocable charitable remainder trusts and charitable gift annuities for which WFB serves as trustee. Assets held in these trusts are stated at fair value and are included in investments and assets whose use is limited in the combined balance sheets. Contribution revenues are recognized at the dates the trusts are established. WFB records the change in value of split‐interest agreements according to the fair value of assets that are associated with each trust and recalculates the liability for the present value of annuity obligations. Any change in fair value is recognized in the combined statements of operations and changes in net assets.
WFB is the beneficiary of certain trusts and other assets held and administered by others. WFB’s share of these assets is recorded at fair value as investments with carrying values adjusted annually for changes in fair value.

WAKEFORESTBAPTISTSelected Notes to Combined Financial Statements, continued
September 30, 2016 Dollars in thousands.
FS‐8
e. Property and Equipment
Property and equipment are recorded at cost at the date of acquisition, or estimated fair market value on the date received for donated items. Depreciation is recorded on the straight line method over the estimated useful life of each class or component of depreciable asset. Estimated lives range from 1 to 50 years. Depreciation is not recorded on land and construction in progress. Gains or losses on the disposal of property and equipment are included in other operating expenses in the combined statements of operations and changes in net assets. Interest cost incurred on borrowed funds during the period of construction of capital assets is capitalized as a component of the cost of acquiring these assets.
Estimated Useful Lifein Years
Land improvements 3‐25Buildings and other improvements 3‐50Fixed and movable equipment 1‐25
f. Asset Retirement Obligations
WFB has asset retirement obligations arising from regulatory requirements to perform certain asset retirement activities at the time that certain buildings and equipment are disposed of or renovated. The liability was initially measured at fair value and subsequently is adjusted for accretion expense and changes in the amount or timing of the estimated cash flows. The corresponding asset retirement costs are capitalized as part of the carrying amount of the related long lived asset and depreciated over the asset’s useful life.
WFB reviews long‐lived assets for impairment whenever events or changes in circumstances indicate that the carrying amount of an asset may not be recoverable. WFB recognizes an impairment charge when the fair value of the asset or group of assets is less than the carrying value.
g. Defined Benefit Plans
WFB records annual amounts relating to its defined benefit plans based on calculations that incorporate various actuarial and other assumptions, including discount rates, mortality, turnover rates, rate of return, and healthcare cost trend rates. Management reviews its assumptions on an annual basis and makes modifications to the assumptions based on current rates and trends when it is appropriate to do so. The effect of modifications to those assumptions is recorded in other changes in net assets and amortized to net periodic pension benefit (cost) over future periods using the corridor method. Management believes that the assumptions used in recording its obligations under the plans are reasonable based on its experience and market conditions.
The net periodic pension benefit (cost) is recognized as employees render the services necessary to earn the benefits.

WAKEFORESTBAPTISTSelected Notes to Combined Financial Statements, continued
September 30, 2016 Dollars in thousands.
FS‐9
h. Derivative Instruments
WFB records all derivative instruments other than interest rate swaps in investments and assets whose use is limited on the combined balance sheets at their respective fair values. WFB records its interest rate swap agreement as part of other assets or liabilities in the accompanying combined balance sheets at fair value. All changes in fair value are reflected in the combined statements of operations and changes in net assets.
i. Revenue Recognition
WFB’s revenue recognition policies are:
Net Patient Service Revenue – Net patient service revenue is reported at the estimated net realizable amounts due from patients, third‐party payers, and others for services rendered, including estimated retroactive adjustments under reimbursement agreements with third‐party payers and contractual adjustments. Retroactive adjustments are accrued on an estimated basis in the period the related services are rendered and will be adjusted in future periods as interim or final settlements are determined.
Charity Care – WFB cares for patients who meet certain criteria under its charity care policy without charge or at amounts less than its established rates. WFB does not pursue collection of amounts determined to qualify as charity care and, accordingly, such amounts are not reported in net patient service revenue.
Gifts, Grants and Contracts – Revenues under grants and contracts with private and governmental sponsoring organizations are deferred until expenses are incurred. The revenues include recoveries of direct and indirect costs, which are generally determined as a negotiated or agreed‐upon percentage of direct costs with certain exclusions.
Net Student Tuition and Fees – Net student tuition and fees are recorded as revenue during the year that the related services are rendered. Student tuition and fees received in advance of services to be rendered are recorded as deferred revenue. Student aid provided by WFB is reflected as a reduction of student tuition and fee revenue. Student aid does not include payments made to students for services rendered to WFB.

WAKEFORESTBAPTISTSelected Notes to Combined Financial Statements, continued
September 30, 2016 Dollars in thousands.
FS‐10
j. Contributions
Contributions, including unconditional promises to give, are recognized as revenues in the period received. Contributions restricted for capital projects or other purposes, permanent endowment funds and contributions under split‐interest agreements or perpetual trusts are reported as nonoperating activities. Conditional promises to give are not recognized until they become unconditional, that is, when the conditions on which they depend are substantially met. Contributions of assets other than cash are recorded at their estimated fair value. Contributions to be received after one year, net of an allowance for uncollectible contributions receivable, are discounted to their present value at a risk‐adjusted rate, which approximates fair value (Level 3). Amortization of discounts is recorded as additional contribution revenue in accordance with donor imposed restrictions, if any, on the contributions. An allowance for uncollectible contributions receivable is accrued based on management’s judgment, including such factors as prior collection history, type of contribution, relationship with the donor, and nature of fundraising activity.
k. HITECH Incentive Funding for Meaningful Use of Electronic Health Records (EHR)
The American Recovery and Reinvestment Act of 2009 (ARRA) established incentive payments under the Medicare and Medicaid programs for certain healthcare providers that use certified EHR technology. The program is commonly referred to as the Health Information Technology for Economic and Clinical Health (HITECH) Act. To qualify for incentives under the HITECH Act, healthcare providers must meet designated EHR meaningful use criteria as defined by the Centers for Medicare and Medicaid Services (CMS). Incentive payments are awarded to healthcare providers who have attested to CMS that applicable meaningful use criteria have been met. Compliance with meaningful use criteria is subject to audit by the federal government or its designee, and incentive payments are subject to adjustment in a future period.
WFB recognizes revenue for EHR incentive payments in the period in which it has obtained reasonable assurance that it is in compliance with the applicable EHR meaningful use requirements. Accordingly, for the period ended September 30, 2016 and the fiscal year ended June 30, 2016, WFB recognized EHR incentives of approximately $110 and $3,980, respectively, which are included in other sources of revenue (separate from net patient service revenue) in the combined statements of operations and changes in net assets.
l. Excess of Revenues and Gains Over Expenses and Losses
The combined statements of operations and changes in net assets include excess of revenues and gains over expenses and losses. Changes in unrestricted net assets that are excluded from excess of revenue and gains over expenses and losses, consistent with industry practice, include transfers of assets to and from affiliates for other than goods and services, change in pension and postretirement plan liabilities, and capital contributions.

WAKEFORESTBAPTISTSelected Notes to Combined Financial Statements, continued
September 30, 2016 Dollars in thousands.
FS‐11
WFB differentiates its operating activities through the use of operating excess of revenues and support over expenses as an intermediate measure of performance. Items that management does not consider to be components of WFB’s operating activities are excluded from operating excess and reported as nonoperating items in the combined statements of operations. These include investment returns (realized and unrealized net gains and losses on investments, interest, and dividends) in excess of or less than WFB’s approved endowment distribution, other than designated returns on assets held for self‐insurance purposes; net gains and losses on interest rate swaps; losses on extinguishment of debt; gains and losses from equity method affiliates; gains and losses on disposal of property and equipment; and other incidental transactions.
m. Income Taxes
WFB includes two primary organizations, NCBH and WFUHS, both of which are tax‐exempt organizations as described in Section 501(c)(3) of the Internal Revenue Code (the Code) and are generally exempt from federal income taxes on related income pursuant to Section 501(a) of the Code. Accordingly, no provision for income taxes is made in the combined financial statements. If applicable, unrelated business income is reported by all member and subsidiary organizations on IRS Form 990‐T. Fiscal years ending on or after June 30, 2013 remain subject to examination by federal and state tax authorities. WFB has evaluated uncertain tax positions for its period ended September 30, 2016 and fiscal year ended June 30, 2016, including a quantification of tax risks in areas such as unrelated business income and taxation of its for‐profit subsidiaries. This evaluation did not have a material effect on WFB’s combined financial statements for the period ended September 30, 2016 and the fiscal year ended June 30, 2016.
n. Use of Estimates
WFB prepares its combined financial statements in accordance with GAAP, which requires management to make estimates and assumptions relating to the reporting of assets and liabilities and the disclosure of contingent assets and liabilities at the date of the combined financial statements and the reported amounts of revenues and expenses during the reporting period. Significant items subject to such estimates and assumptions include the carrying amount of land, buildings, and equipment, valuation allowances for receivables, environmental liabilities, fair value of investments and assets whose is limited, obligations related to employee benefits, third‐party payer settlements, and the ultimate cost of asserted and unasserted malpractice claims. Actual results could differ from those estimates.
o. Reclassifications
Certain reclassifications have been made to the financial statement presentation of the period ended September 30, 2016 and the fiscal year ended June 30, 2016, to correspond to the current year’s format. Net assets are unchanged due to these reclassifications.

WAKEFORESTBAPTISTSelected Notes to Combined Financial Statements, continued
September 30, 2016 Dollars in thousands.
FS‐12
p. New Accounting Pronouncements
In May 2014, the FASB issued Accounting Standards Update (ASU) 2014‐09, Revenue from Contracts with Customers (Topic 606). This ASU establishes principles for reporting useful information to users of financial statements about the nature, amount, timing, and uncertainty of revenue and cash flows arising from the entity’s contracts with customers. Particularly, that an entity recognizes revenue to depict the transfer of promised goods or services to customers in an amount that reflects the consideration to which the entity expects to be entitled in exchange for those goods or services. ASU 2014‐09 is effective for fiscal year 2019. WFB expects to record a decrease in net patient service revenue related to self‐pay patients and a corresponding decrease in bad debt expense upon adoption of the standard.
In January 2016, the FASB issued ASU 2016‐01, Recognition and Measurement of Financial Assets and Financial Liabilities. This ASU removes the requirement to disclose the fair value of financial instruments that are measured at amortized cost. WFB adopted ASU 2016‐01 in 2016 and removed the fair value disclosure for its fixed rate debt.
In February 2016, the FASB issued ASU 2016‐02, Leases (Topic 842). This ASU requires the recognition of lease assets and lease liabilities by lessees for those leases classified as operating leases under previous GAAP which have terms of greater than 12 months. This ASU defines a lease as a contract, or part of a contract, that conveys the right to control the use of identified property, plant, or equipment (an identified asset) for a period of time in exchange for consideration. This ASU retains a distinction between finance leases and operating leases. The result of retaining a distinction between finance leases and operating leases in the statement of operations and the statement of cash flows is largely unchanged from previous GAAP. ASU 2016‐02 is effective for fiscal year 2021. WFB expects to record an increase in lease assets and lease liabilities presented in the combined balance sheets.
In August 2016, the FASB issued ASU 2016‐14, Not‐for‐Profit Entities (Topic 958). This ASU changes certain presentation requirements for not‐for‐profit entities’ financial statements in an effort to make information more meaningful for users. This ASU removes the requirement to distinguish between resources with temporary and permanent restrictions on the face of the financial statements and replaces this with a requirement to present two classes of net assets – with and without donor restrictions. Additionally, the ASU requires expenses to be presented by their natural and functional classifications. The guidance also requires that investment returns be presented net of external and direct internal investment expenses and eliminates the requirements for disclosures of the components of investment returns. ASU 2016‐14 is effective for fiscal year 2018.
q. Limitations on Disclosures in Interim Reporting
Many disclosures ordinarily included in financial statements prepared in accordance with GAAP have been omitted. If the omitted disclosures were included in the financial statements, they might influence the user’s conclusions about the organizations assets, liabilities, net assets, revenues, and expenses. Accordingly, the financial statements are not designed for those who are not informed about such matters.

WAKEFORESTBAPTISTSelected Notes to Combined Financial Statements, continued
September 30, 2016 Dollars in thousands.
FS‐13
2. InvestmentsandAssetsWhoseUseisLimited
Investments and assets whose use is limited consist of the following:
September 30, June 30,2016 2016
Short‐term investments (a) $ 73,794 $ 154,836 Absolute return (b) 456,372 441,491 Commodities (c) 26,824 30,109 Fixed income (d) 350,317 349,189 Private equity (e) 793 948 Public equity (f) 369,565 372,489 Real estate (g) 16,293 17,686 Pooled investments held at WFU (h) 6,287 7,816 Beneficial interest in perpetual trusts and
assets held by others (i) 17,953 17,895 Other (j) 111,262 111,832
Total investments and assets whose use is limited $ 1,429,460 $ 1,504,291
(a) Short‐term investments – includes cash and cash equivalents, and money market mutual funds.
(b) Absolute return – includes investments in hedge funds and hedge fund‐of‐funds that invest both long and short on a global basis primarily in a wide range of securities and other instruments, including equity securities (common stocks), credit securities (both investment grade and non‐investment grade), commodities, private equity, currencies, futures contracts, options, and other derivative instruments. This class also includes absolute return mutual funds and exchange traded funds. The investment objective of this asset class is to produce attractive long‐term risk‐adjusted returns with low correlation to traditional asset classes.
(c) Commodities – includes investments in hedge funds and hedge fund‐of‐funds that invest in a wide range of commodities, securities, and financial instruments with a focus on commodities markets. This class also includes commodity (i.e., precious metals, industrial materials and energy) mutual funds and exchange traded funds. The investment objective of this class is to produce attractive long‐term risk‐adjusted returns in excess of traditional commodity index exposure.
(d) Fixed income – includes corporate bonds, mortgage‐backed securities, asset‐backed securities, mutual funds, exchange traded funds, and other fixed income securities. This class also includes investments in hedge funds and hedge fund‐of‐funds that invest in fixed income securities.
(e) Private equity – includes various illiquid venture capital investments.

WAKEFORESTBAPTISTSelected Notes to Combined Financial Statements, continued
September 30, 2016 Dollars in thousands.
FS‐14
(f) Public equity – includes investments primarily in U.S. and non‐U.S. (including emerging markets) common stocks, mutual funds, and exchange traded funds. This class also includes investments in hedge funds and hedge fund‐of‐funds that invest on both a long and short basis in global equity markets. The investment objective for this class is capital appreciation over the long term.
(g) Real estate – includes direct investments in commercial and residential real estate, as well as real estate mutual funds and exchange traded funds.
(h) Pooled investments held at WFU – includes primarily alternative investment vehicles and other investment interests.
(i) Beneficial interest in perpetual trusts and assets held by others – includes trusts and certain other assets held and administered by others for which WFB has an unconditional right to receive all or a portion of the specified cash flows.
(j) Other – includes primarily investment in equity‐method affiliates and other miscellaneous investments.
During fiscal year 2015, Verger Capital Management, LLC, established a separate fund for WFUHS and other outside entities, called Verger Fund II LLC. A significant share of WFUHS' interest in the WFU investment pool was transferred from the pool to Verger Fund II LLC and other WFUHS investment accounts. Investments remaining in the WFU investment pool will be transferred to Verger Fund II LLC, and other WFUHS investments accounts as those investments mature. WFUHS' investment in Verger Fund II LLC is included in investments in the accompanying combined balance sheets.
WAKEFORESTBAPTISTSelected Notes to Combined Financial Statements, continued
September 30, 2016 Dollars in thousands.
FS‐15
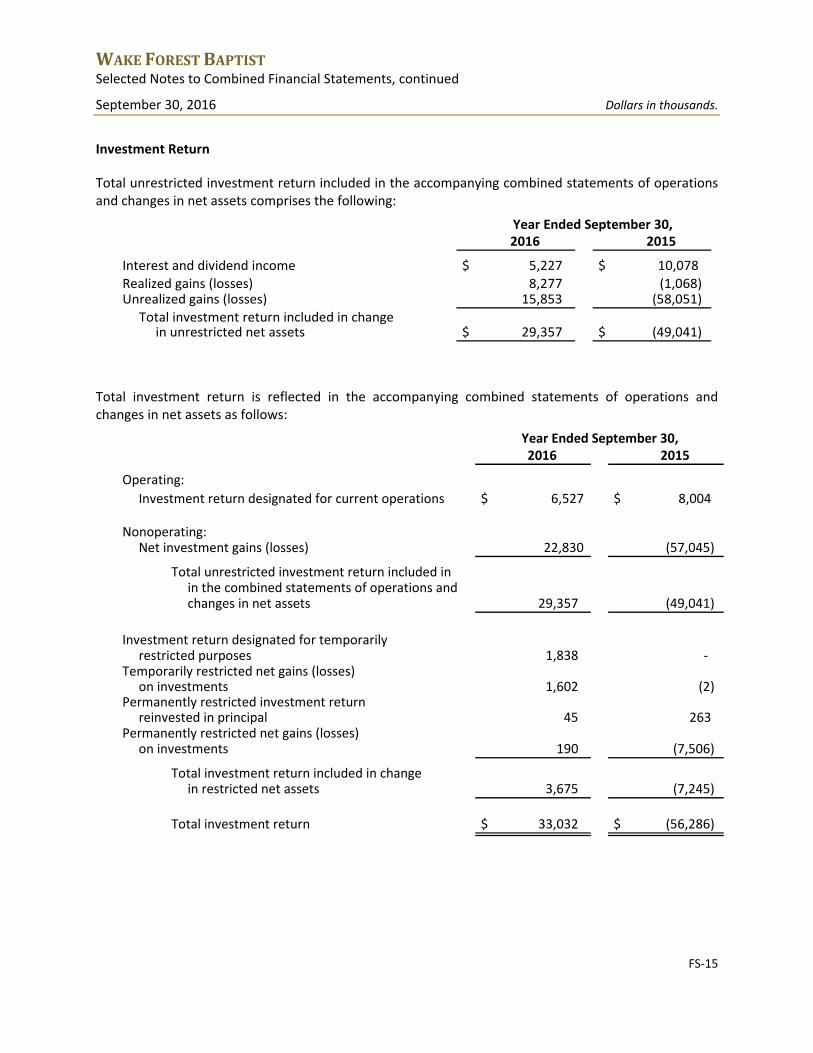
Investment Return
Total unrestricted investment return included in the accompanying combined statements of operations and changes in net assets comprises the following:
2016 2015
Interest and dividend income $ 5,227 $ 10,078 Realized gains (losses) 8,277 (1,068) Unrealized gains (losses) 15,853 (58,051)
Total investment return included in changein unrestricted net assets $ 29,357 $ (49,041)
Year Ended September 30,
Total investment return is reflected in the accompanying combined statements of operations and changes in net assets as follows:
2016 2015
Operating:Investment return designated for current operations $ 6,527 $ 8,004
Nonoperating:Net investment gains (losses) 22,830 (57,045)
Total unrestricted investment return included in in the combined statements of operations andchanges in net assets 29,357 (49,041)
Investment return designated for temporarilyrestricted purposes 1,838 ‐
Temporarily restricted net gains (losses)on investments 1,602 (2)
Permanently restricted investment return reinvested in principal 45 263
Permanently restricted net gains (losses)on investments 190 (7,506)
Total investment return included in changein restricted net assets 3,675 (7,245)
Total investment return $ 33,032 $ (56,286)
Year Ended September 30,
WAKEFORESTBAPTISTSelected Notes to Combined Financial Statements, continued
September 30, 2016 Dollars in thousands.
FS‐16
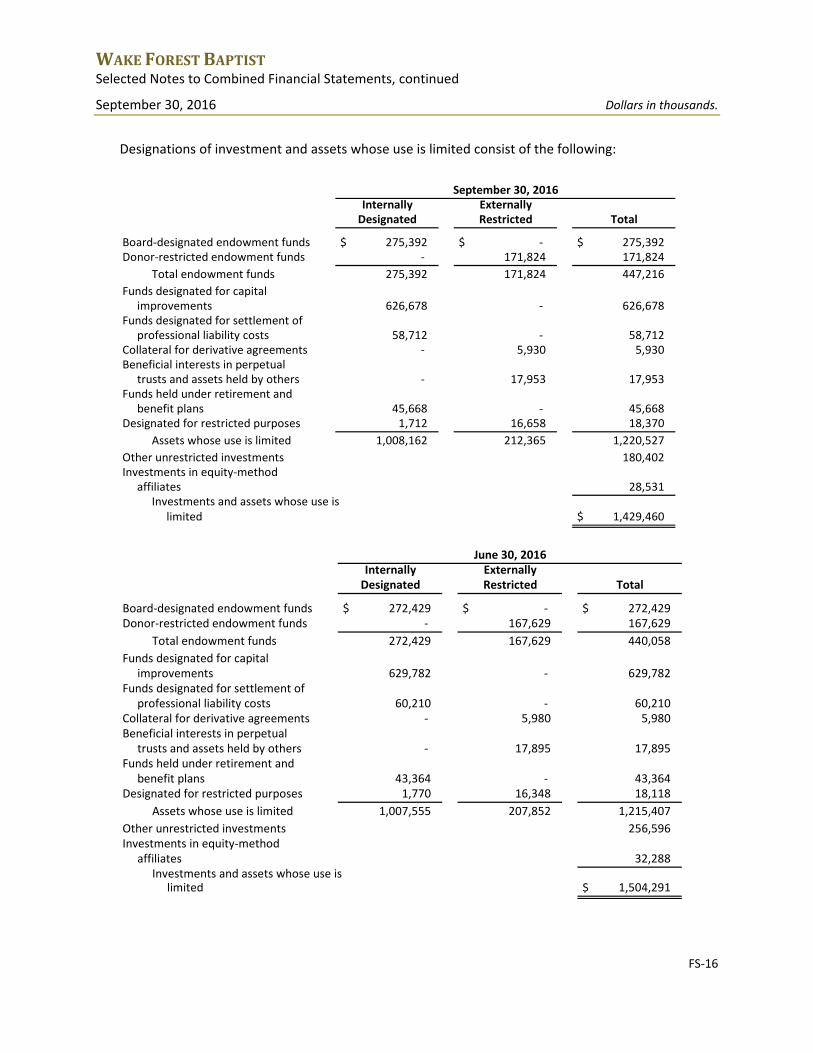
Designations of investment and assets whose use is limited consist of the following:
September 30, 2016
Internally ExternallyDesignated Restricted Total
Board‐designated endowment funds $ 275,392 $ ‐ $ 275,392 Donor‐restricted endowment funds ‐ 171,824 171,824
Total endowment funds 275,392 171,824 447,216 Funds designated for capital
improvements 626,678 ‐ 626,678 Funds designated for settlement of
professional liability costs 58,712 ‐ 58,712 Collateral for derivative agreements ‐ 5,930 5,930 Beneficial interests in perpetual
trusts and assets held by others ‐ 17,953 17,953 Funds held under retirement and
benefit plans 45,668 ‐ 45,668 Designated for restricted purposes 1,712 16,658 18,370
Assets whose use is limited 1,008,162 212,365 1,220,527 Other unrestricted investments 180,402 Investments in equity‐method
affiliates 28,531 Investments and assets whose use is
limited $ 1,429,460
June 30, 2016Internally ExternallyDesignated Restricted Total
Board‐designated endowment funds $ 272,429 $ ‐ $ 272,429 Donor‐restricted endowment funds ‐ 167,629 167,629
Total endowment funds 272,429 167,629 440,058 Funds designated for capital
improvements 629,782 ‐ 629,782 Funds designated for settlement of
professional liability costs 60,210 ‐ 60,210 Collateral for derivative agreements ‐ 5,980 5,980 Beneficial interests in perpetual
trusts and assets held by others ‐ 17,895 17,895 Funds held under retirement and
benefit plans 43,364 ‐ 43,364 Designated for restricted purposes 1,770 16,348 18,118
Assets whose use is limited 1,007,555 207,852 1,215,407 Other unrestricted investments 256,596 Investments in equity‐method
affiliates 32,288 Investments and assets whose use is
limited $ 1,504,291

WAKEFORESTBAPTISTSelected Notes to Combined Financial Statements, continued
September 30, 2016 Dollars in thousands.
FS‐17
3. Debt
Debt consists of the following:
September 30, June 30,2016 2016
Series 2012A (a) $ 118,405 $ 118,405 Series 2012A Unamortized Bond Premium 3,904 3,938 Series 2012A Bond Issuance Costs (973) (981)
Series 2012B (a) 102,155 102,155 Series 2012B Unamortized Bond Premium 13,418 13,613 Series 2012B Bond Issuance Costs (787) (799)
Series 2012C (a) 52,615 52,615 Series 2012C Bond Issuance Costs (387) (393)
Series 2012D (a) 80,000 80,000 Series 2012D Bond Issuance Costs (104) (105)
Series 2010 (b) 272,275 272,275 Series 2010 Unamortized Bond Premium 8,236 8,353 Series 2010 Bond Issuance Costs (2,416) (2,450)
Total bonds payable 646,341 646,626 Line of credit (c) 24,738 26,007 Loan agreement (d) 13,176 13,675 Loan agreement (e) 52,500 54,000 Promissory note (f) 80 80 External notes (g) 567 611 Capital leases (h) 6,918 7,453 Capital leases (i) 43,887 ‐
Total notes payable and capital leases 141,866 101,826
Total debt 788,207 748,452
Less current portion (27,398) (26,397)
Total long‐term debt $ 760,809 $ 722,055

WAKEFORESTBAPTISTSelected Notes to Combined Financial Statements, continued
September 30, 2016 Dollars in thousands.
FS‐18
Debt is reflected in the combined balance sheets as follows:
September 30, June 30,2016 2016
Current portion of long‐term debt $ 27,398 $ 26,397 Notes payable and capital leases, net of current
portion 130,188 91,148 Bonds payable, net of current portion 630,621 630,907
Total debt $ 788,207 $ 748,452
(a) Series 2012 Revenue Bonds – revenue bonds issued by Wake Forest Baptist Obligated Group, representing funds borrowed by the entities pursuant to loan agreements with the North Carolina Medical Care Commission (NCMCC). As a conduit issuer, the NCMCC loans the debt proceeds to the borrower and the bonds are issued by the NCMCC under a MTI structure. The MTI provides the flexibility for multiple parties to participate in debt issuances as part of an obligated group.
The Series 2012A bonds mature in full in fiscal year 2046. The fixed rate instruments bear interest at fixed coupon rates of 4.00% and 5.00%. Per the bond agreements, the principal and sinking fund payments on the bonds are due on December 1 of each year beginning in 2039 and in increasing annual amounts ranging from $9,425 to $20,200.
The Series 2012B bonds mature in full in fiscal year 2034. The fixed rate instruments bear interest at fixed coupon rates ranging from 2.00% to 5.00%. Per the bond agreements, the principal and sinking fund payments on the bonds are due on December 1 of each year beginning in 2014 and in increasing annual amounts ranging from $3,385 to $7,000.
The Series 2012C bonds mature in full in fiscal year 2034. The bonds were issued in the Index Floating Rate Mode and bear interest at an Index Floating Rate based on the SIFMA Index plus a spread of 0.74%. At the option of WFUHS, the bonds may be converted to various interest rate modes. Per the bond agreements, the principal and sinking fund payments on the bonds are due on December 1 of each year beginning in 2014 and in increasing annual amounts ranging from $2,090 to $4,825.
The Series 2012D bonds were issued in an aggregate principal amount not to exceed $80,000 and mature in full in fiscal year 2043. The bonds were issued in the Bank‐Bought Rate Mode and bear interest at an Index Floating Rate based on an Adjusted London Interbank Offered Rate (LIBOR) rate plus a spread of 0.97%. At the option of NCBH, the bonds may be converted to various interest rate modes. Per the bond agreements, the principal and sinking fund payments on the bonds are due on December 1 of each year beginning in 2034 and in increasing annual amounts ranging from $14,075 to $15,295.

WAKEFORESTBAPTISTSelected Notes to Combined Financial Statements, continued
September 30, 2016 Dollars in thousands.
FS‐19
(b) Series 2010 Revenue Bonds – revenue bonds issued by NCBH, representing funds borrowed by the entities pursuant to loan agreements with the NCMCC. As a conduit issuer, the NCMCC loans the debt proceeds to the borrower and the bonds are issued by the NCMCC under an MTI structure. The MTI provides the flexibility for multiple parties to participate in debt issuances as part of an obligated group.
The Series 2010 bonds mature in full in 2034. Per the bond agreements, the principal and sinking fund payments on the bonds are due on June 1 of each year in increasing annual amounts ranging from $7,705 to $12,330. The fixed rate instruments bear interest at coupon rates ranging from 2.00% to 5.25%. The total all‐in yield rate on the Series 2010 bonds, without giving effect to outstanding swap agreements, is 4.71%.
(c) Line of credit – consists of an unsecured credit facility with a total borrowing capacity of $125,000 to provide for the working capital needs of NCBH, WFUHS, and WFUBMC, all Borrowers under the credit facility. The line of credit replaced a previously held line of credit with a total borrowing capacity of $160,000. The line of credit is due on June 23, 2018 and bears interest at the one‐month LIBOR plus 0.70%.
(d) Loan agreement – represents an unsecured loan agreement held by WFUHS, with a variable rate based on the one‐month LIBOR plus a premium of 0.65% for $20,014 to refinance two previously outstanding fixed rate notes. Fixed principal payments and accrued interest are due monthly with a final maturity date of April 1, 2023. This taxable loan is guaranteed by both NCBH and WFUBMC.
(e) Loan agreement – represents an unsecured loan agreement held by WFUBMC, with a variable rate based on the one‐month LIBOR plus a premium of 0.55% for $60,000 to refinance a portion of the previously outstanding line of credit. Fixed principal payments and accrued interest are due monthly with a ten‐year amortization and bullet maturity date of June 23, 2020. This taxable loan is guaranteed by both NCBH and WFUHS.
(f) Promissory note – represents a non‐interest bearing contractual lien against WFUHS, for $800 from the City of Winston‐Salem to provide grant funding for the construction of the Green Park Courtyard in the Piedmont Triad Research Park. The grant states that in the event that an additional $17,400 in taxable property value are created within the Park within 10 years, then the promissory note shall be marked satisfied and paid in full and canceled of record. Fixed payments of principal are due annually with a final maturity date of June 1, 2017.
(g) External notes – includes various notes payable held by WFB affiliates, with interest rates ranging from 3.38% to 9.29% and final maturities between 2017 and 2019.
(h) Capital leases – comprised of capital lease obligations held by NCBH, maturing at various dates through 2019. The obligations have fixed interest rates at 3.1% and are secured by leased equipment.
(i) Capital lease – represents a capital lease obligation of $44,125 held by WFUHS related to the Bowman Gray Center for Medical Education with an initial term of 15 years and additional renewal options. The obligation has a fixed interest rate at 4.5%.

WAKEFORESTBAPTISTSelected Notes to Combined Financial Statements, continued
September 30, 2016 Dollars in thousands.
FS‐20
Bonds issued under the MTI are payable solely from the Obligated Group’s revenues (as defined by the MTI). Additionally, the Combined Group must remain compliant with certain covenants and restrictions required by the MTI and loan agreements underlying the bonds. The Combined Group is subject to covenants under the MTI containing restrictions or limitations with respect to indebtedness, property encumbrance, consolidation or merger or transfer of assets. In addition, the Combined Group has agreed that it will not create any lien upon its property, accounts, or revenue now owned or hereafter acquired other than “permitted liens” as described in the MTI.

WAKEFORESTBAPTISTCombining Balance Sheet Information (Unaudited)
September 30, 2016 Dollars in thousands.
(1) Represents only those WFB entities that are Obligated Group members or Designated Members under the MTI. FS‐21
Non‐ TotalOther Subs Designated Combined
NCBH WFUHS LEXMC NWCCN WFUBMC and Affiliates Eliminations Total WFB Entities Eliminations Group (1)
AssetsCurrent assets:
Cash and cash equivalents $ 94,800 $ 15,938 $ 59,300 $ 5,396 $ 28,846 $ 3,181 $ ‐ $ 207,461 $ (13,010) $ ‐ $ 194,451 Patient receivables, net 172,121 60,671 7,448 ‐ 10,663 470 ‐ 251,373 (10,961) ‐ 240,412 Accounts, grants, and notes receivable, net 92,838 96,810 525 18 6,817 8,332 (129,568) 75,772 (13,053) 828 63,547 Other current assets 56,208 3,383 1,899 ‐ 55,828 76 (53,041) 64,353 5,417 ‐ 69,770
Total current assets 415,967 176,802 69,172 5,414 102,154 12,059 (182,609) 598,959 (31,607) 828 568,180
Accounts, grants, and notes receivable, net, long‐term 36,845 43,030 ‐ ‐ 3,633 ‐ (33,407) 50,101 ‐ 522 50,623 Investments and assets whose use is limited, long‐term 743,381 717,638 ‐ ‐ 69,656 144 (101,359) 1,429,460 (38,386) 39,960 1,431,034 Property and equipment, net 670,857 344,926 22,129 622 39,344 3,385 ‐ 1,081,263 (11,877) 18,953 1,088,339 Goodwill 51,586 1,505 420 ‐ 15,934 ‐ ‐ 69,445 (67,520) ‐ 1,925 Other assets 7,750 5,414 382 ‐ 867 ‐ ‐ 14,413 (2,651) ‐ 11,762
Total assets $ 1,926,386 $ 1,289,315 $ 92,103 $ 6,036 $ 231,588 $ 15,588 $ (317,375) $ 3,243,641 $ (152,041) $ 60,263 $ 3,151,863
Liabilities and Net AssetsCurrent liabilities:
Accounts payable and accruals $ 37,771 $ 55,227 $ 5,986 $ 541 $ 83,870 $ 2,266 $ (95,552) $ 90,109 $ (17,306) $ 416 $ 73,219 Accrued employee compensation 60,062 100,837 2,592 ‐ 7,777 110 ‐ 171,378 (8,026) ‐ 163,352 Estimated third‐party payer settlements 81,707 ‐ 2,235 ‐ ‐ ‐ ‐ 83,942 ‐ ‐ 83,942 Deferred revenue 577 57,571 ‐ ‐ 11 160 ‐ 58,319 (250) ‐ 58,069 Current portion of long‐term debt 11,910 9,063 ‐ ‐ 6,242 183 ‐ 27,398 (595) 412 27,215 Other current liabilities 37,001 23,157 528 ‐ 6,121 ‐ ‐ 66,807 (6,122) ‐ 60,685
Total current liabilities 229,028 245,855 11,341 541 104,021 2,719 (95,552) 497,953 (32,299) 828 466,482
Notes payable and capital leases, net ofcurrent portion 16,478 67,068 ‐ ‐ 46,500 142 ‐ 130,188 (906) 522 129,804
Bonds payable, net of current portion 469,608 161,013 ‐ ‐ ‐ ‐ ‐ 630,621 ‐ ‐ 630,621 Retirement benefits 95,769 38,534 ‐ ‐ ‐ ‐ ‐ 134,303 ‐ ‐ 134,303 Other long‐term liabilities 70,528 76,712 7,403 ‐ 61,061 49 (120,465) 95,288 (2,400) ‐ 92,888
Total liabilities 881,411 589,182 18,744 541 211,582 2,910 (216,017) 1,488,353 (35,605) 1,350 1,454,098
Net assets:Unrestricted 1,022,191 473,765 71,289 5,055 13,954 12,678 (93,609) 1,505,323 (116,436) 67,781 1,456,668 Temporarily restricted 3,681 61,913 1,166 440 6,052 ‐ ‐ 73,252 ‐ ‐ 73,252 Permanently restricted 2,486 164,455 904 ‐ ‐ ‐ ‐ 167,845 ‐ ‐ 167,845
Total net assets attributableto Wake Forest Baptist 1,028,358 700,133 73,359 5,495 20,006 12,678 (93,609) 1,746,420 (116,436) 67,781 1,697,765
Noncontrolling interest in affiliates 16,617 ‐ ‐ ‐ ‐ ‐ (7,749) 8,868 ‐ (8,868) ‐
Total net assets 1,044,975 700,133 73,359 5,495 20,006 12,678 (101,358) 1,755,288 (116,436) 58,913 1,697,765
Total liabilities and net assets $ 1,926,386 $ 1,289,315 $ 92,103 $ 6,036 $ 231,588 $ 15,588 $ (317,375) $ 3,243,641 $ (152,041) $ 60,263 $ 3,151,863

WAKEFORESTBAPTISTCombining Statement of Operations and Changes in Net Assets Information (Unaudited)
Period Ended September 30, 2016 Dollars in thousands.
(1) Represents only those WFB entities that are Obligated Group members or Designated Members under the MTI. FS‐22
Non‐ TotalOther Subs Designated Combined
NCBH WFUHS LEXMC NWCCN WFUBMC and Affiliates Eliminations Total WFB Entities Eliminations Group (1)
Operating revenues and supportPatient service revenue (net of contractual
allowances and discounts) $ 417,394 $ 124,187 $ 23,801 $ 1,943 $ 26,704 $ 2,763 $ ‐ $ 596,792 $ (29,136) $ ‐ $ 567,656 Provision for bad debts (39,232) (3,901) (2,283) ‐ (916) (82) ‐ (46,414) 997 ‐ (45,417)
Net patient service revenue 378,162 120,286 21,518 1,943 25,788 2,681 ‐ 550,378 (28,139) ‐ 522,239
Gifts, grants, and contracts 2,485 39,595 242 899 78 ‐ ‐ 43,299 (1,873) 250 41,676 Net student tuition and fees 428 8,133 ‐ ‐ ‐ ‐ ‐ 8,561 ‐ ‐ 8,561 Investment return designated for
current operations 322 6,125 ‐ ‐ 1 79 ‐ 6,527 (401) ‐ 6,126 Other sources 8,915 67,128 73 ‐ 9,802 13 (62,635) 23,296 (12,812) ‐ 10,484 Net assets released from restrictions 59 6,760 ‐ ‐ 52 ‐ ‐ 6,871 ‐ ‐ 6,871
Total operating revenues and support 390,371 248,027 21,833 2,842 35,721 2,773 (62,635) 638,932 (43,225) 250 595,957
Operating expensesSalaries and wages 130,127 137,624 7,888 ‐ 19,138 474 1,222 296,473 (22,668) ‐ 273,805 Employee benefits 29,637 33,594 2,388 ‐ 4,431 94 287 70,431 (5,310) ‐ 65,121 Purchased services 84,521 34,040 2,440 1,554 6,355 961 (63,298) 66,573 (7,605) ‐ 58,968 Clinical and laboratory supplies 87,534 11,052 4,039 ‐ 3,826 68 ‐ 106,519 (3,870) ‐ 102,649 Other operating expenses 29,079 17,237 1,417 1,045 7,450 286 (846) 55,668 (8,660) 250 47,258 Depreciation and amortization 20,286 8,107 913 20 1,164 103 ‐ 30,593 (1,058) ‐ 29,535 Financing costs 4,691 1,877 ‐ ‐ 188 3 ‐ 6,759 (211) 19 6,567
Total operating expenses 385,875 243,531 19,085 2,619 42,552 1,989 (62,635) 633,016 (49,382) 269 583,903
Operating excess (deficiency) of revenuesand support over expenses 4,496 4,496 2,748 223 (6,831) 784 ‐ 5,916 6,157 (19) 12,054
Nonoperating gains (losses)Gains (losses) from equity‐method affiliates (2,682) (3,319) ‐ ‐ ‐ ‐ 3,187 (2,814) ‐ (6,520) (9,334) Net investment (losses) gains 17,659 5,090 ‐ ‐ 18 63 ‐ 22,830 (593) 19 22,256 Unrealized losses on interest
rate swap valuation ‐ 193 ‐ ‐ ‐ ‐ ‐ 193 ‐ ‐ 193 Other (81) 469 ‐ ‐ ‐ ‐ ‐ 388 513 853 1,754
Excess (deficiency) of revenues andgains over expenses and losses 19,392 6,929 2,748 223 (6,813) 847 3,187 26,513 6,077 (5,667) 26,923

WAKEFORESTBAPTISTCombining Statement of Operations and Changes in Net Assets Information (Unaudited)
Period Ended September 30, 2016 Dollars in thousands.
(1) Represents only those WFB entities that are Obligated Group members or Designated Members under the MTI. FS‐23
Non‐ Total
Other Subs Designated Combined
NCBH WFUHS LEXMC NWCCN WFUBMC and Affiliates Eliminations Total WFB Entities Eliminations Group (1)
Excess (deficiency) of revenues andgains over expenses and losses $ 19,392 $ 6,929 $ 2,748 $ 223 $ (6,813) $ 847 $ 3,187 $ 26,513 $ 6,077 $ (5,667) $ 26,923
Noncontrolling interests 2 ‐ ‐ ‐ ‐ ‐ (37) (35) ‐ 35 ‐
Excess of revenues and gains over expensesand losses attributable to Wake Forst Baptist 19,394 6,929 2,748 223 (6,813) 847 3,150 26,478 6,077 (5,632) 26,923
Equity transfer from (to) affiliate ‐ ‐ ‐ ‐ ‐ ‐ ‐ ‐ ‐ ‐ ‐ Pension and postretirement‐related (loss)
gain other than net periodic pension cost (24) ‐ ‐ ‐ ‐ ‐ ‐ (24) ‐ ‐ (24) Other ‐ ‐ ‐ ‐ ‐ (422) 319 (103) 423 (318) 2
Change in unrestricted net assets 19,370 6,929 2,748 223 (6,813) 425 3,469 26,351 6,500 (5,950) 26,901
Temporarily restricted net assetsContributions 339 4,502 ‐ 128 20 ‐ ‐ 4,989 ‐ ‐ 4,989 Investment return designated for
restricted purposes ‐ 1,838 ‐ ‐ ‐ ‐ ‐ 1,838 ‐ ‐ 1,838 Net assets released from restrictions (59) (6,760) ‐ ‐ (52) ‐ ‐ (6,871) ‐ ‐ (6,871) Net investment (losses) gains 5 1,597 ‐ ‐ ‐ ‐ ‐ 1,602 ‐ ‐ 1,602
Change in temporarily restricted net assets 285 1,177 ‐ 128 (32) ‐ ‐ 1,558 ‐ ‐ 1,558
Permanently restricted net assetsContributions ‐ 1,728 ‐ ‐ ‐ ‐ ‐ 1,728 ‐ ‐ 1,728 Investment return reinvested in principal ‐ 45 ‐ ‐ ‐ ‐ ‐ 45 ‐ ‐ 45 Net investment losses (1) 191 ‐ ‐ ‐ ‐ ‐ 190 ‐ ‐ 190
Change in permanently restricted net assets (1) 1,964 ‐ ‐ ‐ ‐ ‐ 1,963 ‐ ‐ 1,963
Change in net assets (deficit) 19,654 10,070 2,748 351 (6,845) 425 3,469 29,872 6,500 (5,950) 30,422
Net assets at beginning of year 1,025,323 690,063 70,611 5,144 26,851 12,253 (104,864) 1,725,381 (122,936) 64,898 1,667,343
Net assets attributable to
Wake Forest Baptist at end of year 1,044,977 700,133 73,359 5,495 20,006 12,678 (101,395) 1,755,253 (116,436) 58,948 1,697,765
Change in net assets (deficit) attributable to noncontrolling interest (2) ‐ ‐ ‐ ‐ ‐ 37 35 ‐ (35) ‐
Total net assets at end of year $ 1,044,975 $ 700,133 $ 73,359 $ 5,495 $ 20,006 $ 12,678 $ (101,358) $ 1,755,288 $ (116,436) $ 58,913 $ 1,697,765