Embed Size (px)
Citation preview
December 25, 2007
Disclosure of Quarterly Data concerning Competition Review in the Telecommunications Business Field
The second quarter of FY2007 (as of the end of September 2007)
As a part of its competition review in the telecommunications business field, MIC has compiled
share data for the second quarter of FY2007 (as of the end of September 2007), and thus releases it.
Key Points
1. Fixed Communications
(1) Regarding the number of contracts for subscriber telephones (total of subscription contracts for
NTT subscriber telephones, telephone services that do not use NTT's local circuits, 0ABJ–IP
telephones, and cable telephony), the combined share of Nippon Telegraph and Telephone East
Corporation and Nippon Telegraph and Telephone West Corporation is on the decline, at 88.2%
(down 0.6% from the previous quarter).
(2) In terms of the telecommunications numbers allocated to IP telephony services (0AB–J numbers
and numbers with an 050 prefix), SoftBank BB Corp. accounts for 29.7% (down 1.6% from the
previous quarter), followed by the combined share of NTT East and NTT West with 27.2% (up 2.6%
from the previous quarter, or up 12.0% year-on-year), which outdid NTT Communications
Corporation with 20.3% (down 1.3%).
The combined share of NTT East and NTT West in the total number of calls using the 0AB–J
numbers is 75.3% (±0.0%).
2. Mobile Communications
Regarding the number of subscriptions for cellular telephones and PHS (Personal Handy-phone
System), the NTT DoCoMo Group accounts for 51.1% (down 0.5% from the previous quarter),
followed by KDDI with 28.0% (up 0.1%), SoftBank Mobile with 16.4% (up 0.5%), and PHS
(excluding the NTT DoCoMo Group) with 4.6% (±0.0%). Among the three mobile phone operators,
KDDI and SoftBank Mobile have increased their shares.
3. Internet Access
(1) In terms of the number of overall broadband subscriptions (a total of DSL, FTTH and cable
Internet), the combined share of NTT East and NTT West is on the rise, at 44.9% (up 0.9% from the
previous quarter).
(2) In terms of the number of subscriptions for DSL services on a nationwide basis, the combined
share of NTT East and NTT West is 37.4% (down 0.3% from the previous quarter), which is rivaled
by SoftBank BB at 37.4% (up 0.2%).
(3) With respect to the number of subscriptions for FTTH (fiber to the home; with optical fiber)
services, the combined share of NTT East and NTT West continues to increase to more than 70%, at
70.5% (up 0.6% from the previous quarter, or up 4.5% year-on-year), while power utility group
carriers account for 10.2% (up 0.1%) and KDDI accounts for 6.3% (down 0.2%).
Looking into types of buildings, the combined share of NTT East and NTT West is 77.8% (down
0.1%) for single-family housing and offices. As for collective housing, their share continues to grow
to more than 60%, at 60.9% (up 1.6% from the previous quarter, or up 8.3% year-on-year).
4. Corporate Network Services
The number of subscription for WAN services, such as IP-VPN, wide area Ethernet, and Mega Data
Netz of NTT East and West, numbered 740,000 (up 7.2% from the second half of FY2006). The
share of the NTT Group slightly dipped to 69.1% (down 0.2%).
*Since FY2003, MIC has been reviewing the state of competition in the telecommunications
business field. As part of that effort, MIC discloses quarterly data concerning the state of
competition in the telecommunications business field, based on reports from telecommunications
carriers.
+++++++++++++++
For further information about this press release, please fill in the inquiry form and submit it to MIC
on the website
http://www.soumu.go.jp/joho_tsusin/eng/contact.html
International Policy Division,
International Affairs Department
Telecommunications Bureau, MIC
TEL: +81 3 5253 5920 / FAX: +81 3 5253 5924
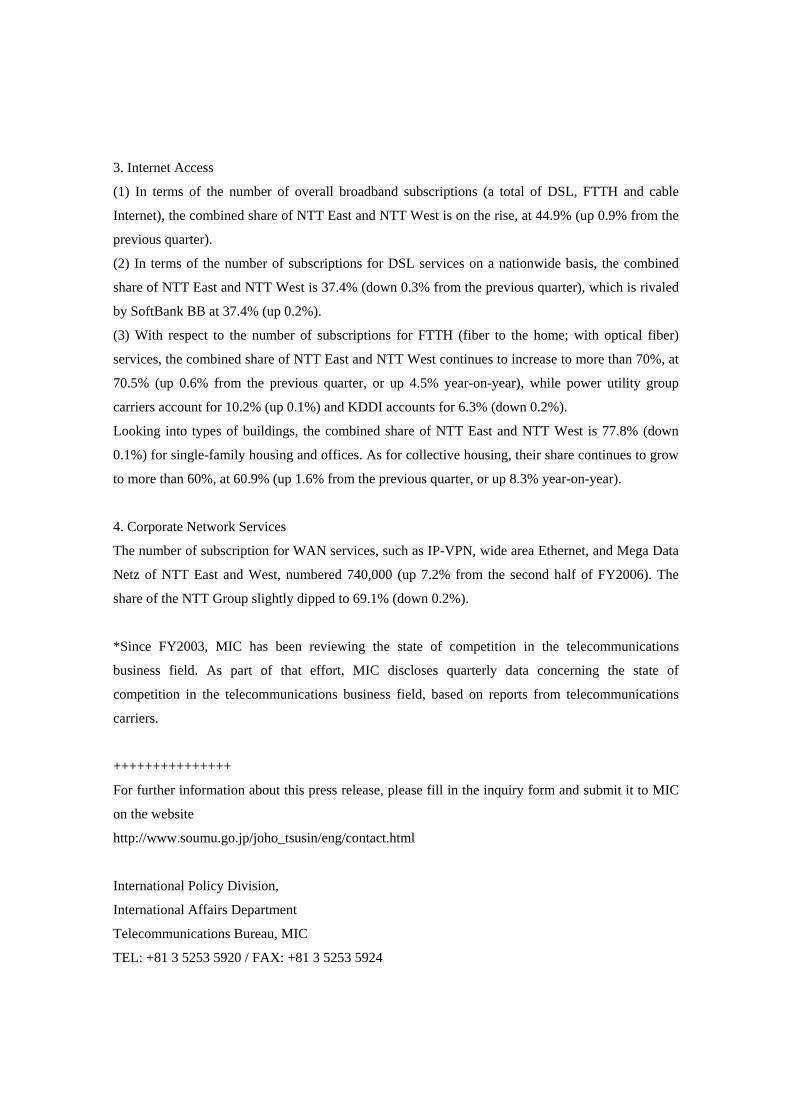
Attachment1 Fixed Communications
(1) Subscriber Telephones
Contracts for subscriber telephones (total of subscription contracts for NTT subscriber telephones, telephone services that do not use NTT’s local circuits, 0ABJ–IP telephones, and cable telephony) numbered 59.08 million as of the end of September 2007. Telephone services that do not use NTT’s local circuits (direct subscriber telephone services) and 0ABJ–IP telephones are on the rise at 4.48 million (up 4.9% from the previous quarter) and 5.75 million (up 15.0%), respectively.
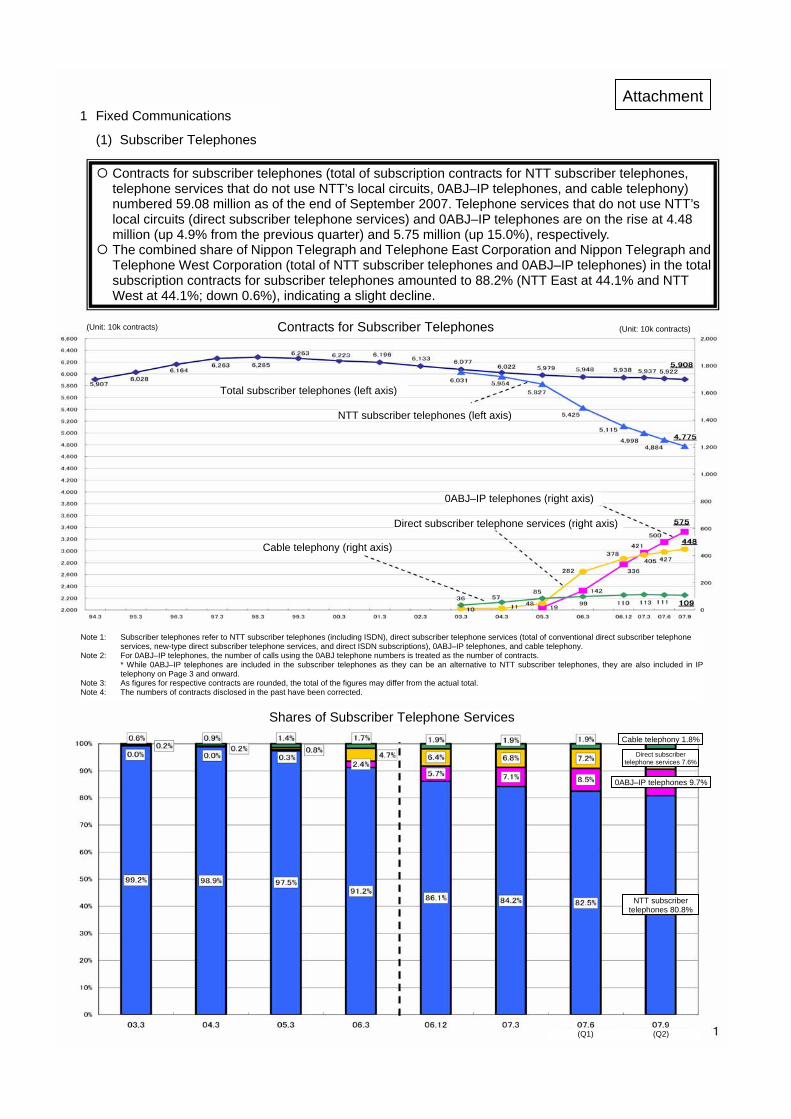
The combined share of Nippon Telegraph and Telephone East Corporation and Nippon Telegraph and Telephone West Corporation (total of NTT subscriber telephones and 0ABJ–IP telephones) in the total subscription contracts for subscriber telephones amounted to 88.2% (NTT East at 44.1% and NTT West at 44.1%; down 0.6%), indicating a slight decline.
Contracts for Subscriber Telephones(Unit: 10k contracts) (Unit: 10k contracts)
Total subscriber telephones (left axis)
NTT subscriber telephones (left axis)
Cable telephony (right axis)
Direct subscriber telephone services (right axis)
0ABJ–IP telephones (right axis)
Note 1: Subscriber telephones refer to NTT subscriber telephones (including ISDN), direct subscriber telephone services (total of conventional direct subscriber telephone services, new-type direct subscriber telephone services, and direct ISDN subscriptions), 0ABJ–IP telephones, and cable telephony.
Note 2: For 0ABJ–IP telephones, the number of calls using the 0ABJ telephone numbers is treated as the number of contracts. * While 0ABJ–IP telephones are included in the subscriber telephones as they can be an alternative to NTT subscriber telephones, they are also included in IP
telephony on Page 3 and onward. Note 3: As figures for respective contracts are rounded, the total of the figures may differ from the actual total. Note 4: The numbers of contracts disclosed in the past have been corrected.
Shares of Subscriber Telephone ServicesCable telephony 1.8%
Direct subscriber telephone services 7.6%
0ABJ–IP telephones 9.7%
NTT subscriber telephones 80.8%
(Q1) (Q2)
Share of NTT East and West in Total Subscriber Telephones
Others 11.8%
NTT West 44.1%
NTT East 44.1%
(Q1) (Q2)
Note: The share of NTT East and NTT West is a total of NTT subscriber telephones (including ISDN) and 0ABJ–IP telephones.
2
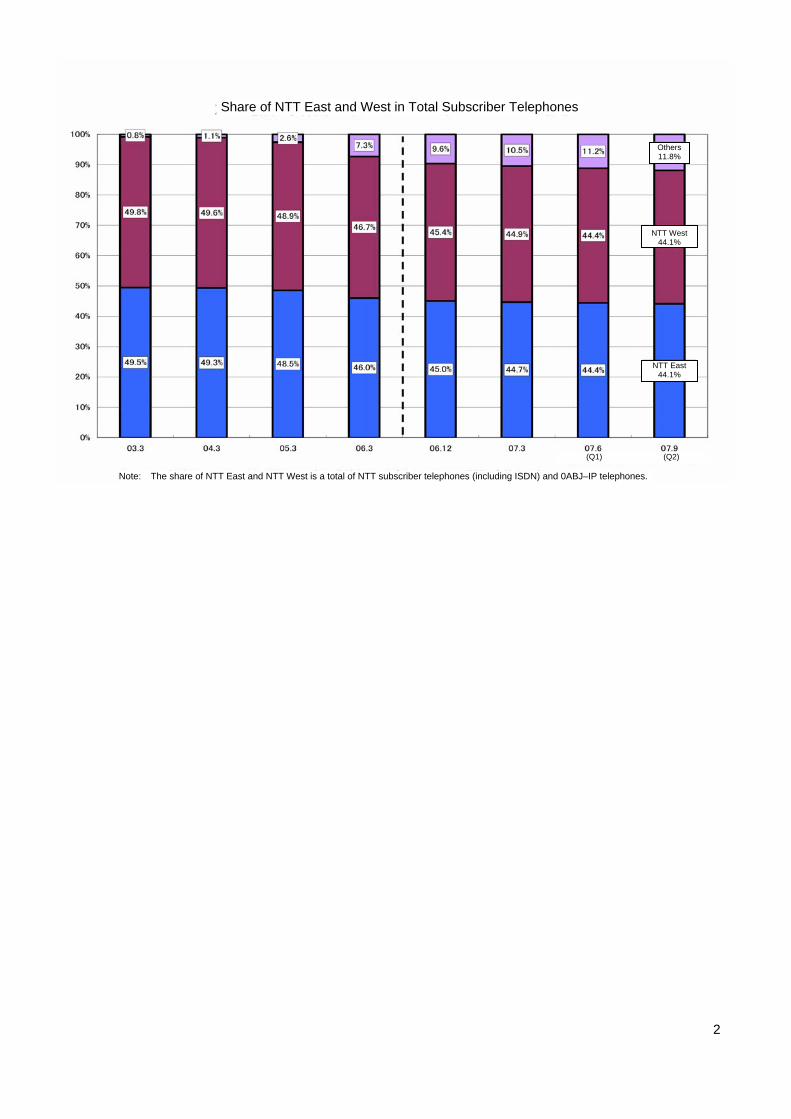
(2) IP Telephony
Users of telecommunications numbers allocated to IP telephony services numbered 15.95 million (up 4.4% from the previous quarter) as of the end of September 2007. While users of 0ABJ numbers are on the rise at 5.75 million (up 15.0%), users of the numbers with a 050 prefix dropped to 10.19 million (down 0.8%).
Regarding the share in the total number of users of IP telephony numbers, SoftBank BB and NTT Communications Corporation dipped to 29.7% (down 1.6%) and 20.3% (down 1.3%), respectively, while the combined share of NTT East and NTT West continued to increase at 27.2% (up 2.6% from the previous quarter or up 12.0% year on year).
The combined share of NTT East and NTT West in the total number of calls using the 0AB–J numbers is 75.3% (NTT East at 41.3% and NTT West at 34.0%; ±0% from the previous quarter).
Users of IP Telephony Numbers(Unit: 10k contracts)
IP telephony total
Numbers with a 050 prefix
0ABJ numbers
Share of Carriers in IP Telephony Numbers (Overall)
Others 15.0%
KDDI 7.8%
NTT West 12.3%
NTT East 14.9%
NTT Communications20.3%
SoftBank BB 29.7%
(Q1) (Q2) Note: The figures represent only the carriers to whom telecommunications numbers for IP telephony are allocated.
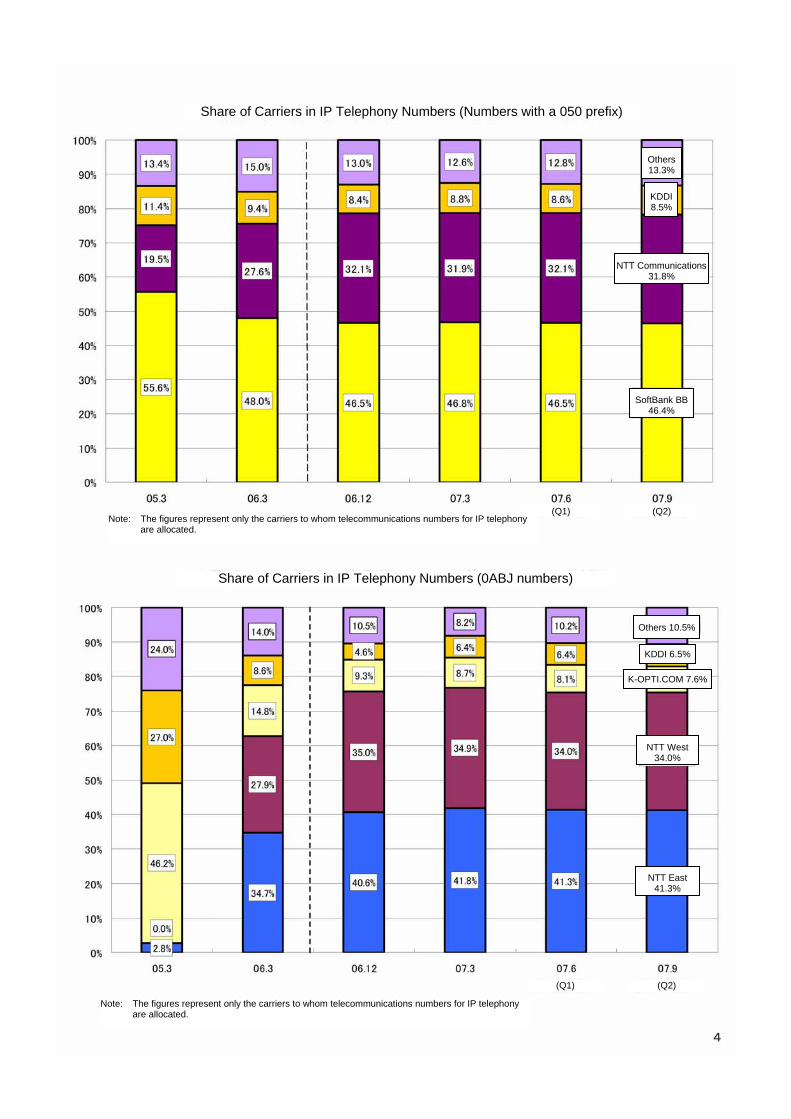
Share of Carriers in IP Telephony Numbers (0ABJ numbers)
Share of Carriers in IP Telephony Numbers (Numbers with a 050 prefix)
Others13.3%
KDDI8.5%
NTT Communications31.8%
SoftBank BB46.4%
(Q1) (Q2) Note: The figures represent only the carriers to whom telecommunications numbers for IP telephony
are allocated.
Others 10.5%
KDDI 6.5%
NTT West 34.0%
NTT East 41.3%
(Q1) (Q2)
Note: The figures represent only the carriers to whom telecommunications numbers for IP telephony are allocated.
K-OPTI.COM 7.6%
2 Mobile Communications
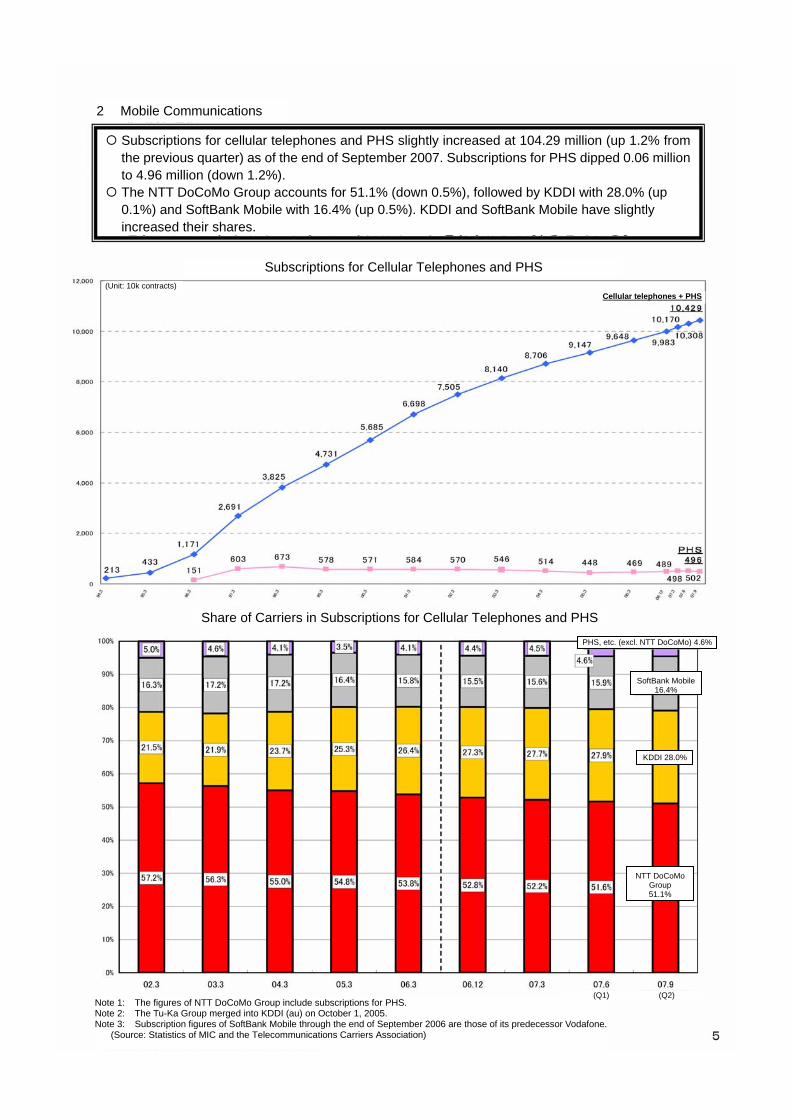
Subscriptions for cellular telephones and PHS slightly increased at 104.29 million (up 1.2% fromthe previous quarter) as of the end of September 2007. Subscriptions for PHS dipped 0.06 million to 4.96 million (down 1.2%).
The NTT DoCoMo Group accounts for 51.1% (down 0.5%), followed by KDDI with 28.0% (up 0.1%) and SoftBank Mobile with 16.4% (up 0.5%). KDDI and SoftBank Mobile have slightly increased their shares.
Subscriptions for Cellular Telephones and PHS
PHS, etc. (excl. NTT DoCoMo) 4.6%
KDDI 28.0%
NTT DoCoMo Group 51.1%
(Unit: 10k contracts) Cellular telephones + PHS
Share of Carriers in Subscriptions for Cellular Telephones and PHS
SoftBank Mobile16.4%
(Q2) Note 1: The figures of NTT DoCoMo Group include subscriptions for PHS. Note 2: The Tu-Ka Group merged into KDDI (au) on October 1, 2005. Note 3: Subscription figures of SoftBank Mobile through the end of September 2006 are those of its predecessor Vodafone. (Source: Statistics of MIC and the Telecommunications Carriers Association)
(Q1)
3 Internet Access
(1) Overall Broadband
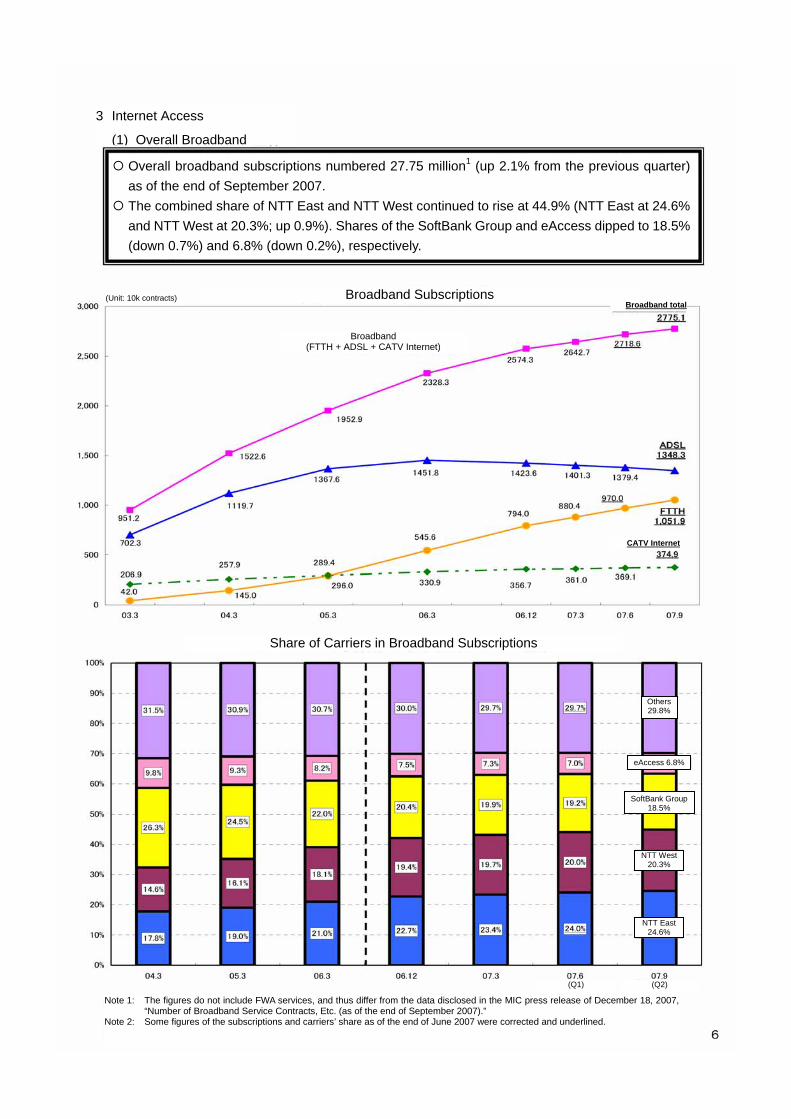
Overall broadband subscriptions numbered 27.75 million1 (up 2.1% from the previous quarter) as of the end of September 2007.
The combined share of NTT East and NTT West continued to rise at 44.9% (NTT East at 24.6% and NTT West at 20.3%; up 0.9%). Shares of the SoftBank Group and eAccess dipped to 18.5% (down 0.7%) and 6.8% (down 0.2%), respectively.
(Unit: 10k contracts) Broadband SubscriptionsBroadband total
Broadband (FTTH + ADSL + CATV Internet)
CATV Internet
Share of Carriers in Broadband Subscriptions
Others29.8%
eAccess 6.8%
NTT West 20.3%
SoftBank Group 18.5%
NTT East 24.6%
(Q1) (Q2)
Note 1: The figures do not include FWA services, and thus differ from the data disclosed in the MIC press release of December 18, 2007, “Number of Broadband Service Contracts, Etc. (as of the end of September 2007).”
Note 2: Some figures of the subscriptions and carriers’ share as of the end of June 2007 were corrected and underlined.
(2) DSL
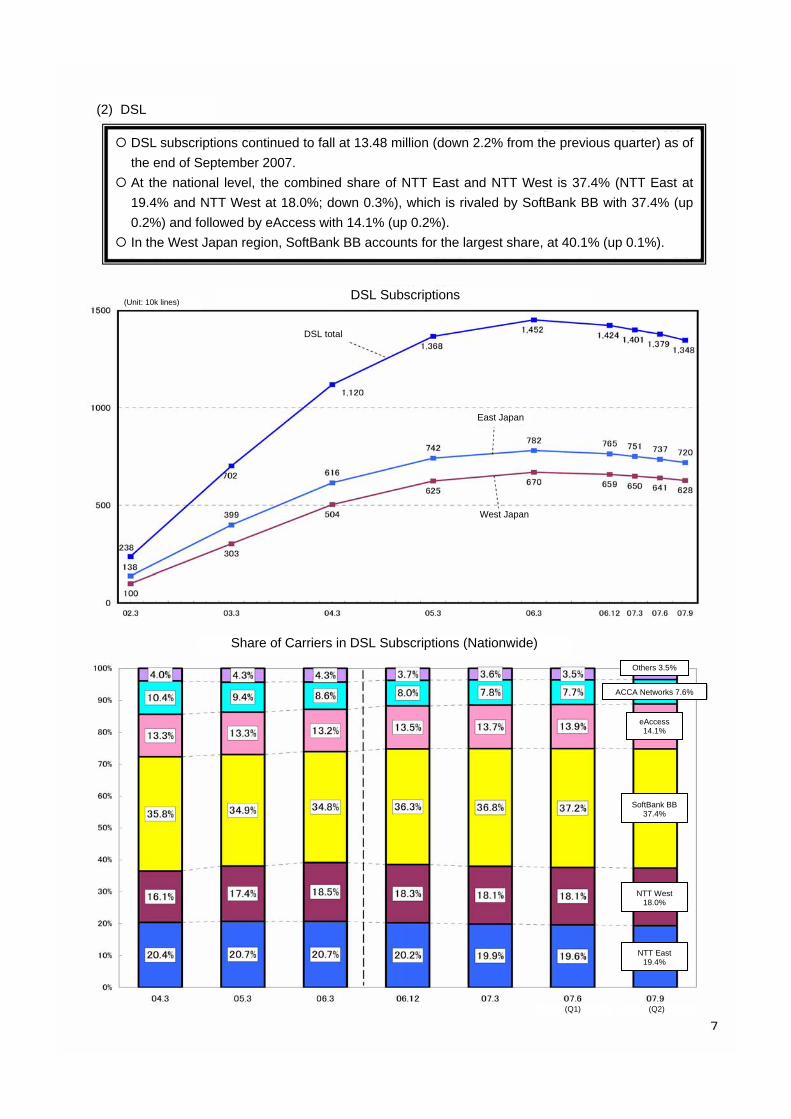
DSL subscriptions continued to fall at 13.48 million (down 2.2% from the previous quarter) as of the end of September 2007.
At the national level, the combined share of NTT East and NTT West is 37.4% (NTT East at 19.4% and NTT West at 18.0%; down 0.3%), which is rivaled by SoftBank BB with 37.4% (up 0.2%) and followed by eAccess with 14.1% (up 0.2%).
In the West Japan region, SoftBank BB accounts for the largest share, at 40.1% (up 0.1%).
(Unit: 10k lines)
DSL total
East Japan
West Japan
DSL Subscriptions
Others 3.5%
ACCA Networks 7.6%
NTT East 19.4%
SoftBank BB 37.4%
(Q1) (Q2)
Share of Carriers in DSL Subscriptions (Nationwide)
eAccess 14.1%
NTT West 18.0%
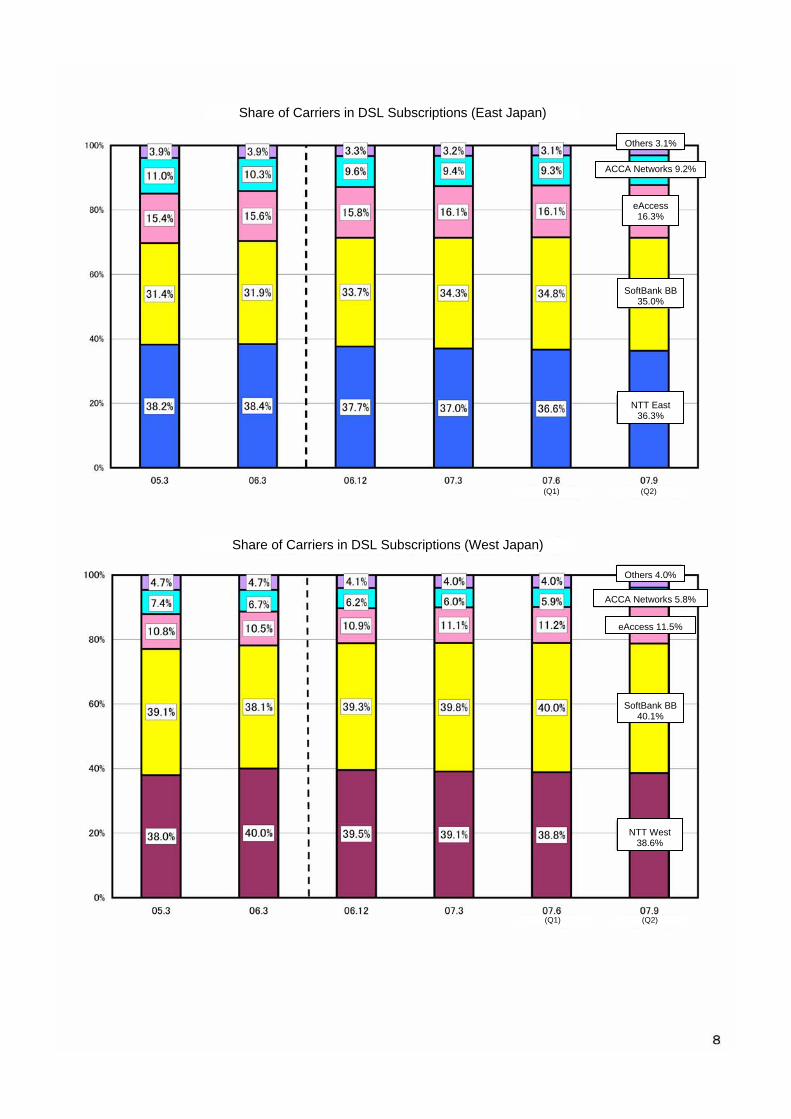
Others 4.0%
ACCA Networks 5.8%
NTT West 38.6%
SoftBank BB40.1%
(Q1) (Q2)
Share of Carriers in DSL Subscriptions (West Japan)
eAccess 11.5%
Share of Carriers in DSL Subscriptions (East Japan)
Others 3.1%
ACCA Networks 9.2%
NTT East 36.3%
SoftBank BB35.0%
eAccess 16.3%
(Q1) (Q2)
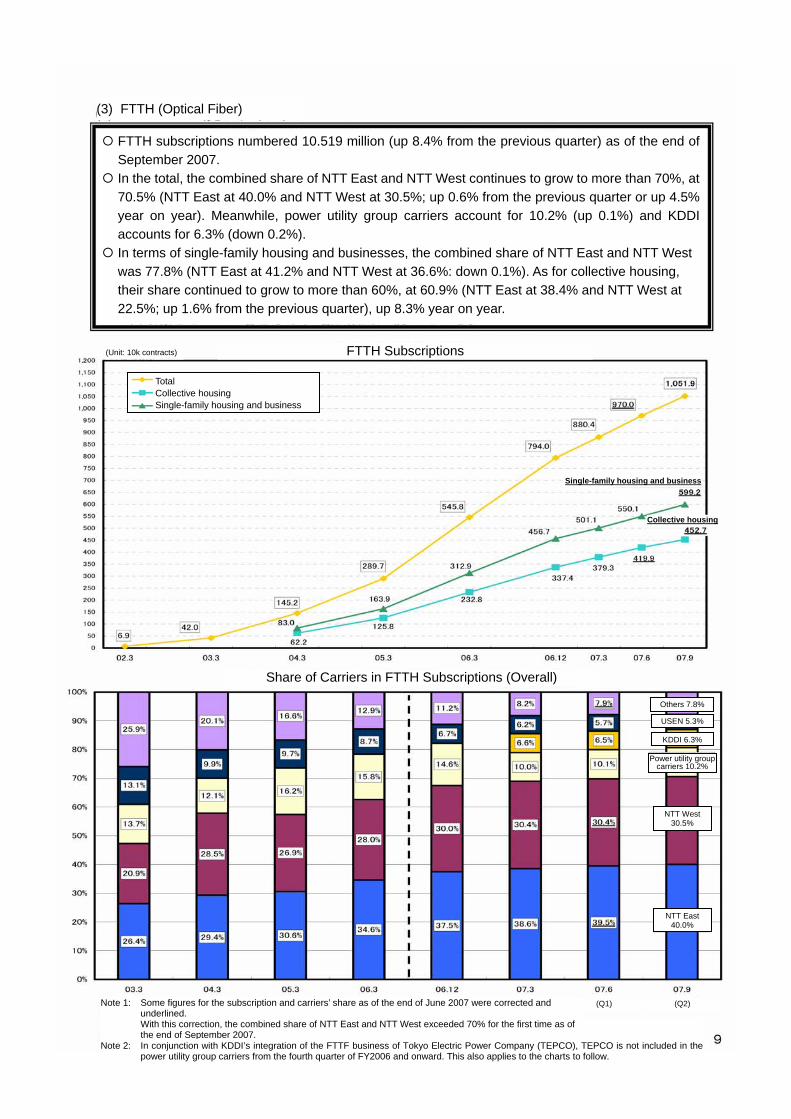
(3) FTTH (Optical Fiber)
FTTH subscriptions numbered 10.519 million (up 8.4% from the previous quarter) as of the end of September 2007.
In the total, the combined share of NTT East and NTT West continues to grow to more than 70%, at 70.5% (NTT East at 40.0% and NTT West at 30.5%; up 0.6% from the previous quarter or up 4.5% year on year). Meanwhile, power utility group carriers account for 10.2% (up 0.1%) and KDDI accounts for 6.3% (down 0.2%).
In terms of single-family housing and businesses, the combined share of NTT East and NTT West was 77.8% (NTT East at 41.2% and NTT West at 36.6%: down 0.1%). As for collective housing, their share continued to grow to more than 60%, at 60.9% (NTT East at 38.4% and NTT West at 22.5%; up 1.6% from the previous quarter), up 8.3% year on year.
(Unit: 10k contracts)
Single-family housing and business
FTTH Subscriptions
Others 7.8%
USEN 5.3%
(Q1) (Q2)
Share of Carriers in FTTH Subscriptions (Overall)
Power utility group carriers 10.2%
NTT West 30.5%
Total Collective housing Single-family housing and business
Collective housing
KDDI 6.3%
NTT East 40.0%
Note 2: In conjunction with KDDI’s integration of the FTTF business of Tokyo Electric Power Company (TEPCO), TEPCO is not included in the
power utility group carriers from the fourth quarter of FY2006 and onward. This also applies to the charts to follow.
Note 1: Some figures for the subscription and carriers’ share as of the end of June 2007 were corrected and underlined. With this correction, the combined share of NTT East and NTT West exceeded 70% for the first time as of the end of September 2007.
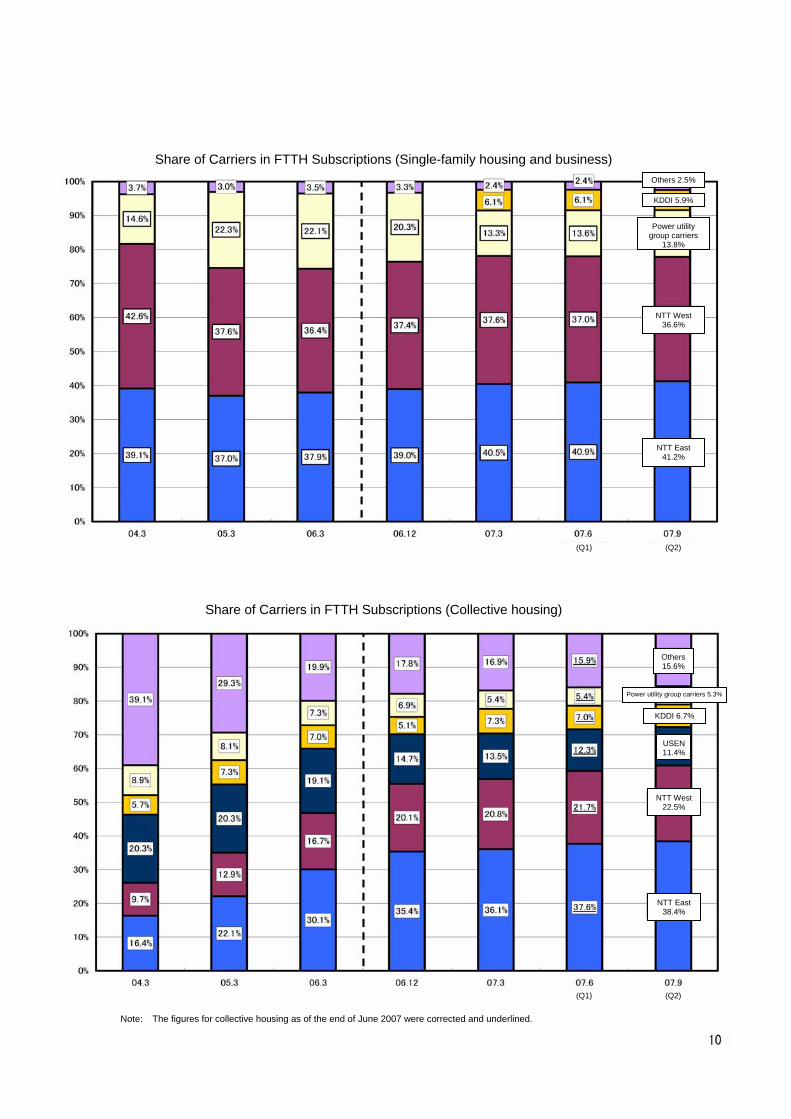
Others 2.5%
(Q1) (Q2)
Share of Carriers in FTTH Subscriptions (Single-family housing and business)
Power utility group carriers
13.8%
NTT West 36.6%
KDDI 5.9%
NTT East 41.2%
Note: The figures for collective housing as of the end of June 2007 were corrected and underlined.
Others 15.6%
(Q1) (Q2)
Share of Carriers in FTTH Subscriptions (Collective housing)
Power utility group carriers 5.3%
NTT West 22.5%
KDDI 6.7%
NTT East 38.4%
USEN11.4%
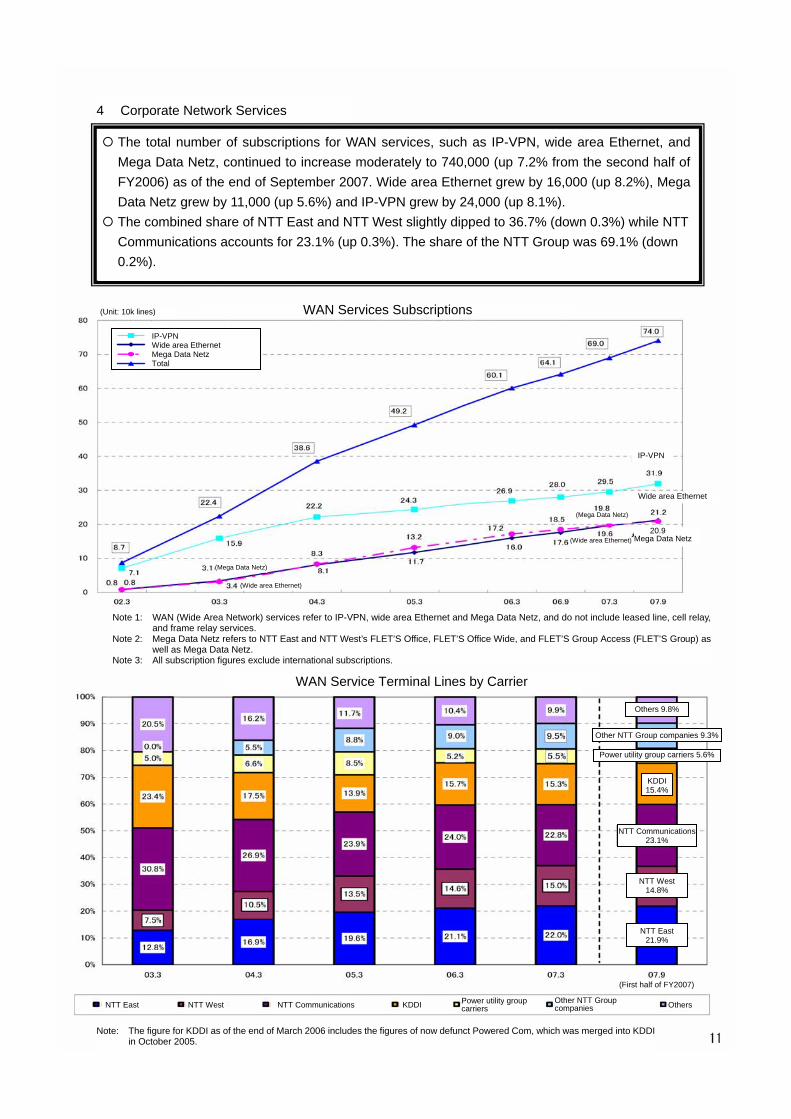
4 Corporate Network Services
The total number of subscriptions for WAN services, such as IP-VPN, wide area Ethernet, and Mega Data Netz, continued to increase moderately to 740,000 (up 7.2% from the second half of FY2006) as of the end of September 2007. Wide area Ethernet grew by 16,000 (up 8.2%), Mega Data Netz grew by 11,000 (up 5.6%) and IP-VPN grew by 24,000 (up 8.1%).
The combined share of NTT East and NTT West slightly dipped to 36.7% (down 0.3%) while NTT Communications accounts for 23.1% (up 0.3%). The share of the NTT Group was 69.1% (down 0.2%).
(Unit: 10k lines)
IP-VPN
WAN Services Subscriptions
Others 9.8%
Other NTT Group companies 9.3%
(First half of FY2007)
WAN Service Terminal Lines by Carrier
Power utility group carriers 5.6%
NTT West 14.8%
KDDI15.4%
NTT East 21.9%
Note: The figure for KDDI as of the end of March 2006 includes the figures of now defunct Powered Com, which was merged into KDDI in October 2005.
Wide area Ethernet
(Mega Data Netz)
(Wide area Ethernet) 20.9Mega Data Netz
(Mega Data Netz)
(Wide area Ethernet)
Note 1: WAN (Wide Area Network) services refer to IP-VPN, wide area Ethernet and Mega Data Netz, and do not include leased line, cell relay, and frame relay services.
Note 2: Mega Data Netz refers to NTT East and NTT West’s FLET’S Office, FLET’S Office Wide, and FLET’S Group Access (FLET’S Group) as well as Mega Data Netz.
Note 3: All subscription figures exclude international subscriptions.
NTT Communications23.1%
IP-VPN Wide area Ethernet Mega Data Netz Total
Other NTT Group companies
Power utility group carriersKDDINTT East NTT Communications NTT West Others