Embed Size (px)
Citation preview
Ku Nor Izah Ku Ismail/FRRaG (Financial Reporting, Regulation & Governance) (2005)
DISCLOSURE IN THE QUARTERLY REPORTS OF MALAYSIAN
COMPANIES
By
Ku Nor Izah Ku Ismail Universiti Utara Malaysia
and
Roy Chandler
Cardiff Business School
ABSTRACT
This study examined the extent of disclosure in the quarterly reports of Malaysian listed companies. The quarterly reports of 117 companies ended on 30 September 2001 were the subjects of the study. First, this study observed companies’ overall disclosure with respect to the Listing Requirements of the KLSE. Second, it observed the extent of narrative disclosure with respect to comments on material changes, review of performance and comment on current year prospects. Finally, the extent of disclosure was tested for association with profitability, growth and leverage of a company. Generally, companies disclose all the mandatory financial statements and relevant notes to the accounts. However, the extent of mandatory narrative disclosures varies. Generally, companies appear to provide a minimum level of disclosure. This study reveals that the extent of disclosure is positively associated with the leverage of a company. No significant association was evidenced between the extent of disclosure and profitability and growth of a company. Plausible explanations of the findings are provided in this paper. The findings provide some useful insights to users, preparers and policy makers into the current practice of reporting selected narrative disclosure in the quarterly reports.
Corresponding Author
Ku Nor Izah Ku Ismail, PhD Associate professor
Centre for Professional and Continuing Education (PACE), Universiti Utara Malaysia,
06010 Sintok, Kedah, Malaysia E-mail: [email protected]
Tel: +604-9284902
Fax: +604-9285779
Key words: Quarterly financial reports, disclosure, interim financial reporting and
KLSE companies. Category of article: Refereed

DISCLOSURE IN THE QUARTERLY REPORTS OF MALAYSIAN COMPANIES
INTRODUCTION
Quarterly financial reporting has been a mandatory requirement for listed Malaysian
companies since 1999, before which companies were required to produce half-yearly
reports. The introduction of quarterly reporting was part of the government’s plan to
restore investors’ confidence and enhance the capital market following the 1997/98
Asian Currency Crisis. The implementation of quarterly reporting by listed companies
is based on the view that the reports would aid informed investing, reduce investment
risk, and increase accountability of those companies (KLSE 1999). Lessons learned
from the financial crisis suggest that lack of adequate, timely and reliable disclosure
by companies might mislead users, and therefore they will not be able to take the
appropriate decisions on a timely basis.
In Malaysia, disclosures in the quarterly reports were initially governed by the Kuala
Lumpur Stock Exchange (KLSE or currently known as Bursa Malaysia), via its
Listing Requirements. The contents prescribed by the Listing Requirements include a
balance sheet, an income statement and specific notes to accompany the financial
statements. In addition, the Listing Requirements require an income statement for the
current year-to-date, comparative income statements of the same quarter and year-to-
date of the previous year, and a comparative balance sheet as of the end of the
immediately preceding financial year. MASB 26, Interim Financial Reporting, issued
by the MASB in 2002 is another source of guidelines for the contents of the quarterly
reports. MASB 26 requires a company to issue a cash flow statement and a statement
1

of changes in equity, in addition to the balance sheet, the income statement and
selected notes to the accounts. Following the issuance of MASB 26, the requirements
of quarterly reporting are now regulated by the Standard. Therefore, in conjunction
with MASB 26, the KLSE, in July 2002 amended the Listing Requirements of KLSE.
Pursuant to the amendments, quarterly reports for quarters ending on or after 30
September 2002 must comply with MASB 26. It is believed that the newly amended
requirements will augur well for the capital market, as investors will have access to
enhanced and streamlined financial information (KLSE 2002).
Although there are conflicting views on the importance of regulation in enhancing the
quality of reporting, this paper believes that financial reporting regulation is
necessary in order to achieve quality financial reporting. There are several reasons
why financial reporting regulation is necessary. Based on the rationales from the
economic literature (see Watts and Zimmerman 1986), Ma (1997) for example cited
two reasons. First, accounting information is a public good in which any interested
party can have access to the information. Being a public good, besides shareholders
who pay for the information, there will be free riders1 who also obtain the
information from the financial reports. In determining the quantity of information to
produce, managers do not take into account the value of the information to the free
riders. Thus, information is under-produced, and there is a market failure2 unless
regulation of financial reporting is introduced (Watts and Zimmerman 1986).
1 A free rider is a person who does not purchase the public good since he is assured of the supply once it is made available to the public. 2 According to Watts and Zimmerman (1986), market failure exists when accounting information produced in the absence of regulation is suboptimal in a Pareto sense, or because the market for financial information results in resource allocation which is inequitable, that is, “unfair” to some groups or individuals.
2

Second, it is argued that management has more information about the value of a firm
than do outside investors, or there is information asymmetry. According to Watts and
Zimmerman (1986), companies whose share prices are undervalued would signal the
fact by disclosing more information. However, the signalling activities can lead to
overproduction of information, and some of the information relates to historical
performance and not to future performance. Thus, there is no social benefit obtained
and the authorities have to interfere and introduce financial reporting regulation to
overcome market failure.
The usefulness of financial information, among other things, depends on the level of
disclosure and its timeliness. As far as the quarterly reports are concerned, our earlier
paper (Ku Ismail and Chandler 2004) examined the reporting lag of quarterly reports
of Malaysian companies. However, no studies have been conducted to examine
quarterly reporting disclosure in Malaysia. Disclosure studies merely concentrate on
annual reporting (see for example, Ku Ismail and Abdullah, 1998; Haniffa and Cooke,
2002). Therefore, it is appropriate that this study extends our previous study by
examining the disclosure practice of the quarterly reports of companies in Malaysia.
The objectives of this paper are to examine:
1. companies’ overall disclosure with respect to mandatory items of the quarterly
reports,
2. the extent of selected mandatory narrative disclosure in the quarterly reports, and
3. the extent to which disclosure is associated with the profitability, growth and
leverage of a company.
3

The structure of this paper is organized as follows. First, a review of literature will be
presented. Next, this paper will discuss the research methods, following which a
section discussing the results will be presented. Finally, the conclusions will be
discussed.
REVIEW OF LITERATURE
As the US was the first country to promote corporate interim reporting, most of the
studies related to the reports are found in that country. The earliest survey on interim
disclosure was conducted by Taylor (1965). It was followed by Lipay (1972),
Edwards et al. (1972), Bersford and Rutzler (1976), and McEwen and Schwartz
(1992). An analysis of the above studies shows that as more and more regulations on
interim reporting were introduced in the US (for example, quarterly reporting to
replace half-yearly reporting, the SEC Rulings, and APB Opinion No. 28, Interim
Financial Reporting), there has been a substantial increase in the volume of reporting.
However, the reporting of textual materials was limited and showed the greatest
variation. In their study to observe whether firms comply with the disclosure
requirements stipulated in APB Opinion No. 28, Interim Financial Reporting,
McEwen and Schwartz (1992) revealed that firms did not disclose all the information
required by the Opinion and the researchers concluded that this non-compliance thus
diminishes the usefulness of the reports. They believed that stricter enforcement as
well as auditor involvement with interim reporting would provide a basis for greater
compliance. It was also found that the extent of compliance with some of the
disclosure requirements was difficult to determine from the reports. For example, it is
difficult to determine whether firms that failed to indicate seasonal operations either
do not have seasonal activities or are not complying with the disclosure guidelines.
4

In the UK, interim reports are prepared on a half-yearly basis. Surveys of the UK
interim reports could be found, for example in Holmes (1971), Lunt (1982), Maingot
(1983), Coopers and Lybrand (1992), Hussey and Wolfe (1994 and 1998) and
Bagshaw (1999). Like in the US, there has been an increase in the volume of interim
reporting with the passage of time. The most recent UK study conducted by Bagshaw
(1999) revealed that there has been a dramatic change in the content of the reports
since 1992. Interim reports have become more lengthy and detailed than before. It
was also noted that 73 percent of the companies published an auditor review report.
In Canada, Lambert et al. (1991) examined the reporting practices of 150 companies
by surveying their 1989/1990 interim financial reports. In a number of cases, Lambert
et al. (1991) concluded that companies were presenting much more information than
required by the CICA Handbook. In these instances, they recommended that
regulations be raised to the level of current reporting practice.
In Finland, Schadewitz and Blevins (1998) investigated the disclosure level of interim
reports of the Helsinki Stock Exchange (HSE) companies during the period 1985 to
1993 and determined if disclosure is associated with company specific characteristics.
The study provided evidence that the interim disclosure is directly related to business
risk, capital structure, size of a company, and market maturity. The study also
confirmed the hypothesis that disclosure is inversely related to governance structure.
This implied that the greater the institutional concentration of ownership of Finnish
firms by other firms is, the lower the degree of interim disclosure would be. The
5

variables market risk, stock price adjustment, growth and growth potential appeared
not to have any significant influence on interim disclosure.
Tan and Tower (1997) scrutinized half-yearly reports of Australian and Singaporean
listed companies to gain some evidence on the compliance issue. They found that
there was a distinct difference of compliance towards half-yearly requirements
between the two countries. Many more Australian companies did not fully meet the
reporting requirement compared with the Singaporean companies. This is not
surprising because the Australian companies were required to comply with more than
six times as many requirements as their counterparts in Singapore. The researchers
suggested that the difference in the compliance level between the two countries was
due to the difference in political freedom in both countries. The other three factors
(industry type, company size and leverage) were tested for each individual country
and showed no significant influence on the level of compliance.
In summary, the above studies on disclosure show mixed evidence on the contents
exhibited in the interim reports. The findings differ because they were conducted at
different times and in different reporting environments. While some studies analysed
the reports before any regulation was in place, others were conducted after the rules
have been laid out. The characteristics of the company such as size have been shown
to be able to explain the variations in the quality of disclosure. Nevertheless, the
studies generally indicated that reporting regulation that spells out the contents of the
interim reports is important if the quality of disclosure is to be enhanced.
6

In Malaysia, no studies have been conducted to examine the disclosure in the
quarterly reports of companies. One related study was on the timeliness of quarterly
reporting. In the study, we (Ku Ismail and Chandler 2004) found that all companies,
except for one, reported within the allowable reporting lag of two months. However, a
majority of companies took as long as they are allowed to announce their quarterly
reports. The average reporting lag was 56 days. Consistent with the literature, the
study provides evidence that the timeliness of quarterly reporting is influenced by
size, profitability, growth and leverage of a company in the expected direction.
Larger, profitable, growing and low leveraged companies tend to report more quickly
than other companies.
RESEARCH METHODS
Measuring the Extent of Disclosure
In measuring the extent of disclosure, only items that are common and could be
disclosed by all companies became the basis of measurement. This is to avoid
marking down a company that does not disclose an item that may not be relevant.
Upon further analysis of the quarterly reports, all companies were found to present
their balance sheets and income statements. The relevant notes were also disclosed,
and where an item of information was not applicable or not relevant to the company, a
statement of such inapplicability was provided. However, the real reasons for non-
disclosure were impossible to determine by mere observation of the reports. Non-
disclosure may be due to the items being irrelevant or immaterial and thus not subject
to disclosure, or alternatively the company was not willing to disclose the item in
question although it was relevant.
7

The narrative materials contain the greatest variation of all items and for that reason
they were chosen as the basis for measuring the extent of disclosure. In particular, the
following three explanatory notes were selected as the subjects of investigation:
• Material changes in the quarterly results compared with that of the previous
quarter;
• Review of performance of the company; and
• Comment on current year prospects.
Although the above notes are compulsory, the guidelines provided are subjective
and hence the amount of disclosure is subject to the interpretation of the
preparers. Therefore, the amount of disclosure with regard to the above three
items is likely to vary between companies. The above notes were also selected
because investors and other users place great importance on the items. As interim
reports are used to forecast the forthcoming annual results, to predict results
beyond the current period and to provide feedback information concerning
financial performance for comparison with earlier expectations (see for example,
Lambert et al., 1991), these items provide useful information to the users.
Various methods have been adopted in measuring the relative extent of disclosure
among companies. One of the commonly used methods is the construction of a
disclosure index (see for e.g., Tan and Tower, 1997; Schadewitz and Blevins, 1998).
However, the use of a disclosure index is sometimes impractical especially when one
is analysing narrative disclosure. Although some disclosures are mandated, the
content and comprehensiveness is often at the discretion of the preparer. Where
narrative disclosure is concerned (such as in social and environmental reporting),
8

most researchers made use of a content analysis approach (e.g., Guthrie and Parker,
1990; Smith and Taffler, 2000) in measuring the extent of disclosure either by
counting the number of words, sentences, or pages. This study adopts the content
analysis approach in measuring the relative extent of disclosure in the quarterly
reports, by counting the number of words. It is argued that by using the number of
words, instead of the number of sentences or pages, the volume of disclosure may be
recorded in greater detail (Zeghal and Ahmed, 1990).
Extent of Disclosure and Company Attributes
Several company attributes have been examined in previous disclosure studies to
explain the variations in the extent of disclosure. These include variables that are
associated, for example, with structure (size and capital structure), and performance
(profitability and growth) of a company. Although studies such as those by
Schadewitz and Blevins (1998) and Haniffa and Cooke (2002) include other variables
such as those related to corporate governance and culture of a company, this study
will only concentrate on profitability, growth and leverage of a company. This paper
hypothesises that the extent of disclosure is positively associated with profitability,
growth and leverage of a company. The association between these variables and the
extent of disclosure could be explained by signalling hypothesis and agency theory.
They are based on the notion that managers have more information about the value of
a firm than do outside investors. Signalling hypothesis refers to the proposition that
signalling motivates corporate disclosure (Watts and Zimmermann, 1986). The
agency theory believes that the information from the agent is desired by the principal
in order to monitor the agent’s behaviour and to motivate the agent to act in the
principal’s interest.
9

Profitability of a company
The profitability of a company has been hypothesised to be positively associated with
its extent of disclosure. Based on signalling hypothesis, it is argued that a highly
profitable firm is more likely to signal to the market its superior performance by
disclosing more information (Cooke, 1989). Management with good news is likely to
disclose more information than management with bad news (Naser, 1998). It has been
posited that higher profitability motivates management to provide greater information
to support the continuance of their positions and compensations. On the other hand,
management with low profitability may provide less information to cover up the
reasons for losses or reducing earnings (Singhvi and Desai, 1971).
Based on the foregoing discussion, this paper hypothesises that there is a positive
association between profitability of a company and the extent of disclosure. Although
there are various measures of profitability, this study measures profitability by the
profit margin of a company, that is, the ratio of net income to turnover (or sales). This
measure of profitability, for example, has been employed by Singhvi (1968), and
Courtis (1979).
Growth of a company
Like profitability, growth is generally associated with good management and
performance. It is argued that management of a company with good prospects is
willing to inform investors of its growth opportunities (Kanto and Schadewitz, 1997).
Consistent with signalling hypothesis, high growth companies are likely to disclose
more information to highlight the good news and to give confidence to the investors.
10

On the other hand, companies with low or negative growth are more likely to hide the
bad news by disclosing less information. Consistent with the works of Kanto and
Schadewitz (1997), and Schadewitz and Blevins (1998), the percentage change in net
sales for the current quarter from last year’s corresponding quarter is taken to be the
measure for growth in this study.
Leverage of a company
From the perspective of agency theory, Jensen and Meckling (1976) argued that
higher monitoring costs would be incurred by firms that are highly leveraged. To
reduce the monitoring costs, it is expected that firms that are highly leveraged would
disclose more information in their financial reports. Thus, the relationship between
leverage and the extent of disclosure is expected to be positive. Nevertheless, previous
evidence shows that the results were inconclusive. Some studies showed a significant
relationship (e.g. Courtis, 1979 and Hossain and Adams, 1995 in annual report
studies; Schadewitz and Blevins, 1998 in interim report studies), while others found
no relationship (e.g. Chow and Wong-Boren, 1987, and Ahmed and Nicholls, 1994 in
annual report studies).
Based on the argument provided by agency theory, this paper hypothesises that highly
leveraged firms disclose more information in the quarterly reports compared with the
lowly leveraged firms. This study measures leverage in terms of the ratio of debt to
total assets, as employed by Courtis (1979) and Chow and Wong-Boren (1987).
Because some companies were insolvent and had a negative amount of equity,
measuring leverage as the debt to equity ratio might be misleading.
11

Hypothesis Testing
From the foregoing discussion, the hypotheses to be tested, stated in their alternative
forms are:
H1: The extent of disclosure is positively associated with profitability of a company.
H2: The extent of disclosure is positively associated with growth of a company.
H3: The extent of disclosure is positively associated with leverage of a company.
An ordinary least squared (OLS) regression test was conducted in order to test the
hypotheses. The general structural equation that was employed to explain the
association is:
Disclosure = α + + β1Margin+ β2Growth + β3Leverage + ε
where:
Disclosure = the extent of disclosure measured by the total number of words
disclosed in the three notes scaled to size (total assets) of a company,
Margin = profitability of a company, measured by profit margin (i.e. net
income/ turnover),
Growth = growth of a company measured by the percentage change in net sales
from previous year’s corresponding quarter,
Leverage = capital structure (leverage) of a company measured by ratio of debt
to total assets,
α and βi = constant/ parameters to be estimated, i = 1 to 4, and
ε = disturbance term.
The total number of words is scaled to the size of a company in order to reduce the
size effect of the variable on the regression and to control for the influence of size on
12

the extent of disclosure. Bigger companies are likely to report more because they have
more activities compared with their smaller counterparts.
Sampling of Quarterly Reports
Quarterly reports of KLSE listed companies for the quarter ended 30 September 2001
are the primary reports analysed. This period was chosen because it is expected that
companies were already accustomed to quarterly disclosure requirement provided
under the KLSE Listing Requirements since they came into effect in July 1999. The
report was the latest quarterly report, other than the fourth quarter report, during the
time the data were collected. In determining the sample, companies listed on the
KLSE before January 2000 were initially identified. This is to ensure that companies
would be able to present their comparative financial statements (as required by the
KLSE) when data pertaining to the quarter ended on 30 September 2001 were
collected.
Companies listed under the finance (financial institutions, insurers and securities
firms), trusts and closed-end funds classification of the KLSE listing were excluded
from the sample. This is because those companies have different requirements with
respect to financial disclosure. After omitting these companies, there were 351
companies in the sampling frame. Out of these 351 companies, one-third or 117
companies were selected, using a systematic sampling design. This involved the
selection of one out of every three of companies in the sampling frame, which was
generated from the list of companies published in the Investors Digest (KLSE, 2000).
The list was arranged in alphabetical order and according to boards and industries.
Therefore, industry bias is not a problem in this study. Quarterly reports submitted to
13

the KLSE and made available on the KLSE Listing Information Network (KLSE
LINK) are the data source used in this study.
RESULTS AND DISCUSSION
Overall Disclosure
As at the time this study was undertaken, the quarterly reports of KLSE listed
companies should include an income statement, a balance sheet, selected explanatory
notes and a statement as to whether the reports have been audited or not. Overall, the
quarterly reports of the 117 companies were found to comply with the above
requirements. However, no attempt was made by any company in this study to
voluntarily include a cash flow statement and a statement of changes in equity. The
omission of these two statements is not surprising because at the time the study was
conducted, MASB 26 (which proposed the inclusion of both statements in addition to
the existing income statement and balance sheet) was still at the exposure draft stage,
and thus has not been in effect. The standard is effective for accounting periods
beginning on or after 1 July 2002. The findings suggest that in the absence of
enforcement, disclosure is likely to be low.
The extent of disclosure differs among companies. For some items, exceptional items
for instance, some companies stated that they did not have such items and thus did not
disclose the information. How far this statement is true is impossible to tell because a
company may have the item but would prefer to defer the recognition in light of the
practice of income management and so forth.
14

Disclosure of Material Changes in Quarterly Results
One of the narrative explanatory notes that companies have to include in the quarterly
reports is ‘material changes in quarterly results compared with that of the previous
quarter’. In particular, the KLSE requires companies to make “an explanatory
comment on any material change in the profit before taxation for the quarter reported
on as compared with the immediate preceding quarter”. (KLSE 2001, Appendix 9B-
05).
Table 1 shows that a majority of companies (84.6 percent) reported on the change in
profit before tax, and thus complied with the Requirements. Out of this, at least 47
(40.2 percent) included comments on the change in turnover. This shows that the
compliance rate was high and some companies were willing to comment on some
other performance measures, particularly on turnover. Another company stated that
there was no material change in results, and therefore no changes in results were
reported. However, 17 companies (14.5 percent) did not comply with the
Requirements. Out of these, 11 companies (9.4 percent) made a comment on turnover
and/or other performance indicators while 6 companies (5.1 percent) made no specific
reference to any performance indicators when commenting on the change.
Table 1
Performance measures provided in comments on material changes
Comments: Frequency Percent Compliance Profit before tax only 52 44.4 Yes Profit before tax and turnover and others (if any)
47 40.2 Yes
Stated that there was no material change in results
1 0.9 Yes
Turnover and/or others 11 9.4 No No specific performance indicator 6 5.1 No Total 117 100.0
15
The 17 companies that did not comply with the Requirements were further
investigated to find evidence of any action (at least an amendment to the quarterly
reports) taken by the KLSE for non-compliance. It appears that no action was taken.
This suggests that the KLSE was not thorough enough in scrutinising the details of the
contents of the quarterly reports, as such that companies could get away with not
reporting some of the details.
Disclosure of Review of Performance
With regard to the review of performance, companies are expected to disclose the
following in the quarterly reports: “A review of the performance of the company and
its principal subsidiaries, setting out material factors affecting the earnings and/or
revenue of the company and the group for the current quarter and financial year-to-
date” (KLSE 2001, Appendix 9B-06).
Unlike the comment on material change in results, here the Requirements do not
specify the particular earnings indicator to be reviewed. Results of further analysis are
provided in Table 2. It shows that compliance with the requirement was high (87.2
percent), although not all companies provided the information. More companies
provided a review on profit before tax than on turnover. However, at least 47 percent
of them made a review on both performance indicators.
16

Table 2 Performance measures commented in review of performance
Frequency Percent Compliance Profit before tax only 20 17.1 Turnover only 10 8.5 Profit before tax and turnover only 55 47.0 Profit before tax and/or turnover and others
12 10.3
Others 5 4.3
Yes
(87.2%)
No specific performance measure 7 6.0 None 8 6.8
No (12.8%)
Total 117 100.0
Table 2 also shows that 15 companies (12.8 percent) did not comply with the
requirements. Of the 15 companies, seven did make a comment, but not on any
specific earnings measure. The remaining eight companies failed to make any
comments at all. Those 15 companies were also observed to determine if they were
the same companies that failed to comply with the requirement on change in profit
before tax. Out of those, only five cases of serial non-disclosure were observed.
Further investigation into the quarterly reports of the eight companies that did not
make any comments reveals that no enforcement actions or penalties were imposed on
the companies for failure to disclose the necessary information. Again, this suggests
that the KLSE may not have looked seriously into the matter.
Disclosure of Current Year Prospects
Where a statement on the current year prospects is concerned, a listed company is
required to disclose “a commentary on the prospects, including the factors that are
likely to influence the company’s prospects for the remaining period to the end of the
financial year” (Appendix 9B-06, KLSE 2001).
17
It appears that comments on the prospects vary among companies. While some
companies made a forecast on the current year’s results, one company did not make
any comment at all. Details on the types of information and comments with respect to
current year prospects are depicted in Table 3.
Table 3 shows that only 24 companies (20.5 percent) made a forecast. The forecasts
were, however, general and not supported by any figures. A bare majority of the
companies (55.5 percent) expressed a general optimism or pessimism for the current
year. Eleven companies (9.4 percent) gave no indication of the direction of the
prospects of the company, but stated that it all depends on internal or external factors.
Three companies stated that no projection could be made. Twelve companies (10.3
percent) actually made no comment on the prospects where 11 of them merely
reviewed the current quarter’s performance by comparing their results with those of
the last quarter. This type of information is actually more relevant to the section on
review of performance. Overall, the information provided in Table 3 provides
evidence that attempts were made by companies to comment on the prospects but
with varying rigour.
18
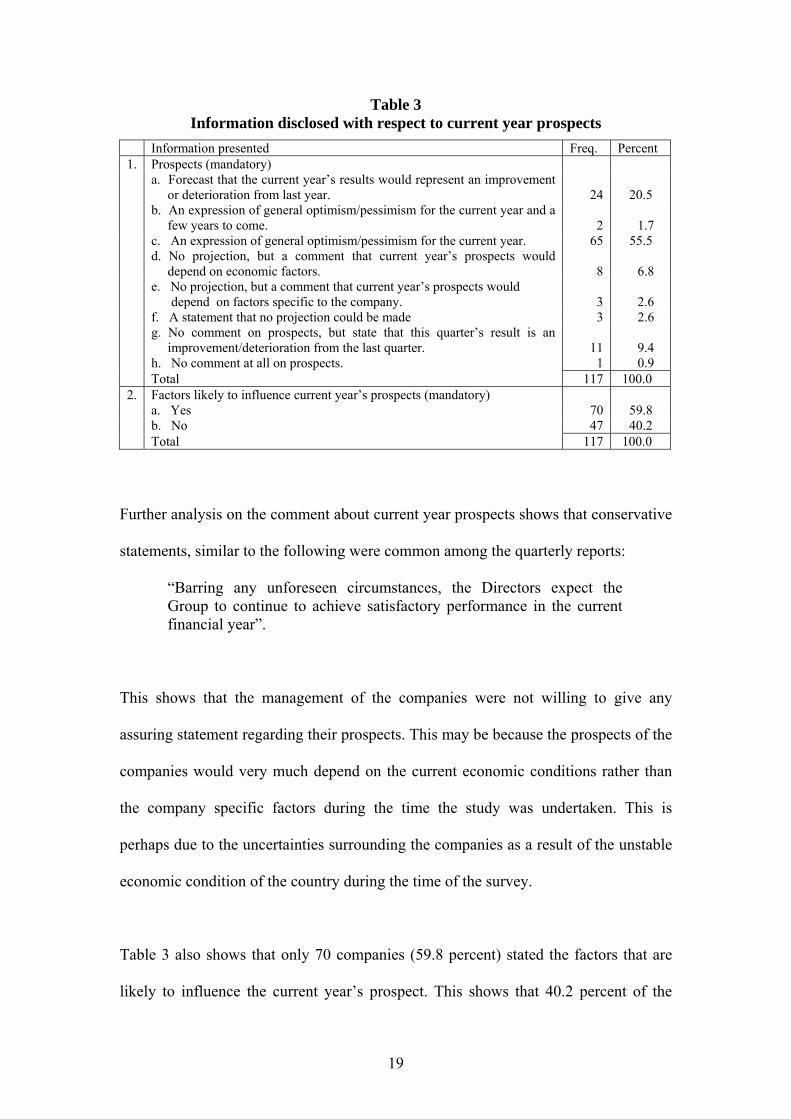
Table 3 Information disclosed with respect to current year prospects
Information presented Freq. Percent 1. Prospects (mandatory) a. Forecast that the current year’s results would represent an improvement
or deterioration from last year.
24
20.5 b. An expression of general optimism/pessimism for the current year and a
few years to come.
2
1.7 c. An expression of general optimism/pessimism for the current year. 65 55.5 d. No projection, but a comment that current year’s prospects would
depend on economic factors.
8
6.8 e. No projection, but a comment that current year’s prospects would
depend on factors specific to the company.
3
2.6 f. A statement that no projection could be made 3 2.6 g. No comment on prospects, but state that this quarter’s result is an
improvement/deterioration from the last quarter.
11
9.4 h. No comment at all on prospects. 1 0.9 Total 117 100.0 2. Factors likely to influence current year’s prospects (mandatory) a. Yes 70 59.8 b. No 47 40.2 Total 117 100.0
Further analysis on the comment about current year prospects shows that conservative
statements, similar to the following were common among the quarterly reports:
“Barring any unforeseen circumstances, the Directors expect the Group to continue to achieve satisfactory performance in the current financial year”.
This shows that the management of the companies were not willing to give any
assuring statement regarding their prospects. This may be because the prospects of the
companies would very much depend on the current economic conditions rather than
the company specific factors during the time the study was undertaken. This is
perhaps due to the uncertainties surrounding the companies as a result of the unstable
economic condition of the country during the time of the survey.
Table 3 also shows that only 70 companies (59.8 percent) stated the factors that are
likely to influence the current year’s prospect. This shows that 40.2 percent of the
19

companies in this study did not fully comply with the requirement on current year’s
prospects. This high non-compliance is rather surprising given the fact that the
Requirements have been in place since 1999. It suggests that the monitoring
mechanism of the KLSE may not have been effective in relation to this matter.
Association between Extent of Disclosure and Company Characteristics
Table 4 presents the descriptive statistics of the data gathered on the extent of
disclosure of each of the three explanatory notes.
Table 4 Descriptive statistics on the number of words disclosed
Explanatory notes: Mean Std. Dev. Min. Max. Median Material changes in the quarterly results
65.02 38.96 15 215 53.00
Review of performance 100.54 64.19 23 321 85.00 Current year prospects 53.25 40.91 10 265 45.00 Total number of words 218.80 108.45 84 634 202.00 Data in Table 4 reveal that the range of the number of words used in each of the three
explanatory notes is large. The total number of words ranges from 84 to 634 with a
mean of 218.8 words. That the medians of the number of words are less than the
means in all the three notes indicates that more than fifty percent of the companies are
reporting less than the average number of words. In other words, the scores are
skewed to the right. However, it is not the purpose of this paper to investigate the
reasons for the variation in disclosure.
In order to determine the association between the extent of disclosure (dependent
variable) and the three selected company variables (independent variables), an
20

ordinary least square (OLS) regression analysis was conducted. After omitting cases
of outliers and insufficient information, 111 companies were included in the analysis.
Table 5 provides the descriptive statistics of the variables.
Table 5 Descriptive statistics of variables
Mean Std. Dev. Min. Max. Median Disclosure 1.356 2.273 0.06 16.87 .665 Margin -0.267 1.150 -8.89 0.52 0.021 Growth 4.444 44.427 -100.00 262.97 -0.064 Leverage 0.714 0.992 0.10 8.39 0.539 Disclosure = The extent of disclosure measured by the total number of words scaled to total
assets Margin = Profit margin (i.e. net income/ turnover) Growth = Percentage change in net sales from previous year’s corresponding quarter Leverage = Leverage of a company measured by ratio of debt to total assets
The Pearson correlation coefficients among the variables are presented in Table 6.
The correlation coefficients among the independent variables are low in which the
lowest absolute value is 0.432. As suggested by Kleinbaum, Kupper and Muller3
(1988), multicollinearity is not a problem in this regression procedure.
Table 6 Pearson correlation coefficients (2-tailed)
Disclosure Margin Growth Margin -0.186* Growth -0.032 0.229** Leverage 0.626** -0.432** -0.135 **Significant at 0.05 * Significant at 0.1
Results of the regression analysis, using the ENTER method are depicted in Table 7.
The adjusted R2 of 0.385 and F value of 23.982 show that the model describes 38.5
percent of the variation in disclosure and it is significant at the 1 percent level. There
3 According to Kleinbaum et al. (1988), a model is said to suffer a severe problem of multicollinearity if the R2 ≥ 0.9, or if R ≥ 0.95.
21

is not sufficient evidence to support the hypotheses that the extent of disclosure is
directly related to profitability and sales growth of a company.
Table 7 Regression results of extent of disclosure against company characteristics
Adjusted R2 = 0.385 F = 23.982 Sig. = 0.000 Coefficient t p-value Constant 0.298 1.406 0.163 Margin 0.191 1.141 0.256 Growth 0.00187 0.476 0.635 Leverage 1.541 8.108 0.000** **Significant at 0.01
Leverage of a company is the only variable that is significantly associated with the
level of disclosure. The β and p values suggest that the relationship is positive and is
significant at the 1 percent level. This implies that as the leverage of a company
increases, the level of disclosure provided in the notes increases. This finding is
consistent with those of Courtis (1979), Hossain and Adams (1995) and Schadewitz
and Blevins (1998). It supports the agency theory (see Jensen and Meckling, 1976),
which argued that higher monitoring costs would be incurred by firms that are highly
leveraged. As financial disclosure is used for monitoring purposes, firms that are
highly leveraged would disclose more information in the quarterly reports.
CONCLUSION
Analysis of 117 quarterly reports issued for the quarter ended 30 September 2001
finds that companies disclose all the mandatory financial statements and relevant
selected explanatory notes as outlined by the KLSE. However, disclosure with respect
to voluntary information and mandatory items whose content is subject to the
22

discretion of the preparers was inadequate. Generally, companies tended merely to
satisfy the minimum disclosure requirements. Where the narrative disclosure is
concerned, there was a great dispersion on the extent of disclosure. The cost of
preparation and competition are the likely explanations for the phenomenon.
In determining the relationship between the extent of disclosure and the chosen
characteristics of companies, results of the regression test show that the leverage of a
company is the only variable that is significantly associated with the extent of
disclosure and the relationship is positive. This is in agreement with the hypothesis
that highly leveraged companies would disclose more information than the lowly
leveraged companies. Profitability and growth do not appear to influence the extent of
disclosure.
The conservative statements provided by companies and a number of cases of non-
compliance may not benefit the users much in making their decisions. In order to
improve disclosure and benefit the users, regulations and enforcements should be
strengthened. For instance, the regulatory bodies could strengthen the requirements
by not only requiring additional items of disclosure, but also reducing the ambiguity
so that there will be no room for exploitation. More importantly, this should be
followed by stricter monitoring procedures. It is believed that regulation alone,
without strict enforcement would not warrant quality reporting.
23

REFERENCES
Ahmed, K. and Nicholls, D. (1994). The impact of non-financial company
characteristics on mandatory disclosure compliance in developing countries: the case of Bangladesh. The International Journal of Accounting, 29(1), 62-77.
Bagshaw, K. (1999). Interim Financial Reporting: A Guide to Best Practice. London: Accountancy Books.
Beresford, D. R. and Rutzler, J.E. (1976). A survey of the new look to financial reporting. Financial Executive, 44(9), 38-50.
Chow, C.W. and Wong-Boren, A. (1987). Voluntary financial disclosure by Mexican Corporations. The Accounting Review, 62(3), 533-541.
Cooke, T.E. (1989). Disclosure in the Corporate Annual Reports of Swedish Companies. Accounting and Business Research, 19(74), 113-124.
Coopers and Lybrand, (1992). Reporting by Companies on Interim Results, A Guide to Best Practice, London: Coopers and Lybrand.
Courtis, J.K. (1979). Annual report disclosure in New Zealand: analysis of selected corporate attributes. New England Accounting Research Study No. 8.
Edwards, J.W., Dominiak, G.F. and Hedges, T.V. 1972. Interim Financial Reporting, New York: National Association of Accountants.
Guthrie, J.E. and Parker, L.D. (1990). Corporate social disclosure practice: a comparative international analysis. Advances in Public Interest Accounting, 3, 159-176.
Haniffa, R. and Cooke, T. (2002). Culture, corporate governance and disclosure in Malaysian Corporations. ABACUS, 38(3), 317-349.
Holmes, G. 1971. Interim Statements. Accountancy, 82(September), 18-522. Hossain, M. and Adams, M. (1995). An empirical study of voluntary financial
disclosure by Australian listed companies. Akauntan Nasional. July, 12-14. Hussey, R. and Woolfe, S. (1994). Interim statements and preliminary profit
announcements, The Research Board Monograph Series, London: ICAEW. Hussey, R. and Woolfe, S. (1998). The auditors’ review report. Managerial Auditing
Journal, 13(8), 448-454. Jensen, M. and Meckling, W. (1976). Theory of the firm: managerial behavior,
agency cost and ownership structure. Journal of Financial Economics, 3(4), 305-360.
Kanto, A.J. and Schadewitz, H.J. (1997). A multidimensional model for the disclosure policy of a firm. Scandinavian Journal of management, 13(3), 229-249.
Kleinbaum, D., Kupper, L., and Muller, K. (1988). Applied Regression Analysis and Other Multivariable Methods, Boston: PWS-KENT.
Ku Ismail, K.N.I. and Abdullah, S.N. (1998). Mandatory disclosure in the annual reports of general insurers in Malaysia. Jurnal Analisis, Universiti Utara Malaysia, 5 (1&2), 47-66.
Ku Ismail, K.N.I. and Chandler, R. (2004). The timeliness of quarterly financial reports of companies in Malaysia, Asian Review of Accounting, 12(1): 1-18.
Kuala Lumpur Stock Exchange. (1999). KLSE Strengthens Corporate Accountability of PLCs, Press Release, 11 March, [WWW] <http://www.klse.com.my/ website/news/pr/> [Accessed 8 March 2000].
Kuala Lumpur Stock Exchange. (2000). Investors’ Digest, February, Kuala Lumpur: KLSE.
24

Kuala Lumpur Stock Exchange. (2001). Listing Requirements of Kuala Lumpur Stock Exchange, Kuala Lumpur: KLSE.
Kuala Lumpur Stock Exchange. (2002). KLSE announces amendments to quarterly financial reporting for public listed companies. Press Release, 5 July, http://www.klse.com.my/website/news/ pr/.
Lambert, M.R., Cartwright, D.H., O’Connor, M.H. and Walsh, M. (1991). Interim Financial Reporting: A Continuous Process, Toronto: The Canadian Institute of Chartered Accountants.
Lipay, R.J. (1972). What’s happening with interim financial reporting? Financial Executive, 40(10), 28-34.
Lunt, M.H.C. (1982). The Role of Interim Accounts and Preliminary Profit Announcements in Financial Reporting, London: The Institute of Chartered Accountants in England and Wales.
Ma, R. (1997). Standard setting issues and the International Accounting Standards, Chapter 5, In: Ma, R. ed. Financial Reporting in the Pacific Asia Region, Singapore: World Scientific.
Maingot, M. (1983). Published interim reports in the United Kingdom. The International Journal of Accounting, 18, 133-149.
McEwen, R.A. and Schwartz, B.N. (1992). Are firms complying with the minimum standards for interim financial reporting? Accounting Horizons, 6(1), 75-87.
Naser, K. (1998). Comprehensiveness of disclosure of non-financial companies listed on the Amman financial market. International Journal of Commerce and Management, 8(1), 88-119.
Schadewitz, H.J. and Blevins, D.R. (1998). Major determinants of interim disclosures in an emerging market. American Business Review, 16(1), 41-55.
Singhvi, S.S. (1968). Characteristics and implications of inadequate disclosure: a case study of India. The International Journal of Accounting, 3(2), 29-43.
Singhvi, S.S. and Desai, H.B. (1971). An empirical analysis of the quality of corporate financial disclosure. The Accounting Review, 46(1), 129-138.
Smith, R. and Taffler, L.W. (2000). The chairman’s statement – A content analysis of discretionary narrative disclosures. Accounting, Auditing and Accountability Journal, 13(5), 624-646.
Tan, S. and Tower, G. D. (1997). Comparing compliance: Too much regulation, or insufficient attention? Australian CPA, 67(9), 56-59.
Taylor, R.G. (1965). A look at published interim reports. Accounting Review, 40, 89-96.
Watts, R.L. and Zimmerman, J.L. 1986. Positive Accounting Theory, New Jersey: Prentice-Hall.
Zeghal, D. and Ahmed, S.A. (1990). Comparison of social responsibility information disclosure media used by Canadian firms. Accounting, Auditing and Accountability Journal, 3(1), 38-53.
25