Embed Size (px)
Citation preview

Quantitative Research Methods
KASHIF QADRI
Measurement & Scaling Quantification Lecture Week 2

Overview The nature of data Types of data
Scale - types of scales Primary Vs. Secondary Data Methods of primary data collection Tools of quantitative data collection
Comparative scaling Non-comparative scaling Multi-item scaling
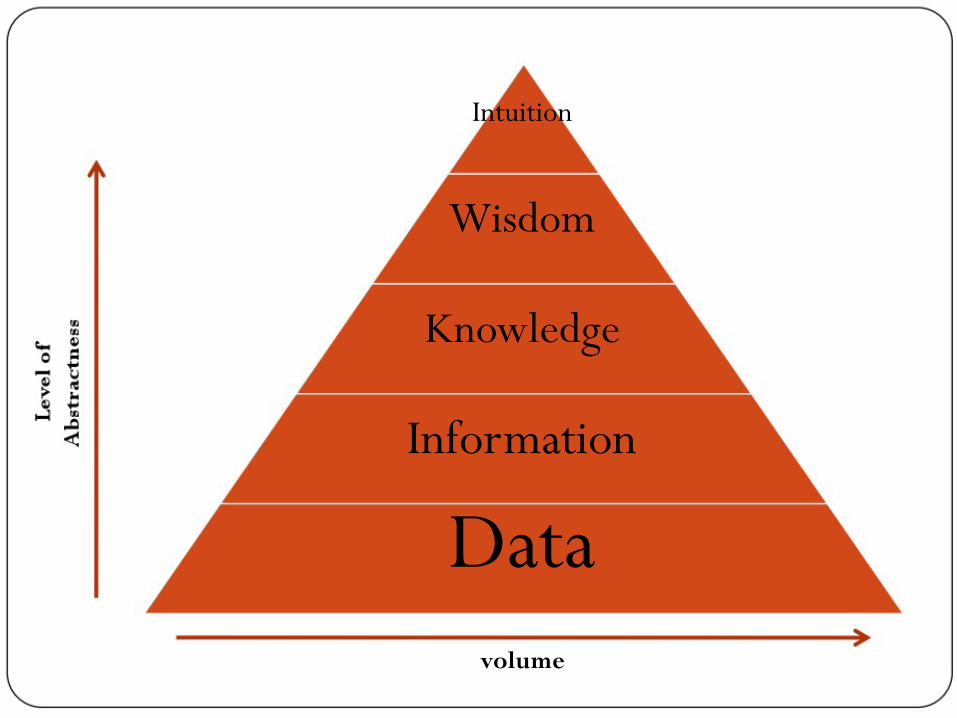
Intuition
Wisdom
Knowledge
Information Data
volume
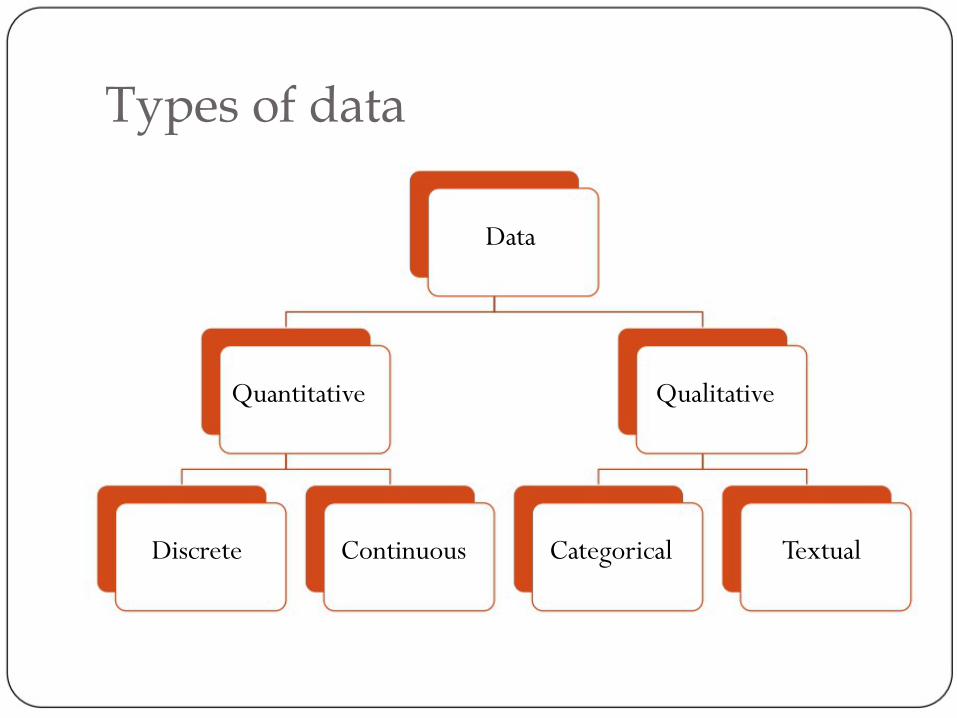
Types of data
Data
Quantitative
Qualitative
Discrete
Continuous
Categorical
Textual
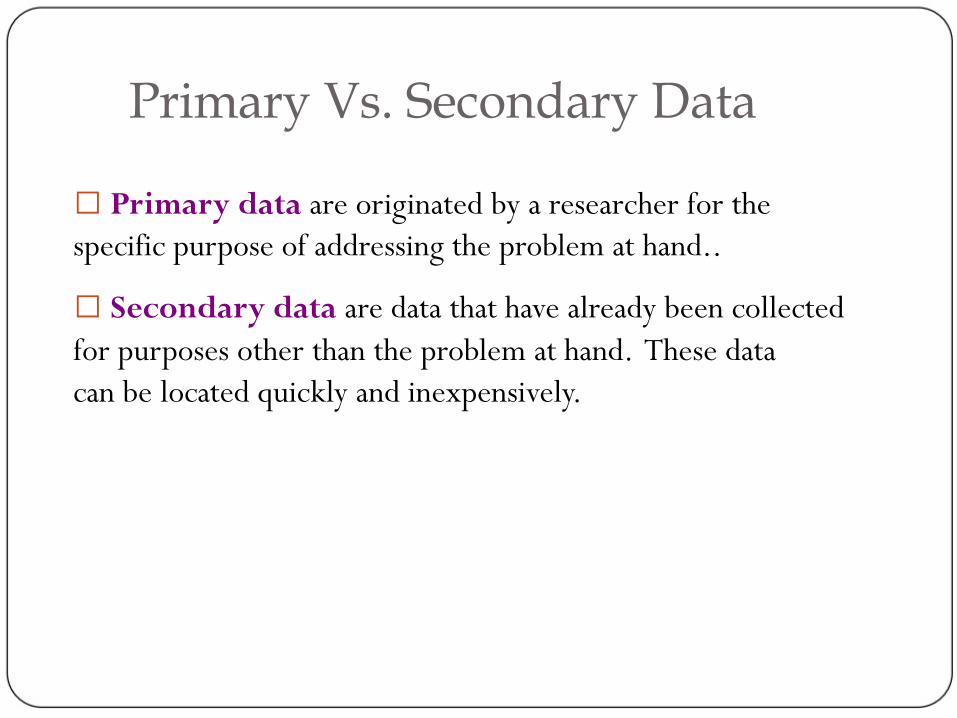
Primary Vs. Secondary Data
Primary data are originated by a researcher for the specific purpose of addressing the problem at hand.. Secondary data are data that have already been collected for purposes other than the problem at hand. These data can be located quickly and inexpensively.

Data Sources
Primary Data Collection
Observation
Experimentation
Secondary Data Compilation
Print or Electronic
Survey
Interviews

A Comparison of Primary & Secondary Data
Primary Data
Secondary Data
Collection purpose
For the problem at hand
For other problems Collection process
Very involved
Rapid & easy Collection cost
High
Relatively low Collection time
Long
Short
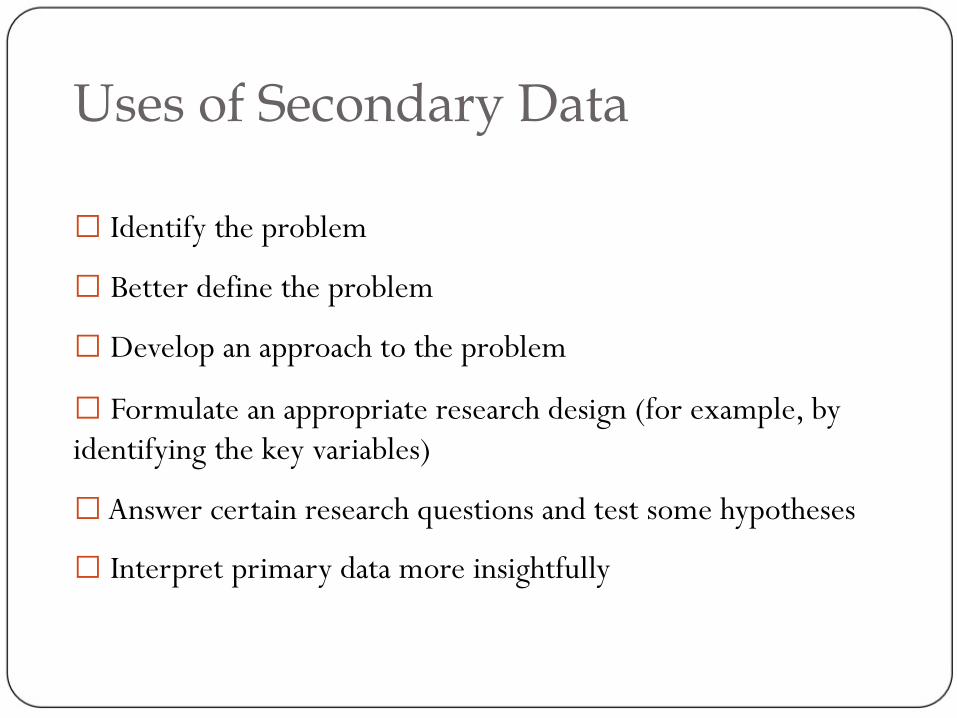
Uses of Secondary Data Identify the problem Better define the problem Develop an approach to the problem Formulate an appropriate research design (for example, by identifying the key variables) Answer certain research questions and test some hypotheses
Interpret primary data more insightfully
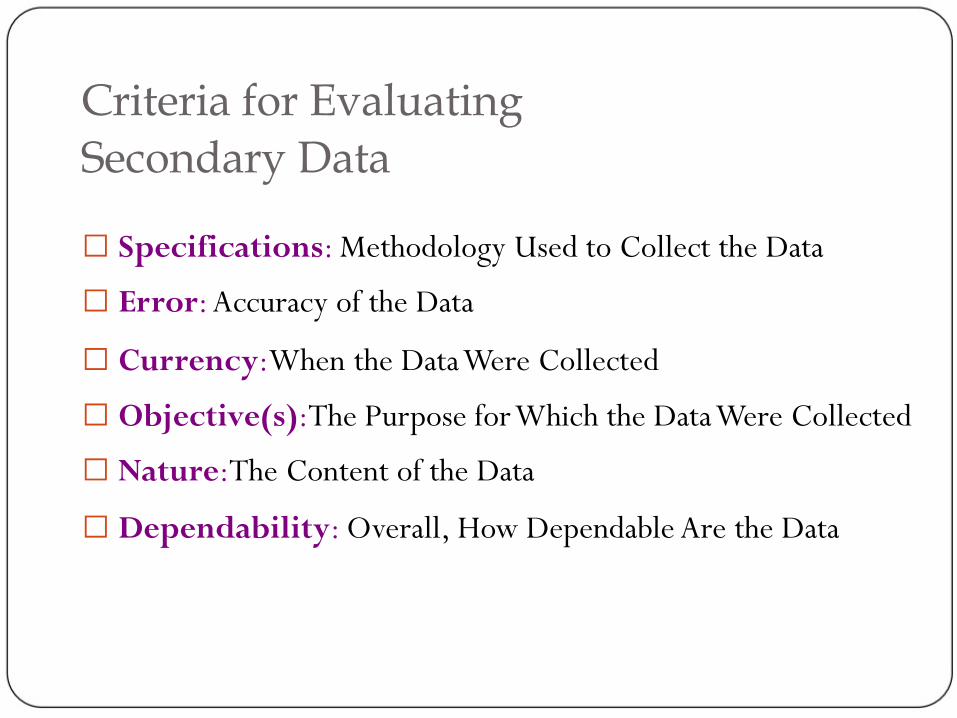
Criteria for Evaluating Secondary Data Specifications: Methodology Used to Collect the Data Error: Accuracy of the Data
Currency:When the Data Were Collected Objective(s):The Purpose for Which the Data Were Collected Nature:The Content of the Data
Dependability: Overall, How Dependable Are the Data
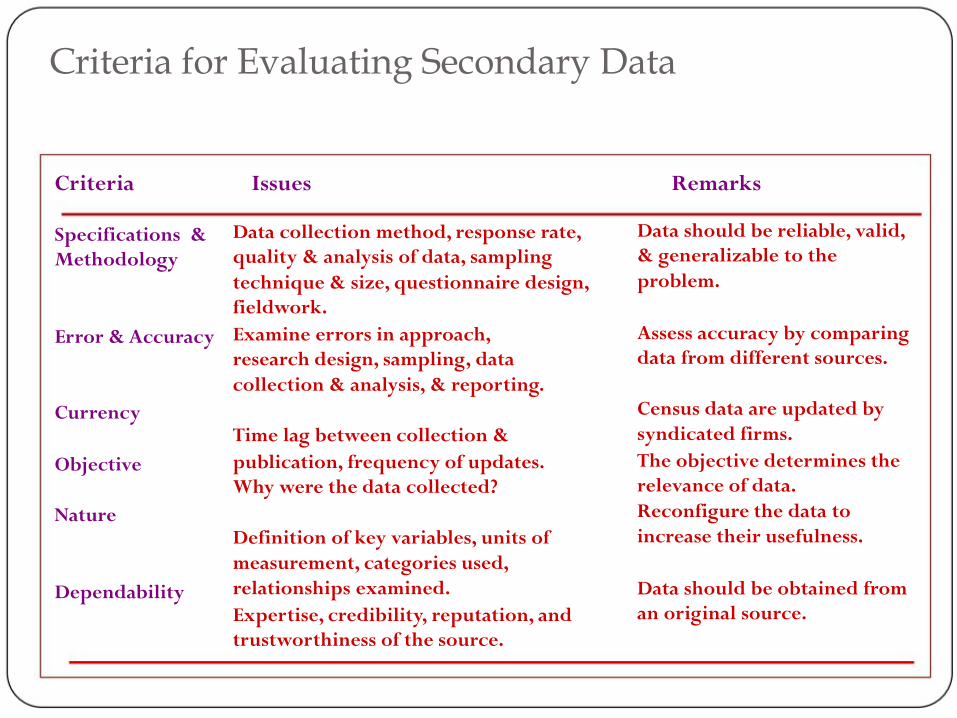
Criteria for Evaluating Secondary Data
Criteria
Issues
Remarks
Specifications & Methodology
Error & Accuracy
Currency Objective Nature
Dependability
Data collection method, response rate, quality & analysis of data, sampling technique & size, questionnaire design, fieldwork. Examine errors in approach, research design, sampling, data collection & analysis, & reporting. Time lag between collection & publication, frequency of updates. Why were the data collected? Definition of key variables, units of measurement, categories used, relationships examined. Expertise, credibility, reputation, and trustworthiness of the source.
Data should be reliable, valid, & generalizable to the problem. Assess accuracy by comparing data from different sources. Census data are updated by syndicated firms. The objective determines the relevance of data. Reconfigure the data to increase their usefulness. Data should be obtained from an original source.
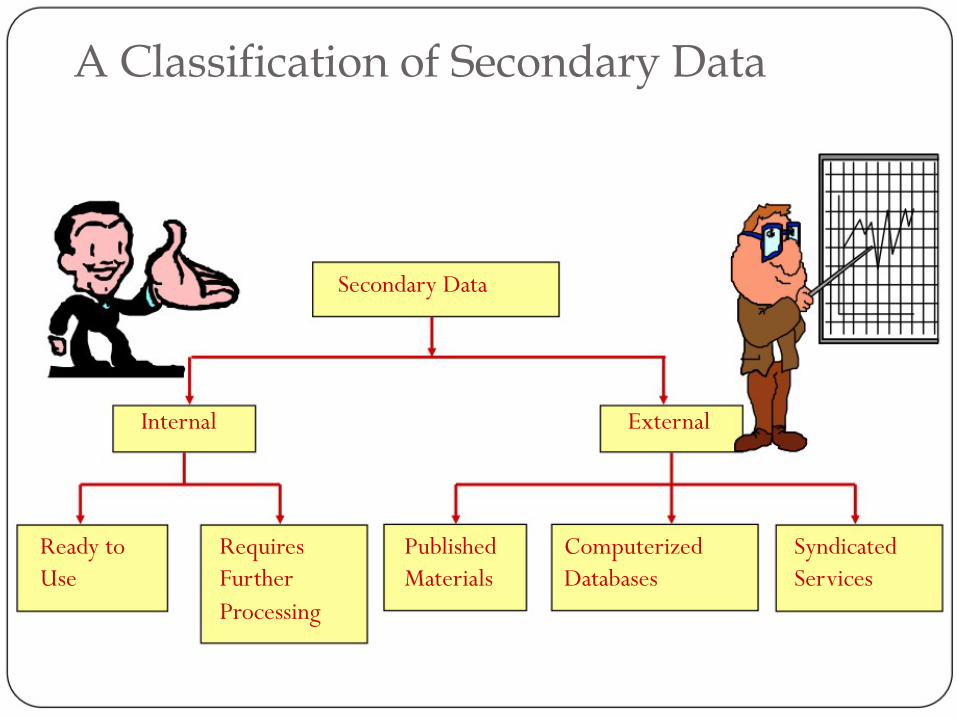
A Classification of Secondary Data
Secondary Data
Internal
External
Ready to
Requires
Published
Computerized
Syndicated Use
Further
Materials
Databases
Services Processing
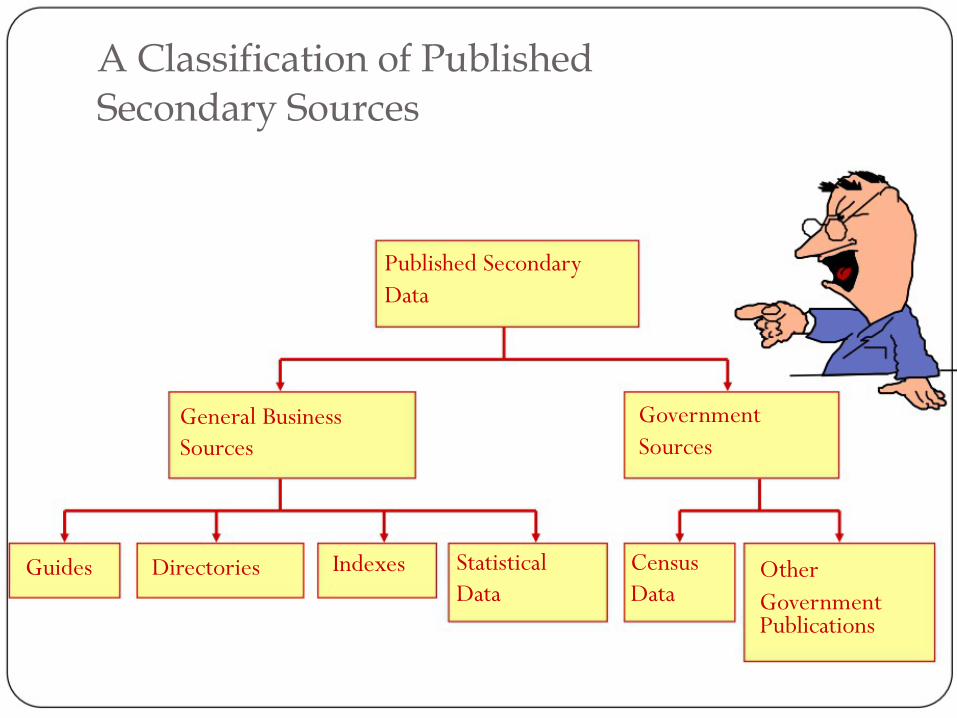
A Classification of Published Secondary Sources
Published Secondary Data
General Business Sources
Indexes
Government Sources
Statistical Census
Guides Directories Data Data
Other Government Publications
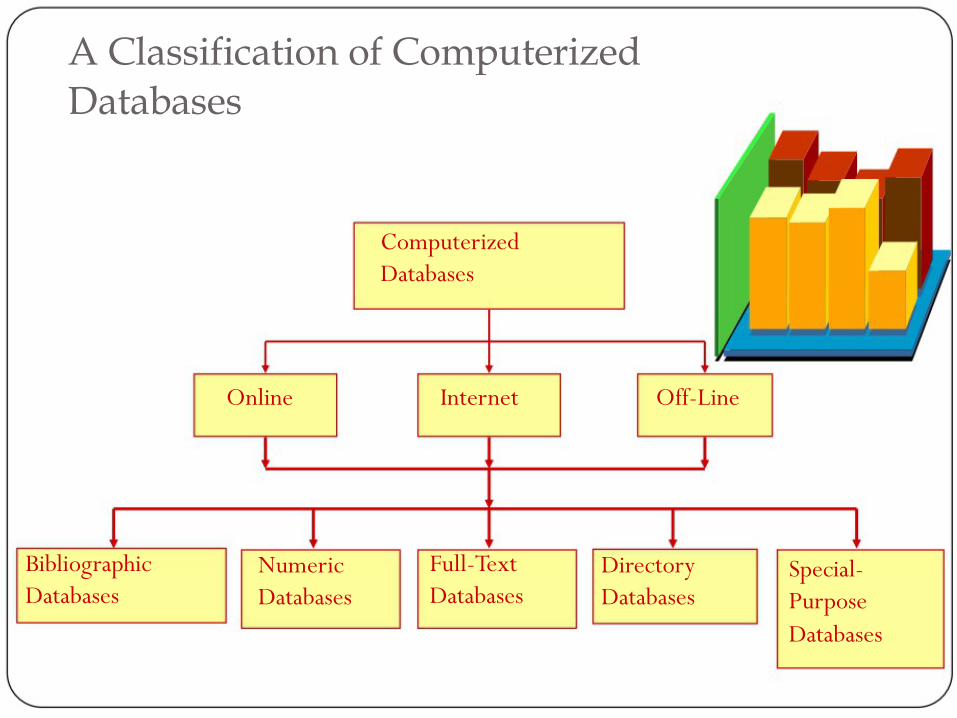
A Classification of Computerized Databases
Computerized Databases
Online
Internet
Off-Line
Bibliographic
Numeric
Full-Text
Directory
Special- Databases
Databases
Databases
Databases
Purpose Databases
Measurement and Scaling
Measurement means assigning numbers or other symbols to characteristics of objects according to certain pre-specified rules.
One-to-one correspondence between the numbers and the characteristics being measured. The rules for assigning numbers should be standardized and applied uniformly. Rules must not change over objects or time.

Measurement and Scaling Scaling involves creating a continuum upon which measured objects are located.
Consider an attitude scale from 1 to 100. Each respondent is assigned a number from 1 to 100, with 1 = Extremely Unfavorable, and 100 = Extremely Favorable. Measurement is the actual assignment of a number from 1 to 100 to each respondent. Scaling is the process of placing the respondents on a continuum with respect to their attitude toward department stores.
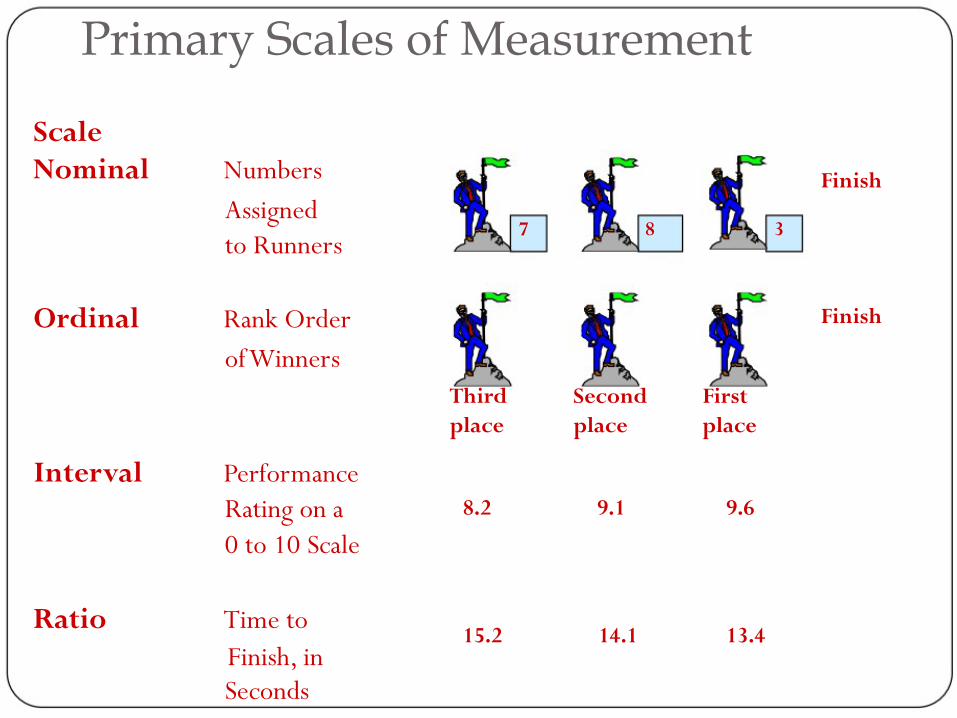
Primary Scales of Measurement
Scale Nominal Numbers Assigned
to Runners
Ordinal Rank Order of Winners
Interval Performance Rating on a
0 to 10 Scale
Ratio Time to Finish, in
Seconds
7 8
Third Second place place
8.2 9.1
15.2 14.1
Finish
3
Finish
First place
9.6
13.4
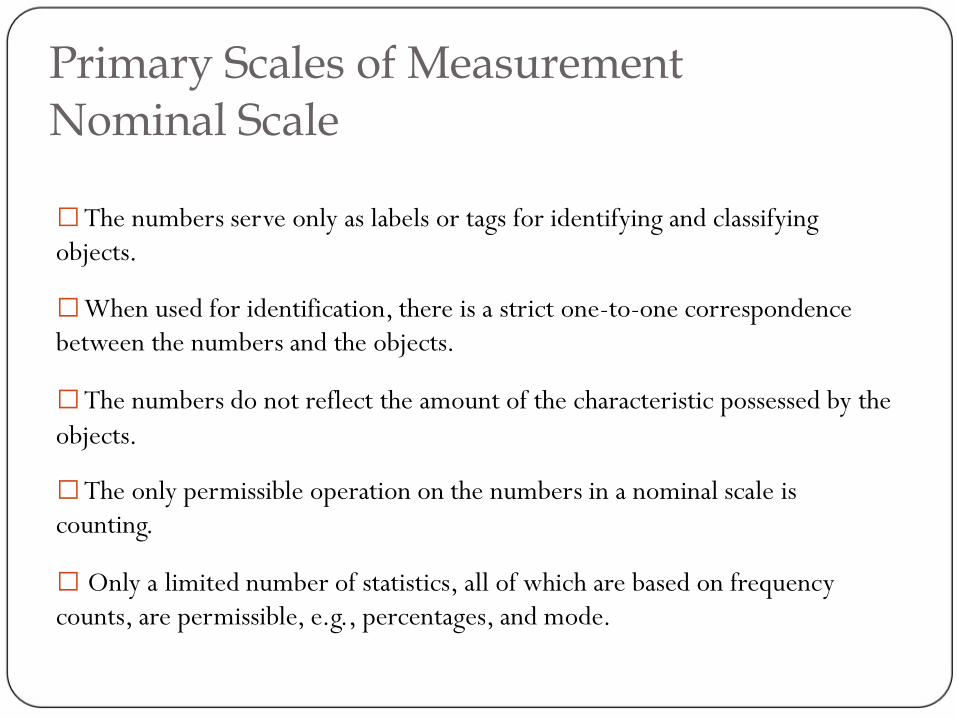
Primary Scales of Measurement Nominal Scale The numbers serve only as labels or tags for identifying and classifying objects. When used for identification, there is a strict one-to-one correspondence between the numbers and the objects. The numbers do not reflect the amount of the characteristic possessed by the objects. The only permissible operation on the numbers in a nominal scale is counting. Only a limited number of statistics, all of which are based on frequency counts, are permissible, e.g., percentages, and mode.
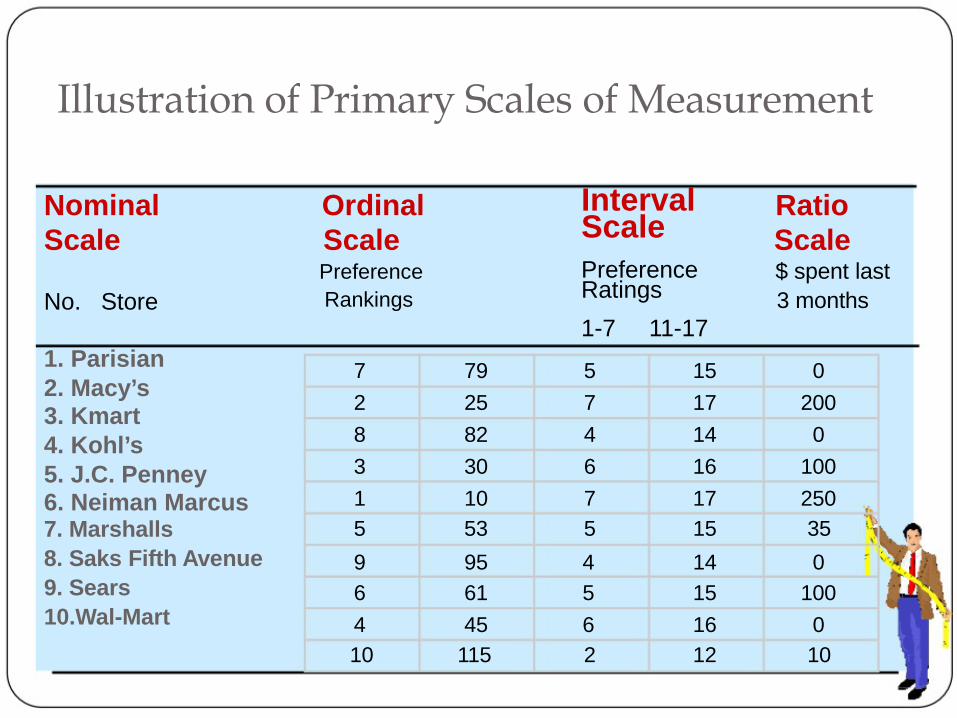
Illustration of Primary Scales of Measurement
Nominal Scale No. Store 1. Parisian 2. Macy’s 3. Kmart 4. Kohl’s 5. J.C. Penney 6. Neiman Marcus
Ordinal Scale Preference Rankings
7 79 2 25 8 82 3 30 1 10
Interval Scale Preference Ratings 1-7 11-17 5 15 7 17 4 14 6 16 7 17
Ratio Scale $ spent last 3 months
0 200
0 100
250 7. Marshalls
5
53
5
15
35 8. Saks Fifth Avenue
9. Sears 10.Wal-Mart
9 95 4 14 0 6 61 5 15 100 4 45 6 16 0 10
115
2
12
10
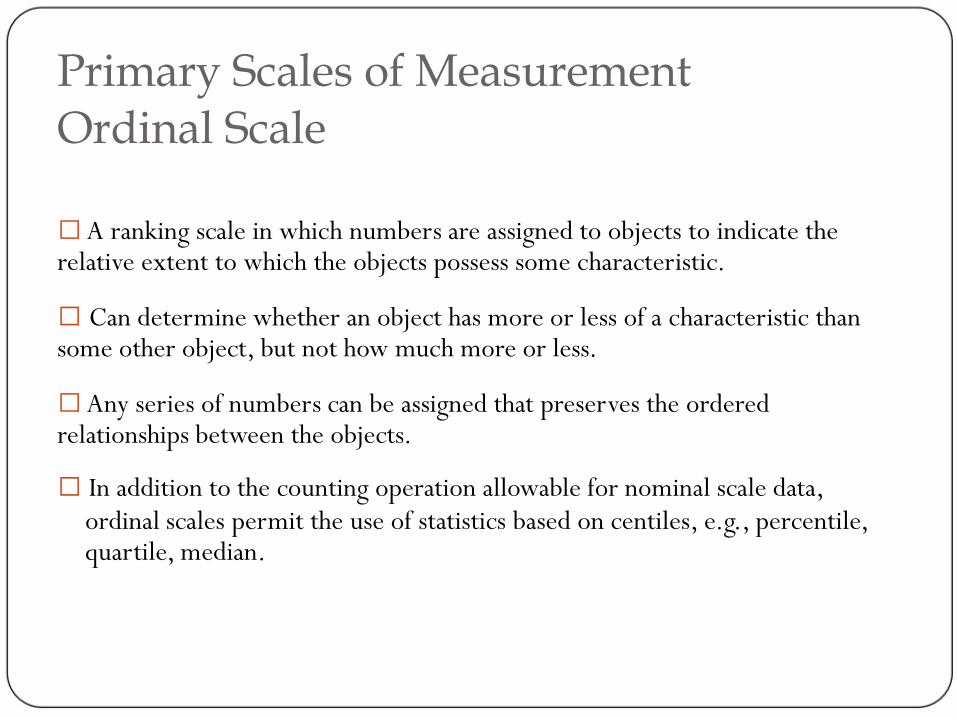
Primary Scales of Measurement Ordinal Scale A ranking scale in which numbers are assigned to objects to indicate the relative extent to which the objects possess some characteristic. Can determine whether an object has more or less of a characteristic than some other object, but not how much more or less. Any series of numbers can be assigned that preserves the ordered relationships between the objects. In addition to the counting operation allowable for nominal scale data, ordinal scales permit the use of statistics based on centiles, e.g., percentile,
quartile, median.
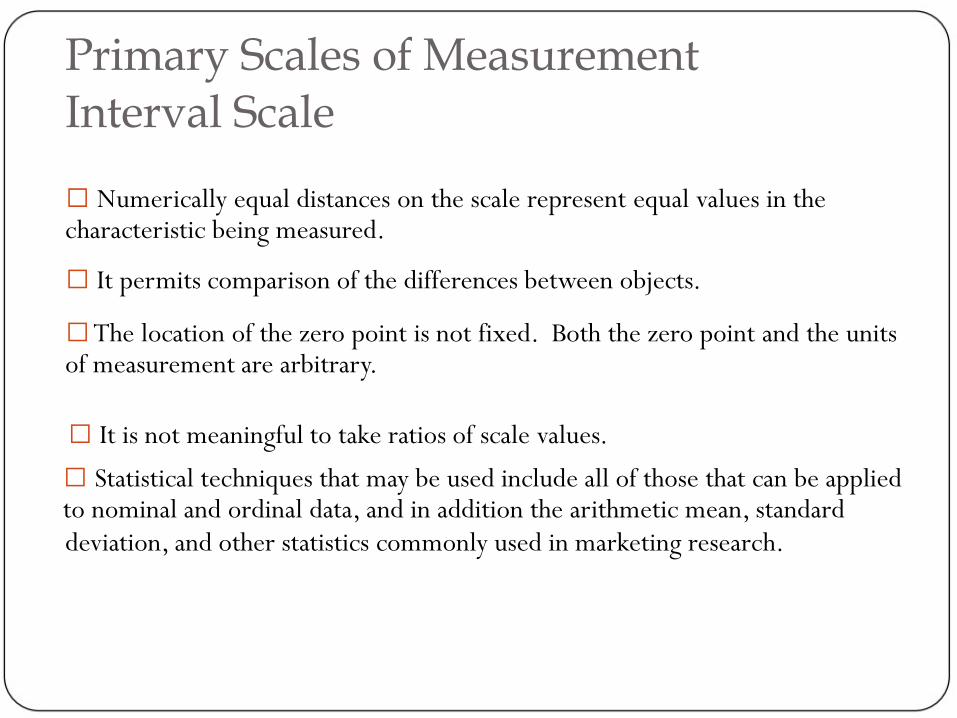
Primary Scales of Measurement Interval Scale Numerically equal distances on the scale represent equal values in the characteristic being measured. It permits comparison of the differences between objects. The location of the zero point is not fixed. Both the zero point and the units of measurement are arbitrary. It is not meaningful to take ratios of scale values. Statistical techniques that may be used include all of those that can be applied to nominal and ordinal data, and in addition the arithmetic mean, standard deviation, and other statistics commonly used in marketing research.
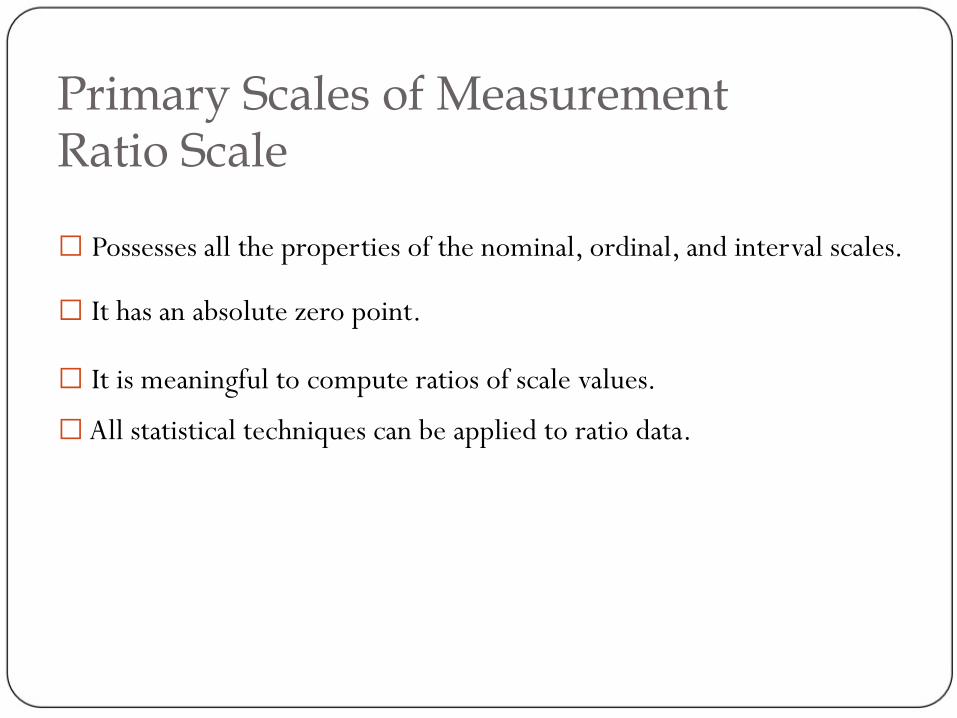
Primary Scales of Measurement Ratio Scale Possesses all the properties of the nominal, ordinal, and interval scales.
It has an absolute zero point.
It is meaningful to compute ratios of scale values. All statistical techniques can be applied to ratio data.
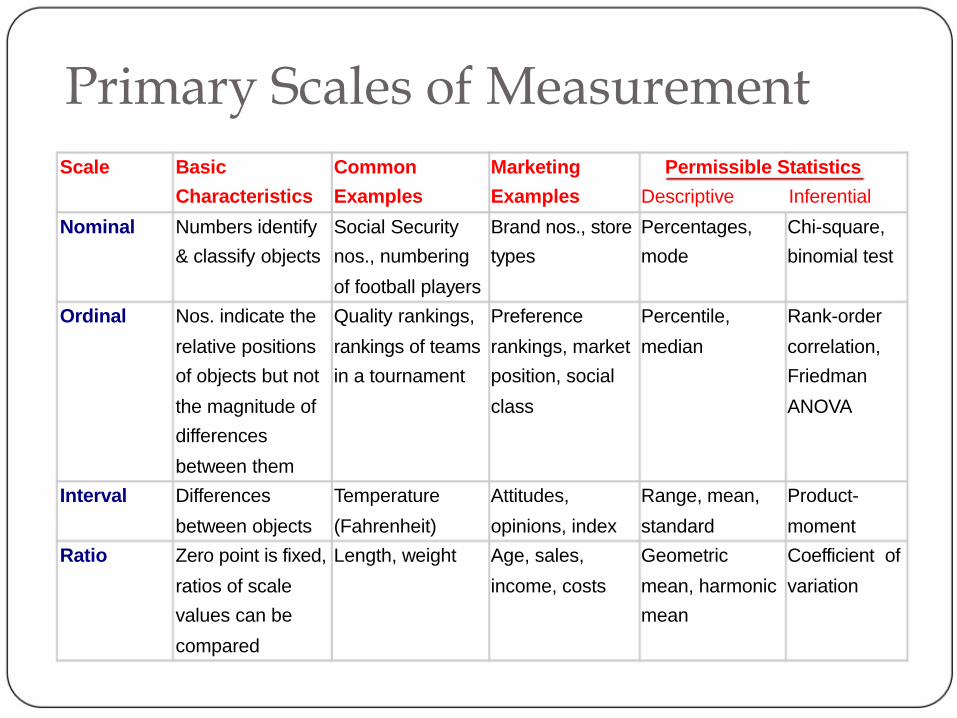
Primary Scales of Measurement Scale
Basic
Common
Marketing
Permissible Statistics Characteristics
Examples
Examples
Descriptive
Inferential Nominal
Numbers identify
Social Security
Brand nos., store
Percentages,
Chi-square, & classify objects
nos., numbering
types
mode
binomial test of football players
Ordinal
Nos. indicate the
Quality rankings,
Preference
Percentile,
Rank-order relative positions
rankings of teams
rankings, market
median
correlation, of objects but not
in a tournament
position, social
Friedman the magnitude of
class
ANOVA differences
between them Interval
Differences
Temperature
Attitudes,
Range, mean,
Product- between objects
(Fahrenheit)
opinions, index
standard
moment Ratio
Zero point is fixed,
Length, weight
Age, sales,
Geometric
Coefficient of ratios of scale
income, costs
mean, harmonic
variation values can be
mean compared
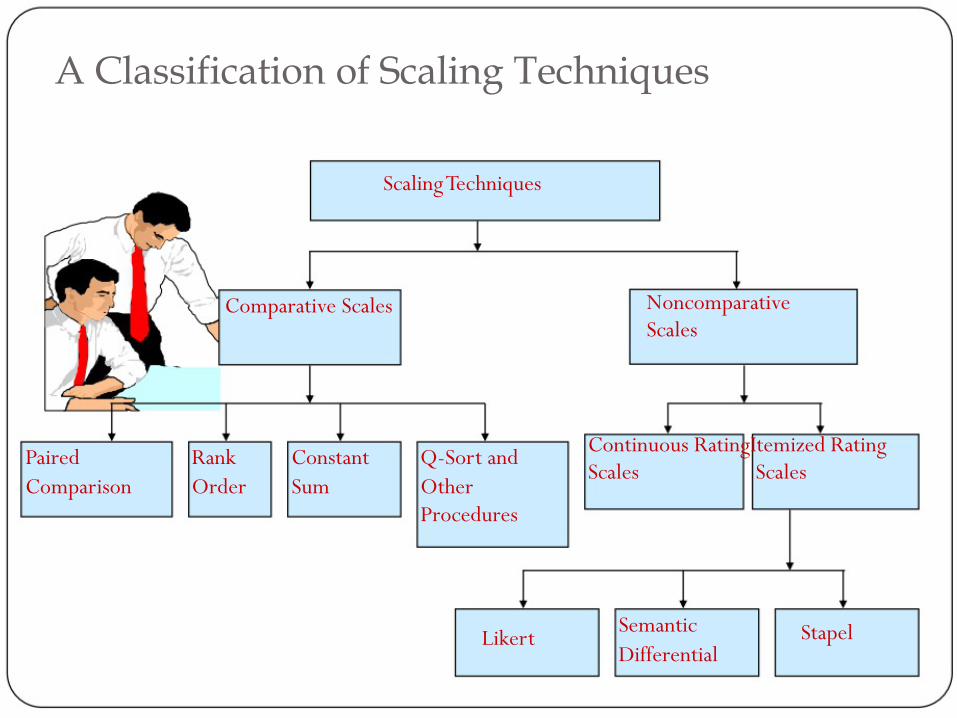
A Classification of Scaling Techniques
Scaling Techniques
Comparative Scales
Paired Rank Constant Q-Sort and Comparison Order Sum Other Procedures
Likert
Noncomparative Scales
Continuous RatingItemized Rating Scales Scales
Semantic
Stapel Differential
A Comparison of Scaling Techniques Comparative scales involve the direct comparison of stimulus objects. Comparative scale data must be interpreted in relative terms
and have only ordinal or rank order properties.
In noncomparative scales, each object is scaled independently of the others in the stimulus set. The resulting data are generally assumed to be interval or ratio scaled.
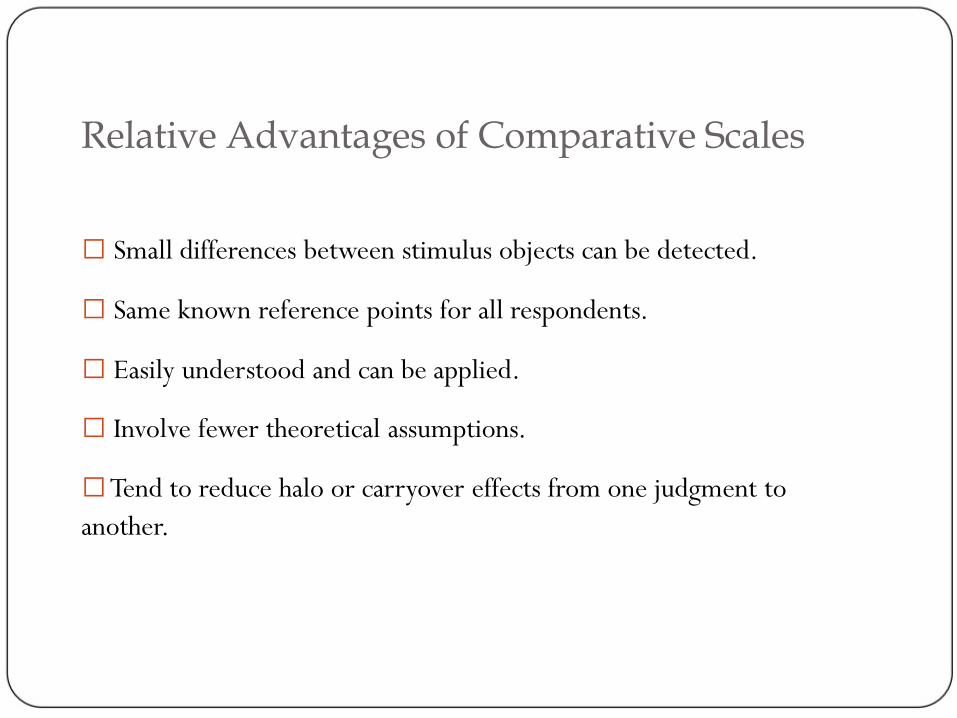
Relative Advantages of Comparative Scales
Small differences between stimulus objects can be detected.
Same known reference points for all respondents.
Easily understood and can be applied.
Involve fewer theoretical assumptions.
Tend to reduce halo or carryover effects from one judgment to another.
Relative Disadvantages of Comparative Scales Ordinal nature of the data Inability to generalize beyond the stimulus objects scaled.
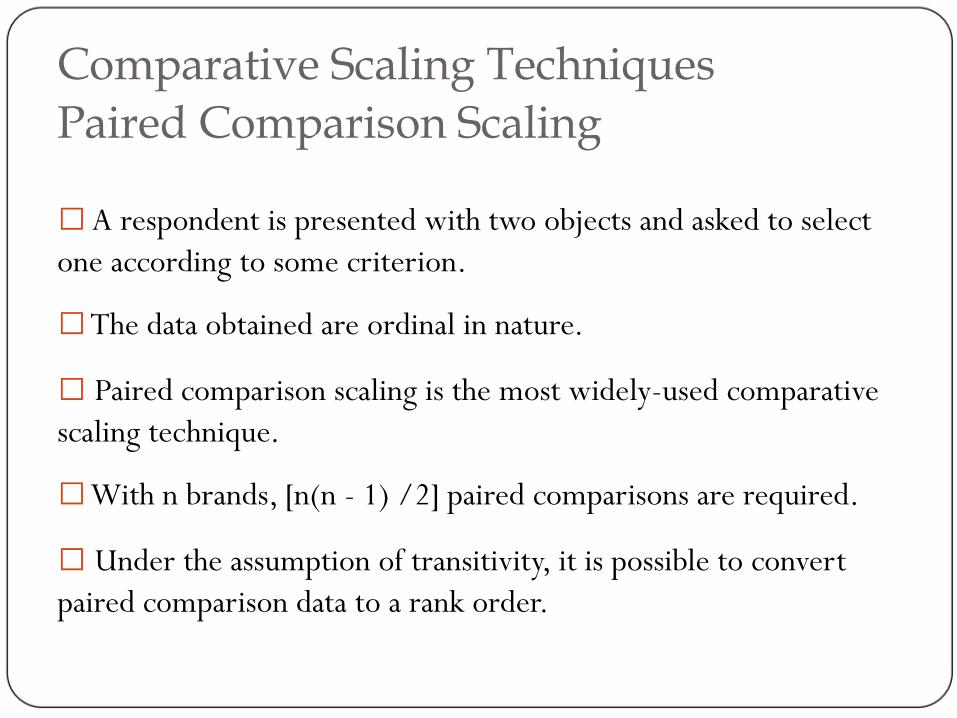
Comparative Scaling Techniques Paired Comparison Scaling A respondent is presented with two objects and asked to select one according to some criterion. The data obtained are ordinal in nature. Paired comparison scaling is the most widely-used comparative scaling technique. With n brands, [n(n - 1) /2] paired comparisons are required. Under the assumption of transitivity, it is possible to convert paired comparison data to a rank order.
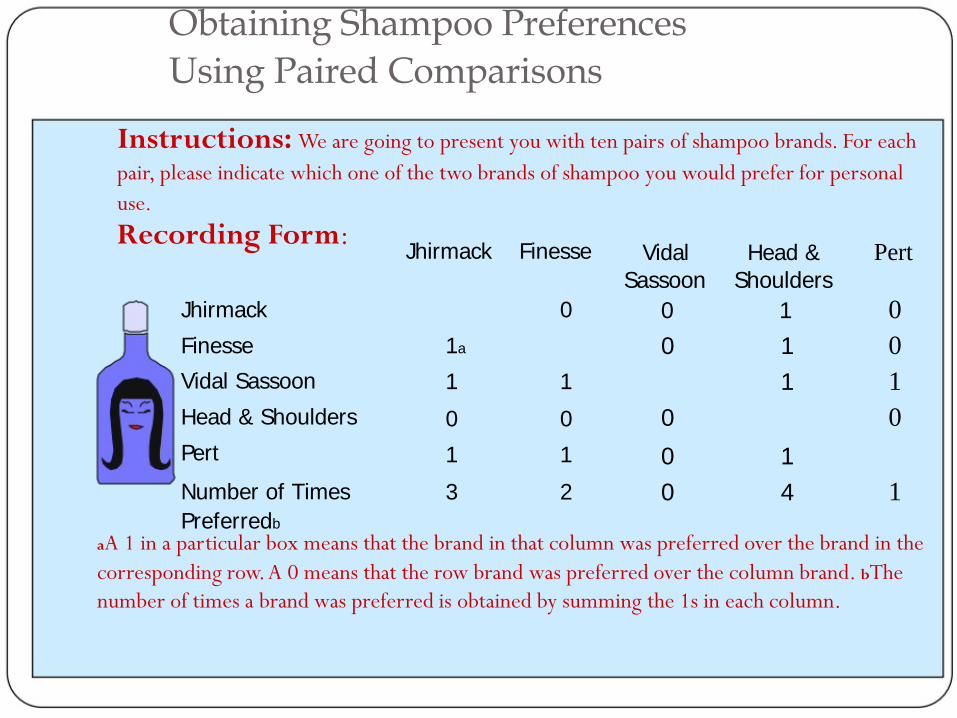
Obtaining Shampoo Preferences Using Paired Comparisons
Instructions: We are going to present you with ten pairs of shampoo brands. For each pair, please indicate which one of the two brands of shampoo you would prefer for personal use. Recording Form:
Jhirmack Finesse Vidal Sassoon Head & Shoulders Pert
Number of Times Preferredb
Jhirmack Finesse
0 1a
1 1 0 0 1 1 3 2
Vidal Head & Pert Sassoon Shoulders
0 1 0 0 1 0
1 1 0 0
0 1 0 4 1
aA 1 in a particular box means that the brand in that column was preferred over the brand in the corresponding row. A 0 means that the row brand was preferred over the column brand. bThe number of times a brand was preferred is obtained by summing the 1s in each column.
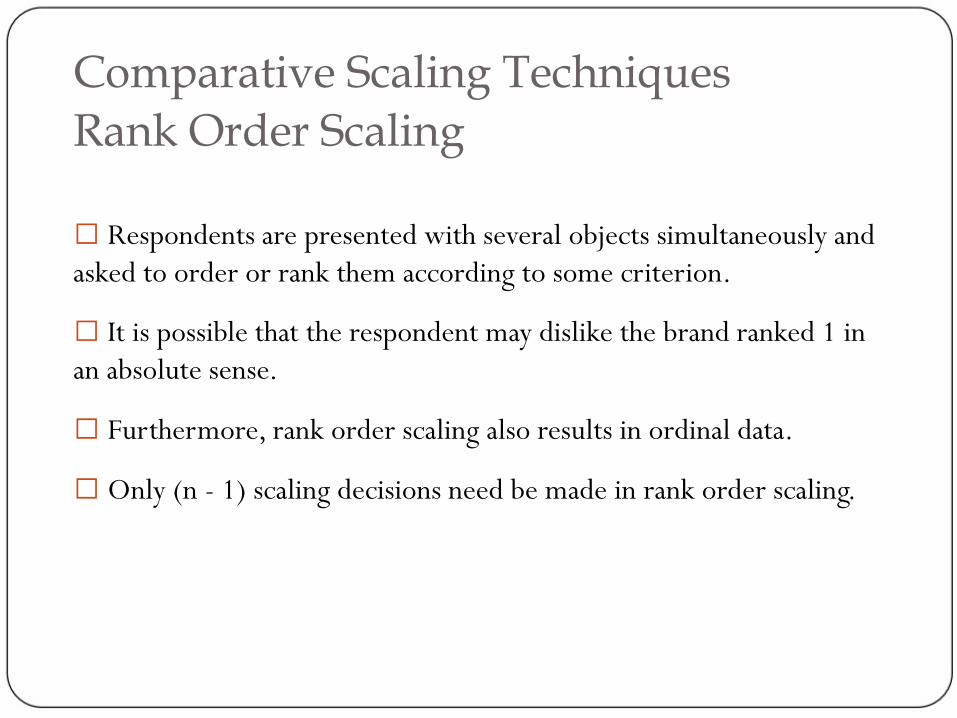
Comparative Scaling Techniques Rank Order Scaling Respondents are presented with several objects simultaneously and asked to order or rank them according to some criterion. It is possible that the respondent may dislike the brand ranked 1 in an absolute sense. Furthermore, rank order scaling also results in ordinal data. Only (n - 1) scaling decisions need be made in rank order scaling.
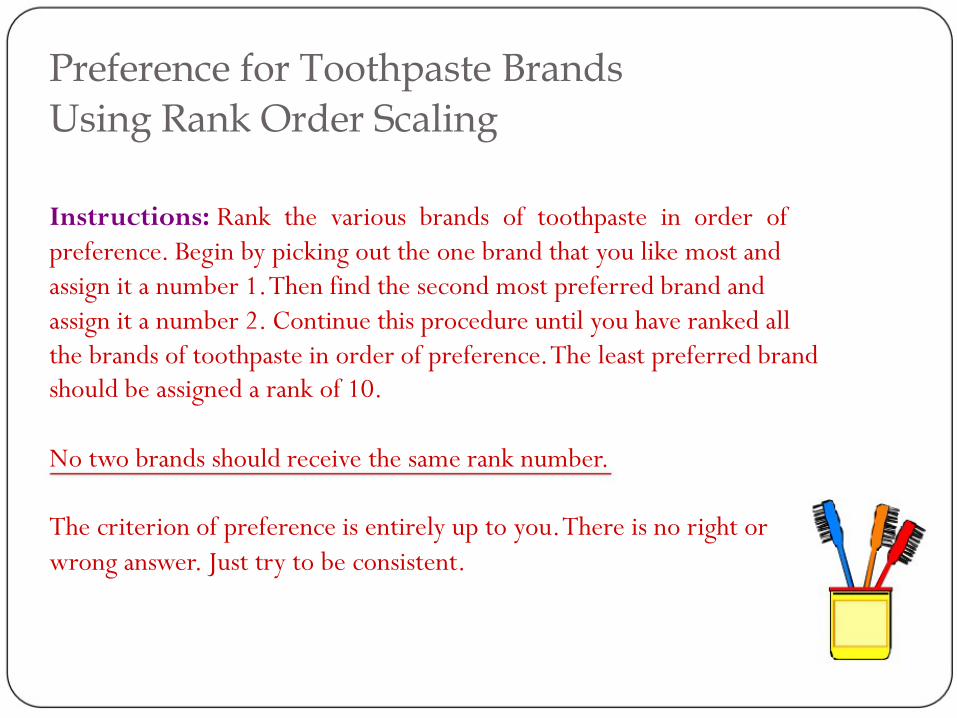
Preference for Toothpaste Brands Using Rank Order Scaling Instructions: Rank the various brands of toothpaste in order of preference. Begin by picking out the one brand that you like most and assign it a number 1. Then find the second most preferred brand and assign it a number 2. Continue this procedure until you have ranked all the brands of toothpaste in order of preference. The least preferred brand should be assigned a rank of 10. No two brands should receive the same rank number. The criterion of preference is entirely up to you. There is no right or wrong answer. Just try to be consistent.
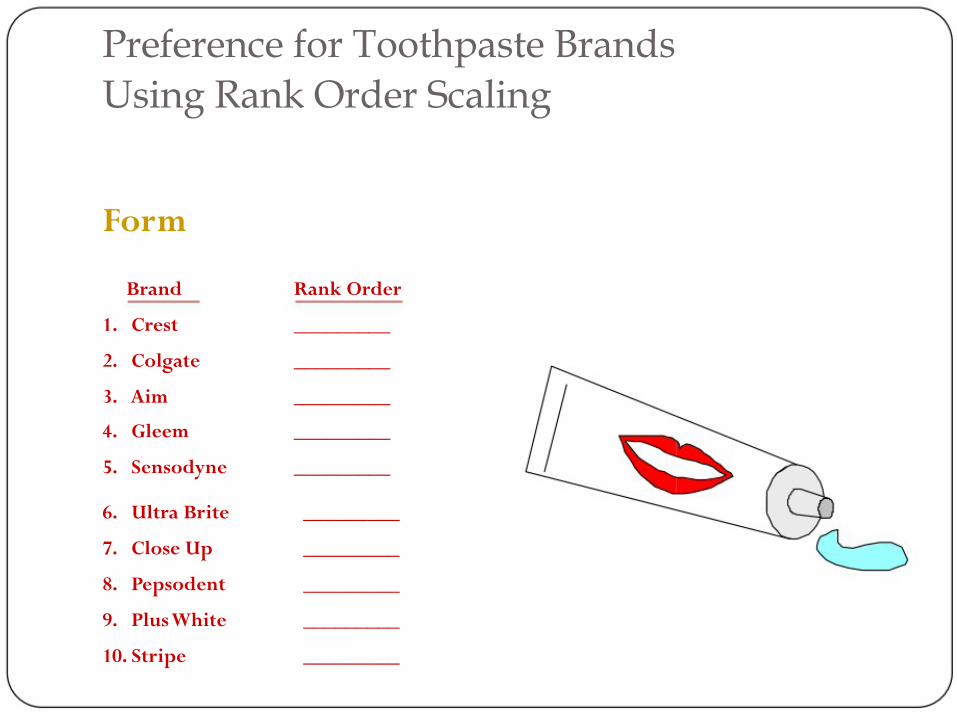
Preference for Toothpaste Brands Using Rank Order Scaling
Form
Brand
Rank Order 1. Crest
_________ 2. Colgate
_________ 3. Aim
_________ 4. Gleem
_________ 5. Sensodyne
_________
6. Ultra Brite
_________ 7. Close Up
_________ 8. Pepsodent
_________ 9. Plus White
_________ 10. Stripe
_________
Comparative Scaling Techniques Constant Sum Scaling Respondents allocate a constant sum of units, such as 100 points to attributes of a product to reflect their importance. If an attribute is unimportant, the respondent assigns it zero points. If an attribute is twice as important as some other attribute, it receives twice as many points. The sum of all the points is 100. Hence, the name of the scale.
Importance of Bathing Soap Attributes Using a Constant Sum Scale
Instructions On the next slide, there are eight attributes of bathing soaps. Please allocate 100 points among the attributes so that your allocation reflects the relative importance you attach to each attribute. The more points an attribute receives, the more important the attribute is. If an attribute is not at all important, assign it zero points. If an attribute is twice as important as some other attribute, it should receive twice as many points.
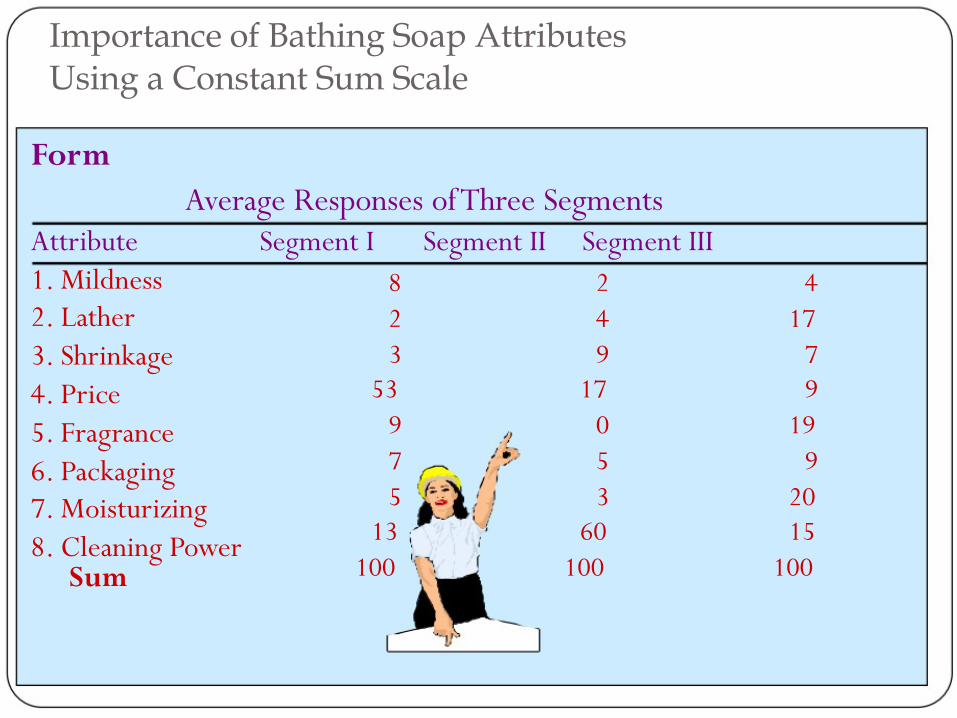
Importance of Bathing Soap Attributes Using a Constant Sum Scale
Form Average Responses of Three Segments
Attribute 1. Mildness 2. Lather 3. Shrinkage 4. Price 5. Fragrance 6. Packaging 7. Moisturizing 8. Cleaning Power Sum
Segment I Segment II Segment III 8 2 4
2 4 17 3 9 7 53 17 9
9 0 19 7 5 9 5 3 20 13 60 15
100 100 100
Noncomparative Scaling Techniques
Respondents evaluate only one object at a time, and for this reason non-comparative scales are often referred to as monadic scales. Non-comparative techniques consist of continuous and itemized rating scales.

Continuous Rating Scale Respondents rate the objects by placing a mark at the appropriate position on a line that runs from one extreme of the criterion variable to the other. The form of the continuous scale may vary considerably. How would you rate Sears as a department store? Version 1 Probably the worst - - - - - - -I - - - - - - - - - - - - - - - - - - - - - - Probably the best Version 2 Probably the worst - - - - - - -I - - - - - - - - - - - - - - - - - - - - - --Probably the best 0
10
20
30
40
50
60
70
80
90
100
Version 3 Very bad
Neither good
Very good nor bad
Probably the worst - - - - - - -I - - - - - - - - - - - - - - - - - - - - ---Probably the best 0
10
20
30
40
50
60
70
80
90
100
Itemized Rating Scales The respondents are provided with a scale that has a number or brief description associated with each category. The categories are ordered in terms of scale position, and the respondents are required to select the specified category that best
describes the object being rated.
The commonly used itemized rating scales are the Likert, semantic differential, and Stapel scales.

Likert Scale
The Likert scale requires the respondents to indicate a degree of agreement or disagreement with each of a series of statements about the stimulus objects.
Strongly
Disagree
Neither
Agree
Strongly disagree
agree nor
agree disagree
1. Sears sells high quality merchandise.
1
2X
3
4
5
2. Sears has poor in-store service.
1
2X
3
4
5
3. I like to shop at Sears.
1
2
3X
4
5
The analysis can be conducted on an item-by-item basis (profile analysis), or a total (summated) score can be calculated.
When arriving at a total score, the categories assigned to the negative statements by the respondents should be scored by reversing the scale.

Semantic Differential Scale The semantic differential is a seven-point rating scale with end
points associated with bipolar labels that have semantic meaning.
SEARS IS:
Powerful
--:--:--:--:-X-:--:--: Weak Unreliable
--:--:--:--:--:-X-:--: Reliable
Modern --:--:--:--:--:--:-X-: Old-fashioned
The negative adjective or phrase sometimes appears at the left side of the scale and sometimes at the right. This controls the tendency of some respondents, particularly those with very positive or very negative attitudes, to mark the right- or left-hand sides without reading the labels.
Individual items on a semantic differential scale may be scored on either a -3 to +3 or a 1 to 7 scale.
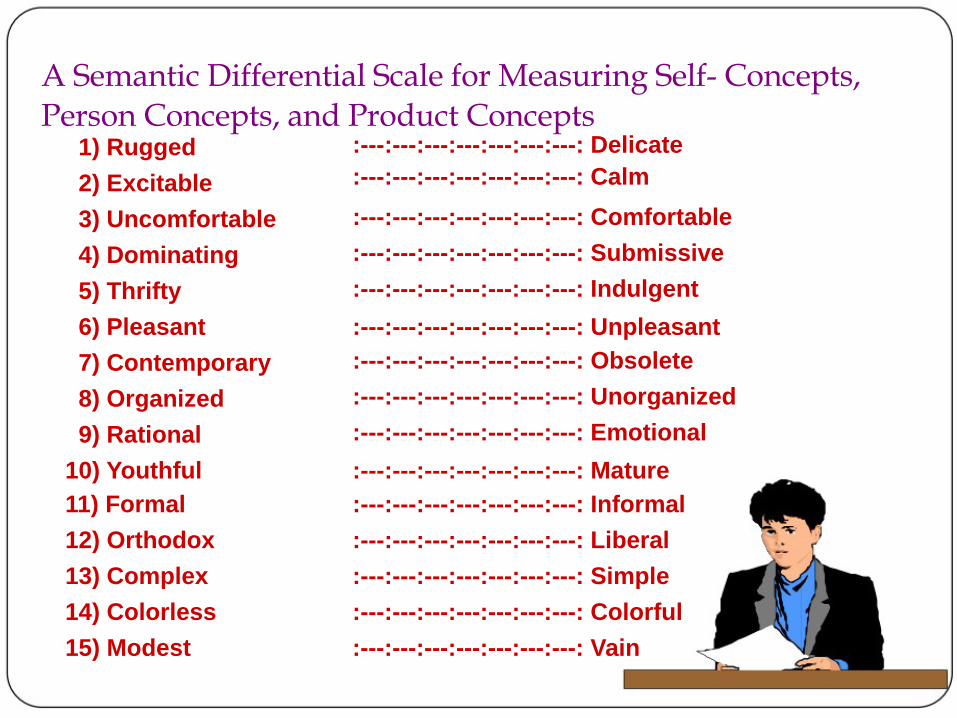
A Semantic Differential Scale for Measuring Self- Concepts, Person Concepts, and Product Concepts 1) Rugged
2) Excitable 3) Uncomfortable 4) Dominating 5) Thrifty 6) Pleasant 7) Contemporary 8) Organized 9) Rational 10) Youthful
11) Formal 12) Orthodox 13) Complex 14) Colorless 15) Modest
:---:---:---:---:---:---:---: Delicate :---:---:---:---:---:---:---: Calm :---:---:---:---:---:---:---: Comfortable :---:---:---:---:---:---:---: Submissive :---:---:---:---:---:---:---: Indulgent :---:---:---:---:---:---:---: Unpleasant :---:---:---:---:---:---:---: Obsolete :---:---:---:---:---:---:---: Unorganized :---:---:---:---:---:---:---: Emotional :---:---:---:---:---:---:---: Mature :---:---:---:---:---:---:---: Informal :---:---:---:---:---:---:---: Liberal :---:---:---:---:---:---:---: Simple :---:---:---:---:---:---:---: Colorful :---:---:---:---:---:---:---: Vain

Stapel Scale The Stapel scale is a unipolar rating scale with ten categories numbered from -5 to +5, without a neutral point (zero). This scale is usually presented vertically.
SEARS
+5
+5 +4
+4 +3
+3 +2
+2X +1
+1 HIGH QUALITY
POOR SERVICE -1
-1 -2
-2 -3
-3 -4X
-4 -5
-5 The data obtained by using a Stapel scale can be analyzed in the
same way as semantic differential data.