Embed Size (px)
Citation preview
1
Quantitative phosphoproteomics reveals pathways for coordination of cell growth and division by the fission yeast DYRK kinase Pom1
Arminja N. Kettenbach1,3, Lin Deng1, Youjun Wu1, Suzanne Baldissard1, Mark E. Adamo3, Scott A. Gerber1,2,3, and James B. Moseley1 1 – Department of Biochemistry, The Geisel School of Medicine at Dartmouth, Hanover, NH 03755, USA 2 – Department of Genetics, The Geisel School of Medicine at Dartmouth, Hanover, NH 03755, USA 3 – Norris Cotton Cancer Center, The Geisel School of Medicine at Dartmouth, Lebanon, NH 03756, USA Correspondence should be addressed to: James B. Moseley [email protected] Tel: 603-650-1159 Arminja N. Kettenbach [email protected] Tel: 603-653-9068 Running title: Quantitative phosphoproteomics for S. pombe Pom1
MCP Papers in Press. Published on February 26, 2015 as Manuscript M114.045245
Copyright 2015 by The American Society for Biochemistry and Molecular Biology, Inc.

2
Summary Complex phosphorylation-dependent signaling networks underlie the coordination of cellular growth and division. In the fission yeast S. pombe, the DYRK family protein kinase Pom1 regulates cell cycle progression through the mitotic inducer Cdr2, and controls cell polarity through unknown targets. Here, we sought to determine the phosphorylation targets of Pom1 kinase activity by SILAC-based phosphoproteomics. We defined a set of high-confidence Pom1 targets that were enriched for cytoskeletal and cell growth functions. Cdr2 was the only cell cycle target of Pom1 kinase activity that we identified in cells. Mutation of Pom1-dependent phosphorylation sites in the C-terminus of Cdr2 inhibited mitotic entry but did not impair Cdr2 localization. In addition, we found that Pom1 phosphorylated multiple substrates that function in polarized cell growth, including Tea4, Mod5, Pal1, the Rho GAP Rga7, and the Arf GEF Syt22. Purified Pom1 phosphorylated these cell polarity targets in vitro, confirming that they are direct substrates of Pom1 kinase activity and likely contribute to regulation of polarized growth by Pom1. Our study demonstrates that Pom1 acts in a linear pathway to control cell cycle progression while regulating a complex network of cell growth targets.

3
Introduction The coordination of cell growth and division represents a fundamental concept in cell
biology. The mechanisms that promote polarized growth and drive cell cycle progression are complex signaling networks that operate in a wide range of cell types and organisms. Understanding these networks and their molecular connections requires large-scale approaches that define the underlying biochemical reactions. Phosphorylation drives many events in both cell polarity and cell cycle signaling, and protein kinases that act in both processes represent key players in coordinated growth and division.
The fission yeast S. pombe has served as a long-standing model organism for studies on cell polarity and the cell cycle. The fission yeast protein kinase Pom1 is an intriguing candidate to function in the coordination of polarized growth and cell cycle progression. This DYRK family kinase was originally identified as a polarity mutant (hence the name Pom1) in a genetic screen for misshapen cells (1). Later studies revealed an additional role for Pom1 in cell cycle progression, where it delays mitotic entry until cells reach a critical size threshold (2,3). Thus, pom1∆ mutant cells display defects in both cell polarity and cell size at mitosis, as well as misplaced division septa (1-6). Mutations that impair Pom1 kinase activity mimic these deletion phenotypes, indicating a key role for Pom1-dependent phosphorylation. The pleiotropic phenotype of pom1 mutants might result from Pom1 phosphorylating distinct substrates for cell polarity versus mitotic entry, but the targets of Pom1 kinase activity are largely unknown. Only two Pom1 substrates have been identified to date. First, Pom1 auto-phosphorylates as part of a mechanism that promotes localization in a cortical gradient enriched at cell tips (7). Second, Pom1 phosphorylates two regions of the protein kinase Cdr2. Phosphorylation of Cdr2 C-terminus is proposed to prevent mitotic entry by inhibiting Cdr2 kinase activity (8,9), while phosphorylation near membrane-binding motifs of Cdr2 promotes medial cell division by inhibiting localization of Cdr2 at cell tips (10). It has been unclear if Cdr2 represents the only cell cycle target of Pom1 kinase activity, and no cell polarity targets of Pom1 have been identified. In order to clarify how this protein kinase controls multiple cellular processes, we have comprehensively cataloged Pom1 substrates by quantitative phosphoproteomics. Such a large-scale approach also has the potential to reveal general mechanisms that operate in the coordination of cell growth and division.
Stable isotope labeling of amino acids in culture (SILAC) combined with phosphopeptide enrichment and mass spectrometry has allowed the proteome-wide analysis of protein phosphorylation from diverse experimental systems (11-15). In this approach, cells are grown separately in media containing normal (“light”) or isotope-labeled (“heavy”) arginine and lysine, treated, mixed, and processed for LC-MS/MS analysis. In combination with analog-sensitive protein kinase mutants, which can be rapidly and specifically inhibited by non-hydrolyzable ATP analogs (16,17), SILAC presents a powerful approach to identify cellular phosphorylation events that depend on a specific protein kinase. This method is particularly well suited for studies in yeast, where analog-sensitive protein kinase mutants can be readily integrated into the genome.
In this study, we have employed SILAC-based phosphoproteomics to identify Pom1 substrates in fission yeast. New Pom1 targets were verified as direct substrates in vitro, and our analysis indicates that Pom1 controls cell cycle progression through a single target while coordinating a more complex network of cell polarity targets.

4
Experimental Procedures Yeast strains and growth – Standard S. pombe media and methods were used (18); strains are listed in supplementary table S1. We used PCR and homologous recombination for gene tagging and deletions (19), and integrations were verified by colony PCR. To make the phospho-mutants, genomic sequences of Pom1 substrates were cloned into pJK148/pJK210 vectors, mutated by Quick-Change II site-directed mutagenesis kit (Stratagene) and transformed back to endogenous chromosomal loci by counter-selection with 5-FOA (5-fluoroorotic acid, US Biological). All strains were generated by tetrad dissection, when applicable. Growth medium for SILAC experiments was based upon modified EMM2 media as described by Bicho et al. (20), and contained 1.1 g/L ammonium chloride, 250 mg/L proline, and 150 mg/L heavy or light arginine and/or lysine. Heavy arginine [13C6,15N4] and heavy lysine [13C6,15N2] were purchased from Cambridge Isotope Laboratories. Testing SILAC strains – To test incorporation and conversion of isotopically labeled amino acids, strains were maintained in logarithmic growth at 32˚C for 10 generations. 50 ml of cells at A595 of 0.4 were harvested by centrifugation and washed twice in 300 µl 1x PBS containing Roche complete protease inhibitors and 1 mM PMSF. Cells were mechanically lysed at 4˚C by two rounds of bead beating for 45 seconds at full speed in a Mini-beadbeater-16 (Biospec). The resulting lysate was supplemented with Triton X-100 to 1% and clarified by centrifugation for 5 minutes at 16,000g at 4˚C. The supernatant was harvested and protein concentration was measured with the BioRad DC Protein Assay. 20 µg total protein was separated by SDS-PAGE followed by coomassie staining. Prominent bands were excised, destained, and in-gel trypsin digested (Promega). After extraction, peptides were analyzed on a Q-Exactive Plus mass spectrometer (Thermo Fisher Scientific, Bremen, Germany) equipped with an Easy-nLC 1000 and nanospray source (Thermo Fisher Scientific). Peptides were redissolved in 5% ACN / 1% formic acid and loaded onto a trap column at 2500 nl/min (1.5 cm length, 100 µm inner diameter, ReproSil, C18 AQ 5 µm 120 Å pore (Dr. Maisch, Ammerbuch, Germany)) vented to waste via a micro-tee and eluted across a fritless analytical resolving column (35 cm length, 100 µm inner diameter, ReproSil, C18 AQ 3 µm 120 Å pore) pulled in-house (Sutter P-2000, Sutter Instruments, San Francisco, CA) with a 60 min gradient of 5-30% LC-MS buffer B (LC-MS buffer A: 0.0625% formic acid, 3% ACN; LC-MS buffer B: 0.0625% formic acid, 95% ACN). An instrument (Q-Exactive plus control software v. 2.3, build 1765; previously tuned and calibrated per instrument manufacturer’s guidelines using LTQ Velos ESI positive ion calibration solution (Pierce)) method consisting of one survey scan (AGC target value: 1e6; R = 70K; maximum ion time: 100 milliseconds; mass range: 350 to 1500 m/z; lock mass(21) set to background ion 445.120029) was collected, followed by ten data-dependent tandem mass spectra on the top ten most abundant precursor ions ((isolation width: 1.2 m/z; HCD collision energy (NCE): 26; MS1 signal threshold: 2e4; AGC MS2 target value: 1e5; maximum MS/MS ion time: 75 milliseconds; dynamic exclusion: repeat count of 1, maximum exclusion list size , 20 seconds wide in time, +/- 20 ppm wide in m/z; doubly- and triply-charged precursors only (22). Large-scale SILAC phosphoproteomic screens – Strains used for phosphoproteomic screens were JM1637 (pom1-as lys3Δ::natR arg3Δ::hphR car1Δ::hphR aru1Δ::kanR) and JM2235 (lys3Δ::natR arg3Δ::hphR aru1Δ::kanR car1Δ::hphR). After 10 generations of growth at 32˚C in media containing either heavy or light arginine and lysine, the ‘heavy’ culture was treated for 20 minutes with final concentration of 10 µM 3-MB-PP1 (1-(tert-Butyl)-3-(3-methylbenzyl)-1H-

5
pyrazolo[3,4-d]pyrimidin-4-amine (Toronto Research Chemicals), while the ‘light’ culture was treated with DMSO control. Each culture volume was 2 liters. The cultures were then harvested by 6-minute centrifugation at 8,000g at 4˚C, washed once with 200 ml ice-cold PBS, combined together, and then centrifuged again with the same conditions. The pellet was resuspended in 1/3 v/w ice-cold PBS containing Roche complete protease inhibitors and 1 mM PMSF, and then frozen dropwise in liquid nitrogen. Frozen pellets were lysed by 2 minutes of grinding in a pre-chilled coffee bean grinder; lysis efficiency was ~80% as judged by microscopy. Cell powder was resuspended in ice-cold lysis buffer ((8 M urea, 25 mM Tris-HCl pH 8.6, 150 mM NaCl, phosphatase inhibitors (2.5 mM beta-glycerophosphate, 1 mM sodium fluoride, 1 mM sodium orthovanadate, 1 mM sodium molybdate, 1 mM sodium tartrate) and protease inhibitors (1 mini-Complete EDTA-free tablet per 10 ml lysis buffer; Roche Life Sciences)), sonicated three times for 15 sec each with intermittent cooling on ice. Lysates were spun for 30 min at 2851 x g and the supernatants were transferred to a new tube. Protein concentration was determined using a BCA assay (Pierce/ThermoFisher Scientific). For reduction, DTT was added to the lysates to a final concentration of 5 mM and incubated for 30 min at 55 °C. Afterwards, lysates were cooled to room temperate and alkylated with 15 mM iodoacetamide at room temperature for 45 min. The alkylation was then quenched by the addition of an additional 5 mM DTT. After 6-fold dilution with 25 mM Tris-HCl pH 8 and 1 mM CaCl2, the samples were digested overnight at 37 °C with 2.5% (w/w) trypsin. The next day, the digest was stopped by the addition of 0.25% TFA (final v/v), centrifuged at 2851 x g for 30 min at room temperature to pellet precipitated lipids. Peptide digests were desalted on a 500 mg (sorbent weight) SPE C18 cartridge (Grace-Davidson). Desalted peptides were lyophilized and stored at -80 °C until further use. Phosphopeptide Enrichment. Phosphopeptide purification was performed as previously described (23). Briefly, peptides were resuspended in 2M lactic acid in 50% ACN (“binding solution”). Sixty milligrams of yeast peptides were resuspended in 6000 µl of binding solution. Twenty-five mg of TiO2 beads were added, and yeast peptides were vortexed by affixing to the top of a vortex mixer on the highest speed setting at room temperature for 1 h. Afterwards, the beads were washed twice with binding solution and three times with 100 µl 50% ACN / 0.1% TFA. Peptides were eluted twice with 50 mM KH2PO4 (adjusted to pH 10 with ammonium hydroxide). Peptide elutions were combined, quenched with 50% ACN / 5% formic acid, dried and desalted on a µHLB OASIS C18 desalting plate (Waters). Enriched phosphopeptides were subjected to a second round of phosphopeptide purification to increase phosphopeptide selectivity. In the second round, peptides were resuspended in 1500 µl of binding solution. Twenty mg of TiO2 beads were added, and phosphopeptide enrichment was carried out as in the first round. Peptide elutions were combined, quenched with 50% ACN / 5% formic acid, dried and desalted on a µHLB OASIS C18 desalting plate (Waters). Strong cation exchange chromatography (SCX). Phosphopeptides were resuspended in SCX buffer A (7 mM KH2PO4, pH 2.65 / 30% ACN) and separated per injection on a 2.1 mm ID x 200 mm long SCX column (Phenomenex Luna SCX) as previously described (23), using a gradient of 0 to 10 % SCX buffer B (350 mM KCl / 7 mM KH2PO4, pH 2.65 / 30% ACN) over 10 minutes, 10% to 17% SCX buffer B over 17 minutes, 17% to 32% SCX buffer B over 13 minutes, 32% to 60% SCX buffer B over 10 minutes, 60% to 100% SCX buffer B over 2 minutes, holding at 100% SCX buffer B for 5 minutes, from 100% to 0% SCX buffer B over 2

6
minutes, and equilibration at 0% SCX buffer B for 65 minutes, all at a flow rate of 0.2 ml/min, after a full blank injection of the same program was run to equilibrate the column. 24 fractions were collected from the onset of the void volume (1.5 minutes) until the elution of strongly basic peptides in the 100% SCX buffer B wash (37.5 minutes), at 1.5-minute intervals. After separation, the SCX fractions were dried and desalted using a µHLB OASIS C18 96-well desalting plate and manifold (Waters). LC-MS/MS Analysis. LC-MS/MS analysis for SILAC yeast phosphopeptides and in vitro kinase assays was performed on a LTQ-Orbitrap mass spectrometer (Thermo Fisher Scientific, Bremen, Germany) equipped with an Agilent 1100 capillary HPLC, FAMOS autosampler (LC Packings, San Francisco, CA) and nanospray source (Thermo Fisher Scientific). Peptides were redissolved in 5% ACN / 1% formic acid and loaded onto an in-house packed polymer-fritted (24,25) trap column at 2.5 µl/min (1.5 cm length, 100 µm inner diameter, ReproSil, C18 AQ 5 µm 200 Å pore (Dr. Maisch, Ammerbuch, Germany)) vented to waste via a micro-tee. The peptides were eluted by split-flow at ~800 – 1000 psi head pressure from the trap and across a fritless analytical resolving column (18 cm length, 100 µm inner diameter, ReproSil, C18 AQ 3 µm 200 Å pore) pulled in-house (Sutter P-2000, Sutter Instruments, San Francisco, CA) with a 50 min gradient of 5-30% LC-MS buffer B (LC-MS buffer A: 0.0625% formic acid, 3% ACN; LC-MS buffer B: 0.0625% formic acid, 95% ACN). An LTQ-Orbitrap (LTQ Orbitrap MS control software v. 2.5.5, build 4 (06/20/08); previously tuned and calibrated per instrument manufacturer’s guidelines using caffeine, MRFA, and UltraMark “CalMix”) method consisting of one Orbitrap survey scan (AGC Orbitrap target value: 700K; R = 60K; maximum ion time: 800 milliseconds; mass range: 400 to 1400 m/z; Orbitrap “preview” mode enabled; lock mass (21) set to background ion 445.120025) was collected, followed by ten data-dependent tandem mass spectra on the top ten most abundant precursor ions ((isolation width: 1.6 m/z; CID relative collision energy (RCE): 35%; MS1 signal threshold: 12,500; AGC LTQ target value: 3,500; maximum MS/MS ion time: 125 milliseconds; dynamic exclusion: repeat count of 1, exclusion list size of 500 (max), 24 seconds wide in time, +/- 20 ppm wide in m/z; doubly- and triply-charged precursors only; no neutral-loss dependent or multi-stage activation methods were employed (22)). Peptide spectral matching and bioinformatics. Raw data were searched using SEQUEST (26,27) (Thermo Fisher Scientific, San Jose, CA) against a target-decoy (reversed) (28) version of the S. pombe (UniProt; downloaded 9/2010; 9.954 total (forward & reverse) sequences) proteome sequence database with a precursor mass tolerance of +/- 1 Da and requiring fully tryptic peptides with up to two mis-cleavages and carbamidomethylcysteine as fixed modifications. Oxidized methionine, phosphorylated serine, threonine and tyrosine, and heavy lysine (+ 8.01420 Da) and arginine (+ 10.00827 Da) were allowed as variable modifications for all SEQUEST searches. The resulting peptide spectral matches were filtered to < 1% false discovery rate (FDR), based on reverse-hit counting (mass measurement accuracy cutoffs (MMA) within -/+ 2.5ppm, a delta-XCorr (dCn) of greater than 0.08, and appropriate XCorr values for +2 and +3-charge state peptides). Probability of phosphorylation site localization was determined by PhosphoRS (29). SILAC quantification was performed using a highly in-house-modified version of the XPRESS algorithm (http://tools.proteomecenter.org, 30). Log2 H/L ratios were median adjusted for mixing errors and proline incorporation. Phosphopeptide fold-changes were not adjusted for potential changes in protein abundance after 20 minutes of Pom1 inhibition, as we

7
did not expect significant changes in protein abundance within this timeframe. Motif analysis was performed on phophopeptides down-regulated by 1.5-fold or more and a p-value < 0.1 using Motif-X (31), with a background dataset of the S. pombe proteome. Eleven of 34 Pom1 target sites matched the proline-containing consensus motif described for DYRK kinases in other organisms. All raw data and results were uploaded to ProteomeXchange Consortium (http://proteomecentral.proteomexchange.org) (32) via the PRIDE partner repository with the dataset identifier PXD001649. Generation of combined database and Gene Ontology analysis – To assemble a complete phosphoproteomics map for fission yeast, data from previous large-scale phosphoproteomics studies (33-36) were integrated with our data using custom-written PERL (version 5.8.8) scripts, which can be provided upon request. Briefly, the formats and assignments of phopsho-peptides from different studies were unified using uniprot - gene name pairing table (http://www.uniprot.org/docs/pombe). The peptide sequence, uniprot entry and position of phosphorylation were verified/corrected by most recent uniprot database of fission yeast proteome (http://www.uniprot.org/uniprot/?query=taxonomy:4896). Uniqueness of phospho-peptides in each study was assessed by removing redundant peptides and compared with other studies. The phosphorylation sites from all phosphopeptides were then mapped back to individual proteins. GO (gene ontology) analyses, process, function and component, were performed using Princeton GO term finder (http://go.princeton.edu/) using all S. pombe proteins as background. Protein purification and in vitro kinase assays – Recombinant Pom1 and kinase-dead Pom1(K728R) mutants were purified from E. coli as previously described (9). The same methods were used to purify recombinant Tea4(1-296) and Mod5(28-495) fragments. Rga7, Pal1, and Syt22(297-807) were cloned into pQE30 vector (Qiagen), expressed in BL21(Rosetta) E. coli, and purified with Ni-NTA beads (Qiagen). For in vitro kinase assays, purified proteins were incubated with Pom1 or Pom1-KD in kinase buffer (30 mM Tris-HCl pH 7.5, 100 mM NaCl, 10 mM MgCl2, 1 mM EGTA, 20 µM ATP, 10% glycerol). 20 µl reactions were incubated at 30˚C for 30 minutes and then stopped by addition of 3x SDS-PAGE sample buffer and boiling. Reactions were separated by SDS-PAGE followed by coomassie staining. Bands were excised, destained, trypsin-digested, peptides were extracted and analyzed by LC-MS/MS. Microscopy – Imaging was performed at 25°C using a DeltaVision Imaging System (Applied Precision), comprised of an Olympus IX-71 inverted wide-field microscope, a Photometrics CoolSNAP HQ2 camera, and Insight solid-state illumination unit. In figures 5 and S1, stacks of z-series were acquired with 0.5 µm step size and deconvolved in SoftWoRx software (Applied Precision). Images were rendered by two-dimensional maximum intensity projection by ImageJ 1.45 (National Institutes of Health).

8
Results SILAC-based phosphoproteomic screen As a first step towards identifying the phosphorylation targets of Pom1, we tested the phenotype of the analog-sensitive pom1-as mutant, which does not perturb Pom1 function in the absence of ATP analog inhibitor (5). In pom1∆ cells, the Pom1 target Cdr2 mis-localizes to non-growing cell tips (2,3). We found that addition of 10 µM 3MB-PP1 to pom1-as cells generated a similar localization defect for Cdr2-mEGFP. After 20 minutes of pom1-as inhibition, over 90% of cells displayed Cdr2 at cell tips (Figure S1). In control experiments, addition of 10 µM 3MB-PP1 to pom1+ cells did not affect Cdr2 localization, and Cdr2 localized properly in pom1-as cells treated with DMSO (Figure S1). Thus, Pom1 targets can be specifically affected by 20-minute inhibition of the pom1-as allele. We next combined this pom1-as allele with previously characterized mutations for fission yeast SILAC (20). This strain utilizes lys3∆ and arg1-230 auxotrophic mutations for incorporation of either unmodified lysine and arginine (“light”) or isotopically labeled [13C6,15N2] lysine and [13C6,15N4] arginine (“heavy”), and the car2∆ mutation to prevent conversion of exogenous arginine to proline. We encountered conversion of the heavy label to other amino acids. This problem was due to conversion of arginine, as it was observed in arginine auxotrophic mutants but not lysine auxotrophic mutants (Figure S2). We used three approaches to minimize label conversion. First, we replaced arg1-230 mutation with arg3∆, which acts farther upstream in the arginine biosynthesis pathway. Second, we grew cells in the presence of exogenous proline to minimize proline biosynthesis/conversion. Third, we found that the double car1∆ aru1∆ mutant significantly improved conversion when compared to the single car2∆ mutant. Our final strain pom1-as-SILAC (pom1-as lys3∆ arg3∆ car1∆ aru1∆) solved the conversion problem for peptides lacking proline, and exhibited only minor conversion to proline (Figure S3). We used this strain to identify phosphopeptides that were significantly reduced in phosphorylation site occupancy upon Pom1 inhibition (see workflow in Figure 1). Briefly, pom1-as-SILAC cells were grown for 10 generations in media containing either light or heavy lysine and arginine. We then added 10 µM 3MB-PP1 to the heavy culture, and DMSO to the light culture. After 20 minutes, the cultures were harvested by centrifugation, mixed, and lysed. Protein lysates were digested to peptides with trypsin, phosphopeptides were enriched using titanium-dioxide microspheres, and separated by strong-cation exchange chromatography. We analyzed the resulting phosphopeptides by high-performance liquid chromatography-tandem mass spectrometry. This experimental design was applied to three biological replicates. We also performed a set of control experiments to account for Pom1-independent effects of 3MB-PP1 (33,37). For these controls, we applied the same workflow to three biological replicates of the ‘wildtype’ SILAC strain lys3∆ arg3∆ car1∆ aru1∆.
From these combined experiments, we identified over 18,625 phosphopeptides that mapped to 12,524 unique phosphorylation sites on 2,114 proteins (Table S2). To our knowledge, this represents the largest number of phosphopeptides identified to date in S. pombe. The number of phosphorylation sites per protein was not correlated with protein abundance (38) and only weakly correlated with protein length, indicating that these data do not over-represent highly abundant or long proteins (Figure S4A-B). We next examined overlap in both phosphoproteins and phosphopeptides from our study versus four previous fission yeast phosphoproteomic studies (Figures 2A) (33-36). Our data identified 460 new phosphoproteins that were previously not seen in the other datasets, while 482 phosphoproteins were reported in all five studies. We also identified 6,909 unique phosphorylation sites that had not been previously reported; these newly

9
identified phosphorylation sites are spread over 1,731 proteins. Thus, our data represent a significant addition to the S. pombe phosphoproteome.
We next used these data to probe general aspects of phosphorylation in fission yeast. To this end, we combined our data with four previous studies (33-36) to generate a large database that includes all mapped phosphorylation sites and phosphoproteins in a unified format (Tables S3 and S4). In generating this database, we adjusted amino acid positions by mapping all peptides back to most recent Uniprot /PomBase sequences. This combined database includes 18,861 unique phosphorylation sites on 2,553 proteins, nearly half of the fission yeast proteome. On average, each phosphoprotein in the database contains approximately 7 phosphorylation sites. The most heavily phosphorylated proteins from this database are the uncharacterized protein SPAC688.07c (103 sites) and Cdc15 (100 sites), which coordinates cytoskeletal rearrangements with cell cycle progression (39-42). Most phosphoproteins contained less than 10 identified phosphorylation sites (Figure 2B). We examined gene ontology (GO) enrichment for heavily phosphorylated proteins, which we defined as proteins with more than 20 phosphorylation sites. Interestingly, this list was highly enriched for proteins that localize to the cell cortex and regulate cell growth through Rho GTPase signaling and the cytoskeleton (Figure 2C). We conclude that phosphorylation is heavily utilized to regulate cell growth and cell shape in this model organism, and a critical next step will be to define the kinase-substrate relationships that underlie these regulatory networks. Identification of Pom1 targets
Next, we examined phosphopeptides that were significantly reduced in their phosphorylation occupancy upon addition of 3MB-PP1. The heavy/light ratio for each phosphopeptide was log2-transformed to quantify abundance changes upon inhibition of Pom1 (Figure 3A, see also Tables S2 and S5). Our control experiments revealed phosphopeptides that were inhibited by 3MB-PP1 in the pom1+ control strain, indicating non-specific inhibition by 3MB-PP1 in the absence of analog-sensitive mutations. From the list of phosphopeptides that were >2-fold reduced by Pom1 inhibition, we next generated a high-confidence set of likely Pom1 targets. We only considered phosphopeptides that had a p-value less than 0.2 and that were also quantified in the negative control experiments. We also removed proteins with any phosphopeptides that were 1.5-fold reduced in the negative control experiments. The resulting proteins represent likely targets of Pom1 kinase activity in cells (Table 1), and identify a proline-directed consensus motif for phosphorylation by Pom1 (Figure 3B), shared with DYRK kinases in other systems (43,44). By gene ontology (GO) categories, this list of proteins is enriched for proteins that function in processes such as regulation of cell growth and cytoskeletal organization (Figure 3C), consistent with the established functions of Pom1. Moreover, these putative targets are enriched for localization at the cortex of cell tips, where Pom1 localizes (1). In these proteins, Pom1-dependent and Pom1-independent phosphorylation events largely cluster outside of known or predicted functional domains, in support of previous models for phosphoregulation (45). Pom1 kinase activity is required for proper cell polarity and cytokinesis (1,4,6), but the relevant substrates have been unknown. We identified multiple Pom1-dependent phosphorylation sites on proteins involved in cell polarity and septation (Table 1), suggesting that Pom1 coordinates these complex cellular processes through multiple targets. In particular, Mod5 and Tea4 have well-studied roles in promoting polarized growth at cell tips (46-49), and Tea4 is essential for Pom1 cortical localization by acting as an adaptor for the phosphatase Dis2 (7). We found a single Pom1-dependent phosphorylation site on Tea4, and multiple Pom1-dependent

10
phosphorylation sites on Mod5. Both proteins also contained many phosphorylation sites that were not affected by inhibition of Pom1 (Table S2). Beyond Tea4 and Mod5, we identified Pom1-dependent phosphorylation sites on the less-studied cell polarity proteins Rga7, Pal1, and Syt22. Pal1 is an adaptor protein required for cylindrical cell morphology (50); Rga7 acts as a Rho GTPase activating protein (GAP) (51-53); and Syt22 is a GTP/GDP exchange factor (GEF) for Arf GTPase (54). Our identification of these substrates indicates that Pom1 regulates multiple GTPase signaling networks involved in cell polarity. Pom1 is also known to auto-phosphorylate as part of its localization cycle (7), and we confirmed Pom1 auto-phosphorylation in vivo. Finally, we identified the septation proteins Cyk3 and Imp2 (55,56) as likely targets of Pom1, consistent with a role for Pom1 in this process. These combined data suggest that Pom1 coordinates the complex events of polarized growth and septation through Mod5, Tea4, Pal1, Rga7, Syt22, Cyk3, and Imp2.
In contrast to this complex cell polarity network, Pom1 has been proposed to regulate mitotic entry through a single protein, the SAD kinase Cdr2, which is directly phosphorylated by Pom1 in vitro (2,8,9). Indeed, we identified a cluster of Pom1-dependent phosphorylation sites in the C-terminal domain (CTD) of Cdr2 (Table 1). We did not identify any other G2/M regulatory proteins as high-confidence Pom1 targets. This suggests that Pom1 regulates mitotic entry entirely through Cdr2, although our results do not exclude the possibility of additional targets. We conclude that Pom1 likely regulates cell cycle progression through a single substrate Cdr2, but coordinates multiple events in polarized growth through diverse targets.
Next, we performed in vitro kinase assays to test if Pom1 directly phosphorylates these potential substrates. Cdr2 has been shown to be a direct substrate of Pom1 in vitro (2,8,9), while the other top targets represent novel substrates for Pom1. To test this, we expressed and purified the top cell polarity substrates Tea4, Mod5, Rga7, Pal1, and Syt22 from bacteria. We purified full-length versions of Rga7 and Pal1, and fragments that contained the Pom1-dependent phosphorylation sites for Tea4, Mod5, and Syt22. Following in vitro kinase assays with either wildtype Pom1 or kinase-dead Pom1, we used LC-MS/MS to identify phosphorylation sites on these substrates. All of these proteins were phosphorylated by wildtype Pom1 but not by kinase-dead Pom1 (Figure 4 and Table S6), indicating that they are direct Pom1 substrates. For every substrate, we identified in vitro phosphorylation sites that were also Pom1-dependent in vivo. We also identified additional sites in vitro that may contribute to Pom1 regulation of these substrates in cells. Our combined data indicate that Cdr2, Tea4, Mod5, Rga7, Pal1, and Syt22 are direct substrates of Pom1 kinase in cells. Role of Pom1 phosphorylation in cells
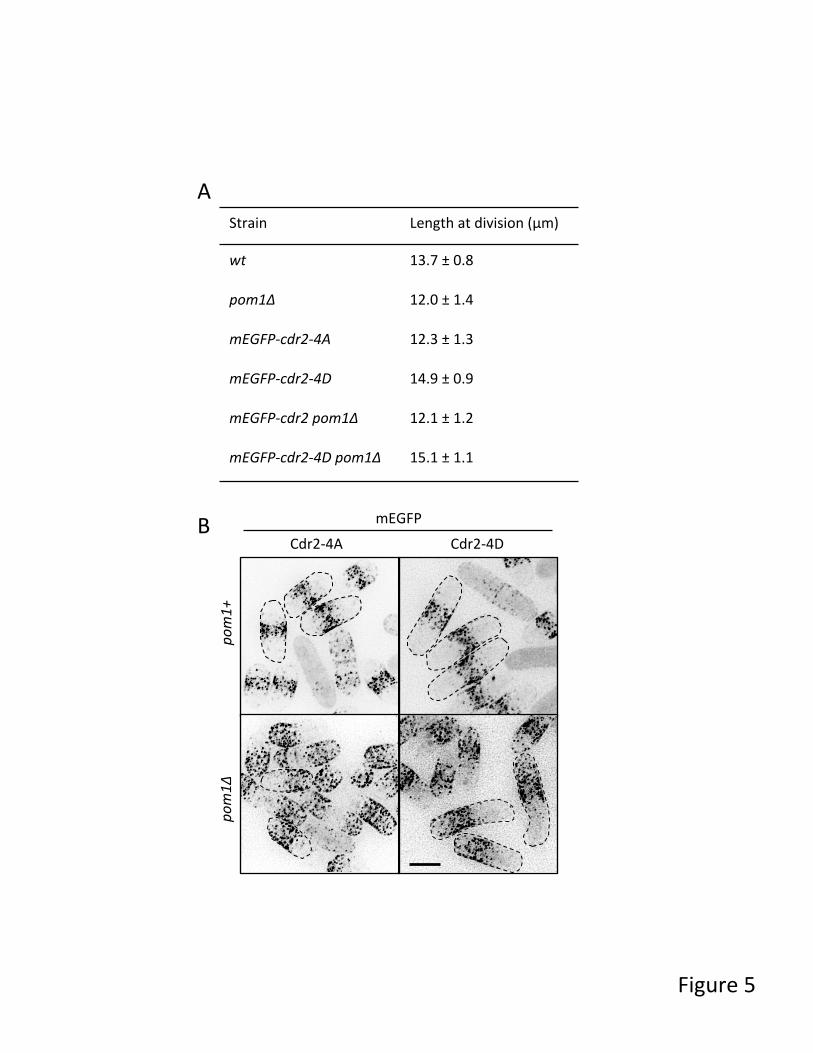
We next tested the functional role of Pom1-dependent phosphorylation in cells. In pom1∆ mutant cells, Cdr2 is mislocalized and cells enter mitosis prematurely in a Cdr2-dependent manner (2,3). We mutated a cluster of four Pom1 sites (S758, S760, S761 and S762) in the Cdr2 C-terminal domain (CTD), and then assayed both Cdr2 localization and cell size at division (Figure 5). These constructs contained an amino-terminal mEGFP tag and were integrated at the endogenous cdr2+ chromosomal locus. The non-phosphorylatable mutant Cdr2-4A phenocopied the cell division size defect of pom1∆, but this mutant protein localized properly to cortical nodes in the cell middle. The phosphomimetic mutant Cdr2-4D also localized properly but exhibited an increase in cell size at division, consistent with Pom1-dependent inhibition of Cdr2. Further, the cdr2-4D cell size phenotype was epistatic to pom1∆, indicating that it underlies Pom1 regulation of cell size at division. Although both Cdr2-4A and Cdr2-4D mutants localize properly in pom1+

11
cells, they both mislocalized to cell tips in pom1∆ mutants (Figure 5B). We conclude that Cdr2-4A and Cdr2-4D are separation of function mutants, demonstrating that Pom1 regulates cell size at division through phosphorylation of Cdr2-CTD. This cell cycle regulation by Pom1 is independent from its role in controlling Cdr2 localization, which may be mediated by additional Pom1 phosphorylation sites on Cdr2 (10) or through additional proteins at cell tips.
The mislocalization of Cdr2 in pom1∆ cells prompted us to examine the role of Pom1 in localization of newly identified substrates. We found that Pal1, Rga7, Tea4, and Mod5 localize to cell tips and the division septum, consistent with previous studies (Figure 6) (46,48-50,57). For Syt22, we integrated a C-terminal GFP tag at the chromosomal locus and observed puncta throughout the cell cortex (Figure 6). We found that deletion of pom1+ did not disrupt the localization of these target proteins. In pom1∆ cells, Tea4 and Mod5 remained at both cell tips while Pal1 and Rga7 were enriched at a single cell tip, likely due to loss of bipolar growth (Figure 6). We also did not observe changes for Syt22-GFP localization in pom1∆ cells. Although we cannot rule out subtle defects, we conclude that Pom1 does not play a major role in directing the localization of its substrates Pal1, Rga7, Syt22, Tea4, and Mod5.
Next, we examined the functional role of Pom1 phosphorylation sites on cell polarity substrates, starting with the Rho2 GTPase Rga7. Our SILAC and in vitro kinase assays revealed a concentrated cluster of Pom1 phosphorylation sites on Rga7. Using a functional 3HA C-terminal tag integrated at the endogenous locus, we found that Rga7-3HA migrated as a double-band in Western blot, consistent with phosphorylation. Moreover, the protein collapsed to a single band in pom1∆ cells (Figure 7A), supporting Pom1 phosphorylation of Rga7 in cells. We next generated the mutant Rga7(∆475-499) by deleting the cluster of residues phosphorylated by Pom1. The mutant Rga7(∆475-499)-3HA migrated as a single band in both pom1+ and pom1∆ cells (Figure 7A), consistent with loss of an upper phospho-dependent band. However, rga7(∆475-499)-mCherry localized to cell tips and the cytokinetic ring, similar to full-length Rga7-mCherry (Figure 7B). These truncated mutants also did not exhibit the phenotypic defects of rga7∆ cells (Figure 7B), such as multi-septation and altered cell polarity (53). Thus, phosphorylation of this region by Pom1 is not required for the localization or function of Rga7.
We also did not observe localization or phenotypic defects upon mutation of strong phosphorylation sites in the Pom1 targets Mod5 and Tea4. The double mutant tea4(S215A) mod5(9A) maintained proper polarity, even when cells were elongated to detect subtle polarity defects (Figure S5). Finally, we considered that combining multiple phosphorylation site mutations might reveal the role of Pom1 sites in cell polarity. Therefore, we generated the quadruple mutant mod5(9Ala) tea4(S215A) pal1(S89A, S90A) rga7(∆475-499), but this mutant maintained proper cell shape and growth even when grown at 36˚C (Figure 7C). We conclude that these phosphorylation sites alone do not explain the role of Pom1 in cell polarity.
Cell polarity is a complex phenomenon that emerges from many cellular activities including local GTPase activation, cytoskeletal organization, endocytosis, exocytosis, and more. Pom1 might coordinate distinct aspects of polarized growth through its multiple cell polarity targets. To test this idea, we generated double mutants in Pom1 target proteins and tested for additive or synthetic morphology defects. For example, tea4∆ mutants exhibit a slightly curved and elongated cell shape (48,49), while pal1∆ cells are short and wide (50). We found that pal1∆ tea4∆ double mutants exhibited severe defects in cell shape and septation, leading to many dead cells in cultures (Figure 8A). Consistent with these synthetic defects, serial dilution growth assays revealed that the double mutant cells grew slower than either single mutant, and pal1∆ tea4∆ cells were dead at high temperature (Figure 8B). These synthetic defects indicate that Tea4

12
and Pal1 contribute distinct non-overlapping functions to polarized cell growth. Similarly, we found that syt22∆ tea4∆ double mutant cells exhibited a striking ‘kinked’ cell shape that was not observed in either single mutant (Figure 8C). Single tea4∆ mutants display a characteristic T-shaped branch when exiting stationary phase in starvation-refeeding experiments (48,49). We found that syt22∆ tea4∆ double mutants exacerbated this phenotype, leading to a range of cell shapes with misplaced division septa (Figure 8D). These experiments indicate that substrates of Pom1 function in multiple aspects of polarized growth, and support a model where Pom1 coordinates distinct cellular activities to promote cell morphogenesis.
Discussion The well-known role of phosphorylation in diverse cellular activities underscores the
importance of defining these post-translational events at the molecular level. In this study, we identified phosphorylation sites on over 18,000 unique phosphopeptides from over 2,000 proteins. To our knowledge, this represents the largest current dataset for the fission yeast phosphoproteome. We also combined our data with four previously published studies (33-36) to generate a comprehensive view of phosphorylation in fission yeast. This combined database reports all phosphorylated residues for any given protein in a unified format, with the potential to serve as a resource for researchers in a number of fields. We analyzed this database and found that the most heavily phosphorylated proteins are enriched for factors that regulate cytoskeletal and cell polarity changes at the cell cortex. During interphase, the fission yeast actin cytoskeleton promotes monopolar growth at one cell tip until an abrupt transition to bipolar growth (58,59). At division, the actin cytoskeleton is redirected to the cell middle to facilitate cytokinesis and septation. These transitions, as well as rapid changes in growth upon environmental stresses, may be controlled in dynamic and reversible fashion by phosphorylation, unlike slower regulatory mechanisms driven by protein synthesis and degradation.
Pom1 presented an intriguing candidate for phosphoproteomic analysis because pom1∆ cells have defects in both cell polarity and mitotic entry (1-3). We have identified distinct Pom1 substrates for these two coordinated processes. Interestingly, our data suggest that Pom1 regulates mitotic entry through a single substrate (Cdr2), but phosphorylates a larger number of targets related to cell polarity. This suggests that Pom1 functions in a linear cell cycle regulatory pathway, while acting more broadly to coordinate diverse events for polarized growth. Understanding the temporal and spatial differences in Pom1 activity towards these distinct substrates has the potential to reveal broad principles that coordinate cell growth and division.
We found that Pom1 phosphorylates the C-terminal domain (CTD) of Cdr2, and this modification inhibits mitotic entry but not Cdr2 localization. This is important because Cdr2 is mislocalized in pom1∆ cells (2,3), raising the possibility that Pom1 regulates mitotic entry through localization of Cdr2. However, data from our study, in combination with previous work from our group and others (8,9), suggests that Pom1 phosphorylates the Cdr2-CTD to inhibit Cdr2 kinase activity and prevent mitotic entry. This regulation of Cdr2 enzyme activity is separate from Pom1 regulation of Cdr2 localization, which appears to involve additional phosphorylation sites in membrane-binding region of Cdr2 (10). Thus, Pom1 has separate mechanisms to regulate Cdr2 localization and kinase activity, and inhibition of kinase activity is the mechanism that inhibits mitotic entry until cells reach a critical size threshold.
Our phosphoproteomic analysis identified multiple Pom1 targets that connect with cell polarity, suggesting that Pom1 coordinates a complex morphology network. Deletion of several

13
Pom1 targets leads to cell polarity defects, but site-specific mutations to prevent phosphorylation of multiple strong Pom1 sites did not lead to clear polarity defects. This indicates the presence of additional sites and/or targets beyond our current analysis. These additional targets might include Imp2 and Cyk3, which we identified as likely Pom1 targets, or other factors such as Cdc15, which fell just below our stringent cutoff for identification of Pom1 targets. Interestingly, the Pom1 targets Rga7 and Imp2 have recently been shown to function with Cdc15 during cytokinesis (53), in support of coordinated activity of multiple Pom1 targets. While unraveling this complex network extends beyond the current study, our data provide a framework with clearly identified targets for future work. It is interesting to note that Pom1 phosphorylates polarity factors Tea4 and Mod5 both in vitro and in cells. Tea4 is required for Pom1 localization to the cell cortex (7), and Mod5 promotes Tea4 localization indirectly through Tea1 and Tea3 (47,48,60). Thus, Tea4 and Mod5 promote Pom1 localization but also act as substrates. This raises the possibility of a feedback loop related to Pom1 itself, or potentially other downstream targets of Mod5-Tea4 such as the actin cytoskeleton.
In summary, we devised new methods for SILAC-based phosphoproteomics in fission yeast, and employed this approach to identify targets of the DYRK kinase Pom1. We generated a vast database of phosphorylation sites in the fission yeast proteome. Further, we demonstrated that Pom1 regulates mitotic entry through a linear pathway but coordinates a complex network of cell polarity proteins. Our work should facilitate future studies on phosphoregulation in this well-studied model system at both the biochemical and systems levels.
Acknowledgments We thank members of the Biochemistry Department for discussions and technical assistance; and Ken Sawin, Pilar Perez, Mohan Balasubramanian, and Fred Chang for strains. This work was supported by National Institutes of Health grants R01-GM099774 (J.B.M.) and R01-CA155260 (S.A.G.). J.B.M. is a Pew Scholar in the Biomedical Sciences. Figure Legends Figure 1. Work flow for SILAC-based phosphoproteomic identification of Pom1 substrates. SILAC strain containing wildtype pom1+ was used as a negative control to assess 3-MB-PP1 off-target effects. Figure 2. Assembly and analysis of the fission yeast phosphoproteome. (A) Comparison of unique phosphopeptides and phosphoproteins in this study (pom1-as SILAC) and previous studies. (B) Distribution of the number of phosphorylation sites per phosphoprotein in fission yeast. (C) GO terms enriched for heavily phosphorylated proteins (≥20 phosphorylation sites) relative to the fission yeast proteome. The p values are shown on the right of each bar. Figure 3. Identification of Pom1 proteomic substrates. (A) Volcano plot for phosphopeptides identified at least twice in pom1-as SILAC experiments. Red data points are peptides that were >2-fold inhibited in pom1+ SILAC experiments and therefore represent off-target effects of the 3-MB-PP1 drug. (B) Consensus motif analysis for Pom1 substrates listed in Table 1. (C) GO terms enriched for Pom1 substrates from Table 1. The p values are shown on the right of each bar.
14
Figure 4. Pom1 directly phosphorylates Tea4, Mod5, Rga7, Pal1 and Syt22 in vitro. Schematic summary of results from in vitro kinase assays using purified recombinant proteins. Pom1 was incubated with each substrate, and phosphorylation sites were mapped by mass spectrometry. Red lines mark sites that were phosphorylated by Pom1 in vitro and also in a Pom1-dependent manner in vivo. Black lines mark in vitro phosphorylation sites that were not identified as Pom1-dependent in vivo. Proteins domains are indicated with gray bars for each protein, and the fragments purified for Tea4, Mod5, and Syt22 are underlined in black. Figure 5. Pom1 negatively regulates cell cycle through phosphorylation of C-terminal domain of Cdr2. (A) Length of dividing, septated cells of the indicated strains (mean ± SD; n >100 for each value). (B) Localization of Cdr2 phospho-mutants in pom1+ or pom1∆ cells. Dashed lines showed the cell outlines. Note the off-center localization of Cdr2 in pom1∆ cells. Images are inverted maximum projections from deconvolved z-series. Scale bar, 5 µm. Figure 6. Localization of Pom1 substrates in pom1+ and pom1∆ cells. Images are inverted single focal planes. All fluorescent tags were integrated at the endogenous locus. Scale bar, 5 µm. Figure 7. Pom1 phosphorylation of cell polarity proteins. (A) Western blot analysis of Rga7-3HA and Rga7(Δ475-499)-3HA in pom1+ and pom1∆ cells. Note that Rga7-3HA doublet depends on both Pom1 and Pom1 phosphorylation sites. (B) Localization of Rga7-tdTomato and Rga7(∆475-499)-tdTomato. Images are inverted single focal planes. Scale bar, 5 µm. (C) Combined phosphorylation site mutations in Mod5, Tea4, Pal1, and Rga7 do not impair cell morphology. Images are differential interference contrast images of wildtype and the indicated phopho-mutant. Scale bar, 10 µm. Figure 8. Pom1 cell polarity targets exhibit synthetic genetic defects. (A) Differential interference contrast (DIC) images of the indicated deletion mutants grown at 32˚C in rich media. (B) 10-fold serial dilutions of the indicated strains grown on rich media plates at the indicated temperatures. (C) DIC images of the indicated deletion mutants grown at 32˚C in rich media. Asterisks denote kinked cells. (D) The indicated strains were grown to saturation, and then diluted into fresh rich media for 3.5 hours prior to imaging by DIC. Scale bars are all 10 µm.

15
References 1. Bahler, J., and Pringle, J. R. (1998) Pom1p, a fission yeast protein kinase that provides
positional information for both polarized growth and cytokinesis. Genes & development 12, 1356-1370
2. Martin, S. G., and Berthelot-Grosjean, M. (2009) Polar gradients of the DYRK-family kinase Pom1 couple cell length with the cell cycle. Nature 459, 852-856
3. Moseley, J. B., Mayeux, A., Paoletti, A., and Nurse, P. (2009) A spatial gradient coordinates cell size and mitotic entry in fission yeast. Nature 459, 857-860
4. Bahler, J., Steever, A. B., Wheatley, S., Wang, Y., Pringle, J. R., Gould, K. L., and McCollum, D. (1998) Role of polo kinase and Mid1p in determining the site of cell division in fission yeast. The Journal of cell biology 143, 1603-1616
5. Padte, N. N., Martin, S. G., Howard, M., and Chang, F. (2006) The cell-end factor pom1p inhibits mid1p in specification of the cell division plane in fission yeast. Current biology : CB 16, 2480-2487
6. Bahler, J., and Nurse, P. (2001) Fission yeast Pom1p kinase activity is cell cycle regulated and essential for cellular symmetry during growth and division. The EMBO journal 20, 1064-1073
7. Hachet, O., Berthelot-Grosjean, M., Kokkoris, K., Vincenzetti, V., Moosbrugger, J., and Martin, S. G. (2011) A phosphorylation cycle shapes gradients of the DYRK family kinase Pom1 at the plasma membrane. Cell 145, 1116-1128
8. Bhatia, P., Hachet, O., Hersch, M., Rincon, S. A., Berthelot-Grosjean, M., Dalessi, S., Basterra, L., Bergmann, S., Paoletti, A., and Martin, S. G. (2014) Distinct levels in Pom1 gradients limit Cdr2 activity and localization to time and position division. Cell cycle 13, 538-552
9. Deng, L., Baldissard, S., Kettenbach, A. N., Gerber, S. A., and Moseley, J. B. (2014) Dueling kinases regulate cell size at division through the SAD kinase Cdr2. Current biology : CB 24, 428-433
10. Rincon, S. A., Bhatia, P., Bicho, C., Guzman-Vendrell, M., Fraisier, V., Borek, W. E., Alves Fde, L., Dingli, F., Loew, D., Rappsilber, J., Sawin, K. E., Martin, S. G., and Paoletti, A. (2014) Pom1 regulates the assembly of Cdr2-Mid1 cortical nodes for robust spatial control of cytokinesis. The Journal of cell biology 206, 61-77
11. Walther, T. C., and Mann, M. (2010) Mass spectrometry-based proteomics in cell biology. The Journal of cell biology 190, 491-500
12. de Godoy, L. M., Olsen, J. V., Cox, J., Nielsen, M. L., Hubner, N. C., Frohlich, F., Walther, T. C., and Mann, M. (2008) Comprehensive mass-spectrometry-based proteome quantification of haploid versus diploid yeast. Nature 455, 1251-1254
13. Kruger, M., Moser, M., Ussar, S., Thievessen, I., Luber, C. A., Forner, F., Schmidt, S., Zanivan, S., Fassler, R., and Mann, M. (2008) SILAC mouse for quantitative proteomics uncovers kindlin-3 as an essential factor for red blood cell function. Cell 134, 353-364
14. Ong, S. E., Blagoev, B., Kratchmarova, I., Kristensen, D. B., Steen, H., Pandey, A., and Mann, M. (2002) Stable isotope labeling by amino acids in cell culture, SILAC, as a simple and accurate approach to expression proteomics. Molecular & cellular proteomics : MCP 1, 376-386

16
15. Ong, S. E., and Mann, M. (2005) Mass spectrometry-based proteomics turns quantitative. Nature chemical biology 1, 252-262
16. Bishop, A. C., Buzko, O., and Shokat, K. M. (2001) Magic bullets for protein kinases. Trends in cell biology 11, 167-172
17. Bishop, A. C., Ubersax, J. A., Petsch, D. T., Matheos, D. P., Gray, N. S., Blethrow, J., Shimizu, E., Tsien, J. Z., Schultz, P. G., Rose, M. D., Wood, J. L., Morgan, D. O., and Shokat, K. M. (2000) A chemical switch for inhibitor-sensitive alleles of any protein kinase. Nature 407, 395-401
18. Moreno, S., Klar, A., and Nurse, P. (1991) Molecular genetic analysis of fission yeast Schizosaccharomyces pombe. Methods in enzymology 194, 795-823
19. Bahler, J., Wu, J. Q., Longtine, M. S., Shah, N. G., McKenzie, A., 3rd, Steever, A. B., Wach, A., Philippsen, P., and Pringle, J. R. (1998) Heterologous modules for efficient and versatile PCR-based gene targeting in Schizosaccharomyces pombe. Yeast 14, 943-951
20. Bicho, C. C., de Lima Alves, F., Chen, Z. A., Rappsilber, J., and Sawin, K. E. (2010) A genetic engineering solution to the "arginine conversion problem" in stable isotope labeling by amino acids in cell culture (SILAC). Molecular & cellular proteomics : MCP 9, 1567-1577
21. Olsen, J. V., de Godoy, L. M., Li, G., Macek, B., Mortensen, P., Pesch, R., Makarov, A., Lange, O., Horning, S., and Mann, M. (2005) Parts per million mass accuracy on an Orbitrap mass spectrometer via lock mass injection into a C-trap. Mol Cell Proteomics 4, 2010-2021
22. Villen, J., Beausoleil, S. A., and Gygi, S. P. (2008) Evaluation of the utility of neutral-loss-dependent MS3 strategies in large-scale phosphorylation analysis. Proteomics 8, 4444-4452
23. Kettenbach, A. N., and Gerber, S. A. (2011) Rapid and reproducible single-stage phosphopeptide enrichment of complex peptide mixtures: application to general and phosphotyrosine-specific phosphoproteomics experiments. Anal Chem 83, 7635-7644
24. Xie, R., and Oleschuk, R. (2007) Photoinduced polymerization for entrapping of octadecylsilane microsphere columns for capillary electrochromatography. Anal Chem 79, 1529-1535
25. Magnuson, B., Ekim, B., and Fingar, D. C. (2012) Regulation and function of ribosomal protein S6 kinase (S6K) within mTOR signalling networks. Biochem J 441, 1-21
26. Eng, J. K., Mccormack, A. L., and Yates, J. R. (1994) An Approach to Correlate Tandem Mass-Spectral Data of Peptides with Amino-Acid-Sequences in a Protein Database. Journal of the American Society for Mass Spectrometry 5, 976-989
27. Faherty, B. K., and Gerber, S. A. (2010) MacroSEQUEST: efficient candidate-centric searching and high-resolution correlation analysis for large-scale proteomics data sets. Anal Chem 82, 6821-6829
28. Elias, J. E., and Gygi, S. P. (2007) Target-decoy search strategy for increased confidence in large-scale protein identifications by mass spectrometry. Nat Methods 4, 207-214
29. Taus, T., Kocher, T., Pichler, P., Paschke, C., Schmidt, A., Henrich, C., and Mechtler, K. (2011) Universal and confident phosphorylation site localization using phosphoRS. J Proteome Res 10, 5354-5362
17
30. Han, D. K., Eng, J., Zhou, H., and Aebersold, R. (2001) Quantitative profiling of differentiation-induced microsomal proteins using isotope-coded affinity tags and mass spectrometry. Nat Biotechnol 19, 946-951
31. Schwartz, D., and Gygi, S. P. (2005) An iterative statistical approach to the identification of protein phosphorylation motifs from large-scale data sets. Nat Biotechnol 23, 1391-1398
32. Vizcaino, J. A., Deutsch, E. W., Wang, R., Csordas, A., Reisinger, F., Rios, D., Dianes, J. A., Sun, Z., Farrah, T., Bandeira, N., Binz, P. A., Xenarios, I., Eisenacher, M., Mayer, G., Gatto, L., Campos, A., Chalkley, R. J., Kraus, H. J., Albar, J. P., Martinez-Bartolome, S., Apweiler, R., Omenn, G. S., Martens, L., Jones, A. R., and Hermjakob, H. (2014) ProteomeXchange provides globally coordinated proteomics data submission and dissemination. Nature biotechnology 32, 223-226
33. Koch, A., Krug, K., Pengelley, S., Macek, B., and Hauf, S. (2011) Mitotic substrates of the kinase aurora with roles in chromatin regulation identified through quantitative phosphoproteomics of fission yeast. Science signaling 4, rs6
34. Beltrao, P., Trinidad, J. C., Fiedler, D., Roguev, A., Lim, W. A., Shokat, K. M., Burlingame, A. L., and Krogan, N. J. (2009) Evolution of phosphoregulation: comparison of phosphorylation patterns across yeast species. PLoS biology 7, e1000134
35. Carpy, A., Krug, K., Graf, S., Koch, A., Popic, S., Hauf, S., and Macek, B. (2014) Absolute proteome and phosphoproteome dynamics during the cell cycle of fission yeast. Molecular & cellular proteomics : MCP
36. Wilson-Grady, J. T., Villen, J., and Gygi, S. P. (2008) Phosphoproteome analysis of fission yeast. Journal of proteome research 7, 1088-1097
37. Oppermann, F. S., Grundner-Culemann, K., Kumar, C., Gruss, O. J., Jallepalli, P. V., and Daub, H. (2012) Combination of chemical genetics and phosphoproteomics for kinase signaling analysis enables confident identification of cellular downstream targets. Molecular & cellular proteomics : MCP 11, O111 012351
38. Marguerat, S., Schmidt, A., Codlin, S., Chen, W., Aebersold, R., and Bahler, J. (2012) Quantitative analysis of fission yeast transcriptomes and proteomes in proliferating and quiescent cells. Cell 151, 671-683
39. Carnahan, R. H., and Gould, K. L. (2003) The PCH family protein, Cdc15p, recruits two F-actin nucleation pathways to coordinate cytokinetic actin ring formation in Schizosaccharomyces pombe. The Journal of cell biology 162, 851-862
40. Fankhauser, C., Reymond, A., Cerutti, L., Utzig, S., Hofmann, K., and Simanis, V. (1995) The S. pombe cdc15 gene is a key element in the reorganization of F-actin at mitosis. Cell 82, 435-444
41. Roberts-Galbraith, R. H., Chen, J. S., Wang, J., and Gould, K. L. (2009) The SH3 domains of two PCH family members cooperate in assembly of the Schizosaccharomyces pombe contractile ring. The Journal of cell biology 184, 113-127
42. Wachtler, V., Huang, Y., Karagiannis, J., and Balasubramanian, M. K. (2006) Cell cycle-dependent roles for the FCH-domain protein Cdc15p in formation of the actomyosin ring in Schizosaccharomyces pombe. Molecular biology of the cell 17, 3254-3266
43. Soundararajan, M., Roos, A. K., Savitsky, P., Filippakopoulos, P., Kettenbach, A. N., Olsen, J. V., Gerber, S. A., Eswaran, J., Knapp, S., and Elkins, J. M. (2013) Structures of Down syndrome kinases, DYRKs, reveal mechanisms of kinase activation and substrate recognition. Structure 21, 986-996

18
44. Kettenbach, A. N., Wang, T., Faherty, B. K., Madden, D. R., Knapp, S., Bailey-Kellogg, C., and Gerber, S. A. (2012) Rapid determination of multiple linear kinase substrate motifs by mass spectrometry. Chemistry & biology 19, 608-618
45. Iakoucheva, L. M., Radivojac, P., Brown, C. J., O'Connor, T. R., Sikes, J. G., Obradovic, Z., and Dunker, A. K. (2004) The importance of intrinsic disorder for protein phosphorylation. Nucleic acids research 32, 1037-1049
46. Snaith, H. A., and Sawin, K. E. (2003) Fission yeast mod5p regulates polarized growth through anchoring of tea1p at cell tips. Nature 423, 647-651
47. Snaith, H. A., Samejima, I., and Sawin, K. E. (2005) Multistep and multimode cortical anchoring of tea1p at cell tips in fission yeast. The EMBO journal 24, 3690-3699
48. Martin, S. G., McDonald, W. H., Yates, J. R., 3rd, and Chang, F. (2005) Tea4p links microtubule plus ends with the formin for3p in the establishment of cell polarity. Developmental cell 8, 479-491
49. Tatebe, H., Shimada, K., Uzawa, S., Morigasaki, S., and Shiozaki, K. (2005) Wsh3/Tea4 is a novel cell-end factor essential for bipolar distribution of Tea1 and protects cell polarity under environmental stress in S. pombe. Current biology : CB 15, 1006-1015
50. Ge, W., Chew, T. G., Wachtler, V., Naqvi, S. N., and Balasubramanian, M. K. (2005) The novel fission yeast protein Pal1p interacts with Hip1-related Sla2p/End4p and is involved in cellular morphogenesis. Molecular biology of the cell 16, 4124-4138
51. Soto, T., Villar-Tajadura, M. A., Madrid, M., Vicente, J., Gacto, M., Perez, P., and Cansado, J. (2010) Rga4 modulates the activity of the fission yeast cell integrity MAPK pathway by acting as a Rho2 GTPase-activating protein. The Journal of biological chemistry 285, 11516-11525
52. Villar-Tajadura, M. A., Coll, P. M., Madrid, M., Cansado, J., Santos, B., and Perez, P. (2008) Rga2 is a Rho2 GAP that regulates morphogenesis and cell integrity in S. pombe. Molecular microbiology 70, 867-881
53. Martin-Garcia, R., Coll, P. M., and Perez, P. (2014) F-BAR domain protein Rga7 collaborates with Cdc15 and Imp2 to ensure proper cytokinesis in fission yeast. Journal of cell science
54. Fujita, A., and Misumi, Y. (2009) Fission yeast syt22 protein, a putative Arf guanine nucleotide exchange factor, is necessary for new end take off. FEMS microbiology letters 294, 191-197
55. Pollard, L. W., Onishi, M., Pringle, J. R., and Lord, M. (2012) Fission yeast Cyk3p is a transglutaminase-like protein that participates in cytokinesis and cell morphogenesis. Molecular biology of the cell 23, 2433-2444
56. Demeter, J., and Sazer, S. (1998) imp2, a new component of the actin ring in the fission yeast Schizosaccharomyces pombe. The Journal of cell biology 143, 415-427
57. Arasada, R., and Pollard, T. D. (2011) Distinct roles for F-BAR proteins Cdc15p and Bzz1p in actin polymerization at sites of endocytosis in fission yeast. Current biology : CB 21, 1450-1459
58. Hayles, J., and Nurse, P. (2001) A journey into space. Nature reviews. Molecular cell biology 2, 647-656
59. Chang, F., and Martin, S. G. (2009) Shaping fission yeast with microtubules. Cold Spring Harbor perspectives in biology 1, a001347

19
60. Bicho, C. C., Kelly, D. A., Snaith, H. A., Goryachev, A. B., and Sawin, K. E. (2010) A catalytic role for Mod5 in the formation of the Tea1 cell polarity landmark. Current biology : CB 20, 1752-1757

Table 1. Top targets of Pom1 kinase activity in cells. For each phosphopeptide, the log2-transformed heavy/light ratio is given for pom1-as and wild type strains as indicated.Abbreviations: # = phosphorylation; * = oxidation
Protein Phophopeptide sequence Phospho site pom1-as wild typeCyk3 K.SSIDTPITSSDQGLT#PDLVGS#SNALNKPTR.E T106:S112 -5.59 -0.21Cyk3 K.S#FS#RANS#PLLR.L S207:S209:S213 -1.24 0.28Cyk3 K.SHPM*LNSLGS#SLS#LK.K S140:S143 -1.09 -0.09Rga7 R.AAS#PFRPT#SVS#PQPSSPTK.S S484:T489:S492 -4.50 0.67Rga7 R.AASPFRPTS#VS#PQPSSPT#K.S S490:S492:T499 -3.67 0.13Rga7 R.AASPFRPT#S#VSPQPS#SPTK.S T489:S490:S496 -3.45 -0.18Rga7 R.AASPFRPTS#VS#PQPS#SPTK.S S490:S492:S496 -3.28 -0.09Rga7 R.AASPFRPTS#VS#PQPSS#PTK.S S490:S492:S497 -3.03 -0.13Rga7 R.AAS#PFRPTS#VS#PQPSSPTK.S S484:S490:S492 -2.65 -0.26Rga7 R.AAS#PFRPTSVS#PQPSS#PTK.S S484:S492:S497 -2.27 0.31Rga7 R.AAS#PFRPTS#VSPQPSS#PTK.S S484:S490:S497 -1.98 -0.16Rga7 R.AAS#PFRPTSVS#PQPS#SPTK.S S484:S492:S496 -1.64 0.06Rga7 R.AASPFRPTSVS#PQPSS#PTK.S S492:S497 -1.45 -0.01Rga7 R.AASPFRPTSVS#PQPS#SPTK.S S492:S496 -1.02 0.11Syt22 R.SRS#ALS#YQNDRPLATDLPSVIYNHK.H S647:S650 -4.14 0.08Erj5 R.APASSEDTDS#DGQM*EDEEKSDSVHK.S S251 -3.62 -0.36Pal1 R.SNS#SM*GTFDPPPR.Y S89 -3.23 0.17Pal1 R.S#NSSM*GTFDPPPR.Y S87 -2.48 0.14Pal1 R.SNSS#M*GTFDPPPR.Y S90 -2.23 0.15Mpd2 R.DTDS#PLNILVDKAK.A S320 -3.10 -0.57Mod5 R.DYTQPAASAT#PVPK.E T492 -2.50 -0.05Mod5 K.SAS#PALIDTSTLDSR.L S193 -2.04 0.02Mod5 R.SS#FNS#NFR.T S154:S157 -1.08 -0.60Mod5 K.ARPVS#VPDM*SS#PVPASSVEYESLK.A S276:S282 -1.07 0.32Tea4 K.TLEAPS#PNFR.I S227 -2.33 0.02SPCC5E4.05c R.APTSES#TTVPETIVASTTK.V S344 -2.20 -0.17SPCC5E4.05c R.APT#SES#TTVPETIVASTTK.V T341:S344 -1.21 -0.25Egd2 K.IEES#FEQEKAVDETGVDAK.D S122 -1.84 -0.44Cdr2 R.M*S#VSS#SPFAVFR.Q S758:S761 -1.77 0.03Cdr2 R.M*SVSS#SPFAVFR.Q S761 -1.72 -0.17Cdr2 R.M*S#VSSSPFAVFR.Q S758 -1.23 0.05Ent1 R.T#GDDRFSNIAQAISTGNPM*GTDSFGNIGLTR.V T591 -1.62 -0.24Ent1 K.FTNSAGQTIQAQAT#GNT#HNPFQSQQATGYYK.Q T644:T647 -1.09 -0.24Imp2 K.LTS#RPS#TPNVGNTAPDALSSPR.N S380:S383 -1.41 -0.06Imp2 R.NDS#PLTSAADEQM*K.H S402 -1.13 -0.02SPCC962.01 R.FDHVTGTAENRPQT#PST#K.A T91:T94 -1.32 -0.06SPCC962.01 R.FDHVTGTAENRPQT#PS#TK.A T91:S93 -1.11 -0.05Vps35 R.SILISS#PADLIASDPR.A S732 -1.22 -0.05Pom1 R.SSNGNSDSAS#PPPVPR.L S513 -1.11 -0.32

Figure 1
Light Heavy
1:1 mix
Intensity
m/z
3-‐MB-‐PP1 DMSO
Whole cell lysate
Digested with trypsin
LC-‐MS/LTQ-‐Orbitrap
Light
wt/pom1-‐as
Heavy

# Phosphoproteins # Phosphopep8des # Phosphoryla8on sites
This study 2,113 18,071 12,524
Carpy et al. 1,331 2,661 3,636
Beltrao et al. 915 2,139 2,061
Wilson-‐Grady et al. 1,194 3,640 3,196
Koch et al. 1,544 6,986 8,279
Combined 2,553 27,111 18,861
A
B C
Figure 2
0
50
100
150
200
250
300
350
400
0 20 40 60 80 100
# proteins
# phosphoryla8on sites 0 10 20 30 40
acSn corScal patch assembly
regulaSon of establishment of cell polarity
regulaSon of Rho GTPase acSvity
bipolar cell growth
Rho GTPase acSvator acSvity
ARF guanyl-‐nucleoSde exchange factor acSvity
phosphaSdylinositol bisphosphate binding
medial cortex
site of polarized growth
growing cell Sp
non-‐growing cell Sp
Fold-‐enrichment (p<0.01)
p=1.2E-‐7 p=7.4E-‐5 p=5.1E-‐8 p=2.4E-‐6
p=6.3E-‐5
p=9.5E-‐3 p=1.2E-‐3
p=5.8E-‐4 p=6.8E-‐3
p=5.3E-‐5
p=3.0E-‐5
FuncSon Component
Process

A
B
C
0"
2"
4"
6"
8"
'4" '3" '2" '1" 0" 1" 2" 3" 4"log2 raSo heavy/light
-‐log 1
0 p-‐value
Figure 3
0 10 20 30 40 50
nucleoside-triphosphatase regulator GTPase regulator activity!
cell division site part!cell cortex of cell tip!
site of polarized growth!cytoskeleton organization!
anatomical structure morphogenesis!cell morphogenesis!
actin cytoskeleton organization!regulation of cell growth!
activation of bipolar cell growth!
FuncSon Component Process
p=2.0E-‐2
p=2.5E-‐2 p=3.8E-‐4
p=2.0E-‐2 p=1.4E-‐2 p=1.7E-‐2
p=9.3E-‐4
p=2.7E-‐3 p=3.1E-‐4
p=1.8E-‐2 p=2.3E-‐2
Fold enrichment (p<0.01)

100 200 300 400 500 600 700 800 900 1000 0
Tea4 (1-‐296) SH3
Mod5 (28-‐495) TBD
Rga7 FBAR GAP
Pal1 Pal
Syt22 (297-‐807) Sec7 PH
Lines indicate phosphorylated residue
Red = Pom1 site in vivo by SILAC
Black = Not Pom1-‐dependent in vivo
Figure 4
Amino acids
Strain Length at division (µm)
wt 13.7 ± 0.8
pom1∆ 12.0 ± 1.4
mEGFP-‐cdr2-‐4A 12.3 ± 1.3
mEGFP-‐cdr2-‐4D 14.9 ± 0.9
mEGFP-‐cdr2 pom1∆ 12.1 ± 1.2
mEGFP-‐cdr2-‐4D pom1∆ 15.1 ± 1.1
Cdr2-‐4A Cdr2-‐4D
pom1+
pom1∆
mEGFP
A
B
Figure 5

pom1+
pom1∆
Pal1-‐GFP Rga7-‐GFP Syt22-‐GFP Tea4-‐GFP GFP-‐Mod5
Figure 6

pom1+ pom1∆ pom1+ pom1∆
Rga7-‐3HA Rga7(∆475-‐499)-‐3HA
α-‐HA
Rga7-‐tdTomato Rga7(∆475-‐499)-‐tdTomato
wildtype Mod5-‐9A tea4-‐S227A
Pal1-‐S89A,S90A rga7(∆475-‐499)
A
B
C
Figure 7

Log-‐phase Starve-‐refeed A C
B wildtype
pal1∆
tea4∆
tea4∆ pal1∆
wt
pal1∆
tea4∆
pal1∆ tea4∆
wt
syt22∆
tea4∆
syt22∆ tea4∆
wt
syt22∆
tea4∆
syt22∆ tea4∆
D
25˚C 37˚C
Figure 8
* *