Embed Size (px)
Citation preview

Richard LawsonCentral Manchester Nuclear Medicine Centre
Quantitative Methods in Renography
Radionuclides in Nephrourology, Mikulov 2010
Richard Lawson Central Manchester Nuclear Medicine Centre
Overview• Problems of quantifying the renogram• Complex shape of the curve• Unwanted background
• Background subtraction• Recognising correct subtraction
Tissue and vascular background components• Compare two solutions• Rutland plot• Deconvolution• Quantitative parameters• Relative function• Absolute function• Elimination
ISCORN Consensus Report: Sem.Nucl.Med. 1999, 29:146-159
Richard Lawson Central Manchester Nuclear Medicine Centre
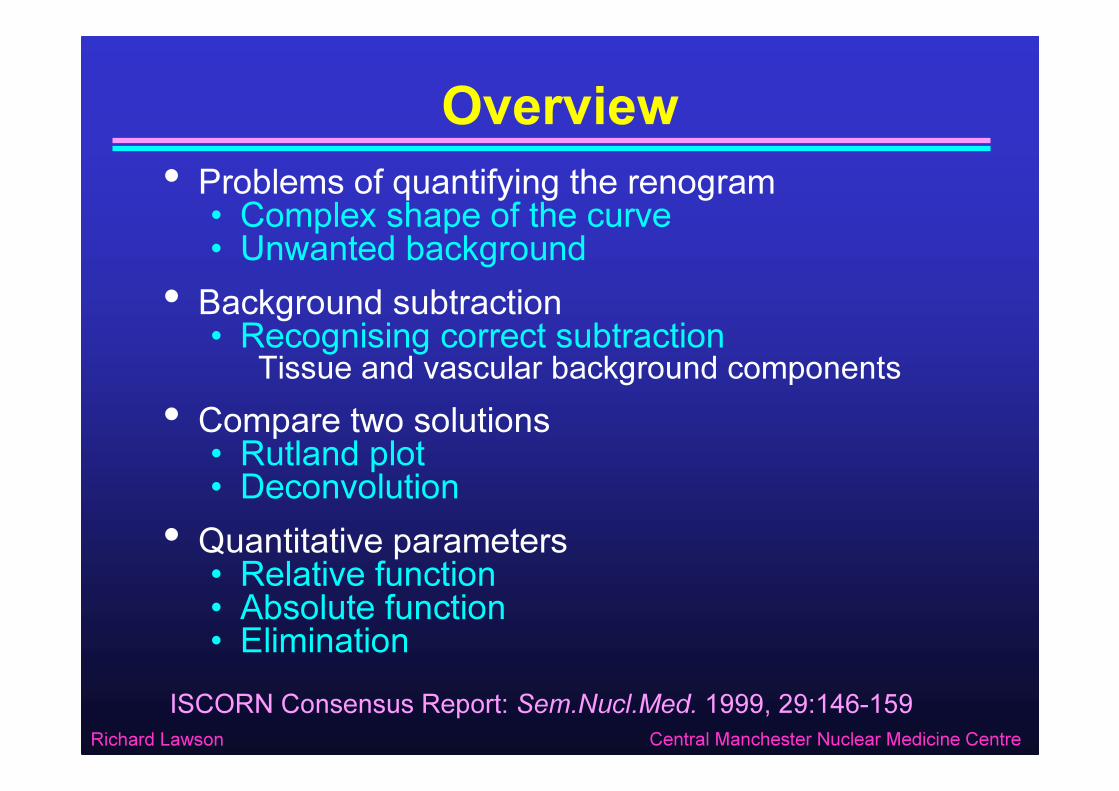
Renography• Renography is a dynamic study of kidney function• Time is the important dimension• It is the renogram curves that show transit of tracer through the kidneys• So curves are more important than the images• Upslope of curves demonstrate kidney uptake• Relative functionone kidney compared with the other• Absolute functioneach kidney compared with normal
• Downslope of curves demonstrate elimination
It is important to produce the correct curves
Richard Lawson Central Manchester Nuclear Medicine Centre
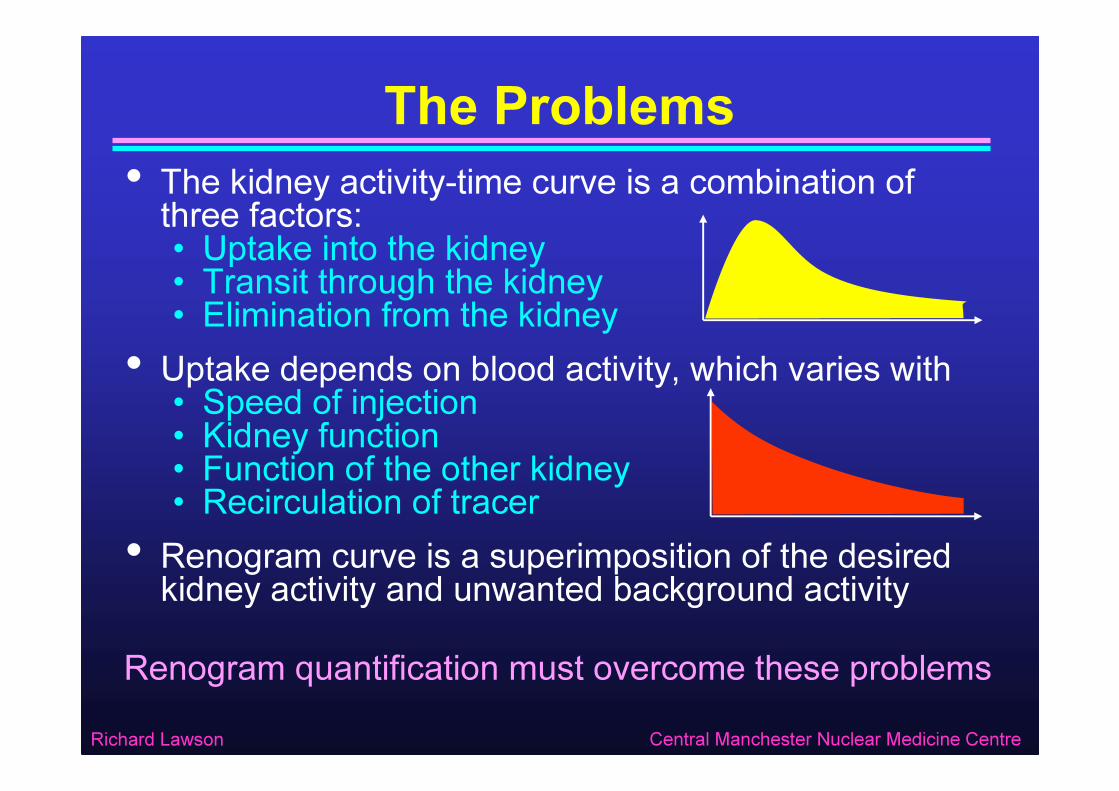
The Problems• The kidney activity-time curve is a combination of three factors:• Uptake into the kidney• Transit through the kidney• Elimination from the kidney
• Uptake depends on blood activity, which varies with• Speed of injection• Kidney function• Function of the other kidney • Recirculation of tracer
• Renogram curve is a superimposition of the desired kidney activity and unwanted background activity Renogram quantification must overcome these problems
Background Subtraction
Richard Lawson Central Manchester Nuclear Medicine Centre
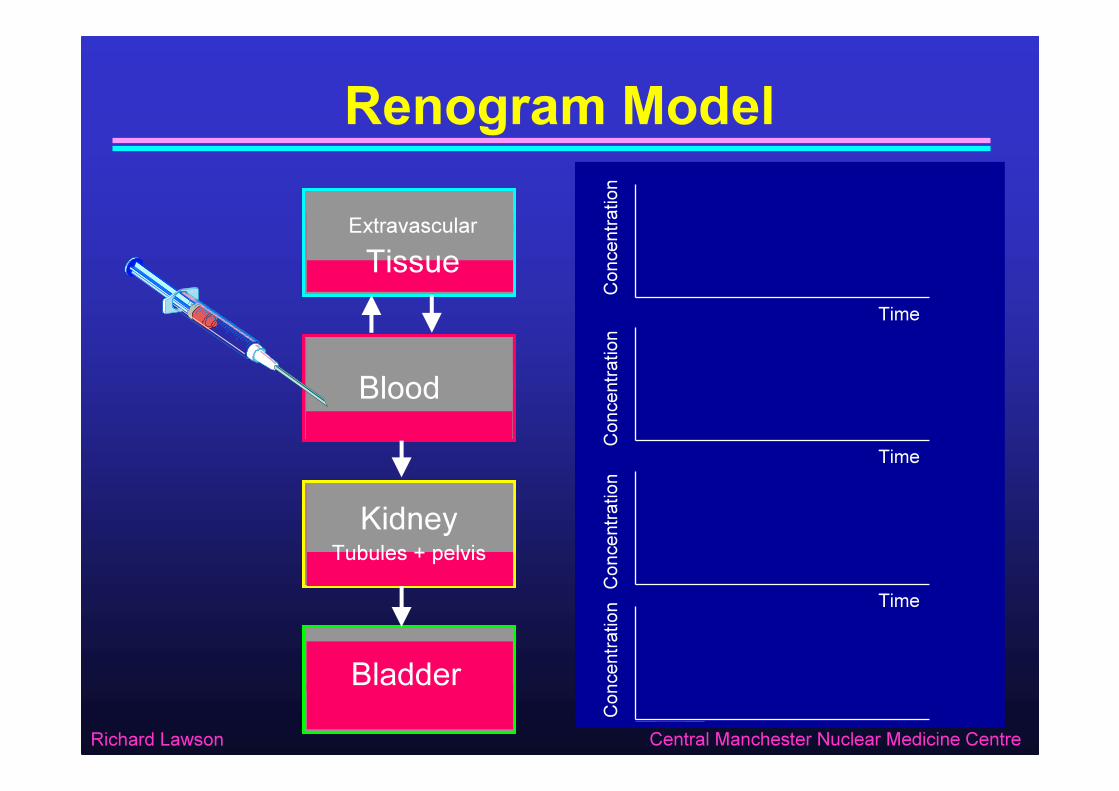
Renogram Model
Time
Conc
entra
tion
KidneyTubules + pelvis
Bladder
ExtravascularTissue
Blood
Conc
entra
tion
Conc
entra
tion
Conc
entra
tion
Time
Time
Richard Lawson Central Manchester Nuclear Medicine Centre
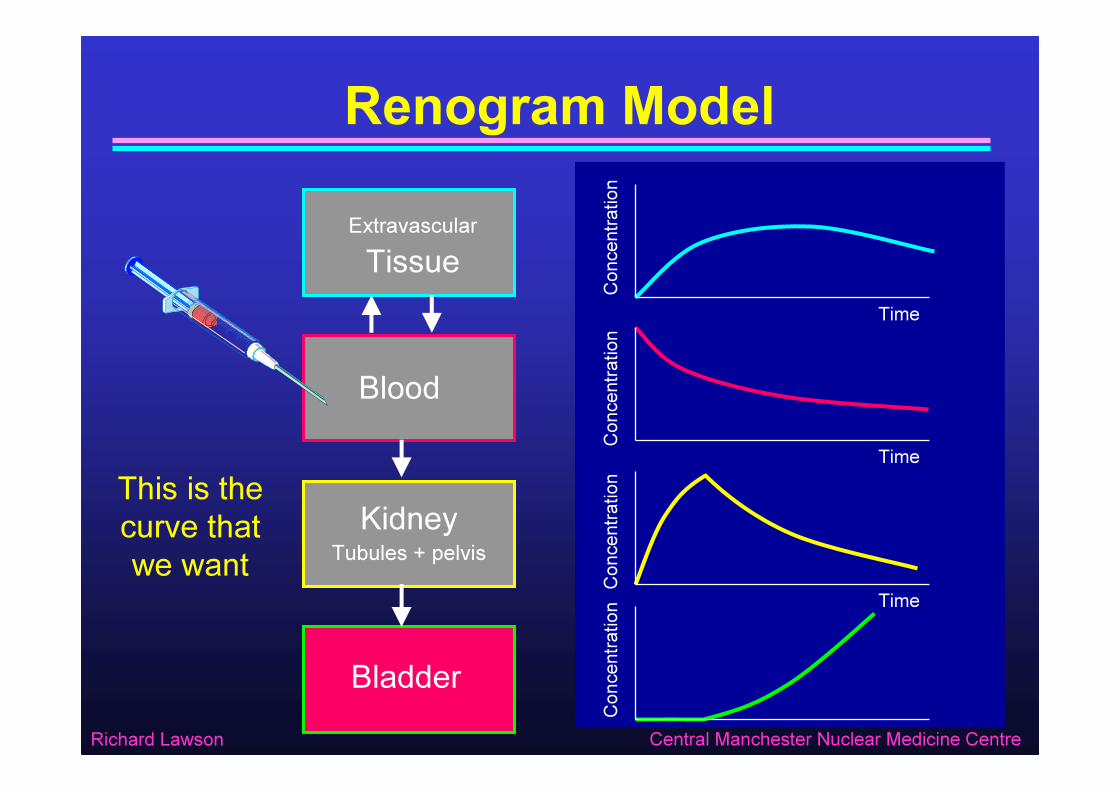
Renogram Model
Time
Conc
entra
tion
Blood
Bladder
KidneyTubules + pelvis
ExtravascularTissue
Conc
entra
tion
Conc
entra
tion
Conc
entra
tion
Time
Time
This is the curve that we want
Richard Lawson Central Manchester Nuclear Medicine Centre
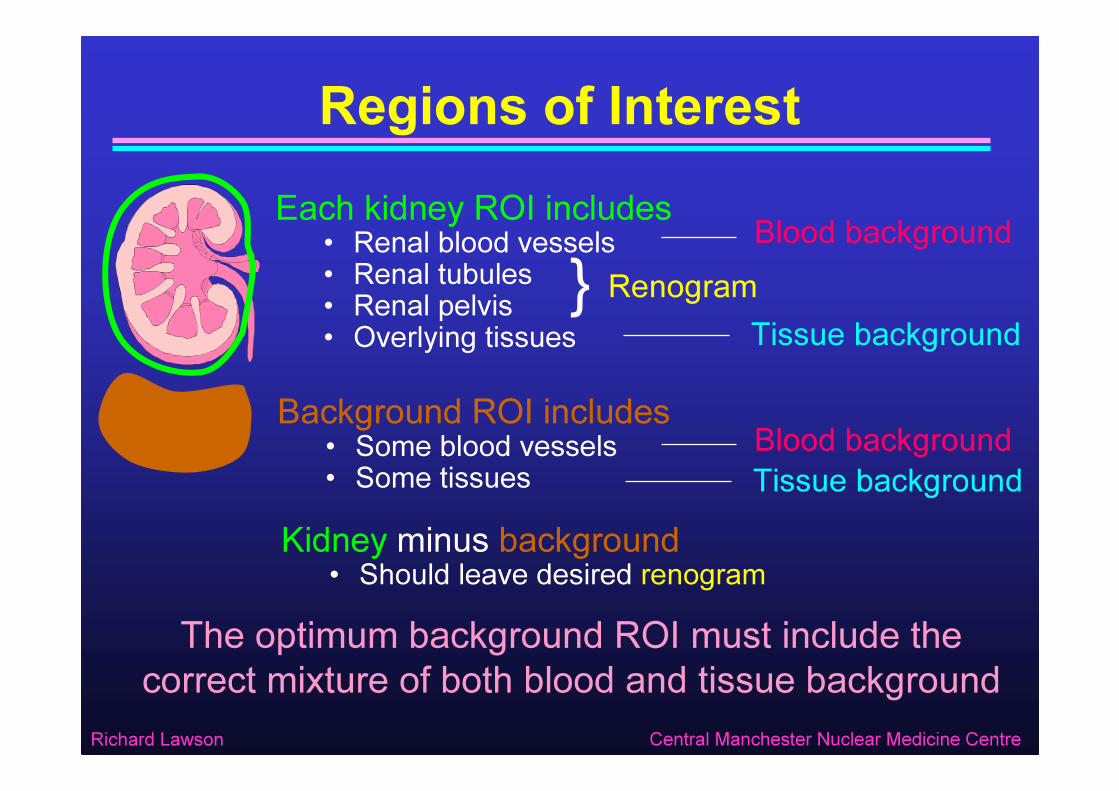
Each kidney ROI includes• Renal blood vessels • Renal tubules• Renal pelvis• Overlying tissues
Regions of Interest
Background ROI includes• Some blood vessels • Some tissues
The optimum background ROI must include the correct mixture of both blood and tissue background
Blood background
Tissue backgroundRenogram}
Kidney minus background• Should leave desired renogram
Blood backgroundTissue background
Richard Lawson Central Manchester Nuclear Medicine Centre
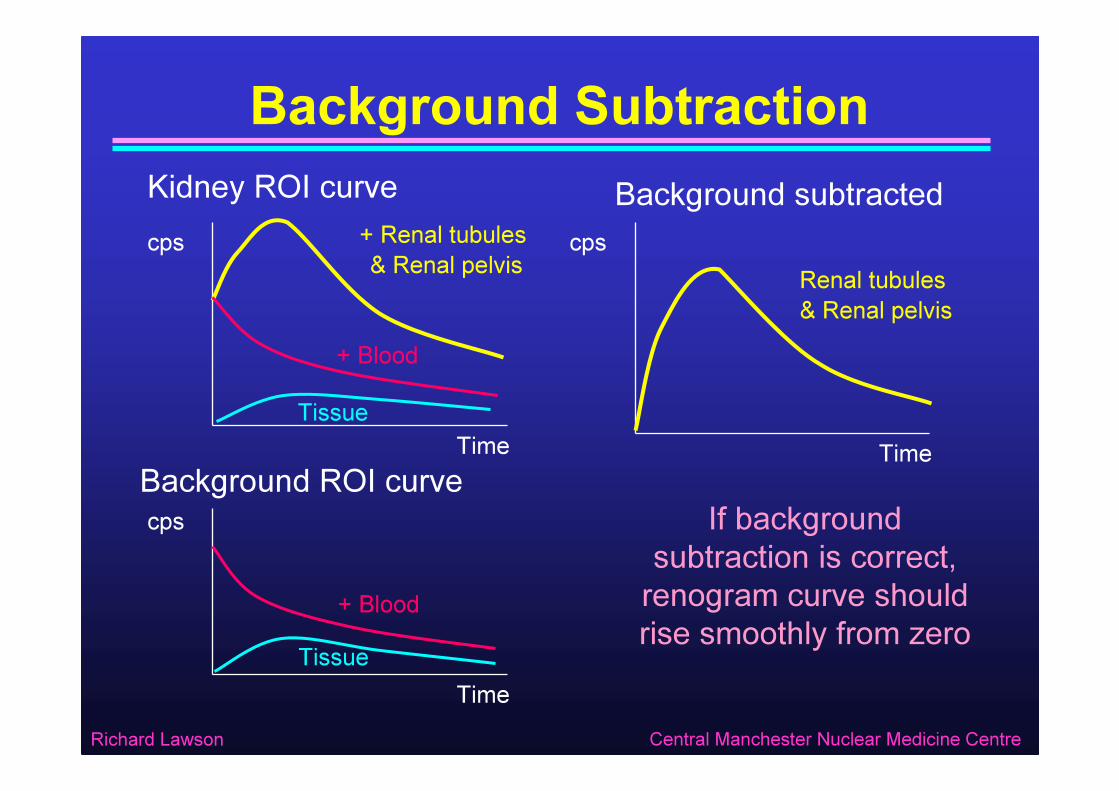
Background Subtraction
If background subtraction is correct, renogram curve should rise smoothly from zero
Kidney ROI curve+ Renal tubules& Renal pelvis
+ BloodTissue
cps
TimeBackground ROI curve
Tissue+ Blood
cps
Time
Background subtracted
Renal tubules& Renal pelvis
cps
Time
Richard Lawson Central Manchester Nuclear Medicine Centre
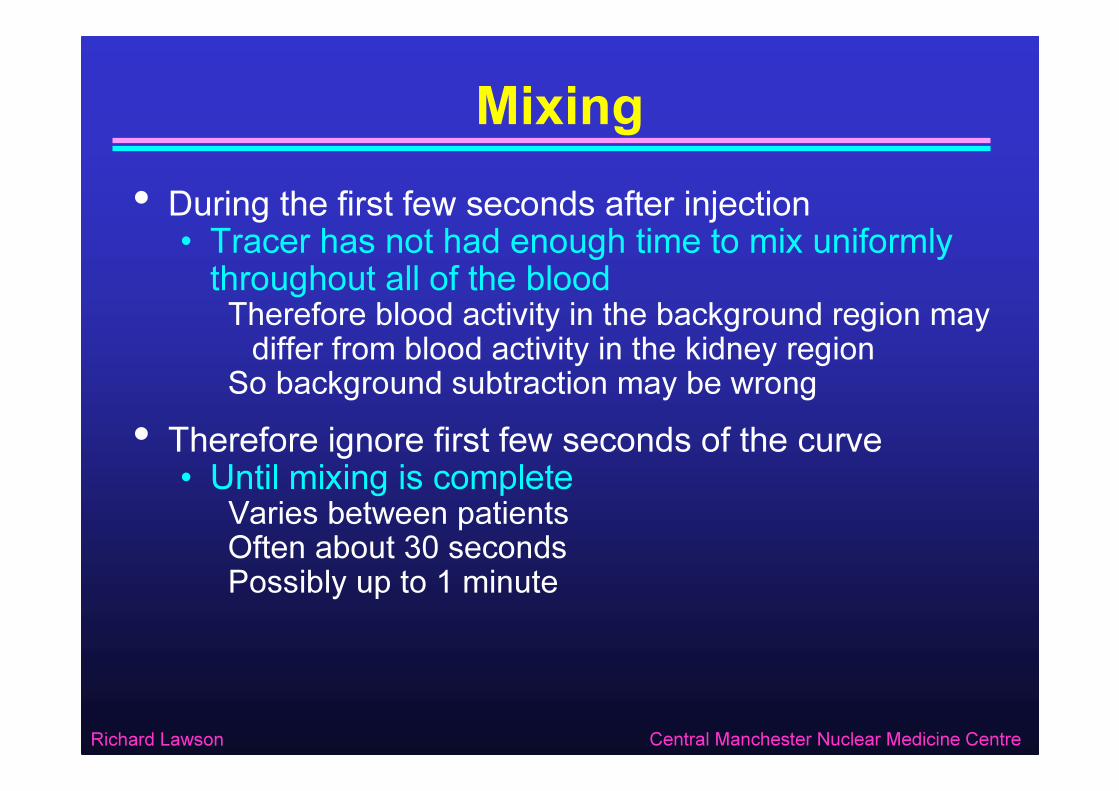
Mixing• During the first few seconds after injection• Tracer has not had enough time to mix uniformly throughout all of the bloodTherefore blood activity in the background region may differ from blood activity in the kidney region
So background subtraction may be wrong• Therefore ignore first few seconds of the curve• Until mixing is complete
Varies between patientsOften about 30 secondsPossibly up to 1 minute
Richard Lawson Central Manchester Nuclear Medicine Centre
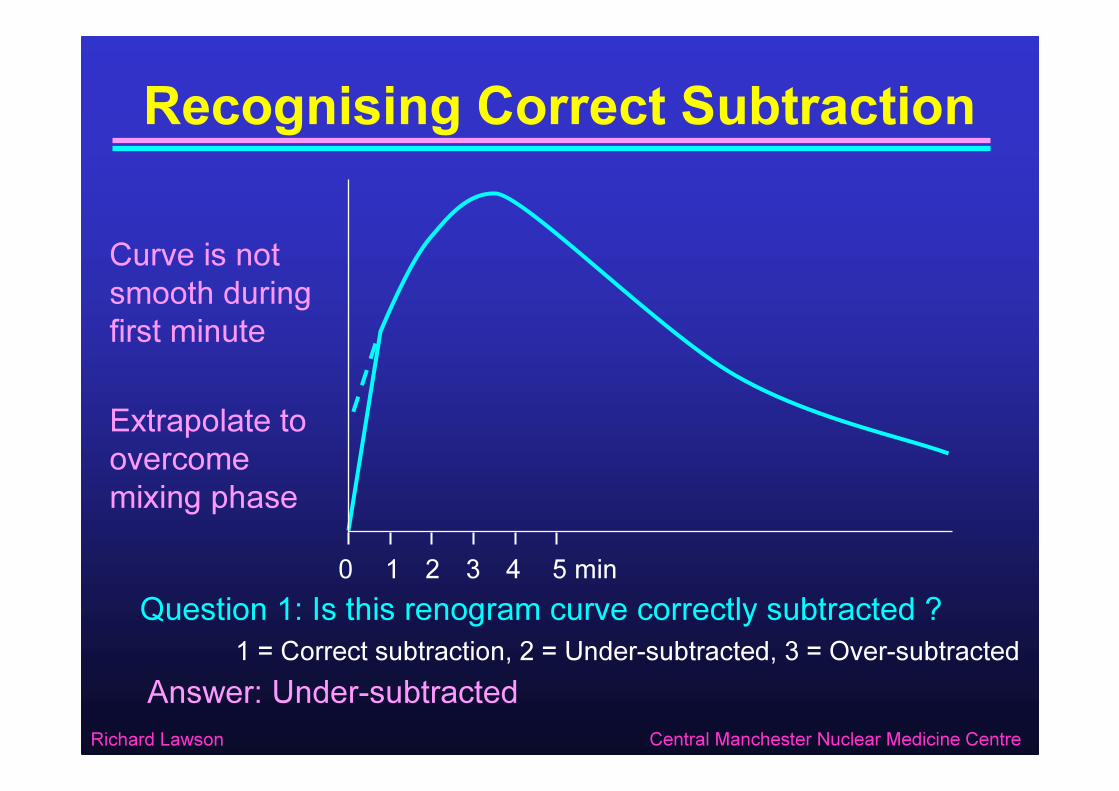
Recognising Correct Subtraction
5 min0 1 2 3 4
Curve is not smooth during first minute
Question 1: Is this renogram curve correctly subtracted ?1 = Correct subtraction, 2 = Under-subtracted, 3 = Over-subtracted
Answer: Under-subtracted
Extrapolate to overcome mixing phase
Richard Lawson Central Manchester Nuclear Medicine Centre
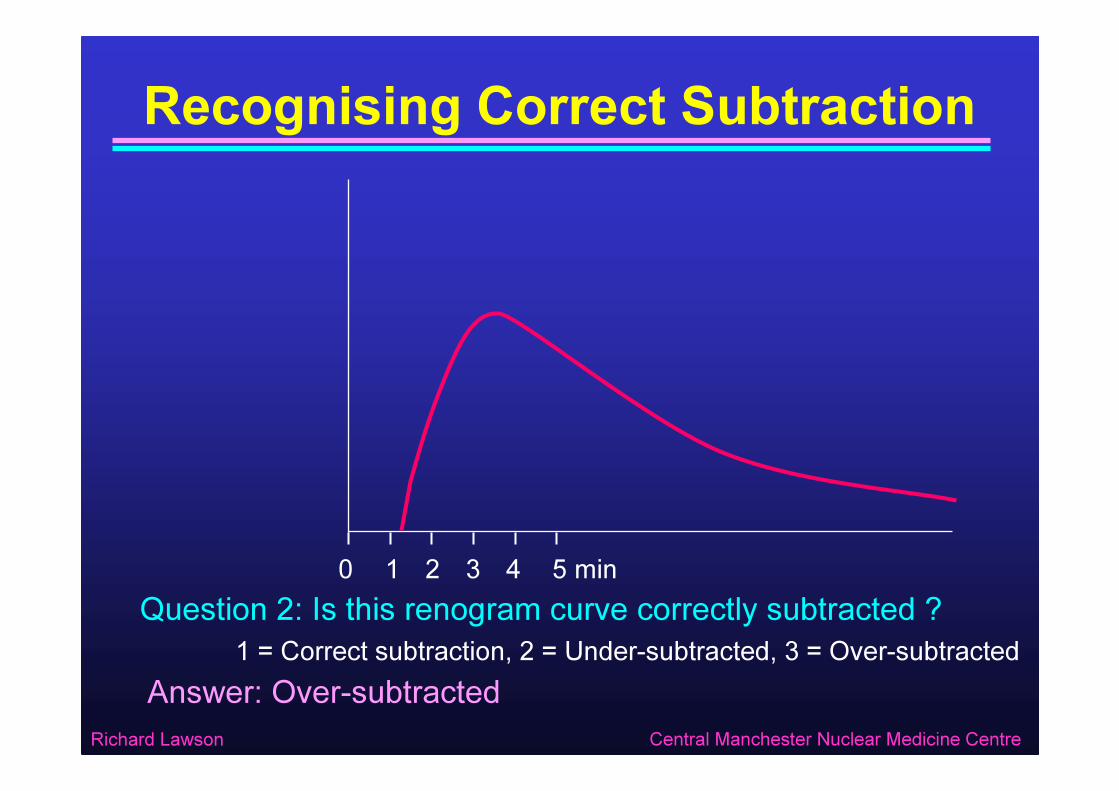
Recognising Correct Subtraction
5 min0 1 2 3 4Question 2: Is this renogram curve correctly subtracted ?
1 = Correct subtraction, 2 = Under-subtracted, 3 = Over-subtractedAnswer: Over-subtracted
Richard Lawson Central Manchester Nuclear Medicine Centre
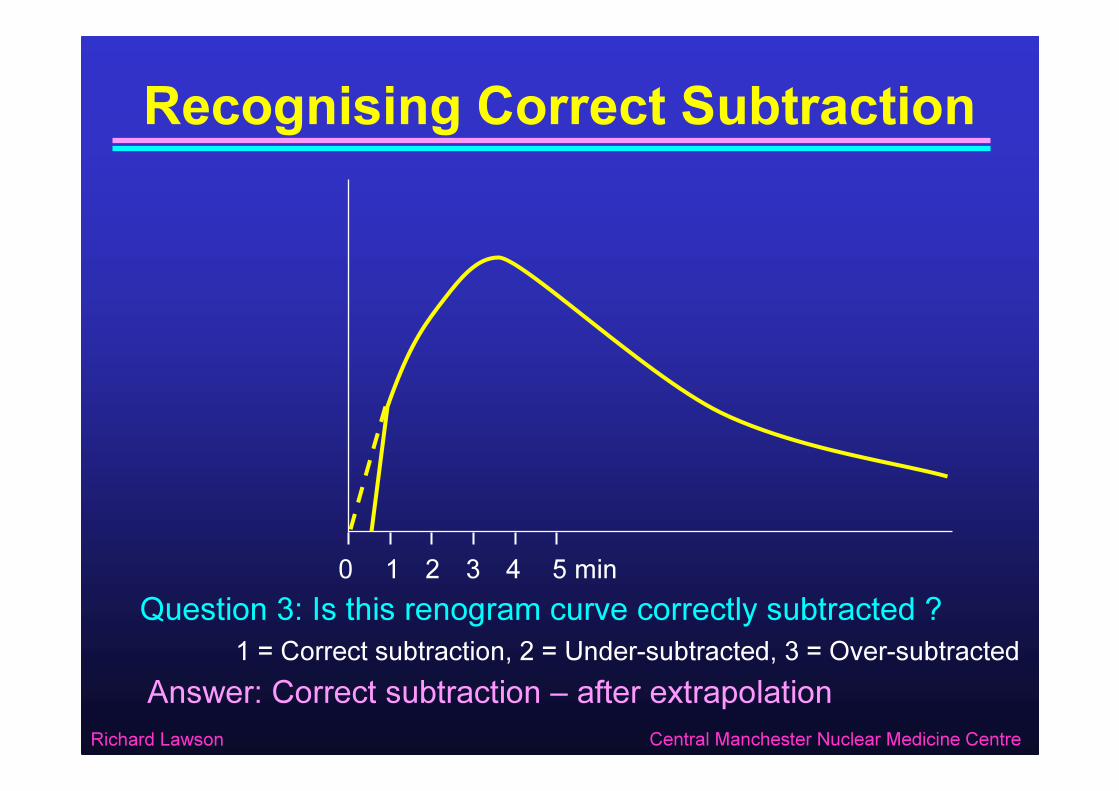
Recognising Correct Subtraction
5 min0 1 2 3 4Question 3: Is this renogram curve correctly subtracted ?
1 = Correct subtraction, 2 = Under-subtracted, 3 = Over-subtractedAnswer: Correct subtraction – after extrapolation
Richard Lawson Central Manchester Nuclear Medicine Centre
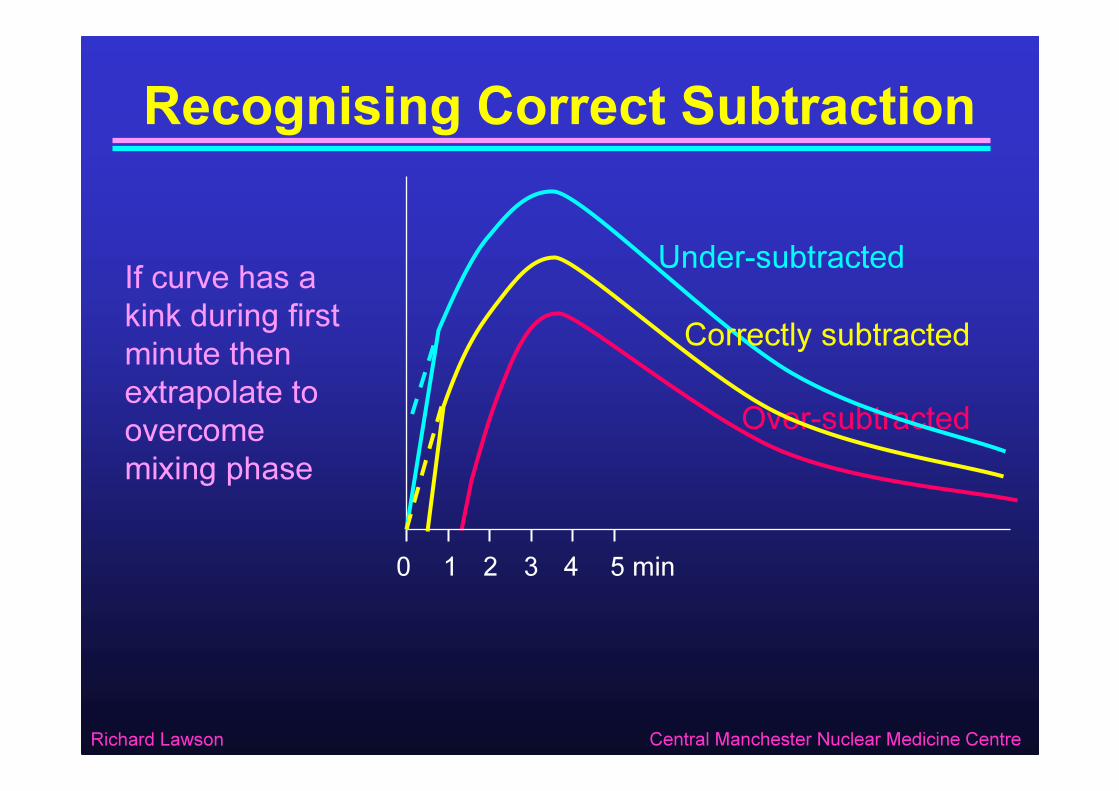
Recognising Correct Subtraction
Over-subtracted
5 min0 1 2 3 4
Under-subtracted
Correctly subtractedIf curve has a kink during first minute then extrapolate to overcome mixing phase
Richard Lawson Central Manchester Nuclear Medicine Centre
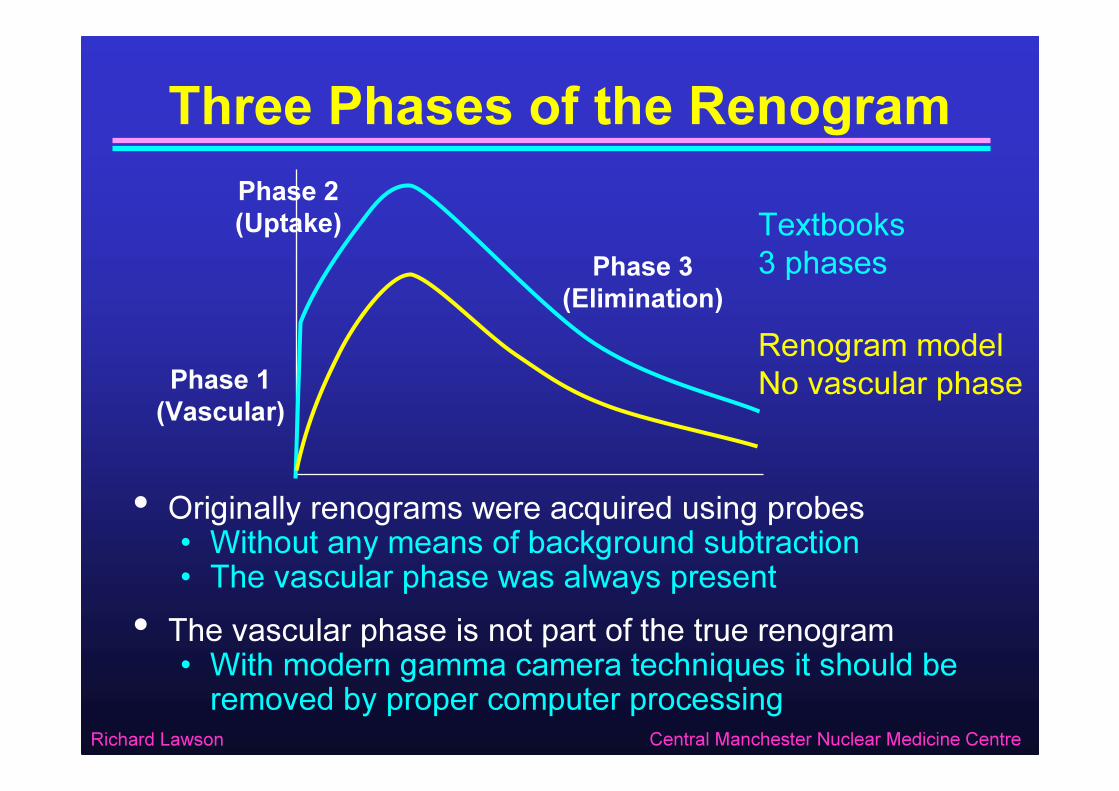
Three Phases of the Renogram
• Originally renograms were acquired using probes• Without any means of background subtraction• The vascular phase was always present
• The vascular phase is not part of the true renogram• With modern gamma camera techniques it should be removed by proper computer processing
Phase 1 (Vascular)
Phase 2 (Uptake)
Phase 3 (Elimination)
Textbooks3 phases
Renogram modelNo vascular phase

Richard Lawson Central Manchester Nuclear Medicine Centre
Teaching Point• Background subtraction is correct when the renogram curve rises smoothly from zeroAfter extrapolating to overcome incomplete mixing during the first minuteAssuming that the bolus appears in kidneys during the first frame of the study – time zero
0 1 min

Background Subtraction Examples
Richard Lawson Central Manchester Nuclear Medicine Centre
Example 1
• 50 MBq 99mTc MAG3• Good uptake in both kidneys• Both kidneys equal function
Richard Lawson Central Manchester Nuclear Medicine Centre
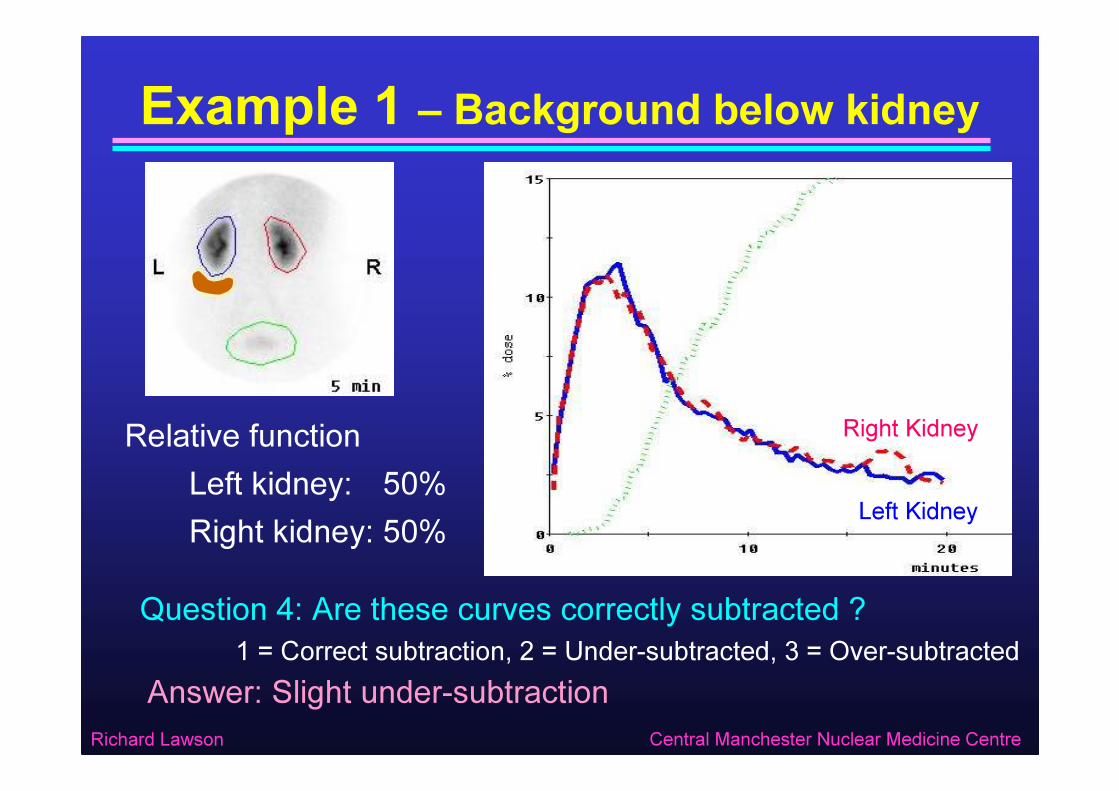
Example 1 – Background below kidney
Relative functionLeft kidney: 50%Right kidney: 50%
Answer: Slight under-subtraction
Left Kidney
Right Kidney
Question 4: Are these curves correctly subtracted ?1 = Correct subtraction, 2 = Under-subtracted, 3 = Over-subtracted
Richard Lawson Central Manchester Nuclear Medicine Centre
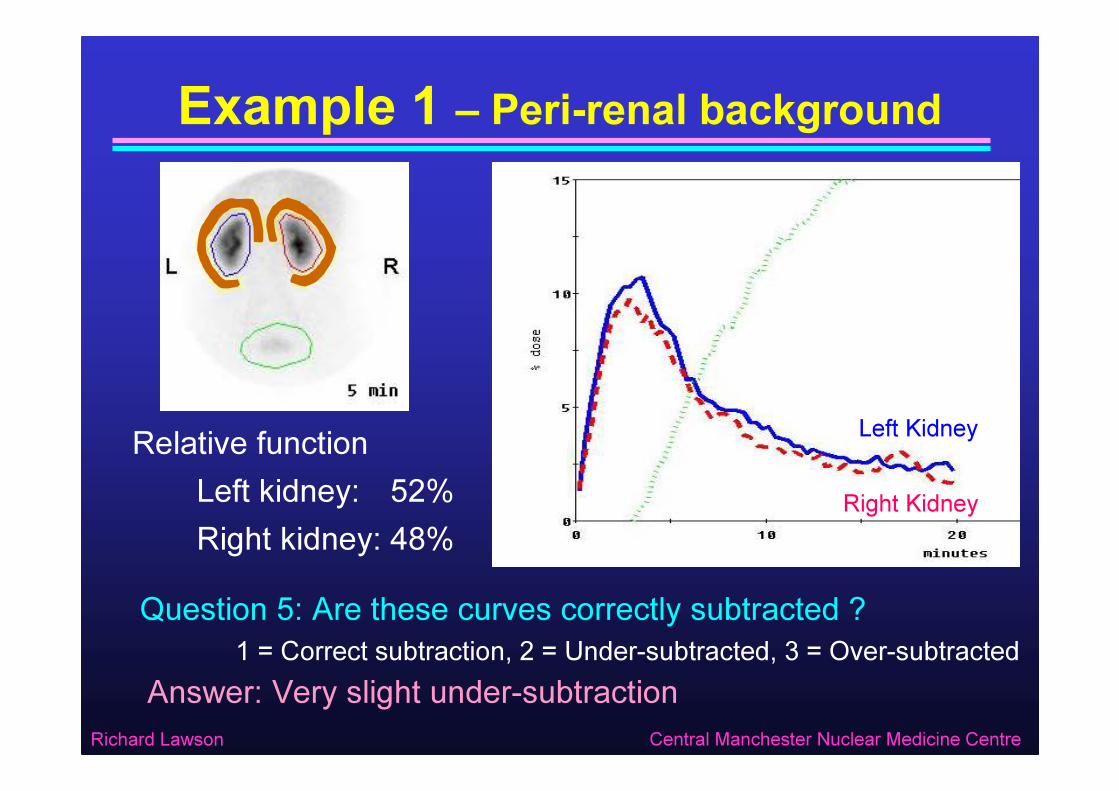
Example 1 – Peri-renal background
Relative functionLeft kidney: 52%Right kidney: 48%
Answer: Very slight under-subtraction
Left Kidney
Right Kidney
Question 5: Are these curves correctly subtracted ?1 = Correct subtraction, 2 = Under-subtracted, 3 = Over-subtracted
Richard Lawson Central Manchester Nuclear Medicine Centre
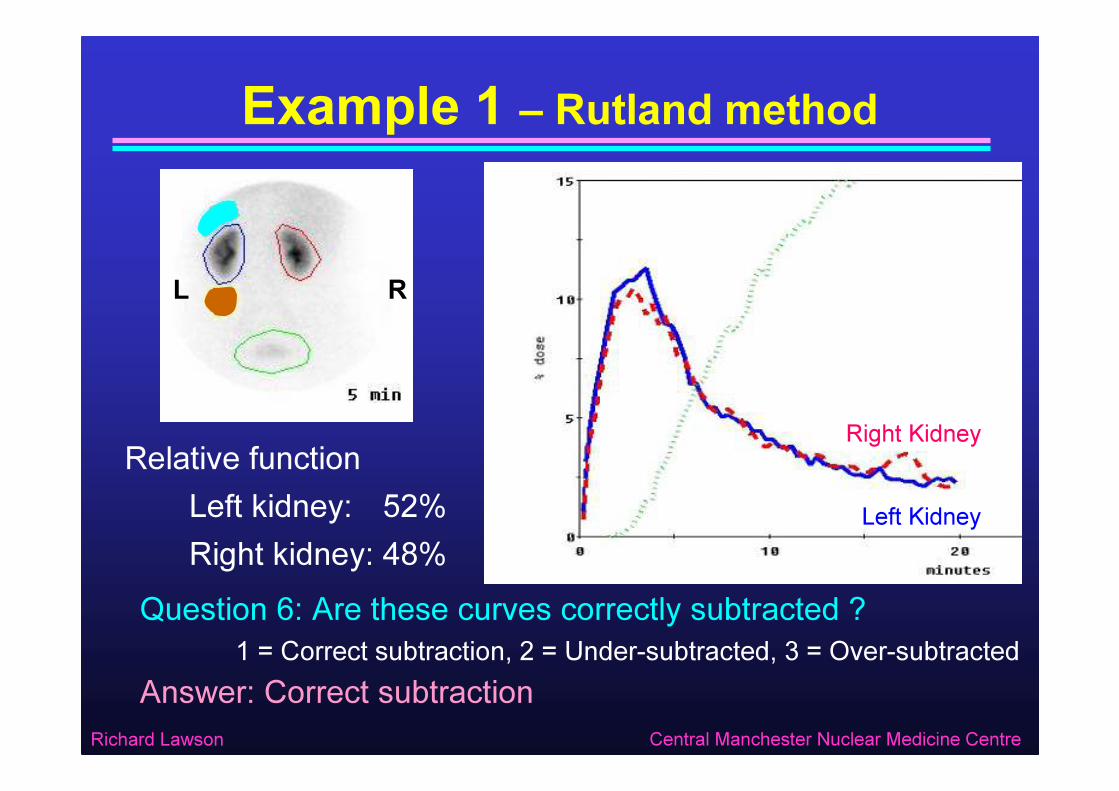
Example 1 – Rutland method
Relative functionLeft kidney: 52%Right kidney: 48%
L R
Answer: Correct subtraction
Left Kidney
Right Kidney
Question 6: Are these curves correctly subtracted ?1 = Correct subtraction, 2 = Under-subtracted, 3 = Over-subtracted
Richard Lawson Central Manchester Nuclear Medicine Centre
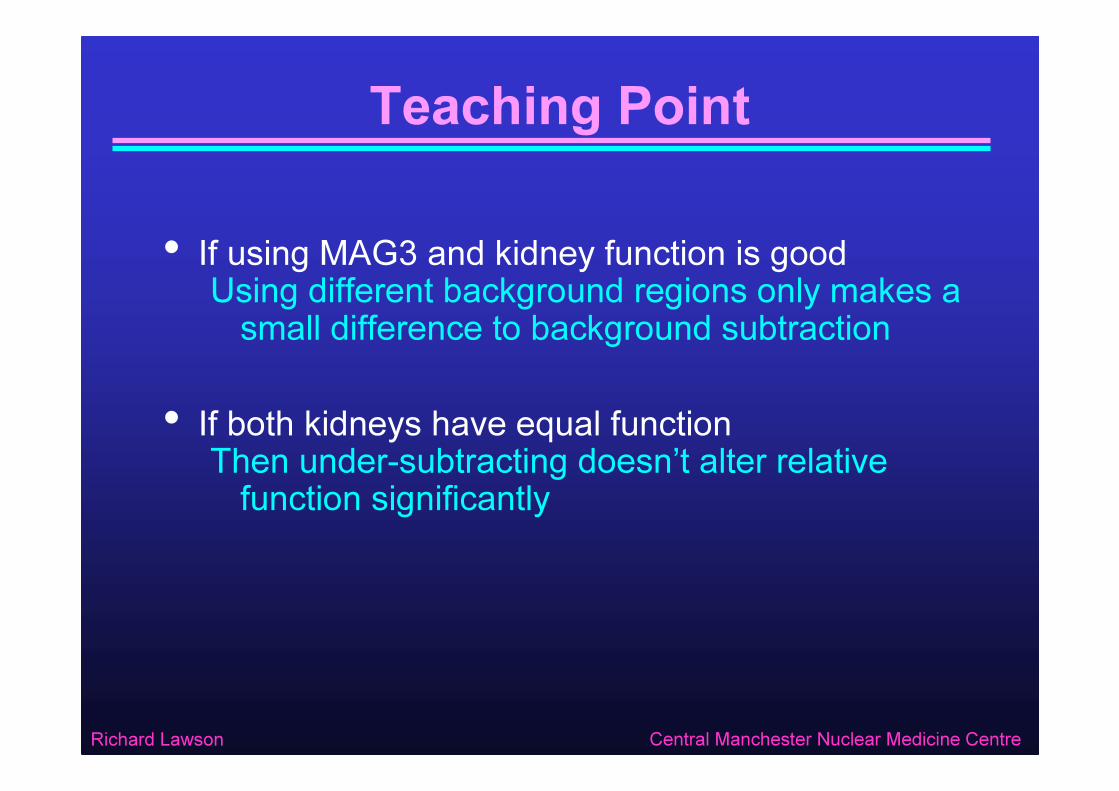
Teaching Point
• If using MAG3 and kidney function is goodUsing different background regions only makes a small difference to background subtraction
• If both kidneys have equal functionThen under-subtracting doesn’t alter relative function significantly
Richard Lawson Central Manchester Nuclear Medicine Centre
Example 2
• 50MBq 99mTc MAG3• Both kidneys poor function• Right worse than left
Richard Lawson Central Manchester Nuclear Medicine Centre
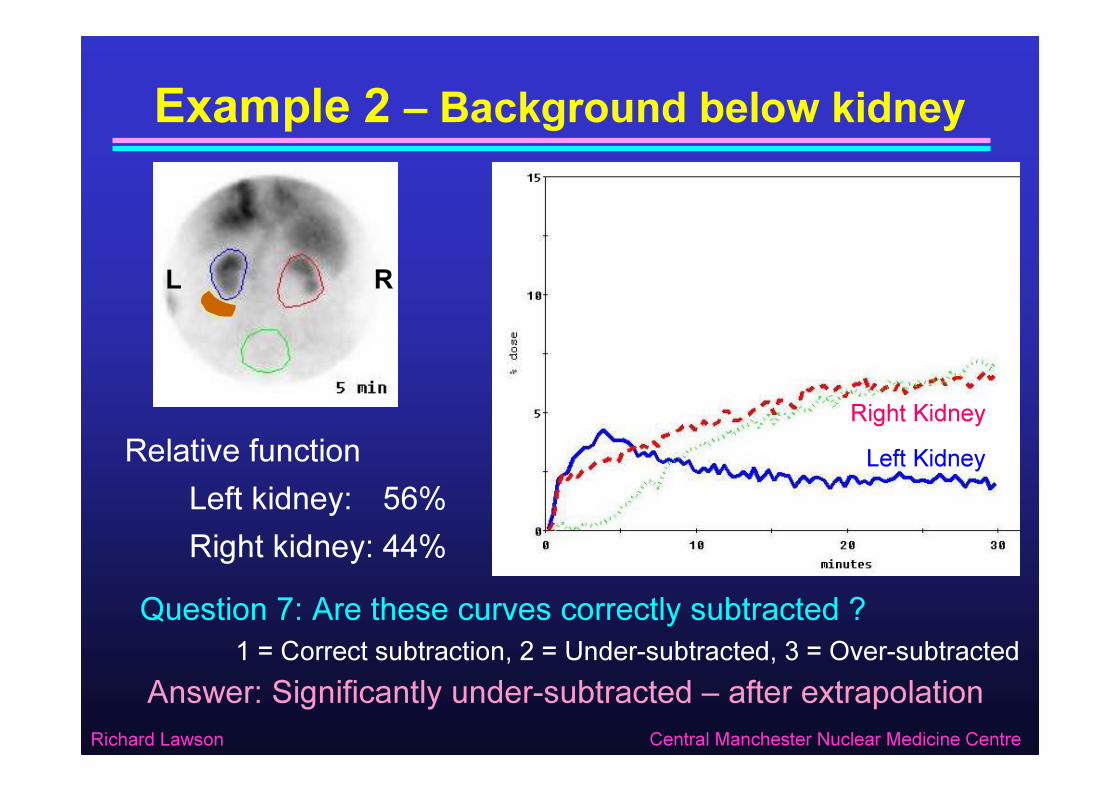
Example 2 – Background below kidney
Relative functionLeft kidney: 56%Right kidney: 44%
Answer: Significantly under-subtracted – after extrapolation
L R
Left KidneyRight Kidney
Question 7: Are these curves correctly subtracted ?1 = Correct subtraction, 2 = Under-subtracted, 3 = Over-subtracted
Richard Lawson Central Manchester Nuclear Medicine Centre
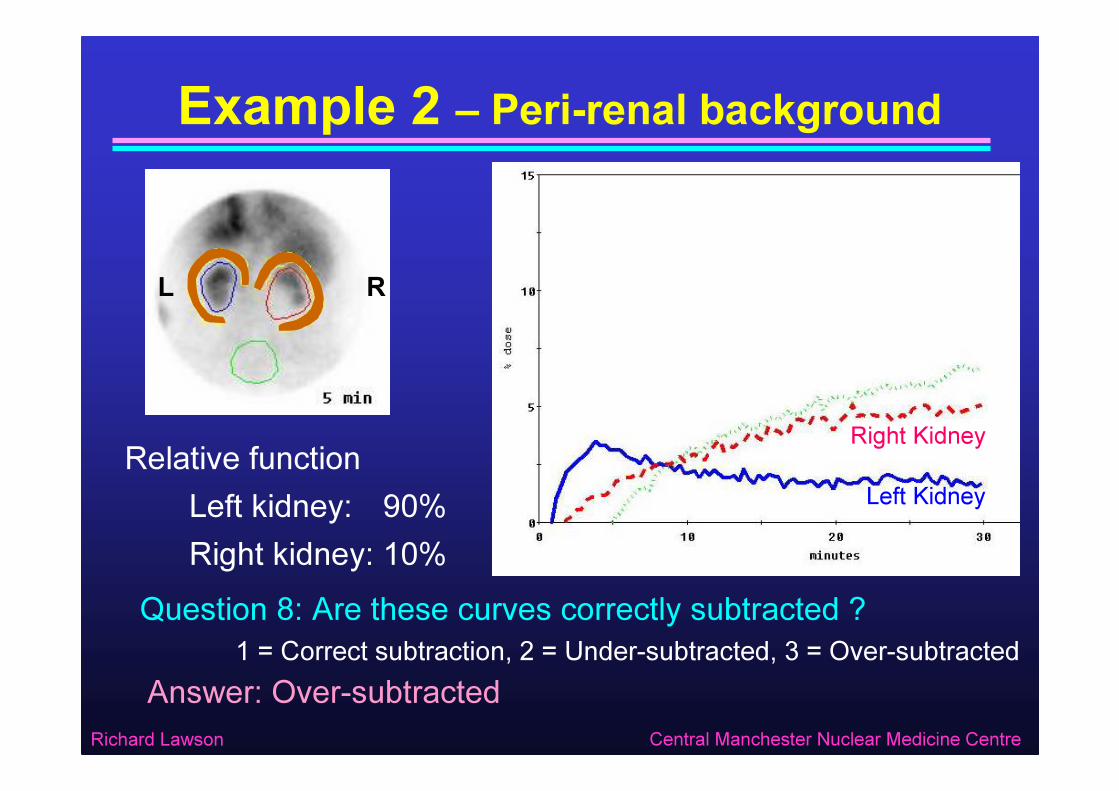
Example 2 – Peri-renal background
Relative functionLeft kidney: 90%Right kidney: 10%
Answer: Over-subtracted
L R
Left Kidney
Right Kidney
Question 8: Are these curves correctly subtracted ?1 = Correct subtraction, 2 = Under-subtracted, 3 = Over-subtracted

Richard Lawson Central Manchester Nuclear Medicine Centre
Example 2 – Rutland method
Relative functionLeft kidney: 66%Right kidney: 34%
Answer: Correct subtraction – after extrapolation
L R
Left Kidney
Right Kidney
Question 9: Are these curves correctly subtracted ?1 = Correct subtraction, 2 = Under-subtracted, 3 = Over-subtracted
Richard Lawson Central Manchester Nuclear Medicine Centre
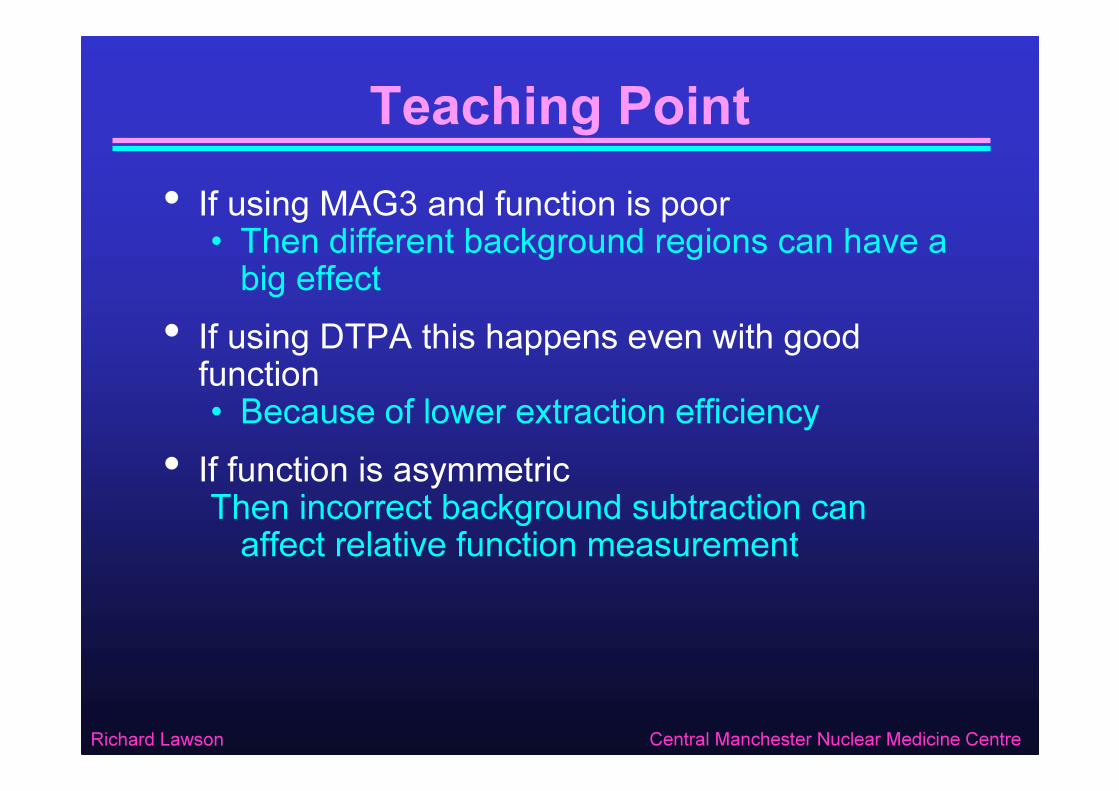
Teaching Point• If using MAG3 and function is poor• Then different background regions can have a big effect
• If using DTPA this happens even with good function• Because of lower extraction efficiency
• If function is asymmetricThen incorrect background subtraction can affect relative function measurement
Richard Lawson Central Manchester Nuclear Medicine Centre
Example 3
• 50 MBq 99mTc MAG3• Left kidney good function• Right kidney hydronephrotic
Richard Lawson Central Manchester Nuclear Medicine Centre
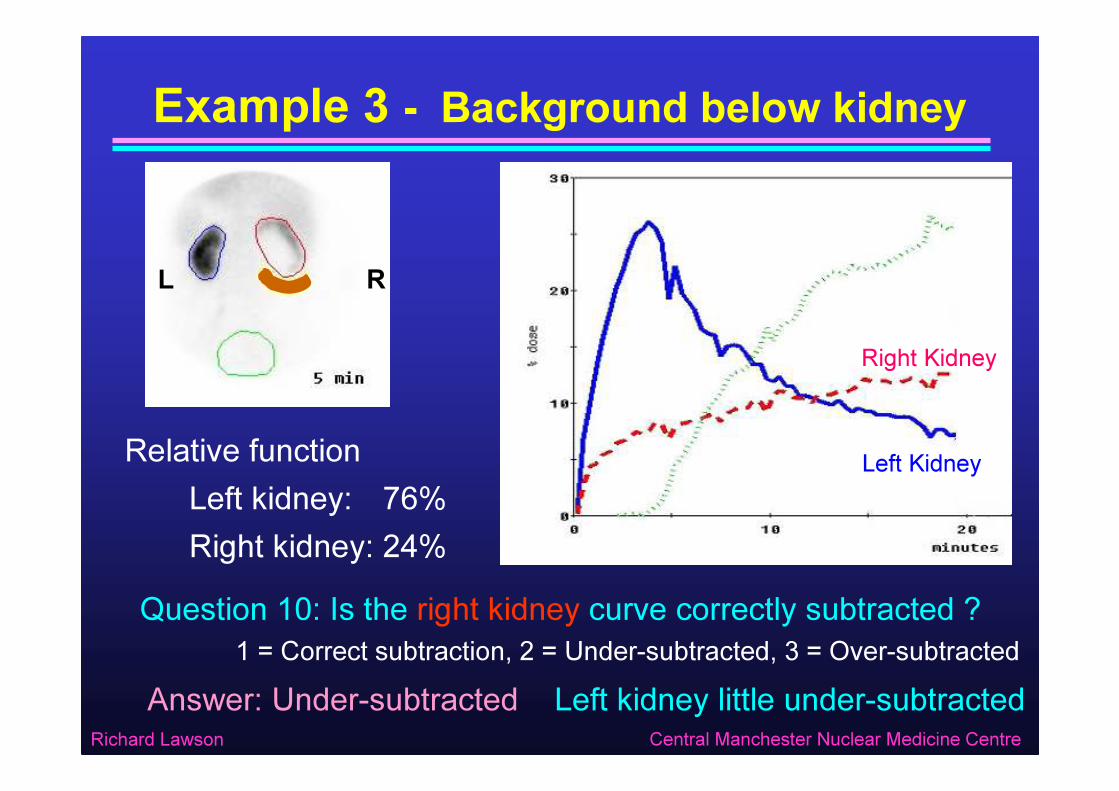
Example 3 - Background below kidney
Relative functionLeft kidney: 76%Right kidney: 24%
Answer: Under-subtracted
L R
Left Kidney
Right Kidney
Question 10: Is the right kidney curve correctly subtracted ?1 = Correct subtraction, 2 = Under-subtracted, 3 = Over-subtracted
Left kidney little under-subtracted

Richard Lawson Central Manchester Nuclear Medicine Centre
Example 3 – Peri-renal background
Relative functionLeft kidney: 85%Right kidney: 15%
Answer: Over-subtracted
L R
Left Kidney
Right Kidney
Question 11: Is the right kidney curve correctly subtracted ?1 = Correct subtraction, 2 = Under-subtracted, 3 = Over-subtracted
But left kidney is OK

Richard Lawson Central Manchester Nuclear Medicine Centre
Example 3 – Rutland method
Relative functionLeft kidney: 81%Right kidney: 19%
Answer: Correct subtraction
L R
Left Kidney
Right Kidney
Question 12: Is the right kidney curve correctly subtracted ?1 = Correct subtraction, 2 = Under-subtracted, 3 = Over-subtracted
For both kidneys
Richard Lawson Central Manchester Nuclear Medicine Centre
Teaching Point
• If the vascularity of each kidney is differentThen it is difficult to find a single background region that works for both kidneys
• The Rutland method overcomes this by automatically adjusting the amount of vascular background to suit each kidney
The Rutland Method
Richard Lawson Central Manchester Nuclear Medicine Centre
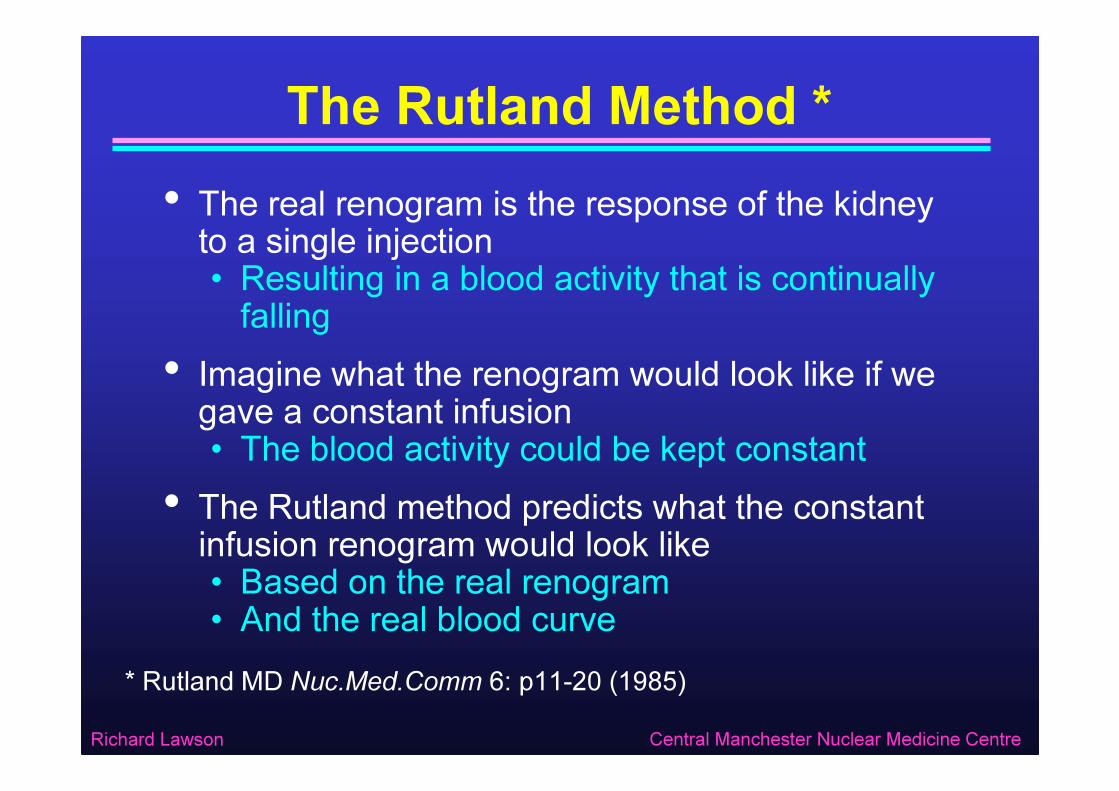
The Rutland Method *• The real renogram is the response of the kidney to a single injection• Resulting in a blood activity that is continually falling
• Imagine what the renogram would look like if we gave a constant infusion• The blood activity could be kept constant
• The Rutland method predicts what the constant infusion renogram would look like• Based on the real renogram• And the real blood curve
* Rutland MD Nuc.Med.Comm 6: p11-20 (1985)

Richard Lawson Central Manchester Nuclear Medicine Centre
Constant Infusion Model
Time
Conc
entra
tion
Kidney
Bladder
ExtravascularTissue
Blood
Conc
entra
tion
Conc
entra
tion
Conc
entra
tion
Time
Time
Richard Lawson Central Manchester Nuclear Medicine Centre
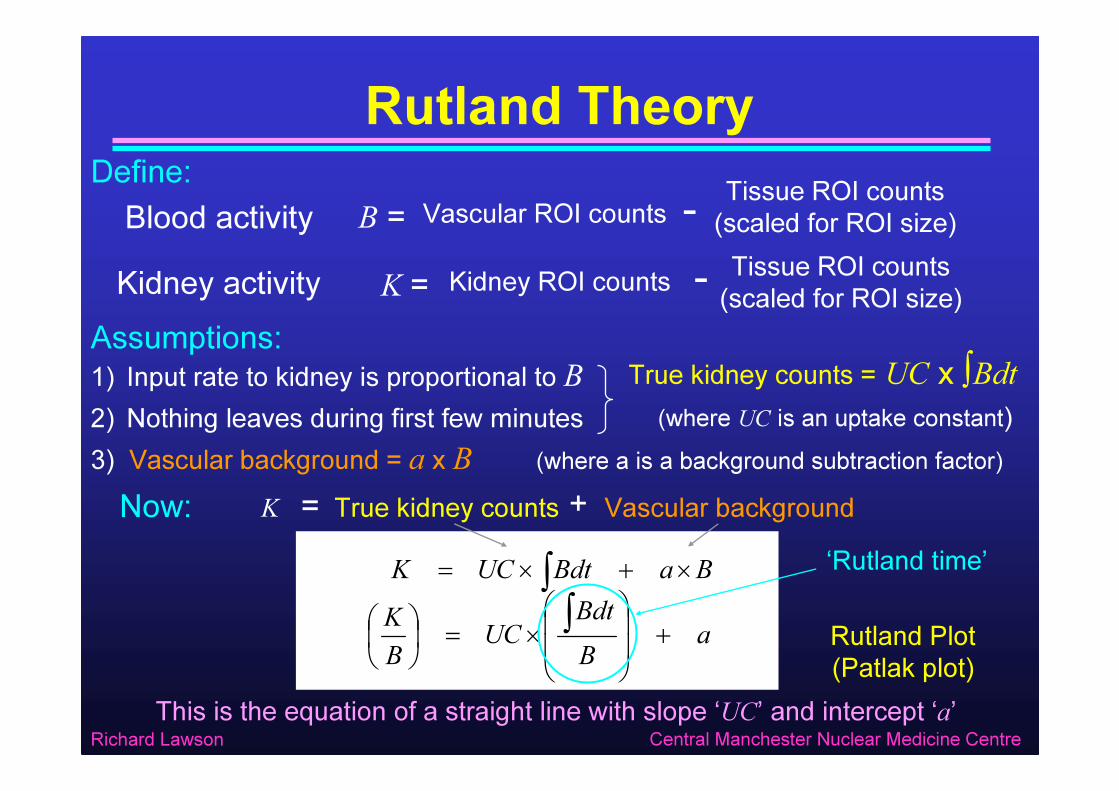
Rutland Theory
Assumptions:
Define:
K = True kidney counts Vascular background+∫ ×+×= BaBdtUCK
aBBdt
UCBK +
×=
∫
Now:
This is the equation of a straight line with slope ‘UC’ and intercept ‘a’
1) Input rate to kidney is proportional to B2) Nothing leaves during first few minutes3) Vascular background = a x B (where a is a background subtraction factor)
‘Rutland time’
True kidney counts = UC x ∫Bdt(where UC is an uptake constant)
B = Vascular ROI counts Tissue ROI counts(scaled for ROI size)-Blood activity
K = Kidney ROI counts Tissue ROI counts(scaled for ROI size)-Kidney activity
Rutland Plot (Patlak plot)
Richard Lawson Central Manchester Nuclear Medicine Centre
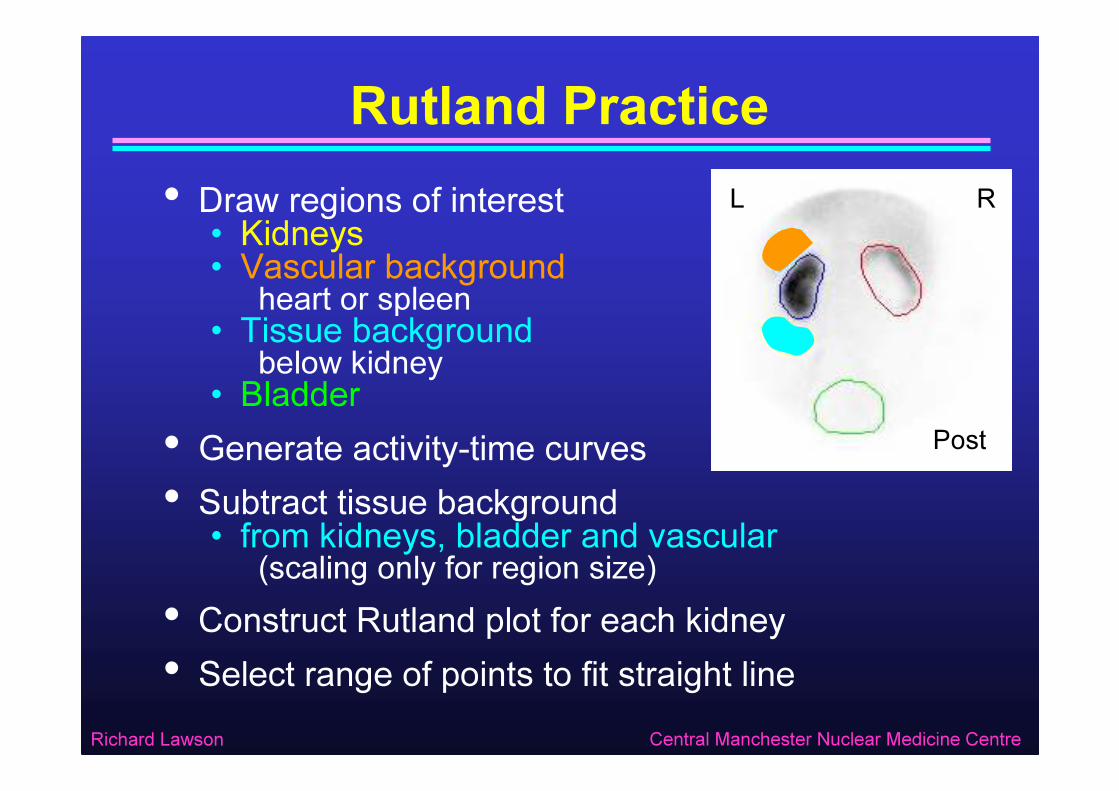
Rutland Practice• Draw regions of interest• Kidneys• Vascular background
heart or spleen• Tissue backgroundbelow kidney• Bladder
• Generate activity-time curves• Subtract tissue background• from kidneys, bladder and vascular
(scaling only for region size) • Construct Rutland plot for each kidney• Select range of points to fit straight line
L R
Post

Richard Lawson Central Manchester Nuclear Medicine Centre
Choosing the fit range
*** * *
*
Early points may be below the line (incomplete mixing)
Late points will be below the line (kidney is emptying)
Fit should include just points in
straight section
Typical Rutland Plot
Richard Lawson Central Manchester Nuclear Medicine Centre
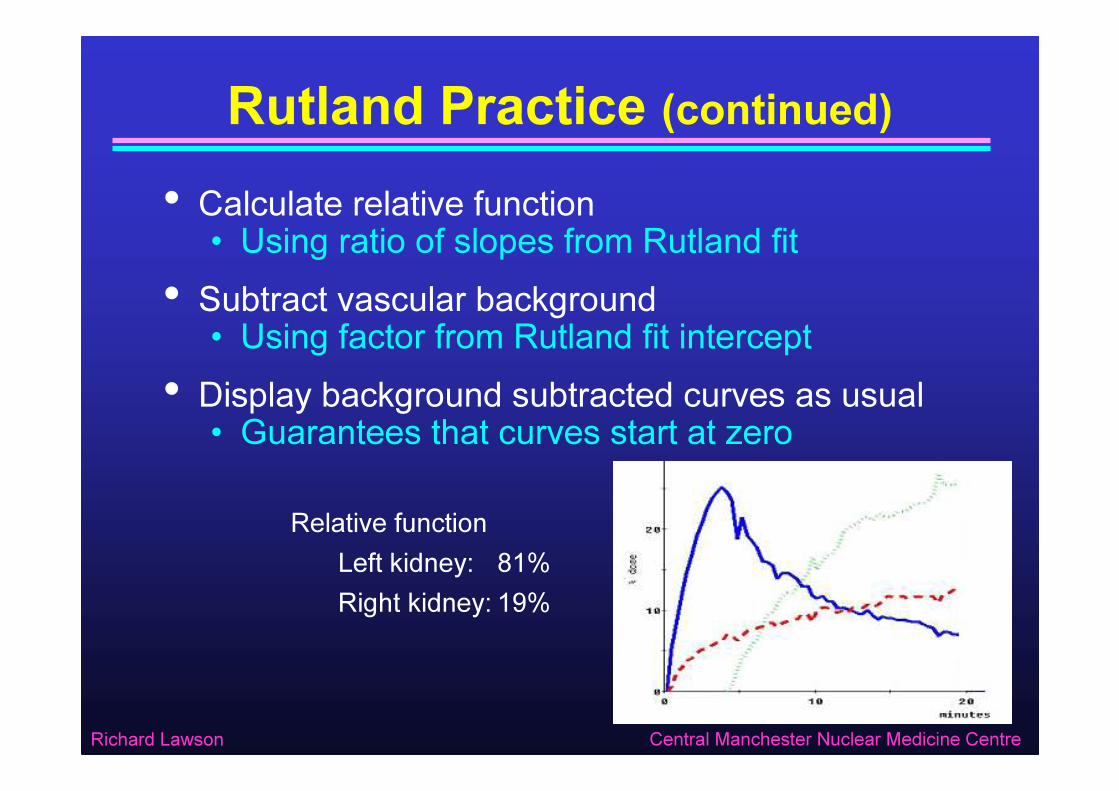
Rutland Practice (continued)• Calculate relative function• Using ratio of slopes from Rutland fit
• Subtract vascular background• Using factor from Rutland fit intercept
• Display background subtracted curves as usual• Guarantees that curves start at zero
Relative functionLeft kidney: 81%Right kidney: 19%
Richard Lawson Central Manchester Nuclear Medicine Centre
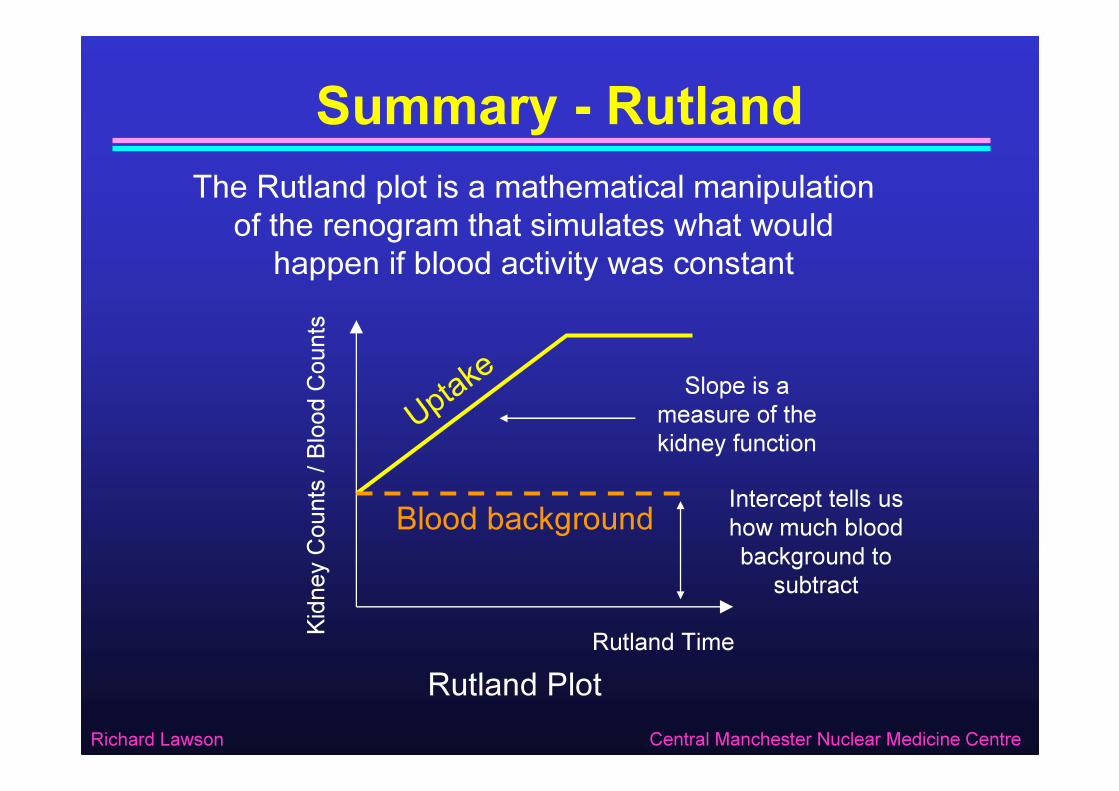
Summary - RutlandThe Rutland plot is a mathematical manipulation of the renogram that simulates what would happen if blood activity was constant
Rutland PlotRutland TimeKid
ney C
ounts
/ Bloo
d Cou
nts
U ptake
Blood background Intercept tells us how much blood background to
subtract
Slope is a measure of the kidney function

Deconvolution
Richard Lawson Central Manchester Nuclear Medicine Centre
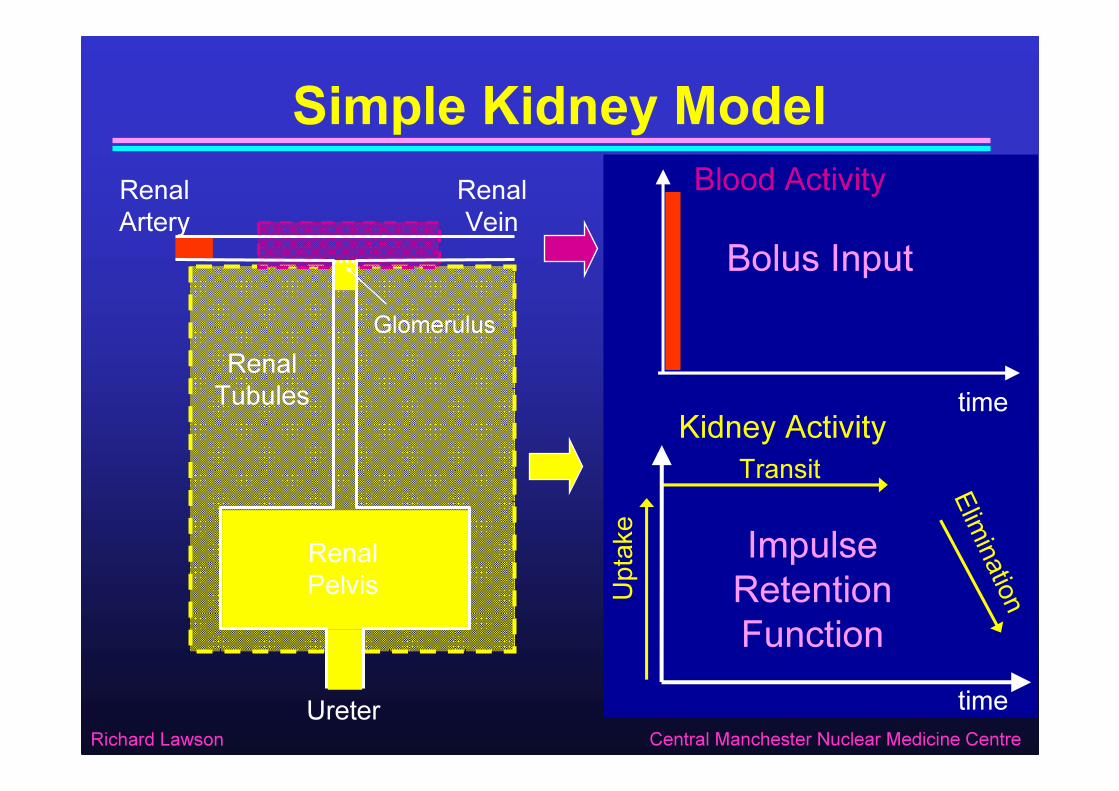
Simple Kidney Model
Bolus Input
Uptak
e
Transit Elimination
Impulse Retention Function
Blood Activity
time
time
Kidney Activity
Renal Artery
Renal Vein
Ureter
GlomerulusRenal
Tubules
Renal Pelvis
Richard Lawson Central Manchester Nuclear Medicine Centre
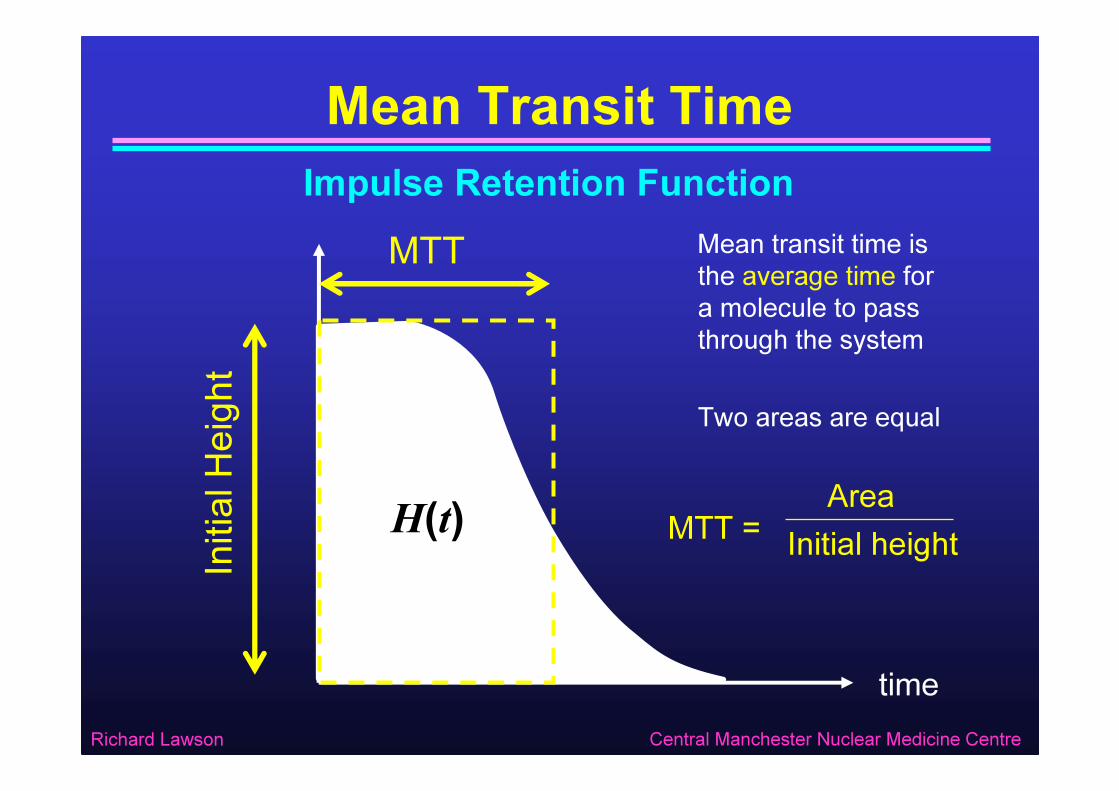
Mean Transit TimeImpulse Retention Function
MTTIni
tial H
eight
Mean transit time is the average time for a molecule to pass through the system
MTT =Area
Initial height
time
Two areas are equal
H(t)

Richard Lawson Central Manchester Nuclear Medicine Centre
‘Idealised’ Renogram• Perfect bolus Input• But not practicable• Perfect injection• Direct into renal artery• No recirculation
Blood Activity
time
Uptak
e
Transit Elimination
time
Kidney Activity• Impulse Response• But easy to interpret• Uptake, transit and elimination are separated
Richard Lawson Central Manchester Nuclear Medicine Centre
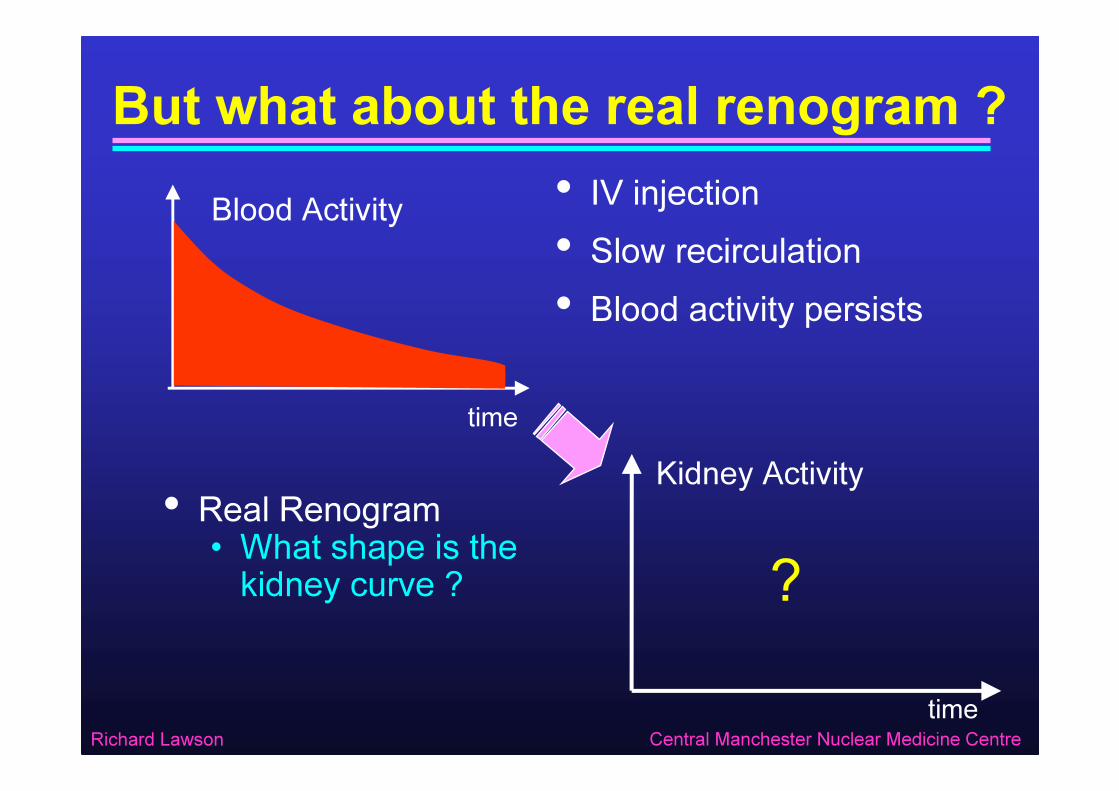
But what about the real renogram ?• IV injection• Slow recirculation• Blood activity persists
Blood Activity
time
time
Kidney Activity• Real Renogram• What shape is the kidney curve ? ?
Richard Lawson Central Manchester Nuclear Medicine Centre
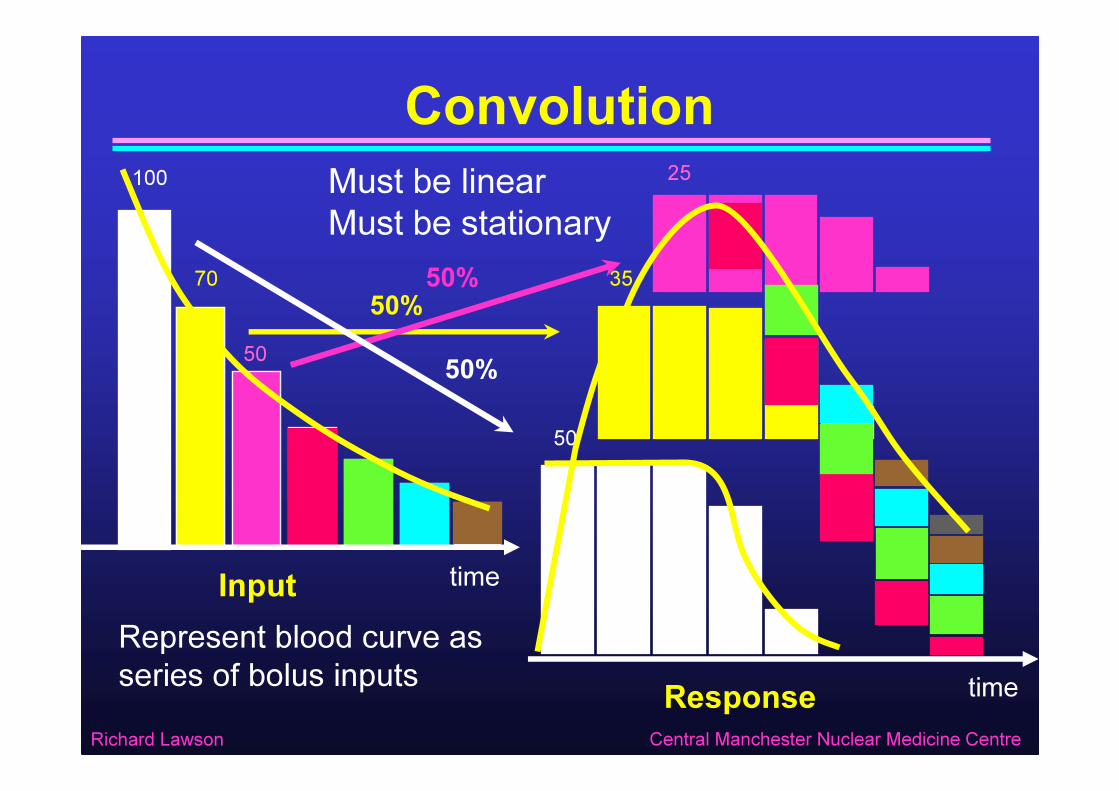
100
50
Must be linearMust be stationary
70 3550%
Convolution
Input time
Response time
50%
50
25
Represent blood curve as series of bolus inputs
50%
Richard Lawson Central Manchester Nuclear Medicine Centre
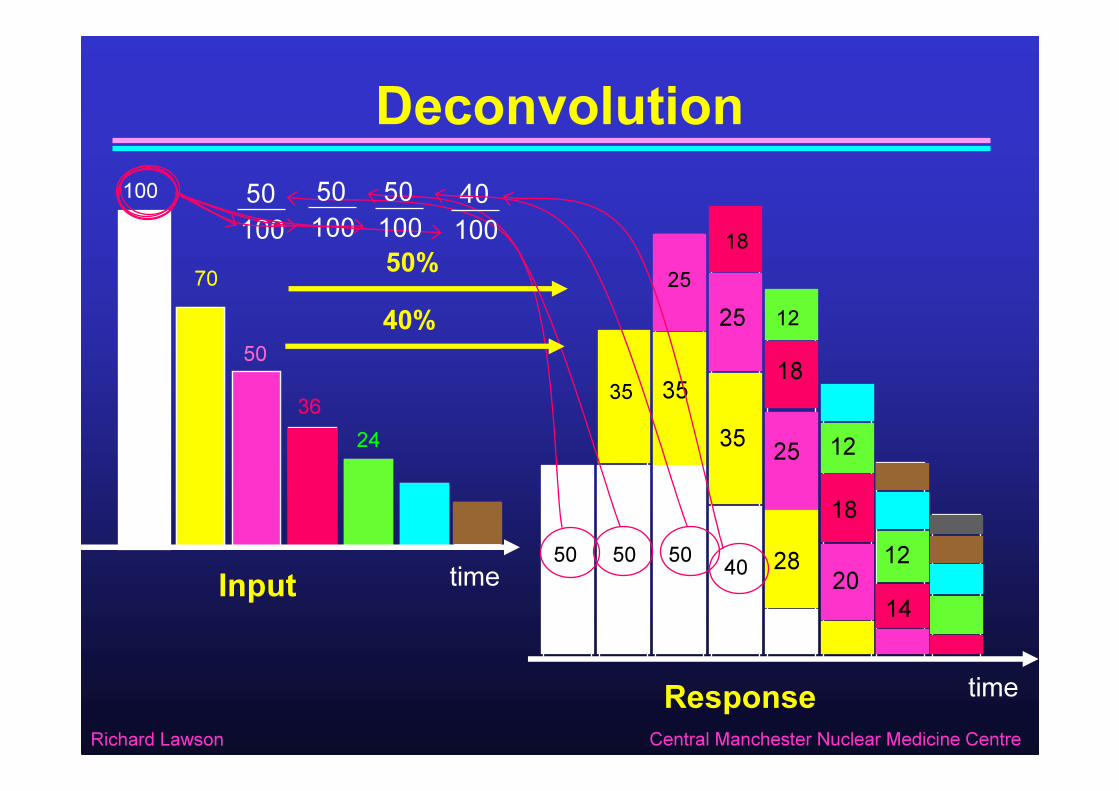
Deconvolution
Input time
Response time
50100
50
50%
100
70
50
3624
35
2518
12
50
50100
35
2518
12
50
35 25
181240
40%
28 2014
40100
50100
Richard Lawson Central Manchester Nuclear Medicine Centre
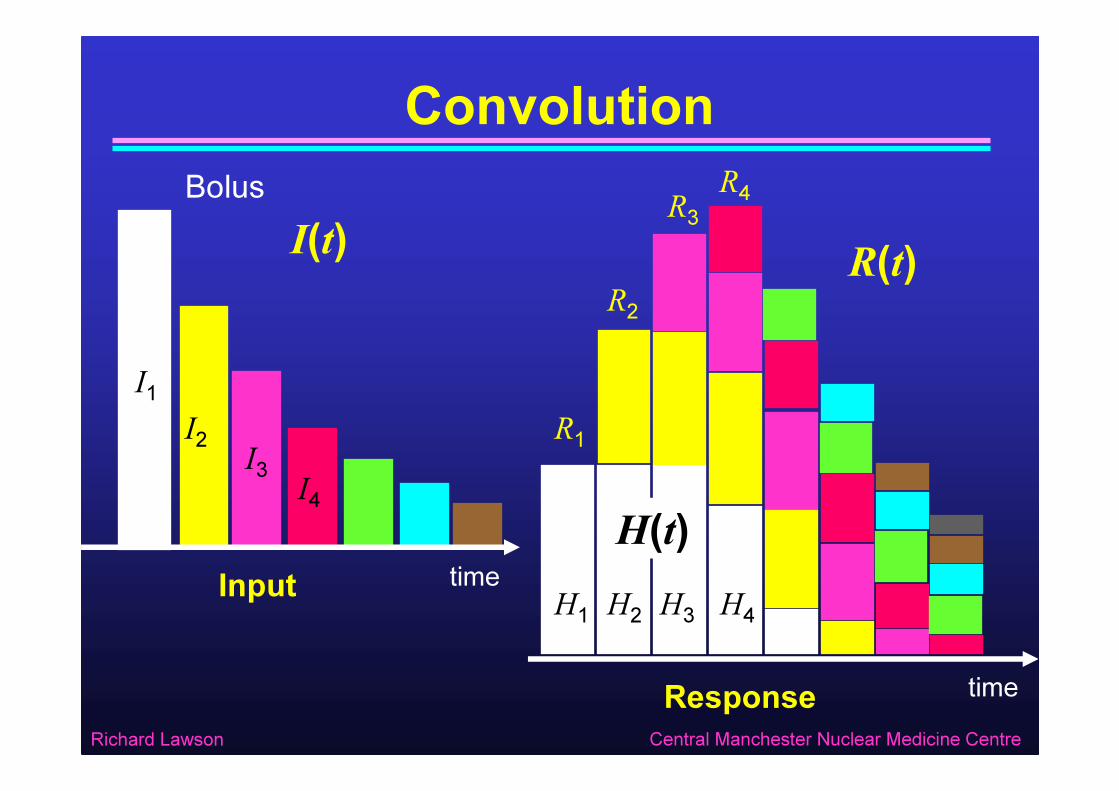
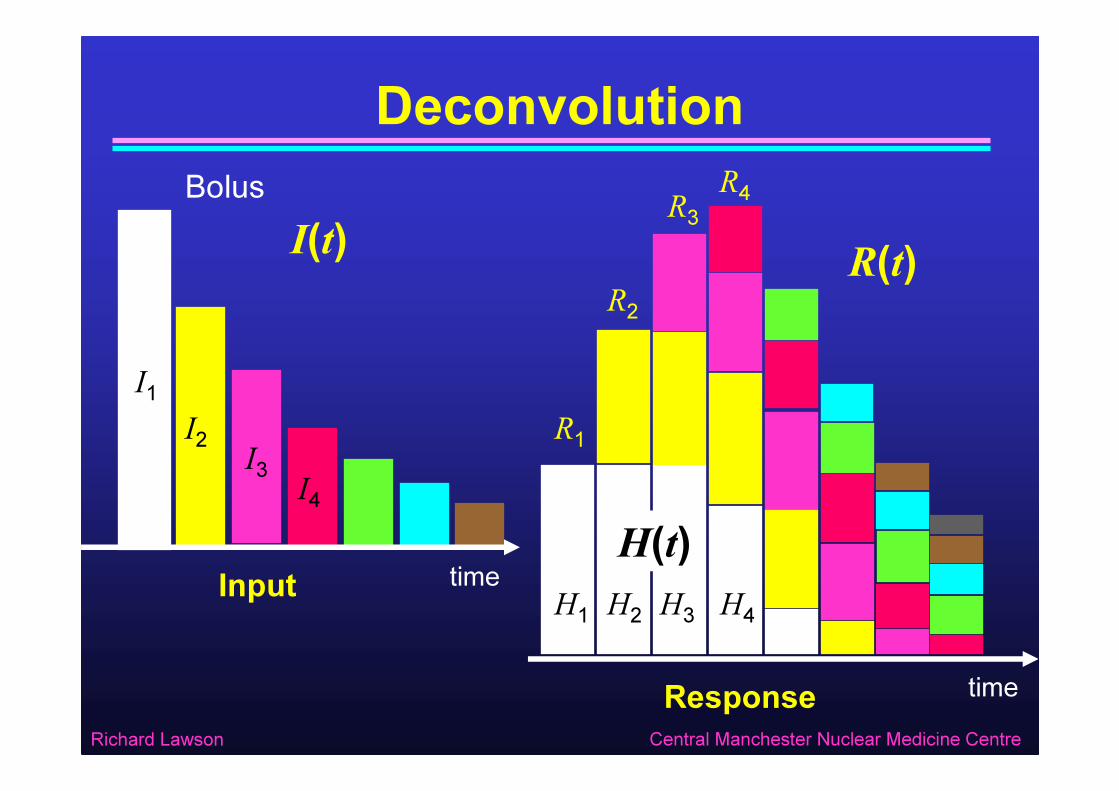
Convolution
Input time
Response time
I(t) R(t)
H(t)
Bolus
I1I2 I3 I4
R1
R2
R3R4
H1 H2 H4H3
Richard Lawson Central Manchester Nuclear Medicine Centre
Deconvolution
Input time
Response time
I(t) R(t)
H(t)
Bolus
I1I2 I3 I4
R1
R2
R3R4
H1 H2 H4H3

Richard Lawson Central Manchester Nuclear Medicine Centre
Teaching Point• Given the input to a system I(t) and the response to that input R(t), you can use deconvolution to calculate the expected response to an ideal impulse input• This is the impulse retention function , H(t)• The impulse retention function is easy to interpret because• The initial height represents uptake• The duration represents transit• The downslope represents elimination
Richard Lawson Central Manchester Nuclear Medicine Centre
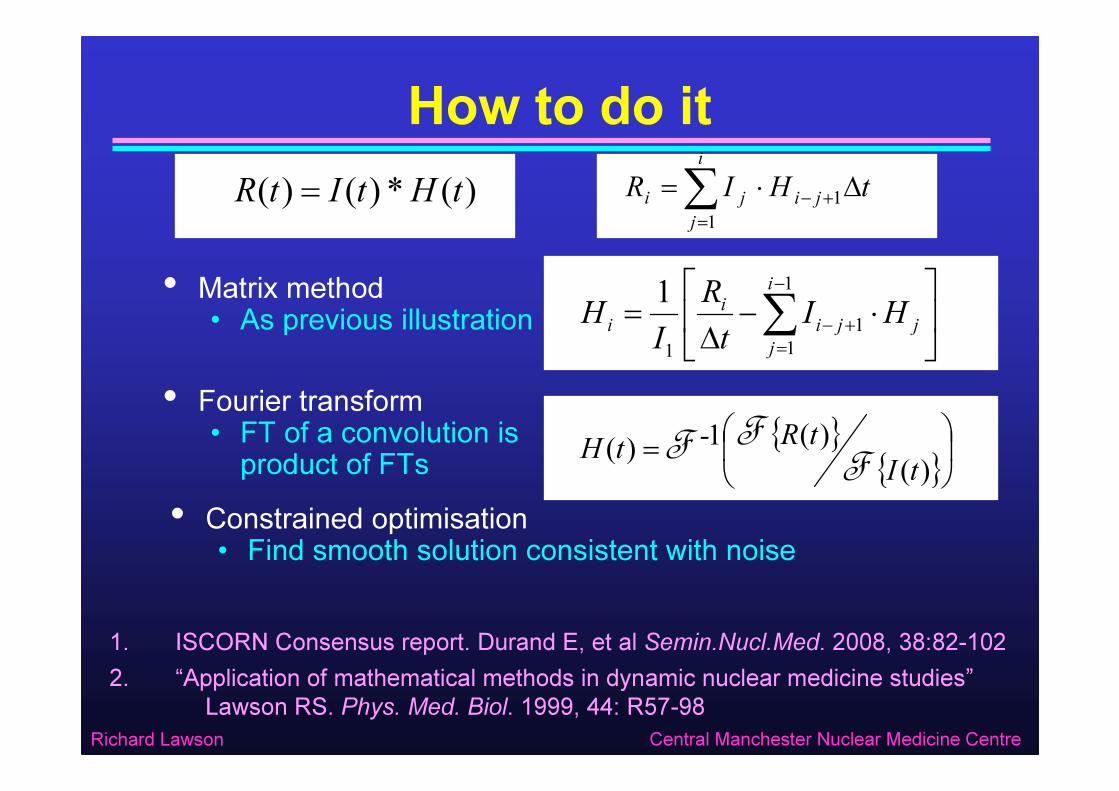
How to do it
• Matrix method• As previous illustration
⋅−∆= ∑−
=+−
1
11
1
1 i
jjji
ii HI
tR
IH
1. ISCORN Consensus report. Durand E, et al Semin.Nucl.Med. 2008, 38:82-1022. “Application of mathematical methods in dynamic nuclear medicine studies”
Lawson RS. Phys. Med. Biol. 1999, 44: R57-98
{ } { }
= )()(1)(
tItR-tH F
FF• Constrained optimisation
• Find smooth solution consistent with noise
• Fourier transform• FT of a convolution is
product of FTs
∑=
+− ∆⋅=i
jjiji tHIR
11)(*)()( tHtItR =

Richard Lawson Central Manchester Nuclear Medicine Centre
Renogram Deconvolution
Blood Activity Renogram
Bolus Input Impulse Response Function
Deconvolution
Richard Lawson Central Manchester Nuclear Medicine Centre
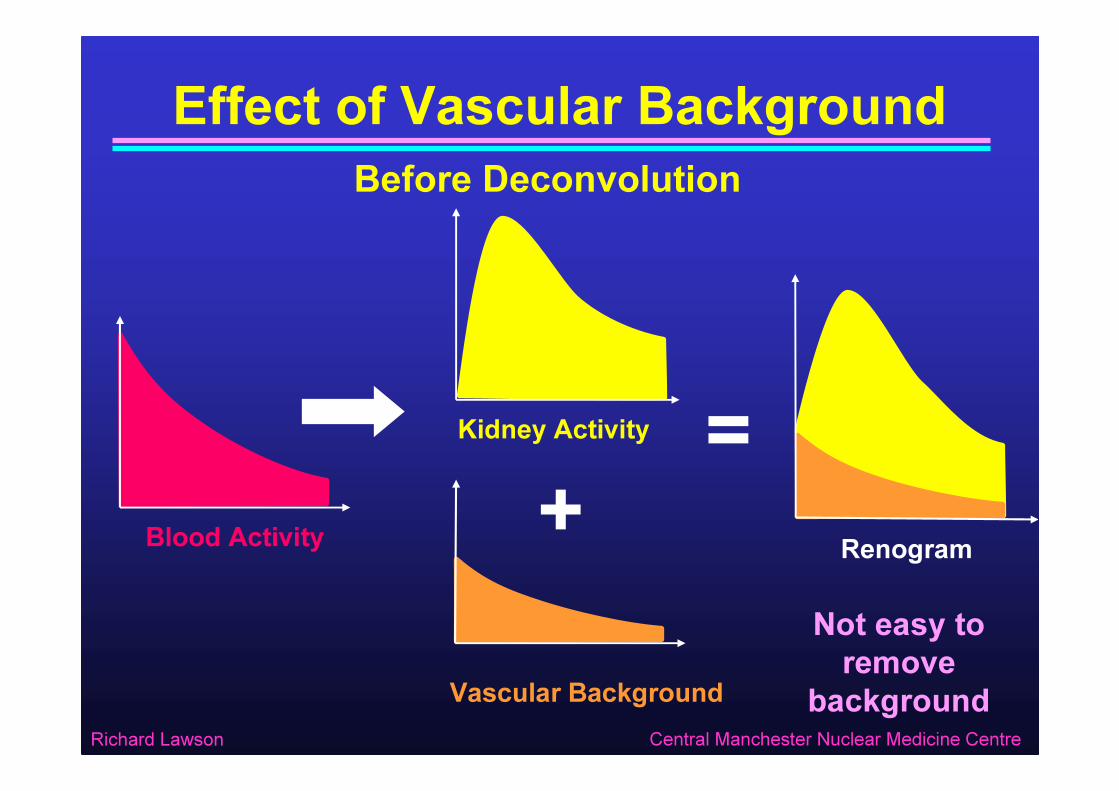
Effect of Vascular Background
Blood Activity
Vascular Background
Kidney Activity
+ Renogram
=
Not easy to remove
background
Before Deconvolution

Richard Lawson Central Manchester Nuclear Medicine Centre
Effect of Vascular Background
Blood Activity
Vascular Background
Kidney Activity
+ Renogram
=
Easy to remove
background
After Deconvolution
Richard Lawson Central Manchester Nuclear Medicine Centre
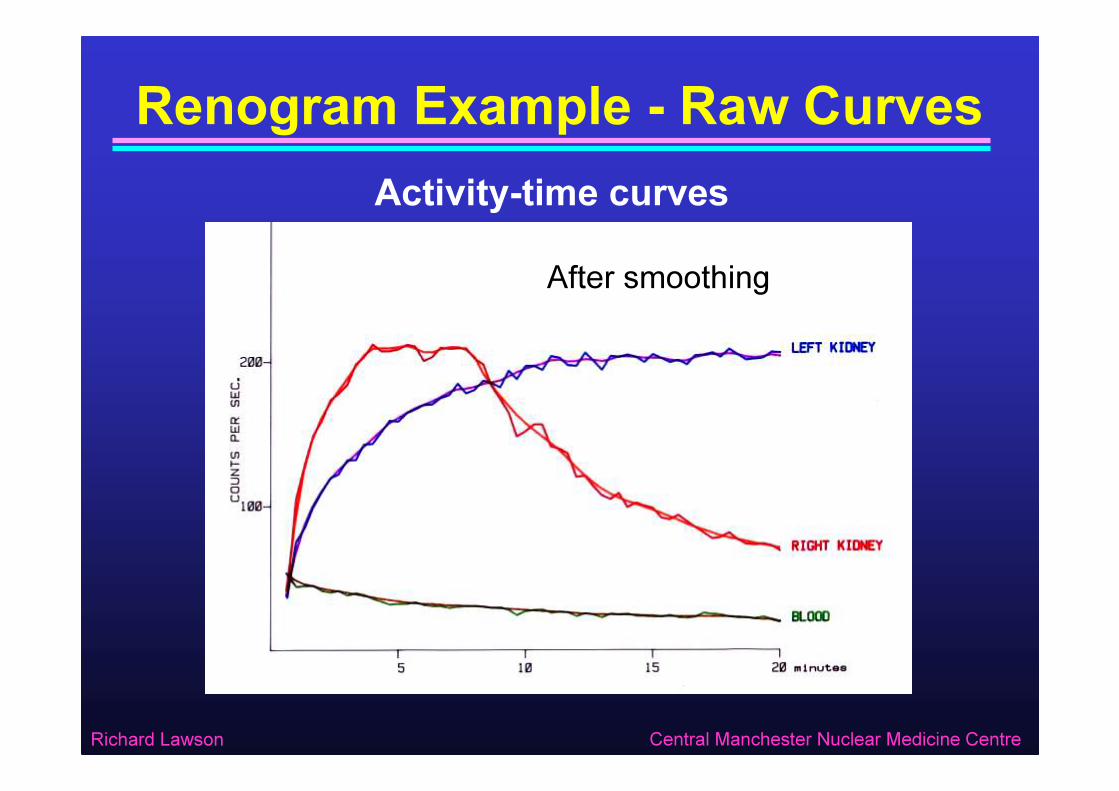
Renogram Example - Raw CurvesActivity-time curves
After smoothing
Richard Lawson Central Manchester Nuclear Medicine Centre
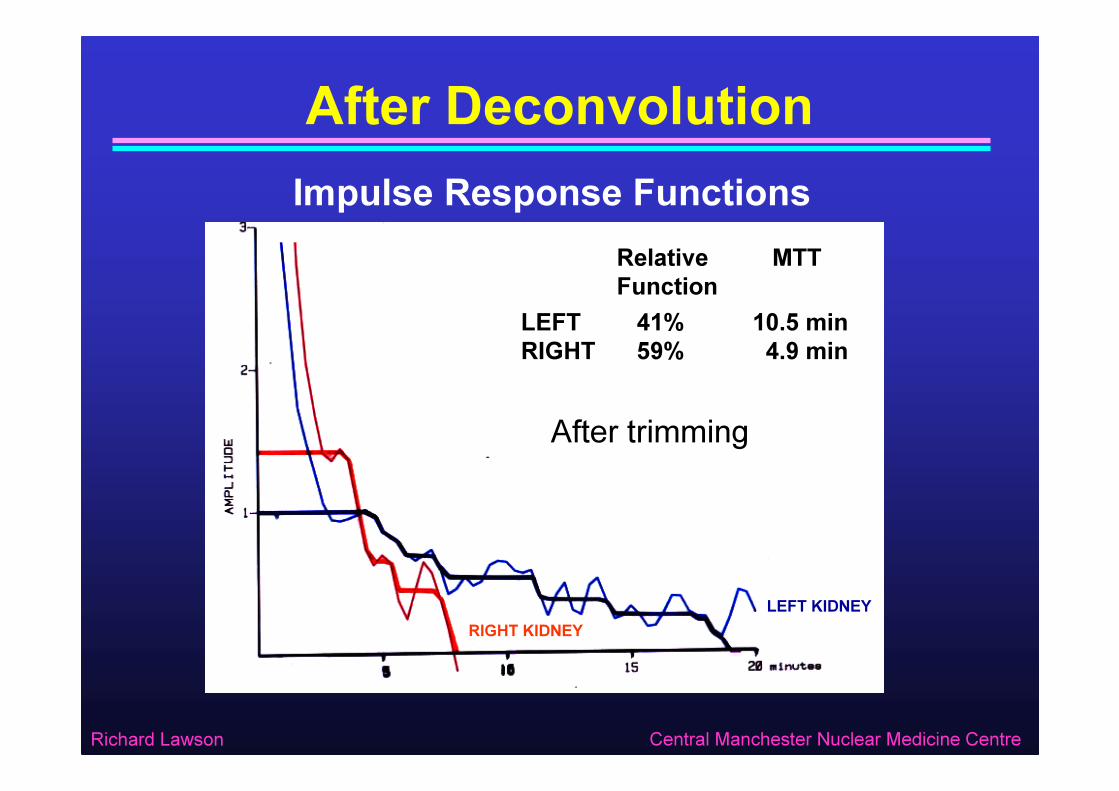
After DeconvolutionImpulse Response Functions
Relative MTTFunction
LEFT 41% 10.5 minRIGHT 59% 4.9 min
After trimming
LEFT KIDNEYRIGHT KIDNEY
Richard Lawson Central Manchester Nuclear Medicine Centre
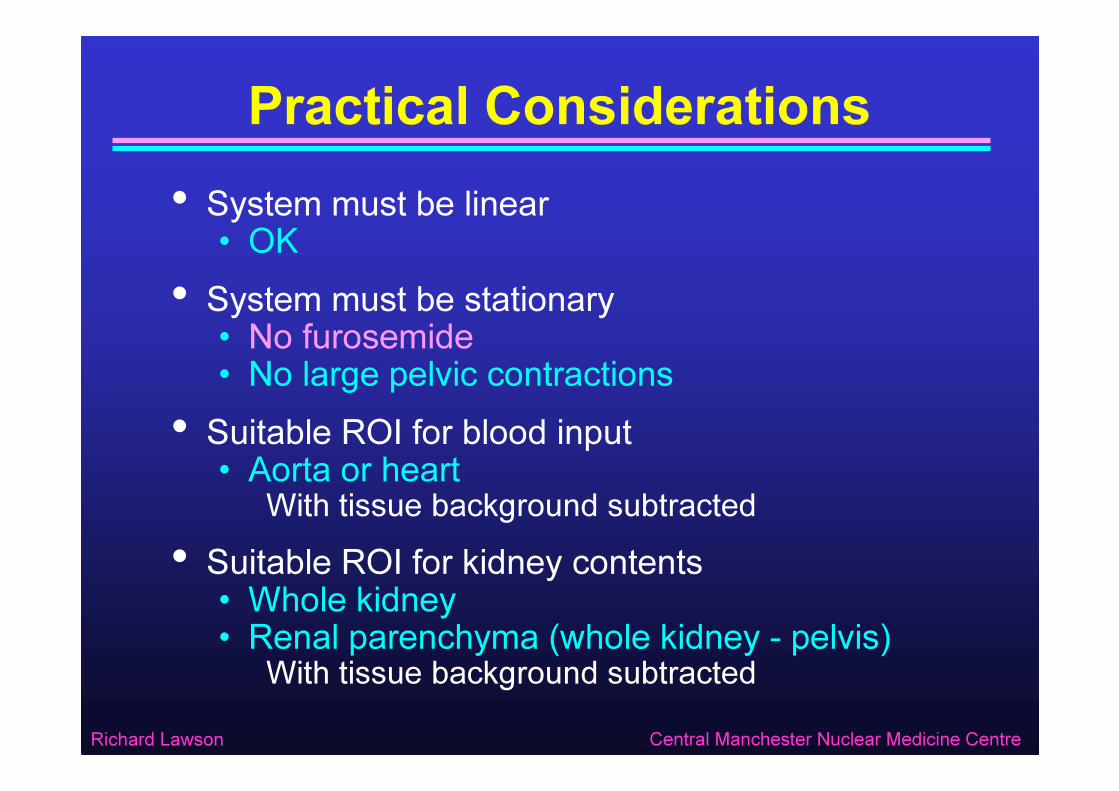
Practical Considerations• System must be linear
• OK• System must be stationary
• No furosemide• No large pelvic contractions
• Suitable ROI for blood input• Aorta or heart
With tissue background subtracted• Suitable ROI for kidney contents
• Whole kidney• Renal parenchyma (whole kidney - pelvis)
With tissue background subtracted
Richard Lawson Central Manchester Nuclear Medicine Centre
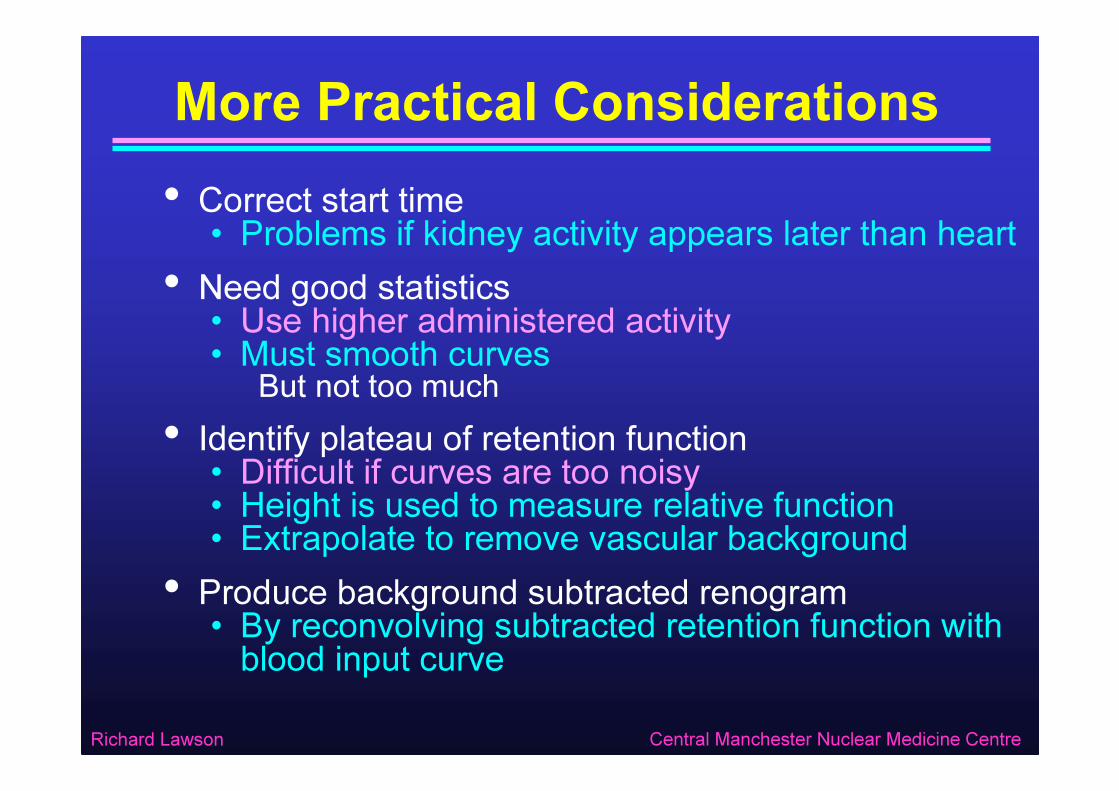
More Practical Considerations• Correct start time• Problems if kidney activity appears later than heart• Need good statistics• Use higher administered activity• Must smooth curves
But not too much• Identify plateau of retention function• Difficult if curves are too noisy• Height is used to measure relative function• Extrapolate to remove vascular background• Produce background subtracted renogram • By reconvolving subtracted retention function with blood input curve
Richard Lawson Central Manchester Nuclear Medicine Centre
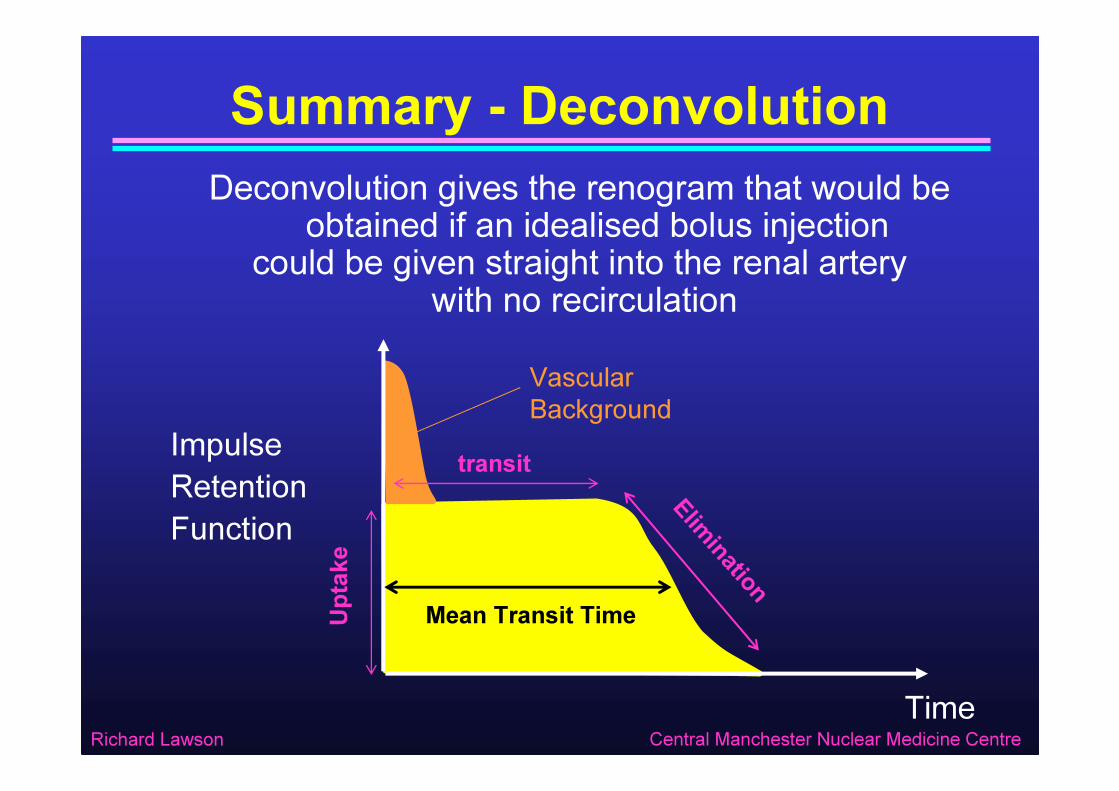
Summary - DeconvolutionDeconvolution gives the renogram that would be
obtained if an idealised bolus injectioncould be given straight into the renal artery
with no recirculation
Time
ImpulseRetentionFunction
transit
Uptak
e
Eliminat ion
Mean Transit Time
Vascular Background
Quantitative Parameters
Richard Lawson Central Manchester Nuclear Medicine Centre
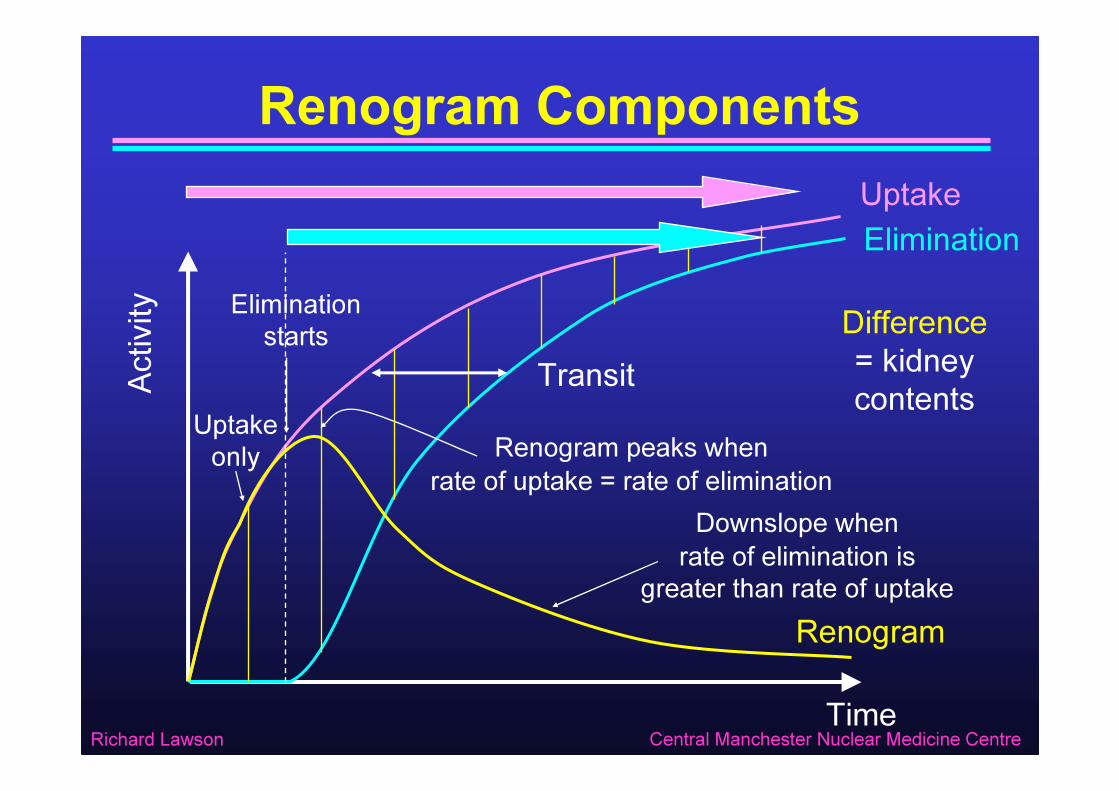
Renogram ComponentsUptakeElimination
Transit
Renogram
Time
Activ
ity Difference = kidney contents
Renogram peaks whenrate of uptake = rate of elimination
Uptake only
Elimination starts
Downslope whenrate of elimination is
greater than rate of uptake
Richard Lawson Central Manchester Nuclear Medicine Centre
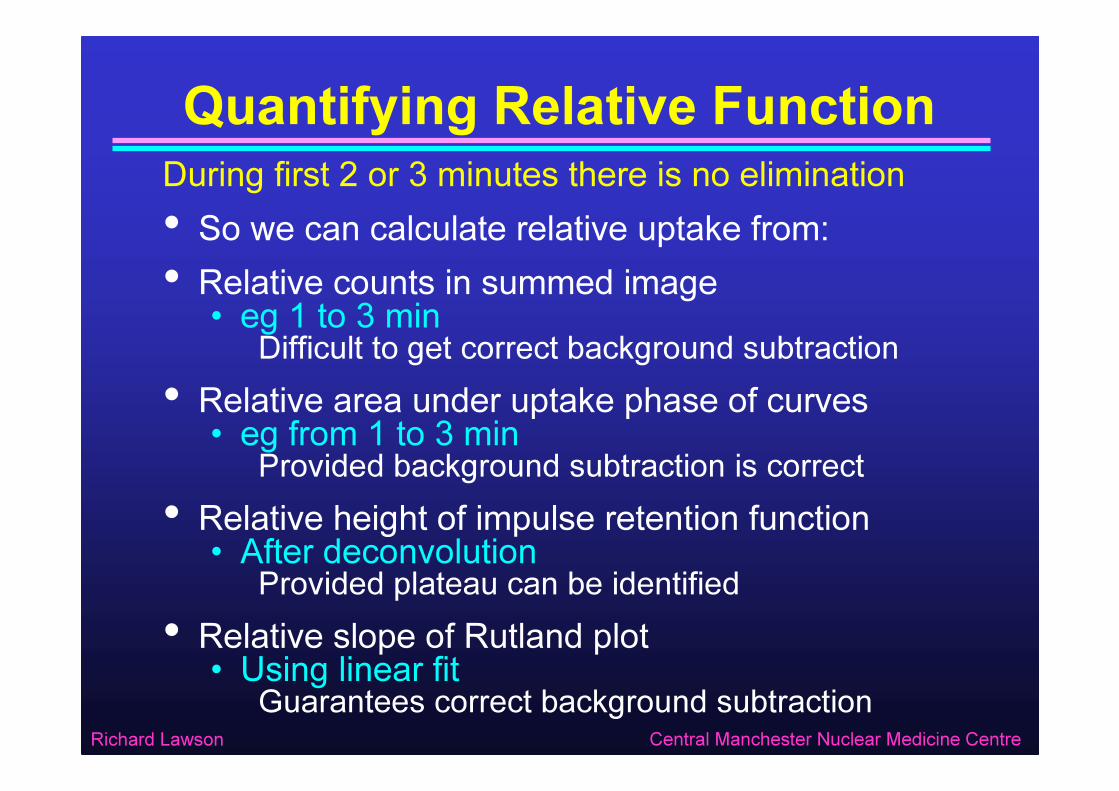
Quantifying Relative FunctionDuring first 2 or 3 minutes there is no elimination• So we can calculate relative uptake from:• Relative counts in summed image• eg 1 to 3 min
Difficult to get correct background subtraction• Relative area under uptake phase of curves• eg from 1 to 3 min
Provided background subtraction is correct• Relative height of impulse retention function• After deconvolution
Provided plateau can be identified• Relative slope of Rutland plot• Using linear fit
Guarantees correct background subtraction
Richard Lawson Central Manchester Nuclear Medicine Centre
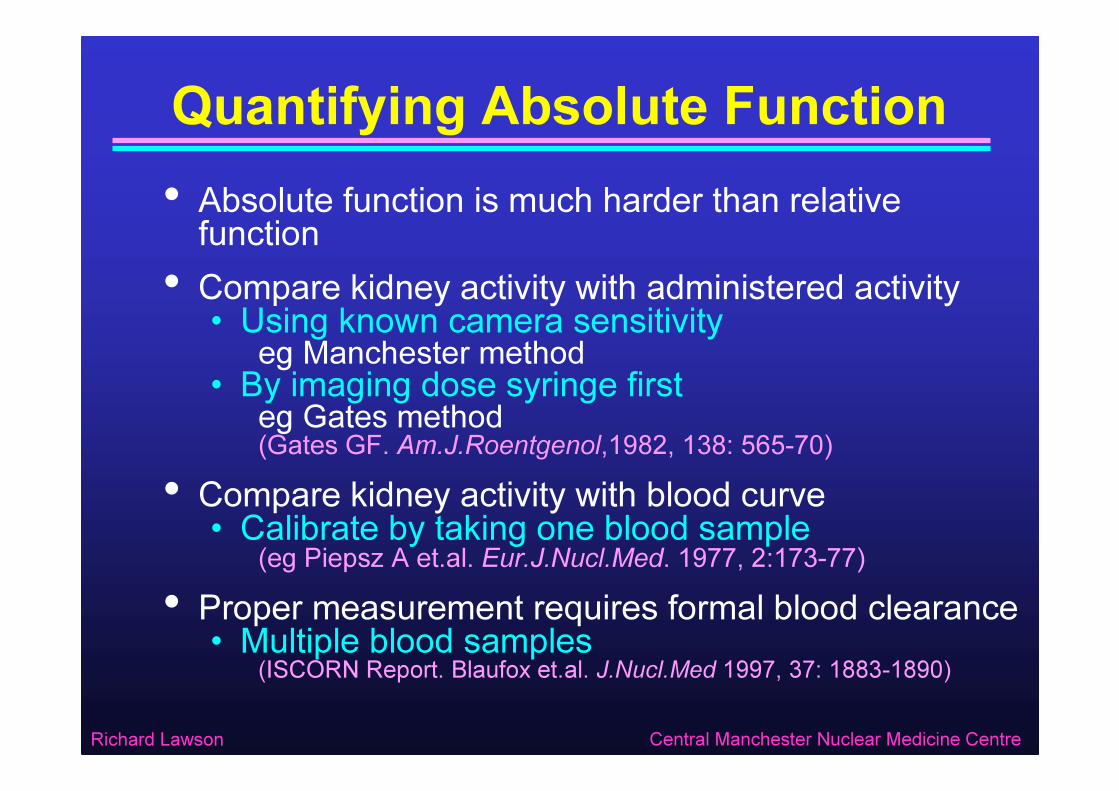
Quantifying Absolute Function• Absolute function is much harder than relative function• Compare kidney activity with administered activity• Using known camera sensitivity
eg Manchester method• By imaging dose syringe firsteg Gates method(Gates GF. Am.J.Roentgenol,1982, 138: 565-70)
• Compare kidney activity with blood curve• Calibrate by taking one blood sample(eg Piepsz A et.al. Eur.J.Nucl.Med. 1977, 2:173-77)
• Proper measurement requires formal blood clearance• Multiple blood samples(ISCORN Report. Blaufox et.al. J.Nucl.Med 1997, 37: 1883-1890)

Richard Lawson Central Manchester Nuclear Medicine Centre
Quantifying Elimination
Time
Activ
ityIntegrate blood input and fit to uptake phase (Rutland plot)
Difference between zero output and Renogram
= Urine output
RenogramBlood (input)
Uptak
e pha
se
Urine Output / Zero Output= Renal Output Efficiency *
* Chaiwatanarat et. al. J.Nucl.Med. 1993, 34: 845-848
Extrapolate to later times = Zero output curve
Richard Lawson Central Manchester Nuclear Medicine Centre
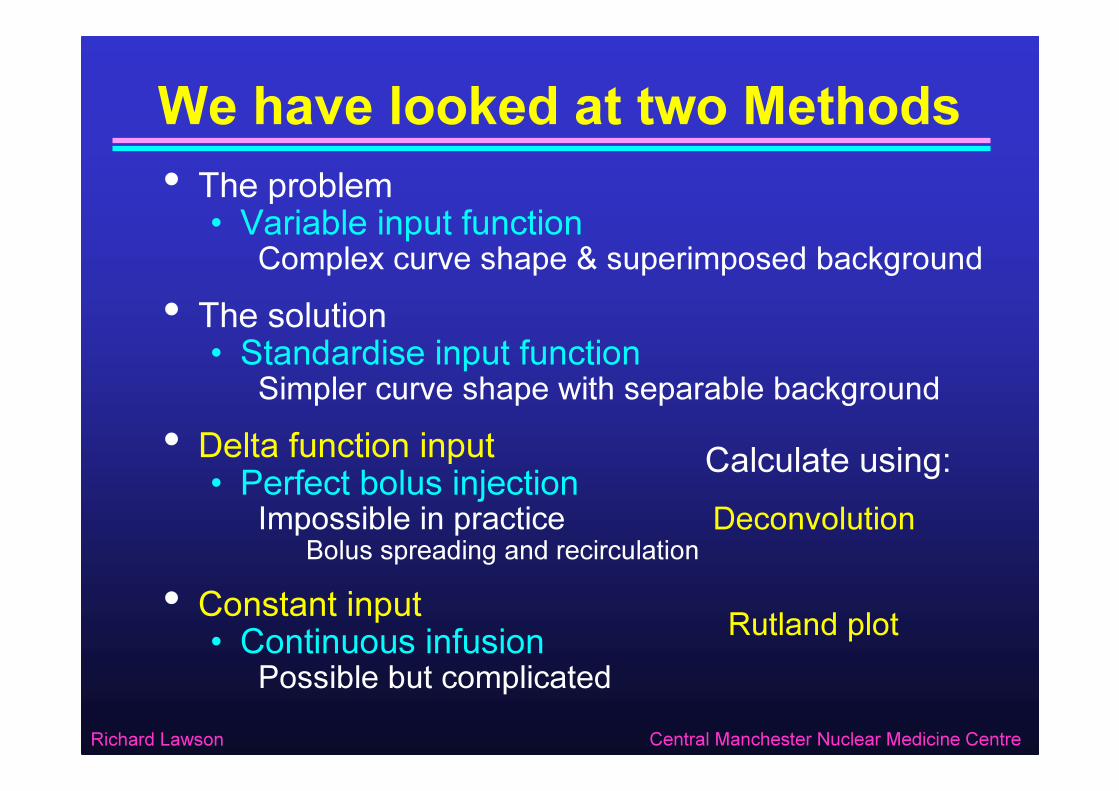
We have looked at two Methods• The problem
• Variable input functionComplex curve shape & superimposed background
• The solution• Standardise input function
Simpler curve shape with separable background• Delta function input
• Perfect bolus injectionImpossible in practice
Bolus spreading and recirculation• Constant input
• Continuous infusionPossible but complicated
Rutland plot
DeconvolutionCalculate using:
Richard Lawson Central Manchester Nuclear Medicine Centre
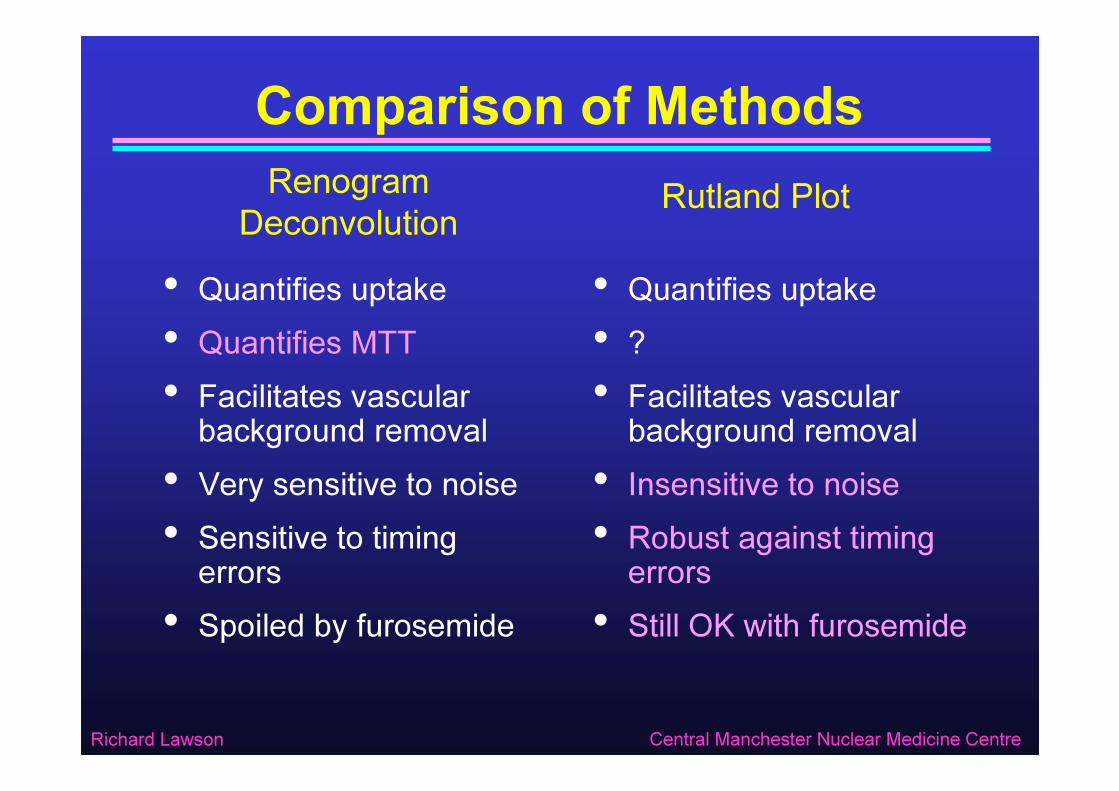
Comparison of Methods
• Quantifies uptake• Quantifies MTT• Facilitates vascular
background removal• Very sensitive to noise• Sensitive to timing
errors• Spoiled by furosemide
• Quantifies uptake• ?• Facilitates vascular
background removal• Insensitive to noise• Robust against timing
errors• Still OK with furosemide
Renogram Deconvolution Rutland Plot
Richard Lawson Central Manchester Nuclear Medicine Centre
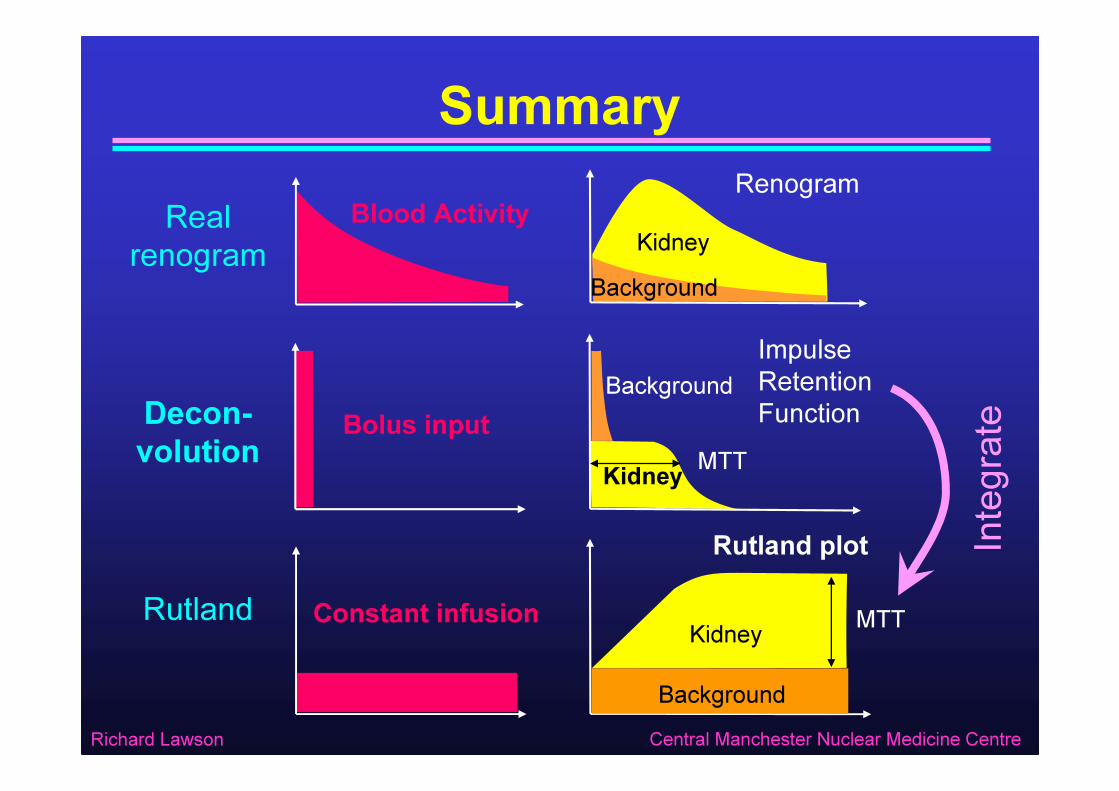
Summary
Integ
rate
Blood ActivityReal renogram
RenogramKidney
Background
Bolus inputDecon-volution
Impulse Retention Function
Kidney
Background
Constant infusionRutlandRutland plot
Kidney
Background
MTT
MTT
Richard Lawson Central Manchester Nuclear Medicine Centre
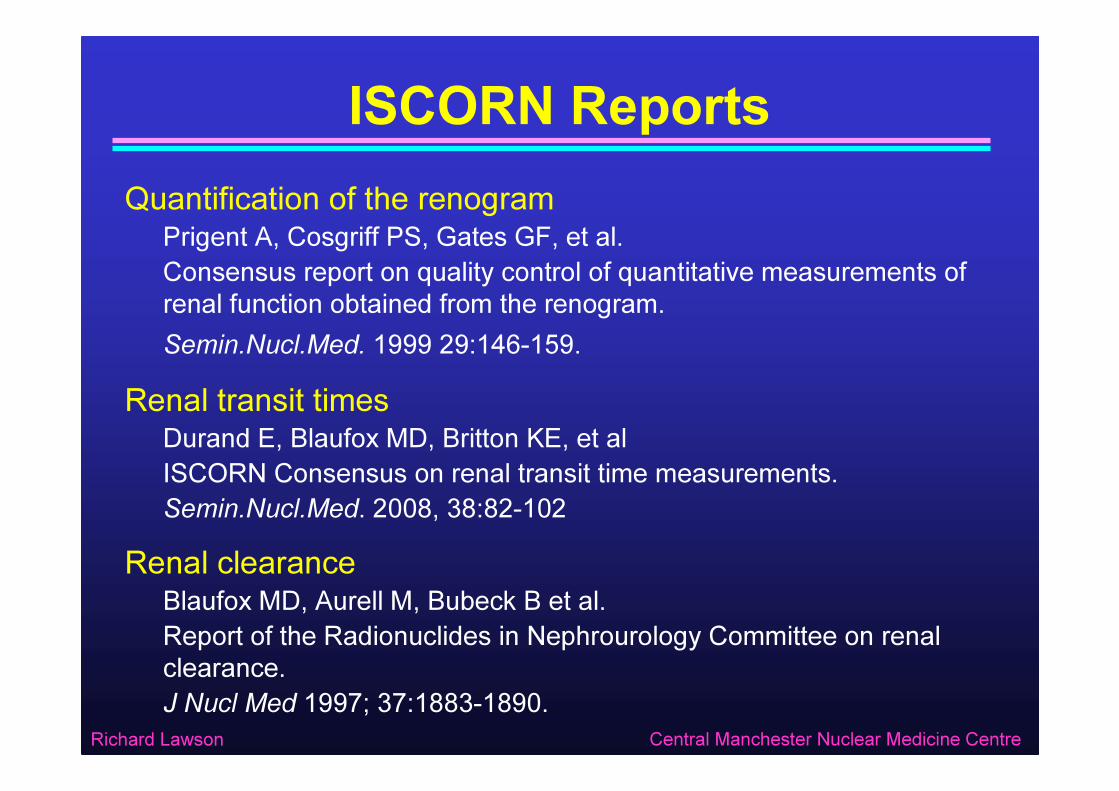
ISCORN ReportsQuantification of the renogram
Prigent A, Cosgriff PS, Gates GF, et al.Consensus report on quality control of quantitative measurements of renal function obtained from the renogram.Semin.Nucl.Med. 1999 29:146-159.
Renal transit timesDurand E, Blaufox MD, Britton KE, et alISCORN Consensus on renal transit time measurements.Semin.Nucl.Med. 2008, 38:82-102
Renal clearanceBlaufox MD, Aurell M, Bubeck B et al. Report of the Radionuclides in Nephrourology Committee on renal clearance. J Nucl Med 1997; 37:1883-1890.