Embed Size (px)
Citation preview
Nuclear Renography

Objectives we will learn
How a nuclear renogram is performed Three classes of radionuclides used in renography How to read nuclear renogram images
Plus We will learn about three congenital anomalies for which
nuclear renography is useful.
Introduction Ultrasound and cystography give us a lot of
information about the urinary tract Nuclear renography gives a very detailed
representation of the function and drainage of the kidneys.
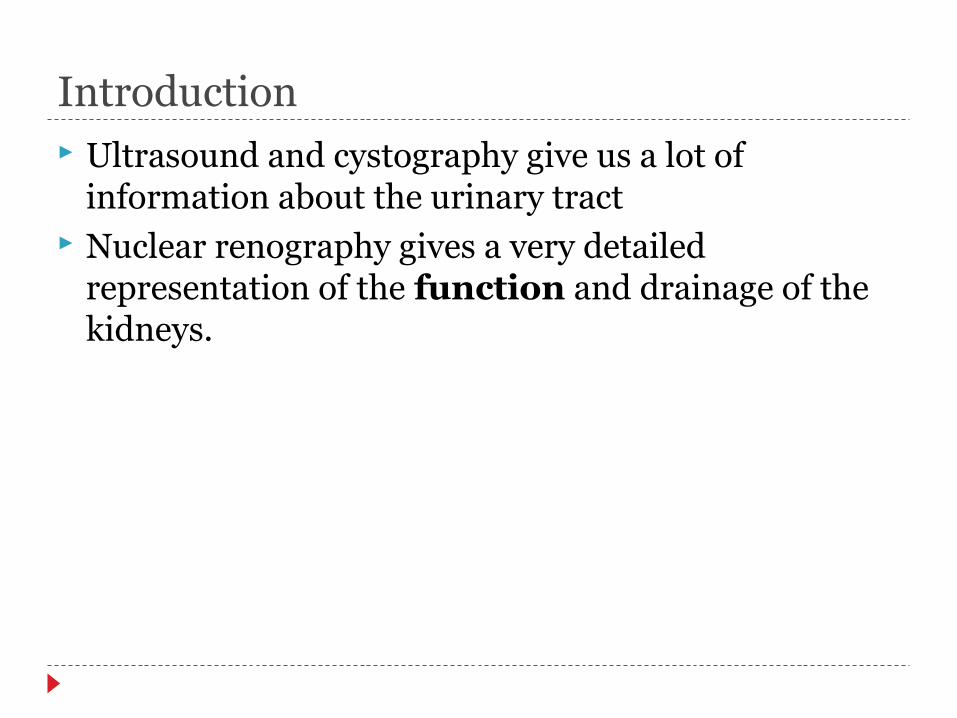
Nuclear renography is highly accurate at measuring kidney function, but the images are low resolution.
Technique Nuclear renography is performed by injecting a
radionuclide into the venous circulation. The uptake and passage of the radionuclide is detected by a nuclear medicine camera.

Synonyms The terms radionuclide, radioisotope, radio tracer or
nuclear imaging agent all refer to the radioactive material that is used to make the nuclear medicine images. These substances are molecules that contain radioactive atoms. When those atoms decay, they emit energy in the form of gamma rays or alpha or beta particles that are detected by the nuclear medicine camera.
Radionuclides Three basic classes of radionuclide are employed in
nuclear renography.
Filtered agents
Excreted agents
Cortical imaging agents
Filtered Radionuclides DTPA and MAG3 are filtered through the
glomerulus. This is useful in evaluating: Perfusion
Vascular supply Filtration
Measuring renal function (glomerular filtration rate)
Drainage Detects obstruction
Excreted Radionuclides MAG3 and Hipuran are excreted by the renal
tubules. These radionuclides are helpful in evaluating patients with: Diminished renal function
Kidney transplants
Cortical Imaging Radionuclides
DMSA and Glucoheptonate are accumulated in the cortex so they are helpful in evaluating: Renal scarring from chronic infection Infarction Renal mass Differential renal mass (proportion of total renal
mass contributed by each kidney)
Nuclear Renography – Conventions
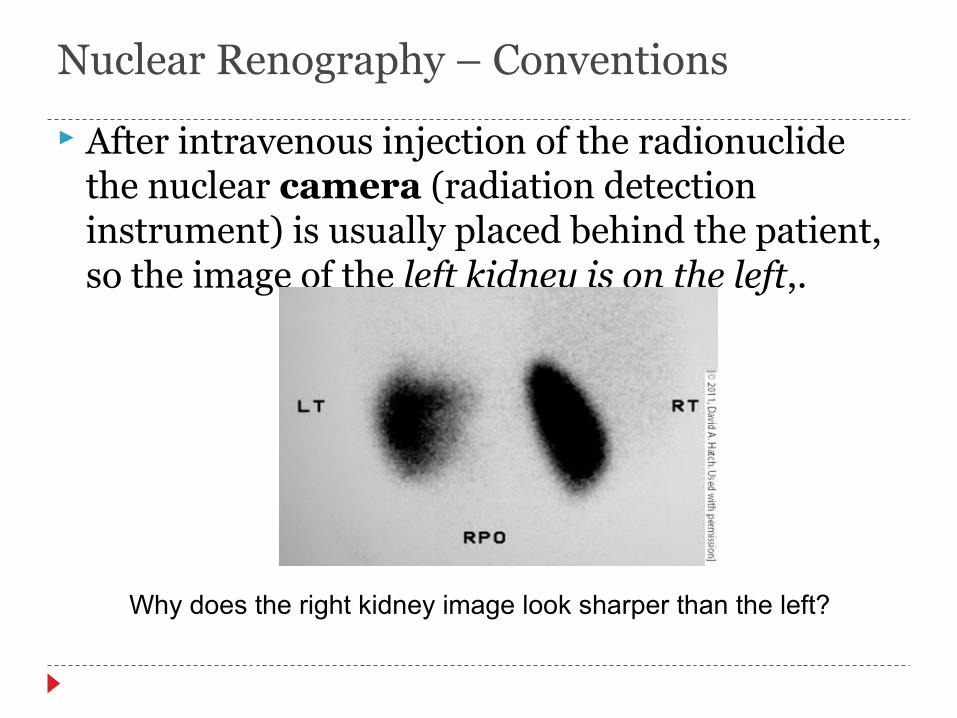
After intravenous injection of the radionuclide the nuclear camera (radiation detection instrument) is usually placed behind the patient, so the image of the left kidney is on the left,.
Why does the right kidney image look sharper than the left?
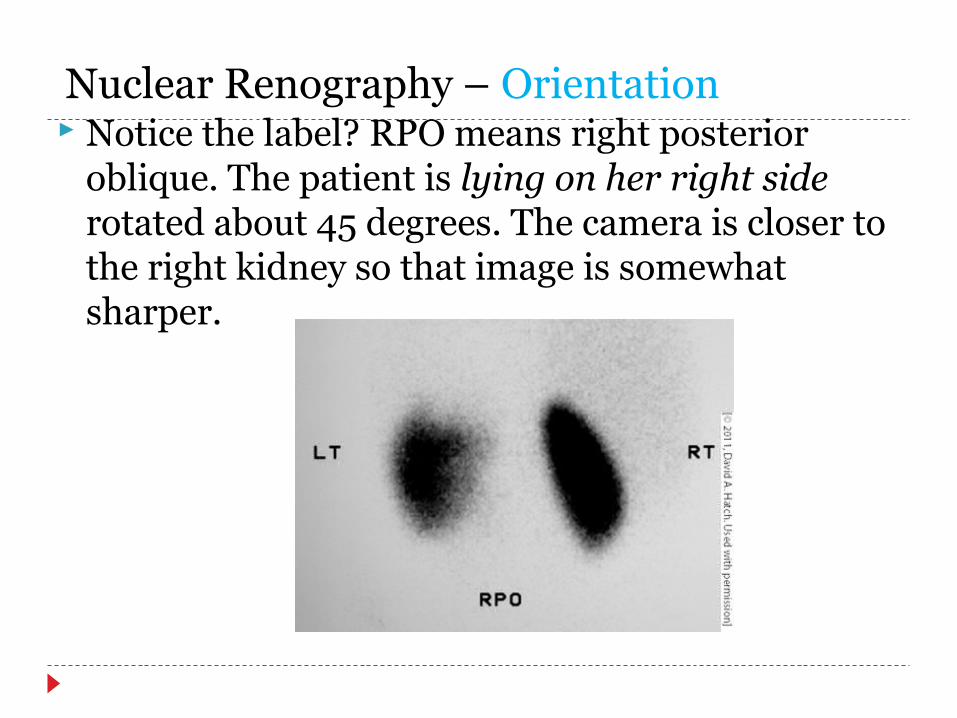
Nuclear Renography – Orientation Notice the label? RPO means right posterior
oblique. The patient is lying on her right side rotated about 45 degrees. The camera is closer to the right kidney so that image is somewhat sharper.

Case History
• A six year old girl with known vesicoureteric reflux has had febrile urine infections despite prophylactic antibiotics. Pyelonephritis can cause renal scarring. Previously, this patient had no renal scars. In order to determine if this girl has new renal scars, what radionuclide would you use?
• Filtered imaging agent• Excreted imaging agent• Cortical imaging agent•Cortical imaging agent
Cortical Imaging Scan
The radioisotope is injected intravenously. Images are obtained in various orientations
Posterior (because the kidneys are closer to the back) LPO (left posterior oblique) RPO (right posterior oblique)• We examine the images to detect defects. A scarred area
will have no uptake of the radionuclide and, therefore, no radioactivity detected by the camera. Such areas are described as photopenic.
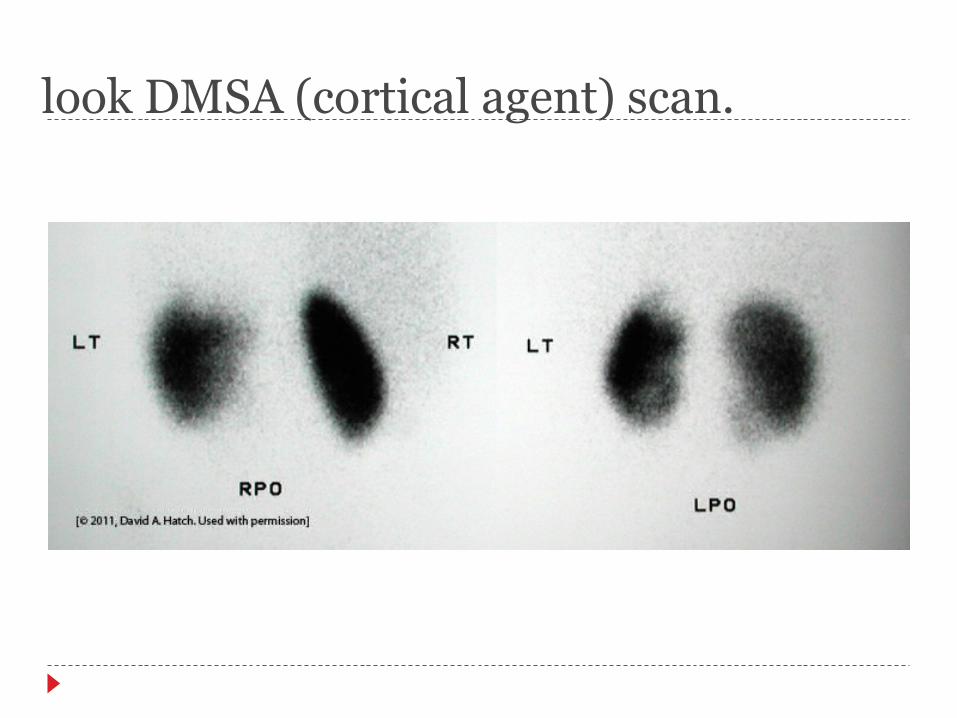
look DMSA (cortical agent) scan.
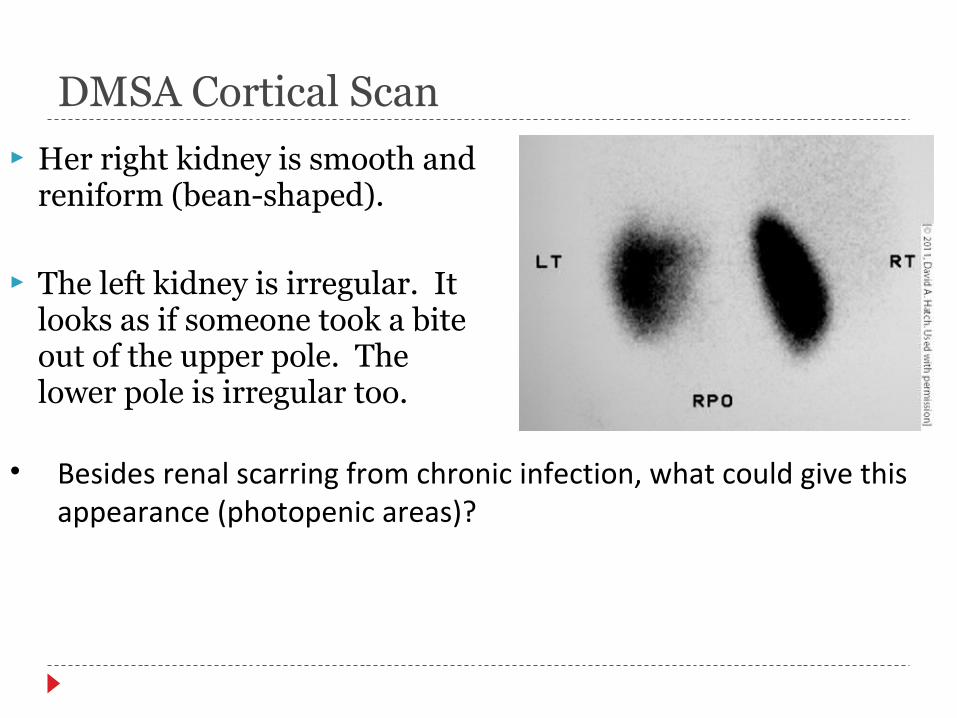
DMSA Cortical Scan Her right kidney is smooth and
reniform (bean-shaped).
The left kidney is irregular. It looks as if someone took a bite out of the upper pole. The lower pole is irregular too.
• Besides renal scarring from chronic infection, what could give this appearance (photopenic areas)?
Case Summary
• Renal scars show up as photopenic areas where one would expect to see cortical uptake.
• Scar formation represents a loss of renal parenchyma.
• This girl has suffered renal scarring from recurrent pyelonephritis.
• Infarction of a portion of a kidney would also show up on a cortical imaging scan as a photopenic area.
Case History A 4-year-old male is referred for evaluation of colicky
right flank pain. Ultrasound showed grade IV right hydronephrosis. Past history is otherwise negative.
Exam: healthy male. BP = 116/72 (high for a 4-year-old). Non-tender fullness in the right upper quadrant.
We suspect that he has an obstruction, but we need to confirm. What radionuclide class should we use to evaluate his kidney drainage?
Evaluation of Hydronephrosis A filtered agent is best for evaluating filtration and
drainage. The nuclear imaging study used to evaluate obstruction is called a lasix renogram.
A lasix renogram is dynamic study performed over time.

A filtered radionuclide is injected intravenously.
The radionuclide is followed continuously. After the radionuclide has circulated
thoroughly (usually after peak concentration and active drainage from the kidneys) lasix is given intravenously in order to maximize urine production. This helps to demonstrate obstruction.
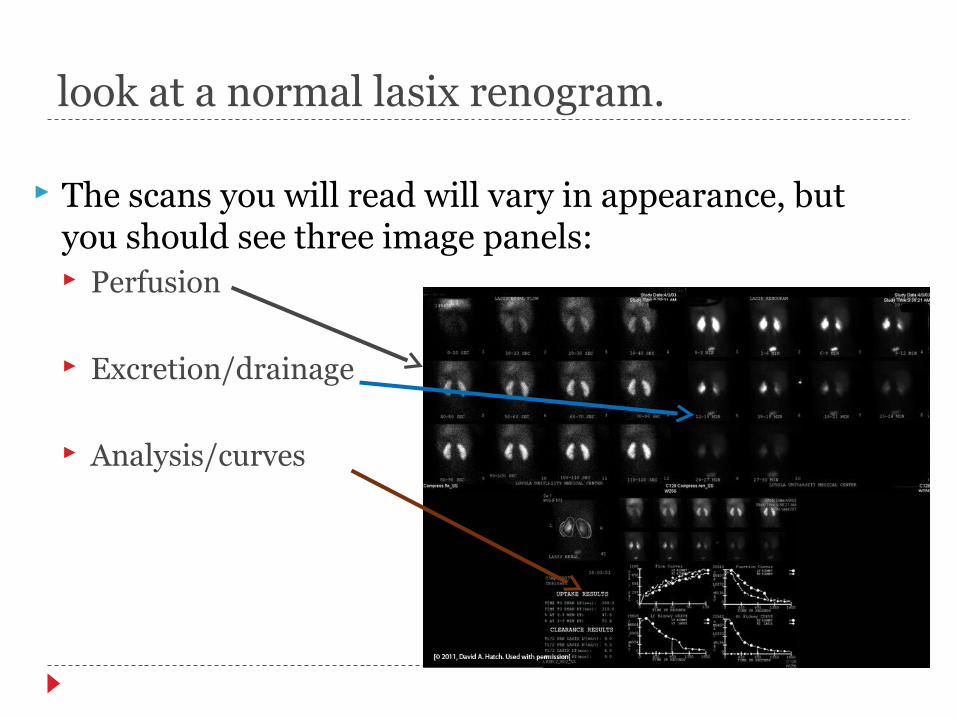
look at a normal lasix renogram.
The scans you will read will vary in appearance, but you should see three image panels: Perfusion
Excretion/drainage
Analysis/curves
Perfusion Panel
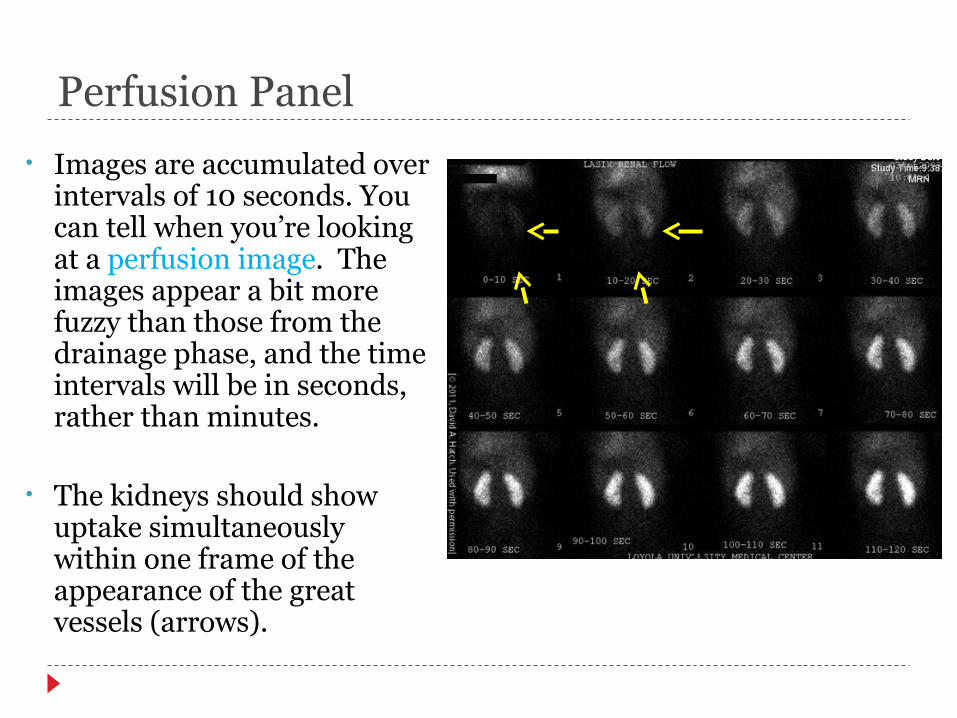
• Images are accumulated over intervals of 10 seconds. You can tell when you’re looking at a perfusion image. The images appear a bit more fuzzy than those from the drainage phase, and the time intervals will be in seconds, rather than minutes.
• The kidneys should show uptake simultaneously within one frame of the appearance of the great vessels (arrows).
Perfusion Panel
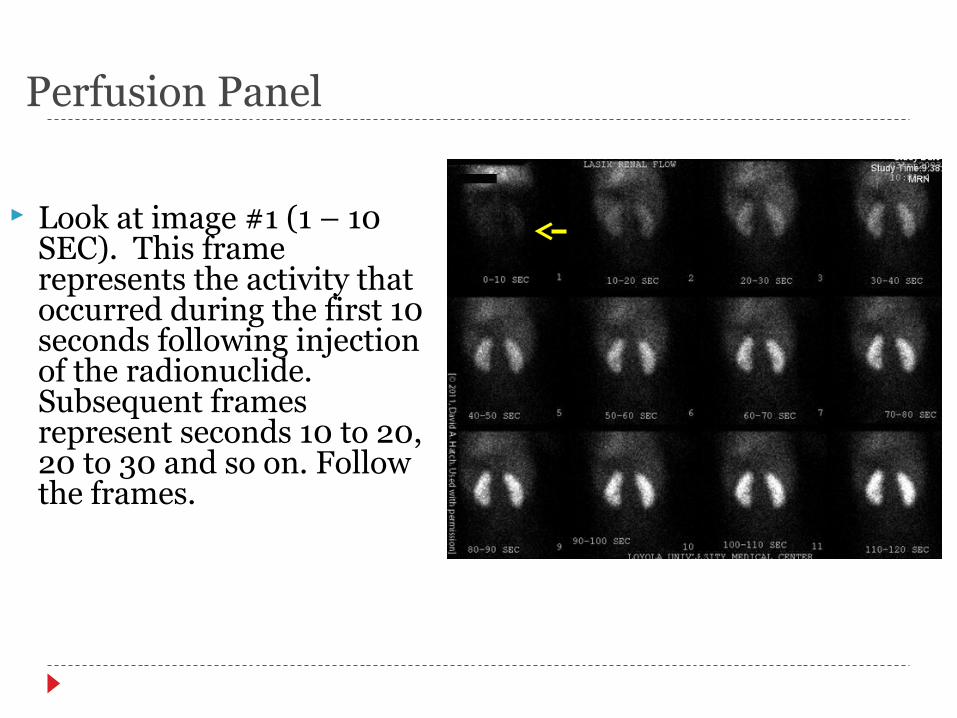
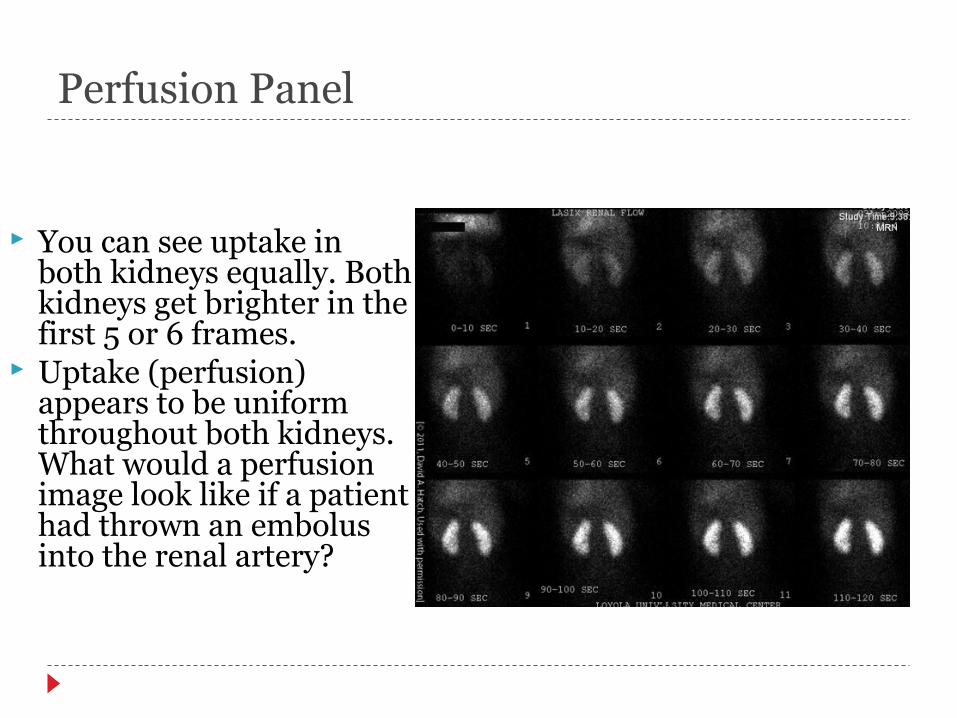
Look at image #1 (1 – 10 SEC). This frame represents the activity that occurred during the first 10 seconds following injection of the radionuclide. Subsequent frames represent seconds 10 to 20, 20 to 30 and so on. Follow the frames.
Perfusion Panel
You can see uptake in both kidneys equally. Both kidneys get brighter in the first 5 or 6 frames.
Uptake (perfusion) appears to be uniform throughout both kidneys. What would a perfusion image look like if a patient had thrown an embolus into the renal artery?
Excretion / Drainage Panel
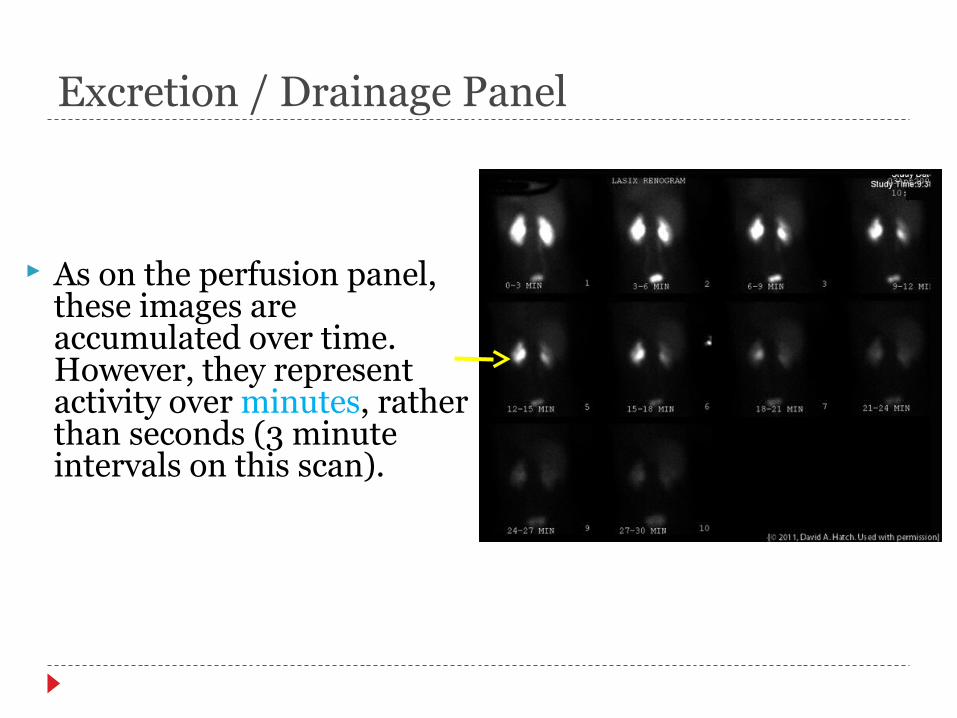
As on the perfusion panel, these images are accumulated over time. However, they represent activity over minutes, rather than seconds (3 minute intervals on this scan).

Excretion / Drainage Panel
You may find it useful to ask yourself two questions: Which frame on the
excretion/ drainage panel is the brightest for each kidney?
Do the kidneys look less bright in subsequent frames (do both kidneys show drainage)?

Excretion / Drainage Panel
On this scan, both kidneys are brightest in the first frame. The left kidney drains a bit more slowly than the right (image #5).
Excretion / Drainage
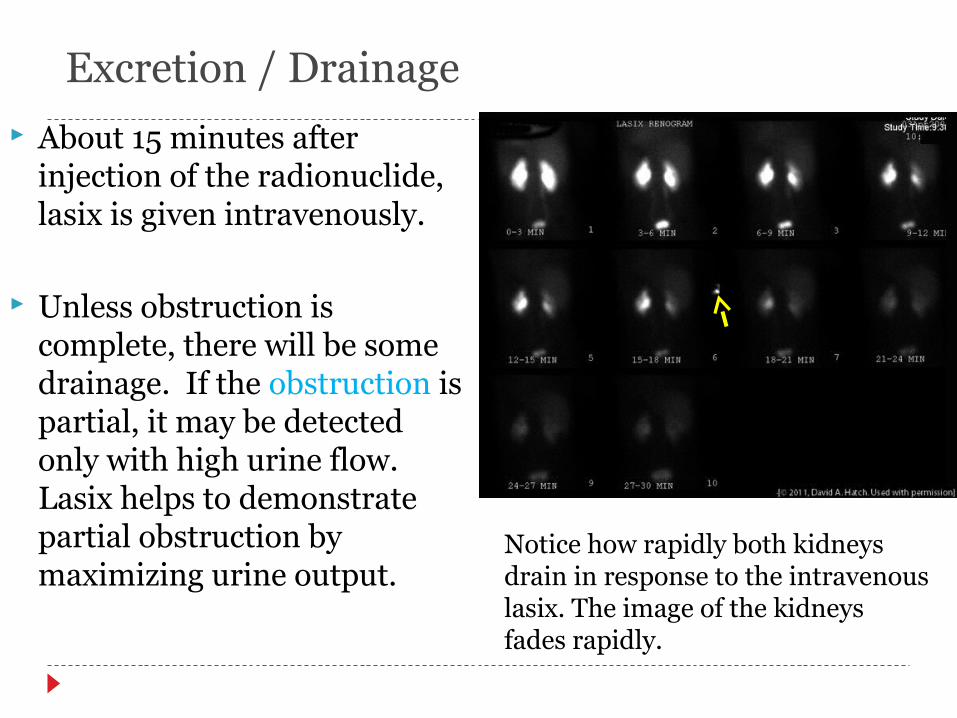
About 15 minutes after injection of the radionuclide, lasix is given intravenously.
Unless obstruction is complete, there will be some drainage. If the obstruction is partial, it may be detected only with high urine flow. Lasix helps to demonstrate partial obstruction by maximizing urine output.
Notice how rapidly both kidneys drain in response to the intravenous lasix. The image of the kidneys fades rapidly.
Curves / Analysis Panel
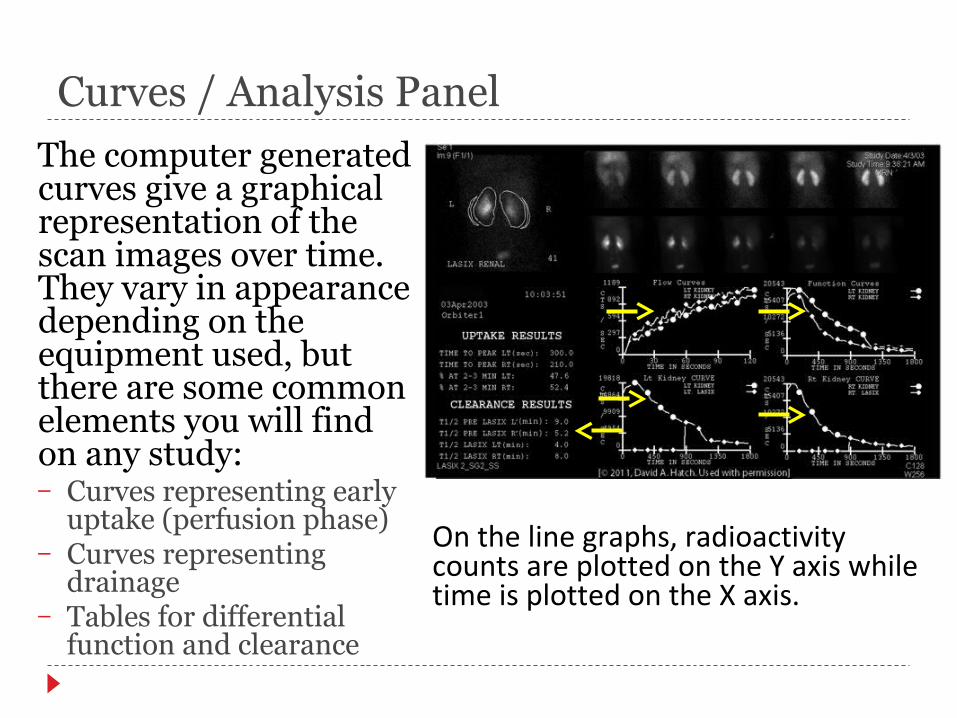
The computer generated curves give a graphical representation of the scan images over time. They vary in appearance depending on the equipment used, but there are some common elements you will find on any study:– Curves representing early
uptake (perfusion phase)– Curves representing
drainage– Tables for differential
function and clearance
On the line graphs, radioactivity counts are plotted on the Y axis while time is plotted on the X axis.

Curves / Analysis Panel
• Area of interest– This is a graphical representation of
the area from which radioactivity is measured in the analysis. There are two such areas for each kidney.
• Kidney area• Background area
– The radioactivity detected in the background area is subtracted from that detected from the kidney to eliminate background noise.

Look at some normal curves. Normally, the curves show rapid uptake (flow curve
on left) and rapid drainage (function curve on right). Each kidney is plotted separately
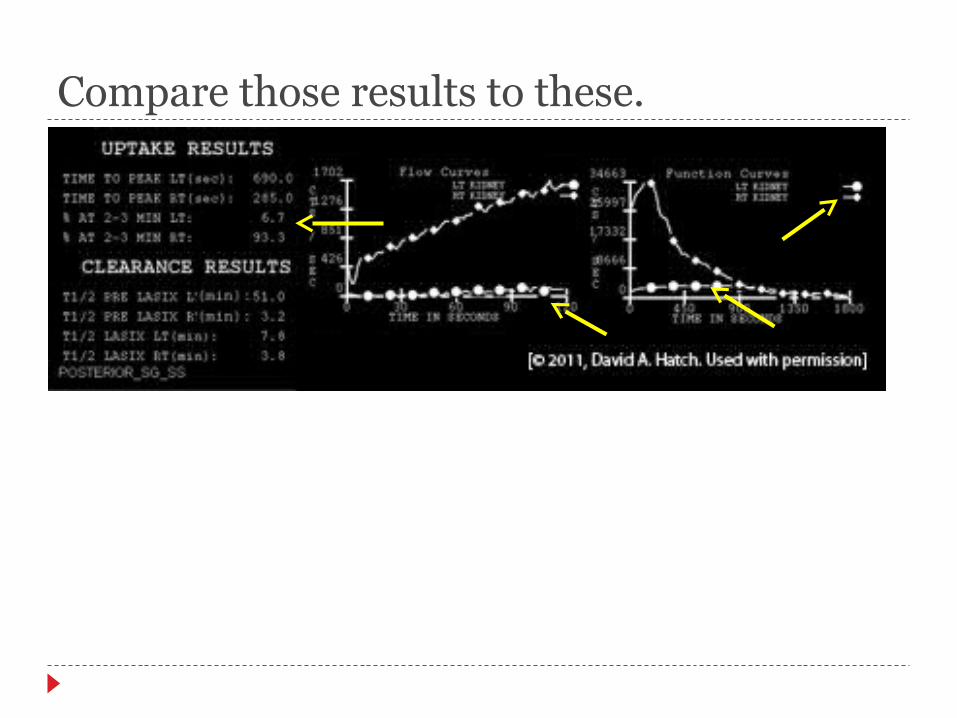
Compare those results to these.

Table This table gives a numeric
representation of the scan including: Differential function, the
relative contribution of each kidney to total renal perfusion/uptake.
T ½ - the time at which half of the radionuclide has drained (ignore T ½ pre-lasix for now).
Lasix Renogram
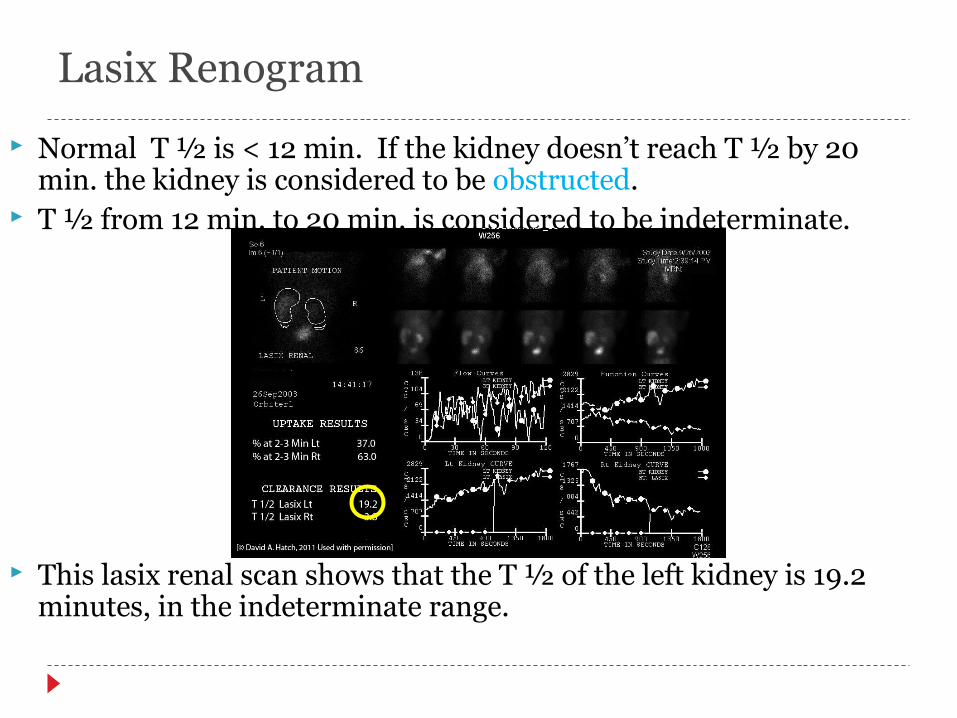
Normal T ½ is < 12 min. If the kidney doesn’t reach T ½ by 20 min. the kidney is considered to be obstructed.
T ½ from 12 min. to 20 min. is considered to be indeterminate.
This lasix renal scan shows that the T ½ of the left kidney is 19.2 minutes, in the indeterminate range.
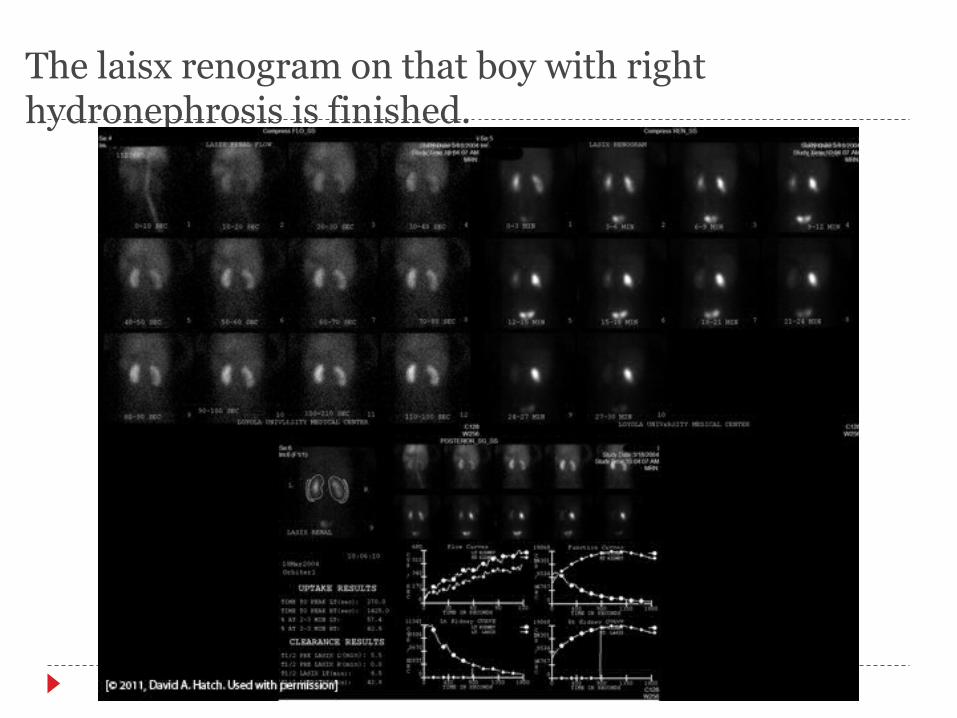
The laisx renogram on that boy with right hydronephrosis is finished.
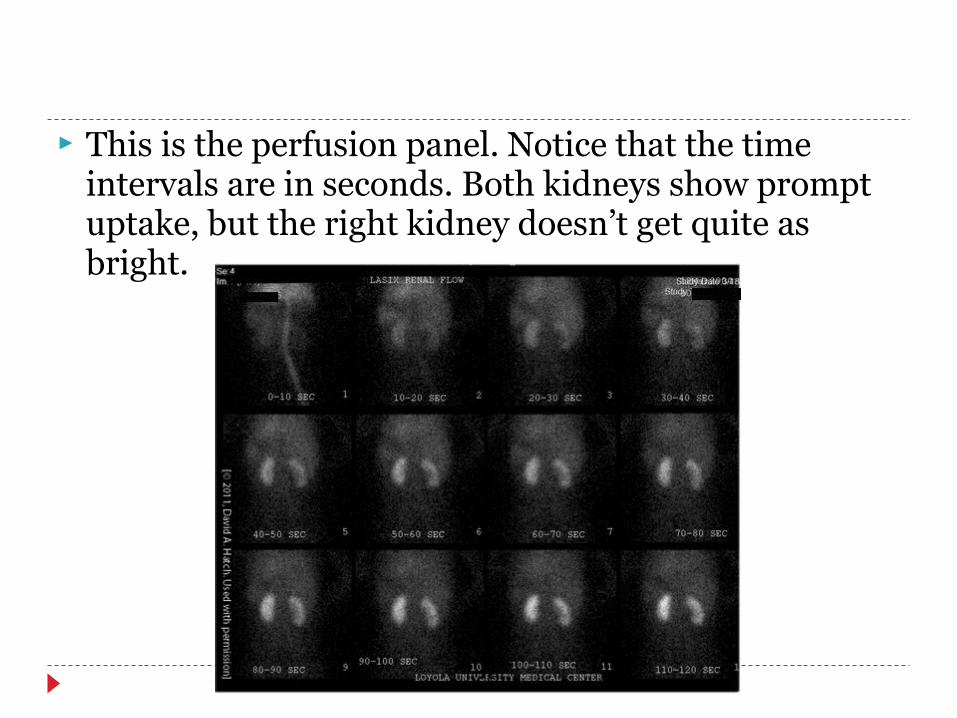
This is the perfusion panel. Notice that the time intervals are in seconds. Both kidneys show prompt uptake, but the right kidney doesn’t get quite as bright.
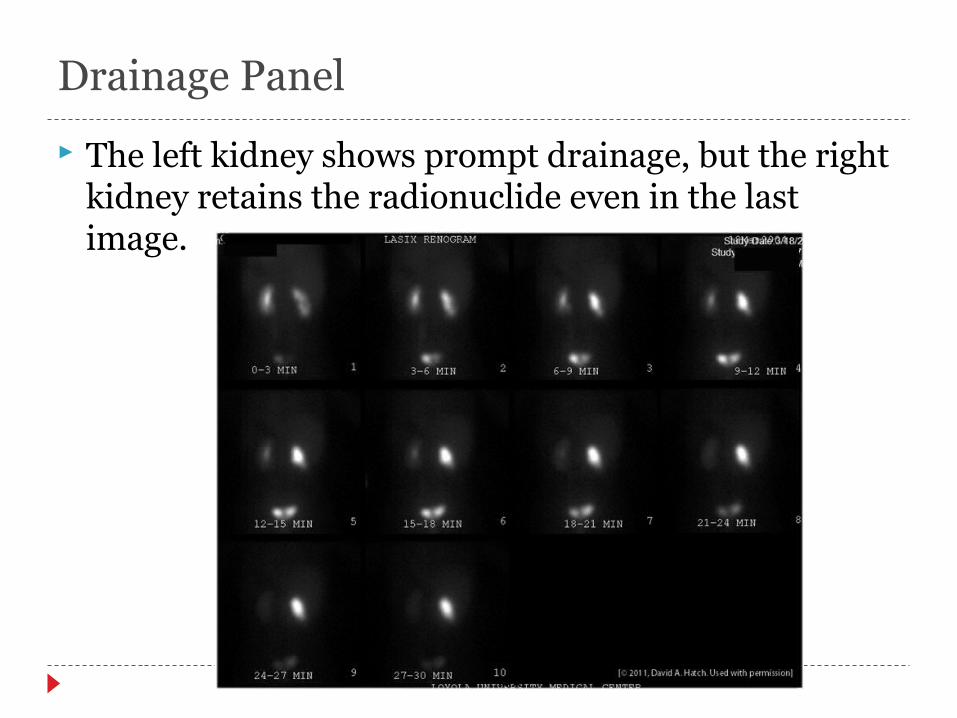
Drainage Panel
The left kidney shows prompt drainage, but the right kidney retains the radionuclide even in the last image.
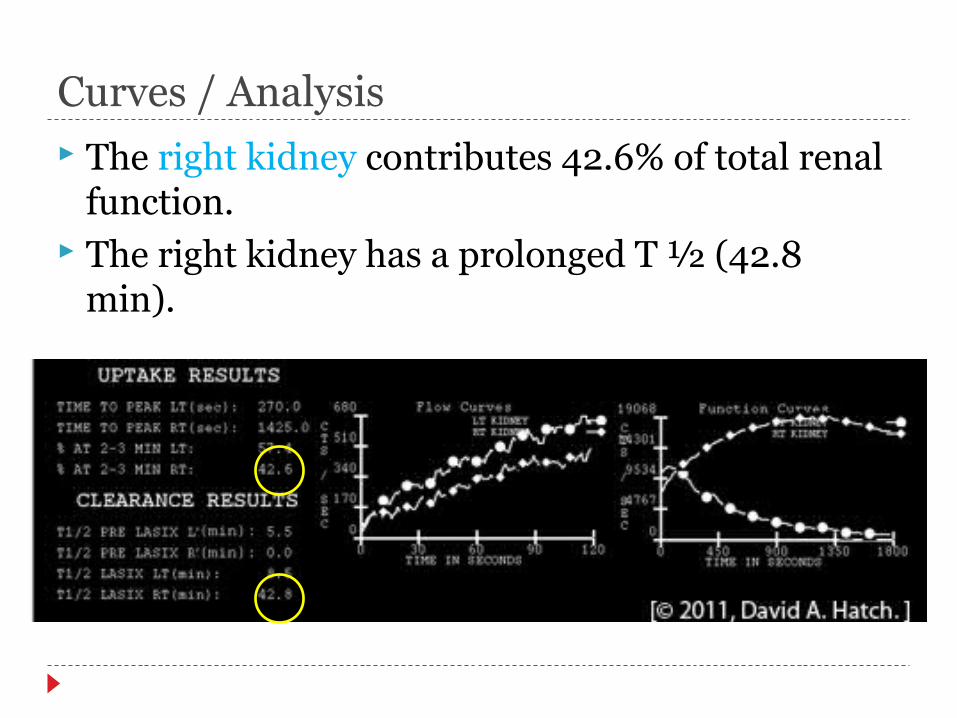
Curves / Analysis The right kidney contributes 42.6% of total renal
function. The right kidney has a prolonged T ½ (42.8
min).
Case Summary
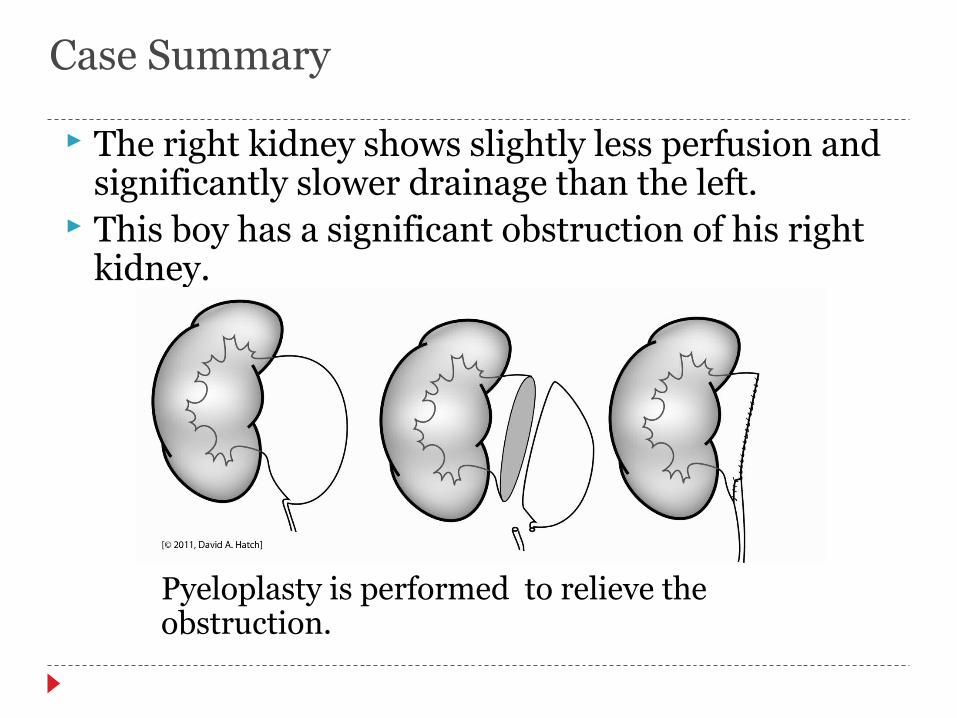
The right kidney shows slightly less perfusion and significantly slower drainage than the left.
This boy has a significant obstruction of his right kidney.
Pyeloplasty is performed to relieve the obstruction.

Case History You are called to see a newborn male. Prenatal
ultrasounds have shown an abnormality of the right kidney. Unfortunately, neither the ultrasound images nor the report is available.
The baby was born at 40 weeks gestational age with APGARs of 9/9/9. Exam is completely normal. His pediatrician orders an ultrasound

Ultrasound Interpretation
Size Right: 6.6 cm. Why is this
kidney so large? (Nl = 4 cm) Left: 5.2 cm. Why is this kidney
so large? Shape
Right: Reniform Left: Reniform
Ultrasound Interpretation
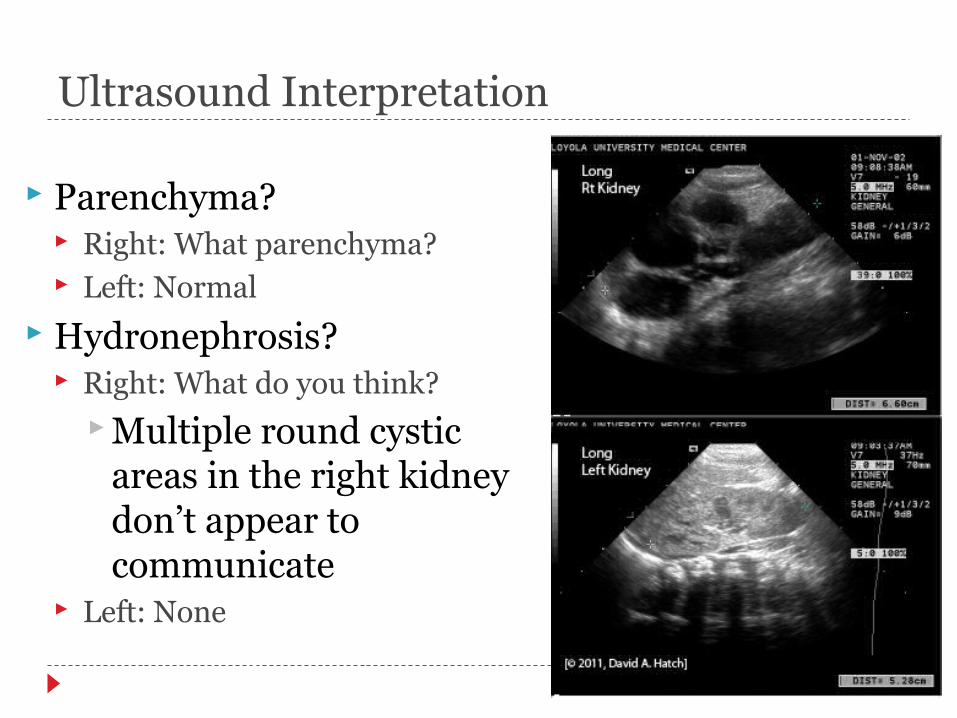
Parenchyma? Right: What parenchyma? Left: Normal
Hydronephrosis? Right: What do you think?
Multiple round cystic areas in the right kidney don’t appear to communicate
Left: None
Renal Function? What type of nuclear scan would be appropriate
to determine function and possible obstruction of the kidneys?
Filtered agent Demonstrates perfusion and obstruction
Excreted agent Function and perfusion (indirectly)
Cortical agent Renal mass

We ordered a DTPA Renal Scan (Filtered radionuclide)

Your interpretation?
Perfusion Normal on left None on right
We know from the ultrasound that there is a kidney on the right. Why doesn’t it show up on the nuclear scan?

Your interpretation? Drainage
None on right Delayed on left
Analysis/curves Panel
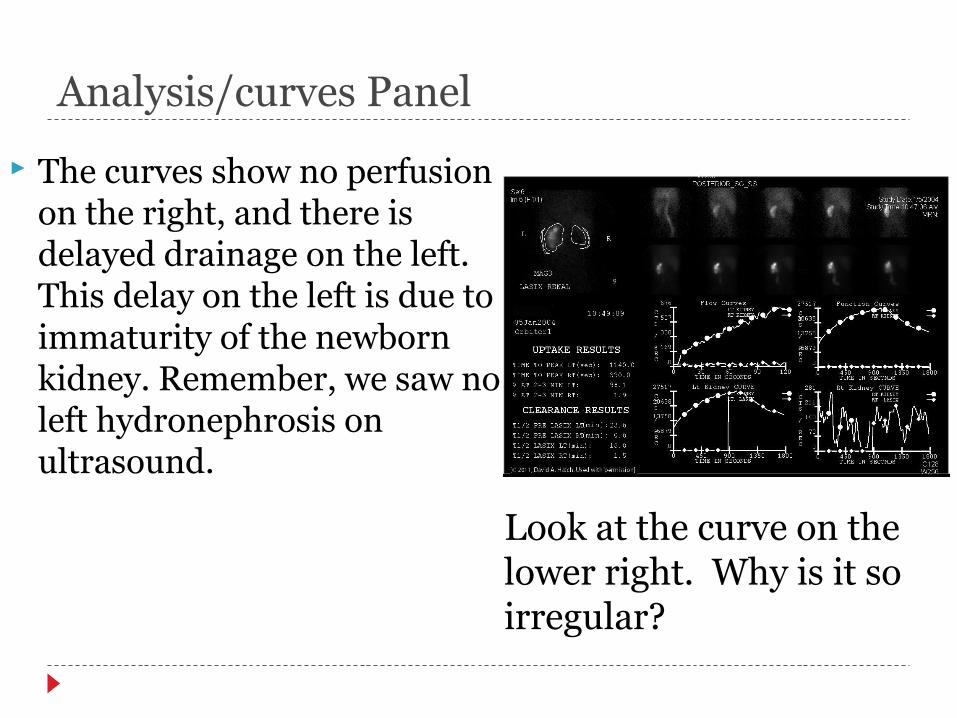
The curves show no perfusion on the right, and there is delayed drainage on the left. This delay on the left is due to immaturity of the newborn kidney. Remember, we saw no left hydronephrosis on ultrasound.
Look at the curve on the lower right. Why is it so irregular?
Analysis/ Curves Panel
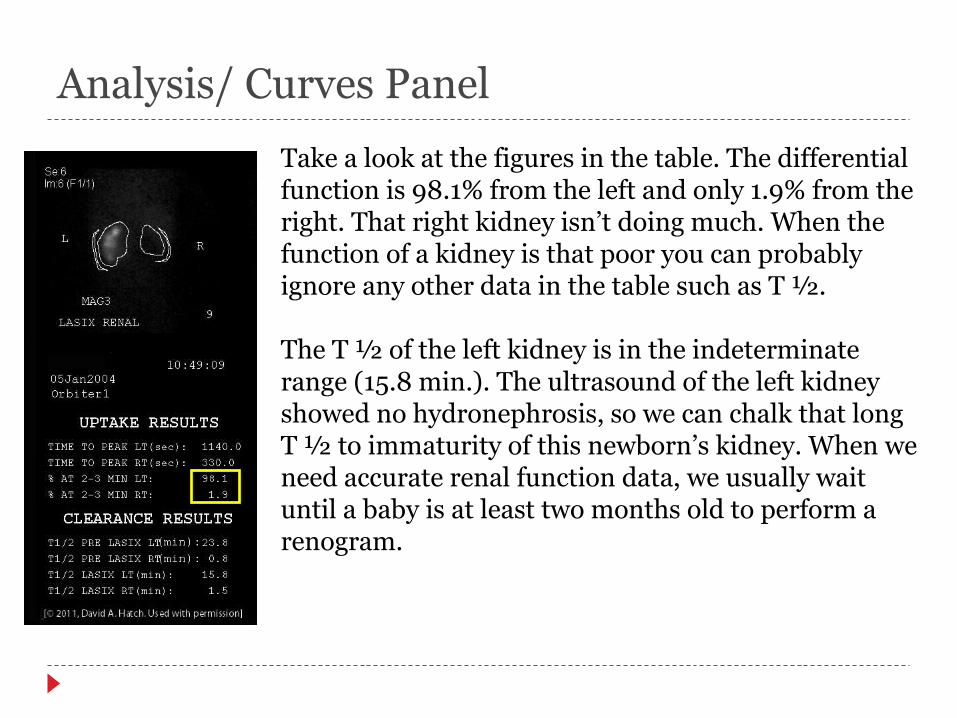
Take a look at the figures in the table. The differential function is 98.1% from the left and only 1.9% from the right. That right kidney isn’t doing much. When the function of a kidney is that poor you can probably ignore any other data in the table such as T ½.
The T ½ of the left kidney is in the indeterminate range (15.8 min.). The ultrasound of the left kidney showed no hydronephrosis, so we can chalk that long T ½ to immaturity of this newborn’s kidney. When we need accurate renal function data, we usually wait until a baby is at least two months old to perform a renogram.

Case Summary
This baby’s right kidney is enlarged with multiple non-communicating cystic areas. It has no perfusion and no function. This is a typical multicystic–dysplastic kidney. The cause for this condition is thought to be a failure in the canalization and/or development of the proximal collecting system from the calyces to the renal pelvis. There is no communication between the collecting ducts and the ureter.
Nuclear Renography Summary
A nuclear renal scan is performed by intravenous injection of a radioisotope. A radiation detection device (nuclear medicine camera) is used to detect passage of the radioisotope through the urinary tract over time. Because the camera is placed posterior to the patient, the scan will show the right kidney on your right as you face the scan.

Nuclear Renography Summary
Remember the 3 radionuclide classes Filtered – Shows perfusion, drainage and function Excreted – Shows tubular function Cortical imaging – Shows scaring and renal mass
3 panels of a nuclear renogram Perfusion Drainage/function Curves/analysis
Nuclear Renography Summary
Ureteropelvic junction obstruction An obstruction of urine flow from the kidney pelvis to the
ureter. UPJ obstruction can cause pain, urine infection, gross hematuria and it can increase the risk of kidney stones.
Multicystic-dysplastic kidney A congenital condition caused by failure of development
of the most proximal collecting system that results in a non-functioning kidney composed of cysts of varying size.

THANK YOU