Embed Size (px)
Citation preview

1
Quantitative mass spec based proteomics
Tuula NymanInstitute of [email protected]
THE PROTEOMEThe complete protein complement expressed by a genome or by a cell or a tissue type
(M. Wilkins et al. BioTechnology 14, 61-65, 1996)
Protein and peptide separation: electrophoresis (SDS-PAGE and 2-DE) and different forms of chromatography
Protein identification and characterisation:mass spectrometry
Methods in proteomics
2
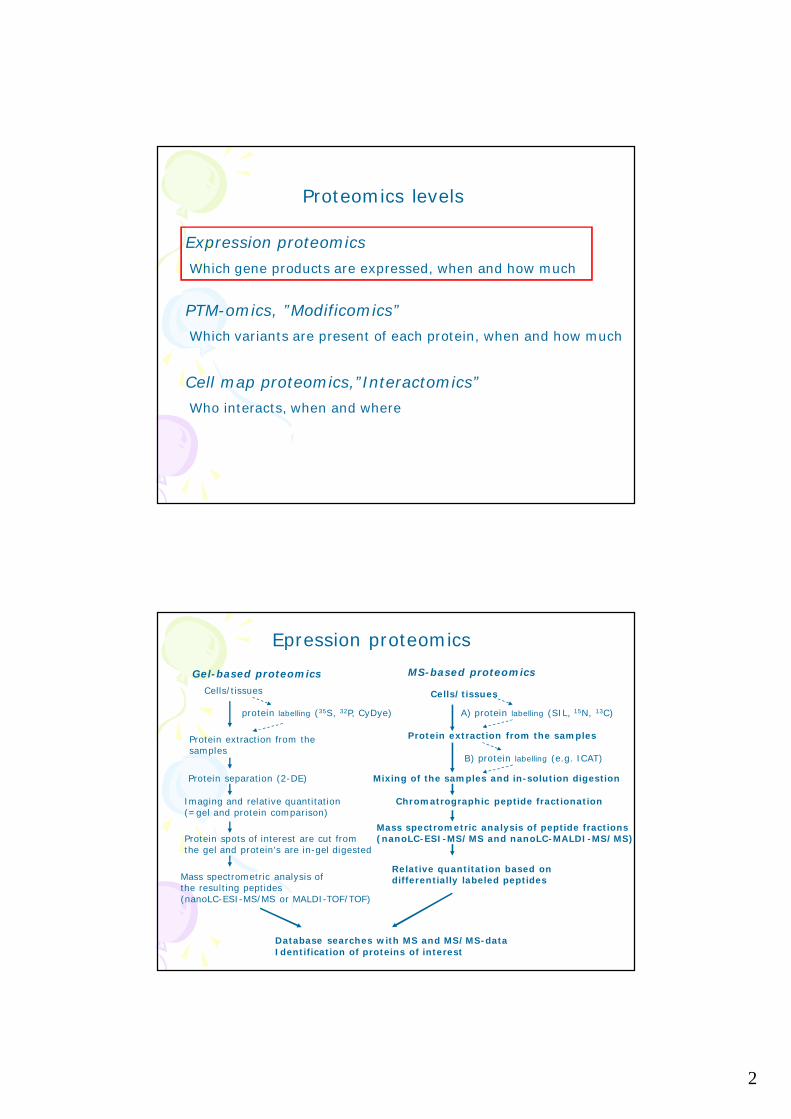
Proteomics levels
Expression proteomics
Which gene products are expressed, when and how much
PTM-omics, ”Modificomics”
Which variants are present of each protein, when and how much
Cell map proteomics,”Interactomics”
Who interacts, when and where
Cells/tissues
Protein separation (2-DE)
Imaging and relative quantitation (=gel and protein comparison)
Protein spots of interest are cut fromthe gel and protein's are in-gel digested
Gel-based proteomics
Mass spectrometric analysis of the resulting peptides(nanoLC-ESI-MS/MS or MALDI-TOF/TOF)
Mixing of the samples and in-solution digestion
Protein extraction from the samples
Cells/tissues
protein labelling (35S, 32P, CyDye)
B) protein labelling (e.g. ICAT)
Protein extraction from the samples
A) protein labelling (SIL, 15N, 13C)
Identification of proteins of interestDatabase searches with MS and MS/MS-data
MS-based proteomics
Chromatrographic peptide fractionation
Mass spectrometric analysis of peptide fractions(nanoLC-ESI-MS/MS and nanoLC-MALDI-MS/MS)
Relative quantitation based on differentially labeled peptides
Epression proteomics

3
Two-dimensional electrophoresis based proteomics:Viral dsRNA induced differences in keratinocytes
•240 reproducibly differentially expressed protein spots-137 in mitochondria (103 up- and 34 downregulted)-103 in cytoplasm (70 up- and 33 downregulated)
•Proteins from 179 spots successfully identified
Two-dimensional electrophoresis
-proteins are separated according to their pI and molecular weight -2-DE is an efficient method to separate very complex protein mixtures-2-DE separates also protein isoforms into distinct spots

4
-certain protein classes, e.g. very big or small proteins and proteins with extreme pI:s are absent or underrepresented in 2-DE gels
-a lot of manual lab work
2-DE is a good separation method but…
MS-based proteomics
-possibility to study all protein classes
-for quantificatication the proteins/peptides are usually labeled with stable isotopes
-also label-free approaches
-most steps can be automated
5
Stable isotope labeling
-Protein samples are labeled with different stableisotopes, after labeling the proteins/peptidesin different samples are still chemically (almost)identical but have a mass difference
-Samples are mixed after labeling and relative protein quantification between the samplesis done based on MS or MS/MS data
Stable isotope labeling
Isotope Coded Affinity Tags (ICAT), Steve Gygi et al, Nature Biotechnology 1999
Stable isotope labeling by amino acids in cell culture (SILAC),Shao-En Ong et al, Mol Cell Proteomics 2002
Isotope tagged relative and absolute quantitation (iTRAQ), Ross PL et al, Mol Cell Proteomics 2004
6
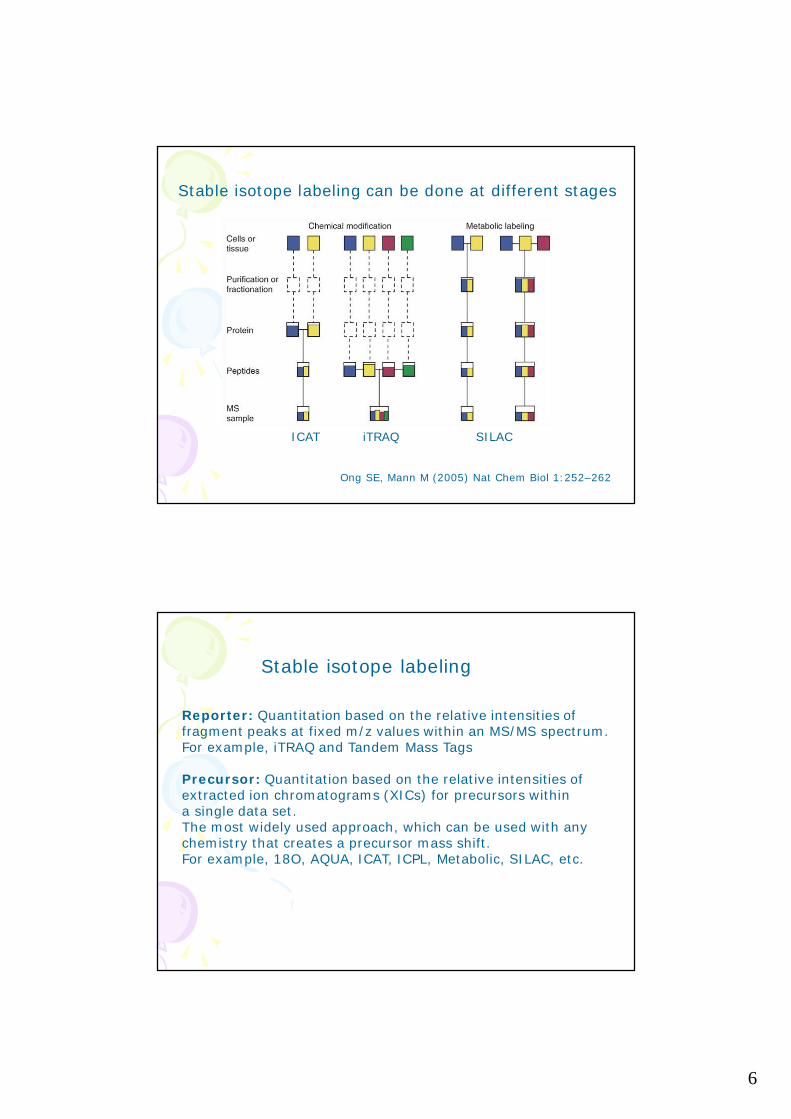
ICAT iTRAQ SILAC
Stable isotope labeling can be done at different stages
Ong SE, Mann M (2005) Nat Chem Biol 1:252–262
Reporter: Quantitation based on the relative intensities of fragment peaks at fixed m/z values within an MS/MS spectrum. For example, iTRAQ and Tandem Mass Tags
Precursor: Quantitation based on the relative intensities of extracted ion chromatograms (XICs) for precursors within a single data set. The most widely used approach, which can be used with any chemistry that creates a precursor mass shift. For example, 18O, AQUA, ICAT, ICPL, Metabolic, SILAC, etc.
Stable isotope labeling
7
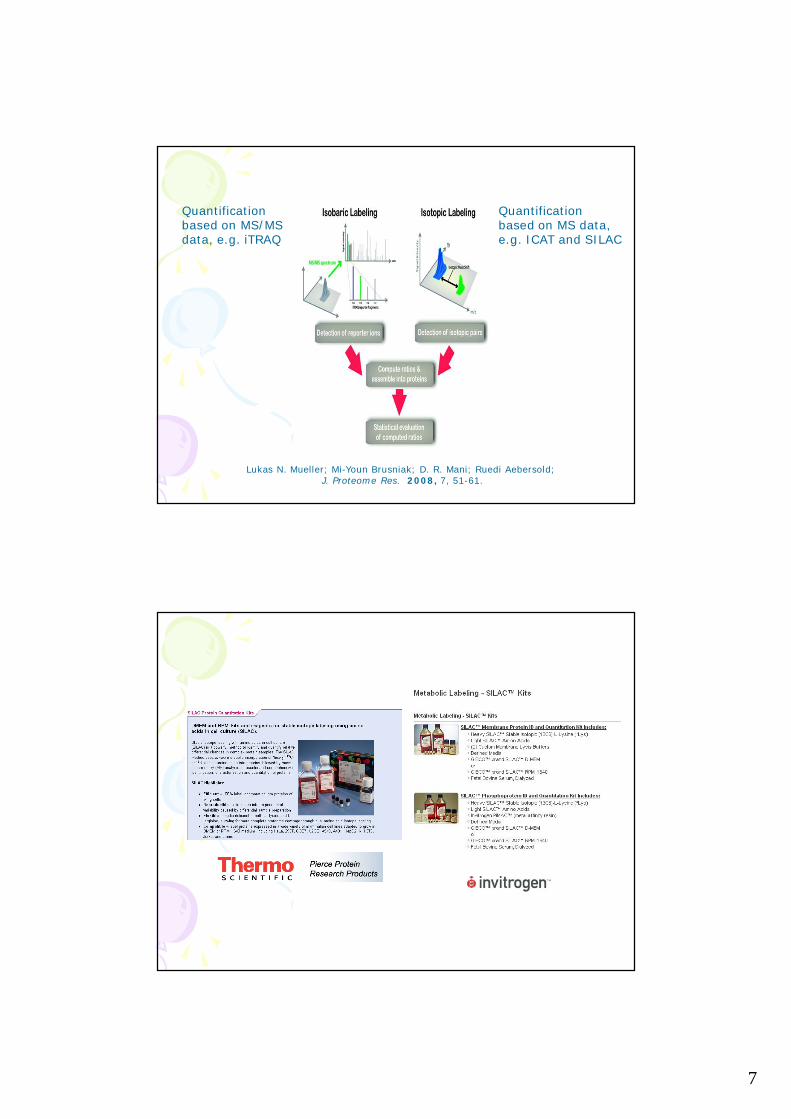
Lukas N. Mueller; Mi-Youn Brusniak; D. R. Mani; Ruedi Aebersold; J. Proteome Res. 2008, 7, 51-61.
Quantificationbased on MS/MS data, e.g. iTRAQ
Quantificationbased on MS data,e.g. ICAT and SILAC
8
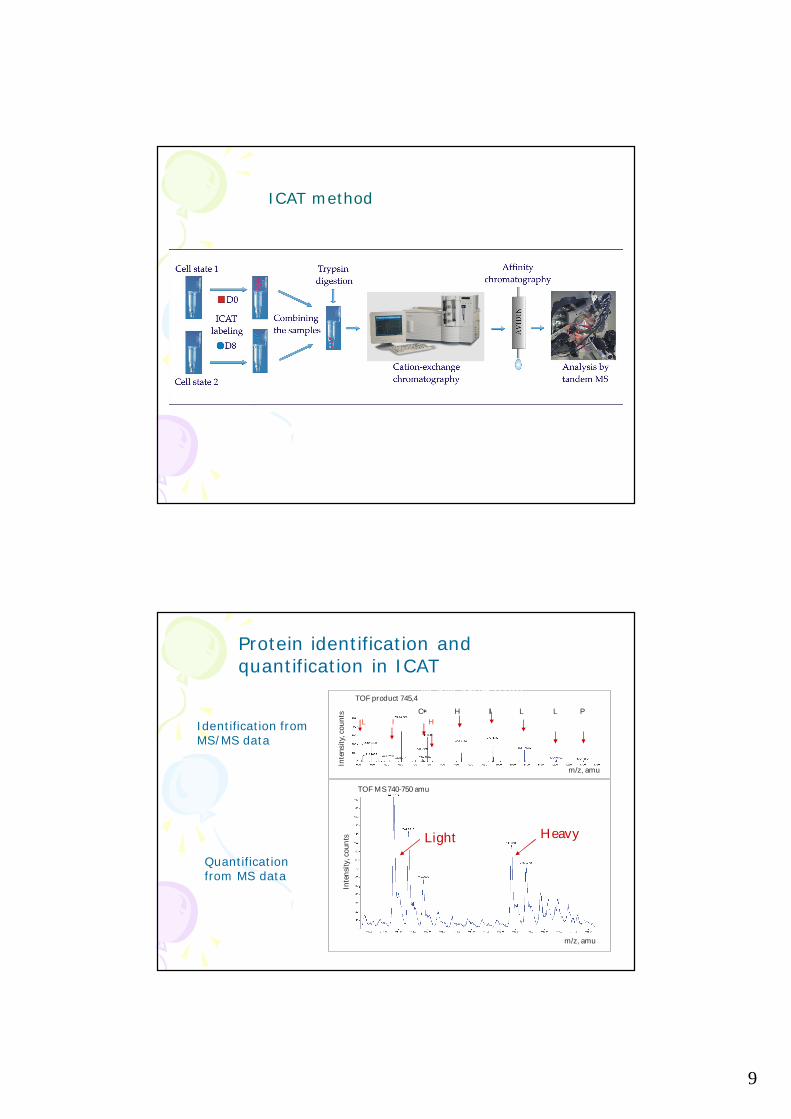
First generation ICAT reagent
Cleavable ICAT reagents
Isotope-coded affinity tags:cysteine-spesific labeling
9
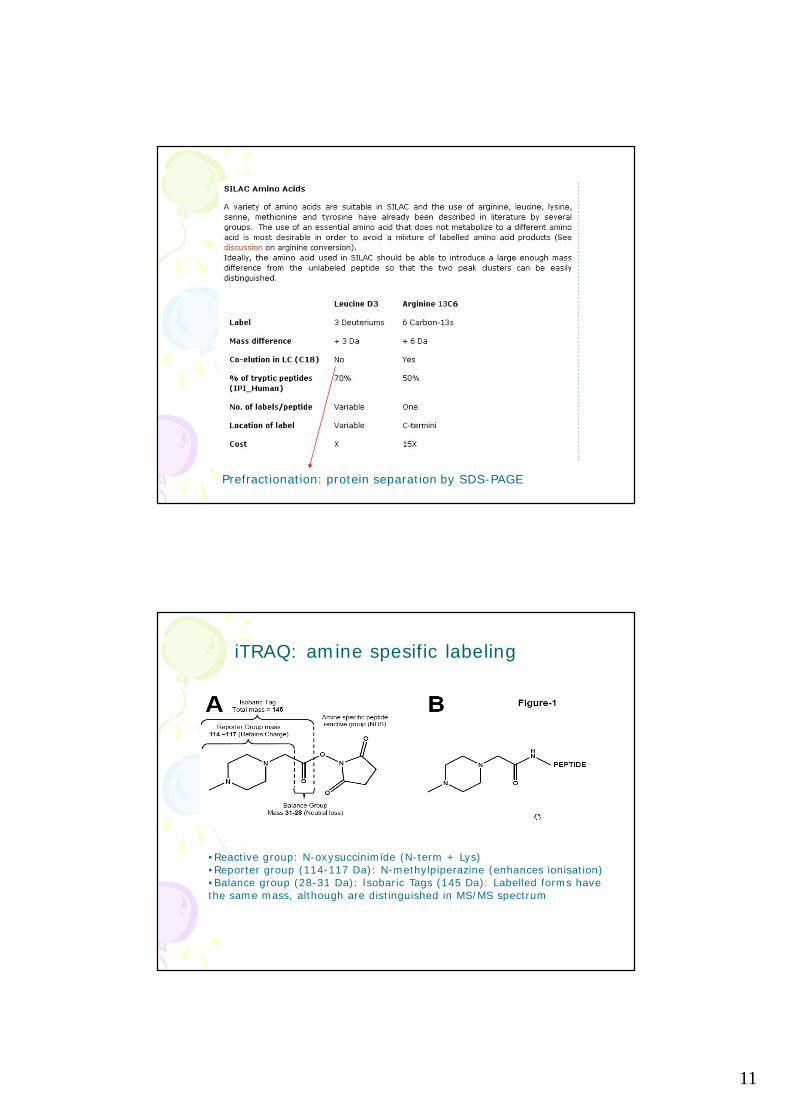
ICAT method
Protein identification and quantification in ICAT
C H I L PLH
IIL
Inte
nsity
, cou
nts
m/z, amu
TOF product 745,4
Inte
nsity
, cou
nts
m/z, amu
TOF MS 740-750 amu
Identification from MS/MS data
Quantification from MS data
HeavyLight
MS spectrum
MS/MS spectrum

10
-Simplifies mixtures into cysteine containing peptides only -Complexity down to around 10-20%-Cysteine in 80-90% of all proteins only.-Incomplete proteome coverage-Loss of PTM information-Only pair-wise comparison possible
The ICAT technique is cysteine specific
SILAC: in vivo incorporation of a stable isotope label into proteins
http://silac.org/index_html
-two cell populations are grown in culture media that are identical except that one of them contains a 'light' and the other a 'heavy' form of a particular amino acid
-pioneering work by Matthias Mann’s group
11
Prefractionation: protein separation by SDS-PAGE
iTRAQ: amine spesific labeling
•Reactive group: N-oxysuccinimide (N-term + Lys)•Reporter group (114-117 Da): N-methylpiperazine (enhances ionisation)•Balance group (28-31 Da): Isobaric Tags (145 Da): Labelled forms have the same mass, although are distinguished in MS/MS spectrum

12
iTRAQ workflow
Isolated protein pellets
Protein reduction, alkylation, and in-solution digestion
iTRAQ labelling of the peptides
Pooling of the labelled samples
SCX fractionation of the peptides
LC-MS/MS analysis for the SCX fractions
Protein ID and quantification based on MS/MS data
iTRAQ/ Sample preparation
-protein pellet is the preferred starting material(e.g. 2D Clean Up Kit)
-protein pellet is dissolved in SDS-containing bufferto ensure that proteins are in solution
-disulphide bond reduction and Cys alkylation
-protein digestion with trypsin o/n (use exess of trypsin because of the SDS in the buffer)
-iTRAQ labeling after digestion

13
Strong cation exchange (SCX) is most often used
iTRAQ/ Peptide fractionation
Buffers: A: 20 mM KH2PO4, pH 3B: 0,4 M KCl in A buffer
Column: Polysulfoethyl A (200 x 2,1 mm) Flow: 200 µl/minFraction collection: 1 min fractions
All the peptide containing SCX-fractions are analysed separately by LC-MS/MS
One LC-MS/MS run 180 min

14
Exp 1, TOF scan
Exp 2, product ion scan
Exp 3, product ion scan
Compared to ’normal’ identification: Higher collision energy and focus on reporter ion region in MS/MS scans
Zoom into Repoter ion region: Quantification data
15
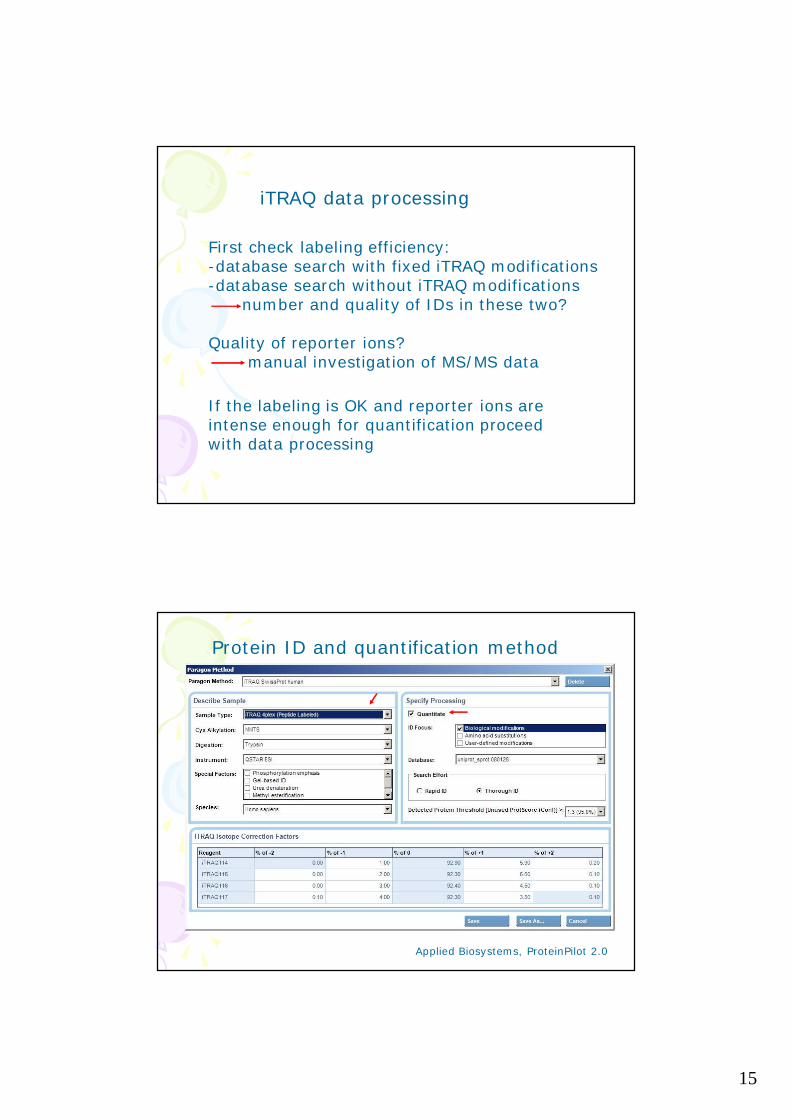
iTRAQ data processing
First check labeling efficiency:-database search with fixed iTRAQ modifications-database search without iTRAQ modifications
number and quality of IDs in these two?
Quality of reporter ions?manual investigation of MS/MS data
If the labeling is OK and reporter ions are intense enough for quantification proceedwith data processing
Protein ID and quantification method
Applied Biosystems, ProteinPilot 2.0
16
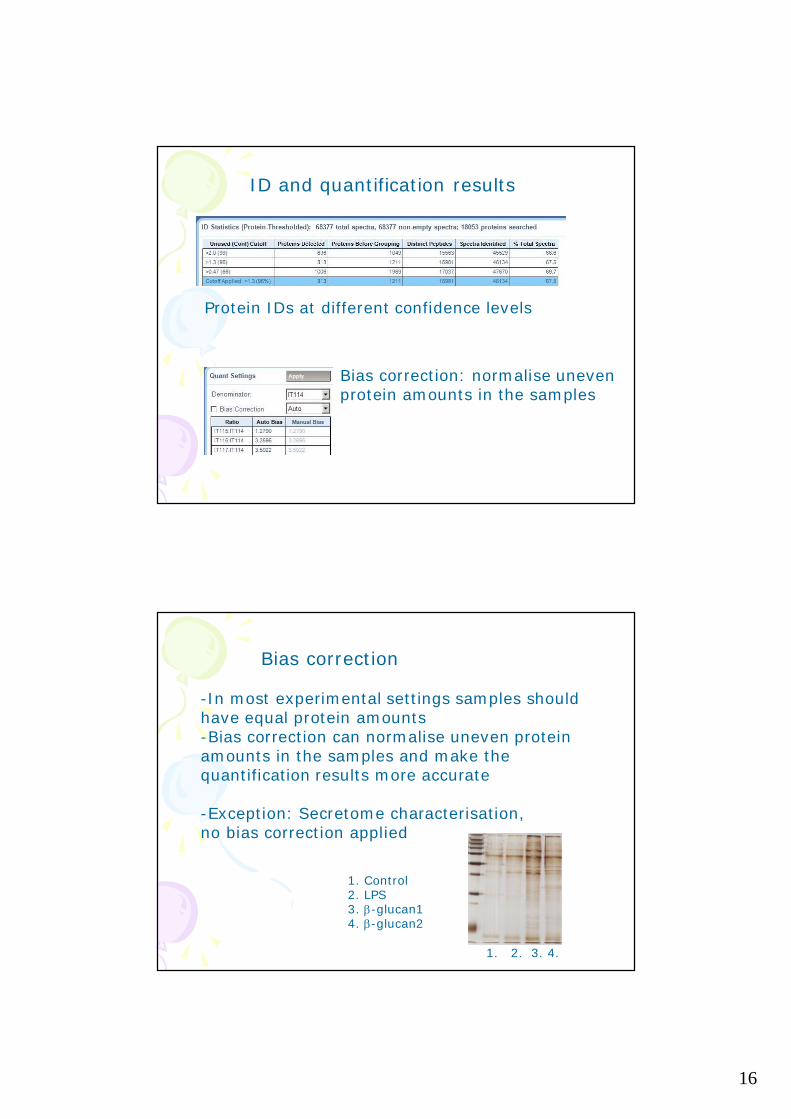
ID and quantification results
Bias correction: normalise uneven protein amounts in the samples
Protein IDs at different confidence levels
Bias correction
-In most experimental settings samples should have equal protein amounts-Bias correction can normalise uneven protein amounts in the samples and make the quantification results more accurate
-Exception: Secretome characterisation, no bias correction applied
1. 2. 3. 4.
1. Control2. LPS3. -glucan14. -glucan2

17
Quantification resultsProtein quantificationresults
Protein quantificationresults are calculated from the peptide quantification data
The user needs to decidethe fold difference for altered expression, usually 1.5 or 2 folddifference is reported

18
19
20
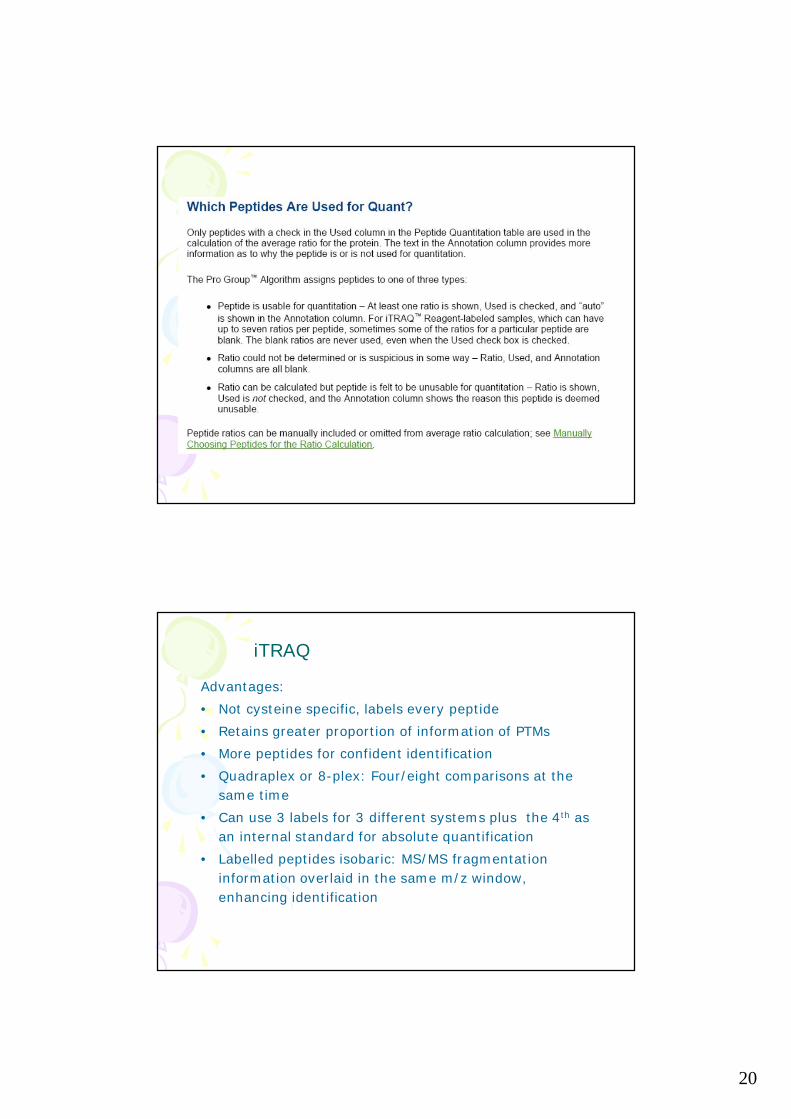
iTRAQ
Advantages:
• Not cysteine specific, labels every peptide
• Retains greater proportion of information of PTMs
• More peptides for confident identification
• Quadraplex or 8-plex: Four/eight comparisons at the same time
• Can use 3 labels for 3 different systems plus the 4th as an internal standard for absolute quantification
• Labelled peptides isobaric: MS/MS fragmentation information overlaid in the same m/z window, enhancing identification

21
114 115 116 117
human primary macrophages:influenza A virus infection (6h, 12h, 18h), cell fractionation: mitochondria, cytoplasm, nuclei
protein digestion + iTRAQ labelling,SCX fractionation of labelled peptides
LC-MS/MS analysis
protein identification and quantitation:Paragon algorithm (ProteinPilot)
Human primary macrophages infected with Influeza A virus
Control INF A 6h INF A 12h INF A 18h
Reduction,cysteine blocking,
digestion
Reduction,cysteine blocking,
digestion
Reduction,cysteine blocking,
digestion
Reduction,cysteine blocking,
digestion
iTRAQ Labelling
(114)
iTRAQ Labelling
(115)
iTRAQ Labelling
(116)
iTRAQ Labelling
(117)
combine labelled samples
SCX
LC-MS/MS
Infection of macrophages, Fractionation of cells (mitochondrial, cytoplasmic and nuclear fractions), extraction of proteins
Data-analysis
22
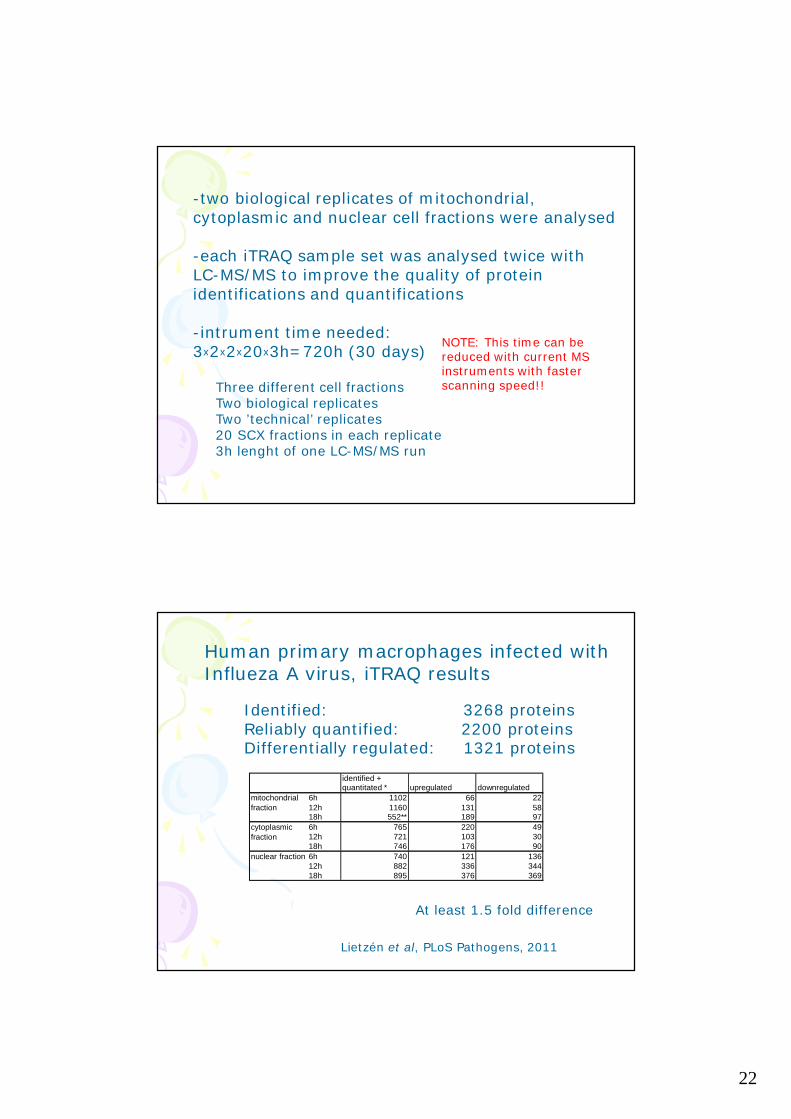
-two biological replicates of mitochondrial, cytoplasmic and nuclear cell fractions were analysed
-each iTRAQ sample set was analysed twice with LC-MS/MS to improve the quality of protein identifications and quantifications
-intrument time needed:3x2x2x20x3h=720h (30 days)
Three different cell fractionsTwo biological replicatesTwo ’technical’ replicates20 SCX fractions in each replicate3h lenght of one LC-MS/MS run
NOTE: This time can be reduced with current MS instruments with faster scanning speed!!
Identified: 3268 proteinsReliably quantified: 2200 proteinsDifferentially regulated: 1321 proteins
Human primary macrophages infected withInflueza A virus, iTRAQ results
identified + quantitated * upregulated downregulated
6h 1102 66 2212h 1160 131 5818h 552** 189 976h 765 220 4912h 721 103 3018h 746 176 906h 740 121 13612h 882 336 34418h 895 376 369
mitochondrial fraction
cytoplasmic fraction
nuclear fraction
At least 1.5 fold difference
Lietzén et al, PLoS Pathogens, 2011

23
Analysis of protein complexes using mass spectrometry
8, 645-654 (August 2007)
Isobaric tags to elucidate complex formation dynamics

24
ICAT, SILAC and iTRAQ
ICAT and SILAC: quantification based on MS dataidentification based on MS/MS data
iTRAQ: both ID and quantification based on MS/MS data
ALL produce huge amounts of raw datacurrent bottlenecks are in data analysis
and validation of the results
Replicate (= Spectral feature analysis)Label free quantitation based on the relative intensities of extracted ion chromatograms (XICs) for precursors in multiple data sets aligned using mass and elution time.
emPAI (Exponentially Modified Protein Abundance Index)Label free quantitation for the proteins in a mixture based on protein coverage by the peptide matches in a database search result
Label-free quantification

25
Nature Methods - 4, 787 - 797 (2007)
Spectral feature analysis:Label-free, MS1 driven
-the analysis starts with alignment of MS1 data from different samples, extraction of spectral features and their quantification
-spectral features showing differential expression are identified using a targeted MS/MS-based workflow.
-biological samples are analyzed in separate MS runs and the correspondence between spectral features across the runs is established by means of computational tools
-allows analysis of a large number of spectrum features and allows higher data throughput
-is compatible with applications that require profiling of multiple biological samples e.g. biomarker discovery
-does not require identification of the peptide sequence corresponding to each observed spectrum feature before quantification
-drawback: increased computational complexity
Spectral feature analysis
26
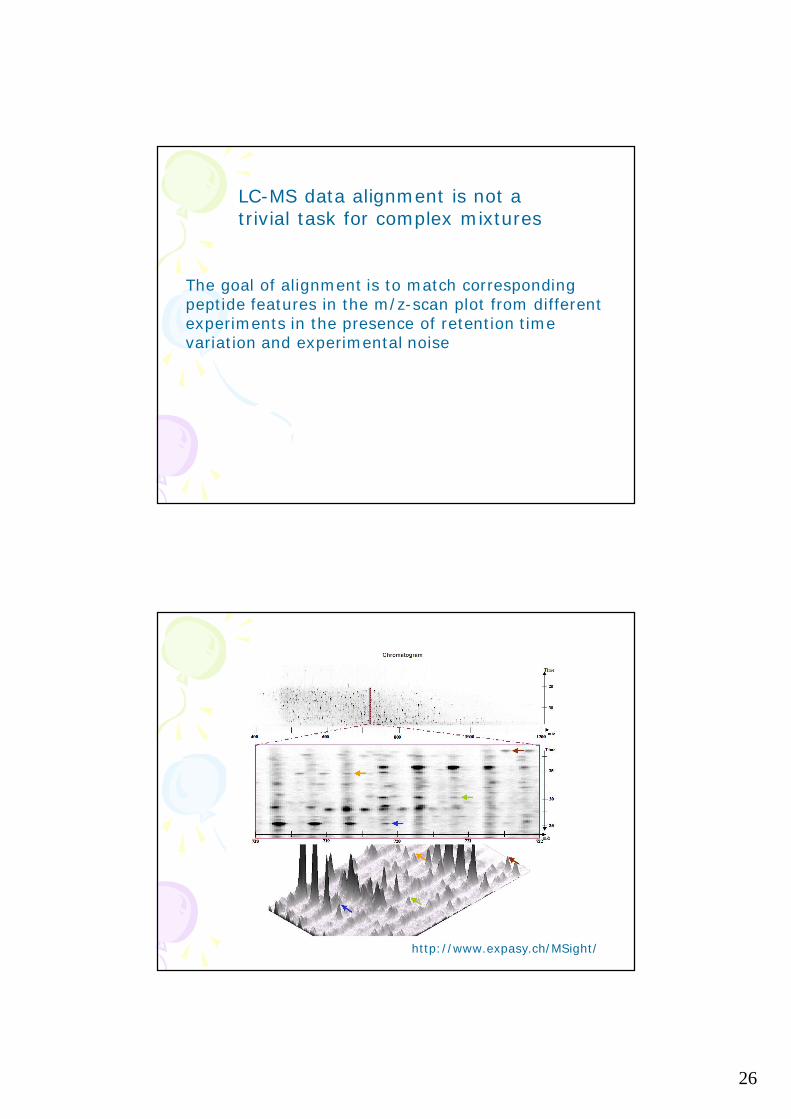
The goal of alignment is to match corresponding peptide features in the m/z-scan plot from different experiments in the presence of retention time variation and experimental noise
LC-MS data alignment is not a trivial task for complex mixtures
http://www.expasy.ch/MSight/
27
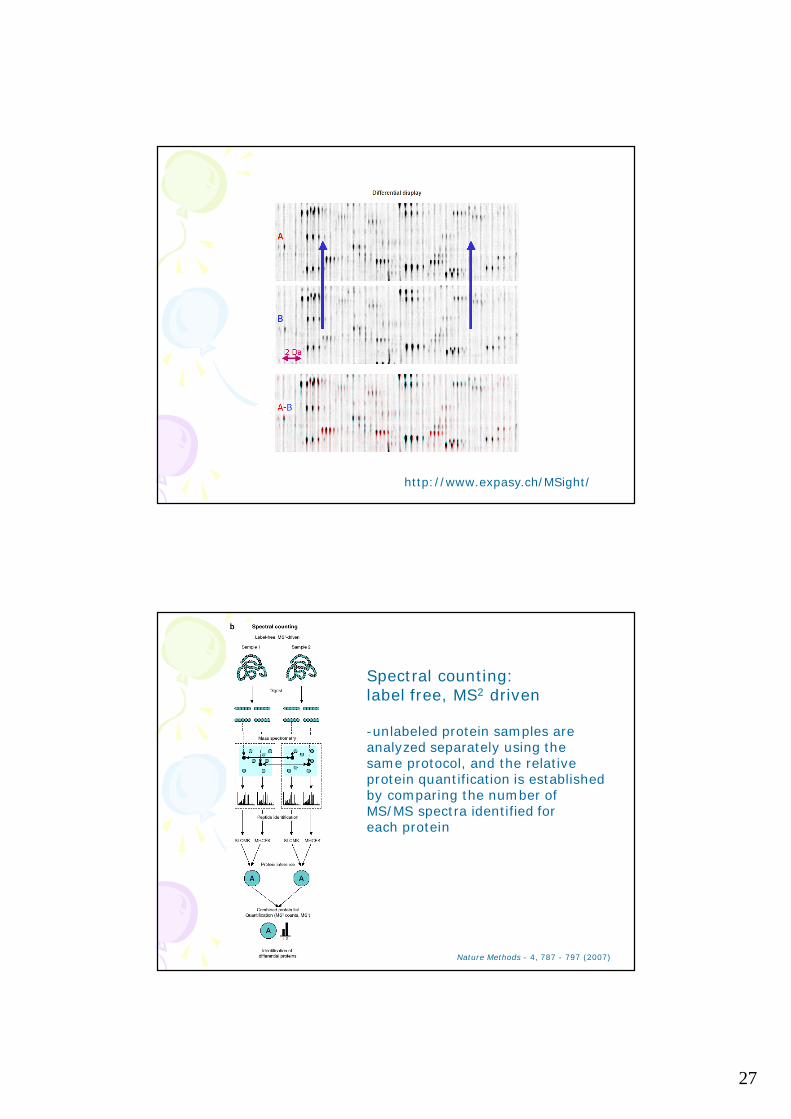
http://www.expasy.ch/MSight/
Spectral counting:label free, MS2 driven
-unlabeled protein samples are analyzed separately using the same protocol, and the relative protein quantification is established by comparing the number of MS/MS spectra identified for each protein
Nature Methods - 4, 787 - 797 (2007)

28
-the protein abundance in each sample is estimated from the number of MS/MS spectra identified corresponding to each protein normalized to account for protein length or expected number of tryptic peptides -as a variation of this strategy, peptide abundance can be determined from the intensity of the corresponding spectrum features
-suffers from inability to quantify low abundance proteins identified from only one or two peptides -in general is less accurate than the methods based on stable isotope labeling
Spectral counting
Dashed lines indicate points at which experimental variation and thus quantification errors can occur
Quantitative MS based proteomics
Anal Bioanal Chem (2007) 389:1017–1031
29
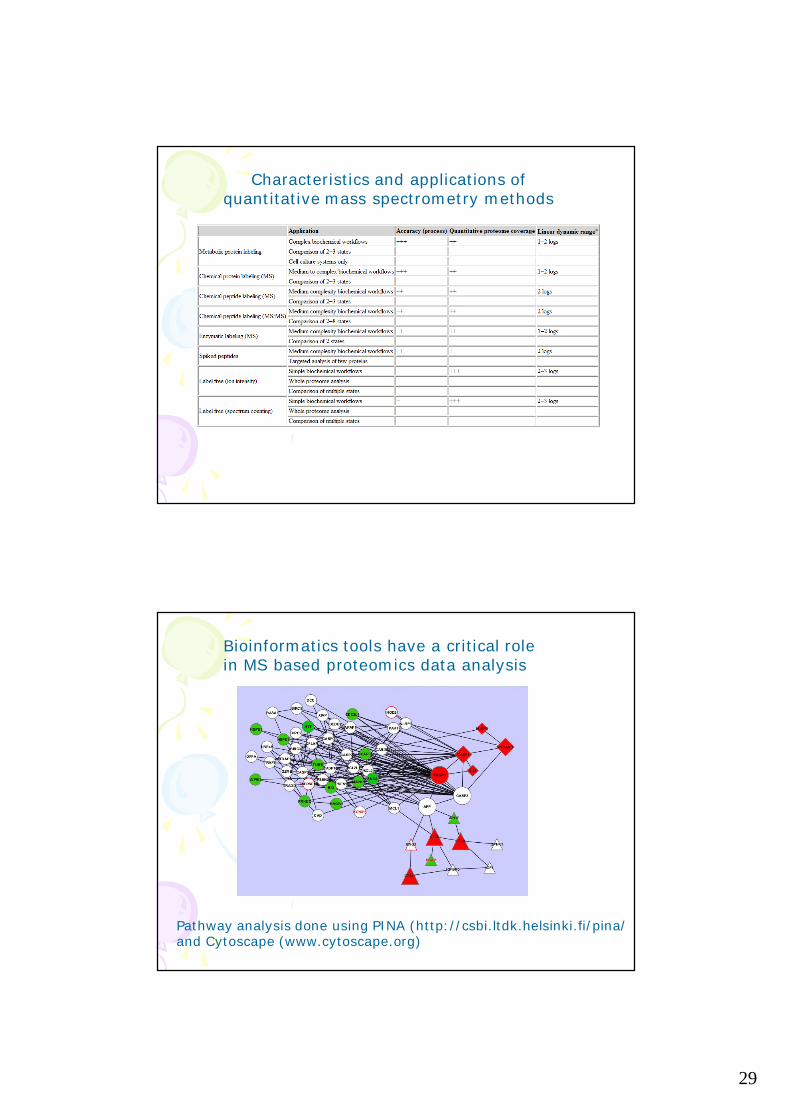
Characteristics and applications of quantitative mass spectrometry methods
Pathway analysis done using PINA (http://csbi.ltdk.helsinki.fi/pina/and Cytoscape (www.cytoscape.org)
Bioinformatics tools have a critical role in MS based proteomics data analysis