Embed Size (px)
Citation preview
Towards Prediction of Violin Timbre from Vibrational Measurements
Massimiliano Zanoni, Fabio Antonacci, Augusto SartiDipartimento di Elettronica, Informazione e Bioingegneria, Politecnico di Milano - Piazza Leonardo da Vinci 32 - 20133 Milano,
ABSTRACT
This contribution investigates on the acoustics of violin, andmore specifically on the relationship existing between vibra-tional impulse responses and the timbre of the instrument.With respect to previous publications on this topic, we tacklethe problem using a feature-based approach. More specifically,we aim at finding the correlation between the features extractedfrom accelerometric measurements of the bridge mobility andfrom audio recordings of a prescribed set of performances. Re-sults demonstrate that features describing to the global shapeof the spectrum are strongly related. On these descriptors wealso show the possibility of predicting the features of audiorecordings from the vibrational ones. Experimental data arebased on a set of 25 modern violins.
1. INTRODUCTION
The perceived quality of violins is mainly determined by itstimbre. Many studies have been proposed in the literature[1, 2].In this paper we investigate on the relationship existing be-tween vibrational data and audio recordings of performancesof violins. The Rayleigh integral [3] suggests that the emit-ted sound is related to the vibrational velocity field on topand back plates through an integral equation, which, however,cannot be used to predict deterministically the timbre fromthe vibrational analysis, due to the complexity of the physicaland vibrational behavior of the instrument. Instead, worksin the literature aim at finding a relationship between timbre,perception and vibrational response of the instrument usingtools from machine learning. In an early study in [4] the au-thor demonstrated that peaks in the bridge admittance between1 kHz and 3 kHz impact on the perception of the timbre. In[5] the author observes that, despite the fact that the bridgeresponse is characterized by relevant peaks and troughs, theperceived quality of the instrument does not change much fromnote to note played by the musician, suggesting that the timbralquality of the instrument must be attributed to the global shapeof the spectrum rather than to its details. In [6] authors relatevibrational and acoustics data of violins by comparing the har-monics of the long-term spectrum of glissando performanceswith the bridge mobility transfer function, which interestinglyturn out to exhibit similar features.
The characterization of the timbre, which is mostly subjec-tive, using objective descriptors extracted from the sound, hasgained interest in the research community [7], and is spread-ing also in Musical Acoustics [2]. In this work we adopt a
feature-based approach in order to investigate on the relationbetween vibrational and audio recordings. As far as vibra-tional analysis is concerned, we measured the bridge mobilityfunction [8]. Audio data, instead, consist in the recording ofexcerpts of songs, open strings, and musical scales. Many low-level timbral features have been extracted from both soundrecordings and vibrational impulse responses. The Pearsoncorrelation is then analyzed to assess which descriptors ofthe sound recordings can be predicted from the vibrationaldata. Results demonstrate that descriptors related to the over-all shape of the spectrum exhibit a good degree of correlation,thus confirming the results in [5] and [6]. On these descriptors,we also implemented a curve fitting algorithm, and a goodfitting accuracy is found. We believe that this paper sheds lighton the possibility for violin-makers to fine tune some parame-ters of the timbre of the instrument at the different stages ofthe making process (e.g. additional thinning of plate).
2. DATA ACQUISITION
Our study is based on 25 violins: 16 from the “TriennaleViolin-making Competition” held in Cremona, Italy, in Septem-ber 2015 and 9 from the collection of the school of lutherie.
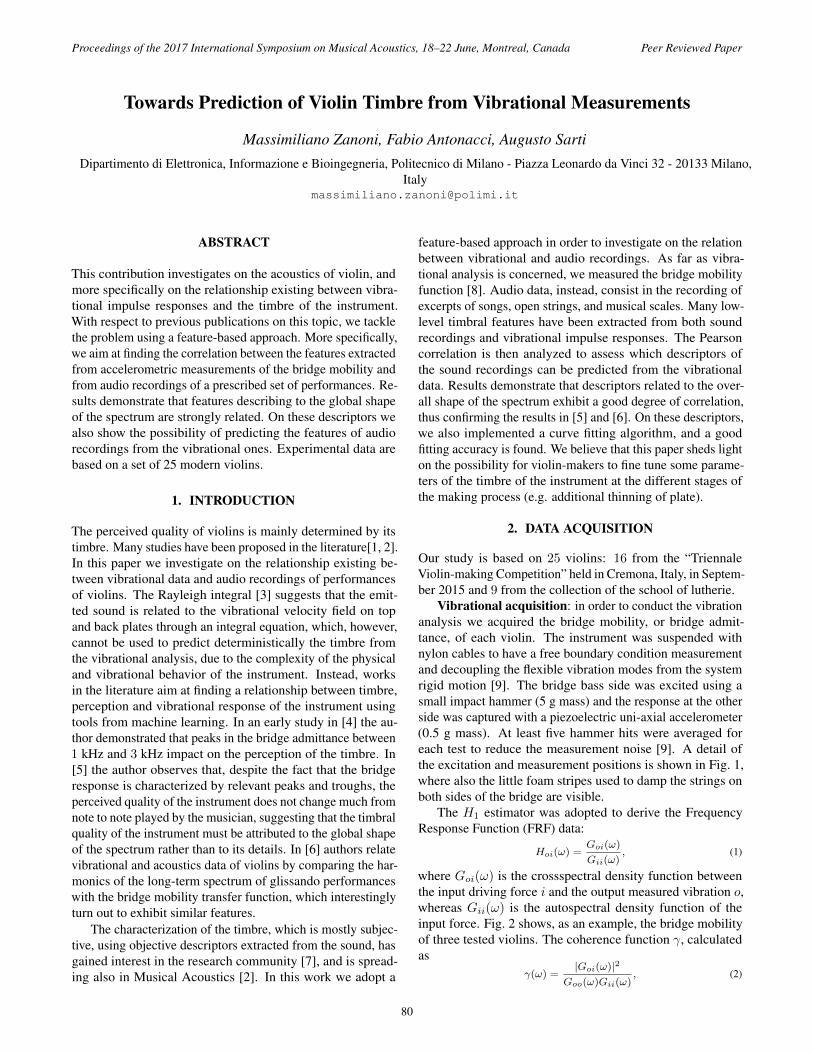
Vibrational acquisition: in order to conduct the vibrationanalysis we acquired the bridge mobility, or bridge admit-tance, of each violin. The instrument was suspended withnylon cables to have a free boundary condition measurementand decoupling the flexible vibration modes from the systemrigid motion [9]. The bridge bass side was excited using asmall impact hammer (5 g mass) and the response at the otherside was captured with a piezoelectric uni-axial accelerometer(0.5 g mass). At least five hammer hits were averaged foreach test to reduce the measurement noise [9]. A detail ofthe excitation and measurement positions is shown in Fig. 1,where also the little foam stripes used to damp the strings onboth sides of the bridge are visible.
The H1 estimator was adopted to derive the FrequencyResponse Function (FRF) data:
Hoi(ω) =Goi(ω)
Gii(ω), (1)
where Goi(ω) is the crossspectral density function betweenthe input driving force i and the output measured vibration o,whereas Gii(ω) is the autospectral density function of theinput force. Fig. 2 shows, as an example, the bridge mobilityof three tested violins. The coherence function γ, calculatedas
γ(ω) =|Goi(ω)|2
Goo(ω)Gii(ω), (2)
Proceedings of the 2017 International Symposium on Musical Acoustics, 18–22 June, Montreal, Canada Peer Reviewed Paper
80
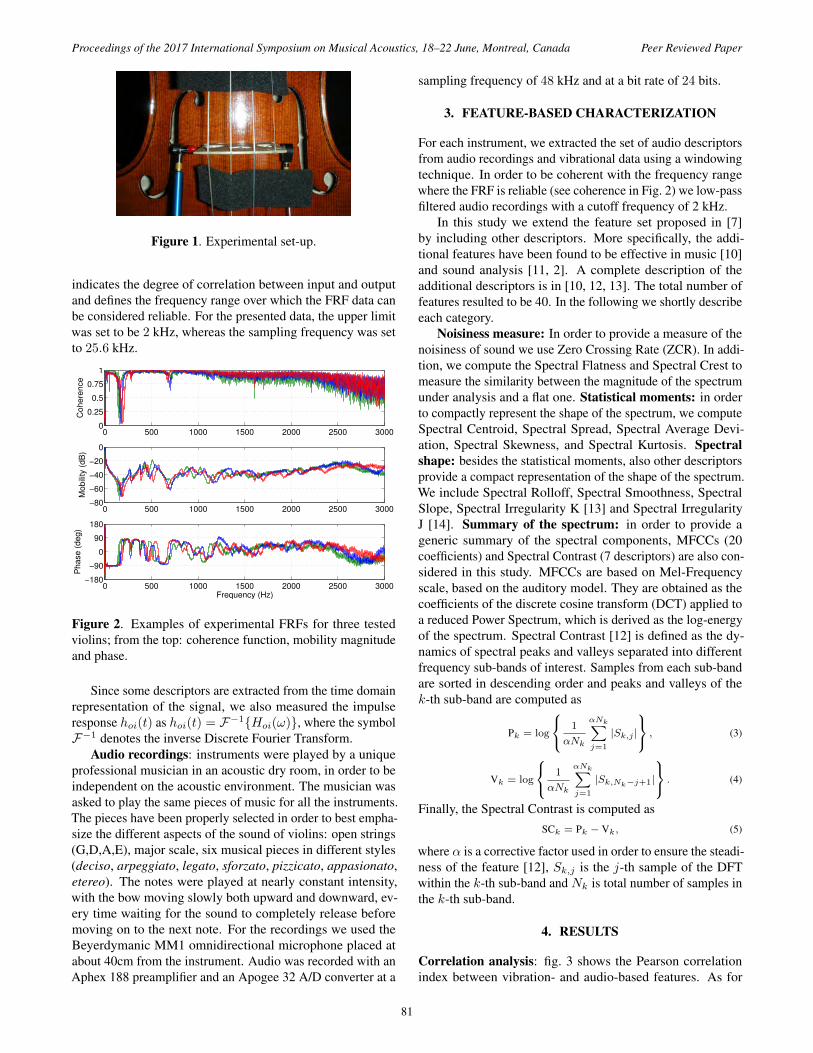
Figure 1. Experimental set-up.
indicates the degree of correlation between input and outputand defines the frequency range over which the FRF data canbe considered reliable. For the presented data, the upper limitwas set to be 2 kHz, whereas the sampling frequency was setto 25.6 kHz.
0 500 1000 1500 2000 2500 30000
0.25
0.5
0.75
1
Cohere
nce
0 500 1000 1500 2000 2500 3000−80
−60
−40
−20
0
Mobili
ty (
dB
)
0 500 1000 1500 2000 2500 3000−180
−90
0
90
180
Phase (
deg)
Frequency (Hz)
Figure 2. Examples of experimental FRFs for three testedviolins; from the top: coherence function, mobility magnitudeand phase.
Since some descriptors are extracted from the time domainrepresentation of the signal, we also measured the impulseresponse hoi(t) as hoi(t) = F−1{Hoi(ω)}, where the symbolF−1 denotes the inverse Discrete Fourier Transform.
Audio recordings: instruments were played by a uniqueprofessional musician in an acoustic dry room, in order to beindependent on the acoustic environment. The musician wasasked to play the same pieces of music for all the instruments.The pieces have been properly selected in order to best empha-size the different aspects of the sound of violins: open strings(G,D,A,E), major scale, six musical pieces in different styles(deciso, arpeggiato, legato, sforzato, pizzicato, appasionato,etereo). The notes were played at nearly constant intensity,with the bow moving slowly both upward and downward, ev-ery time waiting for the sound to completely release beforemoving on to the next note. For the recordings we used theBeyerdymanic MM1 omnidirectional microphone placed atabout 40cm from the instrument. Audio was recorded with anAphex 188 preamplifier and an Apogee 32 A/D converter at a
sampling frequency of 48 kHz and at a bit rate of 24 bits.
3. FEATURE-BASED CHARACTERIZATION
For each instrument, we extracted the set of audio descriptorsfrom audio recordings and vibrational data using a windowingtechnique. In order to be coherent with the frequency rangewhere the FRF is reliable (see coherence in Fig. 2) we low-passfiltered audio recordings with a cutoff frequency of 2 kHz.
In this study we extend the feature set proposed in [7]by including other descriptors. More specifically, the addi-tional features have been found to be effective in music [10]and sound analysis [11, 2]. A complete description of theadditional descriptors is in [10, 12, 13]. The total number offeatures resulted to be 40. In the following we shortly describeeach category.
Noisiness measure: In order to provide a measure of thenoisiness of sound we use Zero Crossing Rate (ZCR). In addi-tion, we compute the Spectral Flatness and Spectral Crest tomeasure the similarity between the magnitude of the spectrumunder analysis and a flat one. Statistical moments: in orderto compactly represent the shape of the spectrum, we computeSpectral Centroid, Spectral Spread, Spectral Average Devi-ation, Spectral Skewness, and Spectral Kurtosis. Spectralshape: besides the statistical moments, also other descriptorsprovide a compact representation of the shape of the spectrum.We include Spectral Rolloff, Spectral Smoothness, SpectralSlope, Spectral Irregularity K [13] and Spectral IrregularityJ [14]. Summary of the spectrum: in order to provide ageneric summary of the spectral components, MFCCs (20coefficients) and Spectral Contrast (7 descriptors) are also con-sidered in this study. MFCCs are based on Mel-Frequencyscale, based on the auditory model. They are obtained as thecoefficients of the discrete cosine transform (DCT) applied toa reduced Power Spectrum, which is derived as the log-energyof the spectrum. Spectral Contrast [12] is defined as the dy-namics of spectral peaks and valleys separated into differentfrequency sub-bands of interest. Samples from each sub-bandare sorted in descending order and peaks and valleys of thek-th sub-band are computed as
Pk = log
1
αNk
αNk∑
j=1
|Sk,j |
, (3)
Vk = log
1
αNk
αNk∑
j=1
|Sk,Nk−j+1|
. (4)
Finally, the Spectral Contrast is computed asSCk = Pk − Vk, (5)
where α is a corrective factor used in order to ensure the steadi-ness of the feature [12], Sk,j is the j-th sample of the DFTwithin the k-th sub-band and Nk is total number of samples inthe k-th sub-band.
4. RESULTS
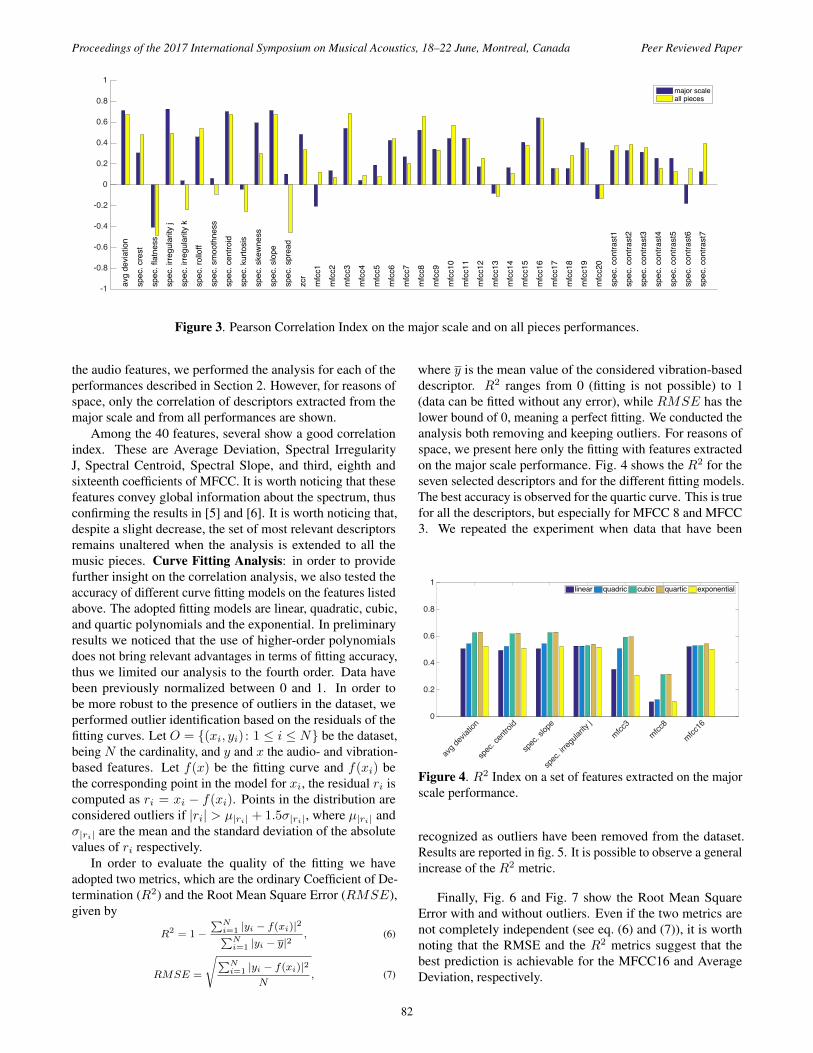
Correlation analysis: fig. 3 shows the Pearson correlationindex between vibration- and audio-based features. As for
Proceedings of the 2017 International Symposium on Musical Acoustics, 18–22 June, Montreal, Canada Peer Reviewed Paper
81
-1
-0.8
-0.6
-0.4
-0.2
0
0.2
0.4
0.6
0.8
1
avg
dev
iatio
n
spe
c. c
rest
spe
c. fl
atne
ss
spe
c. ir
regu
larit
y j
spe
c. ir
regu
larit
y k
spe
c. ro
lloff
spe
c. s
moo
thne
ss
spe
c. c
entro
id
spe
c. k
urto
sis
spe
c. s
kew
ness
spe
c. s
lope
spe
c. s
prea
d
zcr
mfc
c1
mfc
c2
mfc
c3
mfc
c4
mfc
c5
mfc
c6
mfc
c7
mfc
c8
mfc
c9
mfc
c10
mfc
c11
mfc
c12
mfc
c13
mfc
c14
mfc
c15
mfc
c16
mfc
c17
mfc
c18
mfc
c19
mfc
c20
spe
c. c
ontra
st1
spe
c. c
ontra
st2
spe
c. c
ontra
st3
spe
c. c
ontra
st4
spe
c. c
ontra
st5
spe
c. c
ontra
st6
spe
c. c
ontra
st7
major scaleall pieces
Figure 3. Pearson Correlation Index on the major scale and on all pieces performances.
the audio features, we performed the analysis for each of theperformances described in Section 2. However, for reasons ofspace, only the correlation of descriptors extracted from themajor scale and from all performances are shown.
Among the 40 features, several show a good correlationindex. These are Average Deviation, Spectral IrregularityJ, Spectral Centroid, Spectral Slope, and third, eighth andsixteenth coefficients of MFCC. It is worth noticing that thesefeatures convey global information about the spectrum, thusconfirming the results in [5] and [6]. It is worth noticing that,despite a slight decrease, the set of most relevant descriptorsremains unaltered when the analysis is extended to all themusic pieces. Curve Fitting Analysis: in order to providefurther insight on the correlation analysis, we also tested theaccuracy of different curve fitting models on the features listedabove. The adopted fitting models are linear, quadratic, cubic,and quartic polynomials and the exponential. In preliminaryresults we noticed that the use of higher-order polynomialsdoes not bring relevant advantages in terms of fitting accuracy,thus we limited our analysis to the fourth order. Data havebeen previously normalized between 0 and 1. In order tobe more robust to the presence of outliers in the dataset, weperformed outlier identification based on the residuals of thefitting curves. Let O = {(xi, yi) : 1 ≤ i ≤ N} be the dataset,being N the cardinality, and y and x the audio- and vibration-based features. Let f(x) be the fitting curve and f(xi) bethe corresponding point in the model for xi, the residual ri iscomputed as ri = xi − f(xi). Points in the distribution areconsidered outliers if |ri| > µ|ri| + 1.5σ|ri|, where µ|ri| andσ|ri| are the mean and the standard deviation of the absolutevalues of ri respectively.
In order to evaluate the quality of the fitting we haveadopted two metrics, which are the ordinary Coefficient of De-termination (R2) and the Root Mean Square Error (RMSE),given by
R2 = 1−∑Ni=1 |yi − f(xi)|2∑Ni=1 |yi − y|2
, (6)
RMSE =
√∑Ni=1 |yi − f(xi)|2
N, (7)
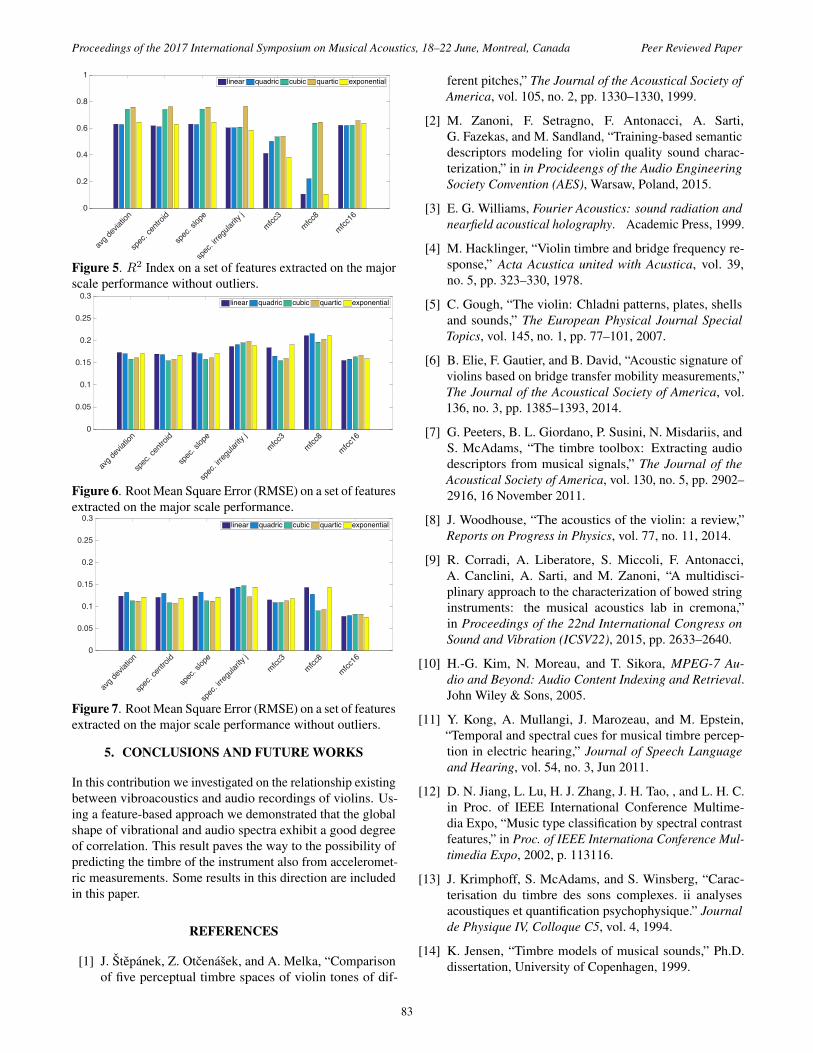
where y is the mean value of the considered vibration-baseddescriptor. R2 ranges from 0 (fitting is not possible) to 1(data can be fitted without any error), while RMSE has thelower bound of 0, meaning a perfect fitting. We conducted theanalysis both removing and keeping outliers. For reasons ofspace, we present here only the fitting with features extractedon the major scale performance. Fig. 4 shows the R2 for theseven selected descriptors and for the different fitting models.The best accuracy is observed for the quartic curve. This is truefor all the descriptors, but especially for MFCC 8 and MFCC3. We repeated the experiment when data that have been
avg d
eviat
ion
spec
. cen
troid
spec
. slop
e
spec
. irreg
ularity
jmfcc
3mfcc
8
mfcc16
0
0.2
0.4
0.6
0.8
1R2
linear quadric cubic quartic exponential
Figure 4. R2 Index on a set of features extracted on the majorscale performance.
recognized as outliers have been removed from the dataset.Results are reported in fig. 5. It is possible to observe a generalincrease of the R2 metric.
Finally, Fig. 6 and Fig. 7 show the Root Mean SquareError with and without outliers. Even if the two metrics arenot completely independent (see eq. (6) and (7)), it is worthnoting that the RMSE and the R2 metrics suggest that thebest prediction is achievable for the MFCC16 and AverageDeviation, respectively.
Proceedings of the 2017 International Symposium on Musical Acoustics, 18–22 June, Montreal, Canada Peer Reviewed Paper
82
avg d
eviat
ion
spec
. cen
troid
spec
. slop
e
spec
. irreg
ularity
jmfcc
3mfcc
8
mfcc16
0
0.2
0.4
0.6
0.8
1R2 - Outliers deleted
linear quadric cubic quartic exponential
Figure 5. R2 Index on a set of features extracted on the majorscale performance without outliers.
avg d
eviat
ion
spec
. cen
troid
spec
. slop
e
spec
. irreg
ularity
jmfcc
3mfcc
8
mfcc16
0
0.05
0.1
0.15
0.2
0.25
0.3RMSElinear quadric cubic quartic exponential
Figure 6. Root Mean Square Error (RMSE) on a set of featuresextracted on the major scale performance.
avg d
eviat
ion
spec
. cen
troid
spec
. slop
e
spec
. irreg
ularity
jmfcc
3mfcc
8
mfcc16
0
0.05
0.1
0.15
0.2
0.25
0.3RMSE - Outliers deleted
linear quadric cubic quartic exponential
Figure 7. Root Mean Square Error (RMSE) on a set of featuresextracted on the major scale performance without outliers.
5. CONCLUSIONS AND FUTURE WORKS
In this contribution we investigated on the relationship existingbetween vibroacoustics and audio recordings of violins. Us-ing a feature-based approach we demonstrated that the globalshape of vibrational and audio spectra exhibit a good degreeof correlation. This result paves the way to the possibility ofpredicting the timbre of the instrument also from acceleromet-ric measurements. Some results in this direction are includedin this paper.
REFERENCES
[1] J. Stepanek, Z. Otcenasek, and A. Melka, “Comparisonof five perceptual timbre spaces of violin tones of dif-
ferent pitches,” The Journal of the Acoustical Society ofAmerica, vol. 105, no. 2, pp. 1330–1330, 1999.
[2] M. Zanoni, F. Setragno, F. Antonacci, A. Sarti,G. Fazekas, and M. Sandland, “Training-based semanticdescriptors modeling for violin quality sound charac-terization,” in in Procideengs of the Audio EngineeringSociety Convention (AES), Warsaw, Poland, 2015.
[3] E. G. Williams, Fourier Acoustics: sound radiation andnearfield acoustical holography. Academic Press, 1999.
[4] M. Hacklinger, “Violin timbre and bridge frequency re-sponse,” Acta Acustica united with Acustica, vol. 39,no. 5, pp. 323–330, 1978.
[5] C. Gough, “The violin: Chladni patterns, plates, shellsand sounds,” The European Physical Journal SpecialTopics, vol. 145, no. 1, pp. 77–101, 2007.
[6] B. Elie, F. Gautier, and B. David, “Acoustic signature ofviolins based on bridge transfer mobility measurements,”The Journal of the Acoustical Society of America, vol.136, no. 3, pp. 1385–1393, 2014.
[7] G. Peeters, B. L. Giordano, P. Susini, N. Misdariis, andS. McAdams, “The timbre toolbox: Extracting audiodescriptors from musical signals,” The Journal of theAcoustical Society of America, vol. 130, no. 5, pp. 2902–2916, 16 November 2011.
[8] J. Woodhouse, “The acoustics of the violin: a review,”Reports on Progress in Physics, vol. 77, no. 11, 2014.
[9] R. Corradi, A. Liberatore, S. Miccoli, F. Antonacci,A. Canclini, A. Sarti, and M. Zanoni, “A multidisci-plinary approach to the characterization of bowed stringinstruments: the musical acoustics lab in cremona,”in Proceedings of the 22nd International Congress onSound and Vibration (ICSV22), 2015, pp. 2633–2640.
[10] H.-G. Kim, N. Moreau, and T. Sikora, MPEG-7 Au-dio and Beyond: Audio Content Indexing and Retrieval.John Wiley & Sons, 2005.
[11] Y. Kong, A. Mullangi, J. Marozeau, and M. Epstein,“Temporal and spectral cues for musical timbre percep-tion in electric hearing,” Journal of Speech Languageand Hearing, vol. 54, no. 3, Jun 2011.
[12] D. N. Jiang, L. Lu, H. J. Zhang, J. H. Tao, , and L. H. C.in Proc. of IEEE International Conference Multime-dia Expo, “Music type classification by spectral contrastfeatures,” in Proc. of IEEE Internationa Conference Mul-timedia Expo, 2002, p. 113116.
[13] J. Krimphoff, S. McAdams, and S. Winsberg, “Carac-terisation du timbre des sons complexes. ii analysesacoustiques et quantification psychophysique.” Journalde Physique IV, Colloque C5, vol. 4, 1994.
[14] K. Jensen, “Timbre models of musical sounds,” Ph.D.dissertation, University of Copenhagen, 1999.
Proceedings of the 2017 International Symposium on Musical Acoustics, 18–22 June, Montreal, Canada Peer Reviewed Paper
83