Embed Size (px)
Citation preview

This content has been downloaded from IOPscience. Please scroll down to see the full text.
Download details:
IP Address: 96.83.66.233
This content was downloaded on 22/12/2015 at 18:14
Please note that terms and conditions apply.
Quantitative evaluation of erosive cavitation pressure field from pits in material: fact or myth?
View the table of contents for this issue, or go to the journal homepage for more
2015 J. Phys.: Conf. Ser. 656 012045
(http://iopscience.iop.org/1742-6596/656/1/012045)
Home Search Collections Journals About Contact us My IOPscience
Quantitative evaluation of erosive cavitation pressure field
from pits in material: fact or myth?
J-K Choi1 and G L Chahine
DYNAFLOW, INC.
10621-J Iron Bridge Road, Jessup, Maryland, 20794, USA
E-mail: [email protected]
Abstract. Material pitting in a cavitating flow has been used for a long time as an indicator of
the vague ‘cavitation intensity’ concept. Periodically, some researchers suggest pitting tests as
a “simple” means to provide quantitative measurements of the amplitude of the impulsive
pressures in the cavitation field, especially when combined with Tabor’s formula or with
simple finite element computations with static loads. This paper examines the viability of such
a method using fully coupled bubble dynamics and material response, and strongly concludes
that the commonly accepted idea is a myth, as different loading scenarios with the same
amplitude of the cavitation impulsive pressure result in different pit aspect ratios.
1. Introduction
In order to characterize cavitation erosive fields for different operating conditions (e.g. different flow
speeds, cavitation sources, or small scale laboratory accelerated erosion tests versus full scale real
operation), a reliable method to evaluate the cavitation field ‘intensity’ is needed. As expanded upon
in [1] the cavitation field intensity is defined by a distribution function, N(Ppeak), where N is the
number of impulsive pressure peaks per unit exposed area and unit time of given amplitude, Ppeak . To
this, we should add the distribution of time widths of the pressure peaks [2]. Acoustic pressure
measurements are probably the best that can be done presently to determine this intensity despite
limitations in the high frequency response and in the size of the sensors [1,2]. However, with advances
in instrumentation and miniaturization, these limitations will be reduced over time. Another method,
which has been used for at least a whole century [3,4] is to “use the material as the pressure sensor”.
Short duration cavitation pitting tests within the incubation period, where non-overlapping pits are
produced, are conducted and the peak pressures are deduced from the pit geometric characteristics
using the Tabor relationship [1,5]. Recently, finite element method analysis was also conducted to
obtain a substitute to Tabor equations [6] using however the same basis for the load, i.e. time
independent idealized constant pressure loads. Since in such approaches the load is also characterized
by over-simplified parameters, almost a one-to-one relationship between the loads and the pit
geometry characteristics is also found.
In order to investigate more rigorously whether cavitation pit geometric characteristics can be used
along with Tabor relationship to deduce the pressure amplitude responsible for the pit, we conducted
fully coupled computations of bubble dynamics/material response and compared the Tabor-predicted
1 To whom any correspondence should be addressed.
9th International Symposium on Cavitation (CAV2015) IOP PublishingJournal of Physics: Conference Series 656 (2015) 012045 doi:10.1088/1742-6596/656/1/012045
Content from this work may be used under the terms of the Creative Commons Attribution 3.0 licence. Any further distributionof this work must maintain attribution to the author(s) and the title of the work, journal citation and DOI.
Published under licence by IOP Publishing Ltd 1

peak pressure from the resulting pit to the actually peak pressure generated by the bubble collapse and
applied to the material. The numerical approach is documented with details in [7–9].
2. Analytic relation between strain and pit geometry
In Tabor’s approach [5], a pit is assumed to be a spherical indentation
characterized by its diameter D and depth h (figure 1) and the mean
strain, m , in the material around the pit can be estimated from:
2
/0.1 0.8
1 4 /m
D h D
R h D
, (1)
where R is the sphere radius that fits in the pit.
The maximum strain is related to the mean
strain after assuming an exponential strain
distribution in the depth direction [10] by:
max 1 ,m (2)
where is the exponent of the exponential strain distribution, which can be
obtained experimentally. The values reported in [7,10] are used in this study.
From the maximum strain, the maximum stress can be deduced using the
stress-strain curve of the material. The maximum stress occurs at the surface
of the material, and in this approach is assumed to be equal to the peak of the
impulsive pressure at the material surface.
3. FSI simulations of pit formation and pit geometry
In order to examine the validity of inferring the magnitude of the impulsive
pressure generated by the collapse of a bubble, which resulted in the
analyzed pit, we conducted an extensive series of finite element simulations
of pit formation in a material exposed to two types of loads: a) fully coupled
fluid structure interaction (FSI) simulations of bubble dynamics and material
response; b) material deformation due to synthetic loading configurations
where we varied systematically the amplitude, space extent and duration of
the load [11]. The FSI simulations were conducted using well-validated 3D
bubble dynamics codes and procedures [7–9], which modelled bubble shape
deformation, reentrant jet development, compressible impact of the jet on the
material with generation of a water hammer impact and emission of a shock
wave. Bubble size, standoff from wall, and collapse driving pressure
functions were varied to cover a range of FSI conditions. Figure 2 illustrates this for a particular
condition taken from [8]. Figure 2a shows bubble outlines at
different instants during the bubble collapse. Figure 2b and
figure 2c show bubble shapes and pressure contours with very
high pressures generated respectively by liquid-liquid impact at
reentrant jet touchdown and by jet-wall impact. The liquid-liquid
impact event generates a localized high pressure region which
expands quasi spherically and propagate to the wetted material
surface (first pressure peak in figure 3). The bubble ring left
after the jet touchdown shrinks, then collapses and generates
another high pressure wave (second peak in figure 3).
The dynamics of the material is modeled by a non-linear
finite element method. Figure 3 illustrates the FSI computations
with the pressures generated at the material surface center by the
collapsing bubble and the corresponding time dependent
response of the material illustrated by the development of the
indentation depth with time. Due to the high pressure generated
Figure 1. Sketch of
idealized spherical pit.
Figure 2. Example
bubble shapes and
pressure field during
bubble collapse near a
wall [8].
Figure 3. Time history of pressure
and vertical displacement of
Al 7075 following the collapse of
a cavitation bubble [8].
h
R
D
t=0.05 s
t=0.4 s
t=0.0 s
9th International Symposium on Cavitation (CAV2015) IOP PublishingJournal of Physics: Conference Series 656 (2015) 012045 doi:10.1088/1742-6596/656/1/012045
2
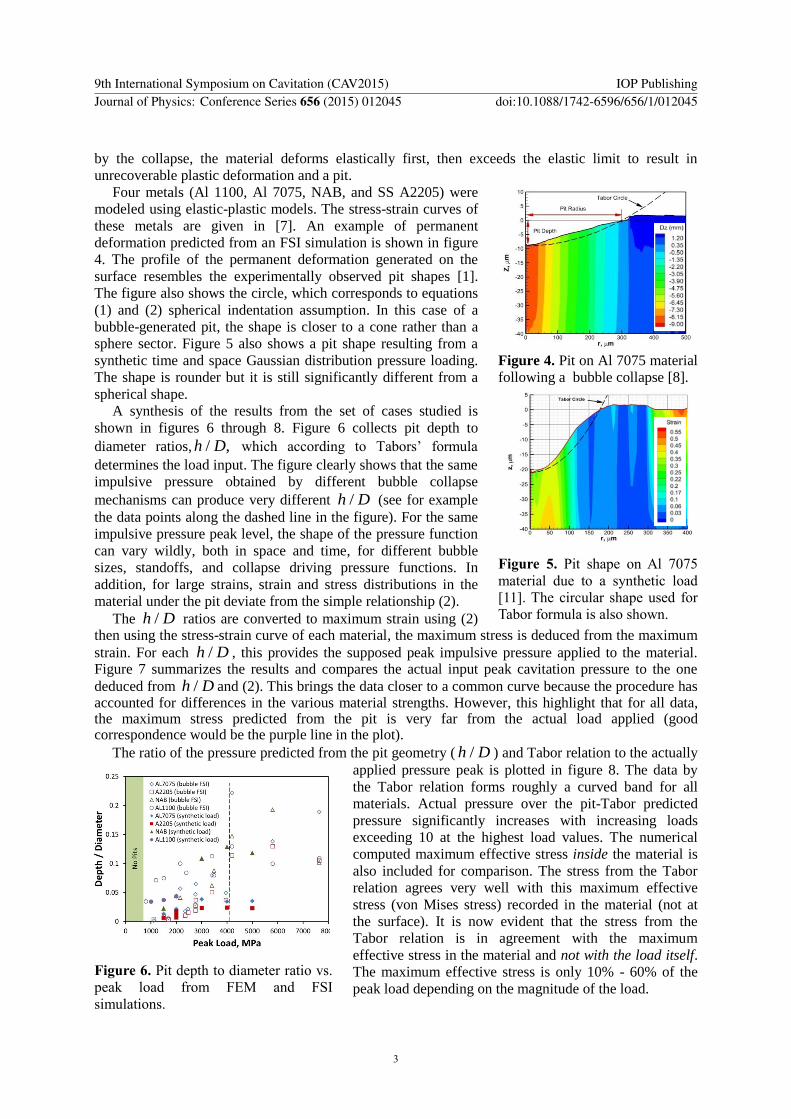
by the collapse, the material deforms elastically first, then exceeds the elastic limit to result in
unrecoverable plastic deformation and a pit.
Four metals (Al 1100, Al 7075, NAB, and SS A2205) were
modeled using elastic-plastic models. The stress-strain curves of
these metals are given in [7]. An example of permanent
deformation predicted from an FSI simulation is shown in figure
4. The profile of the permanent deformation generated on the
surface resembles the experimentally observed pit shapes [1].
The figure also shows the circle, which corresponds to equations
(1) and (2) spherical indentation assumption. In this case of a
bubble-generated pit, the shape is closer to a cone rather than a
sphere sector. Figure 5 also shows a pit shape resulting from a
synthetic time and space Gaussian distribution pressure loading.
The shape is rounder but it is still significantly different from a
spherical shape.
A synthesis of the results from the set of cases studied is
shown in figures 6 through 8. Figure 6 collects pit depth to
diameter ratios, / ,h D which according to Tabors’ formula
determines the load input. The figure clearly shows that the same
impulsive pressure obtained by different bubble collapse
mechanisms can produce very different /h D (see for example
the data points along the dashed line in the figure). For the same
impulsive pressure peak level, the shape of the pressure function
can vary wildly, both in space and time, for different bubble
sizes, standoffs, and collapse driving pressure functions. In
addition, for large strains, strain and stress distributions in the
material under the pit deviate from the simple relationship (2).
The /h D ratios are converted to maximum strain using (2)then using the stress-strain curve of each material, the maximum stress is deduced from the maximum
strain. For each /h D , this provides the supposed peak impulsive pressure applied to the material. Figure 7 summarizes the results and compares the actual input peak cavitation pressure to the one
deduced from /h D and (2). This brings the data closer to a common curve because the procedure has accounted for differences in the various material strengths. However, this highlight that for all data, the maximum stress predicted from the pit is very far from the actual load applied (good correspondence would be the purple line in the plot).
The ratio of the pressure predicted from the pit geometry ( /h D ) and Tabor relation to the actually
applied pressure peak is plotted in figure 8. The data by
the Tabor relation forms roughly a curved band for all
materials. Actual pressure over the pit-Tabor predicted
pressure significantly increases with increasing loads
exceeding 10 at the highest load values. The numerical
computed maximum effective stress inside the material is
also included for comparison. The stress from the Tabor
relation agrees very well with this maximum effective
stress (von Mises stress) recorded in the material (not at
the surface). It is now evident that the stress from the
Tabor relation is in agreement with the maximum
effective stress in the material and not with the load itself.
The maximum effective stress is only 10% - 60% of the
peak load depending on the magnitude of the load.
Figure 4. Pit on Al 7075 material
following a bubble collapse [8].
Figure 5. Pit shape on Al 7075
material due to a synthetic load
[11]. The circular shape used for
Tabor formula is also shown.
Figure 6. Pit depth to diameter ratio vs.
peak load from FEM and FSI
simulations.
9th International Symposium on Cavitation (CAV2015) IOP PublishingJournal of Physics: Conference Series 656 (2015) 012045 doi:10.1088/1742-6596/656/1/012045
3

4. Conclusions
Pits forming on a material from the impulsive pressure
loading resulting from bubble collapse were simulated
numerically. This enabled careful examination of the
suitability of using material pits measurements and
Tabor’s analytic relation to infer pressure peaks from the
pit geometry. The study clearly showed that this
approach is very inaccurate and actually provides the
maximum effective (von Mises) stress inside the
material and not the amplitude of the cavitation pressure
peak. Additional information such as the time and space
dependent pit characteristics would be needed to attempt
a better correlation.
Acknowledgments
This work was supported by the Office of Naval
Research, Contract N00014-11-C-0378 Dr. Ki-Han Kim
monitor. We gratefully acknowledge this support.
References
[1] Kim K-H, Chahine G L, Franc J-P and Karimi A
2014 Advanced Experimental and Numerical
Techniques for Cavitation Erosion Prediction,
Series Fluid Mechanics and Its Applications vol
106, ed K-H Kim, G L Chahine, J-P Franc and A
Karimi (Springer, Berlin, Germany)
[2] Singh S, Choi J-K and Chahine G L 2013
Characterization of Cavitation Fields From
Measured Pressure Signals of Cavitating Jets and
Ultrasonic Horns J. Fluids Eng. 135 9111–91302
[3] Knapp R T 1955 Recent investigations of the mechanics of cavitation and cavitation damage
Trans. Am. Soc. Mech. Eng. 77 1045–54
[4] Parsons C A and Cook S S 1919 Investigation into causes of corrosion or erosion of propellers
J. Am. Soc. Nav. Eng. 31 536–41
[5] Tabor D 1951 The Hardness of Metals (Oxford, United Kingdom: Clarendon Press)
[6] Pöhl F, Mottyll S, Skoda R and Huth S 2015 Evaluation of cavitation-induced pressure loads
applied to material surfaces by finite-element-assisted pit analysis and numerical investigation
of the elasto-plastic deformation of metallic materials Wear
[7] Chahine G L 2014 Modeling of Cavitation Dynamics and Interaction with Material Advanced
Experimental and Numerical Techniques for Cavitation Erosion Prediction ed A Kim, K-H,
Chahine, G L, Franc, J-P, Karimi (Berlin: Springer) pp 123–73
[8] Hsiao C-T, Jayaprakash A, Kapahi A and Choi J-K 2014 Modeling of Material Pitting from
Cavitation Bubble Collapse J. Fluid Mech. 755 142–75
[9] Chahine G L, Kapahi A, Choi J-K and Hsiao C-T 2015 Modeling of Surface Cleaning by
Cavitation Bubble Dynamics and Collapse Ultrason. Sonochem. 10.1016/j.
[10] Karimi A and Franc J-P 2014 Modeling of material response Advanced Experimental and
Numerical Techniques for Cavitation Erosion Predicition ed K-H Kim, G . Chahine, J-P Franc
and A Karimi (Springer) pp 163–80
[11] Choi J-K, Jayaprakash A, Kapahi A, Hsiao C-T and Chahine G L 2014 Relationship between
space and time characteristics of cavitation impact pressures and resulting pits in materials J.
Mater. Sci. 49 3034–51
Figure 7. Comparison of the pressure
deduced from Tabor pit analysis and the
actual pressure applied to the material.
Figure 8. Ratio of the Tabor pit analysis
pressure to the actual cavitation peak
pressure.
9th International Symposium on Cavitation (CAV2015) IOP PublishingJournal of Physics: Conference Series 656 (2015) 012045 doi:10.1088/1742-6596/656/1/012045
4


![Visualization of Unsteady Behavior of Cavitation in ... · cavitation state, transition-cavitation state, and super-cavitation state in the orifice throat [5]. Under relative high](https://img.pdfslide.us/doc/110x75/5b4f673e7f8b9a166e8c4c74/visualization-of-unsteady-behavior-of-cavitation-in-cavitation-state-transition-cavitation.jpg)