Embed Size (px)
Citation preview
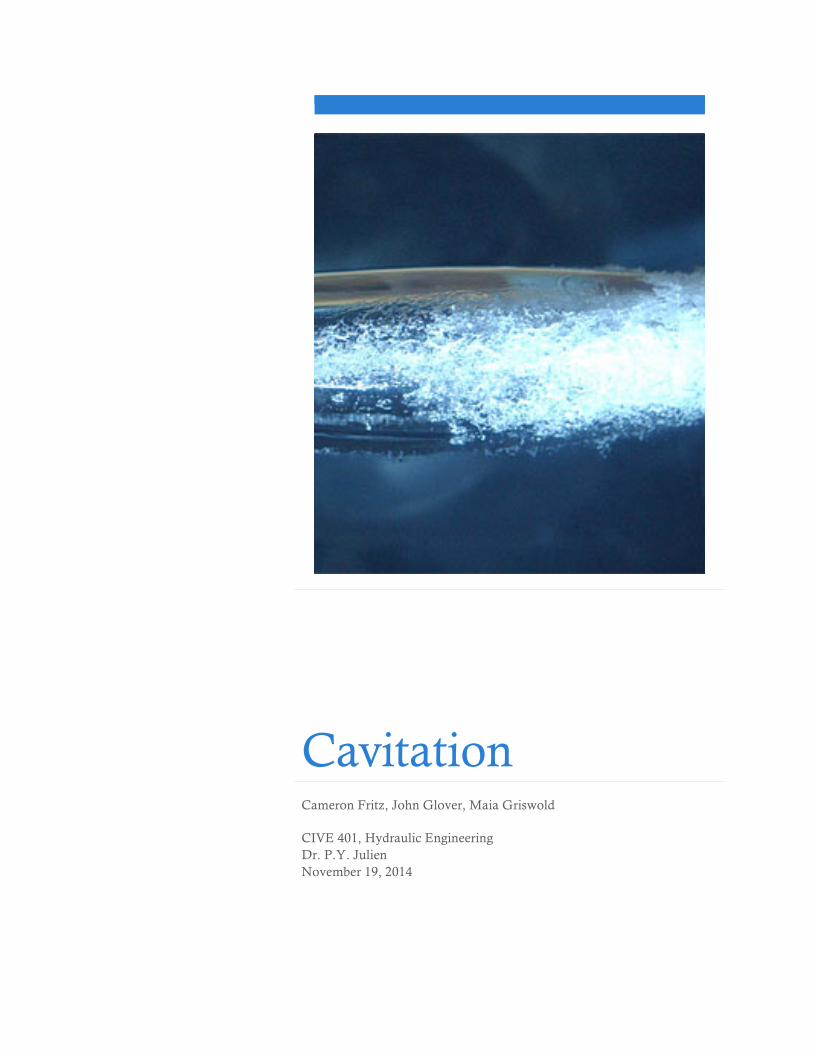
Cavitation Cameron Fritz, John Glover, Maia Griswold
CIVE 401, Hydraulic Engineering Dr. P.Y. Julien November 19, 2014
Cavitation 2
Table of Contents
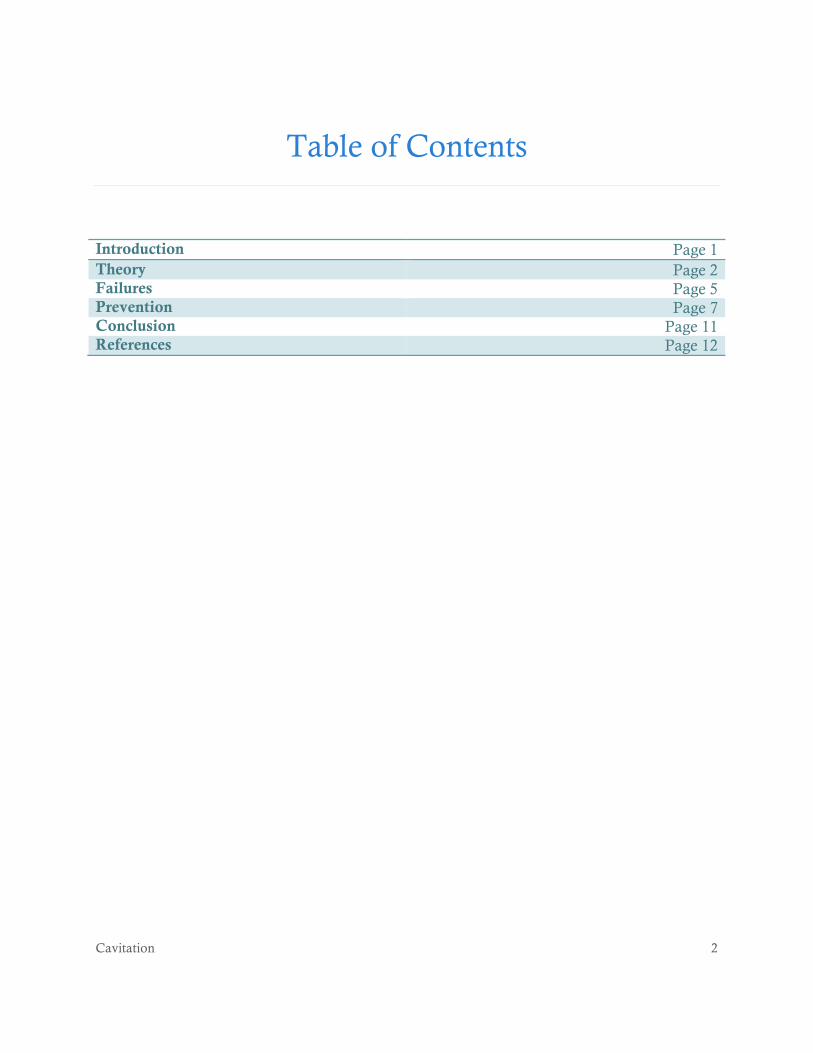
Introduction Page 1 Theory Page 2 Failures Page 5 Prevention Page 7 Conclusion Page 11 References Page 12
Fritz, Glover, Griswold
Cavitation 1
Cavitation
Introduction
Cavitation is the occurrence of small bubbles in a hydraulic system due to a pressure
decrease such that the pressure in the water is less than vapor pressure. When water
pressure is lower than vapor pressure, the water vaporizes within the liquid and small
bubbles are formed. Pressure of the liquid around the bubbles causes the bubbles to then
collapse which releases energy. In a hydraulic system, cavitation releases so much energy
that damage and erosion can occur on the solid aspects of the system. We can see the
negative results of cavitation in pumps, turbines and dams.
For any hydraulic system, cavitation must be taken into consideration both during the
design process as well as after the system is in place. Engineers need to routinely check for
cavitation damage during the life of the system. If cavitation occurs and is not caught
quickly colossal damage can occur. An example of this is outlined in the tunnel collapse of
1974 during the construction process of the Tarbela Dam in Pakistan. Prevention of
cavitation is essential for the success and continued operation of any hydraulic system. An
outline of theory, failures and prevention is detailed in the following report.
Cavitation 2
Theory
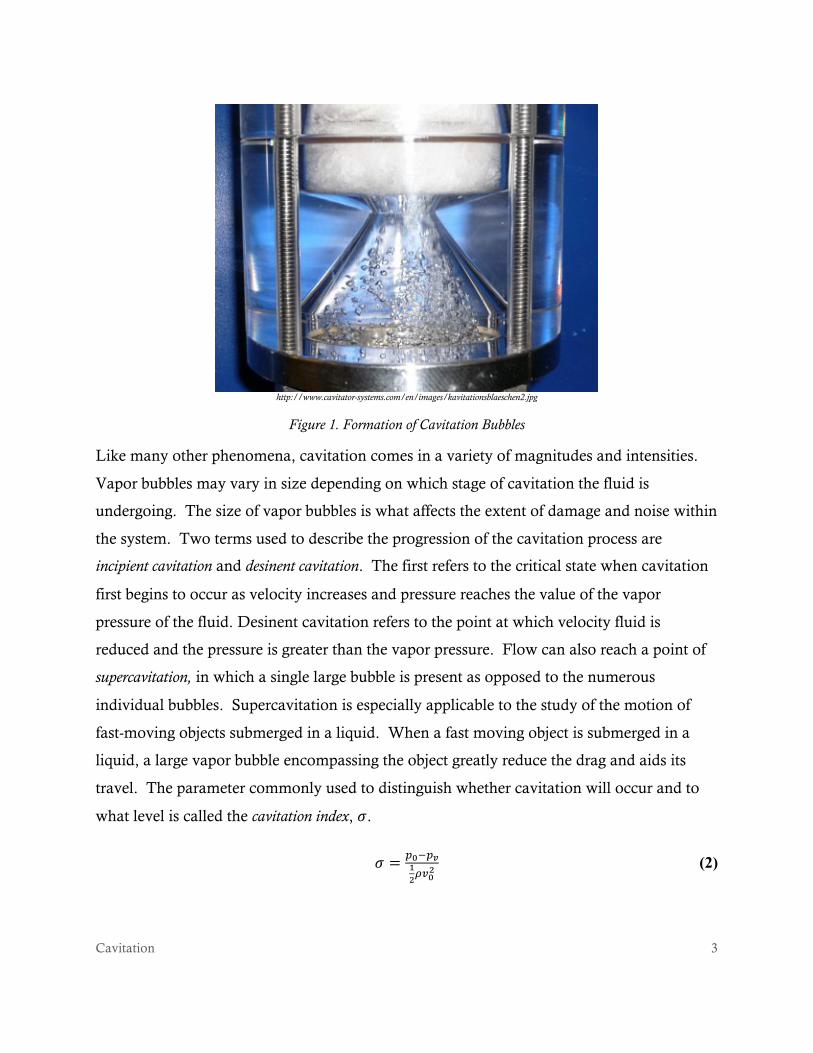
Cavitation is a phenomenon that occurs when the pressure within a flowing fluid reaches
the vapor pressure of the fluid, resulting in the formation of vapor bubbles. It is generally
characterized by a loud crackling noise and a “cloud” of vapor bubbles that form where the
cavitation is initiated (see Figure 1). These audible and visible signs, along with damage to
surfaces within the pipe, are often the most recognizable aspects of cavitation. There are two
different types of cavitation, depending on the properties of the vapor voids: vaporous
cavitation when the bubbles consist of water vapor and gaseous cavitation when the bubbles
contain gasses other than water vapor. Cavitation occurs due to a pressure drop as a result
from an increase in the velocity of the fluid through a specific zone, often as a result of a
decrease in the cross sectional area of the flow. Since pressure decreases at higher altitudes
cavitation can also occur with an increase in the elevation of the hydraulic system. This
concept is explicitly expressed by Bernoulli’s Equation (Eqn. 1), in which it is evident that
an increase in velocity or elevation on either side of the equation will result in a decrease in
the associated pressure in order to maintain equilibrium (constant total head).
!!!+ !!!
!"+ z! =
!!!+ !!!
!"+ z! (1)
Cavitation is often confused with the process of boiling, which is a similar phenomenon
with several key differences. During the boiling process, the temperature of water is
increased while maintaining constant external pressure (e.g., an open pot on a stove). As
the water begins to undergo a phase change once the temperature reaches the boiling point,
with vapor bubbles forming and collapsing when they reach the surface. Cavitation is
similar in the way that it too consists of water changing from liquid to vapor state. However,
the primary difference is that boiling occurs by changing the temperature while holding the
pressure constant, and cavitation occurs by changing the pressure while holding the
temperature constant.
Cavitation 3
http://www.cavitator-systems.com/en/images/kavitationsblaeschen2.jpg
Figure 1. Formation of Cavitation Bubbles Like many other phenomena, cavitation comes in a variety of magnitudes and intensities.
Vapor bubbles may vary in size depending on which stage of cavitation the fluid is
undergoing. The size of vapor bubbles is what affects the extent of damage and noise within
the system. Two terms used to describe the progression of the cavitation process are
incipient cavitation and desinent cavitation. The first refers to the critical state when cavitation
first begins to occur as velocity increases and pressure reaches the value of the vapor
pressure of the fluid. Desinent cavitation refers to the point at which velocity fluid is
reduced and the pressure is greater than the vapor pressure. Flow can also reach a point of
supercavitation, in which a single large bubble is present as opposed to the numerous
individual bubbles. Supercavitation is especially applicable to the study of the motion of
fast-moving objects submerged in a liquid. When a fast moving object is submerged in a
liquid, a large vapor bubble encompassing the object greatly reduce the drag and aids its
travel. The parameter commonly used to distinguish whether cavitation will occur and to
what level is called the cavitation index, 𝜎.
𝜎 = !!!!!!!!!!
! (2)
Cavitation 4
The smaller the cavitation index, the greater the likelihood of cavitation. When 𝜎 remains
greater than 𝜎! (incipient cavitation number) cavitation will not take place.
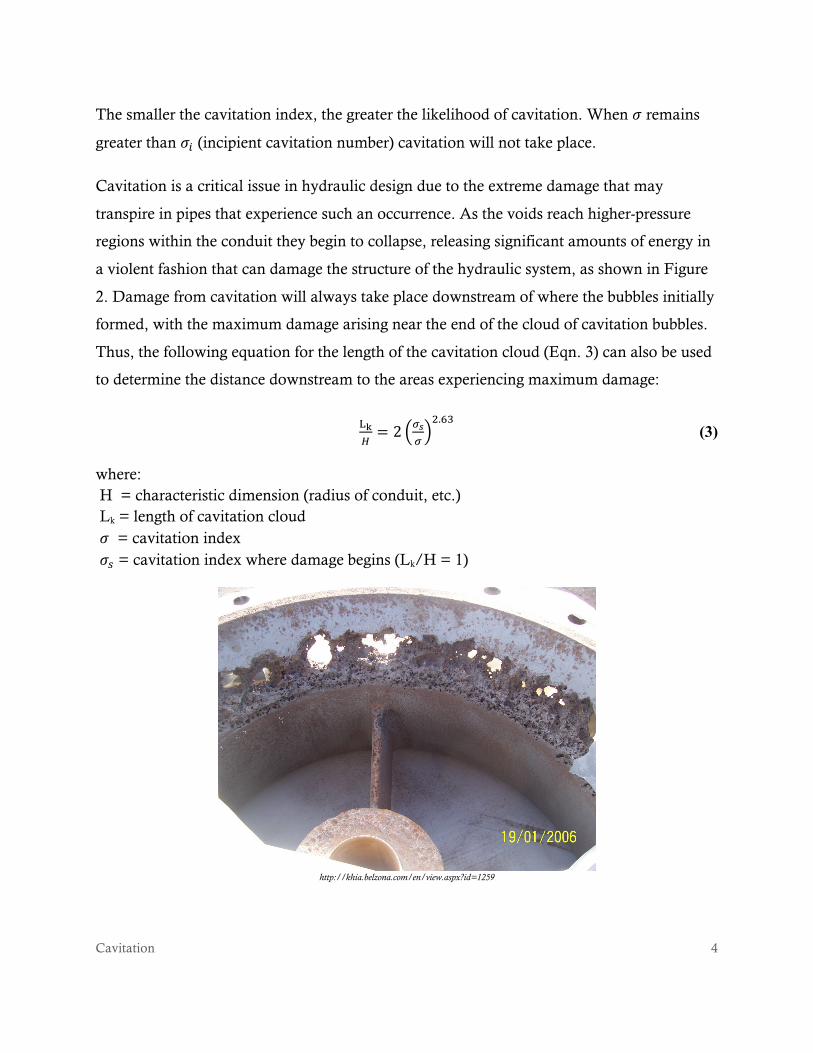
Cavitation is a critical issue in hydraulic design due to the extreme damage that may
transpire in pipes that experience such an occurrence. As the voids reach higher-pressure
regions within the conduit they begin to collapse, releasing significant amounts of energy in
a violent fashion that can damage the structure of the hydraulic system, as shown in Figure
2. Damage from cavitation will always take place downstream of where the bubbles initially
formed, with the maximum damage arising near the end of the cloud of cavitation bubbles.
Thus, the following equation for the length of the cavitation cloud (Eqn. 3) can also be used
to determine the distance downstream to the areas experiencing maximum damage:
!!!= 2 !!
!
!.!" (3)
where: H = characteristic dimension (radius of conduit, etc.) Lk = length of cavitation cloud 𝜎 = cavitation index 𝜎! = cavitation index where damage begins (Lk/H = 1)
http://khia.belzona.com/en/view.aspx?id=1259
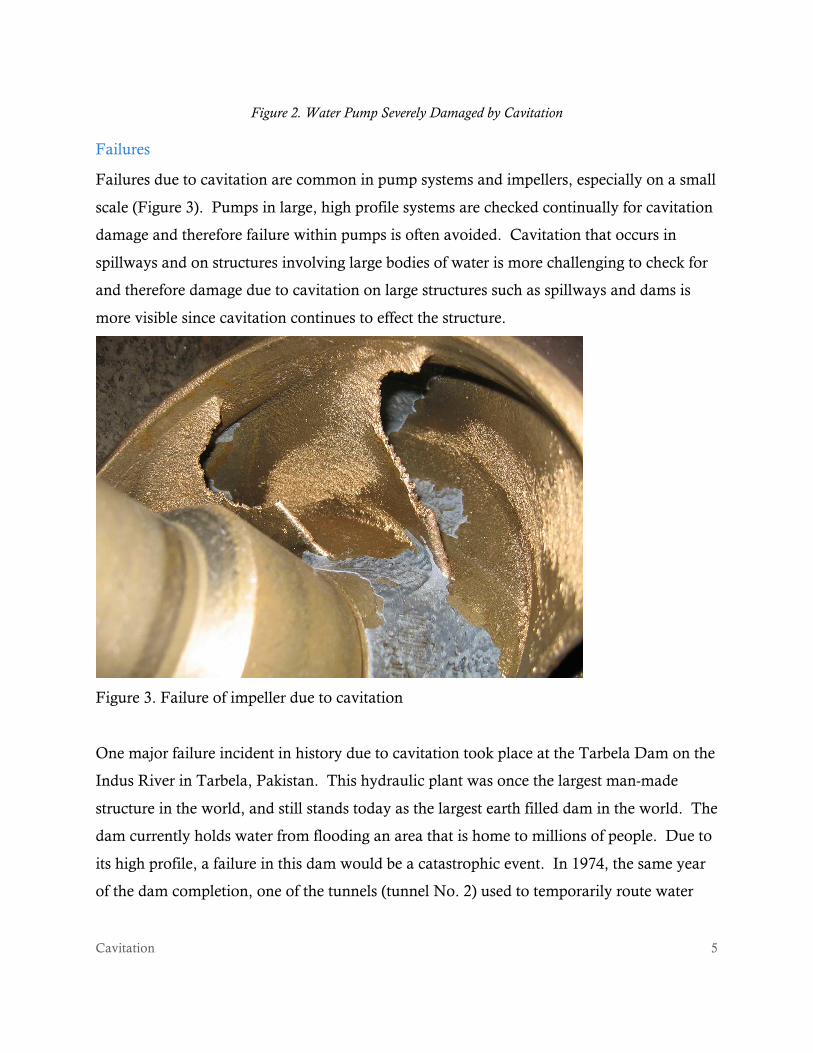
Cavitation 5
Figure 2. Water Pump Severely Damaged by Cavitation
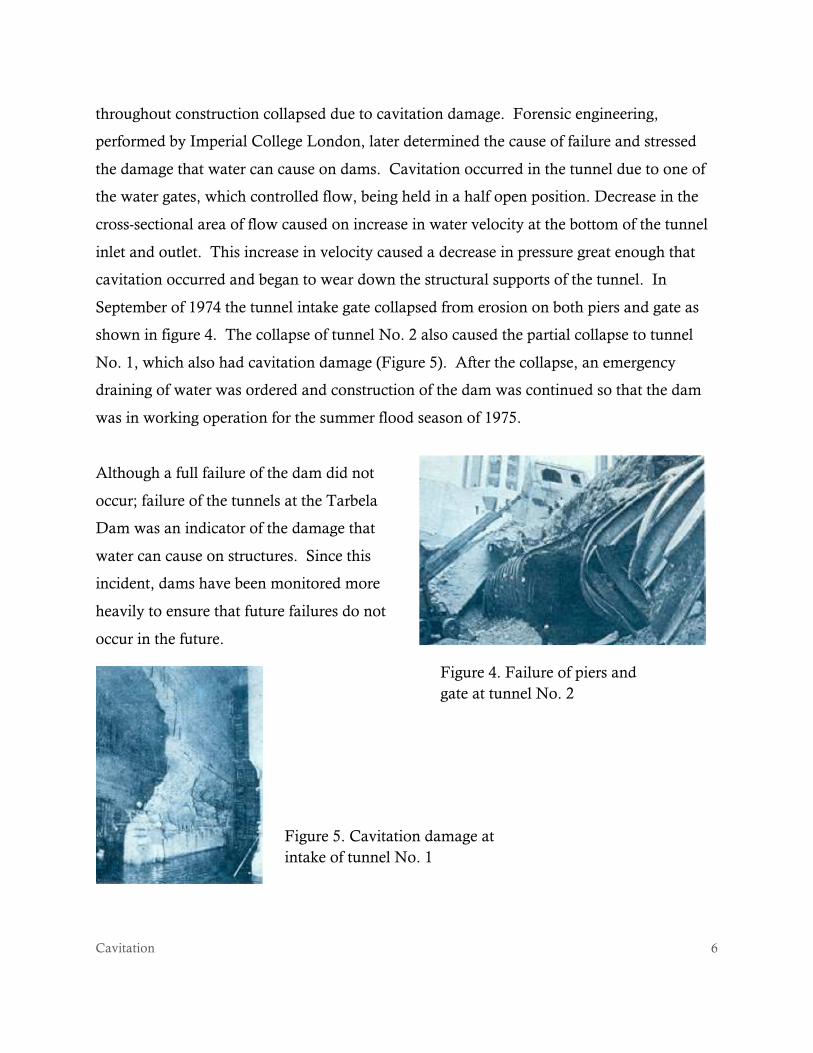
Failures
Failures due to cavitation are common in pump systems and impellers, especially on a small
scale (Figure 3). Pumps in large, high profile systems are checked continually for cavitation
damage and therefore failure within pumps is often avoided. Cavitation that occurs in
spillways and on structures involving large bodies of water is more challenging to check for
and therefore damage due to cavitation on large structures such as spillways and dams is
more visible since cavitation continues to effect the structure.
Figure 3. Failure of impeller due to cavitation
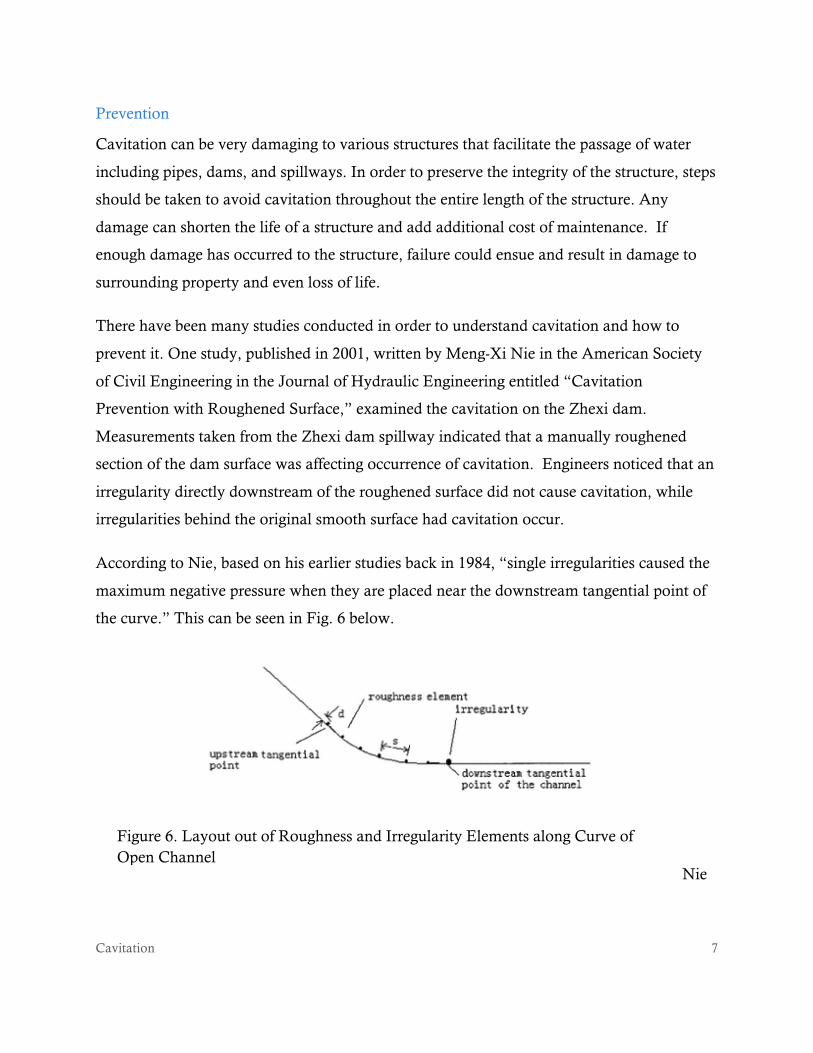
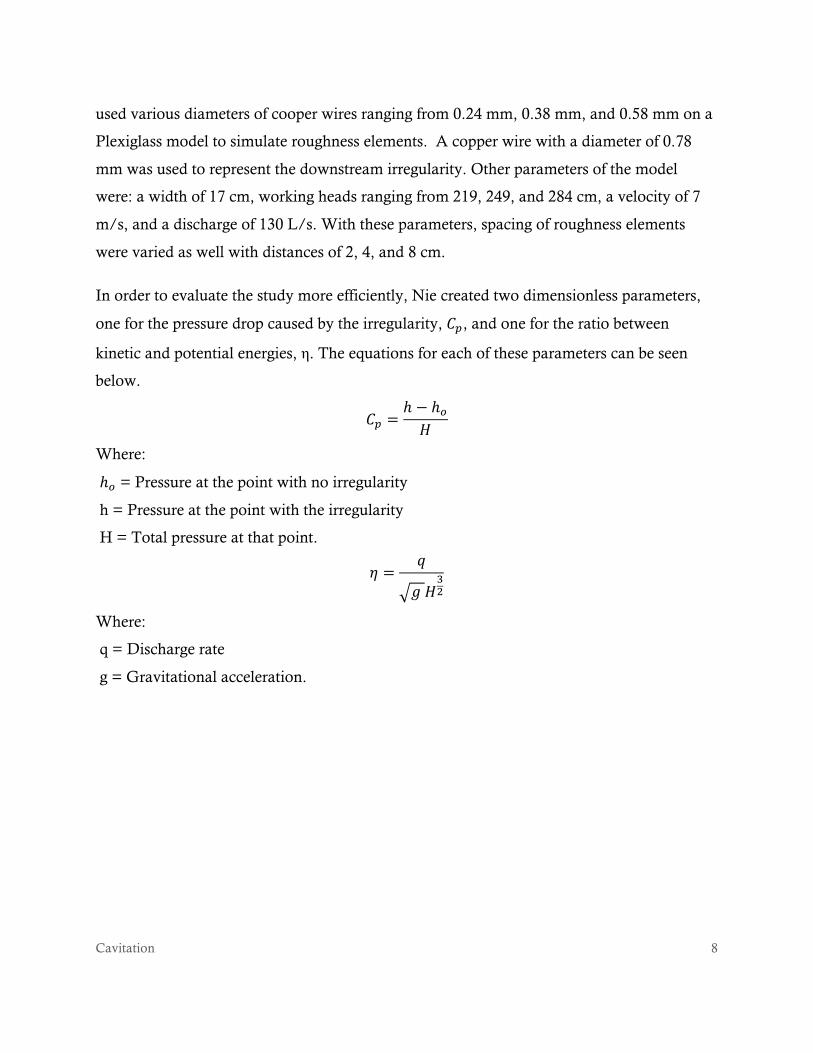
One major failure incident in history due to cavitation took place at the Tarbela Dam on the
Indus River in Tarbela, Pakistan. This hydraulic plant was once the largest man-made
structure in the world, and still stands today as the largest earth filled dam in the world. The
dam currently holds water from flooding an area that is home to millions of people. Due to
its high profile, a failure in this dam would be a catastrophic event. In 1974, the same year
of the dam completion, one of the tunnels (tunnel No. 2) used to temporarily route water
Cavitation 6
throughout construction collapsed due to cavitation damage. Forensic engineering,
performed by Imperial College London, later determined the cause of failure and stressed
the damage that water can cause on dams. Cavitation occurred in the tunnel due to one of
the water gates, which controlled flow, being held in a half open position. Decrease in the
cross-sectional area of flow caused on increase in water velocity at the bottom of the tunnel
inlet and outlet. This increase in velocity caused a decrease in pressure great enough that
cavitation occurred and began to wear down the structural supports of the tunnel. In
September of 1974 the tunnel intake gate collapsed from erosion on both piers and gate as
shown in figure 4. The collapse of tunnel No. 2 also caused the partial collapse to tunnel
No. 1, which also had cavitation damage (Figure 5). After the collapse, an emergency
draining of water was ordered and construction of the dam was continued so that the dam
was in working operation for the summer flood season of 1975.
Although a full failure of the dam did not
occur; failure of the tunnels at the Tarbela
Dam was an indicator of the damage that
water can cause on structures. Since this
incident, dams have been monitored more
heavily to ensure that future failures do not
occur in the future.
Figure 4. Failure of piers and gate at tunnel No. 2
Figure 5. Cavitation damage at intake of tunnel No. 1
Cavitation 7
Prevention
Cavitation can be very damaging to various structures that facilitate the passage of water
including pipes, dams, and spillways. In order to preserve the integrity of the structure, steps
should be taken to avoid cavitation throughout the entire length of the structure. Any
damage can shorten the life of a structure and add additional cost of maintenance. If
enough damage has occurred to the structure, failure could ensue and result in damage to
surrounding property and even loss of life.
There have been many studies conducted in order to understand cavitation and how to
prevent it. One study, published in 2001, written by Meng-Xi Nie in the American Society
of Civil Engineering in the Journal of Hydraulic Engineering entitled “Cavitation
Prevention with Roughened Surface,” examined the cavitation on the Zhexi dam.
Measurements taken from the Zhexi dam spillway indicated that a manually roughened
section of the dam surface was affecting occurrence of cavitation. Engineers noticed that an
irregularity directly downstream of the roughened surface did not cause cavitation, while
irregularities behind the original smooth surface had cavitation occur.
According to Nie, based on his earlier studies back in 1984, “single irregularities caused the
maximum negative pressure when they are placed near the downstream tangential point of
the curve.” This can be seen in Fig. 6 below.
Nie
Figure 6. Layout out of Roughness and Irregularity Elements along Curve of Open Channel
Cavitation 8
used various diameters of cooper wires ranging from 0.24 mm, 0.38 mm, and 0.58 mm on a
Plexiglass model to simulate roughness elements. A copper wire with a diameter of 0.78
mm was used to represent the downstream irregularity. Other parameters of the model
were: a width of 17 cm, working heads ranging from 219, 249, and 284 cm, a velocity of 7
m/s, and a discharge of 130 L/s. With these parameters, spacing of roughness elements
were varied as well with distances of 2, 4, and 8 cm.
In order to evaluate the study more efficiently, Nie created two dimensionless parameters,
one for the pressure drop caused by the irregularity, 𝐶!, and one for the ratio between
kinetic and potential energies, η. The equations for each of these parameters can be seen
below.
𝐶! =ℎ − ℎ!𝐻
Where:
ℎ! = Pressure at the point with no irregularity
h = Pressure at the point with the irregularity
H = Total pressure at that point.
𝜂 =𝑞
𝑔 𝐻!!
Where:
q = Discharge rate
g = Gravitational acceleration.
Cavitation 9
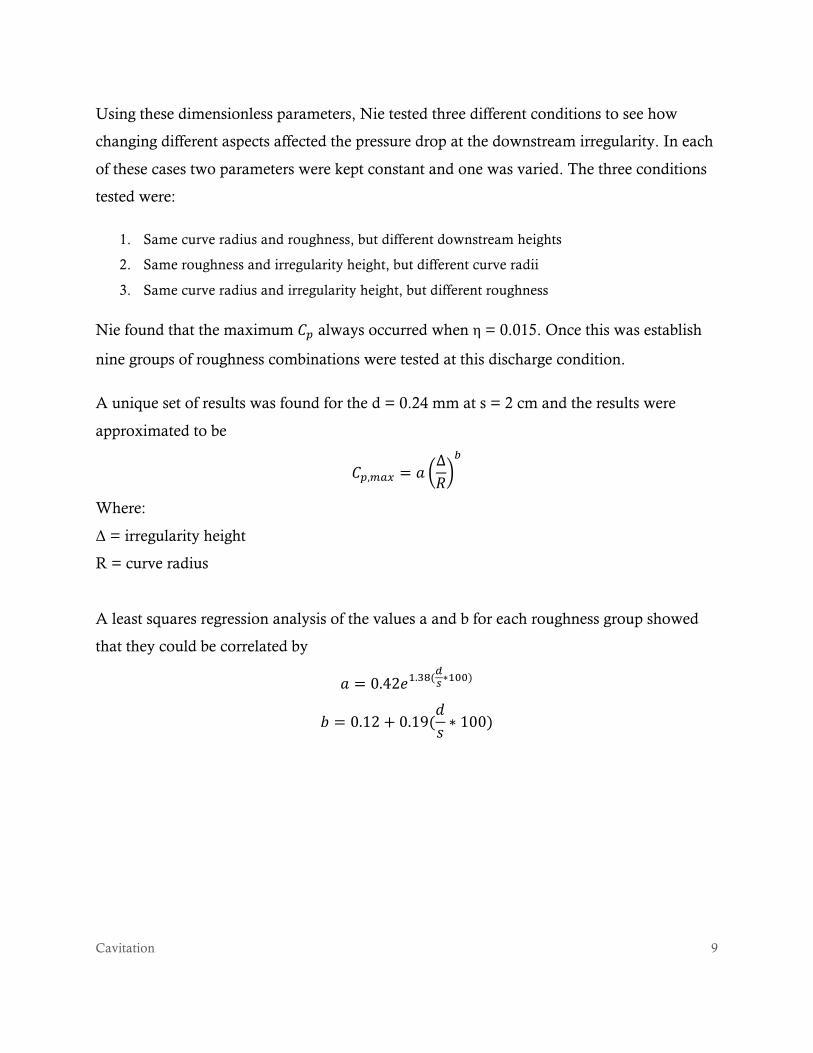
Using these dimensionless parameters, Nie tested three different conditions to see how
changing different aspects affected the pressure drop at the downstream irregularity. In each
of these cases two parameters were kept constant and one was varied. The three conditions
tested were:
1. Same curve radius and roughness, but different downstream heights
2. Same roughness and irregularity height, but different curve radii
3. Same curve radius and irregularity height, but different roughness
Nie found that the maximum 𝐶! always occurred when η = 0.015. Once this was establish
nine groups of roughness combinations were tested at this discharge condition.
A unique set of results was found for the d = 0.24 mm at s = 2 cm and the results were
approximated to be
𝐶!,!"# = 𝑎∆𝑅
!
Where:
Δ = irregularity height
R = curve radius
A least squares regression analysis of the values a and b for each roughness group showed
that they could be correlated by
𝑎 = 0.42𝑒!.!"(!!∗!"")
𝑏 = 0.12+ 0.19(𝑑𝑠 ∗ 100)
Cavitation 10
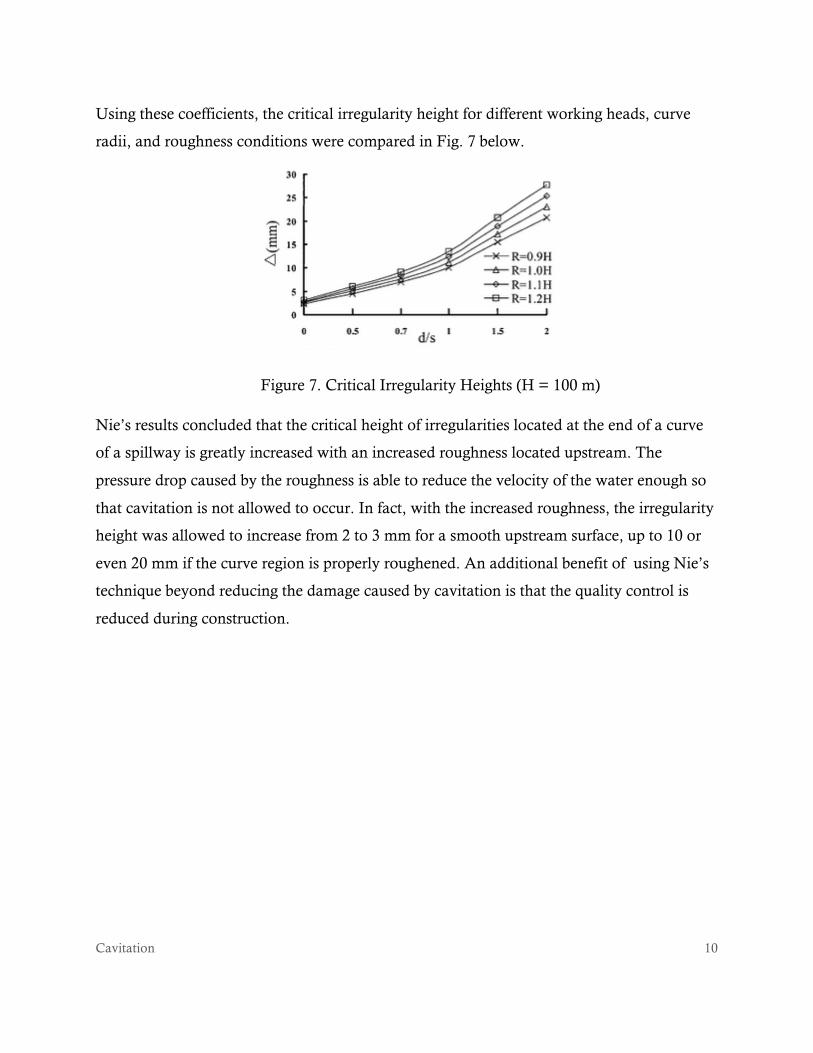
Using these coefficients, the critical irregularity height for different working heads, curve
radii, and roughness conditions were compared in Fig. 7 below.
Nie’s results concluded that the critical height of irregularities located at the end of a curve
of a spillway is greatly increased with an increased roughness located upstream. The
pressure drop caused by the roughness is able to reduce the velocity of the water enough so
that cavitation is not allowed to occur. In fact, with the increased roughness, the irregularity
height was allowed to increase from 2 to 3 mm for a smooth upstream surface, up to 10 or
even 20 mm if the curve region is properly roughened. An additional benefit of using Nie’s
technique beyond reducing the damage caused by cavitation is that the quality control is
reduced during construction.
Figure 7. Critical Irregularity Heights (H = 100 m)
Cavitation 11
Conclusion
Cavitation is a well-understood phenomenon in fluid dynamics that must be considered in
all design where water or some other fluid undergoes some pressure drop. Without properly
considering cavitation while designing a structure that transports fluid undesired damage
may occur, reducing the lifetime of the design, and producing additional expenses.
Significant damage to a structure can also lead to property damage outside of the structure.
Fortunately, the theory and equations governing cavitation are well known and understood.
Additionally, there have been many studies on how to reduce and even prevent cavitation
from occurring. Some of these found practices can even produce additional benefits, for
example reduction in quality control. Cavitation can be detrimental to any water structure
design but with careful consideration and calculation there should be no reason that
cavitation is allowed to occur.
Cavitation 12
References
Information, pictures and figures used are sited below, used without permission for educational purposes only.
Campbell, Peter, ed. Learning from Construction Failures: Applied Forensic Engineering. Scotland, UK: Whittles Publishing, 2001. Print.
Chiarugi, V. "Sinmast Divers At Tarbela." sinitworks (1976): n. pag. Print.
"Solving a cavitation problem." Centrifugal Pump Help-John Anspach Consulting. Wordpress, 17 Apr. 2011. Web. 2014.
Nie, Meng-Xi. "Cavitation Prevention with Roughened Surface." Journal of Hydraulic Engineering 127.10 (2001): 878. Web.
“Fundamentals” Cavitation and Bubbly Flows Group at St. Anthony Falls Laboratory. N.p.,n.d. Web. 8 Nov. 2014 Falvey, Henry T. “Cavitation in Chutes and Spillways.” (1990): n. pag. United States Department of the Interior, Bureau of Reclamation. Web. 8 Nov. 2014