Embed Size (px)
Citation preview

Quantifying sediment transport on desert piedmonts
using 10Be and 26Al
Kyle K. Nichols a,*, Paul R. Bierman a, Roger LeB. Hooke b,Erik M. Clapp a, Marc Caffee c
aSchool of Natural Resources and Department of Geology, University of Vermont, Burlington, VT, 05405, USAbDepartment of Geological Sciences and Institute for Quaternary Studies, University of Maine, Orono, ME, 04496, USA
cCenter for Accelerator Mass Spectrometry, Lawrence Livermore National Laboratory, Livermore, CA, 94550, USA
Received 10 September 1999; received in revised form 17 July 2001; accepted 5 October 2001
Abstract
In situ produced 10Be and 26Al, measured in 40 sediment samples collected from the Iron and Granite Mountain piedmonts,
eastern Mojave Desert, provide a unique view of piedmont modification processes and process rates over the 103 to 105 year time
scale. Cosmogenic nuclide-based models suggest that the Iron and Granite Mountains generate 0.11–0.13 and 0.082–0.097 m3
of sediment per year per meter of rangefront, respectively. The sediment moves down the piedmont in an active transport layer
(ATL), which is 20 to 30 cm thick (based on visual observations, measurements of depth to a buried B-horizon, cosmogenic
nuclide data, and maximum ephemeral channel depths). Sediment in this layer is well-mixed vertically and horizontally on the
102 year time scale, indicating that the small ephemeral channels, which dominate the piedmont surface migrate quickly.
Interpretive models of increasing nuclide activities at depth in two pits suggest steady sediment deposition on the piedmont (at
rates between 17–21 and 38–45 m Ma� 1) until the late Pleistocene epoch, when a discontinuity to markedly lower nuclide
activities in the isotopically well-mixed active transport layer suggests that deposition stopped, a significant change in piedmont
behavior. Nuclide activities in 10 amalgamated surface samples, each collected along a different 4-km-long transect, increase
steadily away from the mountain front. Thus, we infer that sediment is uniformly dosed by cosmic rays as it is transported down
the Iron and Granite Mountain piedmonts. Interpretive models suggest that long-term average sediment speeds down the Iron and
Granite Mountain piedmonts are a few decimeters to a meter per year. D 2002 Published by Elsevier Science B.V.
Keywords: Arid region sediment transport; Climate change; Cosmogenic nuclide; Desert geomorphology; Pediment; Piedmont
1. Introduction
Little is known about the rate and style of long-
term sediment transport across desert piedmont surfa-
ces (Denny, 1967; Hooke, 1968). Runoff is episodic
in arid regions; thus, long-term observations, accom-
plished so far in only a few places worldwide, are
necessary to determine process rates. Rates deter-
mined over these human time scales may or may
not be representative of rates on geologic time scales
(Greenbaum et al., 1999; Lekach and Schick, 1999;
Yair, 1999). Furthermore, the difficulty in determining
accurate sediment generation rates in source basins
has precluded quantitative estimates of sediment flux
and sediment transport rates across piedmont surfaces.
0169-555X/02/$ - see front matter D 2002 Published by Elsevier Science B.V.
PII: S0169 -555X(01 )00192 -1
* Corresponding author.
E-mail address: [email protected] (K.K. Nichols).
www.elsevier.com/locate/geomorph
Geomorphology 45 (2002) 105–125

K.K. Nichols et al. / Geomorphology 45 (2002) 105–125106

Traditional geomorphic techniques of mapping,
monitoring, and observing soil development have elu-
cidated surface histories and piedmont ages. These are
useful for inferring changes in piedmont process (Bir-
keland, 1984; Wells et al. 1987; McFadden et al., 1989;
Bull, 1991), changes that are routinely attributed to
climatic fluctuations (Oberlander, 1974; Mayer and
Bull, 1981; Dohrenwend, 1987; Bull, 1991). For exam-
ple, Bull and Schick (1979) and Bull (1991) suggested
that soil was stripped off desert hillslopes and trans-
ported down gradient as a result of the change from a
wetter to a drier climate at the Pleistocene/Holocene
transition. Similarly, Wells et al. (1987) associated
increased drainage basin sediment yield with early
Holocene deposition on piedmonts. They suggested
that, once the reservoir of sediment stored in mountain
basins was depleted, transport capacity of channels
increased and at least some piedmonts were dissected.
Previous studies of desert piedmonts have been
unable to address the long-term rate and distribution
of germane surface processes such as sediment trans-
port and deposition. By using a new tool, in situ
produced cosmogenic 10Be and 26Al, a novel sampling
strategy, and interpretive models, we quantify long-
term average sediment transport rates across large,
planar, piedmont surfaces that extend more than 10
km from the Iron and Granite Mountains in the Mojave
Desert, California (Fig. 1). Application of these tech-
niques elsewhere could lead to a better understanding
of arid-region sediment transport and surface pro-
cesses on desert piedmonts including the effects of
climate change.
Fig. 1. (a) Location of the Iron and Granite Mountains in the Mojave Desert, CA, and detailed contour map of the Iron and Granite Mountain
piedmonts. On the contour map, straight black lines represent transect locations on the piedmont surfaces. IMT= Iron Mountain transect
samples, GMT=Granite Mountain transect samples, IMT-2H= Iron Mountain transect where additional shallow pits were dug, but no sediment
samples collected. Black squares represent soil pit locations. Gray circles represent valley sample locations. IMV= Iron Mountain valley
samples and GMV=Granite Mountain valley samples. CRA=Colorado River Aqueduct. Contour interval is 50 m. Map based on the Granite
Pass and East of Granite Pass U.S.G.S. 1:24,000 Quadrangles, 1985. (b) Oblique aerial photograph of the Iron and Granite Mountains and
respective piedmonts looking to the southwest. Granite Mountains are on the left (south) and the Iron Mountains are on the right (west). Steep,
narrow source basins for each piedmont penetrate mountains normal to rangefront. View is f 10 km wide.
K.K. Nichols et al. / Geomorphology 45 (2002) 105–125 107

2. Research area
In the Mojave Desert, the Iron and Granite Moun-
tains rise steeply from adjacent, low-gradient (f 2j)piedmonts (Fig. 1). The piedmont surfaces consist
primarily of grus, 0.5 to 1 mm in diameter. There is
minimal carbonate development in the soils (Fig. 2).
Small ephemeral channels, averaging 10 cm in depth
(Nichols and Bierman, 2002), migrate across the
planar piedmonts and account for the majority of
sediment transport (Bull, 1977). Almost all surface
clasts are unvarnished; desert pavements are not well
developed and there is no significant channel incision.
These and other field observations suggest that the
ephemeral channel network has relatively recently
reworked most ( > 98%) of the piedmont surface. The
remainder, directly abutting the rangefront, is relict
alluvium exhibiting some pavement development and
incision by channels 0.5 to 5 m deep. There is no
evidence for range-bounding faults, suggesting that the
basin and adjacent ranges are not currently tectonically
active.
The southern Mojave Desert and the Iron and
Granite Mountain piedmonts are extremely dry and
warm. Average annual precipitation is 79 mm and the
mean temperatures for January and July are 12 and 35
jC, respectively (NOAA, 1982). Packrat midden data
indicate a change in the climate from wetter to drier
conditions between 10,000 and 8000 years ago (Spaul-
ding et al., 1983; Spaulding and Graumlich, 1986).
3. Cosmogenic nuclides
Cosmic rays bombard Earth’s surface and produce a
variety of nuclides in situ including 10Be and 26Al.
Cosmogenic nuclide production rates are greatest at
the surface and decrease exponentially with depth (Lal,
1988). For example, production rates at a depth of 1 m
in sediment (q = 1.55 g cm� 3) are 37% of surface
production. Production rates for 10Be and 26Al, and the
adjustments for altitude and latitude, have been esti-
mated, but remain uncertain at the 10% to 20% level
(Nishiizumi et al., 1989; Lal, 1991; Clark et al., 1995;
Bierman et al., 1996; Dunai, 2000; Desilets and
Zereda, 2000). We can measure 10Be and 26Al activ-
ities (toF 4% precision or better) using accelerator
mass spectrometry. We use these nuclides as cosmic-
ray dosimeters to record near-surface residence time.
Using quantitative and qualitative geomorphic models,
we interpret measured 10Be and 26Al activities in terms
of integrated cosmic-ray dosing. From this informa-
tion, we estimate sediment transport rates expressed as
average grain speeds down piedmont.
4. Methods
4.1. Sediment collection for 10Be and 26Al analysis
To understand and quantify the three-dimensional
behavior of the Iron and Granite Mountains and their
piedmonts over time, we collected three types of
samples: source valley alluvial sediment, piedmont
surface sediment, and sediment exposed in soil pits.
Measurement of 10Be and 26Al in sediment samples
collected from valleys at the Iron and Granite Moun-
tain rangefronts allows quantification of long-term
average source-basin lowering rates and the flux of
sediment entering the piedmont (e.g., Brown et al.,
1995; Bierman and Steig, 1996; Granger et al., 1996).
Integrated piedmont transect samples located at suc-
cessive 1-km intervals from the rangefront reflect
changes in average 10Be and 26Al activity as sediment
moves away from the source basins and allow us to
determine average sediment speed down piedmont.
Profiles of piedmont sediment exposed in soil pits
allow us to quantify the depth to which sediment is
currently well mixed and provide insight into whether
the piedmont is, or has been, a surface of deposition,
erosion, or transport.
4.1.1. Source valley alluvial sediment samples
We determined long-term basin erosion and sedi-
ment generation rates by analyzing fluvial sediment
samples collected from source valley alluvial channels
draining small, steep, lithologically homogeneous
basins in the Iron Mountains (n= 3), and the Granite
Mountains (n = 2) (Fig. 1). Each of these samples repre-
sents the integration of sediment transported out of
many small sub-basins and mixed by fluvial processes.
4.1.2. Transect samples of piedmont sediment
Five transects were laid out on the Iron and Granite
Mountain piedmonts. The transects were parallel to
the rangefronts and were spaced at 1-km intervals
K.K. Nichols et al. / Geomorphology 45 (2002) 105–125108

Fig. 2. Grain size and carbonate distribution of sediment collected from Iron and Granite Mountain piedmonts. G = gravel and larger,
CS = coarse sand, MS=medium sand, and FS = fine sand and smaller. (A) Amalgamated Iron Mountain transect samples. No clear down-
piedmont fining trend is observed. (B) Amalgamated Granite Mountain transect samples. No clear down-piedmont fining trend is observed. (C)
Soil Pit 1. Grain size is uniform except for a gravel layers at depths of 10 to 20 cm and 76 to 86 cm. (D) Soil pit 2. Grain size is uniform except
for gravel layer at depth of 28 to 40 cm. (E) Soil pit 1 carbonate percentage in less than 80 Am fraction. Highest percentage is from 20 to 30 cm.
(F) Soil pit 2 carbonate percentage. Highest percentage is from 71 to 80 cm.
K.K. Nichols et al. / Geomorphology 45 (2002) 105–125 109

down the piedmont, starting at the respective range-
fronts. Along each transect, we collected equal vol-
umes of surface sediment (0 to 10 cm deep) from 20
sampling stations and amalgamated these 20 samples.
The transects were 4 km long and the sampling stations
were spaced approximately 200 m apart (Fig. 1). The
actual locations of predetermined sampling stations
were established in the field using a hand-held Garmin
12 Global Positioning System (GPS); the horizontal
uncertainty of uncorrected GPS measurements effec-
tively randomized (F 20 m) actual sample locations
along the transects.
The piedmont consists of three distinct, low-relief
geomorphic units: low terraces 10 to 20 cm high),
active channels, and animal burrow piles (Fig. 3). We
classified each transect sampling station according to
the geomorphic unit that was sampled (Table 1). To
determine if low-terrace sediment has been exposed
on average longer than channel sediment and, thus, is
more heavily dosed by cosmic radiation, we collected
separate subsamples on two transects of both geo-
morphic units and compared the nuclide activities. We
also subsampled sediment from animal burrow piles
to determine the depth from which sediment was
transported vertically by burrowing. At each of the
20 sampling stations along transects IMT-1 and IMT-
4, we collected equal volumes of sediment from the
nearest terrace, channel, and animal burrow pile, and
amalgamated each type of sample separately.
A distinctive, rougher fan surface appeared to
extend into the northern four sampling stations along
IMT-0 (Fig 1). Channels were entrenched and the
surface had a poorly developed pavement. To deter-
mine whether or not the difference in appearance was
reflected in nuclide activity, we collected a separate
subsample of sediment from only the four sampling
stations on the alluvial fan surface and amalgamated
these samples (IMT-0FAN). The IMT-0 transect sam-
ple contained sediment from all 20 sampling stations
(Table 1).
4.1.3. Soil pit sediment samples
In the two soil pits on the Iron Mountain piedmont
(Fig. 1), we noted soil stratigraphy, sediment grain
size, and soil horizonation to a depth of about 1 m. On
the basis of soil stratigraphy, we divided each pit into
eight depth intervals that we sampled to determine
nuclide activity. Each interval was continuous so that
the entire soil profile was represented. We dug 25
additional shallow soil pits along IMT-1, IMT-2H, and
IMT-4 to understand better the spatial variability of
depth to the buried B-horizon.
Fig. 3. Photograph of ephemeral channels and terraces located near IMT-3. Unvegetated channel bottom contains the most recently transported
sediment. Low terraces have sparse vegetation. There is no desert pavement. The channel in the middle of photograph is f 2 m wide.
Photograph taken looking southwest with the Iron Mountains in the right background.
K.K. Nichols et al. / Geomorphology 45 (2002) 105–125110
4.2. Laboratory methods
All samples were sieved and weighed. We ana-
lyzed the 0.5 to 1.0 mm size fraction to minimize
inclusion of aeolian input from other basins. We did
not analyze different grain sizes because ephemeral
channels, such as those on the Iron and Granite
Mountain piedmonts, are not armored and apparently
do not preferentially transport smaller grain sizes
(Laronne and Reid, 1993; Laronne et al., 1994; Reid
and Laronne, 1995). This conclusion is supported by
previous research in arid-region streams that suggests
that all grain sizes have statistically similar 10Be and26Al activities (Clapp et al., 2000; Clapp et al., 2001).
Thus, we assume that nuclide activities in the 0.5 to
1.0 mm size fraction that we analyzed are representa-
tive of all fluvially transported material.
We measured the density and carbonate content of
all soil pit depth intervals. To measure the density, we
extracted a known volume of sediment from each
layer and weighed each sample. The density did not
vary systematically with depth and the average den-
sity of all strata was 1.55F 0.07 g cm� 3. We used the
Chittick apparatus to measure carbonate content
(Machette, 1986). Based on the results of the carbo-
nate measurements (Fig. 2) and our soil pit observa-
tions, we classified the carbonate development as
Stage I.
Samples for nuclide analysis (0.5 to 1 mm) were
ultrasonically etched, once in heated 6 N HCl and up
to four times in heated 1% HF and 1% HNO3 in
order to remove any atmospheric 10Be and to isolate
at least 40 g of pure quartz (Kohl and Nishiizumi,
1992). After the addition of 250 Ag of Be carrier, we
digested the samples with HF. Be and Al were puri-
fied using chromatographic techniques. The 10Be/9Be
and 26Al/27Al ratios were determined using acceler-
ator mass spectrometry (AMS) at Lawrence Liver-
more National Laboratory. All measurements were
corrected using similarsized procedural blanks. Blanks
were prepared with each batch of seven samples and
analyzed at the same time as the other seven samples.
We calculated 10Be and 26Al activity from 9Be (ad
ded as carrier) and native 27Al measured by Induc-
tively Coupled Argon Plasma Spectrometry–Optical
Emission in duplicate aliquots removed from HF so-
lutions.
4.3. Reproducibility
The nuclide data are reproducible. Field replication,
laboratory replication (Table 2), and the 26Al/10Be
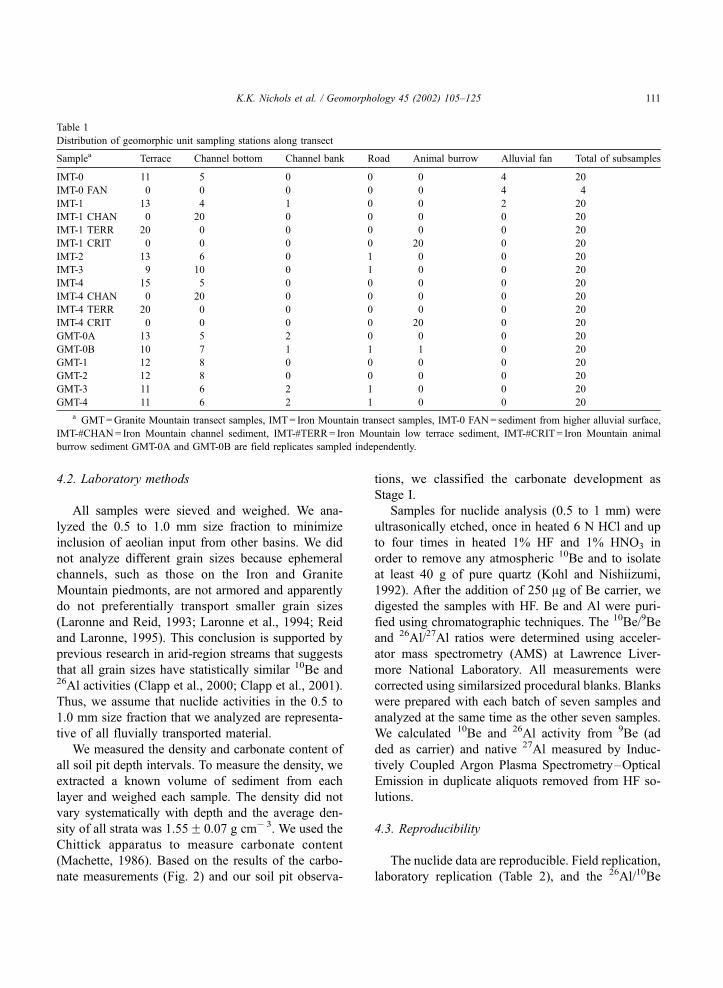
Table 1
Distribution of geomorphic unit sampling stations along transect
Samplea Terrace Channel bottom Channel bank Road Animal burrow Alluvial fan Total of subsamples
IMT-0 11 5 0 0 0 4 20
IMT-0 FAN 0 0 0 0 0 4 4
IMT-1 13 4 1 0 0 2 20
IMT-1 CHAN 0 20 0 0 0 0 20
IMT-1 TERR 20 0 0 0 0 0 20
IMT-1 CRIT 0 0 0 0 20 0 20
IMT-2 13 6 0 1 0 0 20
IMT-3 9 10 0 1 0 0 20
IMT-4 15 5 0 0 0 0 20
IMT-4 CHAN 0 20 0 0 0 0 20
IMT-4 TERR 20 0 0 0 0 0 20
IMT-4 CRIT 0 0 0 0 20 0 20
GMT-0A 13 5 2 0 0 0 20
GMT-0B 10 7 1 1 1 0 20
GMT-1 12 8 0 0 0 0 20
GMT-2 12 8 0 0 0 0 20
GMT-3 11 6 2 1 0 0 20
GMT-4 11 6 2 1 0 0 20
a GMT=Granite Mountain transect samples, IMT= Iron Mountain transect samples, IMT-0 FAN= sediment from higher alluvial surface,
IMT-#CHAN= Iron Mountain channel sediment, IMT-#TERR= Iron Mountain low terrace sediment, IMT-#CRIT= Iron Mountain animal
burrow sediment GMT-0A and GMT-0B are field replicates sampled independently.
K.K. Nichols et al. / Geomorphology 45 (2002) 105–125 111

Table 210Be and 26Al data for the Iron and Granite Mountain piedmonts
Samplea Elevation
(m)bNorthingc,d Eastingc,d Measured nuclide concentration
(106 atoms g� 1)eRatio26Al/10Be
Description
10 Be 26Al
GMV-1 485 3766547 671919 0.168F 0.009 1.02F 0.06 6.08F 0.48 integrated valley
sediment
GMV-2 600 3764501 672404 0.131F 0.005 0.82F 0.04 6.22F 0.40 integrated valley
sediment
GMV-3 550 3765000 672274 0.148F 0.005 0.98F 0.05 6.65F 0.41 integrated valley
sediment
GMT-0A 450 3767980
3766620
670920
674540
0.188F 0.009 1.15F 0.06 6.10F 0.46 integrated transect
sediment (20 sites)
GMT-0B 0.191F 0.010 1.06F 0.10 5.58F 0.59 field replicate of
GMT-0A
GMT-1 415 3768900
3767530
671270
674920
0.213F 0.015 1.11F 0.16 5.21F 0.86 integrated transect
sediment (20 sites)
GMT-2 380 3769820
3768440
671640
675260
0.243F 0.010 1.57F 0.08 6.46F 0.42 integrated transect
sediment (20 sites)
GMT-3 350 3770760
3769400
672000
675620
0.290F 0.011 1.66F 0.10 5.71F 0.41 integrated transect
sediment (20 sites)
GMT-4 320 3771680
3770320
672360
675970
0.316F 0.012 1.95F 0.10 6.18F 0.39 integrated transect
sediment (20 sites)
IMV-1 530 3776603 666643 0.140F 0.004 0.91F 0.06 6.46F 0.46 integrated valley
sediment
IMV-2 495 3776515 667054 0.162F 0.005 1.13F 0.07 6.93F 0.47 integrated valley
sediment
IMV-3 510 3775699 666478 0.143F 0.004 0.99F 0.06 6.89F 0.45 integrated valley
sediment
IMT-0 425 3777034
3773103
668460
668011
0.226F 0.010 1.38F 0.08 6.14F 0.45 integrated transect
sediment (20 sites)
IMT-0FAN 440 3777034
3776442
668460
668402
0.212F 0.008 1.37F 0.11 6.46F 0.57 integrated alluvial
fan sediment
(4 sites)
IMT-1 400 3776958
3773033
669428
669010
0.245F 0.008 1.46F 0.07 5.98F 0.36 integrated transect
sediment (20 sites)
IMT-1CHAN 0.252F 0.011 1.51F 0.08 6.00F 0.42 integrated channel
sediment (20 sites)
IMT-1CRIT 0.259F 0.008 1.68F 0.09 6.51F 0.40 integrated animal
burrow sediment
(20 sites)
IMT-1TERR 0.258F 0.011 1.53F 0.10 5.95F 0.46 integrated terrace
sediment (20 sites)
IMT-2 355 3776816
3772997
670422
669974
0.286F 0.009 1.87F 0.11 6.54F 0.43 integrated transect
sediment (20 sites)
IMT-3 320 3776850
3772898
671359
670988
0.320F 0.013 2.04F 0.12 6.37F 0.46 integrated transect
sediment (20 sites)
IMT-3DUP 0.325F 0.010 1.90F 0.10 5.86F 0.35 laboratory replicate
of IMT-3
IMT-4 290 3776693
3772847
672391
671975
0.367F 0.100 2.38F 0.12 6.49F 0.36 integrated transect
sediment (20 sites)
IMT-4CHAN 0.393F 0.019 2.16F 0.13 5.49F 0.42 integrated channel
sediment (20 sites)
IMT-4CRIT 0.392F 0.019 2.24F 0.12 5.71F 0.41 integrated animal
burrow sediment
(20 sites)
K.K. Nichols et al. / Geomorphology 45 (2002) 105–125112

regression validate the method of collecting integrated
samples and the laboratory procedures. Measured
yields of Be carrier average 100.6F 1.1%; measured
yields of Al blanks average 99.7F 0.9%, indicating
high recovery of stable Al. Nuclide activities of GMT-
0A and B, collected independently along the same
transect, are statistically indistinguishable for both26Al and 10Be activity (Fig. 4). IMT-3 was analyzed
twice; both analyses produced statistically similar re-
sults for both 26Al and 10Be (Fig. 4). Considering the
Samplea Elevation
(m)bNorthingc,d Eastingc,d Measured nuclide concentration
(106 atoms g� 1)eRatio26Al/10Be
Description
10 Be 26Al
IMT-4TERR 0.380F 0.020 2.24F 0.12 5.89F 0.43 integrated terrace
sediment (20 sites)
PIT1 0-10 405 3774990 679030 0.194F 0.015 1.10F 0.08 5.67F 0.57 integrated soil pit
sediment
PIT1 10-20 0.193F 0.007 1.21F 0.08 6.29F 0.45 integrated soil pit
sediment
PIT1 20-30 0.299F 0.014 1.73F 0.11 5.80F 0.44 integrated soil pit
sediment
PIT1 30-40 0.328F 0.011 2.01F 0.10 6.12F 0.38 integrated soil pit
sediment
PIT1 40-50 0.352F 0.011 2.09F 0.11 5.94F 0.36 integrated soil pit
sediment
PIT1 50-66 0.385F 0.013 2.51F 0.13 6.52F 0.40 integrated soil pit
sediment
PIT1 66-76 0.403F 0.020 2.44F 0.14 6.06F 0.45 integrated soil pit
sediment
PIT1 76-86 0.427F 0.026 2.51F 0.13 5.89F 0.47 integrated soil pit
sediment
PIT2 0-14 310 3774990 671500 0.404F 0.012 2.54F 0.13 6.29F 0.38 integrated soil pit
sediment
PIT2 0-14DUP 0.441F 0.013 2.38F 0.12 5.38F 0.32 laboratory replicate
of PIT2 0-14
PIT2 14-28 0.411F 0.016 2.65F 0.15 6.44F 0.44 integrated soil pit
sediment
PIT2 28-40 0.468F 0.015 2.74F 0.14 5.86F 0.36 integrated soil pit
sediment
PIT2 40-50 0.473F 0.015 2.99F 0.15 6.33F 0.38 integrated soil pit
sediment
PIT2 50-60 0.479F 0.016 2.91F 0.16 6.08F 0.40 integrated soil pit
sediment
PIT2 60-71 0.477F 0.014 2.84F 0.16 5.95F 0.37 integrated soil pit
sediment
PIT2 71-80 0.496F 0.015 3.00F 0.15 6.05F 0.34 integrated soil pit
sediment
PIT2 80-90 0.513F 0.015 3.00F 0.15 5.84F 0.33 integrated soil pit
sediment
a GMV=Granite Mountain valley samples, GMT=Granite Mountain transect samples, IMV= Iron Mountain valley samples IMT= Iron
Mountain transect samples, IMT-0FAN= sediment from higher alluvial surface, IMT-#CHAN= Iron Mountain channel sediment, IMT-
#CRIT= Iron Mountain animal burrow sediment, IMT-#TERR= Iron Mountain low terrace sediment, PIT1 = soil pit 1 sediment, PIT2 = soil pit
2 sediment, DUP= laboratory replicate.b Measured from Granite Pass and East of Granite Pass U.S.G.S. quadrangles, 1985, average elevation for transect samples.c Measured using Garmin 12 GPS, UTM zone 11S, NAD 27 coordinate system.d Transect samples are denoted by the two endpoint coordinates.e Error is counting statistics of AMS, with 2% uncertainty for stable Be and 4% uncertainty for stable Al combined quadratically.
Table 2 (continued )
K.K. Nichols et al. / Geomorphology 45 (2002) 105–125 113

entire data set, 10Be and 26Al are well correlated with a
ratio of 5.8F 0.2 and an intercept of 0.07F 0.5� 105
atoms at a 68% confidence level (Fig. 5). Since the 26Al
data mirror the 10Be data, we focus discussion, for the
most part, on the 10Be data. None of our samples have26Al/10Be ratios low enough to suggest significant
burial on the 105 year time scale.
5. Results
Three independent data sets help us understand
sediment transport processes and estimate rates of
landscape change on the Iron and Granite Mountain
piedmonts. Integrated transect nuclide data allow
estimation of sediment transport rates down the pied-
monts. Soil development, soil pit nuclide data, and
ephemeral channel depths in two soil pits reflect the
depth to which piedmont sediment is well-mixed and,
thus, surface histories at these two specific sites.
Nuclide activity in source valley alluvial sediment
samples allows us to quantify the sediment flux to the
piedmonts from mountain drainage basins. Together,
these data provide a four-dimensional (including time)
view of sediment movement into and across the Iron
and Granite Mountain piedmonts on a 104 to 105 year
time scale.
5.1. Piedmont sediment transect data
Integrated transect samples show a remarkably
regular increase in nuclide activity down gradient,
the rate of which is statistically indistinguishable
between the two piedmonts (Fig. 6). The similarity
of the transect sample regression slopes suggests that
cosmic ray dosing rates, as a function of distance down
both piedmonts, are similar. In addition, the nuclide
activity (10Be and 26Al) in terrace, channel, and burrow
Fig. 4. Reproducibility of sediment samples. GMT-0A and GMT-0B
were collected independently. IMT-3 and IMT-3DUP are laboratory
replicates. Error bars represent 1r analytical error.
Fig. 5. 10Be and 26Al data are well correlated (r2 = 0.98). Slope of
5.8F 0.2 (68% confidence level) is consistent with production ratio
of 6.0 (Nishiizumi et al., 1989) and suggests that sediment samples
were not buried for significant periods of time (>105 years).
Fig. 6. Transect (closed symbols) and valley (open symbols) data
from Iron (circles) and Granite (squares) Mountain piedmonts. (A)10Be transect data. (B) 26Al transect data. Slopes for nuclide activity
as a function of distance from rangefront are indistinguishable at the
68% confidence level. Error bars represent 1r analytical error. Error
bars for valley samples are same size as symbols.
K.K. Nichols et al. / Geomorphology 45 (2002) 105–125114

pile sediment is indistinguishable across gradient (Fig.
7). Similar nuclide activities between channel and
terrace sediment imply that channels migrate across
the surface on a time-scale comparable to or less than
the average cosmogenic nuclide detection limit (the
time required to produce the number of atoms that the
AMS could count outside the 1r error, or about 1000
years at our sites). The similarity between nuclide
activity in animal burrow sediment and that in terrace
and channel sediment suggests that sediment is well
mixed to the depth that most animals burrow, presum-
ably less than or equal to the depth of ephemeral
channel incision. Sediment on the alluvial fan surface
(IMT-0FAN) is no more highly dosed than sediment on
the adjacent active piedmont surface (Tables 1 and 2),
implying that sediment exposure histories on a 103
year time scale are similar along IMT-0, regardless of
surface topography.
5.2. Soil pit data
Four lines of evidence suggest that the upper 20 to
30 cm of sediment on the Iron Mountain piedmont,
and by inference the Granite Mountain piedmont, are
vertically well mixed and distinct from underlying
material. (1) The top two samples from both soil pits
have statistically indistinguishable 10Be activity (Fig.
8). (2) A sharp contact between overlying gray bedded
sediment and underlying red massive sediment (also
noted in 25 additional shallow pits along transects
IMT-1, IMT-2H, and IMT-4), occurs on average 20 to
30 cm below the surface. The underlying reddened
material is a buried B-horizon (Bb), the color of which
suggests at least several thousand years of stability
(Birkeland, 1984). (3) Over 9000 topographic meas-
urements of the ephemeral channels, currently the
primary means by which sediment is mixed and
transported, show maximum channel depths between
20 and 30 cm, comparable to the depth of bedded
sediment overlying the Bb-horizon (Nichols and Bier-
man, 2002). (4) Transect samples taken from terraces,
channels, and animal burrow piles have statistically
similar nuclide activities, implying thorough mixing
of the uppermost 20 to 30 cm of piedmont sediment
on the 102 year time scale (Fig. 7).
For the remainder of the paper, we refer to the well-
mixed layer, the upper 25F 5 cm of piedmont soil as
the active transport layer (ATL) (Lekach et al., 1998).
We believe that sediment in the ATL is episodically in
transport down piedmont because this layer is the
same thickness as the maximum channel depths, dis-
plays sedimentary structures, and lacks soil develop-
Fig. 7. Different geomorphic units along the same transect have
similar nuclide activities. ALL= amalgamated sediment, CHAN=
channel sediment, TERR= terrace sediment, and CRIT= animal bur-
row sediment exposed at surface. Error bars represent 1r analytical
error.
Fig. 8. Data from soil pit samples showing increasing nuclide
activities at depth. Pit 1 (circles) is about 2.2 km from the Iron
Mountain rangefront and pit 2 (squares) is about 4.7 km from the
Iron Mountain rangefront. (A) 10Be soil pit data. (B) 26Al soil pit
data. Horizontal bars represent 1r analytical uncertainty. Vertical
bars represent thickness of integrated sample.
K.K. Nichols et al. / Geomorphology 45 (2002) 105–125 115
ment. The upper surface of the Bb-horizon defines the
base of the ATL.
Soil pit samples are isotopically well mixed in the
ATL. However, in the Bb-horizon, nuclide activity
increases with depth (Fig. 8). We interpret the distinct
discontinuity in nuclide activity between the Bb-hori-
zon and the ATL in soil pit 1 as either: (1) a hiatus in
deposition, or (2) erosion of material underlying the
current ATL. Consistent with the transect data (Fig.
6), pit 2, located farther from the rangefront, has
higher 10Be activity than pit 1. Pit 2 has a smaller,
and for 26Al, less well-defined step in nuclide activity
at the base of the ATL, implying either less erosion or
a shorter hiatus in deposition.
5.3. Source valley alluvial sediment data
Average 10Be activities in source valley alluvial
sediment collected along the margins of the Iron and
Granite Mountains are 1.49F 0.12� 105 (1r, n = 3)atoms g� 1 and 1.40F 0.05� 105 (1r, n= 2) atoms
g� 1, respectively.We did not include GMV-1, because
it was not collected at the rangefront and, thus, its
nuclide content does not represent sediment genera-
tion rates in the Granite Mountains.
6. Interpretive models of piedmont process
In order to test specific hypotheses and translate
our nuclide-based qualitative understanding of pied-
mont process and process history into quantifiable
rates and dates, we used mathematical models to
interpret nuclide measurements. One model interprets
source valley alluvial sediment samples in terms of
drainage basin sediment yield and sediment supply to
the piedmont. A second model uses soil pit nuclide
depth profiles to infer depositional history (Lal and
Arnold, 1985; Phillips et al., 1998). A third model
tracks sediment from the time it exits the source
basins until it is deposited or is transported past the
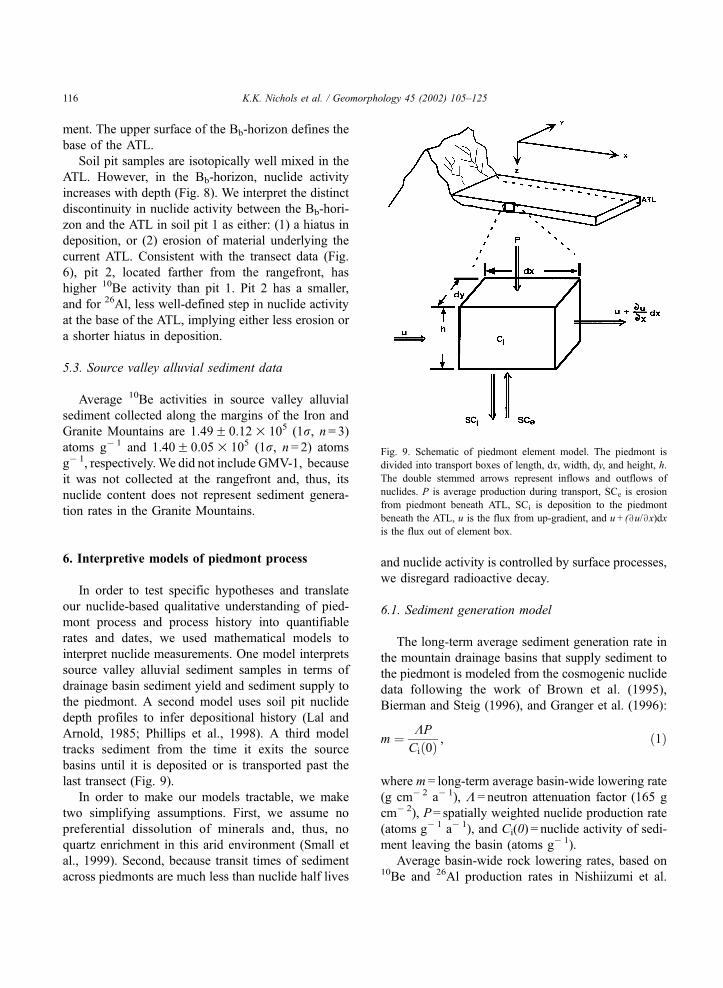
last transect (Fig. 9).
In order to make our models tractable, we make
two simplifying assumptions. First, we assume no
preferential dissolution of minerals and, thus, no
quartz enrichment in this arid environment (Small et
al., 1999). Second, because transit times of sediment
across piedmonts are much less than nuclide half lives
and nuclide activity is controlled by surface processes,
we disregard radioactive decay.
6.1. Sediment generation model
The long-term average sediment generation rate in
the mountain drainage basins that supply sediment to
the piedmont is modeled from the cosmogenic nuclide
data following the work of Brown et al. (1995),
Bierman and Steig (1996), and Granger et al. (1996):
m ¼ KP
Cið0Þ, ð1Þ
where m = long-term average basin-wide lowering rate
(g cm� 2 a� 1), K = neutron attenuation factor (165 g
cm� 2), P= spatially weighted nuclide production rate
(atoms g� 1 a� 1), and Ci(0) = nuclide activity of sedi-
ment leaving the basin (atoms g� 1).
Average basin-wide rock lowering rates, based on10Be and 26Al production rates in Nishiizumi et al.
Fig. 9. Schematic of piedmont element model. The piedmont is
divided into transport boxes of length, dx, width, dy, and height, h.
The double stemmed arrows represent inflows and outflows of
nuclides. P is average production during transport, SCe is erosion
from piedmont beneath ATL, SCi is deposition to the piedmont
beneath the ATL, u is the flux from up-gradient, and u+ (Du/Dx)dxis the flux out of element box.
K.K. Nichols et al. / Geomorphology 45 (2002) 105–125116

(1989) are 37 and 39 m Ma� 1, equivalent to sediment
fluxes of 0.13 and 0.097 m3 a� 1 m� 1, from the Iron
and Granite Mountains, respectively (Table 3). The
basin-wide rock lowering rates, based on production
rates in Bierman et al. (1996) are 31 and 33 m Ma� 1,
equivalent to sediment fluxes of 0.11 and 0.082 m3
a� 1 m� 1, respectively. The Iron and Granite Mountain
denudation rates are comparable to those, estimated
from analysis of 10Be and 26Al in sediment of other
landscapes in arid regions. For example, a gneissic
sub-basin of Yuma Wash in Arizona is eroding at
30F 2 m Ma� 1 (Clapp et al., 2002), and the
granite, schist, and gneiss of Nahal Yael drainage
basin in the Negev Desert are eroding at 29F 6 m
Ma� 1 (Clapp et al., 2000). However, the Iron and
Granite Mountains are eroding more slowly than
semiarid granitic basins in California (60F 14 m
Ma� 1) and sandstone basins in New Mexico (101
F 23 m Ma� 1) (Granger et al., 1996; Clapp et al.,
2001). Erosion rates of granitic landforms are not
controlled by precipitation alone as the Iron and
Granite Mountains (79 mm a� 1 of precipitation) have
erosion rates that are similar to those in the much
wetter Luquillo Forest in Puerto Rico (f 43 m
Ma� 1, >3600 mm a� 1 of precipitation) (Brown et al.,
1995).
6.2. Soil pit profiles, interpretive model
Soil pit data allow insight into past piedmont
processes, specifically the rate at which sediment is
added to or lost from the base of the ATL. Stable or
eroding surfaces have nuclide profiles that decrease
exponentially with depth (Lal and Arnold, 1985) (Fig.
10). In contrast, the nuclide activity in all Iron Moun-
tain soil pit samples collected below the ATL increases
with depth (Fig. 8). This increase mandates that the
Iron Mountain piedmont must have been a surface of
deposition during sometime in the past (Fig. 10).
We can estimate piedmont deposition rates by ap-
plying the Lal and Arnold (1985) deposition model to
our cosmogenic nuclide soil pit profiles. However, this
model assumes constant deposition and does not
account for the discontinuity of nuclide activity that
we measured at the base of the ATL in both soil pits
(Fig. 8). To accommodate the hiatus in deposition that
this discontinuity represents, we modify the Lal and
Arnold model. Considering the thickness (20 cm at pit
1 and 28 cm at pit 2) and density (1.55 g cm � 3) of the
ATL and its effective shielding of the sediment below,
we use an iterative solution to estimate both the de-
position rate and the time (represented by the nuclide
and physical discontinuity) since deposition ceased
Table 310Be and 26Al erosion rates and associated sediment production ratesa
Valley
location
Basin
Area
Production rate
(atoms g� 1 a� 1)bProduction rate
(atoms g� 1 a� 1)bErosion rate
(m Ma� 1)cSediment
generation ratedSediment flux
(m3 a� 1 m� 1)e
(km2) (10�2 g cm�2 a�1)
26Alf 10Beg 26Alh 10Bei 26Al 10Be 26Al 10Be 26Al 10Be
Iron
Mountain
8.1 55.8 9.4 46.5 7.7 35 (29) 39 (33) 0.91 (0.76) 1.03 (0.86) 0.12 (0.10) 0.14 (0.12)
Granite
Mountain
5.7 56.4 9.5 47.0 7.6 38 (32) 40 (34) 1.04 (0.86) 1.08 (0.84) 0.094 (0.079) 0.099 (0.084)
a Averages for IMV-1,2,3 and GMV-2,3.b Basin-wide, weighted average production rate, differences reflect different basin hypsometry.c Rock equivalent (2.7 g cm� 2), erosion rates based on Bierman et al. (1996) in parentheses.d Sediment density = 1.55 g cm� 3, sediment generation rates based on Bierman et al. (1996) in parentheses.e Per unit length of rangefront (m), sediment flux based on Bierman et al. (1996) in parentheses.f Based on high latitude sea-level production rate of 36.8 atoms g�1 a�1 (Nishiizumi et al., 1989), scaled to site using Lal (1991), neutrons
only.g Based on high latitude sea-level production rate of 6.03 atoms g�1 a�1 (Nishiizumi et al., 1989), scaled to site using Lal (1991), neutrons
only.h Based on high latitude sea-level production rate of 30.4 atoms g�1 a�1 (Bierman et al., 1996), scaled to site using Lal (1991), neutrons
only.i Based on high latitude sea-level production rate of 5.17 atoms g�1 a�1 (Bierman et al., 1996), scaled to site using Lal (1991), neutrons
only.
K.K. Nichols et al. / Geomorphology 45 (2002) 105–125 117

(th). Implicit in this calculation is the assumption that
the ATL existed in its present form and thickness
during deposition of the underlying material:
N ¼ Ci þ1
D
Z z
0
PATLe�zqKð Þdzþ Poe
�hqKð Þth
¼ Ci þPoKDq
1� e�zqKð Þ
h iþ Poe
�hqKð Þth, ð2Þ
where N = nuclide activity (atoms g� 1), Ci = inherited
nuclide activity at soil pit location (atoms g� 1),
D = deposition rate (cm a� 1), h= depth of sediment
sample in soil pit (cm), PATL= nuclide production rate
at base of ATL (atoms g� 1 a� 1), z = depth of sediment
sample below the base of the ATL (cm), q = soil
density (g cm� 3), Po = nuclide production rate at sur-
face (atoms g� 1 a� 1), and th = time of depositional
hiatus (years).
On the Iron Mountain piedmont we have two
estimates of Ci. We can use the soil pit data from
the ATL to estimate Ci, or we can use the slope of the
transect data (Fig. 6) to estimate Ci at the location of
each soil pit. We report the average of calculated
deposition rates and hiatus lengths for each estimate
of Ci. Using the production rate estimates of Nishii-
zumi et al. (1989), our 10Be and 26Al data suggest
long-term steady-state deposition rates of approxi-
mately 21 and 45 m Ma� 1 for pits 1 and 2, respec-
tively (Fig. 11). The average unconformity times for
pits 1 and 2 are 8500 and 10,700 years, respectively.
Using the production rates of Bierman et al. (1996),
our 10Be and 26Al data suggest long-term steady-state
deposition rates and hiatus times of 17 m Ma � 1 and
10,300 years for pit 1 and 37.5 m Ma � 1 and 12,500
years for pit 2, respectively (Fig. 11).
These calculations imply a change in piedmont
behavior apparently coincident with the Pleistocene/
Holocene transition about 10,000 years ago. Specifi-
Fig. 10. Stable surfaces (squares) and eroding surfaces (circles) have
nuclide activities that decrease at depth. Depositional surfaces
(triangles) have nuclide activities that increase with depth. Squares
represent a stable surface after 50,000 years of exposure. Circles
represent a surface eroding at 38 m Ma� 1. Triangles represent a 40
m Ma � 1 depositional surface. Data are illustrative for Iron
Mountain piedmont latitude and elevation and a soil density of
1.55 g cm� 3.
Fig. 11. Predicted deposition rates using (A) 10Be data, and (B) 26Al
data for soil pit 1 (circles) and soil pit 2 (squares). Black lines
represent model fit. 10Be and 26Al data are consistent and generate
similar deposition rates for respective soil pits. Example is based on
using Bierman et al. (1996) production rates and soil pit data to
estimate Ci. Nuclide data for pit 1 suggest uniform deposition (16 m
Ma� 1) from the bottom of the soil pit to 20 cm followed by 14,500
years of stability. Nuclide data for soil pit 2 suggest uniform
deposition at 45 m Ma� 1 from the bottom of the soil pit up to 28 cm
followed by 7000 years of stability. A discontinuity in nuclide
activities at 20 and 28 cm (Pits 1 and 2, respectively) suggests that
an active layer above these depths is transporting but not depositing
sediment. Different estimates of Ci, either soil pit data or
extrapolation from the slope of transect data (Fig. 6), yield different
deposition rates and hiatus times. Using Bierman et al. (1996),
nuclide production rates and, averaging the results from the different
Ci estimates, yields average deposition rates and hiatus times of 17
m Ma� 1 and 10,300 years for pit 1, and 38 m Ma� 1 and 12,500
years for pit 2. Using Nishiizumi et al. production rates, the average
deposition rate and hiatus time for pit 1 are 21 m Ma� 1 and 8500
years and for pit 2, 45 m Ma� 1 and 10,700 years, respectively.
K.K. Nichols et al. / Geomorphology 45 (2002) 105–125118
cally, what had been a transport system in which some
mass was lost to the piedmont below, changed to a
regime where sediment moved over, and perhaps
eroded, previously deposited material. These calcula-
tions also imply that sediment was deposited more
slowly closer to the rangefront. Because surface top-
ography on the piedmont is so subdued, these local
deposition rates probably represent the depositional
histories in a substantial area around each soil pit.
Many more pits would be required to map the history
of deposition over the entire piedmont.
6.3. Down piedmont sediment transport speeds
In order to quantify the average rate at which
grains of sediment move down the Iron and Granite
Mountain piedmonts, we used conceptual models that
consider both nuclide and mass balances. These
models can be developed and employed in a variety
of ways (Small et al., 1999; Nichols, 2000). These
interpretive models rely upon a variety of parameters
some of which we have measured (such as present day
ATL thickness and nuclide activity in sediment enter-
ing the piedmont), some of which we have calculated
(such as mass flux into the piedmont), and some of
which we have taken from the literature (nuclide
production rates). We do not know how well contem-
porary measurements of these parameters (such as
ATL thickness) represent their value in the past,
particularly, in light of changing climate. Therefore,
we modeled a variety of different scenarios to test
how sensitive sediment transport speeds were to
model assumptions and to determine how well our
measured data match predictions made using different
model assumptions.
The ATL contains a large volume of sediment. The
length of the Iron Mountain piedmont is 12–15 km
and the average thickness of the ATL is about 25 cm. If
the rate at which sediment is currently delivered from
the Iron Mountain source area (0.11 m3 a� 1 m� 1) is
representative of past rates, then the residence time for
the average grain of sediment in the ATL is about
30,000 years. If some of the material in the ATL were
derived from erosion of the underlying material, res-
idence time would be shorter. The large volume and
long residence time of sediment in the ATL must
buffer the system against perturbations in sediment
delivery rates, perhaps caused by changing climate.
The simplest model for sediment flux across the
piedmont is one in which a column of sediment enters
the ATL from the source area and, as successive
columns are added at the up-piedmont end, this
column moves down the piedmont as a unit. As each
column moves down piedmont in this plug flow
scenario, it is subjected to cosmic ray bombardment
and consequently accumulates 10Be at a rate of about
192 atoms cm� 2 a� 1 (Lal, 1988; Bierman et al., 1996
production rates). Here, the cm2 refers to the surface
area of the column, and the column is assumed to be
25 cm high (h), the mean thickness of the ATL. As the
measured density of the sediment is 1.55 g cm� 3, this
amounts to an accumulation rate of 5.0 10Be atoms
g� 1 a� 1 in the well-mixed ATL. Sediment moving
down the Granite Mountain piedmont acquires 10Be at
a rate of about 0.32 atoms g� 1cm� 1 (Fig. 6), imply-
ing a speed, u, of f 16 cm a� 1 and a flux, uh, of 390
cm3 cm� 1 a� 1. This calculated sediment flux is lower
by a factor of two than the flux inferred from nuclide
activity in the source valley alluvial sediment samples,
about 820 cm3 cm� 1 a� 1 (Table 3). This model im-
plies that the column would take about 40,000 years
to move from the rangefront to transect GMT4, 6.2
km from the rangefront.
One can consider other scenarios in order to im-
prove the fit of the model to the data. For example, if
erosion of the underlying piedmont is occurring, both
sediment and associated nuclides must enter the ATL.
Assuming the ATL remains 25 cm thick as indicated
by contemporary measurements, the speed of the
column must increase with distance from the range-
front because sediment flux through the ATL is
increasing down piedmont. This flux increase will
have two offsetting effects. On one hand, the increase
in speed will reduce the time available for accumu-
lation of nuclides by production within the column; on
the other hand, the more highly dosed sediment
eroded from the substrate will increase the average
concentration in the column.
Alternatively, we might assume that the ATL is
increasing in thickness through time as sediment from
the source area is incorporated within it. In this case,
with no erosion of the substrate, the speed of the
column would decrease down slope. This decrease in
speed would lead to a concavity in plots of 10Be ac-
tivity vs. distance from the rangefront because, in dis-
tal areas, the more slowly moving column would have
K.K. Nichols et al. / Geomorphology 45 (2002) 105–125 119

more time to accumulate nuclides as it traversed a
given distance. Such a concavity is evident in the data
for the Granite Mountain piedmont in Fig. 6 although
one might argue that it is of marginal statistical
significance given the uncertainty in the measure-
ments. There is also a concavity of similar magnitude
in the data for the Iron Mountain piedmont if one
ignores the measurements between x =� 1 and x= 0.
Using the production rate mentioned above and slopes
of a smooth concave curve through the Granite Moun-
tain data (Fig. 6), the speed would have to decrease
from f 39 cm a� 1 in the first kilometer to f 16 cm
a� 1 between 5 and 6 km from the rangefront.
To sort out these possibilities, we developed a
numerical model of the piedmont. In this model, we
divided the ATL into boxes of height, h, length, dx
(2000 cm), and width, dy (1 cm) (Fig. 9). The nuclide
content of a box increases due to production, P, and
erosion of the substrate at a rate S. Thus, during the
residence time of sediment in the box, taken to be dx/
u, the concentration of nuclides becomes:
Ci ¼ Ci�1 þ ðP þ SCeÞdx
uh: ð3Þ
Sediment and nuclides were considered to enter the
box from the up-piedmont end. This sediment is then
thoroughly mixed with that already in the box and that
entering by substrate erosion, thus homogenizing the
nuclide concentration. The mixing algorithm is:
Ci ¼ðCi�1uþ CidxÞhþ CuSdx
ðuþ dxÞhþ Sdx, ð4Þ
where Cu =Ced +Ci(1� d), and d = 1 when S>0 and 0when S < 0. The effect of the latter relation is to make
the concentration of nuclides in the sediment entering
the box through erosion equal to that in the substrate.
Finally, sediment is passed out of this box at its distal
end and enters the next box downslope.
There are two main differences between the mixing
model and the column model described above. The
most important is that mixing is allowed between
columns and between the underlying piedmont and
the ATL. This mimics actual processes on the pied-
mont where there is exchange between sediment in
transport and sediment that has been residing in the
ATL for some years. In addition, some lower activity
sediment could be deposited from the ATL to the
piedmont below, or some higher activity sediment
located in the Bb-horizon below the ATL could be
eroded and incorporated into the transport layer. The
other key difference is that with a numerical model we
can incorporate changes in h, S, and Ce with x.
Using measured parameters, we have generated
models that fit the Iron and Granite transect data well
(RMS error, 7300 and 10,200 atoms g� 1, respec-
tively, Fig. 12). For both these models, we used the
nuclide production rates of Bierman et al. (1996), the
nuclide-based estimates of sediment flux to the pied-
mont (Table 3), the soil pit-based estimates of nuclide
activity in the top of the underlying Bb-horizon, the
Fig. 12. Predicted (lines) and measured (circles) nuclide activities
for Iron (A) and Granite (B) Mountains. Predicted values are from
mixing model. RMS errors are low for both Iron Mountain
(7.3� 103 atoms g� 1) and Granite Mountain (10.2� 103 atoms
g– 1). The following model parameters are the same for both
piedmonts: Po = 6.3 atoms g� 1 a� 1, K = 165 g cm� 2, q= 1.55 g
cm� 3, Ce = linear extrapolation between nuclide activity in soil pits
of upper Bb sample corrected for 5000 years of surface exposure
below 25 cm ATL. For Iron Mountain: ho, the thickness of the ATL
at the range front, is 9.0 cm; a, defined as the down piedmont rate of
ATL thickening, is 4.4 cm km� 1; hdot, the increase in ATL
thickness attributed to incorporation of source valley alluvium
sediment, is 0 cm a� 1; qo, the average basin-wide sediment flux, is
1100 cm3 a� 1 cm� 1 (Table 3). For Granite Mountain: ho = 16 cm,
a= 3.2 cm km� 1, hdot = 0.0003 cm a� 1, qo = 820 cm3 a� 1 cm� 1
(Table 3).
K.K. Nichols et al. / Geomorphology 45 (2002) 105–125120

average soil density, and the accepted neutron attenu-
ation factor (165 g cm� 2). Using the parameters listed
above, the only way to fit the measured transect data
(Fig. 6) was to vary the thickness of the ATL over
time and space.
In order to fit the Iron Mountain data, the ATL
thickened down piedmont at a rate of 4.4 cm km� 1.
This resulted in an ATL that thickened from 9.0 cm at
the rangefront to 32 cm at transect 4. Erosion rates of
the underlying piedmont decreased from 27 m Ma � 1
at the rangefront to 14 m Ma� 1 at transect 4. Average
grain speed decreased down piedmont from 122 to 65
cm a� 1. This model resulted in a total transit time
from the rangefront to transect 4 of 6400 years.
Although measured nuclide activities increased at a
similar rate down both piedmonts, model results
suggest that the Granite Mountain piedmont behaves
somewhat differently than the Iron Mountain pied-
mont. To fit the Granite Mountain data, we thickened
the ATL at a rate of 3.2 cm km� 1 and allowed de-
position of some sediment from the source area into
the ATL at a rate of 0.003 cm a� 1. The best fit model
resulted in an ATL that thickened from 13 cm at
the rangefront to 33 cm at transect 4, 6.2 km away.
Erosion rates of the underlying piedmont decreased
from 7 to 0.6 m Ma� 1 over the same distance. Ave-
rage grain speeds are lower than those on the Iron
Mountain piedmont, decreasing down piedmont from
63 to 24 cm a� 1. This model resulted in a total transit
time from the rangefront to transect 4 of 17,000 years.
The mixing model results constrain piedmont
behavior. Our best fit models for both piedmonts
suggest that sediment is being eroded from below
and entrained into the ATL, that average grain speed
decreases down piedmont, and that the geometry of
the ATL changes over time and space. Transit times
from the rangefront to transect 4 range from 6600 to
17,000 years and average grain speed ranges from a
few decimeters to a meter per year. Additional soil pit
nuclide data and developing models that step through
time will probably further increase our understanding
of piedmont behavior.
7. What we have learned about desert piedmonts
In situ produced cosmogenic nuclides trace sedi-
ment movement onto, across, and within desert
piedmonts. Nuclide data allow us to approach funda-
mental questions about piedmont behavior that have
long resisted quantification such as the rates of sedi-
ment transport and deposition across low-gradient
desert surfaces. The combination of amalgamated
transect samples, source-valley alluvial samples, and
soil-pit depth profiles with mass and nuclide balance
models represents a new approach to the application
of cosmogenic nuclides, one that begins to consider
large scale problems in landscape behavior and
history through a quantitative understanding of sedi-
ment movement and sediment budgets over time and
space.
7.1. Piedmonts as dynamic yet organized systems
Nuclide data require that the low gradient granitic
piedmonts we studied are dynamic on a variety of
length and time scales ranging from years to millennia
and meters to kilometers. For example, nuclide anal-
yses and field observations suggest that lateral and
shallow vertical sediment mixing processes are impor-
tant and rapid on granitic desert piedmonts. Mixing is
done by animal burrowing and by the random avul-
sion, incision, and filling of the shallow ephemeral
channels that criss-cross the piedmont surface (Nich-
ols and Bierman, 2002). Low-relief (dm-scale) geo-
morphic units (channels and terraces) have indistin-
guishable nuclide activities (Fig. 4), suggesting that
braided ephemeral channels migrate across the pied-
mont surface on 102 to 103 year time scales, reshaping
surface microtopography. Depth profiles (Fig. 8) and
nuclide analysis of sediment brought to the surface by
burrowing animals reveal that the uppermost 20 to 30
cm of piedmont sediment is well and continually
mixed over a time scale comparable to that for lateral
mixing.
Within this well-mixed system there is order.
Nuclide activity increases uniformly down both pied-
monts (Fig. 6). The regular increase in average nuclide
activity as a function of distance from the rangefront
indicates that the locally and temporally chaotic pied-
mont sediment transport system functions in a predict-
able, uniform fashion over length and time scales that
our amalgamated samples represent (km) and can
resolve (ka). Individual grains are brought down pied-
mont in an episodic series of transport events, each
presumably of varying length, between which the
K.K. Nichols et al. / Geomorphology 45 (2002) 105–125 121

grains are stored and dosed by cosmic radiation. The
regular increase in average nuclide activity down
piedmont reflects the slow, episodic, but ongoing
transport of grains from mountain sources to the pied-
mont and ultimately, in the case of some of the finer
grains, to playa sinks.
7.2. Piedmont history
Both geologic and isotopic evidence, the marked
discontinuity in soil color and nuclide activity at the
base of today’s well-mixed active layer, require that
the behavior and sediment budget of the Iron Moun-
tain piedmont changed during the Late Pleistocene or
Early Holocene epoch. Soil pit data (Section 6.2),
specifically the general increase in nuclide activity
with depth below the ATL, suggest steady deposition
occurred on the piedmont prior to about 10,000 years
ago at rates between 17 and 45 m Ma� 1. In contrast,
there is no stratigraphic or isotopic evidence of
Holocene deposition from the ATL into the substrate
below. As long as there has been rapid channel
migration that currently characterizes water and sedi-
ment transport on these granitic piedmonts, there will
be a well-mixed layer of surface sediment. The thick-
ness of such an ATL through time cannot be con-
strained by field measurements and likely varies as a
result of changes in sediment supply, climate, and
piedmont hydrology; however, modeling can suggest
reasonable values of ATL thickness in the past.
The end of the Pleistocene was a time when mois-
ture effectiveness and vegetative cover decreased in
the Mojave (Spaulding et al., 1983). Bull and Schick
(1979) and Bull (1991) argued that such a climate
change would result in a pulse of hillslope erosion
and, thus, piedmont aggradation as drainage basin
soils, no longer well anchored by vegetation and sub-
jected to increasingly variable precipitation, were
stripped from hillslopes. Our data are consistent with
a piedmont process change at the Pleistocene/Holo-
cene transition that could have been occasioned by a
change in sediment yield and basin hydrology. How-
ever, even if sediment yield increased as postulated by
Bull, soil pit nuclide data clearly show that such an
increase did not cause deposition from the ATL to the
piedmont below. It is possible that ATL thickness,
which is controlled by the depth of migrating ephem-
eral channels (Nichols and Bierman, 2002), increased
in response to changing runoff patterns and, thus,
accommodated sediment stripped from the basins.1
7.3. Sediment transport rates
Sediment transport rates across desert piedmonts,
expressed as average grain speeds, have been
unknown until now. Although there remains some
uncertainty in nuclide and sediment production rates
and in the flux of sediment delivered from the source
basins, average grain speeds on the Iron Mountain
piedmont range from a few decimeters to a meter per
year. Such low speeds imply that human disturbance
or sediment contamination would have long-lasting
effects on desert piedmonts. Average sediment grains
that are not deposited into long-term storage still
remain on the piedmont for up to tens of thousands
of years as they move from mountains to the playa.
7.4. Application to the ‘‘pediment problem’’
The piedmonts that we studied are low relief, planar
surfaces where sand and fine gravel are transported
from the abutting granitic highlands to distant lowland
basins. Classifying these piedmont surfaces is not
straightforward. They are pediment-like in their planar
morphology and in the existence of an active transport
layer over an indurated, and perhaps beveled, sub-
strate. They are fan-like in that deposition dominated
the piedmont surface over the later Pleistocene.
Whatever term is used to describe the Granite and
Iron Mountain piedmonts, our data are consistent with
a geomorphic system dominated by rapidly migrating
channels, spatially homogeneous braided drainage,
planar morphology, and a uniform substrate lithology.
Homogeneity of a piedmont drainage network is rep-
1 One of us (RLH) interprets the available data differently.
Although there must be an ATL whenever fluvial deposition is
occurring on such a piedmont, Hooke suspects that deposition on
this piedmont effectively ceased prior to the last major pluvial
period in the Mojave. During this pluvial, runoff may have been
confined, by vegetation, to more permanent and more stable
channels. During this hiatus, lasting 10 to 20 ka, weathering resulted
in the observed red Bb horizon. Upon return to arid conditions at the
end of the Pleistocene, according to this interpretation, channels
began to migrate more freely across the piedmont surface and the
present ATL began to form from a mixture of new material derived
from the source area and old material from erosion of the Bb.
K.K. Nichols et al. / Geomorphology 45 (2002) 105–125122

resented numerically by a ‘‘random walk’’ of channels
over uniform lithology (Rachocki, 1981). Results of
such a model show that where alluvial fans coalesce,
drainage becomes an interconnected network of braid-
ed channels, the discharge of channels becomes uni-
form, and the ‘‘. . .coalesced surface forms an alluvial
piedmont plain.’’ Individual channel morphometry on
the IronMountain piedmont does not vary significantly
over the piedmont’s width or length (Nichols and
Bierman, 2002) consistent with Rachocki’s findings.
Weak channel banks and rapid changes in discharge
are typical of migrating channels in sediment-laden
networks (Ritter, 1978) and allow for rapid migration
of channels over either more resistant bedrock or more
indurated sediment. Rapid channel migration, such as
we have demonstrated isotopically at Iron Mountain,
could effectively bevel high spots on piedmonts and
maintain a planar morphology without forming en-
trenched channels. This lateral erosion process is con-
sistent with the ideas of Gilbert (1877) and Paige
(1912), who were the first to speculate that such a
process contributes to pedimentation.
7.5. Implications for the application of cosmogenic
nuclides to geomorphic problems
This study integrates several different applications
of in situ produced cosmogenic nuclides in an attempt
to understand better a geomorphic system. The amal-
gamated transect technique, developed and presented
in this paper, averages out point to point differences
and elucidates large-scale trends in nuclide activity
and, thus, landscape behavior. While sample collection
is time intensive, the number of samples generated is
modest and the surface area over which the results are
relevant is quite large. Simple models allow for deter-
mination of a sediment budget for the Iron and Granite
Mountain piedmont systems and, thus, calculation of
average grain speeds across piedmont surfaces. Depth
profiles of nuclide activity in soils allow us to infer
past behavior of piedmont systems as well as allowing
estimation of sediment deposition rates over time (Lal
and Arnold, 1985; Brown et al., 1995; Phillips et al.,
1998); however, depth profiles are sample intensive
and representative of only modestly sized areas near
the soil pit. All of the field and analytical approaches
that we have used could be applied in any number of
different geomorphic settings.
Measuring and interpreting cosmogenic nuclide
activities allow us to quantify sediment transport rates
and piedmont processes on a 103 to 105 year time
scale, much shorter than the time of formation of
many desert piedmonts (Cooke and Warren, 1973;
Oberlander, 1974), but much longer than the duration
of contemporary process studies (Abrahams et al.,
1984; Lekach and Schick, 1999; Yair, 1999). Thus,
our results describe piedmont behavior and piedmont
modification and begin to approach the question of
piedmont genesis. Such an understanding will only
come when a variety of data including underlying
structure, lithology, and the geometry of sediment
cover are integrated fully with modern process stud-
ies, cosmogenic rate data, and mass balance models.
Although this investigation focuses on one area,
the similar increase of nuclide activity down both the
Iron and Granite Mountain piedmonts suggests that
our findings can probably be generalized to other
granitic piedmonts in similar tectonic and climatic
settings. Applying this technique to piedmonts with
different lithologies, slopes, tectonic settings, cli-
mates, and morphologies will provide a better under-
standing of the rate, history, and distribution of desert
piedmont processes throughout the world.
Acknowledgements
We thank D. Santos and C. Massey for field
assistance, D. Howell for statistical assistance, B.
Copans and S. Neis for laboratory assistance, and D.
Dethier and S. Brown (Williams College) for assis-
tance with carbonate analyses. E. Steig provided
helpful comments on an earlier version of this manu-
script. Funding for this project was provided by U.S.
Army Research Office grants DAAG559710180 and
DAAH049610036, and in part by the U.S. Department
of Energy contract No. W-7405-Eng-48, and National
Science Foundation grants EAR 9628559 and MRI
EAR 9724190.
References
Abrahams, A.D., Parsons, A.J., Cooke, R.U., Reeves, R.W., 1984.
Stone movement on hillslopes in the Mojave Desert, California:
a 16-year record. Earth Surf. Processes and Landforms 9, 365–
370.
K.K. Nichols et al. / Geomorphology 45 (2002) 105–125 123

Bierman, P.R., Steig, E.J., 1996. Estimating rates of denudation
using cosmogenic isotope abundances in sediment. Earth Surf.
Processes and Landforms 21, 125–139.
Bierman, P., Larsen, P., Clapp, E., Clark, D., 1996. Refining esti-
mates of 10-Be and 26-Al production rates. Radiocarbon 38,
149.
Birkeland, P.W., 1984. Soils and Geomorphology. Oxford Univ.
Press, New York, 372 pp.
Brown, E.T., Stallard, R.F., Larsen, M.C., Raisbeck, G.M., Yiou, F.,
1995. Denudation rates determined from the accumulation of in
situ-produced 10Be in the Luquillo Experimental Forest, Puerto
Rico. Earth Planet. Sci. Lett. 129, 193–202.
Bull, W.B., 1977. The alluvial-fan environment. Prog. Phys. Geogr.
1, 222–270.
Bull, W.B., 1991. Geomorphic Responses to Climatic Change. Ox-
ford Univ. Press, New York, 326 pp.
Bull, W.B., Schick, A.P., 1979. Impact of climatic change on an arid
watershed: Nahal Yael, southern Israel. Quat. Res. 11, 153–171.
Clapp, E.M., Bierman, P.R., Schick, A.P., Lekach, J., Enzel, Y.,
Caffee, M., 2000. Sediment yield exceeds sediment production
in arid region drainage basins. Geology 28, 995–998.
Clapp, E.M., Bierman, P.R., Nichols, K.K., Pavich, M., Caffee, M.,
2001. Rates of sediment supply to arroyos from upland erosion
determined using in situ-produced cosmogenic 10Be and 26Al.
Quat. Res. 55, 235–245.
Clapp, E.M., Bierman, P.R., Caffee, M., 2002. Using 10Be and 26Al
to determine sediment generation rates and identify sediment
source areas in an arid region drainage basin. Geomorphology.
Clark, D.H., Bierman, P.R., Larsen, P., 1995. Improving in situ
cosmogenic chronometers. Quat. Res. 44, 367–377.
Cooke, R.U., Warren, A., 1973. Geomorphology in Deserts. Univ.
California Press, Berkeley, 394 pp.
Denny, C.S., 1967. Fans and pediments. Am. J. Sci. 265, 81–105.
Desilets, D., Zreda, M., 2000. Scaling production rates of terrestrial
cosmogenic nuclides for altitude and geomagnetic effects. Geol.
Soc. Am. Abstr. Programs 31, 400.
Dohrenwend, J.C., 1987. Basin and range. In: Graf, W.L. (Ed.),
Geomorphic Systems of North America. Decade of North
America Geology. Geol. Soc. Am., Boulder, Colorado, Centen.
Spec., vol. 2, pp. 303–342.
Dunai, T., 2000. Scaling factors for production rates of in situ
produced cosmogenic nuclides: a critical reevaluation. Earth
Planet. Sci. Lett. 176, 157–169.
Gilbert, G.K., 1877. Geology of the Henry Mountains (Utah). U.S.
Geographical and Geological Survey of the Rocky Mountain
Region. Washington, DC.
Granger, D.E., Kirchner, J.W., Finkel, R., 1996. Spatially averaged
long-term erosion rates measured from in situ produced cosmo-
genic nuclides in alluvial sediment. J. Geol. 104, 249–257.
Greenbaum, N., Salmon, O., Gerson, R., Schick, A.P., 1999. Slope
runoff in a hyperarid region. In: Lekach, J., Hassan, M.A.
(Eds.), Drainage Basin Dynamics and Morphology: Confer-
ence Excursion-Negev Desert (Excursion Guide). Hebrew Univ.,
Jerusalem, pp. 104–110.
Hooke, R.L., 1968. Steady-state relationships on arid-region alluvial
fans in closed basins. Am. J. Sci. 266, 609–629.
Kohl, C.P., Nishiizumi, K., 1992. Chemical isolation of quartz for
measurement of in situ-produced cosmogenic nuclides. Geo-
chim. Cosmochim. Acta 56, 3583–3587.
Lal, D., 1988. In situ-produced cosmogenic isotopes in terrestrial
rocks. Ann. Rev. Earth Planet. Sci. 16, 355–388.
Lal, D., 1991. Cosmic ray labeling of erosion surfaces: in situ
nuclide production rates and erosion models. Earth Planet.
Sci. Lett. 104, 424–439.
Lal, D., Arnold, J.R., 1985. Tracing quartz through the environment.
Proc. Indian Acad. Sci. 94, 1–5.
Laronne, J.B., Reid, I., 1993. Very high rates of bedload sediment
transport by ephemeral desert rivers. Nature 366, 148–150.
Laronne, J.B., Reid, I., Yitshak, Y., Frostick, L.E., 1994. The non-
layering of gravel streambeds under ephemeral flood regimes. J.
Hydrol. 159, 353–363.
Lekach, J., Schick, A.P., 1999. Sediment transport and sediment
yield. In: Lekach, J., Hassan, M.A. (Eds.), Drainage Basin Dy-
namics and Morphology: Conference Excursion-Negev Desert
(Excursion Guide). Hebrew Univ., Jerusalem, pp. 89–97.
Lekach, J., Amit, R., Grodek, T., Schick, A.P., 1998. Fluvio-pedo-
genic processes in an ephemeral stream channel. Nahal Yael,
Southern Negev, Israel. Geomorphology 23, 353–369.
Machette, M., 1986. Calcium and magnesium carbonates. In: Sing-
er, M.J., Janitzky, P. (Eds.), Field and Laboratory Procedures
Used in a Soil Chronosequence Study. U.S. Geol. Surv., Reston,
VI, pp. 30–33.
Mayer, L., Bull, W.B., 1981. Impact of Pleistocene–Holocene
climatic change on particle size distribution of fan deposits
in southwestern Arizona. Geol. Soc. Am. Abstr. Programs 13,
95.
McFadden, L.D., Ritter, J.B., Wells, S.G., 1989. Use of multipara-
meter relative-age methods for age estimation and correlation of
alluvial fansurfaces on a desert piedmont, eastern Mojave Des-
ert, California. Quat. Res. 32, 276–290.
Nichols, K.K., 2000. A multiscale approach to understanding desert
piedmonts using cosmogenic isotopes and centimeter-scale sur-
veying. MSc Thesis, Univ. Vermont, Burlington, VT, 264 pp.
Nichols, K.K., Bierman, P.R., 2002. Fifty-four years of ephemeral
channel response to two years of intense military activity during
World War II, at Camp Iron Mountain, Mojave Desert, Califor-
nia. In: Ehlen, J., Harmon, R.S. (Eds.), The Environmental Leg-
acy of Military Operations. Geol. Soc. Am. Rev. in Eng. Geol.,
vol. 14, pp. 123–136.
Nishiizumi, K., Winterer, E.L., Kohl, C.P., Klein, J., Middleton, R.,
Lal, D., Arnold, J.R., 1989. Cosmic ray production rates of 10Be
and 26Al in quartz from glacially polished rocks. J. Geophy. Res.
94, 17907–17915.
NOAA, 1982. Monthly normals of temperature, precipitation, and
heating and cooling degree days 1951–1980, California, U.S.
National Oceanic and Atmospheric Administration (NOAA),
Asheville, NC.
Oberlander, T.M., 1974. Landscape inheritance and the pediment
problem in the Mojave Desert of southern California. Am. J.
Sci. 274, 849–875.
Paige, S., 1912. Rock-cut surfaces in desert ranges. J. Geol. 20,
442–450.
Phillips, W.M., McDonald, E.V., Reneau, S.L., Poths, J., 1998.
Dating soils and alluvium with cosmogenic 21Ne depth profiles:
K.K. Nichols et al. / Geomorphology 45 (2002) 105–125124
case studies from the Pajarito Plateau, New Mexico, USA. Earth
Planet. Sci. Lett. 160, 209–223.
Rachocki, A., 1981. Alluvial Fans an Attempt at an Empirical Ap-
proach. Wiley, New York, 161 pp.
Reid, I., Laronne, J.B., 1995. Bed load sediment transport in an
ephemeral stream and a comparison with seasonal and perennial
counterparts. Water Resour. Res. 31, 773–781.
Ritter, D.F., 1978. Process Geomorphology. W.M.C. Brown, Debu-
que, IA, 603 pp.
Small, E.E., Anderson, R.S., Hancock, G.S., 1999. Estimates of the
rate of regolith production using 10Be and 26Al from an alpine
hillslope. Geomorphology 27, 131–150.
Spaulding, W.G., Graumlich, L.J., 1986. The last pluvial climatic
episodes in the deserts of southwestern North America. Nature
320, 441–444.
Spaulding, W.G., Leopold, E.B., van Devender, T.R., 1983. Late
Wisconsin paleoecology of the American southwest. In: Wright,
H.E. (Ed.), Late-Quaternary Environments of the United States-
Porter, S.C. (Ed.), The Late Pleistocene, vol. 1. Univ. Minnesota
Press, Minneapolis, pp. 259–293.
Wells, S.G., McFadden, L.D., Dohrenwend, J.C., 1987. Influence of
Late Quaternary climatic changes on geomorphic and pedogenic
processes on a desert piedmont, eastern Mojave Desert, Califor-
nia. Quat. Res. 27, 130–146.
Yair, A., 1999. Sede Boquer research site. In: Lekach, J., Hassan,
M.A. (Eds.), Drainage Basin Dynamics and Morphology: Con-
ference Excursion-Negev Desert (Excursion Guide). Hebrew
Univ., Jerusalem, pp. 18–51.
K.K. Nichols et al. / Geomorphology 45 (2002) 105–125 125