Embed Size (px)
Citation preview
University of Southern Denmark
Quantification on Degradation Mechanisms of Polymer Electrolyte Membrane Fuel CellCatalyst Layers during an Accelerated Stress Test
Sharma, Raghunandan; Andersen, Shuang Ma
Published in:ACS Catalysis
DOI:10.1021/acscatal.8b00002
Publication date:2018
Document version:Accepted manuscript
Citation for pulished version (APA):Sharma, R., & Andersen, S. M. (2018). Quantification on Degradation Mechanisms of Polymer ElectrolyteMembrane Fuel Cell Catalyst Layers during an Accelerated Stress Test. ACS Catalysis, 8(4), 3424-3434.https://doi.org/10.1021/acscatal.8b00002
Go to publication entry in University of Southern Denmark's Research Portal
Terms of useThis work is brought to you by the University of Southern Denmark.Unless otherwise specified it has been shared according to the terms for self-archiving.If no other license is stated, these terms apply:
• You may download this work for personal use only. • You may not further distribute the material or use it for any profit-making activity or commercial gain • You may freely distribute the URL identifying this open access versionIf you believe that this document breaches copyright please contact us providing details and we will investigate your claim.Please direct all enquiries to [email protected]
Download date: 17. Feb. 2022
Subscriber access provided by University Library of Southern Denmark
is published by the American Chemical Society. 1155 Sixteenth Street N.W.,Washington, DC 20036Published by American Chemical Society. Copyright © American Chemical Society.However, no copyright claim is made to original U.S. Government works, or worksproduced by employees of any Commonwealth realm Crown government in the courseof their duties.
Quantification on degradation mechanisms of polymer electrolytemembrane fuel cell catalyst layers during accelerated stress test
Raghunandan Sharma, and Shuang Ma AndersenACS Catal., Just Accepted Manuscript • DOI: 10.1021/acscatal.8b00002 • Publication Date (Web): 14 Mar 2018
Downloaded from http://pubs.acs.org on March 15, 2018
Just Accepted
“Just Accepted” manuscripts have been peer-reviewed and accepted for publication. They are postedonline prior to technical editing, formatting for publication and author proofing. The American ChemicalSociety provides “Just Accepted” as a service to the research community to expedite the disseminationof scientific material as soon as possible after acceptance. “Just Accepted” manuscripts appear infull in PDF format accompanied by an HTML abstract. “Just Accepted” manuscripts have been fullypeer reviewed, but should not be considered the official version of record. They are citable by theDigital Object Identifier (DOI®). “Just Accepted” is an optional service offered to authors. Therefore,the “Just Accepted” Web site may not include all articles that will be published in the journal. Aftera manuscript is technically edited and formatted, it will be removed from the “Just Accepted” Website and published as an ASAP article. Note that technical editing may introduce minor changesto the manuscript text and/or graphics which could affect content, and all legal disclaimers andethical guidelines that apply to the journal pertain. ACS cannot be held responsible for errors orconsequences arising from the use of information contained in these “Just Accepted” manuscripts.
1
Quantification on degradation mechanisms of polymer electrolyte
membrane fuel cell catalyst layers during accelerated stress test
Raghunandan Sharma and Shuang Ma Andersen*
Department of Chemical Engineering, Biotechnology and Environmental Technology, University of
Southern Denmark, Campusvej 55, DK-5230 Odense M, Denmark
* Corresponding author: [email protected]
Abstract
Long term durability of the catalyst layers of a low working temperature fuel cell such as polymer
electrolyte membrane fuel cell (PEMFC) is of significant scientific interest owing to their operation
criteria and high initial cost. Identification of degradation mechanisms quantitatively during an
accelerated stress test (AST) is essential to assess and improve the durability of such catalyst layers.
In this study, we present a quantitative analysis of the degradation mechanisms such as (i) electronic
connectivity loss due to carbon support corrosion, (ii) proton connectivity loss due to
ionomer/catalyst interface loss, (iii) catalyst loss due to dissolution or detachment, and (iv) physical
surface area loss due to particle growth responsible for the electrochemical surface area (ECSA)
loss in Pt-based catalyst layers for PEMFCs during an AST performed through potential cycling
(linear sweep cyclic voltammetry) between 0.4 and 1.6 V for 7000 cycles in Ar saturated 1 M
H2SO4. Using a half membrane electrode assembly (half-MEA), where a gas diffusion electrode
with genuine three-phase-boundaries is used as working electrode through solid electrolyte, we
have observed the ECSA loss due to ionomer/catalyst interface loss and identified catalyst
heterogeneous degradation pattern during AST. Results suggest a significant ECSA loss due to
catalyst isolation (~64% of ECSA loss) from loss of electron and proton connectivities respectively
by catalyst support corrosion (~45%) and ionomer/catalyst interface loss (~19%), followed by
Page 1 of 28
ACS Paragon Plus Environment
ACS Catalysis
123456789101112131415161718192021222324252627282930313233343536373839404142434445464748495051525354555657585960
2
particle growth (~30%) and dissolution/detachment (6%) . Such knowledge and methodology can
effectively contribute to catalyst material screening and electrode structure development to advance
the PEMFC technology.
Keywords
Degradation mechanism, support corrosion, catalyst/ionomer interface, catalyst isolation,
heterogeneous degradation, half-MEA
Introduction
Despite their high power conversion efficiency, suitability for a broad range of power requirements
and environmentally friendly nature, large scale application of polymer electrolyte membrane fuel
cells (PEMFCs) is hindered by the high initial cost and low durability of noble metal, especially Pt-
based catalyst layers.1-2 Significant efforts are being made since long to understand and mitigate the
catalyst degradation mechanisms for the development of highly durable PEMFC catalyst layers.3-6
Strategies being employed to enhance the catalyst layer durability include mainly (i) the mitigation
of catalyst support corrosion by using highly durable support materials such as carbon
nanomaterials,7 8-10 carbon-free supports,11-12 etc., and (ii) the enhancement of Pt stability through
bulk and surface compositional modifications.13-15 Noteworthy research with partial success makes
the topic more exciting with possibility for improvements.
In heterogeneous catalysis, the functioning of a catalytically active site depends not only on its
catalytic activity but also on its interaction with surrounding media responsible for ensuring the
accessibility to reaction species and the removal of byproducts. Particularly, in PEMFCs,
performance of catalyst layers towards catalysis of oxygen reduction reaction (ORR; O2 + 4H+ + 4e-
→ 2H2O) and hydrogen oxidation reaction (HOR; H2 → 2H+ + 2e-) depends on the electronic,
protonic and reactant gas connectivity values of the active sites.16 In a state-of-the-art PEMFC
Page 2 of 28
ACS Paragon Plus Environment
ACS Catalysis
123456789101112131415161718192021222324252627282930313233343536373839404142434445464748495051525354555657585960
3
catalyst layer, the catalyst ink consists of a mixture of the polycrystalline Pt-group metal
nanoparticles supported on high surface area carbon and the proton conducting ionomer (e.g.
Nafion®) in a typical ratio of 70:30 (w/w). The desired connectivity to e- and H+ are achieved
through the carbon support and the ionomer, respectively.
The performance degradation of a catalyst layer during operation is essentially due to either the
change in the type or the number of active sites accessible for the reaction. Accelerated stress test
(AST) based on evolution of the parameters such as electrochemical surface area (ECSA) during a
potential cycling between specified potential range, which is a measure of combination of the type
and number of the active sites, has been used frequently for experimental evaluation of the
durability of such catalyst layers. However, in a state-of-the-art PEMFC catalyst layer, the type of
active site may be considered to be unchanged (assuming random orientation of crystallite faces)
during AST. Under this assumption, the change in ECSA of a catalyst layer during operation/AST
may be assigned to the change in the number of accessible active sites. Performance degradation
due to the reduced number of active sites and hence reduced ECSA may be assigned principally to
(i) catalyst isolation due to carbon support corrosion (electronic connectivity loss),17-20 (ii) catalyst
isolation due to ionomer/catalyst interface loss (proton connectivity loss), (iii) loss of catalyst
loading due to dissolution or detachment and (iv) coarsening of catalyst nanoparticles due to
mechanisms such as electrochemical dissolution/redeposition (Ostwald ripening), migration, etc.21
Substantial attention has been paid in recent past towards the identification of electrode
performance degradation mechanisms, which requires a combination of electrochemical and
structural characterization techniques. While the distribution of particle size can be observed
directly using transmission electron microscopy (TEM) or be estimated indirectly through X-ray
diffraction (XRD), loss due to Pt-dissolution may be estimated through elemental analysis
techniques.22-24 Borup et al. have estimated the effect of carbon corrosion on durability by using the
Page 3 of 28
ACS Paragon Plus Environment
ACS Catalysis
123456789101112131415161718192021222324252627282930313233343536373839404142434445464748495051525354555657585960
4
Pt/C XRD signal ratio before and after AST and a decreased carbon signal was attributed to the
carbon corrosion.3 Similarly, identical location TEM (IL-TEM) has been employed to observe
various degradation mechanisms such as support corrosion, agglomeration, dissolution and
detachment of catalyst particles.21, 25 Those works focus on the catalyst itself, which is certainly
essential, but remain isolated from the electrode level and ignore huge impact from the interface
structure; moreover, the estimation of H+ connectivity loss for the standard three-electrode AST has
not been arguably reported.
Present study attempts to quantify the fractional contributions of the ECSA loss mechanisms of a
state-of-the-art PEMFC catalyst layer during an AST performed through potential cycling (linear
sweep cyclic voltammetry) between 0.4 and 1.6 V in Ar saturated 1 M H2SO4. Despite significant
scientific emphasis on development of catalyst layers with improved durability, fractional
quantification of ECSA loss among the aforementioned mechanisms has not been arguably
presented due to the inherent limitations of the AST using a three-electrode setup measuring ECSA
evolution with potential cycling in liquid electrolytes (Fig. 1a). As shown in Fig. 1b, ECSA
measurement using liquid electrolyte provides two H+ conduction pathways, namely through liquid
electrolyte and through solid electrolyte - ionomer. Hence, particles having no H+ connectivity
through ionomer (type -2) also contribute to ECSA and hence the effect of catalyst isolation due to
ionomer/catalyst interface loss/detachment cannot be detected. Moreover, such artificial proton
conductivity also leads to false degradation.
In the present study, a modified three-electrode setup consisting of a working electrode in form of
half membrane electrode assembly (half-MEA) along with the conventional reference and counter
electrodes (Fig. 1d) has been used. As shown in Fig. 1e, the setup avoids the H+ conduction
pathway through liquid electrolyte and hence enables estimation of the ionomer/catalyst interface
loss /detachment. Possible types of e- and H+ pathways to Pt particles after AST (owing to particle
Page 4 of 28
ACS Paragon Plus Environment
ACS Catalysis
123456789101112131415161718192021222324252627282930313233343536373839404142434445464748495051525354555657585960
5
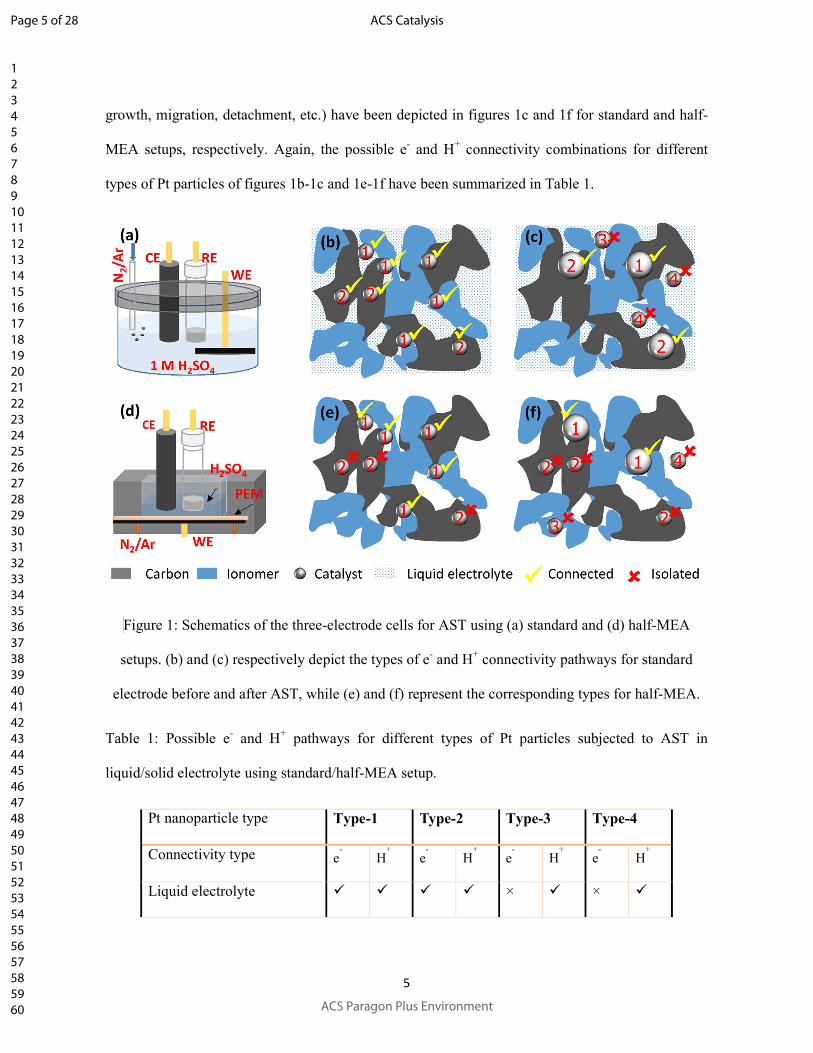
growth, migration, detachment, etc.) have been depicted in figures 1c and 1f for standard and half-
MEA setups, respectively. Again, the possible e- and H+ connectivity combinations for different
types of Pt particles of figures 1b-1c and 1e-1f have been summarized in Table 1.
Figure 1: Schematics of the three-electrode cells for AST using (a) standard and (d) half-MEA
setups. (b) and (c) respectively depict the types of e- and H+ connectivity pathways for standard
electrode before and after AST, while (e) and (f) represent the corresponding types for half-MEA.
Table 1: Possible e- and H+ pathways for different types of Pt particles subjected to AST in
liquid/solid electrolyte using standard/half-MEA setup.
Pt nanoparticle type Type-1 Type-2 Type-3 Type-4
Connectivity type e- H
+ e
- H
+ e
- H
+ e
- H
+
Liquid electrolyte × ×
Page 5 of 28
ACS Paragon Plus Environment
ACS Catalysis
123456789101112131415161718192021222324252627282930313233343536373839404142434445464748495051525354555657585960
6
Solid electrolyte × × × ×
Accelerated stress test, as a mimic of realistic but extreme operation conditions on catalytic
structure in a fuel cell can be expensive, complex and high risk due to involvement of many other
operation factors. Half-MEA has advantages such as: (i) systematic study of only one electrode at a
time (only anode or cathode); (ii) stable and independent counter and reference electrode for
reliable measurements; (iii) realistic three-phase-boundary, not restricted to gas diffusion limit; (iv)
economic, flexible and open to a variety of parameters of interest. Such approach can be a powerful
tool to clarify reaction and/or degradation mechanisms of electrochemical structures and
realistically optimize electrode design for energy conversion related technologies.
2. Experimental methods
2.1 Half-MEA cell assembly
To distinguish between the two proton conduction pathways to catalyst particles, electrochemical
measurements were performed using two different three-electrode setups, namely the standard setup
consisting of working electrode (WE), reference electrode (RE) and counter electrode (CE) in direct
contact with liquid electrolyte (1 M H2SO4) and the half-MEA setup where dissimilar to RE and
CE, the WE was kept in direct contact with a solid electrolyte – proton exchange membrane PEM
(Nafion® 212) instead of liquid electrolyte.26 While both the proton conduction pathways to the
catalyst particles at WE were accessible in the standard setup (WE directly in contact with liquid
electrolyte), the half-MEA setup (WE in contact with liquid electrolyte through PEM) was used to
block the liquid electrolyte pathway.
State-of-the-art catalyst layers were used for both the half-MEA and the standard setups to ensure
high utilization, i.e. a negligible fraction of catalyst particles of type-2. The WE for half-MEA
Page 6 of 28
ACS Paragon Plus Environment
ACS Catalysis
123456789101112131415161718192021222324252627282930313233343536373839404142434445464748495051525354555657585960
7
setup, resembling half of the standard MEAs used in a PEMFC was prepared at EWII fuel cells A/S
through state-of-the-art process used for the full MEAs. Briefly, an electrode sheet (2.86 cm2)
consisting of HiSPEC® 9100 Pt/C (0.6 mgPt cm-2) catalyst and 30 wt% Nafion ionomer spray coated
on a gas diffusion layer (GDL; BD35 SIGRACET®) was hot pressed with a PEM (Nafion® 212) to
form the half-MEA. As shown in Fig. 1d, the half-MEA three-electrode assembly consisted of a
stainless steel (SS) bottom plate with gas inlet and outlet, a graphite end plate with serpentine flow
channels (2.0 × 2.0 cm2 flow channel area), the half-MEA (GDL side facing the flow channels), and
a top plate (~2 cm thick Teflon block) with a central opening of 2.0 × 2.0 cm2 to provide liquid
electrolyte access to the half-MEA such that the liquid electrolyte was in direct contact with its
PEM side. The cell was tightened using four screws through the holes in the bottom and top plates
with a torque of 5.0 cmkp, while the gas/liquid sealing was achieved through appropriate use of o-
rings. The WE was connected to outer circuit through the bottom SS plate, while the RE and CE
were in direct contact to the liquid electrolyte.
On the other hand, measurements in liquid electrolyte (standard setup) were performed in a Teflon
cell of dimensions similar to those of the half-MEA cell. The WE, a 10 mm diameter circular sheet
of HiSPEC® 9100 Pt/C (0.6 mgPt cm-2) spray-coated on a GDL (BD35 SIGRACET®), was
connected to outer circuit through a 0.2 mm thick gold wire.
2.2 Electrochemical measurements
The durability and degradation mechanisms were studied by subjecting the electrodes to linear
sweep cyclic voltammetry cycling for 7000 cycles using 1 M H2SO4 electrolyte (prepared using
H2SO4; EMSURE® grade, assay > 95 – 97%, Merck, Germany and Milli-Q water; resistivity ≥ 18.2
MΩ·cm at 25 °C) in an inert atmosphere (Ar) within a potential range of 0.4-1.6 V. The wide
potential range was selected to enable various degradation mechanisms such as carbon corrosion,
Page 7 of 28
ACS Paragon Plus Environment
ACS Catalysis
123456789101112131415161718192021222324252627282930313233343536373839404142434445464748495051525354555657585960
8
Pt-dissolution/re-deposition, etc. to act simultaneously.27 For half-MEA setup, inert atmosphere was
created by continuous flow of Ar (humidified by bubbling through Milli-Q water bubbler at room
temperature) through the gas flow channels of the end plate while for the standard three-electrode
setup, Ar was bubbled directly through the electrolyte. For both setups, a carbon rod worked as the
counter electrode while the potentials were measured using Hg/Hg2SO4 reference electrode (REF
601 Radiometer®) and reported w.r.t. RHE. The electrolyte volume was kept constant (4.0 mL) for
all the measurements in both types of setups. All the electrochemical measurements were performed
using Zahner®IM6e electrochemical workstation. Reproducibility of the electrochemical
measurements was confirmed by at least two repeated measurements.
The ECSA and double layer capacitance (DLC) measurements were performed after 0, 20, 100,
200, 300, 400, 500, 600, 800, 1K, 2K, 3K, 4K, 5k, 6K and 7K stress cycles by using the cyclic
voltammograms recorded with a potential sweep rate of 10 mV s-1 for two cycles within the
potential ranges of 0.02-1.2 V and 0.1-1.2 V for standard and half-MEA setups, respectively. The
lower limit for half-MEA setup was set to 0.1 V to avoid the observed hydrogen evolution below
0.1 V, due to potential offset from electrolyte resistance. The area under the hydrogen adsorption
peak (cathodic scan) of the second cycle was used to calculate the ECSA, while the DLC was
measured using the difference between the cathodic and anodic currents in the region away from the
faradaic reactions (Fig. S1, in supporting information).
2.3 Structural characterizations
Measurements of Pt-loading on the electrodes before and after AST were performed through X-ray
fluorescence spectroscopy (XRF) using a Thermo Scientific Niton XL3t GOLDD+ XRF analyzer.
Thermogrametric analysis (TGA) and differential scanning calorimetry (DSC) measurements of the
pre-AST and post-AST samples were performed in presence of O2 (1:3 mixture of O2 and N2) at a
Page 8 of 28
ACS Paragon Plus Environment
ACS Catalysis
123456789101112131415161718192021222324252627282930313233343536373839404142434445464748495051525354555657585960
9
heating rate 0f 5 oC min-1 using NETZSCH STA449 F3 thermal analyzer. X-ray diffraction (XRD)
patterns of the samples to study the crystallite size evolution of Pt nanoparticles were collected
through a Rigaku Miniflex 600 X-ray diffractometer using Cu K α (λ = 1.5418 Å) radiation). Peak
fitting and data analysis was assisted by using OriginPro 9.1. The electrode sheets were directly
mounted on a glass sample holder with the catalyst layer side facing the X-ray beam. Transmission
electron microscope (JEOL JEM-2100, 200 kV) was employed to investigate the pre-AST and post-
AST particle size distributions.
3. Results
3.1 Accelerated stress test
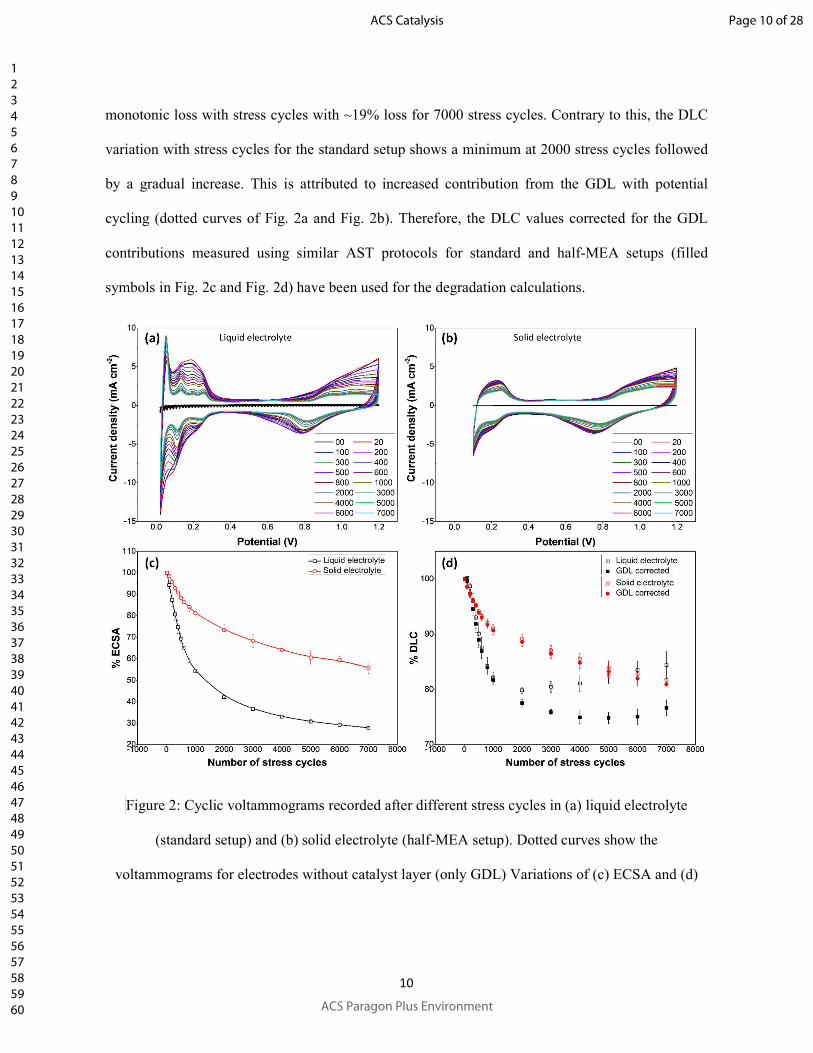
Evolution of cyclic voltammograms with stress cycles for the AST using standard setup and half-
MEA has been depicted in Fig. 2a and Fig. 2b, respectively. The voltammograms from both the
setups show the characteristic peaks corresponding to (i) hydrogen adsorption and desorption for
cathodic and anodic scans below 0.4 V, respectively, and (ii) platinum oxidation during anodic
scans for potentials higher than 0.8 V and reduction of platinum oxides during cathodic scans in
between 0.5 and 0.9 V. After the AST, the hydrogen adsorption-desorption peaks corresponding to
weakly (0.12 V) and strongly (0.28 V) bound hydrogen can be observed clearly for the standard
setup. However, these components of the hydrogen adsorption-desorption peaks remain unresolved
for the post/AST voltammograms from half-MEA possibly due to lower extent of Ostwald ripening
and hence lower evolution of crystalline faces responsible for the peaks.
Evolutions of ECSA and DLC with stress cycles (averaged for different measurements; error bars
show the standard deviation) for the two setups have been shown in Fig. 2c and Fig. 2d (open
symbols), respectively. For 7000 stress cycles, the ECSA loss observed using half-MEA was ~42%
as compared to that of ~72% for the standard setup. Again, the DLC for half-MEA shows a
Page 9 of 28
ACS Paragon Plus Environment
ACS Catalysis
123456789101112131415161718192021222324252627282930313233343536373839404142434445464748495051525354555657585960
10
monotonic loss with stress cycles with ~19% loss for 7000 stress cycles. Contrary to this, the DLC
variation with stress cycles for the standard setup shows a minimum at 2000 stress cycles followed
by a gradual increase. This is attributed to increased contribution from the GDL with potential
cycling (dotted curves of Fig. 2a and Fig. 2b). Therefore, the DLC values corrected for the GDL
contributions measured using similar AST protocols for standard and half-MEA setups (filled
symbols in Fig. 2c and Fig. 2d) have been used for the degradation calculations.
Figure 2: Cyclic voltammograms recorded after different stress cycles in (a) liquid electrolyte
(standard setup) and (b) solid electrolyte (half-MEA setup). Dotted curves show the
voltammograms for electrodes without catalyst layer (only GDL) Variations of (c) ECSA and (d)
Page 10 of 28
ACS Paragon Plus Environment
ACS Catalysis
123456789101112131415161718192021222324252627282930313233343536373839404142434445464748495051525354555657585960
11
DLC with stress cycles for standard and half-MEA setups. Open and filled symbols respectively
represent the values without and with corrections for GDL contributions.
3.2 Microscopy
Particle coarsening during the AST was examined through TEM of the post-AST samples. TEM
samples were prepared by dispersing the catalyst layers in an ethanol/miliQ water mixture (1/2 v/v)
by ultrasonic agitation (60 s using ultrasonic probe; hielscher up200st). For the sample from
standard setup, the catalyst layer was scratched from the GDL mechanically, while for the half-
MEA, it was scratched from the PEM and the GDL, after delaminating them.
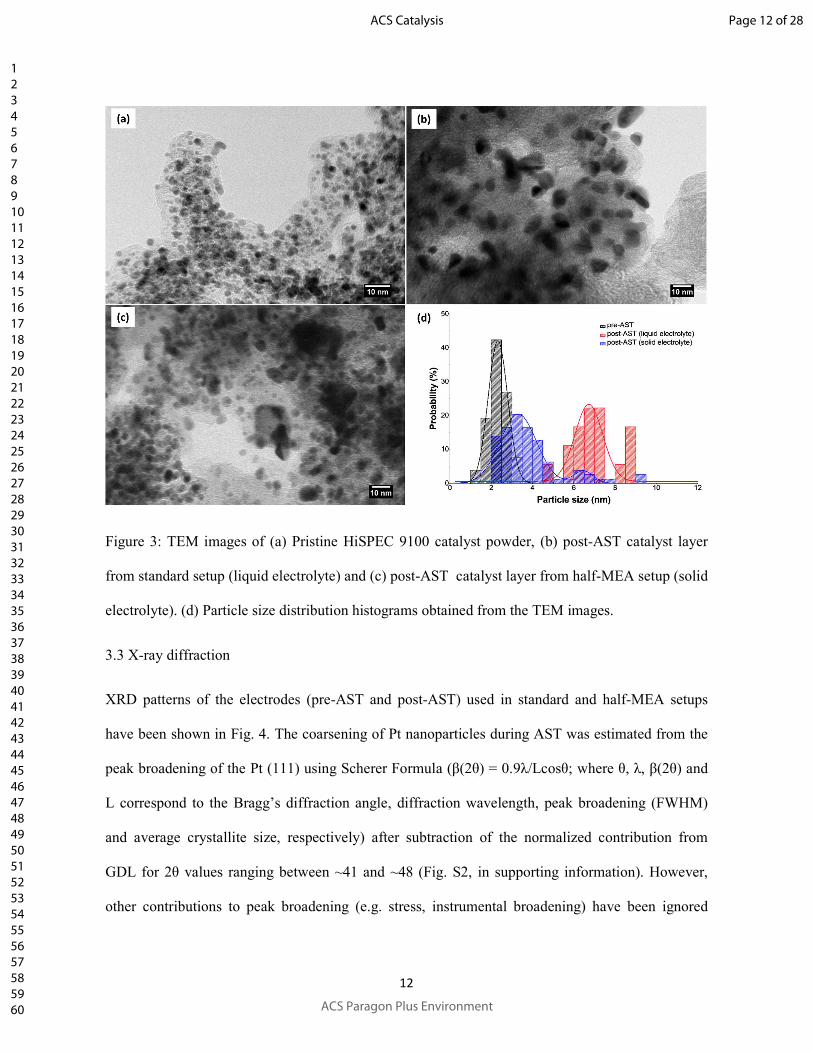
TEM micrographs of the catalyst before and after durability tests have been shown in Fig. 3. Fig. 3
(a) illustrates morphology of the pristine catalyst. The TEM image of post-AST sample from
standard setup (Fig. 3b) shows a clear growth of almost all the particles (homogeneous growth),
which along with the fact that no particles with initial shape and size are observable, suggests both
e- and H+ connectivity values to all the catalyst particles. On the other hand, the TEM image of Fig.
3c for the post-AST sample from half-MEA shows a mixed particle size distribution (heterogeneous
growth). As can be confirmed from the particle size distribution histograms of Fig. 3d, for half-
MEA (Image analysis by using ImageJ28 for particle size estimation; excluding observable
agglomerates), two groups of particle sizes corresponding to the original and the coarsened particles
can be clearly distinguished. The particle size distribution looks more similar to that of the TEM
images of catalysts after AST using a single PEMFC.29
Page 11 of 28
ACS Paragon Plus Environment
ACS Catalysis
123456789101112131415161718192021222324252627282930313233343536373839404142434445464748495051525354555657585960
12
Figure 3: TEM images of (a) Pristine HiSPEC 9100 catalyst powder, (b) post-AST catalyst layer
from standard setup (liquid electrolyte) and (c) post-AST catalyst layer from half-MEA setup (solid
electrolyte). (d) Particle size distribution histograms obtained from the TEM images.
3.3 X-ray diffraction
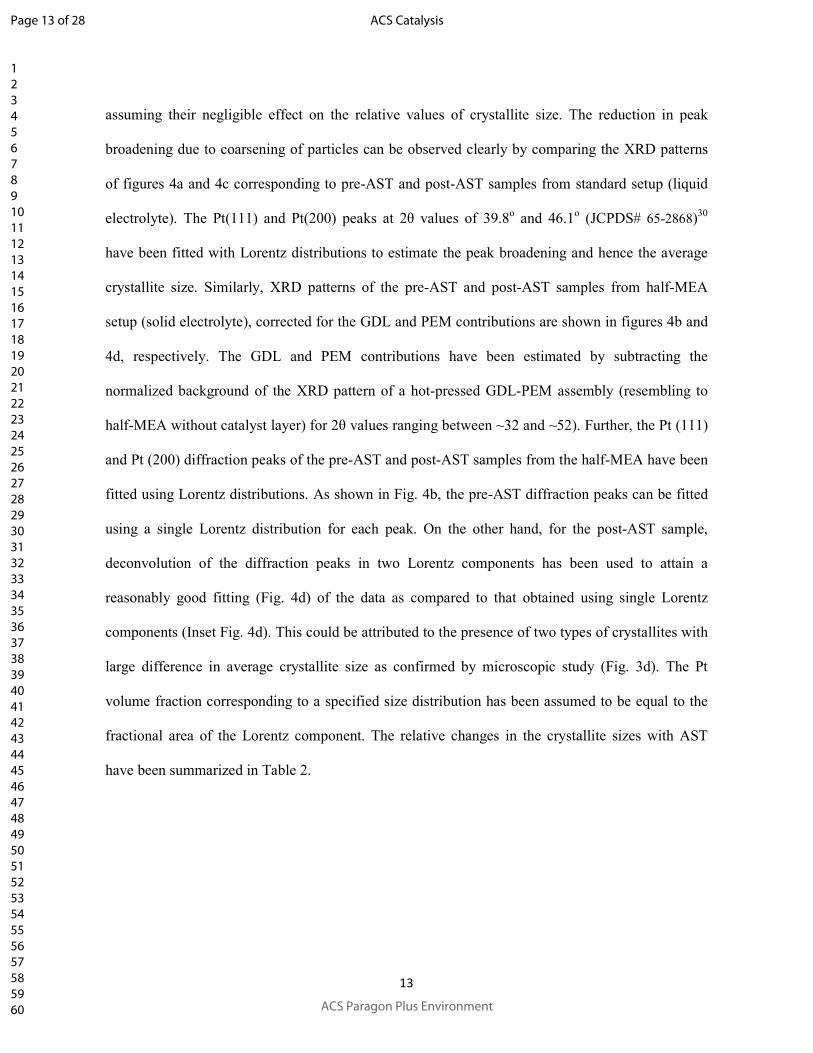
XRD patterns of the electrodes (pre-AST and post-AST) used in standard and half-MEA setups
have been shown in Fig. 4. The coarsening of Pt nanoparticles during AST was estimated from the
peak broadening of the Pt (111) using Scherer Formula (β(2θ) = 0.9λ/Lcosθ; where θ, λ, β(2θ) and
L correspond to the Bragg’s diffraction angle, diffraction wavelength, peak broadening (FWHM)
and average crystallite size, respectively) after subtraction of the normalized contribution from
GDL for 2θ values ranging between ~41 and ~48 (Fig. S2, in supporting information). However,
other contributions to peak broadening (e.g. stress, instrumental broadening) have been ignored
Page 12 of 28
ACS Paragon Plus Environment
ACS Catalysis
123456789101112131415161718192021222324252627282930313233343536373839404142434445464748495051525354555657585960
13
assuming their negligible effect on the relative values of crystallite size. The reduction in peak
broadening due to coarsening of particles can be observed clearly by comparing the XRD patterns
of figures 4a and 4c corresponding to pre-AST and post-AST samples from standard setup (liquid
electrolyte). The Pt(111) and Pt(200) peaks at 2θ values of 39.8o and 46.1o (JCPDS# 65-2868)30
have been fitted with Lorentz distributions to estimate the peak broadening and hence the average
crystallite size. Similarly, XRD patterns of the pre-AST and post-AST samples from half-MEA
setup (solid electrolyte), corrected for the GDL and PEM contributions are shown in figures 4b and
4d, respectively. The GDL and PEM contributions have been estimated by subtracting the
normalized background of the XRD pattern of a hot-pressed GDL-PEM assembly (resembling to
half-MEA without catalyst layer) for 2θ values ranging between ~32 and ~52). Further, the Pt (111)
and Pt (200) diffraction peaks of the pre-AST and post-AST samples from the half-MEA have been
fitted using Lorentz distributions. As shown in Fig. 4b, the pre-AST diffraction peaks can be fitted
using a single Lorentz distribution for each peak. On the other hand, for the post-AST sample,
deconvolution of the diffraction peaks in two Lorentz components has been used to attain a
reasonably good fitting (Fig. 4d) of the data as compared to that obtained using single Lorentz
components (Inset Fig. 4d). This could be attributed to the presence of two types of crystallites with
large difference in average crystallite size as confirmed by microscopic study (Fig. 3d). The Pt
volume fraction corresponding to a specified size distribution has been assumed to be equal to the
fractional area of the Lorentz component. The relative changes in the crystallite sizes with AST
have been summarized in Table 2.
Page 13 of 28
ACS Paragon Plus Environment
ACS Catalysis
123456789101112131415161718192021222324252627282930313233343536373839404142434445464748495051525354555657585960
14
Figure 4: XRD patterns of (a) pre-AST standard electrode (b) pre-AST half-MEA, (c) post- AST
standard electrode and (d) post-AST half-MEA samples with Pt (111) and Pt (200) peaks corrected
for GDL and/or PEM contributions and fitted using Lorentz distributions (Inset: Improper fit with
large residues when using single Lorentz components for Pt peaks).
3.4 Thermal analysis
Thermogravimetry (TG), differential TG (DTG) and differential scanning calorimetry (DSC)
studies of the pre-AST and post-AST samples were performed to observe the structural
modifications during AST. For standard electrode, the thermal analysis has been performed both on
the whole electrode consisting of catalyst layer and GDL (Std. electrode) and on the catalyst layer
Page 14 of 28
ACS Paragon Plus Environment
ACS Catalysis
123456789101112131415161718192021222324252627282930313233343536373839404142434445464748495051525354555657585960
15
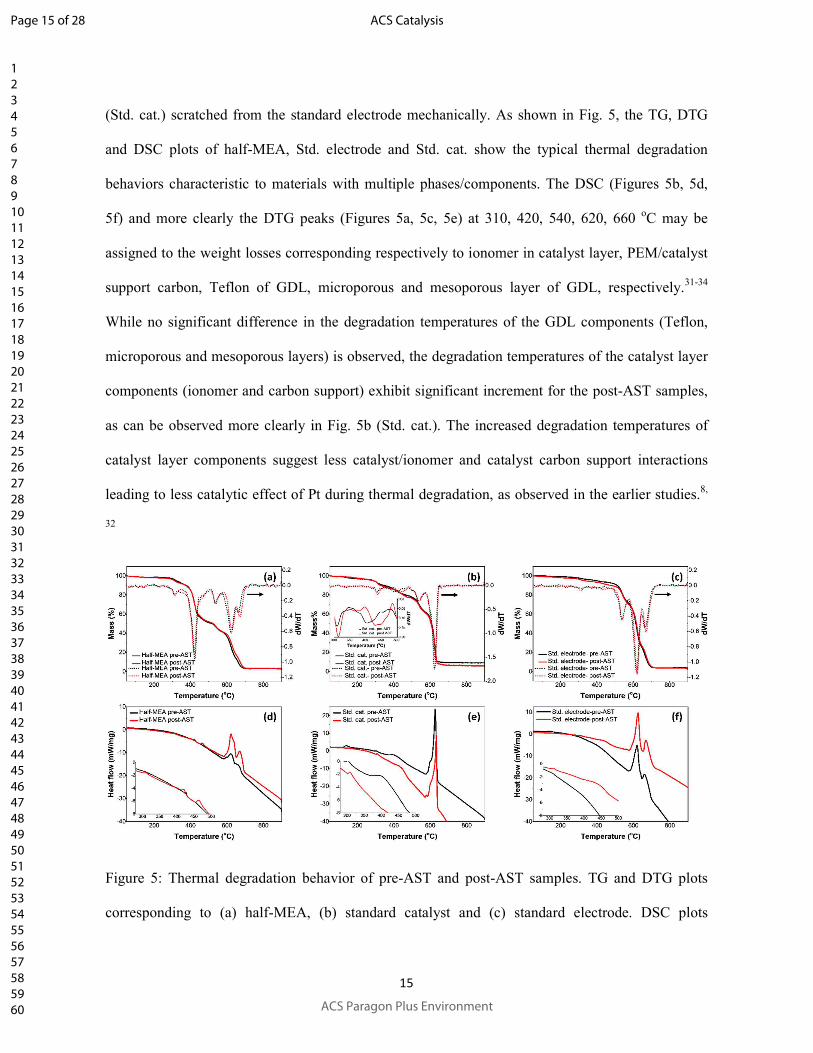
(Std. cat.) scratched from the standard electrode mechanically. As shown in Fig. 5, the TG, DTG
and DSC plots of half-MEA, Std. electrode and Std. cat. show the typical thermal degradation
behaviors characteristic to materials with multiple phases/components. The DSC (Figures 5b, 5d,
5f) and more clearly the DTG peaks (Figures 5a, 5c, 5e) at 310, 420, 540, 620, 660 oC may be
assigned to the weight losses corresponding respectively to ionomer in catalyst layer, PEM/catalyst
support carbon, Teflon of GDL, microporous and mesoporous layer of GDL, respectively.31-34
While no significant difference in the degradation temperatures of the GDL components (Teflon,
microporous and mesoporous layers) is observed, the degradation temperatures of the catalyst layer
components (ionomer and carbon support) exhibit significant increment for the post-AST samples,
as can be observed more clearly in Fig. 5b (Std. cat.). The increased degradation temperatures of
catalyst layer components suggest less catalyst/ionomer and catalyst carbon support interactions
leading to less catalytic effect of Pt during thermal degradation, as observed in the earlier studies.8,
32
Figure 5: Thermal degradation behavior of pre-AST and post-AST samples. TG and DTG plots
corresponding to (a) half-MEA, (b) standard catalyst and (c) standard electrode. DSC plots
Page 15 of 28
ACS Paragon Plus Environment
ACS Catalysis
123456789101112131415161718192021222324252627282930313233343536373839404142434445464748495051525354555657585960
16
corresponding to (d) half-MEA, (e) standard catalyst and (f) standard electrode. Insets of (b), (c),
(d) and (f) show magnified views of some of the less intense peaks.
4. Discussion
4.1 Estimation of catalyst dissolution and physical detachment loss
Estimation of the decrease in catalyst loading during AST due to various processes35 such as
chemical dissolution, electrochemical dissolution-redeposition and physical detachment of
catalyst/support is challenging. Solution study with spectroscopy techniques is insufficient as part
of the dissolved Pt may redeposit on surfaces in contact with the electrolyte (cell walls, counter
electrode, etc.). Such a redeposition of Pt on the gold wire used to connect WE in the standard setup
has been observed in the present study. Again, the detachment of Pt-nanoparticles may remain
undetected in case of sedimentation of larger particles, even using the techniques capable of
detecting Pt0. To overcome the challenge, direct measurement of Pt-loading on the electrode was
performed before and after AST through XRF calibrated for electrodes with known Pt-loadings.
4.2 Quantification of ECSA degradation mechanisms
The fractional contribution from ECSA degradation mechanisms during AST can be quantified in
terms of the associated change in active surface area. Based on the e- and H+ connectivity of the
catalyst particles and their physical surface area, the overall ECSA loss can be attributed to various
degradation mechanisms such as (i) fractional loss of e- connectivity due to corrosion of catalyst
support (), (ii) fractional loss of H+ connectivity due to catalyst-ionomer detachment (), (iii)
fractional loss of Pt-loading due to Pt-dissolution and particle detachment () and (iv) fractional
loss of physical surface area due to coarsening of Pt nanoparticles through Ostwald ripening
/migration mechanisms ( ⁄ , where and are respectively the pre-AST and post-AST
specific areas determined from crystalline sizes. Assuming spherical shape of the nanoparticles,
Page 16 of 28
ACS Paragon Plus Environment
ACS Catalysis
123456789101112131415161718192021222324252627282930313233343536373839404142434445464748495051525354555657585960
17
when the mass keeps constant, ⁄ can be expressed as ⁄ , with and being the pre-AST
and post-AST particle radii (averaged), respectively).
The ECSA loss in percentage can be given by (S3, in supporting information)-
(1-
)*100 = 1 − [1 − + +] ×
*100 (1)
where =
, =
and =
are the fractional losses due to dissolution, e-
connectivity loss and H+ connectivity loss, respectively. Moreover, Mi, !, ! and ! represent
the initial loading of platinum, the mass loss of Pt due to dissolution, the Pt mass electrochemically
inactive due to e- connectivity loss, and the Pt mass electrochemically inactive due to H+
connectivity loss, respectively.
Fractional contribution of the support corrosion () can be estimated through the change in the
limiting double layer capacitance (DLC) of the electrode, which, in absence of any Faradaic
processes, depends only on the active electrode area.36 Assuming it to be associated mainly to the
high surface area carbon support, the reduction in DLC during AST has been associate to equivalent
fraction of Pt-nanoparticles losing e- connectivity. Similarly, the Pt loss due to dissolution and
detachment () was estimated by measuring the pre-AST and post-AST Pt loadings on the
electrode through XRF. Again, physical surface area loss due to particle growth has been estimated
from the pre-AST and post-AST crystalline sizes obtained from XRD analysis. As shown in Table
2, the XRD data show comparatively higher values of crystalline size as compared to those from
TEM. However, for the calculations in the present study, relative change of particle size are
consistent and the heterogeneous degradation (dissimilar growth of different particles during AST
using Half-MEA setup) can be confirmed from both the XRD and TEM data. The XRD crystalline
size was preferred over TEM as it contains information averaged over a large number of crystallites
while the particle size from TEM is based on a few (<100) particles. As shown in Table 2, while the
ECSA loss for liquid electrolyte can be assigned completely to these three degradation mechanisms
(calculated loss: ~74%; experimental loss: ~72%), the ionomer/catalyst interface loss mechanism
seems essential to explain the total ECSA loss using solid electrolyte (calculated loss: ~35%;
Page 17 of 28
ACS Paragon Plus Environment
ACS Catalysis
123456789101112131415161718192021222324252627282930313233343536373839404142434445464748495051525354555657585960
18
experimental loss: ~42%). Hence, the remaining fraction of ECSA loss not accommodated in the
three other mechanisms has been attributed to the ionomer/catalyst interface loss.
Table 2: Quantification of degradation mechanisms (AST for 7000 stress cycles as described in 2.2)
excluding ionomer/catalyst interaction loss
Electrolyte " (nm)*
ESAi* #$/&'(
DLC (F/g)
)*(+, -*,
+
XRD TEM
Liquid 9.2 7.3 70.5
205 0.41 0.72 0.74 0.13 0.23 - 0.36
Solid 1.8 & 9.8 3.3 & 6.5 51.2
217 0.82 0.42 0.35 0.03 0.19 0.08 0.13
)*(+,: Total ESA loss measured experimentally; -*,
: Total ESA loss calculated without considering the
contribution from ionomer corrosion; +: ESA loss due to particle growth; ": Post-AST particle size (".: Smaller
particles (74%); "$: Larger particles (26%)); *Particle size of pristine catalyst: TEM: 2.3 nm, XRD: 3.7 nm * Different lower integration limits are applied to the two setups as described in 2.2.
4.3 Degradation mechanism comparison for liquid and solid electrolytes
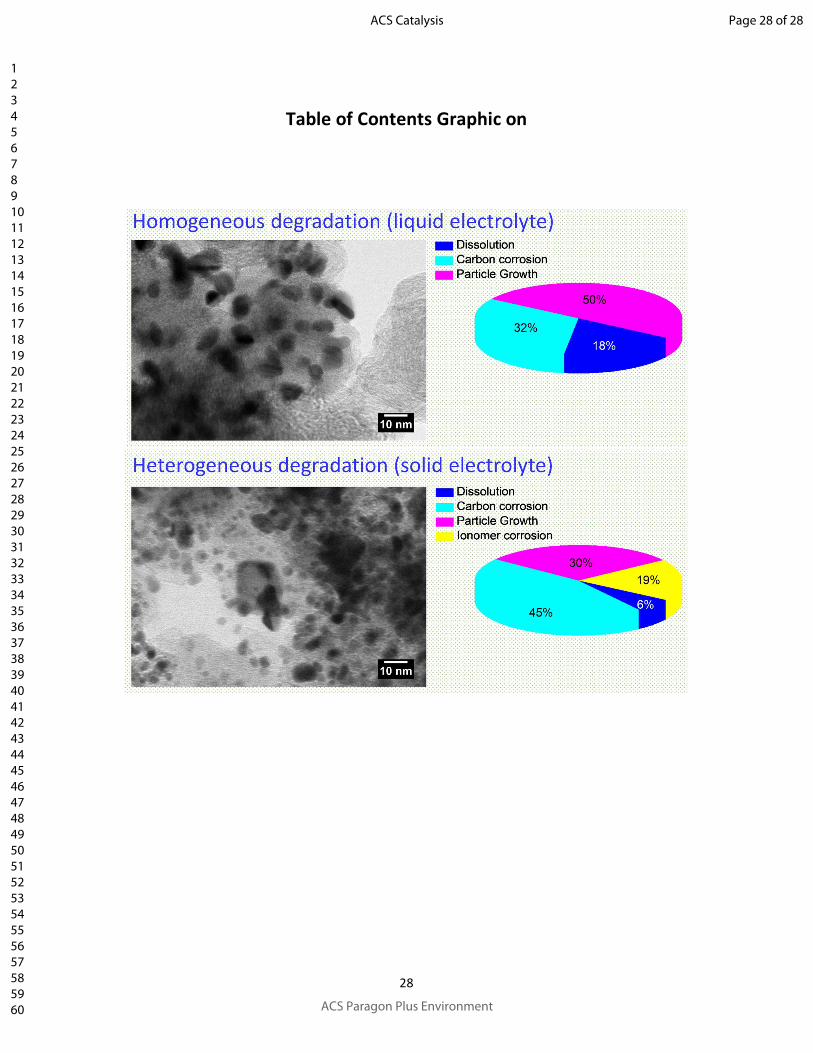
As can be seen in Table 2 and Fig. 6, the nature of catalyst ECSA loss during AST differs
considerably for the two AST setups. Higher total degradation in case of liquid electrolyte (72% as
compared to that of 42% using solid electrolyte) with ~50% fractional contribution from particle
growth suggests higher rate of Pt-dissolution and transport for redeposition in liquid electrolyte as
compared to that in the polymer electrolyte. Similar reasoning may be applied to the relatively
lower Pt-dissolution and particle growth losses for solid electrolyte as compared to that for liquid
electrolyte.
The dissimilar Ostwald ripening /migration behavior of Pt in liquid and polymer electrolytes and the
different H+ conduction pathways provide significant difference in the observed particle growth for
the standard and the half-MEA setups, with the reduction in physical surface area values being
~50% and ~30%, respectively. Apart from this, the observed lower growth of particle size for the
Page 18 of 28
ACS Paragon Plus Environment
ACS Catalysis
123456789101112131415161718192021222324252627282930313233343536373839404142434445464748495051525354555657585960
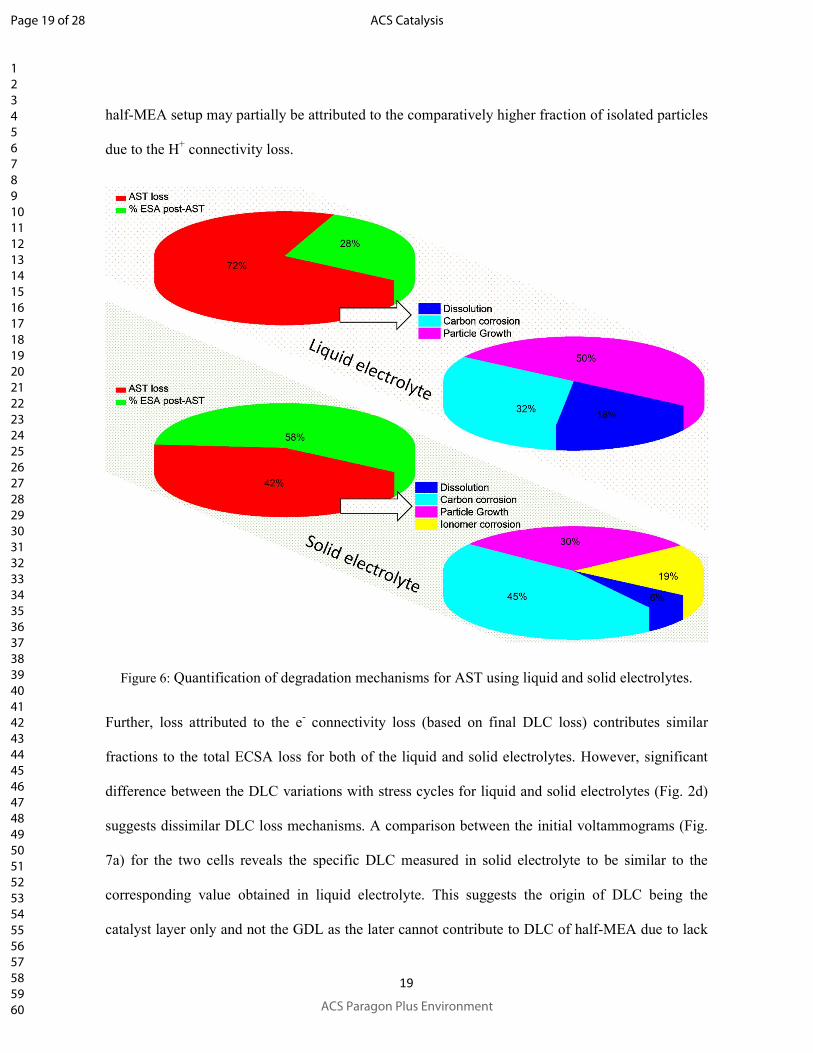
19
half-MEA setup may partially be attributed to the comparatively higher fraction of isolated particles
due to the H+ connectivity loss.
Figure 6: Quantification of degradation mechanisms for AST using liquid and solid electrolytes.
Further, loss attributed to the e- connectivity loss (based on final DLC loss) contributes similar
fractions to the total ECSA loss for both of the liquid and solid electrolytes. However, significant
difference between the DLC variations with stress cycles for liquid and solid electrolytes (Fig. 2d)
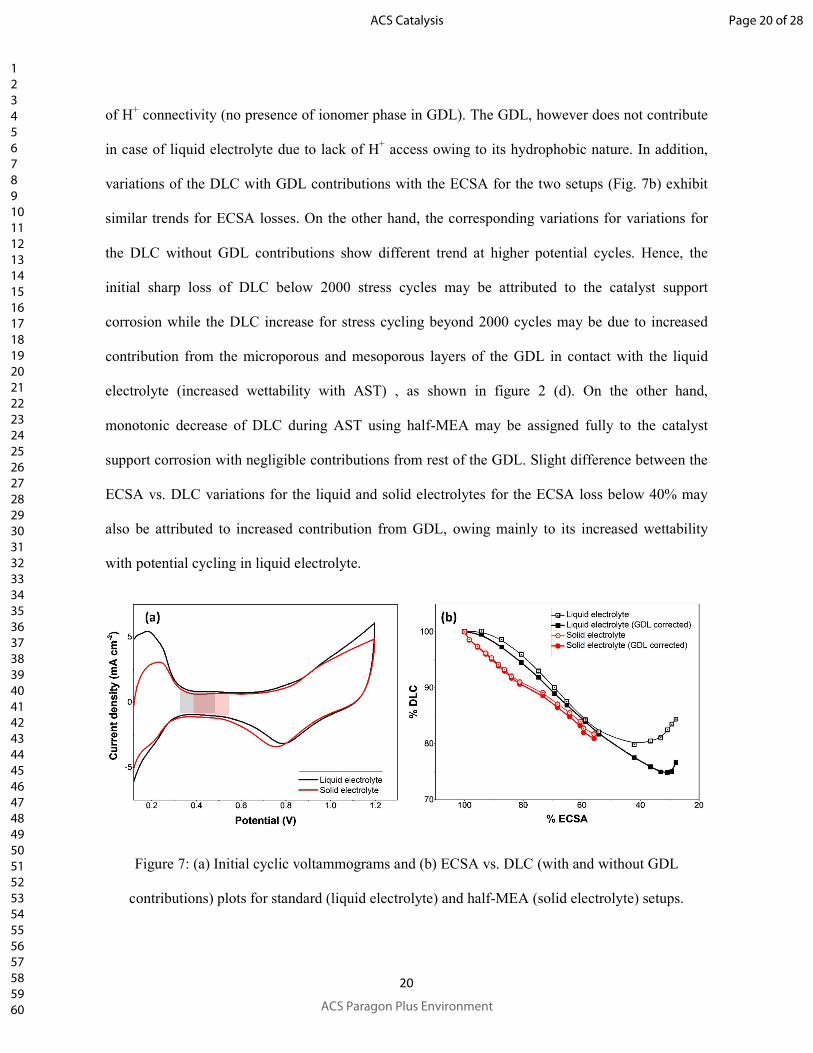
suggests dissimilar DLC loss mechanisms. A comparison between the initial voltammograms (Fig.
7a) for the two cells reveals the specific DLC measured in solid electrolyte to be similar to the
corresponding value obtained in liquid electrolyte. This suggests the origin of DLC being the
catalyst layer only and not the GDL as the later cannot contribute to DLC of half-MEA due to lack
Page 19 of 28
ACS Paragon Plus Environment
ACS Catalysis
123456789101112131415161718192021222324252627282930313233343536373839404142434445464748495051525354555657585960
20
of H+ connectivity (no presence of ionomer phase in GDL). The GDL, however does not contribute
in case of liquid electrolyte due to lack of H+ access owing to its hydrophobic nature. In addition,
variations of the DLC with GDL contributions with the ECSA for the two setups (Fig. 7b) exhibit
similar trends for ECSA losses. On the other hand, the corresponding variations for variations for
the DLC without GDL contributions show different trend at higher potential cycles. Hence, the
initial sharp loss of DLC below 2000 stress cycles may be attributed to the catalyst support
corrosion while the DLC increase for stress cycling beyond 2000 cycles may be due to increased
contribution from the microporous and mesoporous layers of the GDL in contact with the liquid
electrolyte (increased wettability with AST) , as shown in figure 2 (d). On the other hand,
monotonic decrease of DLC during AST using half-MEA may be assigned fully to the catalyst
support corrosion with negligible contributions from rest of the GDL. Slight difference between the
ECSA vs. DLC variations for the liquid and solid electrolytes for the ECSA loss below 40% may
also be attributed to increased contribution from GDL, owing mainly to its increased wettability
with potential cycling in liquid electrolyte.
Figure 7: (a) Initial cyclic voltammograms and (b) ECSA vs. DLC (with and without GDL
contributions) plots for standard (liquid electrolyte) and half-MEA (solid electrolyte) setups.
Page 20 of 28
ACS Paragon Plus Environment
ACS Catalysis
123456789101112131415161718192021222324252627282930313233343536373839404142434445464748495051525354555657585960
21
The fact that the e- connectivity loss from carbon corrosion takes place through electrochemical
oxidation of carbon (eq. 2)19-20, both H+ and e- connectivity values are essential for a forward
reaction.
/ + 21$2 ↔ /2$ + 415 + 4678 = 0.207<=>. 18 (2)
Hence, similar to the lower dissolution/transport rate of Pt/ions in solid electrolyte, the carbon
corrosion rate may be affected by the mass transport limitations for water through PEM and CO2
through the porous GDL as compared to those for liquid electrolytes. Moreover, the high acidity
from perfluorinated sulfonic acid ionomer also prevents the forward reaction. For half-MEA,
assignment of DLC loss to the e- connectivity loss is valid under the assumption that the change in
DLC contribution from the catalyst particles due to their H+ connectivity loss does not affect the
overall DLC having major contribution from high surface area carbon support.
As stated in the introduction section, ECSA loss due to ionomer/catalyst interface loss cannot be
detected using the standard setup based on liquid electrolyte or any other currently available
configurations or technique. Estimations made from the AST using half-MEA setup based on solid
electrolyte suggest ~19% contribution to ECSA loss due to loss of H+ connectivity through
ionomer/catalyst interface loss. ECSA loss contribution due to Pt particle isolation in the electrode
by loss of electron and proton connectivity shows 32% through liquid and 64% through solid
electrolyte.
In summary, the study highlights following points
• AST estimated with liquid electrolyte is limited to the catalyst material itself; it does not
reflect electrode property.
• AST estimated with solid electrolyte through the half-MEA configuration provides realistic
stress conditions for specific electrode development
Page 21 of 28
ACS Paragon Plus Environment
ACS Catalysis
123456789101112131415161718192021222324252627282930313233343536373839404142434445464748495051525354555657585960
22
• Platinum catalyst isolation in the electrode and heterogeneous degradation are important
and realistic degradation patterns
• As indicated in this study, carbon corrosion during air-air start-up/shutdown, is the major
bottle neck of the current low-temperature-PEMFC technology and therefore, replacement
of amorphous carbon with more robust catalyst support is urgently needed.
• Studies investigating the parameters affecting the ionomer/catalyst interaction are of high
interest towards development of catalyst layers with high Pt utilization throughout the
catalyst life.
5. Conclusions
Attempt has been made to quantify the ECSA loss mechanisms during AST of a PEMFC catalyst
layer. In addition to the standard three-electrode setup based on liquid electrolyte, a half-MEA
based three-electrode setup using solid electrolyte has been demonstrated to study the durability of
such electrodes and to quantify the ECSA loss due to loss of H+ connectivity of the catalyst
particles. The half-MEA setup, being more close to the real PEMFC, provides more realistic
degradation mechanisms during AST. ECSA loss contributions due to the particle growth of Pt is
found to be 50% and 30% during AST using standard and half-MEA setups, respectively. Again, in
the half-MEA setup based on solid electrolyte, restricted migration of Pt-ions through PEM leads to
the reduced Pt-dissolution loss as compared to that in the liquid electrolyte of the standard setup.
Moreover, corrosion of catalyst support and hence loss of e- connectivity is found to be the most
severe degradation mechanism with ~45% contribution to total ECSA loss in half-MEA. Similarly,
the loss of H+ connectivity due to ionomer/catalyst interface loss was found to be significant (19%
of ECSA loss). This 64% activity loss due to catalyst isolation by either e- or H+ connectivity loss
signifies great importance of catalyst support and catalyst/ionomer interface optimization.
Identification and quantification of the degradation mechanisms are essential to all aspects of
Page 22 of 28
ACS Paragon Plus Environment
ACS Catalysis
123456789101112131415161718192021222324252627282930313233343536373839404142434445464748495051525354555657585960
23
PEMFC development ranging from material selection, catalyst layer design, electrode structure,
flow field optimization and water management.
Supporting Information
Estimation of electrochemically active surface area (ECSA) and double layer capacitance (DLC),
correction of X-ray diffraction (XRD) pattern (Pt (111) peak) for GDL and PEM contributions,
quantification of degradation mechanisms (mathematical background)
Acknowledgement
PhD fellow Morten Gildsig Poulsen is greatly appreciated for performing TEM. The authors
appreciate the financial support from VILLUM FONDEN blokstipendier, DuraPEM III
(ForskEL J.No 2013-1-12064), UpCat (ForskEL J.No 2015-1-12315), and from the Danish
Council for Strategic Research, Innovation Fond Denmark, through the 4M Centre (J.No 12-
132710). EWII fuel cell A/S is kindly appreciated for providing electrode materials.
References
(1) Banham, D.; Ye, S. Current Status and Future Development of Catalyst Materials and Catalyst
Layers for Proton Exchange Membrane Fuel Cells: An Industrial Perspective. ACS Energy Letters
2017, 2, 629-638.
(2) Shao, M.; Chang, Q.; Dodelet, J.-P.; Chenitz, R. Recent Advances in Electrocatalysts for
Oxygen Reduction Reaction. Chem. Rev. 2016, 116, 3594-3657.
(3) Borup, R. L.; Davey, J. R.; Garzon, F. H.; Wood, D. L.; Inbody, M. A. PEM Fuel Cell
Electrocatalyst Durability Measurements. J. Power Sources 2006, 163, 76-81.
(4) Shao, Y.; Yin, G.; Gao, Y. Understanding and Approaches for the Durability Issues of Pt-Based
Catalysts for PEM Fuel Cell. J. Power Sources 2007, 171, 558-566.
Page 23 of 28
ACS Paragon Plus Environment
ACS Catalysis
123456789101112131415161718192021222324252627282930313233343536373839404142434445464748495051525354555657585960
24
(5) Wu, J.; Yuan, X. Z.; Martin, J. J.; Wang, H.; Zhang, J.; Shen, J.; Wu, S.; Merida, W. A Review
of PEM Fuel Cell Durability: Degradation Mechanisms and Mitigation Strategies. J. Power Sources
2008, 184, 104-119.
(6) Zhang, S.; Yuan, X.-Z.; Hin, J. N. C.; Wang, H.; Friedrich, K. A.; Schulze, M. A Review of
Platinum-Based Catalyst Layer Degradation in Proton Exchange Membrane Fuel Cells. J. Power
Sources 2009, 194, 588-600.
(7) Zhou, X.; Qiao, J.; Yang, L.; Zhang, J. A Review of Graphene-Based Nanostructural Materials
for Both Catalyst Supports and Metal-Free Catalysts in PEM Fuel Cell Oxygen Reduction
Reactions. Adv. Energy Mater. 2014, 4, 1301523.
(8) Andersen, S. M.; Borghei, M.; Lund, P.; Elina, Y.-R.; Pasanen, A.; Kauppinen, E.; Ruiz, V.;
Kauranen, P.; Skou, E. M. Durability of Carbon Nanofiber (CNF) & Carbon Nanotube (CNT) as
Catalyst Support for Proton Exchange Membrane Fuel Cells. Solid State Ionics 2013, 231, 94-101.
(9) Wang, X.; Li, W.; Chen, Z.; Waje, M.; Yan, Y. Durability Investigation of Carbon Nanotube as
Catalyst Support for Proton Exchange Membrane Fuel Cell. J. Power Sources 2006, 158, 154-159.
(10) Zhou, Y.; Neyerlin, K.; Olson, T. S.; Pylypenko, S.; Bult, J.; Dinh, H. N.; Gennett, T.; Shao,
Z.; O'Hayre, R. Enhancement of Pt and Pt-Alloy Fuel Cell Catalyst Activity and Durability Via
Nitrogen-Modified Carbon Supports. Energy Environ. Sci 2010, 3, 1437-1446.
(11) Takasaki, F.; Matsuie, S.; Takabatake, Y.; Noda, Z.; Hayashi, A.; Shiratori, Y.; Ito, K.; Sasaki,
K. Carbon-Free Pt Electrocatalysts Supported on SnO2 for Polymer Electrolyte Fuel Cells:
Electrocatalytic Activity and Durability. J. Electrochem. Soc. 2011, 158, B1270-B1275.
(12) Andersen, S. M.; Larsen, M. J. Performance of the Electrode Based on Silicon Carbide
Supported Platinum Catalyst for Proton Exchange Membrane Fuel Cells. J. Electroanal. Chem.
2017, 791, 175-184.
Page 24 of 28
ACS Paragon Plus Environment
ACS Catalysis
123456789101112131415161718192021222324252627282930313233343536373839404142434445464748495051525354555657585960
25
(13) Stamenkovic, V. R.; Mun, B. S.; Mayrhofer, K. J. J.; Ross, P. N.; Markovic, N. M. Effect of
Surface Composition on Electronic Structure, Stability, and Electrocatalytic Properties of Pt-
Transition Metal Alloys: Pt-Skin versus Pt-Skeleton Surfaces. J. Am. Chem. Soc. 2006, 128, 8813-
8819.
(14) Sasaki, K.; Naohara, H.; Choi, Y.; Cai, Y.; Chen, W.-F.; Liu, P.; Adzic, R. R. Highly Stable Pt
Monolayer on Pdau Nanoparticle Electrocatalysts for the Oxygen Reduction Reaction. Nat.
Commun. 2012, 3, 1115.
(15) Sun, S.; Zhang, G.; Geng, D.; Chen, Y.; Li, R.; Cai, M.; Sun, X. A Highly Durable Platinum
Nanocatalyst for Proton Exchange Membrane Fuel Cells: Multiarmed Starlike Nanowire Single
Crystal. Angew. Chem. 2011, 123, 442-446.
(16) Litster, S.; McLean, G. PEM Fuel Cell Electrodes. J. Power Sources 2004, 130, 61-76.
(17) Wang, J.; Yin, G.; Shao, Y.; Zhang, S.; Wang, Z.; Gao, Y. Effect of Carbon Black Support
Corrosion on the Durability of Pt/C Catalyst. J. Power Sources 2007, 171, 331-339.
(18) Castanheira, L.; Dubau, L.; Mermoux, M.; Berthomé, G.; Caqué, N.; Rossinot, E.; Chatenet,
M.; Maillard, F. Carbon Corrosion in Proton-Exchange Membrane Fuel Cells: From Model
Experiments to Real-Life Operation in Membrane Electrode Assemblies. ACS Catal. 2014, 4, 2258-
2267.
(19) Castanheira, L.; Silva, W. O.; Lima, F. H. B.; Crisci, A.; Dubau, L.; Maillard, F. Carbon
Corrosion in Proton-Exchange Membrane Fuel Cells: Effect of the Carbon Structure, the
Degradation Protocol, and the Gas Atmosphere. ACS Catal. 2015, 5, 2184-2194.
(20) Forouzandeh, F.; Li, X.; Banham, D. W.; Feng, F.; Ye, S.; Birss, V. Evaluation of the
Corrosion Resistance of Carbons for Use as PEM Fuel Cell Cathode Supports. J. Electrochem. Soc.
2015, 162, F1333-F1341.
Page 25 of 28
ACS Paragon Plus Environment
ACS Catalysis
123456789101112131415161718192021222324252627282930313233343536373839404142434445464748495051525354555657585960
26
(21) Meier, J. C.; Galeano, C.; Katsounaros, I.; Topalov, A. A.; Kostka, A.; Schüth, F.; Mayrhofer,
K. J. J. Degradation Mechanisms of Pt/C Fuel Cell Catalysts under Simulated Start–Stop
Conditions. ACS Catal. 2012, 2, 832-843.
(22) Zeng, R.; Zhang, H.; Jiang, L.; Liu, X. Investigation of Microstructure and Pt Distribution in
Catalyst Layer after Accelerated Degradation Test in PEMFC. ECS Transactions 2017, 80, 215-
223.
(23) Andersen, S. M.; Grahl-Madsen, L.; Skou, E. M. Studies on PEM Fuel Cell Noble Metal
Catalyst Dissolution. Solid State Ionics 2011, 192, 602-606.
(24) Yu, K.; Groom, D. J.; Wang, X.; Yang, Z.; Gummalla, M.; Ball, S. C.; Myers, D. J.; Ferreira,
P. J. Degradation Mechanisms of Platinum Nanoparticle Catalysts in Proton Exchange Membrane
Fuel Cells: The Role of Particle Size. Chem. Mater. 2014, 26, 5540-5548.
(25) Hartl, K.; Hanzlik, M.; Arenz, M. IL-TEM Investigations on the Degradation Mechanism of
Pt/C Electrocatalysts with Different Carbon Supports. Energy Environ. Sci 2011, 4, 234-238.
(26) Andersen, S. M.; Skou, E. Electrochemical Performance and Durability of Carbon Supported
Pt Catalyst in Contact with Aqueous and Polymeric Proton Conductors. ACS Appl. Mater.
Interfaces 2014, 6, 16565-16576.
(27) Zhang, Y.; Chen, S.; Wang, Y.; Ding, W.; Wu, R.; Li, L.; Qi, X.; Wei, Z. Study of the
Degradation Mechanisms of Carbon-Supported Platinum Fuel Cells Catalyst Via Different
Accelerated Stress Test. J. Power Sources 2015, 273, 62-69.
(28) Schneider, C. A.; Rasband, W. S.; Eliceiri, K. W. NIH Image to Imagej: 25 Years of Image
Analysis. Nature Methods 2012, 9, 671.
(29) Wu, B.; Zhao, M.; Shi, W.; Liu, W.; Liu, J.; Xing, D.; Yao, Y.; Hou, Z.; Ming, P.; Gu, J.; Zou,
Z. The Degradation Study of Nafion/PTFE Composite Membrane in PEM Fuel Cell under
Accelerated Stress Tests. Int. J. Hydrogen Energy 2014, 39, 14381-14390.
Page 26 of 28
ACS Paragon Plus Environment
ACS Catalysis
123456789101112131415161718192021222324252627282930313233343536373839404142434445464748495051525354555657585960
27
(30) Liu, X.-C.; Wang, G.-C.; Liang, R.-P.; Shi, L.; Qiu, J.-D. Environment-Friendly Facile
Synthesis of Pt Nanoparticles Supported on Polydopamine Modified Carbon Materials. J. Mater.
Chem. A 2013, 1, 3945-3953.
(31) Pozio, A.; Cemmi, A.; Carewska, M.; Paoletti, C.; Zaza, F. Characterization of Gas Diffusion
Electrodes for Polymer Electrolyte Fuel Cells. J. Fuel Cell Sci. Technol. 2010, 7, 041003-041003-7.
(32) Andersen, S. M. Nano Carbon Supported Platinum Catalyst Interaction Behavior with
Perfluorosulfonic Acid Ionomer and Their Interface Structures. Appl. Catal. B Environ. 2016, 181,
146-155.
(33) Lee, H.-J.; Cho, M. K.; Jo, Y. Y.; Lee, K.-S.; Kim, H.-J.; Cho, E.; Kim, S.-K.; Henkensmeier,
D.; Lim, T.-H.; Jang, J. H. Application of TGA techniques to analyze the compositional and
structural degradation of PEMFC MEAs. Polym. Degrad. Stab. 2012, 97, 1010-1016.
(34) Zhang, F.; Zhang, H.; Ren, J.; Qu, C. PTFE Based Composite Anion Exchange Membranes:
Thermally Induced in Situ Polymerization and Direct Hydrazine Hydrate Fuel Cell Application. J.
Mater. Chem. 2010, 20, 8139-8146.
(35) Topalov, A. A.; Cherevko, S.; Zeradjanin, A. R.; Meier, J. C.; Katsounaros, I.; Mayrhofer, K.
J. J. Towards a Comprehensive Understanding of Platinum Dissolution in Acidic Media. Chem. Sci.
2014, 5, 631-638.
(36) Reid, O. R.; Saleh, F. S.; Easton, E. B. Determining Electrochemically Active Surface Area in
PEM Fuel Cell Electrodes with Electrochemical Impedance Spectroscopy and its Application to
Catalyst Durability. Electrochim. Acta 2013, 114, 278-284.
Page 27 of 28
ACS Paragon Plus Environment
ACS Catalysis
123456789101112131415161718192021222324252627282930313233343536373839404142434445464748495051525354555657585960
28
Table of Contents Graphic on
Page 28 of 28
ACS Paragon Plus Environment
ACS Catalysis
123456789101112131415161718192021222324252627282930313233343536373839404142434445464748495051525354555657585960


![Polymer Degradation and Stability · 2019-10-30 · Polymer Degradation and Stability 170 (2019) 108998 (POSS),andalumina-coatedsilica[23].Zirconiumphosphatepaired with PDDA increased](https://img.pdfslide.us/doc/110x75/5f71c4d7090ec208f5729555/polymer-degradation-and-stability-2019-10-30-polymer-degradation-and-stability.jpg)


![Polymer Degradation and Stability · 2019-04-11 · Polymer Degradation and Stability 95 (2010) 2126e2146. ... improved characteristics compared to their individual components [12].Asamatteroffact,naturalbonematrixisanorganic/inorganic](https://img.pdfslide.us/doc/110x75/5f1202493849b60c8e74f2d6/polymer-degradation-and-2019-04-11-polymer-degradation-and-stability-95-2010.jpg)