Embed Size (px)
Citation preview
March 2015
Quality provision under conditions of oligopoly
Johan Willner and Sonja Grönblom
Åbo Akademi University
Abstract: We analyse an oligopoly where sunk costs depend on the quality choice.
Quality and output are underprovided as compared to the socially optimal solution. Entry will
bring output closer to its socially optimal level, but quality will be further reduced. It is well
known that quality-related sunk costs limit the number of firms that can break even, so
increased competition is feasible only if costs increase sharply with quality, or if consumer
welfare is relatively insensitive to quality. Public provision might provide higher welfare
even in presence of a cost disadvantage if competition is not feasible.
Key words: product quality, oligopoly, public and private provision, competition.
JEL-classification: L33, D21, D43, H42
Correspondence: Department of Economics, Åbo Akademi University, Fänriksgatan 3B,
FIN-20500 Turku, Finland; e-mail: [email protected]:\JW\IO\QUAL2.DOC, 16.03.2015; Printed: 16.03.2015, 11:03
1
1. Introduction
This contribution analyses the distortion that arise on an oligopolistic market where firms
have to decide about both output and quality when consumers are fully informed and where
quality affects sunk costs. As shown by Sutton (1991), there is an upper limit to the number
of firms in such a market, so perfect competition will not be an alternative. This upper limit is
stringent in particular if it is relatively cheap to invest in real or perceived quality.
It is well known that firms have an incentive to underprovide quality if consumers are
not fully informed (see, for example, Belleflamme and Peitz, 2010). However, there may be a
quality distortion under full information as well. A profit maximising monopolist may over-
or underprovide quality, depending on the sign of the cross-derivatives of the objective
function and on whether inverse demand becomes more or less steep by a quality increase
(Sheshinski, 1976, Spence, 1975). Moreover, a monopoly may provide a subobtimal product
mix if consumers are heterogeneous (White, 1977).
There is a literature on quality in markets with differentiated goods. White (1977)
suggests that increased competition would improve the product mix, and that a competitive
market would even provide the optimal combination. However, it was subsequently shown
that the spectrum of qualities that firms offer (in order to segment the market) can become
narrower as new firms enter (Gal-Or, 1983). Moreover, firms can under- or overprovide
quality in models based on Hotelling- or Salop-type spatial analogies, as in Ma and Burgess
(1993), where firms underprovide quality in setting with heterogeneous consumers, duopoly
and linear demand. A spatial duopoly is associated with an inefficient allocation in Wolinsky
(1997) as well. A regulated monopoly then provides superior quality, but the comparison
between a regulated monopoly and managed competition is ambiguous when it comes to
welfare. A Hotelling-style duopoly will underprovide congestion-reducing investments in
Matsumura and Matsushima (2007). While these contributions tend to favour regulation,
Brekke et al (2006) suggest, also in a Hotelling-duopoly model, that regulation can cause
firms to overprovide quality. Brekke et al (2011) consider an n-firm spatial oligopoly where
providers are partly altruistic, suggesting that increased competition under regulation then has
an ambiguous effect on quality.
However, less is known about quality in markets that generate a uniform standard even
if firms have an ex ante choice do deviate. What would a basic oligopoly model predict if
goods are potentially differentiated ex ante but homogeneous ex post, as might be expected if
all production functions are the same and if the differences among consumers are negligible?
Would there be a quality distortion under oligopoly, and can it be alleviated by entry? To fill
this gap in the literature, we apply a generalised version of Sutton’s model of sunk costs
related to real or perceived quality (Sutton, 1991). We argue that the approach can also be
2
interpreted as a model of how oligopolistic competition deviates from the social optimum.
The model was developed for explaining the maximum number of firms that can break even
on a market, it then also highlights limits to entry. However, given that entry is often sluggish
(see, for example Geroski, 1995), we also ask how entry within the limits implied by the
model affects output, quality and welfare.
Given the aim to explain the causes of a given market structure rather than its
performance in Sutton (1991), predictions derived from the original version of the model
might on the other hand appear as unduly strong. Output would always be underprovided,
overpriced and of sub-standard quality, unless the costs of achieving higher quality are
prohibitively high. Overpricing can be reduced by entry, but a fragmented market structure is
possible only when it is expensive to achieve high quality, so the quality distortion would
remain. Unlike in Sutton (1991), we therefore assume that the quality of a good can have
either a stronger or a weaker impact on consumer utility than its quantity. Market provision
can then work reasonably well also when sunk costs do not increase steeply with quality,
provided that consumers are more concerned about quantity than quality.
The performance of an oligopoly with few or many firms as compared to the socially
optimal allocation is important also when deciding on how an industry should be organised.
When is for example a combination of privatisation and liberalisation superior to a public
monopoly (which at least has the option of aiming for the optimal solution), and vice versa?1
There is a growing empirical literature on such oligopolies that have replaced public
monopolies. For example, while consumer prices are often lower after electricity
restructuring, the reliability of the system may have been reduced (see Lieb-Dóczy, Börner
and MacKerron, 2003, Brunekreeft and Keller, 2000, Moss, 2004, and Jiang amd Yu, 2004.)
Railway liberalisation has also been criticised for underinvestments in infrastructure and
reduced safety (Crompton and Jupe, 2003, and Newbery, 2006).2 These pieces of evidence
1 Some industry studies have attempted to distinguish between industries that are suitable and unsuitable
for privatisation. For example, Kwoka (2005) argues that there may exist a private-sector advantages in the
generation of electric power, but not in its distribution, while Hart et al. (1997) doubt the merits of privatising
prison services, but not necessarily garbage collection or defense procurement.2 Problems among the railways may be related to the natural monopoly infrastructure rather than to
downstream competition. We have analysed vertical separation elsewhere (see Willner and Grönblom, 2013),
but not with quality and reliability in mind.
3
suggest that restructuring an industry can affect its quality provision. These mechanisms have
to be analysed, and not only with a focus on industries with an upstream natural monopoly
infrastructure.
We do not deal with quality standards by regulation or with other restrictions, because
we have in mind an industry that is seemingly an obvious candidate for privatisation and
liberalisation rather than regulation. In evaluating an oligopoly (that can under some
conditions approach perfect competition) with the socially optimal solution as a benchmark,
we assume like Sutton (1991) that the quality of a good affects consumer utility. Higher
quality can cause consumption to be higher than otherwise, insofar as consuming a unit yields
higher pleasure than before. Such a market is analysed in the companion paper Willner
(2015). But demand may also decrease because of higher quality, as when more durable
light-bulbs need less frequent replacements. Sutton’s model represents an intermediate case,
where the quantity demanded is neither higher nor lower after a quality increase (despite
higher utility), unless other firms provide products of different quality. For example, a
moderate quality change would hardly cause consumers to change their use of for example
health-care, energy, or transport services at least in the short run.
Most versions of our model suggest that an oligopoly will underprovide both output and
quality. When directly applied on privatisation and liberalisation, the analysis seems to yield
the strong policy conclusion that the public monopoly is superior if marginal costs are the
same in both cases. However, our generalisation of Sutton’s model implies that the upper
limit to the number of firms is extended if the quality of a good has a lower impact on
consumer utility than its quantity. Firms would then invest less in quality than otherwise, so
the sunk costs would be lower, thus enabling more firms to enter. The distortions caused by
profit maximising behaviour would then be fairly limited, so market provision would be
superior if it is also associated with a moderate cost advantage. We derive threshold values
for the cost reductions that are necessary for this to be the case.3
We proceed as follows. The basic components of a model where quality matters are
presented in section 2. Section 3 defines the socially optimal solution, and section 4 focuses
on oligopolistic competition. Section 5 evaluates the oligopoly as compared to the optimal
solution. Section 6 extends the analysis to an interpretation in terms of privatisation and
3 To analyse how a reorganisation affects marginal costs is outside our scope in the present contribution,
but we have addressed endogenous differences related to ownership and competition elsewhere (see Willner and
Parker, 2007, Willner and Grönblom, 2013 and Grönblom and Willner, 2014).
4
liberalisation, with a possibility of differences in productive efficiency, to simultaneous
maximisation, and to cases where quality is reflected in marginal rather than sunk costs.
Section 7 presents some concluding remarks. Proofs are included in an appendix.
2. The model
Consider a private or public monopoly or an n-firm Cournot oligopoly, where a firm has to
invest in product quality before deciding about industry output. Like in Sutton (1991), we
assume that the quality (q) of a commodity (y) is dependent on outlays in the form of a sunk
cost S, which can be written
The parameter β then stands for the elasticity of the sunk costs with respect to quality, or
shortly, sunk cost elasticity. Other sunk costs are ignored. We may for example think of
quality as dependent on the amount of staff with long-term contracts, as when it comes to
infrastructure maintenance, when short queuing time is an essential quality dimension, or
when quality depends on R&D outlays. Sutton’s model was developed so as to analyse
branding, i.e. outlays for creating an image of quality, but the analysis can be applied on real
and not only perceived quality as well (see, for example, the application of Berry and
Waldfogel, 2010).
The average variable costs and marginal costs are c. Quality may also be reflected in
the quality of inputs so that c becomes a function of q. Such an extension is addressed in
Section 6.1. There are N identical consumers with the income m, which is normalised to
unity.4 Each individual h has the utility function
where y0 stands for a basket of other goods with a given price p0. The exponents α1, α2, and
α0 express the sensitivity (in the form of elasticity) of utility with respect to changes in
S = q β. (1)
u (yh,qh, y0) = yh
α1qα2y0
α0, (2)
4 Sutton (1991) sets p0=1. However, as we are interested in the level of quality, we need expressions that
are indepentent of scale when it comes to the price level. Setting m=1 provides the simplest way to ensure that
this is the case.
5
consumption of y, its quality and the consumption of the basket of other goods. It will be
useful to denote α2/α1 by ρ. Utility may be either more or less sensitive to the quality than to
the quantity of y (ρ>1 or ρ< 1), or equally sensitive so that α1=α2 like in Sutton (1991).5
Apart from the fact that α1 matters for the size of the industry revenues (R = α1N), the
parameters of the utility function matter in our analysis only through ρ. For example, it will
become obvious in the next section that we might as well transform (2) to qρy when deriving
the socially optimal solution given y0. In what fallows we shall therefore for brevity refer to ρas the quality elasticity.
We focus on the intermediate case where higher quality will neither increase nor reduce
the demand for a homogeneous good, but where the williness to pay for a firm’s product is
higher if it supplies a higher quality than its competitors. The market is thus characterised by
potential vertical product differentiation, in the sense that expensive high-quality and cheap
low-quality firms can coexist. Denote the price of y by p if it is the same in all firms, and
otherwise pi or pj. The following Lemma will be useful for deriving the oligopolistic
equilibrium:
Lemma 1. The ratio is the same for all i and j.
Proof: See Appendix.
With ρ=1 like in Sutton (1991), this means that the price/quality ratio must be the same
for all firms. There is no equilibrium after privatisation unless at least two firms can break
even, and it will turn out that this requires . However, in order to assess the impact of
increased competition we have to ensure that at least three firms can break even, which
requires .
3. The socially optimal solution
There is no equilibrium under profit maximisation unless , because a monopolist would
always get R. The most profitable action would then be to produce as little as possible.
However, the situation is different under welfare maximisation. This section analyses the
welfare maximising solution, which will work as a standard of comparison. It can also be
qiρ/pi = qj
ρ/pj
β/ρ ≥ 1
β/ρ ≥ 8/3
n ≥ 2
5 However, we may without loss of generality assume that α0=1 α1 α2.
6
interpreted as associated with a welfare maximising public monopoly in which marginal costs
can either equal or differ from the marginal costs within an oligopoly with profit maximising
firms.
We assume two-stage maximisation except for when it comes to some extensions in
section 6. The socially optimal solution is however the same also under simultaneous
maximisation. Suppose that a public monopolist maximises the welfare of a typical consumer
under a break-even constraint. Let λ denote the Lagrange multiplier. The socially optimal
solution is obtained by first maximising
given the value of q. Note however that we would get the same result by replacing the
objective function by qρy. Solving for y from the constraint yields
and hence the following utility level for the typical consumer:
It will be useful to abbreviate β/ρ as ε. Maximising this utility with respect to q then yields
which means that output is:
It follows that the price is (1+1/ε)c.
Maxy
Ω = (y /N)α1q
α2y0
α0 + λ(R − cy − q β) (3)
yG(q ) =R − q β
c, (4)
u =(R − q β)
α1 (qα2)y0
α0
cNα1
. (5)
qG =⎛⎜⎝ρRρ + β
⎞⎟⎠
1/β
=⎛⎜⎝
R1 + ε
⎞⎟⎠
1/β
, (6)
yG =βR
(ρ + β)c=
εR(1 + ε)c
. (7)
7
Lemma 2, where e stands for Euler’s number, summarises a couple of observations that
will be useful when comparing the n-firm Cournot-oligpoly to the socially optimal solution:
Lemma 2. Welfare maximisation under a break-even constraint means that a) output
and quality are increasing in the size of the market (R); and b) output is decreasing in the
sunk-cost elasticity (β) and decreasing in the quality elasticity (ρ); c) quality is increasing in
ρ, and decreasing in β except for when β > .
Proof: See appendix.
The fact that output is increasing in R is trivial; quality is also increasing in R because
of the break-even constraint, which implies that a larger R makes it easier for society to
afford a higher quality. The impact of ρ is also obvious, but the impact of β on quality is not
straightforward. Output is increasing in β, because quality is expensive if β is high, in which
case a higher output is a substitute for higher quality. It might be reasonable to guess that
quality is decreasing in β, Lemma 2 implies that quality has a minimum for β = .
This minimum is however associated with very large values of if the market is
reasonably large. For example, R=100 and ρ=1 yields a minimum for , so qG
would be increasing in β for higher values. As follows from section 5, this value of β would
enable 136 firms to break even. The technical conditions would then favour (almost) perfect
competition, where quality is not an issue because of the expensiveness of a quality increase.
We would rarely observe public monopolies under such circumstances, so very high values
of β are outside our focus on oligopoly with a benevolent public monopoly as a benchmark.
Moreover, qG approaches unity as β approaches infinity, but numerical simulations suggest
that qG approaches unity long before β approaches . The U-shape of qG as a function of β is
therefore hardly visible.
4. The n-firm Cournot oligopoly
The products are now potentially differentiated ex ante. Make use of Lemma 1, and consider
with no loss of generality firm number one. It then follows that for all
j=2,3,...n. The sales revenues in the industry must therefore be:
β̂ ≈ (Re − 2)ρ
β̂
β̂
β = β ≈ 269.828.
β̂
pj = p1(qj/q1)ρ
R = y1p1 + p1 ∑j = 2
n
yj
⎛⎜⎝
qj
q1
⎞⎟⎠
ρ
. (8)

8
It follows that the inverse demand for firm 1 is
so its profits are
Maximise with respect to y1:
Next, consider the profit function of another firm j:
Its first-order condition becomes:
Divide all terms in (13) by (qj/q1)ρ and multiply and divide in addition the term in the middle
by the same expression:
p1 =R
y1 + ∑j = 2n yj(qj/q1)ρ
, (9)
π1 =R
y1 + ∑j = 2n yj(qj/q1)ρ
y1 − cy1 − q1β. (10)
R
y1 + ∑j = 2n yj(qj/q1)ρ
−R
[y1 + ∑j = 2n yj(qj/q1)ρ]
2y1 − c = 0. (11)
πj =R
yj + ∑i ≠ j yi(qi/qj)ρyj − cyj − qj
β. (12)
R
yj + ∑i ≠ j yi(qi/qj)ρ−
R
[yj + ∑i ≠ j yi(qi/qj)ρ]2yj − c = 0. (13)
R
yj(qj/q1)ρ + ∑i ≠ j yi(qi/q1)ρ
−R
[yj(qj/q1)ρ + ∑i ≠ j yi(qi/q1)ρ]2yj(qj/q1)
ρ − c(q1/qj)ρ = 0. (14)

9
Note that one of the terms in the sum in must equal y1, so the
denominators of (14) are in fact the same as in (11). Add (11) to the sum of the n 1
expressions represented by (14):
This implies:
Combine (16) and (11) to get y1 as a function of the quality levels:
Insert (16) and (17) into (10) to get the maximum profits as a function of q1 and rearrange:
Maximise with respect to q1, impose ex post symmetry and solve for q1, q2,...qn = q:
Differentiating with respect to β when ρ=1 shows that the quality level has a minimum for
β=2R(n 1)2eρ/n3. Like in the case of the socially optimal solution, quality may be increasing
in β for sufficiently high values.
As for market output, symmetry in output and quality means that y = ny1 when
q=q1=q2=...qn. As follows from (17), we get the same expression as in a basic
Cournot-oligopoly where quality is not an issue.:
∑i ≠ j yi(qi/q1)ρ
(n − 1)Ry1 + ∑j = 2
n yj(qj/q1)ρ− c
⎛⎜⎝1 + q1ρ ∑
j = 2
n
qj−ρ⎞⎟⎠ = 0. (15)
y1 + ∑j = 2n yj(qj/q1)
ρ =(n − 1)R
c(1 + q1ρ∑n
j = 2 qj−ρ)
. (16)
y1 =R(n − 1) (2 − n + q1
ρ∑nj = 2 qj
−ρ)
c(1 + q1ρ∑n
j = 2 qj−ρ)2
. (17)
π1(q1) =R(2 − n + q1
ρ∑nj = 2 qj
−ρ)2
(1 + q1ρ∑n
j = 2 qj−ρ)2
− q1β. (18)
q (n ) =⎡⎢⎣
2ρR(n − 1)2
βn 3
⎤⎥⎦
1/β
=⎡⎢⎣
2R(n − 1)2
εn 3
⎤⎥⎦
1/β
. (19)
10
5. The performance of the n-firm oligopoly
We first compare output and quality under oligopoly with the socially optimal solution. It is
well-known that a commercial oligopoly where quality is not an issue underprovides output
as compared to the socially optimal allocation, but (7) implies that the socially optimal output
now depends on both β and ρ. Like in Sutton (1991), there is an upper limit for the number of
firms, and this limit depends in our version on the quality elasticity as well, and not only on
β:
Lemma 3. a) The feasible range of oligopolistic market structures is represented by
numbers of firms such that
b) The upper limit is increasing in the sunk-cost elasticity but decreasing in the quality
elasticity.
Proof: See appendix.
This lemma is a generalisation of Sutton (1991), where high costs of branding
(perceived quality) favour fragmentation and vice versa, as follows from ρ = 1, so that ε=β.
However, a market can become more fragmented than in Sutton’s model if β>ρ. The opposite
situation cannot hold true, because a duopoly is not feasible unless β/ρ < 1, and it is not
meaningful to analyse entry unless β/ρ 2.6667, or ρ 0.375β. Note also that would be
smaller in the presence of other sunk costs as well.
We might expect that allowing for would imply a quality and/or output distortion
that can go either way, for example because of the potential extension of the feasible interval
of n. A superficial comparison of (6) and (19) and (7) and (20) might indeed suggest an
ambiguous comparison with the socially optimal solution. However, it turns out that the
impact is ambiguous only outside the feasible interval, and that the quantitative significance
of quality distortion depends on ρ:
y(n ) =R(n − 1)
cn. (20)
n̂ = 1 +ε4+√⎯⎯ε
2
16+ε2≥ n ≥ 2. (21)
≥ ≤ n̂
ρ ≠ 1
11
Proposition 1. The n-firm oligopoly underprovides both output and quality relative to
what is socially optimal.
Proof: See appendix.
Proposition 1 holds true for any n in the feasible interval, and hence also if we assume a
free-entry equilibrium where .
However, given the stylised fact that enterprise formation is often sluggish (see
Geroski, 1995), we also ask how an exogeneous change in n in the feasible interval affects
the allocation.6 Output is the same as in a conventional Cournot oligopoly, and hence
increasing in n, but the impact of entry on quality and welfare needs elaboration:
Proposition 2. The following holds true for the n-firm oligopoly: a) Quality is
increasing in R and increases when n increases from 2 to 3, but decreases thereafter; b)
consumer welfare is increasing in n and R in the feasible interval.
Proof: See appendix.
Thus, according to part a), apart from when a third firm enters in a duopoly, increased
competition will not alleviate market failures related to low quality. The intuition is based on
the fact that a change in uniform quality works in the same way as a monotone
transformation of the utility function. So while utility changes, there is no change in the
ranking of baskets of y and y0. Inverse demand collapses to p= R/y in a symmetric
equilibrium, so a quality increase is not translated into a higher willingness to pay. Producers
are rewarded not for quality as such, but for providing better goods or services than their
competitors, so the incentives for quality provision are insufficient. Moreover, these
incentives are further weakened if more competitors enter, because the quality-related costs
become more difficult to afford.
The fact that the highest quality occurs when n=3 implies a lower bound for the
percentage loss of quality:
n = n̂
rqT
6 Note that n/N has to be a negligible, so that we may assume that consumers are identical.
12
This lower bound is decreasing in both ρ and β. For example, setting ρ=1 means that values
of β of 3 and 100 would imply 26.62% and 1.20% respectively. If ρ=2, the corresponding
percentages are 20.97% and 29.83%, but they become 1.19% and 1.20% respectively when ρ
is 0.5.
According to part b), entry would be beneficial for all values of n for which production
is profitable. Note however that the total surplus, which is the most common welfare
criterion, would suggest a lower optimal number of firms, because industry profits (R/n) are
decreasing in n. As for the impact of the market size, it gives firms a stronger incentive to
provide high quality within a given market structure.
Privatisation and liberalisation often take place because of an ambition to cut costs. We
have addressed endogenous differences in genuine cost efficiency elsewhere (for example in
Grönblom and Willner, 2014), but we assume equal marginal costs except for in section 6.1.
In this setting, the public monopoly yields lower unit costs as well:
Corollary 1. Unit costs are the same as in the socially optimal solution in a duopoly,
but otherwise higher and increasing in the number of firms.
Proof: Se appendix.
This result may seem surprising, because of the underprovision of quality under
oligopoly. But entry decreases the output per firm, so the costs of the lower quality per unit of
output nevertheless increase.
6. Extensions
6.1. Privatisation, liberalisation and exogeneous differences in marginal costs
Privatisation of a former welfare maximising monopoly is often believed to increase both
cost efficiency and profit margins, thus making the sign of the welfare change ambiguous,
rqT = 100
⎧⎨⎩1 −
⎡⎢⎣
0.2962(1 + ε)ε
⎤⎥⎦
1/β⎫⎬⎭. (22)
13
unless the profit margins are also reduced through competition.7 The common view that a
public monopoly is inevitably cost inefficient is prejudiced (see the discussion in section 7).
However, it will be useful to analyse the threshold cost reduction that is necessary for
privatisation and liberalisation to be beneficial (or alternatively, the highest cost disadvantage
that is consistent with a public monopoly being preferable). This threshold is an important
indicator when deciding on how an industry should be organised.
The combination of privatisation and liberalisation is here taken to mean replacing the
welfare maximising public monopoly with an n-firm Cournot oligopoly like in sections 4-5.
Suppose that privatisation and liberalisation reduce marginal costs from cG to cP, because the
welfare ranking would otherwise be trivial. Denote the percentage change 100(cG cP)/cG by
μ. It is obvious from (6) and (19) that quality is not affected by marginal costs, so quality
would always be lower after privatisation and liberalisation despite lower marginal costs.
However, it follows from (7) and (20) that privatisation and liberalisation would reduce the
price (increase output) if the percentage cost reduction is larger than a critical value .
Consider first this critical value as a function of the number of firms within the interval [2,
]:
It follows that this expression is the same as the relative output distortion, 1 y(n)/yG. The
intuition is based on the fact that output is inversely proportional to marginal costs.
As for consumer welfare, there is an improvement if and only if qρy increases when the
market becomes an n-firm oligopoly (see the proof of Proposition 2). Use (6), (7), (19), and
(20) to formulate this condition as
μ1T
n̂
μ > μ1T = 100
1 + ε − nnε
. (23)
21/ε(n − 1)(2 + ε)/εR (ε + 1)/ε
ε1/εn (3 + ε)/εcP
>R (ε + 1)/εε
(1 + ε)(ε + 1)/εcG
, (24)
7 To reduce costs has been one of the main arguments for privatisation among economists (see, for
example, Megginson and Netter, 2001, and Pirie, 1988). Efficiency is also mentioned in Mrs. Thatcher’s
memoirs, together with an ideological remark that "[t]he state should not be in business" (Thatcher, 1993, pp.
676-677). But governments have often in practice divested assets because of a need to raise funds (see Parker,
2009).
14
which implies that μ must exceed another critical value :
It can be shown that :
Corollary 2: A larger percentage cost increase is necessary for privatisation and
liberalisation to outperform the public monopoly when it comes to consumer welfare rather
than price or output.
Proof: See appendix.
This corollary means that we may observe higher unit costs and a lower output in the
public monopoly, but consumer welfare may nevertheless be higher. The intuition is based on
the fact that the negative effects of a cost disadvantage in the public monopoly is alleviated
by higher quality.
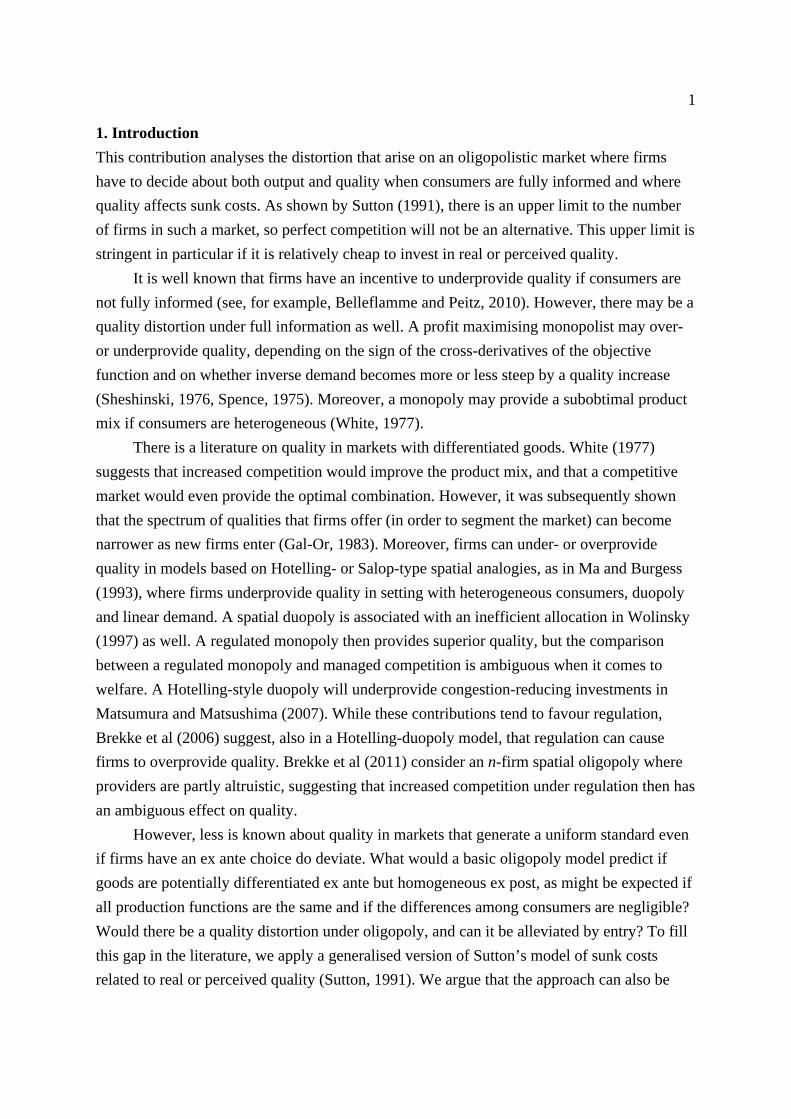
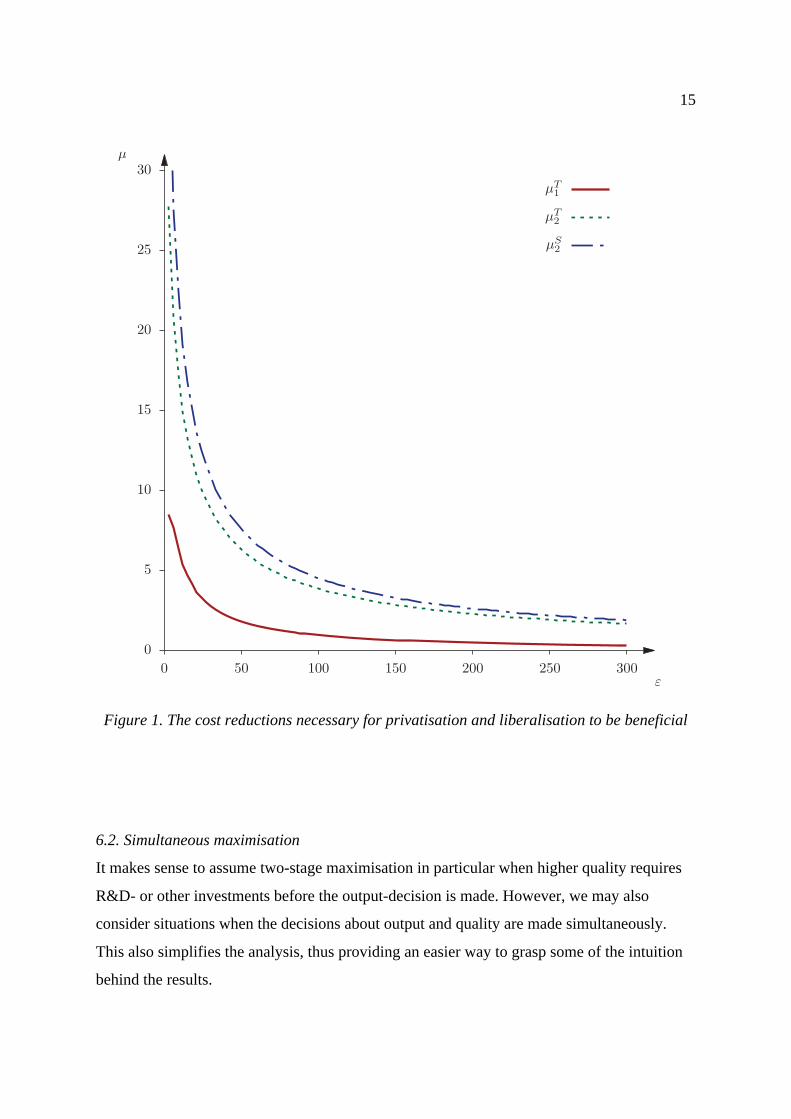
However, me may also assume free entry until n= . The threshold values then become
a function of ε, because a larger value of ε means that a greater number of firms can break
even. Inserting into (23) and (25) yields complicated mathematical expressions, but the
relationship between the necessary percentage cost change and ε can be illustrated
graphically. The curve in Figure 1 refers to the case of simultaneous maximisation (see
section 6.2).
Suppose first that an increase in ε is caused by an increase in β. The intuition for the
downwards-sloping lines and is based on the fact that a high β makes quality expensive,
also when it comes to the socially optimal allocation, so q approaches unity in both cases. As
for the case when a high value of ε is caused by a low ρ, the intuition is based on the fact that
consumer utility is not sensitive in quality. The welfare convergence is then caused by the
fact that the higher fragmentation caused by a higher ε leads to a higher output, as also
reflected in the curve .
μ2T
μT > μ2 = 100⎡⎢⎣1 −
21/ε(n − 1)(2 + ε)/ε [(ε + 1)/ε] (ε + 1)/ε
n (ε + 3)/ε
⎤⎥⎦. (25)
μ2T > μ1
T
n̂
n̂
μ2S
μ2T μ2
S
μ1T
15
Figure 1. The cost reductions necessary for privatisation and liberalisation to be beneficial
6.2. Simultaneous maximisation
It makes sense to assume two-stage maximisation in particular when higher quality requires
R&D- or other investments before the output-decision is made. However, we may also
consider situations when the decisions about output and quality are made simultaneously.
This also simplifies the analysis, thus providing an easier way to grasp some of the intuition
behind the results.
0
5
10
15
20
25
30
0 50 100 150 200 250 300
ε
μ
μT1
μT2
μS2
16
The socially optimal solution does not change. As for the n-firm oligopoly, imposing
symmetry immediately after differentiating profits as expressed by (10) yields the same
expression for industry output as in the case of two-stage maximisation, i.e. (20). However,
quality becomes different. Maximise (10) with respect to q1 as well:
Impose ex-post symmetry and rearrange:
This value is otherwise lower than under two-stage maximisation, but equal when n=2, as
follows from comparing (19) and (27).
The analysis of the maximum number of firms becomes considerably simpler.
Imposing symmetry in (10) and inserting (27) yields:
Routine calculations (see the proof of Proposition 1a) show that the maximum number of
firms is higher than in the case of two-stage maximisation.
Proposition 1 cannot be extended to simultaneous maximisation without a small
amendment:
Proposition 3. The following holds true under simultaneous maximisation: a) industry
output is the same as in the public monopoly after privatisation and liberalisation if n= =
1+ε, but otherwise lower; b) privatisation and liberalisation underprovides quality.
Proof: See appendix.
Output would have been the same both before and after liberalisation and privatisation
for n=1+ in the case of two-stage maximisation, but such a market structure allows firms to
break even only under simultaneous maximisation. The percentage output distortion is the
same as before for all n < 1+ε, but there is no distortion if there is entry until profits are zero.
−R y1
[y1 + ∑j = 2n yj(qj/q1)ρ]
2
⎛⎜⎝−ρ∑j = 2
n yjqjρ
q11 + ρ
⎞⎟⎠− βq1
β − 1 = 0. (26)
q (n ) =⎡⎢⎣ρR(n − 1)
βn 2
⎤⎥⎦
1/β
=⎡⎢⎣
R(n − 1)εn 2
⎤⎥⎦
1/β
. (27)
n̂ = 1 + ε. (28)
n̂
ε
17
Quality is on the other hand suboptimal, in the sense of being lower than (6), for all
values of n, including :
The highest quality occurs when n=2, so the lower bound for the percentage quality distortion
is
which is larger than under two-stage maximisation.
A similar argument as in the proof of Proposition 2 shows that consumer welfare would
be decreasing in n for . However, this number is larger than (28), so welfare is
increasing in n in the feasible interval.
As for unit costs, they are now c(1+1/ε) both before and after liberalisation. Corollary 1
is not robust when the setting is changed to simultaneous maximisation, but unit costs are at
least not higher in the public monopoly. The fact that unit costs do not increase by
privatisation and liberalisation is explained by the lower quality level.
Next, consider the threshold values of μ, which are indexed by S in the case of
simultaneous maximisation. The fact that output is the same as under two-stage maximisation
means that . However, the left hand-expression in (24) changes, so the condition for
welfare to increase is now
which implies that the critical percentage cost reduction becomes:
n̂
q (n̂ ) =⎛⎜⎝
R
(1 + ε)2
⎞⎟⎠
1/β
, (29
rqS = 100
⎧⎨⎩1 −
⎡⎢⎣
0.25(1 + ε)ε
⎤⎥⎦
1/β⎫⎬⎭, (28)
n ≥ 2 + ε
μ1S = μ1
T
(n − 1)(1 + ε)/εR (ε + 1)/ε
ε1/εn (2 + ε)/εcP
>R (ε + 1)/εε
(1 + ε)(ε + 1)/εcG
, (31)
μ2S
μ2S = 100
⎡⎢⎣1 −
(n − 1)(1 + ε)/ε [(ε + 1)/ε] (ε + 1)/ε
n (ε + 2)/ε
⎤⎥⎦. (32)
18
Straightforward calculations shows that this threshold value is higher than under two-stage
maximisation.
Assuming that there is entry until yields the same output as in the public
monopoly. This also means that any cost disadvantage under public ownership would mean a
lower output. As for , the condition for privatisation and liberalisation to produce an
increase in consumer welfare is
6.3. Quality that affects marginal costs
The previous sections have focused on quality as reflected in fixed costs, like when quality is
directly related to the size of the staff. But quality can also be reflected in the quality of the
inputs, for example in higher quantity and/or quality of inputs. This section highlights the
difference between models where quality is reflected in fixed and sunk costs, but in so doing
we simplify by setting ρ=1 like in Sutton (1991).
Suppose that the cost function is of the form TCi =(c0+qγ)yi, thus ignoring all fixed
costs. A public monopoly would maximise
Routine calculations yield the following output and quality:
Next, consider the n-firm oligopoly and assume for simplicity simultaneous
maximisation. The profits of firm 1 are then:
n = n̂
μ2S
μ > μ2 = 100⎡⎢⎣1 −
1
(1 + ε)1/ε
⎤⎥⎦. (33)
Maxy
Ω = (y /N)α1q
α1y0
α0 + λ(R − c0y − q γy). (34)
yG =γR
γc0 + R, (35)
q =⎛⎜⎝
Rγ⎞⎟⎠
1/γ
. (36)
π1 =R
y1 + ∑j = 2n yjqj/q1
y1 − c0y1 − q1γy1. (37)
19
Differentiating with respect to quality yields
Impose ex-post symmetry and rearrange:
Output as a function of quality becomes R(n 1)/n(c0+qγ). Inserting (39) yields:
Routine calculations show that the oligopoly underprovides output and quality, so it
provides an overpriced product of sub-standard quality. However, unit costs (which are here
equal to marginal costs with respect to output) are now
and
It follows that unit costs are now higher in the public monopoly, but this is explained by the
fact that it provides superior quality. The model therefore predicts that a superficial cost
comparison that does not take quality into consideration would find the public monopoly less
cost efficient.
In contrast to models where quality is related to sunk costs, there is no upper limit to
the number of firms (unless there are exogenous sunk costs). The oligopoly converges to the
socially optimal solution as n approaches infinity, like in a conventional oligopoly but in
contrast to the sunk-cost version of the model.
−R y1
[y1 + ∑j = 2n yjqj/q1]
2
⎛⎜⎝−∑j = 2
n yjqj
q12
⎞⎟⎠− γq1
γ + 1y = 0. (38)
q (n ) =⎡⎢⎣(n − 1)R
nγ⎤⎥⎦
1/γ
. (39)
y(n ) =γR(n − 1)
γnc0 + (n − 1)R. (40)
ATCG = c0 +Rγ
(41)
ATC(n ) = c0 +n − 1
nRγ. (42)
20
7. Discussion and concluding remarks
Our analysis has suggested that an oligopoly underprovides output, quality and welfare.
While a price distortion can usually be alleviated by competition, a quality distortion may
even be worsened by entry. These adverse effects apply also to the case where quality is
reflected in marginal costs rather than sunk costs, but entry would then improve quality, and
marginal costs will also be lower under oligopoly than in a public monopoly. To privatise and
liberalise would in both cases have adverse effects, at least in the absence of changes in the
marginal cost functions. This applies also to the introduction of commercial objectives (as for
example suggested by the new public management) into monopolies that have previously
maximised welfare.
However, our generalisation of Sutton (1991) means that the impact on consumer utility
of quality can be weaker or stronger than the impact of consumption as such. This means that
a scope for a relatively large number of firms can not be ruled out even if the sunk costs do
not increase dramatically with quality. The market can become fragmented if the sensitivity
of utility to quality is low, in which case there is no strong quality distortion. Moreover, the
distortion would not have a significant negative impact on utility. Privatisation and
liberalisation would then improve welfare if there is a moderate reduction in marginal costs.
Such a cost advantage should on the other hand not be taken for granted. A proper
reading of the empirical literature on industries with both public and private ownership
suggests that differences in cost efficiency may be nonexistent or may go either way (see
surveys such as Millward, 1982; Boyd, 1986; Willner, 2001).8 Empirical studies of the
substantial experiences of privatisation in Britain fail to detect general post-privatisation
improvements in cost efficiency or total factor productivity (Martin and Parker, 1997, Florio,
2004).9 Several agency models (with and without intrinsic motivation) suggest that private
ownership and competition do not necessarily yield higher cost efficiency (see for example
De Fraja, 1993, Martin, 1993, Bartoletti and Poletti, 1996, Willner and Parker, 2007, Willner
and Grönblom, 2013 and Grönblom and Willner, 2014).
8 There might be a relative public-sector strength in water and electricity provision but not in refuse
collection and bus transport. This may reflect different labour intensity and sensitivity to quality.9 The often cited survey by Megginson and Netter (2001) makes a different conclusion, but it has a strong
emphasis on third-world and transition economies, while many valuable sources from industrial countries are
missing.

21
Acknowledgements
We are grateful to Niklas Grönblom for valuable research assistamce.
APPENDIX
Proof of Lemma 1. Consider an individual who consumes the output of the i:th firm,
i=1,2,...n. Utility maximisation means maximising the following Lagrange function:
This individual then demands
Insert (A.1) and (A.2) into (A.1) to get the indirect utility function. The utility level is then
proportional to
This is the only component in the indirect utility function that depends on which firm that
produces y. All customers are identical utility maximisers, so the following must hold true for
every firm j and i in the industry:
This implies for all i and j. QED
Maxy , y0
L = (yiqiρ)
α1y0
α0 + λ(1 − pi yi − y0p0). (A .1)
yi =α1/(α1 + α0)
pi
, (A .2)
y0 =α0/(α1 + α0)
p0
. (B .3)
⎛⎜⎝
qiρ
pi
⎞⎟⎠
α1
. (A .4)
qiρ
pi
=qj
ρ
pj
. (A .5)
pj = (qj/qi)ρpi
22
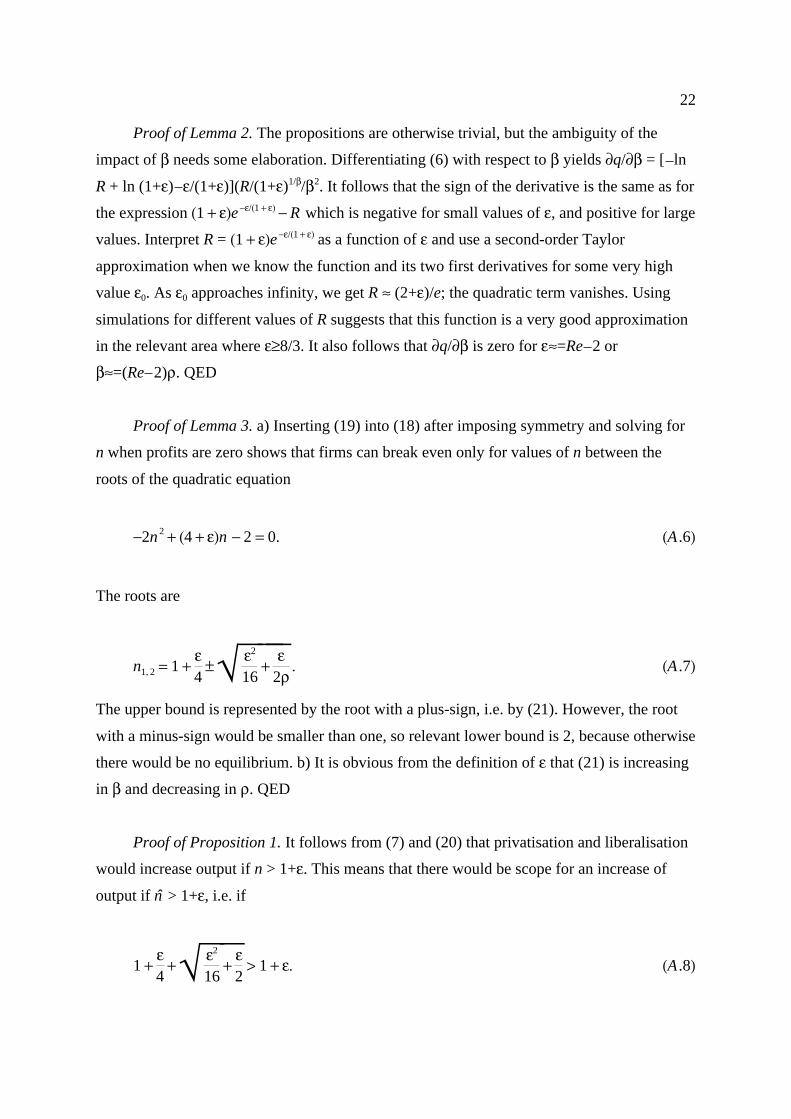
Proof of Lemma 2. The propositions are otherwise trivial, but the ambiguity of the
impact of β needs some elaboration. Differentiating (6) with respect to β yields ∂q/∂β = [ ln
R + ln (1+ε) ε/(1+ε)](R/(1+ε)1/β/β2. It follows that the sign of the derivative is the same as for
the expression which is negative for small values of ε, and positive for large
values. Interpret R = as a function of ε and use a second-order Taylor
approximation when we know the function and its two first derivatives for some very high
value ε0. As ε0 approaches infinity, we get R (2+ε)/e; the quadratic term vanishes. Using
simulations for different values of R suggests that this function is a very good approximation
in the relevant area where ε 8/3. It also follows that ∂q/∂β is zero for ε =Re 2 or
β =(Re 2)ρ. QED
Proof of Lemma 3. a) Inserting (19) into (18) after imposing symmetry and solving for
n when profits are zero shows that firms can break even only for values of n between the
roots of the quadratic equation
The roots are
The upper bound is represented by the root with a plus-sign, i.e. by (21). However, the root
with a minus-sign would be smaller than one, so relevant lower bound is 2, because otherwise
there would be no equilibrium. b) It is obvious from the definition of ε that (21) is increasing
in β and decreasing in ρ. QED
Proof of Proposition 1. It follows from (7) and (20) that privatisation and liberalisation
would increase output if n > 1+ε. This means that there would be scope for an increase of
output if > 1+ε, i.e. if
(1 + ε)e−ε/(1 + ε) − R
(1 + ε)e−ε/(1 + ε)
≈
≥ ≈
≈
−2n 2 + (4 + ε)n − 2 = 0. (A .6)
n1, 2 = 1 +ε4±√⎯⎯⎯ε
2
16+
ε2ρ
. (A .7)
n̂
1 +ε4+√⎯⎯ε
2
16+ε2> 1 + ε. (A .8)
23
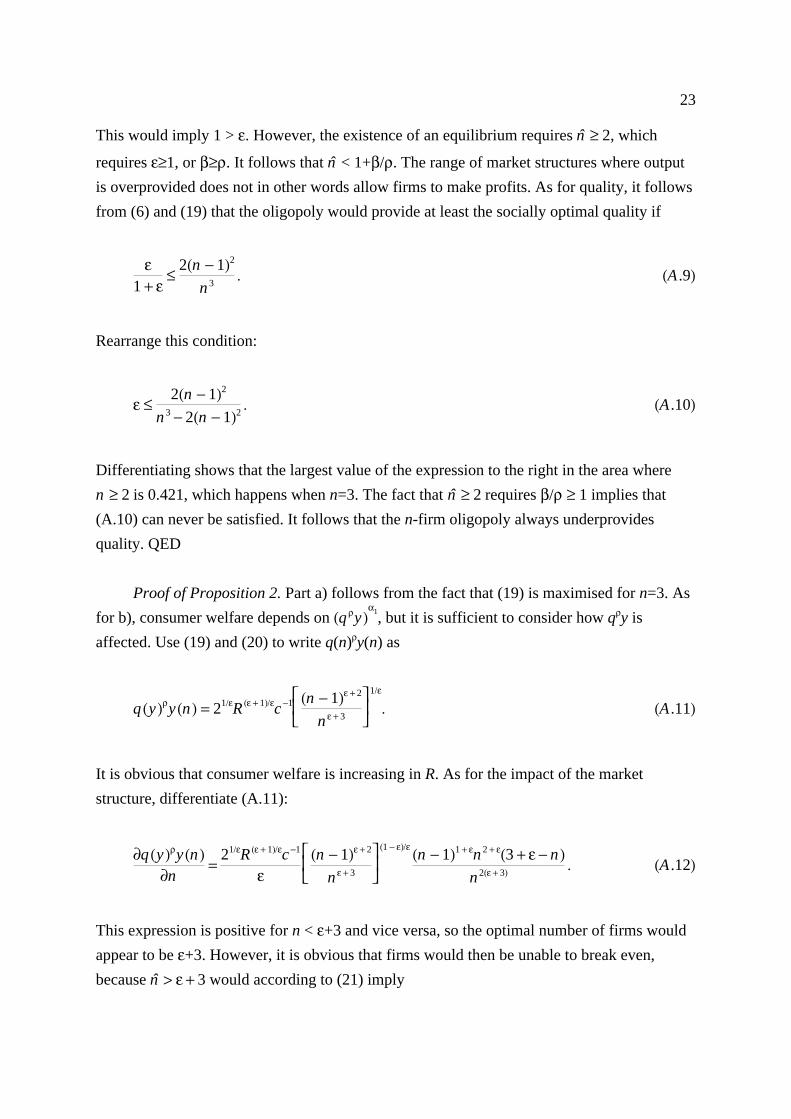
This would imply 1 > ε. However, the existence of an equilibrium requires , which
requires ε 1, or β ρ. It follows that < 1+β/ρ. The range of market structures where output
is overprovided does not in other words allow firms to make profits. As for quality, it follows
from (6) and (19) that the oligopoly would provide at least the socially optimal quality if
Rearrange this condition:
Differentiating shows that the largest value of the expression to the right in the area where
is 0.421, which happens when n=3. The fact that requires β/ρ 1 implies that
(A.10) can never be satisfied. It follows that the n-firm oligopoly always underprovides
quality. QED
Proof of Proposition 2. Part a) follows from the fact that (19) is maximised for n=3. As
for b), consumer welfare depends on , but it is sufficient to consider how qρy is
affected. Use (19) and (20) to write q(n)ρy(n) as
It is obvious that consumer welfare is increasing in R. As for the impact of the market
structure, differentiate (A.11):
This expression is positive for n < ε+3 and vice versa, so the optimal number of firms would
appear to be ε+3. However, it is obvious that firms would then be unable to break even,
because would according to (21) imply
n̂ ≥ 2
≥ ≥ n̂
ε1 + ε
≤2(n − 1)2
n 3. (A .9)
ε ≤2(n − 1)2
n 3 − 2(n − 1)2. (A .10)
n ≥ 2 n̂ ≥ 2 ≥
(q ρy)α1
q (y)ρy(n ) = 21/εR (ε + 1)/εc−1⎡⎢⎣(n − 1)ε + 2
n ε + 3
⎤⎥⎦
1/ε
. (A .11)
∂q (y)ρy(n )∂n
=21/εR (ε + 1)/εc−1
ε⎡⎢⎣(n − 1)ε + 2
n ε + 3
⎤⎥⎦
(1 − ε)/ε (n − 1)1 + εn 2 + ε(3 + ε − n )n 2(ε + 3) . (A .12)
n̂ > ε + 3

24
or
which cannot happen. It follows that consumer welfare is increasing in the number of firms.
QED
Proof of Corollary 1. Unit costs are c+qβ/y. For the case of a public monopoly we then
get:
As for unit costs after privatisation and liberalisation, divide (20) by n to get output per firm.
Total costs per unit of output are then:
Setting n=2 yields the same expression as (A.15), but (A.16) is increasing in n, so any n>2
would mean higher unit costs than in the public monopoly. QED
Proof of Corollary 2: We formulate the antithesis μ1 > μ2. Use (23) and (25) and
rearrange:
This implies
4 + ε + √⎯⎯⎯⎯⎯ε2 + 8ε > 4ε + 12, (A .13)
0 > β2 + 5β + 8, (A .14)
ATCG = c +cε. (A .15)
ATC* = c +2(n − 1)
nε. (A .16)
21/ε(n − 1)(2 + ε)/ε [(ε + 1)/ε] (ε + 1)/ε
n (ε + 3)/ε >(1 + ε) (n − 1)
nε. (A .17)
21/ε(n − 1)2/ε [(ε + 1)/ε]1/ε
n 3/ε > 1, (A .18)
25
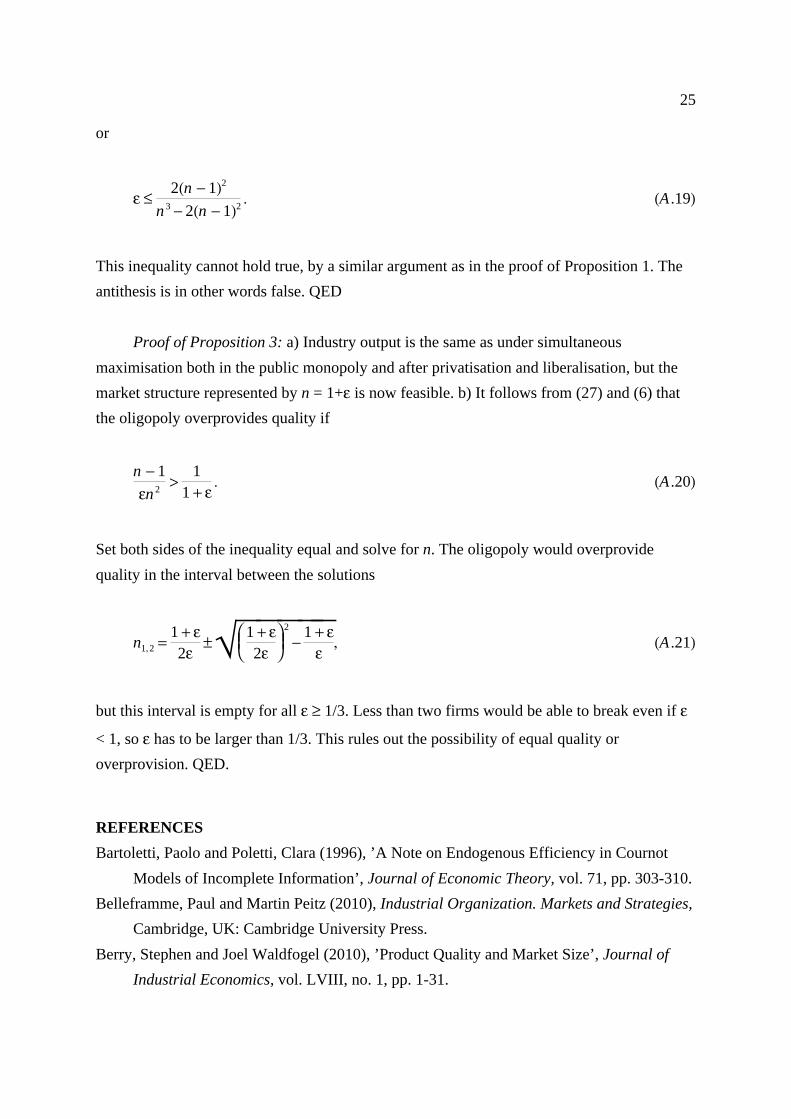
or
This inequality cannot hold true, by a similar argument as in the proof of Proposition 1. The
antithesis is in other words false. QED
Proof of Proposition 3: a) Industry output is the same as under simultaneous
maximisation both in the public monopoly and after privatisation and liberalisation, but the
market structure represented by n = 1+ε is now feasible. b) It follows from (27) and (6) that
the oligopoly overprovides quality if
Set both sides of the inequality equal and solve for n. The oligopoly would overprovide
quality in the interval between the solutions
but this interval is empty for all ε 1/3. Less than two firms would be able to break even if ε
< 1, so ε has to be larger than 1/3. This rules out the possibility of equal quality or
overprovision. QED.
REFERENCES
Bartoletti, Paolo and Poletti, Clara (1996), ’A Note on Endogenous Efficiency in Cournot
Models of Incomplete Information’, Journal of Economic Theory, vol. 71, pp. 303-310.
Belleframme, Paul and Martin Peitz (2010), Industrial Organization. Markets and Strategies,
Cambridge, UK: Cambridge University Press.
Berry, Stephen and Joel Waldfogel (2010), ’Product Quality and Market Size’, Journal of
Industrial Economics, vol. LVIII, no. 1, pp. 1-31.
ε ≤2(n − 1)2
n 3 − 2(n − 1)2. (A .19)
n − 1
εn 2>
11 + ε
. (A .20)
n1,2 =1 + ε2ε
±√⎯⎯⎯⎯⎯⎛⎜⎝
1 + ε2ε
⎞⎟⎠
2
−1 + εε
, (A .21)
≥
26
Boyd, Colin W. (1986), ’The Comparative Efficiency of State Owned Enterprises’, in
Negandhi, Anant R. (ed.), Multinational Corporations and State-Owned Enterprises: A
New Challenge in International Business, Greenwich, Conn. and London: Research in
International Business and International Relations, JAI Press.
Brekke, Kurt R., Robert Nuscheler, and Odd Rune Straume (2006), ’Quality and Location
Choices Under Price Regulation’, Journal of Economics & Managemenet Strategy, vol.
5, no. 1, pp. 207-227
Brekke, Kurt R., Luigi Siciliani, and Odd Rune Straume (2011), ’Hospital Competition and
Quality with Regulated Prices’, Scandinavian Journal of Economics, vol. 113, no. 2,
pp. 444-469.
Brunekreeft, G. and K. Keller (2000), ’The Electricity Supply Industry in Germany: Market
Power or Power of the Market?’, Utility Policy, vol. 9, pp. 15-29.
Crompton, G. and R. Jupe (2003), ’Such a Silly Scheme: The Privatisation of Britain’s
Railways 1992-2002’, Critical Perspectives on Accounting, vol. 14, pp. 617-645.
De Fraja, Giovanni (1993), ’Productive Efficiency in Public and Private Firms’, Journal of
Public Economics, vol. 50, no. 1, pp. 15-30.
Florio, Massimo (2004), The Great Divestiture. Evaluating the Impact of the British
Privatizations 1979-1997, Cambridge, Mass.: MIT Press.
Gal-Or, Esther (1983), ’Quality and Quantity Competition’, Bell Journal of Economics, vol.
14, no. 4, pp. 590-600.
Geroski, Paul (1995), ’What Do We Know About Entry?’, International Journal of Industrial
Organization, vol. 13, no. 4, pp. 421-440.
Grönblom, Sonja and Johan Willner (2014), ’Organisational Form and Individual Motivation:
Public Ownership, Privatisation, and Fat Cats’, Journal of Economic Policy Reform,
vol. 17, no. 3, 2014, pp. 267-284.
Hart, Oliver, Andrei Shleifer, and Robert W. Vishny (1997), ’The Proper Scope of
Government’, Quarterly Journal of Economics, vol. CXII, no. 4, pp. 1127-1163.
Jiang, J. N. and J. Yu (2004), ’Reliability in Electricity Markets: Another Binding
Constraint’, Electricity Journal, vol. 17, no. 5, pp. 43-53.
Lieb-Dóczy, Ernese, Achim-Rüdiger Börner, and Gordon MacKerron (2003), ’Who Secures
the Security of Supply? European perspectivess on Security, Competition and
Liability’, Electricity Journal, vol. 16. no. 10, pp. 10-19.
Kwoka, John E., jr. (2005), ’The Comparative Advantage of Public Ownership: Evidence
from Electric Utilities’, Canadian Journal of Economics, vol. 38, no. 2, pp. 622-640.
Ma, Ching-to Albert and James F. Burgess (1993), ’Quality Competition, Welfare, and
Regulation’, Journal of Economics, vol. 58, no. 2, pp. 153-173.

27
Martin, Stephen (1993), ’Endogeneous Firm Efficiency in a Cournot Principal-Agent Model’,
Journal of Economic Theory, vol. 59, no. 2, pp. 445-450.
Martin, Stephen and David Parker (1997), The Impact of Privatisation. Ownership and
Corporate Performance in the UK, London and New York: Routledge.
Matsumura, Toshiro and Noriaki Matsushima (2007), ’Congestion-reducing Investments and
Economic Welfare in a Hotelling Model’, Economics Letters, vol. 96, no. 2, pp.
161-167.
Megginson, William L. and Jeffry M. Netter (2001), ’From State to Market: A Survey of
Empirical Studies of Privatization’, Journal of Economic Literature, vol. XXXIX, no.
2, pp.321-389.
Millward, R. (1982), ’The Comparative Performance of Public and Private Ownership’, in
Roll, Lord E. (ed.), The Mixed Economy, London: Macmillan.
Moss, D. I. (2004), ’Competition or Reliability in Electricity? What the Coming Policy Shift
Means for Restructuring’, Electricity Journal, vol. 17, no. 2, pp. 11-28.
Newbery, David M. (2006), ’Privatising Network Industries’, pp. 3-50 in Koethenbürger,
Marko, Hans-Werner Sinn, and John Whalley (Eds.), Privatization Experiences in the
EU, Cambridge, MA: MIT Press.
Parker, David (2009), The Official History of Privatisation. Volume I: The Formative Years
1970-1987, London and New York: Routledge.
Pirie, Madsen (1998), Privatization. Theory, Practice and Choice, Aldershot: Wildwood
House.
Sheshinski, Eytan (1976), ’Price, Quality and Quantity Regulation in Monopoly’, Economica,
vol. 34, no. 170, pp. 127-137.
Spence, A. Michael (1975), ’Monopoly, Quality, and Regulation’, Bell Journal of
Economics, vol. 6, no. 2, pp. 417-429.
Sutton, John (1991), Sunk Costs and Market Structure. Price Competition, Advertising and
the Evolution of Concentration, Cambridge, Mass. And London: MIT Press.
Thatcher, Margaret (1993), The Downing Street Years, Glasgow: HarperCollinsPublishers.
Vogelsang, Ingo (1988), ’Regulation of Public Utilities and Natiolalized Industries’, pp.
45-67 in Hare, Paul G. (ed.), Surveys in Public Sector Economics, Oxford: Basil
Blackwell.
White, Lawrence J. (1977), ’Market Structure and Product Varieties’, American Economic
Review, vol. 69, no. 1, pp. 179-182.
Willner, Johan (2001), ’Ownership, Efficiency, and Political Interference’, European Journal
of Political Economy, vol. 17, no. 6, pp. 723-748.
28
Willner, Johan (2015), ’Competition and Quality in Privatised Industries:
Is There a Convergence Towards the Welfare Maximising Solution?’, mimeo, Åbo
Akademi University, latest version January 2015.
Willner, Johan och Sonja Grönblom (2013), ’Reforming a Network Industry; Consequences
for Cost Efficiency and Welfare’, International Review of Applied Economics, vol. 28,
no. 2, pp. 265-284.
Willner, Johan and David Parker (2007), ’The Relative Performance of Public and Private
Enterprise Under Conditions of Active and Passive Ownership and Competition and
Monopoly’, Journal of Economics, vol. 90, no. 3, pp. 221-253.
Wolinsky, Asher (1997), ’Regulation of Duopoly: Managed Competition vs Regulated
Monopolies’, Journal of Economics & Management Strategy, vol. 6, no. 4, pp.
821-847.