Embed Size (px)
Citation preview
Quality of Life Analysis for Patients Receiving Heart Implants David Nfodjo &Christiana Petrou, University of Louisville, Louisville, KY
ABSTRACT Objective: To investigate the quality of life for heart patients using data mining techniques. Method: A quality of life questionnaire was used and given to patients at each follow up visit at baseline and at 3, 6, 12, 18 months after the implantation of a pacemaker. It was the aim to compare the scores to severity, the different prescribing habits for various physicians and to examine the quality of life by time since the implantation through the responses of selected questions from the questionnaires. Kernel density estimation and least squares estimation were used to analyze the data using SAS software. Results: Statistically significant results were obtained by comparing the change in severity between male and female patients. Prescribing habits by different physicians proved to be statistically noteworthy, since different doctors have different prescribing habits. Furthermore, the quality of life questionnaire responses provided a range of statistical results that change as time progresses. Conclusion: The relationship between severity ranking of medications, prescribing habits of physicians and quality of life is statistically significant. Patientsí quality of life responses fluctuate over time. INTRODUCTION The main focus of this statistical study was to investigate the quality of life for heart patients. The objective was to track patients who have received pacemaker implants and document their recovery through a quality of life questionnaire at specific follow up visits to their physician. The patients were asked to complete a questionnaire at the end of their visit at baseline (which was set at two weeks) and at 3, 6, 12, and 18 months. To date, approximately 200 patients have been recruited into the study. Medications were prescribed for the patients and these were investigated as well. The questionnaire that was used was the SF-36. This is a short 36-item questionnaire, which measures eight multi-item dimensions: physical functioning (10 items), social functioning (2 items), role limitations due to physical problems (4 items), role limitations due to emotional problems (3 items), mental health (5 items), energy/vitality (4 items), pain (2 items), general health perception (5 items). The SF-36 has become one of the most widely used generic measures of subjective health status.
All medications received by a patient were combined in an unstructured text string. A text string is enclosed in double quotes, and can contain any combination of letters, numbers, spaces, and punctuation. Text strings were examined as predefined variables. This was done using SAS/Text Miner. Clustering of medications was done using SAS Text Miner with expectation maximization. The expectation-maximization (otherwise known as EM) algorithm is used to estimate the probability density of a set of given data. EM is a statistical model that makes use of the finite Gaussian mixtures model. The algorithm is similar to the K-means procedure in that a set of parameters is re-computed until a desired convergence value is achieved. The finite mixture model assumes all attributes to be independent random variables. A mixture is a set of N probability distributions where each distribution represents a cluster. An individual observation is assigned a probability that it would have a certain set of attribute values given it was a member of a specific cluster. In the simplest case N=2, the probability distributions are assumed to be normal and data instances consist of a single real-valued attribute. Using the scenario, the job of the algorithm is to determine the value of five parameters, specifically the mean and standard deviation for cluster 1, the mean and standard deviation for cluster 2, the sampling probability P for cluster 1 (the probability for cluster 2 is 1-P). The general procedure is to first guess initial values for the five parameters. Then use the probability density function for a normal distribution to compute the cluster probability for each instance. In the case of a single independent variable with mean µ and standard deviation σ, the formula is:
( )( )
2
2
22
1)(σ
µ
σπx
e
xf−−
=
In the two-cluster case, we will have the two probability distribution formulas each with differing mean and standard deviation values. Use the probability scores to re-estimate the five parameters and then return to the probability function of a normal distribution to compute the cluster probability (1). This procedure was done through SAS Software by running the Text Miner program.
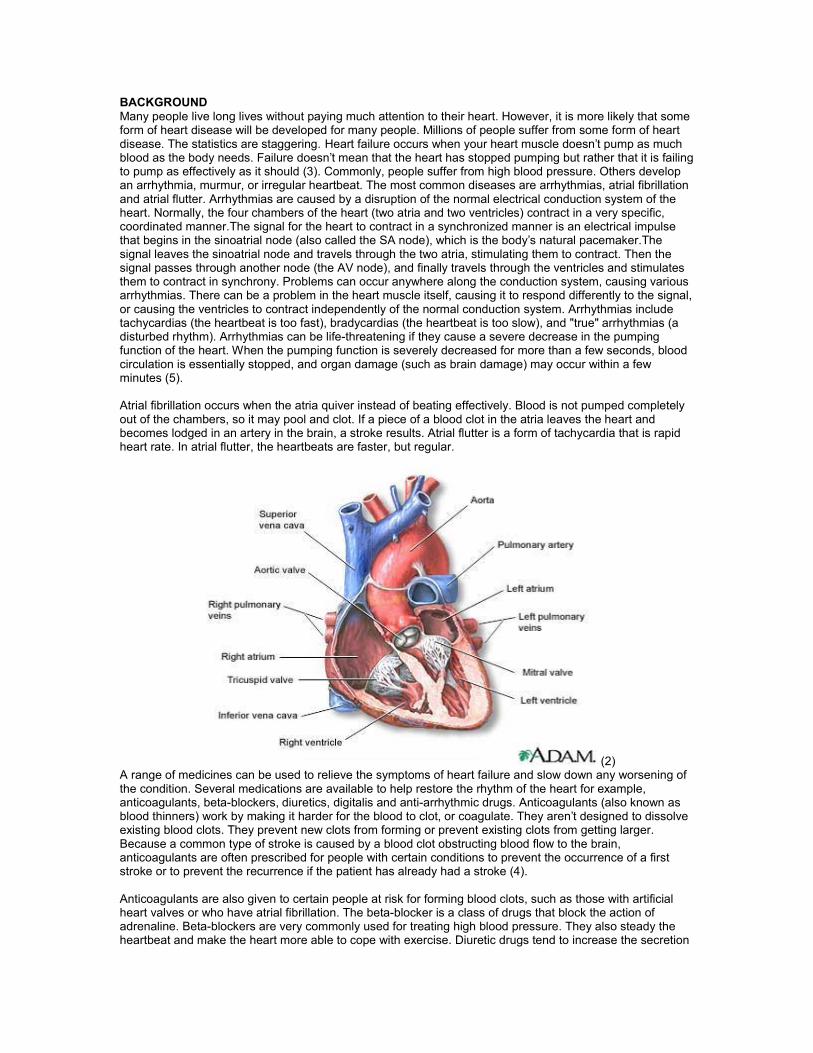
BACKGROUND Many people live long lives without paying much attention to their heart. However, it is more likely that some form of heart disease will be developed for many people. Millions of people suffer from some form of heart disease. The statistics are staggering. Heart failure occurs when your heart muscle doesn't pump as much blood as the body needs. Failure doesn't mean that the heart has stopped pumping but rather that it is failing to pump as effectively as it should (3). Commonly, people suffer from high blood pressure. Others develop an arrhythmia, murmur, or irregular heartbeat. The most common diseases are arrhythmias, atrial fibrillation and atrial flutter. Arrhythmias are caused by a disruption of the normal electrical conduction system of the heart. Normally, the four chambers of the heart (two atria and two ventricles) contract in a very specific, coordinated manner.The signal for the heart to contract in a synchronized manner is an electrical impulse that begins in the sinoatrial node (also called the SA node), which is the body's natural pacemaker.The signal leaves the sinoatrial node and travels through the two atria, stimulating them to contract. Then the signal passes through another node (the AV node), and finally travels through the ventricles and stimulates them to contract in synchrony. Problems can occur anywhere along the conduction system, causing various arrhythmias. There can be a problem in the heart muscle itself, causing it to respond differently to the signal, or causing the ventricles to contract independently of the normal conduction system. Arrhythmias include tachycardias (the heartbeat is too fast), bradycardias (the heartbeat is too slow), and "true" arrhythmias (a disturbed rhythm). Arrhythmias can be life-threatening if they cause a severe decrease in the pumping function of the heart. When the pumping function is severely decreased for more than a few seconds, blood circulation is essentially stopped, and organ damage (such as brain damage) may occur within a few minutes (5). Atrial fibrillation occurs when the atria quiver instead of beating effectively. Blood is not pumped completely out of the chambers, so it may pool and clot. If a piece of a blood clot in the atria leaves the heart and becomes lodged in an artery in the brain, a stroke results. Atrial flutter is a form of tachycardia that is rapid heart rate. In atrial flutter, the heartbeats are faster, but regular.
(2) A range of medicines can be used to relieve the symptoms of heart failure and slow down any worsening of the condition. Several medications are available to help restore the rhythm of the heart for example, anticoagulants, beta-blockers, diuretics, digitalis and anti-arrhythmic drugs. Anticoagulants (also known as blood thinners) work by making it harder for the blood to clot, or coagulate. They aren't designed to dissolve existing blood clots. They prevent new clots from forming or prevent existing clots from getting larger. Because a common type of stroke is caused by a blood clot obstructing blood flow to the brain, anticoagulants are often prescribed for people with certain conditions to prevent the occurrence of a first stroke or to prevent the recurrence if the patient has already had a stroke (4). Anticoagulants are also given to certain people at risk for forming blood clots, such as those with artificial heart valves or who have atrial fibrillation. The beta-blocker is a class of drugs that block the action of adrenaline. Beta-blockers are very commonly used for treating high blood pressure. They also steady the heartbeat and make the heart more able to cope with exercise. Diuretic drugs tend to increase the secretion
and discharge of urine. They increase the production of urine, and so help remove excess fluid from the body. A diuretic acts by increasing the function of the heart, and thereby improves renal perfusion. Digitalis medicines strengthen the force of the heartbeat by increasing the amount of calcium in the heart's cells and help the heart beat more forcefully. Finally there is a variety of anti-arrhythmic drugs. These may be given intravenously in an emergency situation or orally for long-term treatment. These drugs either suppress the abnormal firing of pacemaker tissue or depress the transmission of impulses in tissues that either conduct too rapidly or participate in reentry. A heart-healthy lifestyle can help reduce the risk of heart failure. This includes not smoking, being physically active most days and eating a balanced diet, which results in lowering cholesterol level (4).
However, when medications are ineffective, medical devices can be used such as an implant able cardioverter-defibrillator (often called an ICD), pacemakers and biventricular pacemakers. An ICD is a device that briefly passes an electric current through the heart. It is "implanted," or put in the body surgically. The pulse generator constantly watches your heartbeat. It is like a small computer that runs on a battery. The lead is a wire from the pulse generator to the inside of your heart. The lead takes signals from your heart to the ICD and then takes an electric current from the pulse generator to your heart to help your heart beat regularly. A pacemaker is a small device that sends electrical impulses to the heart muscle to maintain a suitable heart rate; it is placed on the body surgically. Pacemakers are implanted to regulate irregular contractions of the heart (arrhythmia). They are most frequently prescribed to speed the heartbeat of patients who have a slow heart (bradycardia) and they are also used in some cases to slow a fast heart rate (tachycardia). Standard pacemakers pace the right side of the heart. In contrast, biventricular pacemakers pace both the right and left sides of the heart. They do not increase heart rate, but rather stimulate the left and right ventricles simultaneously. This enables the left ventricle to pump blood more efficiently (4).
METHOD
The purpose of text mining is to look for patterns in natural language text, and may be defined as the process of analyzing text to extract information from it. Text mining recognizes that complete understanding of natural language text, a long-standing goal of computer science, is not immediately attainable and focuses on extracting a small amount of information from text with high reliability. The information extracted might be the author, title and date of publication of an article, the acronyms defined in a text or the articles mentioned in the bibliography. Text mining uses recall and precision (borrowed from the information retrieval research community) to measure the effectiveness of different information extraction techniques, allowing quantitative comparisons to be made. In text mining, the goal is to discover heretofore-unknown information, something that no one yet knows and so could not have yet written down. Text mining is a variation on a field called data mining that tries to find interesting patterns from large databases. A typical example in data mining is using consumer purchasing patterns to predict which products to place close together on shelves, or whom to offer coupons for, and so on.
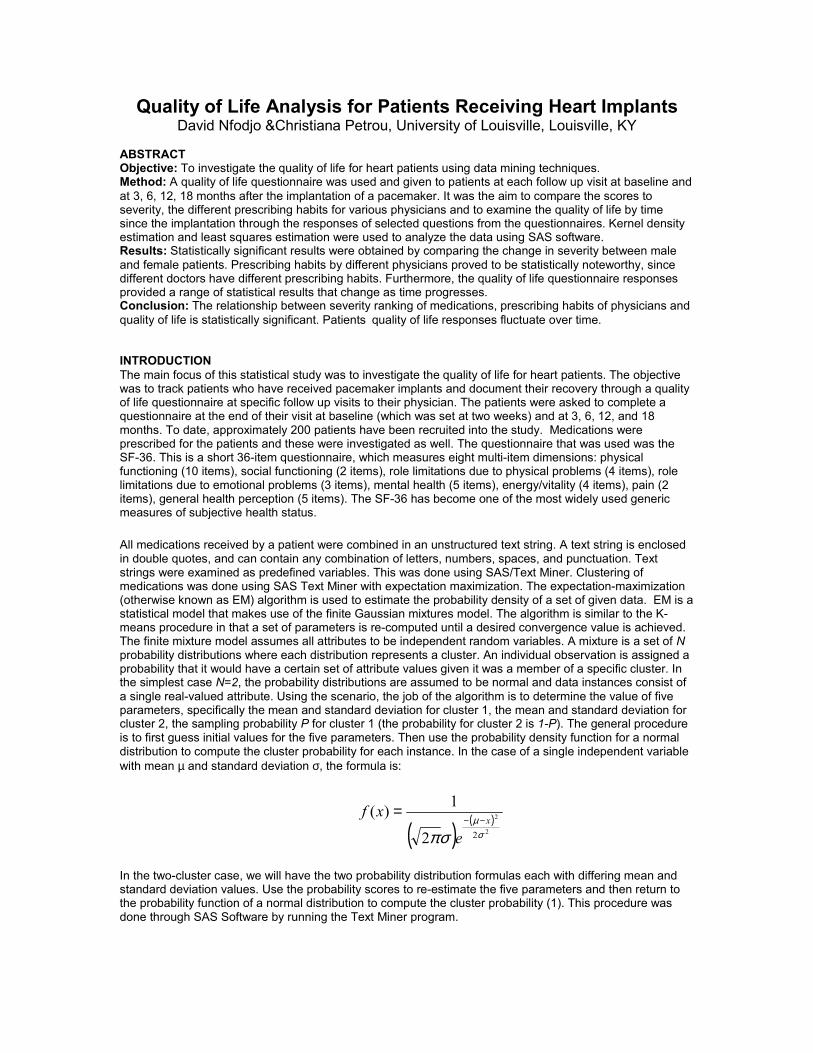
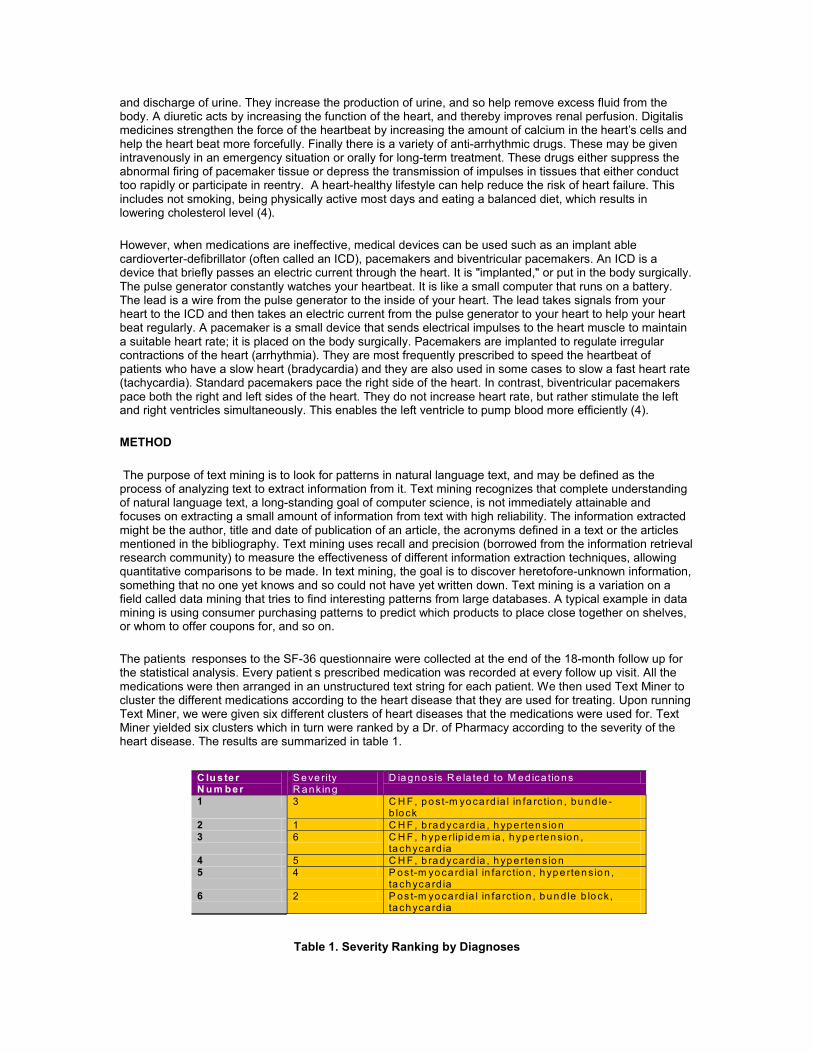
The patientsí responses to the SF-36 questionnaire were collected at the end of the 18-month follow up for the statistical analysis. Every patientís prescribed medication was recorded at every follow up visit. All the medications were then arranged in an unstructured text string for each patient. We then used Text Miner to cluster the different medications according to the heart disease that they are used for treating. Upon running Text Miner, we were given six different clusters of heart diseases that the medications were used for. Text Miner yielded six clusters which in turn were ranked by a Dr. of Pharmacy according to the severity of the heart disease. The results are summarized in table 1.
Table 1. Severity Ranking by Diagnoses
C lu s te r N u m be r
S e ve rity R a n k in g
D ia gno s is R e la te d to M ed ica tio n s
1 3 C H F , p o s t-m yo ca rd ia l in fa rc tio n , bu n d le -b lo ck
2 1 C H F , b ra dycard ia , h yp e rten s io n 3 6 C H F , h yp e rlip id em ia , hype rten s io n ,
ta ch yca rd ia 4 5 C H F , b ra dycard ia , h yp e rten s io n 5 4 P os t-m yo ca rd ia l in fa rc tio n , h yp e rten s io n ,
ta ch yca rd ia 6 2 P os t-m yo ca rd ia l in fa rc tio n , b u n d le b lo ck ,
ta ch yca rd ia
The results of the six different clusters helped us identify the clusters that distinct patients belong to based on the medications they were being prescribed to aid them with their heart diseases. For example if a patient belongs in cluster number one then the heart diseases that are possibly experienced by this patent are CHF, post- myocardial infarction and bundle-block. This is ranked as the third most severe cluster based on heart disease medications. Of course, there is more than one patient in each cluster. On average the different clusters summarize the different heart conditions experienced by the patients. The statistical analysis that was conducted was done based on these six clusters and the comparison of the responses provided by the patients ëallocatedî in different clusters KERNEL DENSITY ESTIMATION The kernel density estimator uses the observed data to estimate the probability density of a sampled population. There are two approaches to estimate density functions. The first approach is parametric, which assumes that the data are obtained from a known probability distribution. An estimate of the parameters is sufficient to determine the probability density function. The nonparametric approach, on the other hand, will have fewer assumptions made about the distribution of the observed data. It is only assumed that the distribution has a symmetric probability density, f , where the collected data are used to estimate f . Density estimates can give valuable information about skew ness and multimodality in the data. THE KERNEL ESTIMATOR The kernel estimator in one dimension is defined by
��
���
� −= �
= hXxK
nhxf i
n
i 1
1)(à
where h is the bandwidth, also called the smoothing parameter. The Kernel function K has the following properties: 1. K ≥ 0 and k is symmetric around the origin. 2. K is continuous
3. �∞
∞
=1)( dxxK
The Kernel estimator is a sum of ìbumpsî placed at the observations .The kernel function K determines the shape of the bumps while the bandwidth h determines their width. Since the kernel function is a probability density function, the kernel estimator will itself be a probability density and f will inherit all the continuity and differentiability properties of the kernel K. The choice of a kernel function is not crucial to the statistical performance of the method. For a specific kernel function, the discrepancy between the density estimator f and the true density f can be measured by the mean integrated square error
MISE ( ) ( ){ } ( )dxxfVardxxfxfEf �� +−= )(à)()(àà 2
It is difficult to estimate the bandwidth using kernel estimation. As the sample size increases, the optimal choice of the bandwidth must decrease. The optimal bandwidth to reduce the mean integrated square error is equal to
{ } { } { } 515
125/125/22 )()()( −−
��� ′′= ndxxftKdttKthMISE
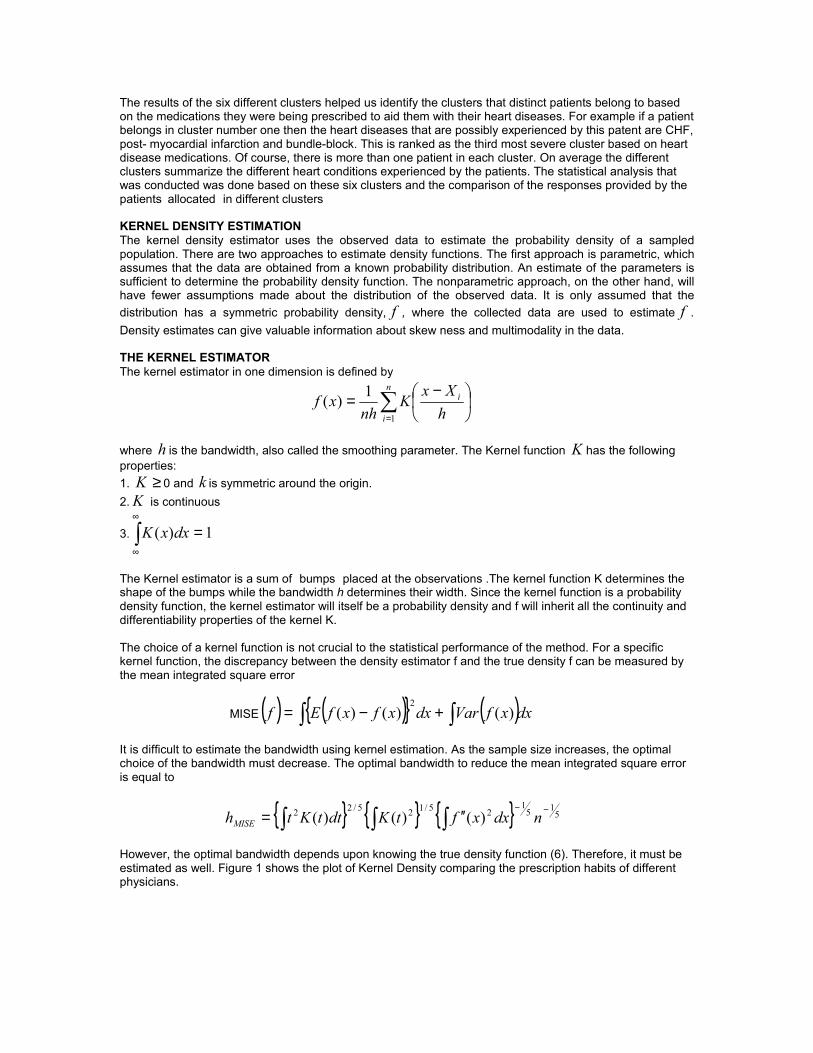
However, the optimal bandwidth depends upon knowing the true density function (6). Therefore, it must be estimated as well. Figure 1 shows the plot of Kernel Density comparing the prescription habits of different physicians.
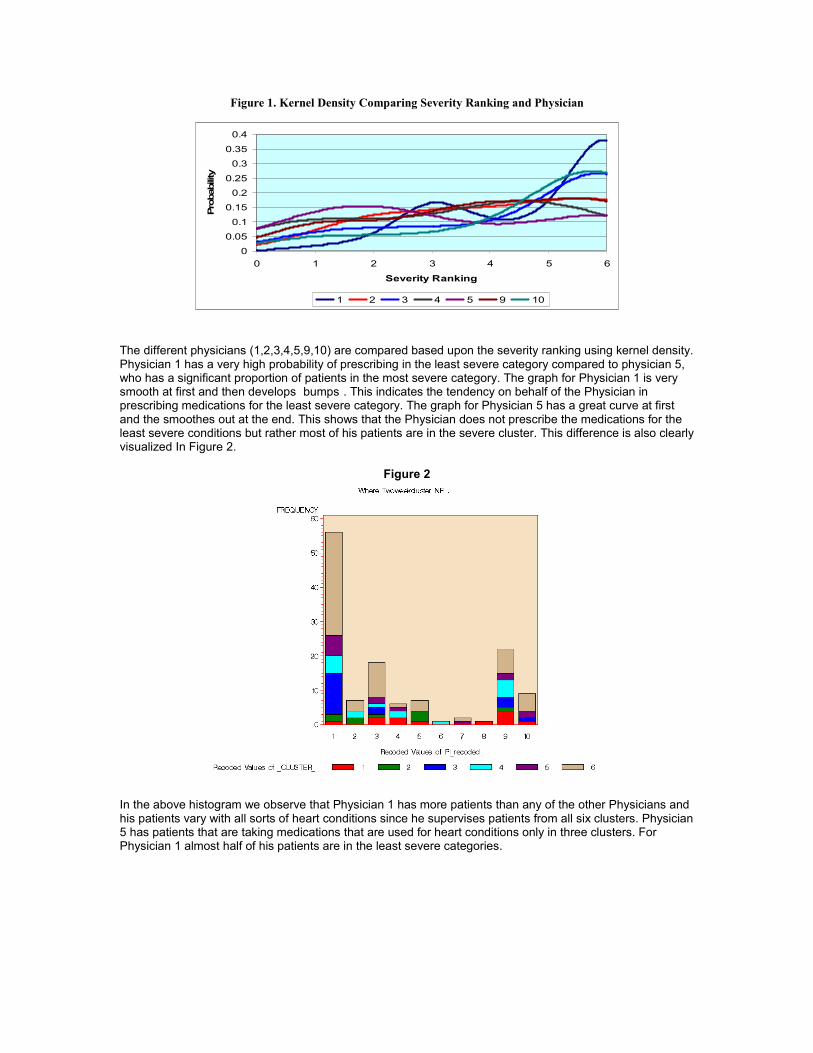
Figure 1. Kernel Density Comparing Severity Ranking and Physician
The different physicians (1,2,3,4,5,9,10) are compared based upon the severity ranking using kernel density. Physician 1 has a very high probability of prescribing in the least severe category compared to physician 5, who has a significant proportion of patients in the most severe category. The graph for Physician 1 is very smooth at first and then develops ìbumpsî. This indicates the tendency on behalf of the Physician in prescribing medications for the least severe category. The graph for Physician 5 has a great curve at first and the smoothes out at the end. This shows that the Physician does not prescribe the medications for the least severe conditions but rather most of his patients are in the severe cluster. This difference is also clearly visualized In Figure 2.
Figure 2
In the above histogram we observe that Physician 1 has more patients than any of the other Physicians and his patients vary with all sorts of heart conditions since he supervises patients from all six clusters. Physician 5 has patients that are taking medications that are used for heart conditions only in three clusters. For Physician 1 almost half of his patients are in the least severe categories.
00.05
0.10.15
0.20.25
0.30.35
0.4
0 1 2 3 4 5 6
Severity Ranking
Prob
abili
ty
1 2 3 4 5 9 10
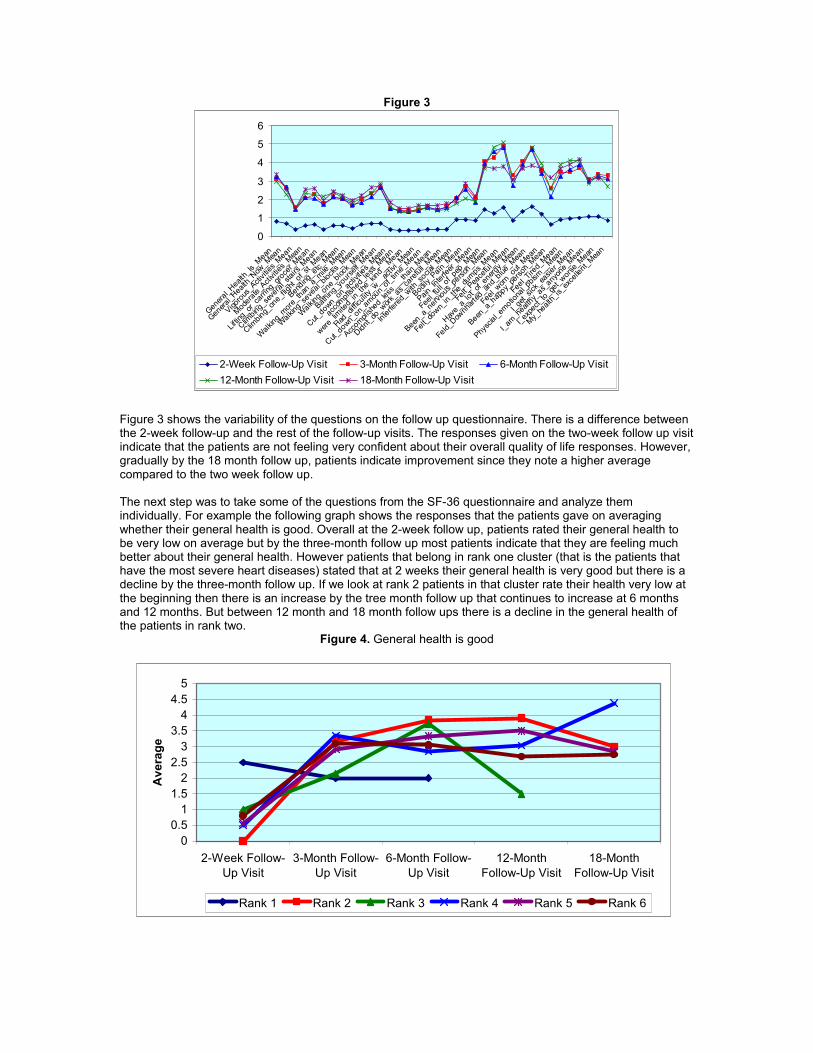
Figure 3
Figure 3 Figure 3 shows the variability of the questions on the follow up questionnaire. There is a difference between the 2-week follow-up and the rest of the follow-up visits. The responses given on the two-week follow up visit indicate that the patients are not feeling very confident about their overall quality of life responses. However, gradually by the 18 month follow up, patients indicate improvement since they note a higher average compared to the two week follow up. The next step was to take some of the questions from the SF-36 questionnaire and analyze them individually. For example the following graph shows the responses that the patients gave on averaging whether their general health is good. Overall at the 2-week follow up, patients rated their general health to be very low on average but by the three-month follow up most patients indicate that they are feeling much better about their general health. However patients that belong in rank one cluster (that is the patients that have the most severe heart diseases) stated that at 2 weeks their general health is very good but there is a decline by the three-month follow up. If we look at rank 2 patients in that cluster rate their health very low at the beginning then there is an increase by the tree month follow up that continues to increase at 6 months and 12 months. But between 12 month and 18 month follow ups there is a decline in the general health of the patients in rank two.
Figure 4. General health is good
0
1
2
3
4
5
6
Genera
l_Hea
lth_Is_
Mean
Genera
l_Healt
h_Now
_Mea
n
Vigorou
s_Acti
vities
_Mea
n
Modera
te_Acti
vities
_Mea
n
Liftin
g_or_
carrin
g_gro
cer_M
ean
Climbing_
seve
ral_s
tairs_
Mean
Climbin
g_on
e_flig
ht_of_st_
Mean
Bending
_etc_
Mean
Walking
_more
_than
_a_m
ile_M
ean
Walking
_sev
eal_blo
cks_
Mean
Walking_
one_b
lock_
Mean
Bathing
_you
rself_
Mean
Cut_do
wn_on
_activ
ities_
Mean
acco
mplish
ed_le
ss_M
ean
were_li
mited_
in_the_k
ind__
Mean
Had_d
ifficu
lity_w__
activ
i_Mea
n
Cut_do
wn_on_
amoun_
of_time_
Mean
Accompli
shed_
less_
__tha
n_Mean
Didnt_do
_work_a
s_ca
refull
_Mea
n
Interfered
_with
_soc
ial_M
ean
Bodily_
Pain_Mean
Pain_In
terfee
r_Mea
n
Feel_f
ull_o
f_pep
_Mean
Been_a_
nerviou
s_pe
rson_
Mean
Felt_do
wn_in_
the_d
umps
_Mean
Felt_
Peace
ful_M
ean
Have_
a_lot
_of_e
nergy_
Mean
Feld_
Downh
arted
_and_
blue_M
ean
Feel_
worn_ou
t_Mean
Been_a_
happy_
perso
n_Mea
n
Feel_Tir
ed_Mean
Physc
ial_emotio
nal_p
blsm__
Mean
I_get_s
ick_ea
sier_M
ean
I_am_h
ealth
y_as_
anyon
e_Mea
n
I_expe
ct_to_
get_wors
e_Mea
n
My_he
alth_
is_ex
celle
nt_Mea
n
2-Week Follow-Up Visit 3-Month Follow-Up Visit 6-Month Follow-Up Visit12-Month Follow-Up Visit 18-Month Follow-Up Visit
00.5
11.5
22.5
33.5
44.5
5
2-Week Follow-Up Visit
3-Month Follow-Up Visit
6-Month Follow-Up Visit
12-MonthFollow-Up Visit
18-MonthFollow-Up Visit
Ave
rage
Rank 1 Rank 2 Rank 3 Rank 4 Rank 5 Rank 6
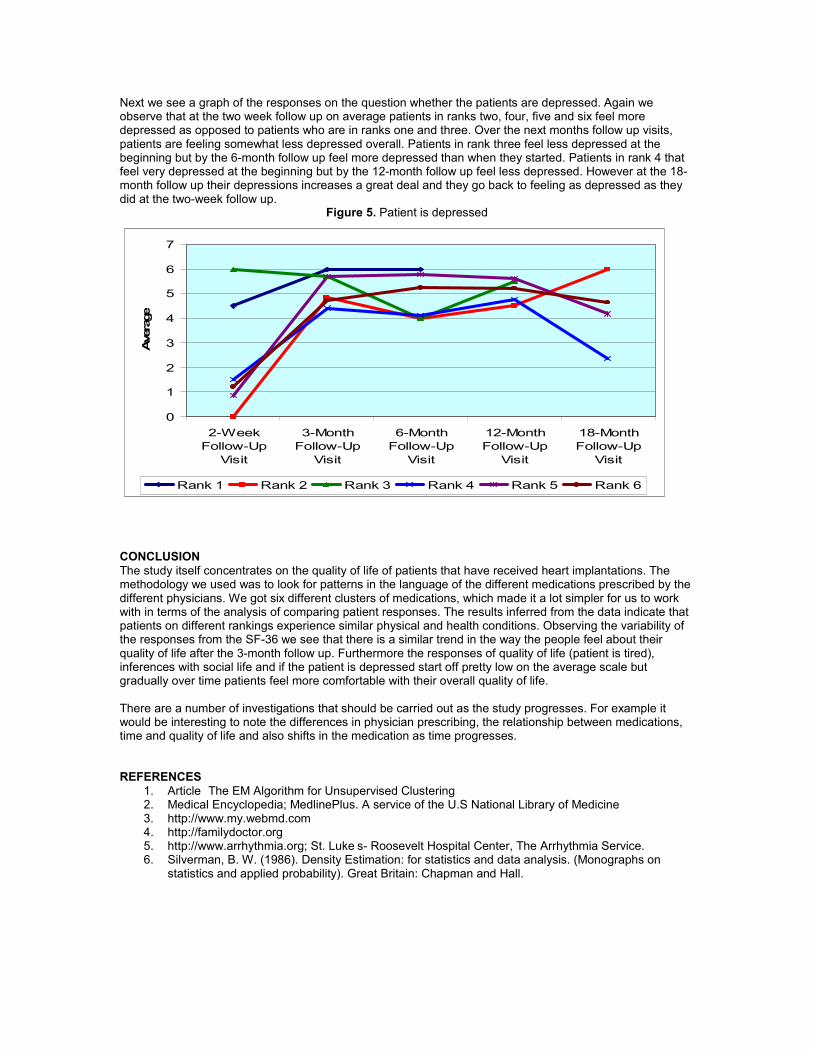
Next we see a graph of the responses on the question whether the patients are depressed. Again we observe that at the two week follow up on average patients in ranks two, four, five and six feel more depressed as opposed to patients who are in ranks one and three. Over the next months follow up visits, patients are feeling somewhat less depressed overall. Patients in rank three feel less depressed at the beginning but by the 6-month follow up feel more depressed than when they started. Patients in rank 4 that feel very depressed at the beginning but by the 12-month follow up feel less depressed. However at the 18-month follow up their depressions increases a great deal and they go back to feeling as depressed as they did at the two-week follow up.
Figure 5. Patient is depressed CONCLUSION The study itself concentrates on the quality of life of patients that have received heart implantations. The methodology we used was to look for patterns in the language of the different medications prescribed by the different physicians. We got six different clusters of medications, which made it a lot simpler for us to work with in terms of the analysis of comparing patient responses. The results inferred from the data indicate that patients on different rankings experience similar physical and health conditions. Observing the variability of the responses from the SF-36 we see that there is a similar trend in the way the people feel about their quality of life after the 3-month follow up. Furthermore the responses of quality of life (patient is tired), inferences with social life and if the patient is depressed start off pretty low on the average scale but gradually over time patients feel more comfortable with their overall quality of life. There are a number of investigations that should be carried out as the study progresses. For example it would be interesting to note the differences in physician prescribing, the relationship between medications, time and quality of life and also shifts in the medication as time progresses. REFERENCES
1. Article ìThe EM Algorithm for Unsupervised Clusteringî 2. Medical Encyclopedia; MedlinePlus. A service of the U.S National Library of Medicine 3. http://www.my.webmd.com 4. http://familydoctor.org 5. http://www.arrhythmia.org; St. Lukeís- Roosevelt Hospital Center, The Arrhythmia Service. 6. Silverman, B. W. (1986). Density Estimation: for statistics and data analysis. (Monographs on
statistics and applied probability). Great Britain: Chapman and Hall.
0
1
2
3
4
5
6
7
2-WeekFollow-Up
Visit
3-MonthFollow-Up
Visit
6-MonthFollow-Up
Visit
12-MonthFollow-Up
Visit
18-MonthFollow-Up
Visit
Ave
rage
Rank 1 Rank 2 Rank 3 Rank 4 Rank 5 Rank 6

ACKNOWLEDGMENTS Thank you to Dr. Patricia Cerrito for her help in constructing this paper. CONTACT INFORMATION Author Name: David Nfodjo & Christiana Petrou Company: University of Louisville Address: Mathematics Department; Belknap Campus City-state ZIP: Louisville, KY Work Phone: 502-852-6240 Email: [email protected], [email protected]