Embed Size (px)
Citation preview
i
ESTIMATING GFR IN ONCOLOGY PATIENTS RECEIVING CISPLATIN CHEMOTHERAPY :
PREDICTED CREATININE CLEARANCE AGAINST Tc-99m DTPA METHODS
by
DR SHARIFAH KHAIDAH BINTI SYED SAHAB
MBBS (IIUM)
Dissertation Submitted In Partial Fulfilment For The
Degree Of Master Of Medicine
(NUCLEAR MEDICINE)
ADVANCED MEDICAL AND DENTAL INSTITUTE UNIVERSITI SAINS MALAYSIA 2016
ii
ACKNOWLEDGEMENT
In the name of Allah, the Most Gracious and the Most Merciful. Alhamdulillah, all praises to
Allah for the strengths and His blessing in completing this thesis.
Special appreciation goes to my supervisors, Dr. Fadzilah binti Hamzah and Dr. Mahayuddin
Manap for the constructive comments, inspiring guidances, understanding and invaluable
advices throughout the experimental and thesis works that have contributed to the success of
this study/research.
I realise that I would not have finished this study without the support and encouragement of
so many people both as individuals or members of the Department of Nuclear Medicine,
Penang Hospital. Special acknowledgement goes to Mr Muhammad Ludfi, a person full of
dedication who has always given me a helping hand while conducting this research. The co-
operations, assistance and suggestions received from all my colleagues (namely Dr Farzaana
Adam) and staffs are beyond evaluation. Not forgetting Dr. Tan Boon Seang, Head of
Department of Oncology and all his staffs for the cooperation and support given while
conducting this study.
My acknowledgement also goes to dedicated lecturers and staffs from Advanced Medical and
Dental Institute, Bertam for the constant support and encouragement throughout the study.
Final but not least for the love and care, I take this opportunity to express the profound
gratitude to my beloved husband, sons and extended family for the endless love, patient
companionship, prayers and sacrifices throughout the study. I dedicate this thesis to these
people whom I love very much.
iii
TABLE OF CONTENTS
TITLE i
ACKNOWLEDGEMENT ii
TABLE OF CONTENTS iii
LIST OF TABLES vii
LIST OF FIGURES viii
ABBREVIATIONS & UNITS x
ABSTRAK xi
ABSTRACT xiii
1. INTRODUCTION 1
2. LITERATURE REVIEW 5
2.1 BRIEF ANATOMY OF THE KIDNEY 6
2.2 OVERVIEW OF RENAL PHYSIOLOGY 8
2.2.1 Glomerular filtration 9
2.2.2 Tubular reabsorption and secretion 10
2.3 EVALUATION OF KIDNEY FUNCTION 10
2.3.1 Glomerular filtration rate (GFR) 10
2.3.2 Effective renal plasma flow (ERPF) 13
2.3.3 Exogenous GFR markers 14
2.3.3.1 Clearance Characterization
2.3.3.1.1 GFR Introduction 19
2.3.3.1.2 One-Compartment Characterization 19
2.3.3.1.3 Early-Compartment Correction 20
2.3.4 Endogenous GFR markers 20
iv
2.4 CISPLATIN INDUCED NEPHROTOXICITY 23
3. OBJECTIVES 26
3.1 GENERAL OBJECTIVE 27
3.2 SPECIFIC OBJECTIVES 27
4. MATERIALS AND METHODS 28
4.1 STUDY DESIGN 29
4.2 POPULATION, TIME AND PLACE 29
4.3 ETHICAL BOARD 30
4.4 SAMPLING PROCEDURE 30
4.5 SELECTION CRITERIA 31
4.5.1 Inclusion criteria 31
4.5.2 Exclusion criteria 31
4.6 MINIMIZING SAMPLING ERROR 31
4.7 PROCEDURE 33
4.8 STATISTICAL METHOD 42
5. RESULTS 43
5.1 DEMOGRAPHIC DATA 44
5.2 CLINICAL CHARACTERISTICS OF RESPONDENTS 44
5.3 GFR VALUES PRE AND POST CHEMOTHERAPY BASED ON
DIFFERENT METHODS 45
5.4 GFR VALUES AMONG CASES DEVELOPING SEVERE
NEPHROTOXICITY (<50ml/min/1.73m2) BOTH PRE AND
POST CHEMOTHERAPY BASED ON DIFFERENT METHODS 47
5.5 MEAN FALL IN GFR PRE AND POST CISPLATIN
CHEMOTHERAPY BY ALL METHODS 48
v
5.6 MEAN FALL IN GFR AMONG CASES DEVELOPING SEVERE
NEPHROTOXICITY (<50ml/min/1.73m2) PRE AND POST
CISPLATIN CHEMOTHERAPY BY ALL METHODS 50
5.7 SCATTER PLOT 52
5.7.1 Bland-Altman PSC 2 - CG 52
5.7.2 Bland-Altman PSC 2 - MDRD 53
5.7.3 Bland-Altman PSC 2 – CKD-EPI 54
5.7.4 Bland-Altman PSC 2 - Gates 55
5.7.5 Bland-Altman PSC 2 – PSC 1 56
5.8 ASSESSMENT OF RELIABILITY OF THE METHODS BY ICC 57
5.9 DETECTION OF NEPHROTOXICITY POST CISPLATIN
CHEMOTHERAPY BY ALL METHODS 58
5.10 MEAN DIFFERENCE IN GFR BETWEEN PSC 2 AND OTHER
METHODS 59
6. DISCUSSION 61
7. CONCLUSION 71
8. LIMITATION AND RECOMMENDATION 73
9. REFERENCES 76
10. APPENDICES 81
Appendix A: Data Collection Form 82
Appendix B: Raw Data for GFR Values 87
Appendix C: Maklumat Kajian untuk Pesakit 95
Appendix D: Research Information for Patient 106

vi
Appendix E: Letter of Approval 117
vii
LIST OF TABLES
Table 1.0 Demographic statistics of respondents 44
Table 2.0 Clinical characteristics of respondents 44
Table 3.0 Pre and post GFR according to different methods 45
Table 4.0 Pre and post GFR among cases developing severe nephrotoxicty
according to different methods 47
Table 5.0 Mean difference of GFR according to different
method pre and post cisplatin therapy 48
Table 6.0 Mean difference of GFR among cases developing severe
nephrotoxicity according to different method pre and post cisplatin
therapy 50
Table 7.0 Intraclass Correlation Coefficients 57
Table 8.0 Detection of severe nephrotoxicity 58
Table 9.0 Average difference in GFR between PSC 2 and other methods 59
viii
LIST OF FIGURES
1.0 Front view of urinary tract 6
2.0 Anatomy of the kidney 6
3.0 Cross-sectional view of renal cortex and medulla 7
4.0 Anatomy of the nephron 7
5.0 Anatomy of the glomerulus 9
6.0 BSA and ECV equations 12
7.0 Dubois and Haycock’s equations 13
8.0 Two and three compartment model 19
9.0 General measures for prevention and treatment of cisplatin
induced AKI 24
10.0 Renal dynamic flow images 37
11.0 Renal dynamic extraction and excretion images 38
12.0 Renal static pre void and post void images 38
13.0 Renal scan data processing and renogram 39
14.0 Single plasma sampling 99mTc-DTPA 40
15.0 Dual plasma sampling 99mTc-DTPA 41
16.0 Difference in GFR value pre and post normalization to BSA 46
17.0 Difference in GFR value according to different methods
pre and post chemotherapy 49
18.0 Bland-Altman plot (PSC 2 vs. CG) 52
ix
19.0 Bland-Altman plot (PSC 2 vs. MDRD) 53
20.0 Bland-Altman plot (PSC 2 vs. CKD-EPI) 54
21.0 Bland-Altman plot (PSC 2 vs. Gates) 55
22.0 Bland-Altman plot (PSC 2 vs. PSC 1) 56
23.0 Average difference in GFR between PSC 2 and other methods 59
x
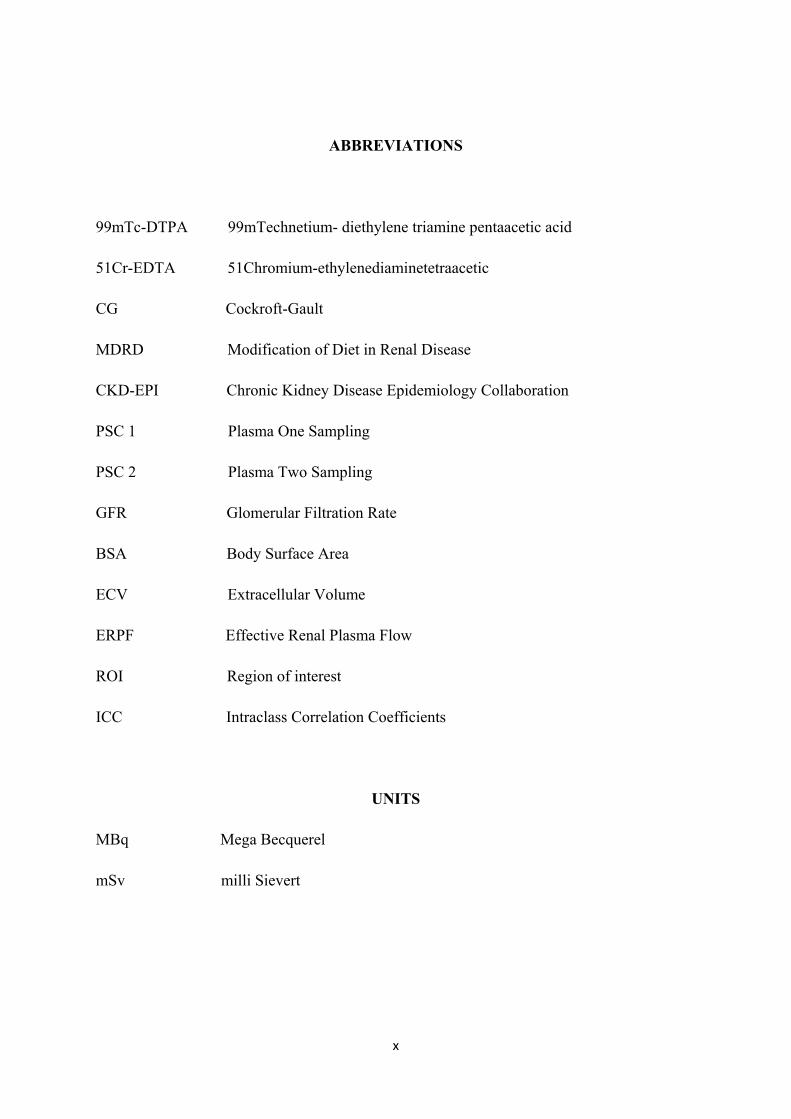
ABBREVIATIONS
99mTc-DTPA 99mTechnetium- diethylene triamine pentaacetic acid
51Cr-EDTA 51Chromium-ethylenediaminetetraacetic
CG Cockroft-Gault
MDRD Modification of Diet in Renal Disease
CKD-EPI Chronic Kidney Disease Epidemiology Collaboration
PSC 1 Plasma One Sampling
PSC 2 Plasma Two Sampling
GFR Glomerular Filtration Rate
BSA Body Surface Area
ECV Extracellular Volume
ERPF Effective Renal Plasma Flow
ROI Region of interest
ICC Intraclass Correlation Coefficients
UNITS
MBq Mega Becquerel
mSv milli Sievert
xi
ABSTRAK
Tajuk:
Mengukur kadar penapisan glomerulus di kalangan pesakit onkologi yang menerima
kemoterapi Cisplatin : Perbandingan antara kaedah pengiraan kreatinin dengan kaedah
99mTc-DTPA.
Objektif:
Menganalisa insiden kerosakan ginjal berikutan rawatan kemoterapi Cisplatin di kalangan
pesakit onkologi melalui kaedah pengiraan kadar penapisan glomerulus sebelum dan selepas
kemoterapi menggunakan persampelan plasma 99mTc-DTPA sebagai rujukan dan
dibandingkan dengan kaedah pengiraan kreatinin dengan kaedah 99mTc-DTPA.
Metodologi:
Satu kajian prospektif yang melibatkan 33 pesakit yang telah dirujuk ke Jabatan Perubatan
Nuklear, Hospital Pulau Pinang untuk skan 99mTechnetium-diethylenetriamine pentaasetic
asid antara 1 February 2014 and 30 April 2015. Kajian ini telah dijalankan bagi menganalisa
insiden kerosakan ginjal berikutan rawatan kemoterapi Cisplatin di kalangan pesakit
onkologi melalui kaedah pengiraan kadar penapisan glomerulus sebelum dan selepas
kemoterapi menggunakan persampelan plasma 99mTc-DTPA sebagai rujukan dan
dibandingkan dengan kaedah pengiraan kreatinin dengan kaedah 99mTc-DTPA. Daripada 33
pesakit yang dirujuk, hanya 21 orang sahaja yang layak dimasukkan ke dalam kajian ini.
xii
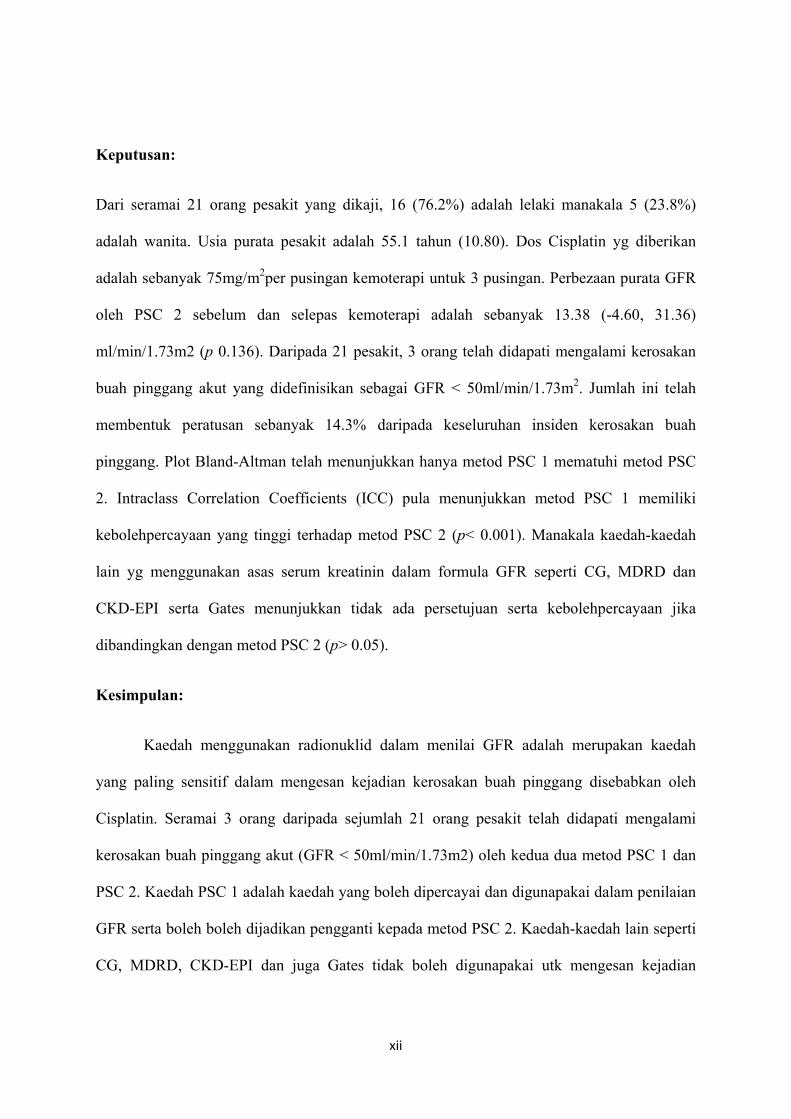
Keputusan:
Dari seramai 21 orang pesakit yang dikaji, 16 (76.2%) adalah lelaki manakala 5 (23.8%)
adalah wanita. Usia purata pesakit adalah 55.1 tahun (10.80). Dos Cisplatin yg diberikan
adalah sebanyak 75mg/m2per pusingan kemoterapi untuk 3 pusingan. Perbezaan purata GFR
oleh PSC 2 sebelum dan selepas kemoterapi adalah sebanyak 13.38 (-4.60, 31.36)
ml/min/1.73m2 (p 0.136). Daripada 21 pesakit, 3 orang telah didapati mengalami kerosakan
buah pinggang akut yang didefinisikan sebagai GFR < 50ml/min/1.73m2. Jumlah ini telah
membentuk peratusan sebanyak 14.3% daripada keseluruhan insiden kerosakan buah
pinggang. Plot Bland-Altman telah menunjukkan hanya metod PSC 1 mematuhi metod PSC
2. Intraclass Correlation Coefficients (ICC) pula menunjukkan metod PSC 1 memiliki
kebolehpercayaan yang tinggi terhadap metod PSC 2 (p< 0.001). Manakala kaedah-kaedah
lain yg menggunakan asas serum kreatinin dalam formula GFR seperti CG, MDRD dan
CKD-EPI serta Gates menunjukkan tidak ada persetujuan serta kebolehpercayaan jika
dibandingkan dengan metod PSC 2 (p> 0.05).
Kesimpulan:
Kaedah menggunakan radionuklid dalam menilai GFR adalah merupakan kaedah
yang paling sensitif dalam mengesan kejadian kerosakan buah pinggang disebabkan oleh
Cisplatin. Seramai 3 orang daripada sejumlah 21 orang pesakit telah didapati mengalami
kerosakan buah pinggang akut (GFR < 50ml/min/1.73m2) oleh kedua dua metod PSC 1 dan
PSC 2. Kaedah PSC 1 adalah kaedah yang boleh dipercayai dan digunapakai dalam penilaian
GFR serta boleh boleh dijadikan pengganti kepada metod PSC 2. Kaedah-kaedah lain seperti
CG, MDRD, CKD-EPI dan juga Gates tidak boleh digunapakai utk mengesan kejadian
xiii
kerosakan buah pinggang berikutan rawatan Cisplatin. Kami mengesyorkan penggunaan PSC
1 utk penilaian GFR bagi pemantauan kes rawatan kemoterapi Cisplatin.
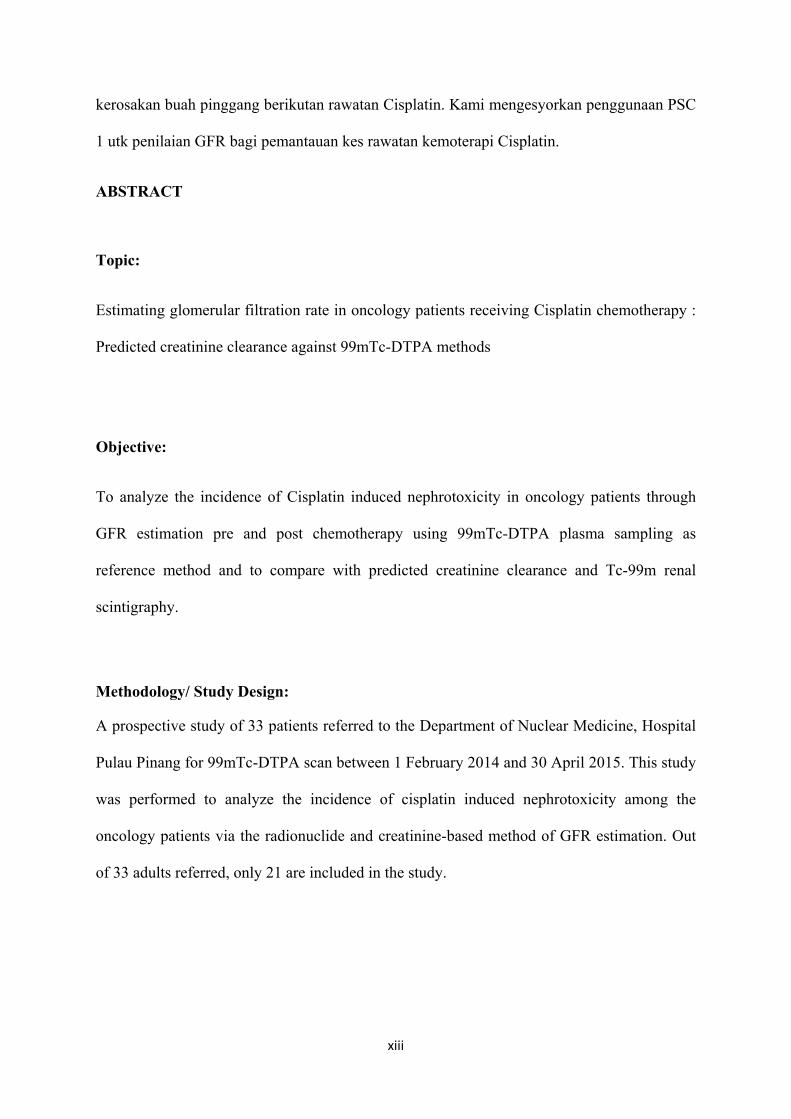
ABSTRACT
Topic:
Estimating glomerular filtration rate in oncology patients receiving Cisplatin chemotherapy :
Predicted creatinine clearance against 99mTc-DTPA methods
Objective:
To analyze the incidence of Cisplatin induced nephrotoxicity in oncology patients through
GFR estimation pre and post chemotherapy using 99mTc-DTPA plasma sampling as
reference method and to compare with predicted creatinine clearance and Tc-99m renal
scintigraphy.
Methodology/ Study Design:
A prospective study of 33 patients referred to the Department of Nuclear Medicine, Hospital
Pulau Pinang for 99mTc-DTPA scan between 1 February 2014 and 30 April 2015. This study
was performed to analyze the incidence of cisplatin induced nephrotoxicity among the
oncology patients via the radionuclide and creatinine-based method of GFR estimation. Out
of 33 adults referred, only 21 are included in the study.
xiv
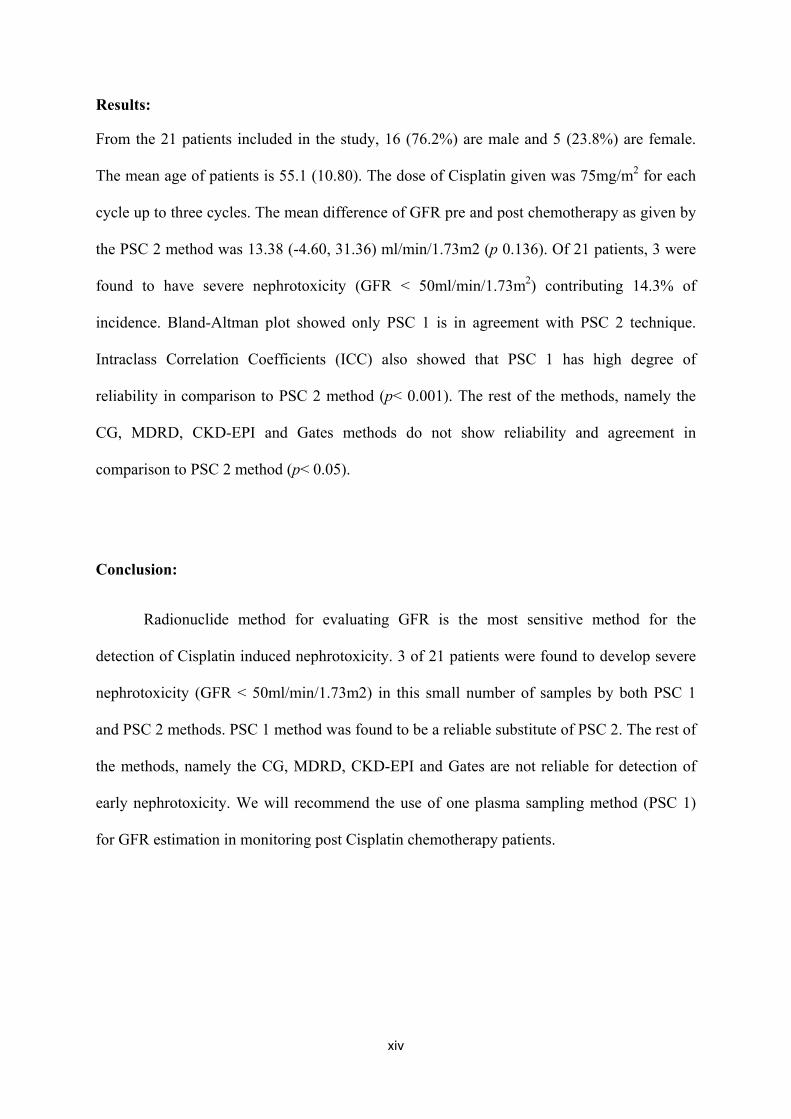
Results:
From the 21 patients included in the study, 16 (76.2%) are male and 5 (23.8%) are female.
The mean age of patients is 55.1 (10.80). The dose of Cisplatin given was 75mg/m2 for each
cycle up to three cycles. The mean difference of GFR pre and post chemotherapy as given by
the PSC 2 method was 13.38 (-4.60, 31.36) ml/min/1.73m2 (p 0.136). Of 21 patients, 3 were
found to have severe nephrotoxicity (GFR < 50ml/min/1.73m2) contributing 14.3% of
incidence. Bland-Altman plot showed only PSC 1 is in agreement with PSC 2 technique.
Intraclass Correlation Coefficients (ICC) also showed that PSC 1 has high degree of
reliability in comparison to PSC 2 method (p< 0.001). The rest of the methods, namely the
CG, MDRD, CKD-EPI and Gates methods do not show reliability and agreement in
comparison to PSC 2 method (p< 0.05).
Conclusion:
Radionuclide method for evaluating GFR is the most sensitive method for the
detection of Cisplatin induced nephrotoxicity. 3 of 21 patients were found to develop severe
nephrotoxicity (GFR < 50ml/min/1.73m2) in this small number of samples by both PSC 1
and PSC 2 methods. PSC 1 method was found to be a reliable substitute of PSC 2. The rest of
the methods, namely the CG, MDRD, CKD-EPI and Gates are not reliable for detection of
early nephrotoxicity. We will recommend the use of one plasma sampling method (PSC 1)
for GFR estimation in monitoring post Cisplatin chemotherapy patients.

xv

1
1.INTRODUCTION
2
The recent data published in 2011 which was based on GLOBOCAN 2008 indicates
that the numbers of cancer cases are on the rise worldwide. Among the risk factors identified
are aging and unhealthy life style. The data shows 12.7 million of cancer cases with 7.6
million of deaths estimated to have occurred in 2008 (Ferlay et al., 2010, Jemal et al., 2011).
Those are identified as solid tumours and the use of Cisplatin chemotherapy as neo-adjuvant
treatment has been shown to have a higher cancer response by 2 to 3 fold compared to after
radio-surgery (Stathopoulos, 2013).
Cisplatin remains as one of the best anticancer agent for the treatment of solid tumour
over the last 30 years (Stathopoulos, 2013). Cisplatin in its full name is known as
dichlorodiamino platinum and had been used for the treatment of various malignancies
involving the head and neck, lung, breast, liver, testis, ovarian and bladder (Kodama et al.,
2014a). Despite its well-known desirable effect on cancer treatment per se, its full therapeutic
potential has been limited by its potential toxicity. Many articles reported that the incidence
of nephrotoxicity following high dose cisplatin chemotherapy happens in the range of 20 to
25% (Yao et al., 2007, Gonzalez et al., 2004). Since Cisplatin remains as a promising
therapeutic anticancer therapy up to date, on-going researches are being done to develop
concurrent renoprotective agent that can reduce the effect of nephrotoxicity. Numerous
efforts are being done to evaluate other chemotherapeutic agents and targeted therapies that
can be alternative to Cisplatin with more or less similar therapeutic effect but lesser toxicity
(Stathopoulos, 2013). Injury to the kidney could happen even after a single dose of 50 to
100mg/m2 of Cisplatin, however, most of the cases are reversible with conservative treatment
of volume expansion or saline diuresis with early detection while a small percentage of
patients will continue to have progressive decline in renal function. Worst case scenario has
been described in the literature whereby repetitive courses of Cisplatin at high doses may lead
3
to irreversible kidney damage if it fails to be detected and treated at early stage (Yao et al.,
2007).
To address this issue, current clinical practice requires close monitoring of the kidney
function pre and post chemotherapy to anticipate any significant decline of renal function.
Therefore, estimating the glomerular filtration rate (GFR) has been accepted at large as a
parameter to represent the functional status of the kidney (Itoh, 2001). There are various
techniques which has been proposed to estimate GFR using endogenous or exogenous
markers, but the most important aspect in choosing which method to use will have to take
into account the simplicity, cost and availability without compromising the accuracy of the
result. The development of various techniques has taken place from calculating the
endogenous to exogenous substances excreted by the kidneys over the years, and until today
it is still well accepted that measurement of the inulin clearance for assessment of GFR
remains as the gold standard. Nevertheless, this method has gained less popularity in view of
its complexity and invasive procedures to perform. Therefore, since the era of 1970s,
radionuclide techniques have been developed as an alternative to inulin for measurement of
GFR (Filler, 2008).
At present, the most frequent technique to assess bedside GFR is still by measuring
the serum creatinine. The result is incorporated into various formulas in order to generate
GFR. However, of note, the interpretation result of this method is susceptible to many
variations by multiple non renal factors, namely the muscle mass, age, race and not forgetting
the dietary intake (Millward et al., 1996). This holds true that in our centre, estimation of
GFR using serum creatinine and Cockroft-Gault (CG) formula is still the preferred choice
here in view of its simplicity to be performed bedside at an affordable cost.
4
The main aim for performing this study is to encourage early detection of
nephrotoxicity post Cisplatin chemotherapy among the selected oncology patients. This is
achieved via various methods for comparison namely the creatinine based method againts the
99mTc-DTPA method. Radionuclide method has been shown to be a potential alternative to
inulin (Biggi et al., 1995). With this, 99mTc-DTPA with two plasma sampling method (PSC
2) has been chosen as the standard of reference. In this study, we attempt to evaluate the
reliability of the creatinine based equations and 99mTc-DTPA single plasma sampling (PSC
1) in comparison to the PSC 2. We also attempt to justify the use of PSC 1 as an alternative to
PSC 2 in view of the less invasive technique with only single blood sampling without
compromising the accuracy of the GFR reading. This is in accordance with the recent study
conducted in 2010 which aim to find a simplified yet accurate way of determining GFR
among children in order to reduce the physical and psychological trauma to the patients
following repetitive blood sampling (Gutte et al., 2010). In order to evaluate possibility of
nephrotoxicity at earlier stage, this study will be conducted in 3 stages; pre chemotherapy to
get baseline GFR, post mid cycle chemotherapy (after 3 cycles of chemo) to measure how
much fall in GFR from baseline and at post completion of 6 cycles of chemotherapy to
further evaluate the trend in GFR reading. The ideal situation is to conduct this study before
and after every Cisplatin dose with the intention to get serial GFR reading. However, due to
limited resources and logistic problems, the justification of this study design is made based
on an article published in 2010 to perform the test to at least post third chemotherapy for
accurate detection of early kidney injury (Fatima N., 2010).

5
2.LITERATURE REVIEW
6
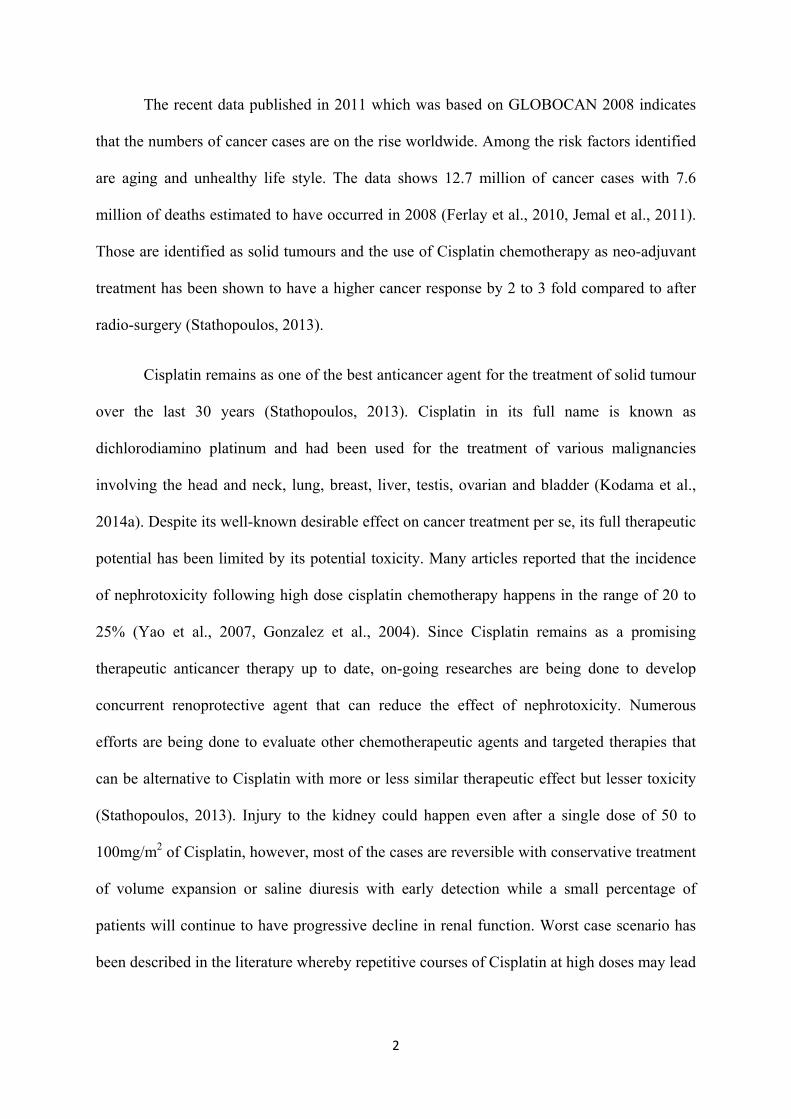
2.1 Brief anatomy of the kidney
Figure 1.0 Front view of urinary tract Figure 2.0 Anatomy of the kidney
(Adapted from www.slideshare.net on 1.8.2015) (Adapted from www.slideshare.net on 1.8.2015)
The kidneys are bean shaped organ located retroperitoneally that play important roles
in vertebrates. They maintain body homeostasis such as regulation of blood pressure,
electrolytes and acid-base balance as well as site for hormones production such as calcitriol,
erythropoietin and renin.
7
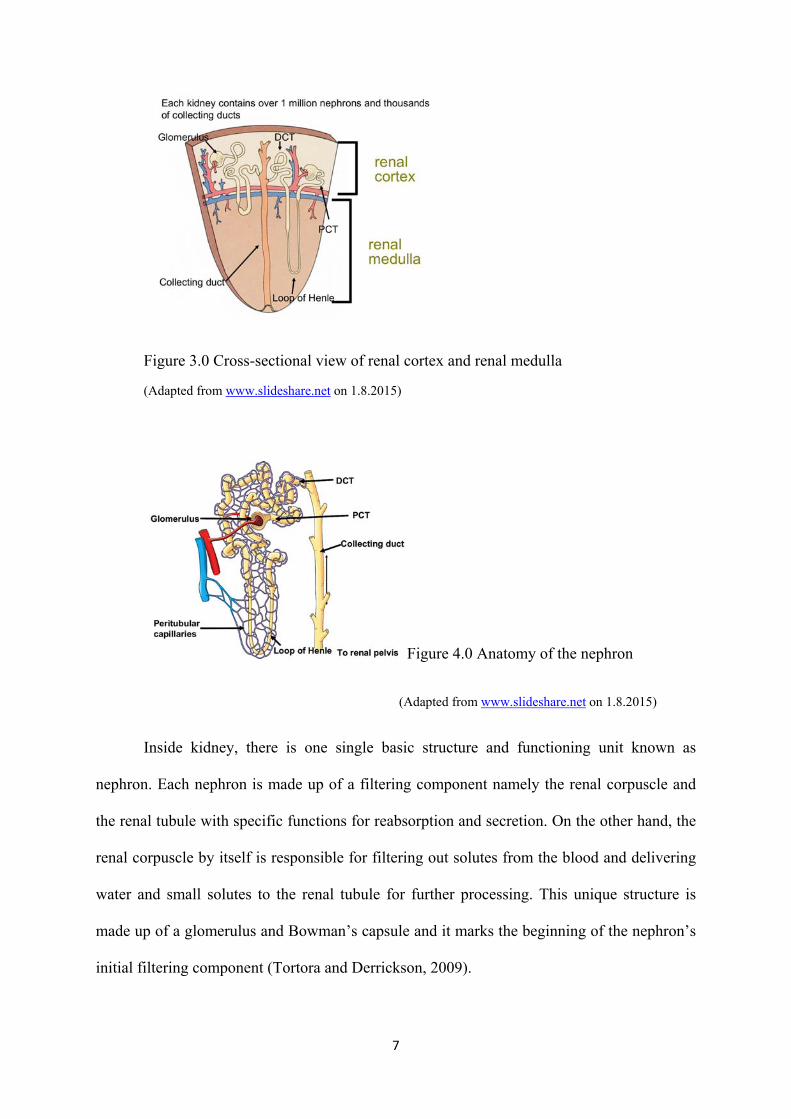
Figure 3.0 Cross-sectional view of renal cortex and renal medulla
(Adapted from www.slideshare.net on 1.8.2015)
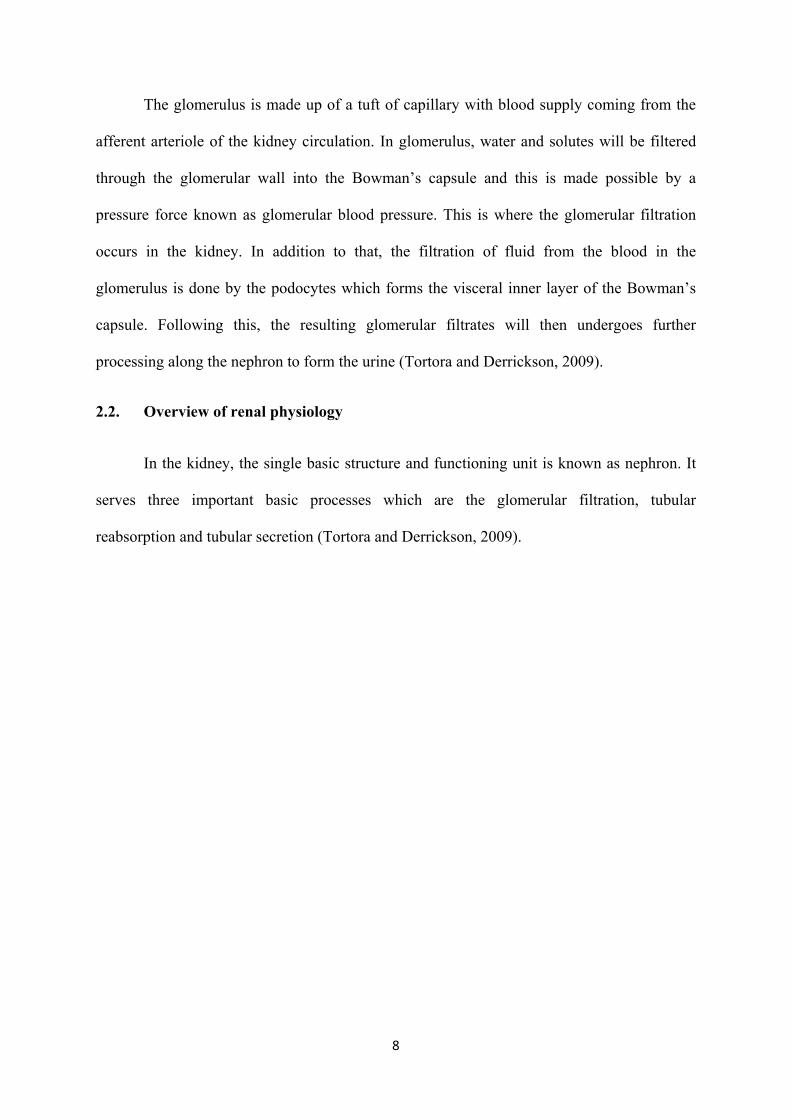
Figure 4.0 Anatomy of the nephron
(Adapted from www.slideshare.net on 1.8.2015)
Inside kidney, there is one single basic structure and functioning unit known as
nephron. Each nephron is made up of a filtering component namely the renal corpuscle and
the renal tubule with specific functions for reabsorption and secretion. On the other hand, the
renal corpuscle by itself is responsible for filtering out solutes from the blood and delivering
water and small solutes to the renal tubule for further processing. This unique structure is
made up of a glomerulus and Bowman’s capsule and it marks the beginning of the nephron’s
initial filtering component (Tortora and Derrickson, 2009).
8
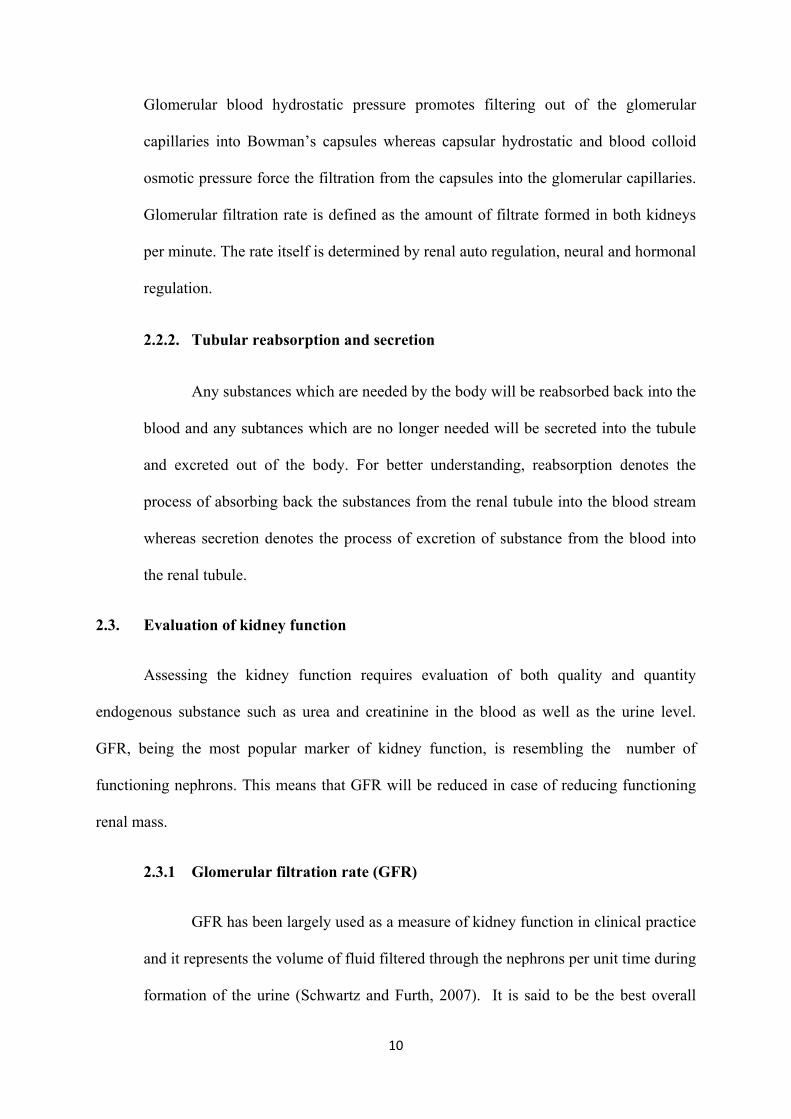
The glomerulus is made up of a tuft of capillary with blood supply coming from the
afferent arteriole of the kidney circulation. In glomerulus, water and solutes will be filtered
through the glomerular wall into the Bowman’s capsule and this is made possible by a
pressure force known as glomerular blood pressure. This is where the glomerular filtration
occurs in the kidney. In addition to that, the filtration of fluid from the blood in the
glomerulus is done by the podocytes which forms the visceral inner layer of the Bowman’s
capsule. Following this, the resulting glomerular filtrates will then undergoes further
processing along the nephron to form the urine (Tortora and Derrickson, 2009).
2.2. Overview of renal physiology
In the kidney, the single basic structure and functioning unit is known as nephron. It
serves three important basic processes which are the glomerular filtration, tubular
reabsorption and tubular secretion (Tortora and Derrickson, 2009).
9
2.2.1 Glomerular filtration
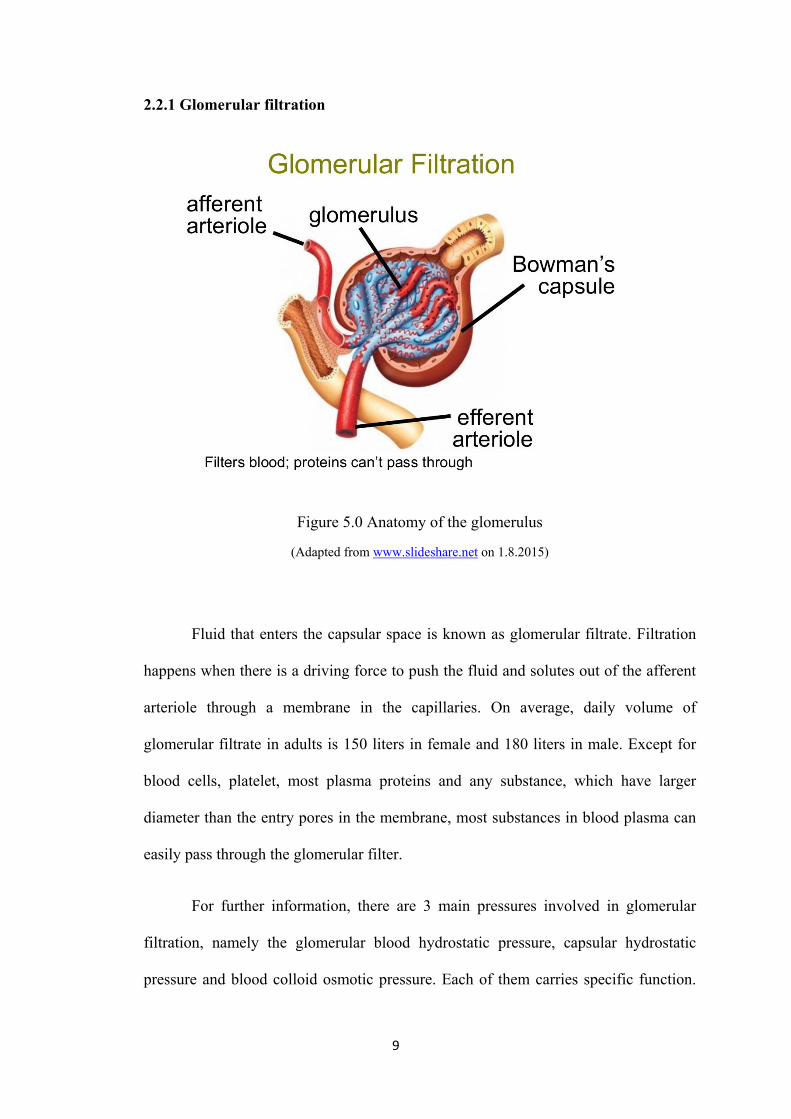
Figure 5.0 Anatomy of the glomerulus
(Adapted from www.slideshare.net on 1.8.2015)
Fluid that enters the capsular space is known as glomerular filtrate. Filtration
happens when there is a driving force to push the fluid and solutes out of the afferent
arteriole through a membrane in the capillaries. On average, daily volume of
glomerular filtrate in adults is 150 liters in female and 180 liters in male. Except for
blood cells, platelet, most plasma proteins and any substance, which have larger
diameter than the entry pores in the membrane, most substances in blood plasma can
easily pass through the glomerular filter.
For further information, there are 3 main pressures involved in glomerular
filtration, namely the glomerular blood hydrostatic pressure, capsular hydrostatic
pressure and blood colloid osmotic pressure. Each of them carries specific function.
10
Glomerular blood hydrostatic pressure promotes filtering out of the glomerular
capillaries into Bowman’s capsules whereas capsular hydrostatic and blood colloid
osmotic pressure force the filtration from the capsules into the glomerular capillaries.
Glomerular filtration rate is defined as the amount of filtrate formed in both kidneys
per minute. The rate itself is determined by renal auto regulation, neural and hormonal
regulation.
2.2.2. Tubular reabsorption and secretion
Any substances which are needed by the body will be reabsorbed back into the
blood and any subtances which are no longer needed will be secreted into the tubule
and excreted out of the body. For better understanding, reabsorption denotes the
process of absorbing back the substances from the renal tubule into the blood stream
whereas secretion denotes the process of excretion of substance from the blood into
the renal tubule.
2.3. Evaluation of kidney function
Assessing the kidney function requires evaluation of both quality and quantity
endogenous substance such as urea and creatinine in the blood as well as the urine level.
GFR, being the most popular marker of kidney function, is resembling the number of
functioning nephrons. This means that GFR will be reduced in case of reducing functioning
renal mass.
2.3.1 Glomerular filtration rate (GFR)
GFR has been largely used as a measure of kidney function in clinical practice
and it represents the volume of fluid filtered through the nephrons per unit time during
formation of the urine (Schwartz and Furth, 2007). It is said to be the best overall
11
measure of renal function in both healthy or diseased kidney (Smith, 1951). The
normal level of GFR varies according to age, sex and body size. In young adults, it
measures approximately 120 to 130ml/min/1.73m2 and this value reduces with age.
Some other author has published the reference range of GFR in adulthood to be
approximately 105ml/min/1.73m2 of BSA (Levey et al., 2003). Although declining
GFR value with age is considered part of normal aging process (Lindeman et al.,
1985), this factor has been found to be independent predictor of adverse sequelae, for
example death or cardiovascular diseases (Manjunath et al., 2003). Therefore, the
prevalence of chronic kidney disease by definition increases with age in view of the
adverse outcomes associated to it. There is estimated 17% of the elderly aged above
60 years old have GFR of less than 60ml/min/1.73m2 (Coresh et al., 2003). This is an
important point to be taken pertaining to the treatment option for chemotherapy and
associated GFR level since the risk of developing carcinoma is also increasing with
age. In children, GFR value slowly increases approaching the adult value over the
first 2 years of life (Murray et al., 2013).
In clinical practice, the measurement of GFR has may uses which include
evaluation and monitoring of kidney in chronic renal disease, during the course of
administration of nephrotoxic drugs, calculation of myelotoxic chemotherapy drug
doses that is excreted through the glomerular filtration, potential renal donor
evaluation, single kidney renal function evaluation, pre and post-operative follow up
as well as prediction or assessment for the need of dialysis (Murray et al., 2013).
There are many options available to measure GFR and many methods are
developed to meet this purpose using either endogenous or exogenous markers. The
main interest of this study is to show the use of radionuclide method as a reliable GFR
marker to detect evidence of nephrotoxicity following Cisplatin chemotherapy.
12
Radionuclide method has been shown to exhibit a comparable result and can be an
alternative to the cumbersome inulin measurement in daily practice (Fawdry and
Gruenewald, 1987, Rehling and Thamdrup, 1984).
GFR normalization is an important component to be performed in obtaining
the final measurement. It is done to eliminate the individual variation from patient to
patient pertaining to the different renal masses in order to establish the reference value
across the individuals with different demographic characteristics (Murray et al.,
2013). There are two ways of performing GFR normalization; one is via Body Surface
Area (BSA) method which is the most widely used method in clinical practice and the
other one is the Extracellular Fluid Volume (ECV) which is less popular compared to
the former method. Though BSA is the preferred method, there is an issue that comes
along with it in which the physiologic relevance has been questioned (Turner and
Reilly, 1995). In opposed to ECV method, it has been said to have a better
dimensional relationship (volume- based) to GFR (Brøchner-Mortensen, 1980) and
has gained more superiority against BSA method especially in children (Bird et al.,
2003).
The BSA and ECV normalizations equations are as follows:
Figure 6.0 BSA and ECV equations
(Adapted from Assessment of glomerular filtration rate measurement with plasma sampling:
A technical review, Journal of nuclear medicine technology 2013 41(2): 67-75))
13
where GFRBSA is in ml/min/1.73m2, GFRECV is in ml/min/12.9, BSA is in m2 and
ECV is in litres.
The two most commonly used BSA estimation methods are the Dubois formula for
adults (Du Bois and Du Bois, 1989) and the Haycock formula for both adult and
children (Haycock et al., 1978). Both formulas area given as follows:
For Dubois formula,
For Haycock formula,
Figure 7.0 Dubois and Haycock’s equations
(adapted from Assessment of glomerular filtration rate measurement with plasma sampling:
A technical review, Journal of nuclear medicine technology 2013 41(2): 67-75)
where BSA is in meters squared, height is in centimetres and weight is in kilograms.
2.3.2 Effective renal plasma flow (ERPF)
ERPF is another way of quantifying renal function other than GFR. ERPF is a
technique used to measure renal plasma flow thus estimating the renal function. It is
measured using plasma clearance technique. Paraaminohippurate (PAH) is the best
substance to measure ERPF with the extraction ratio nearly 1. Historically, I-131 OIH
and I-123 OIH have been used to quantify ERPF whereby the urinary clearance of I-
131 OIH is approximately 85% of PAH. However, at present 99mTc-MAG3 has been
used to replace hippuran. Nevertheless, its efficacy for ERPF measurement has been
14
documented at about 60% of hippuran since it does not undergo glomerular filtration
and slightly reduced level of tubular secretion. However, a lot of studies has been
conducted and prove that 99mTc-MAG3 is able to produce an accurate ERPF result
once corrected for the different extraction fraction (Ziessman et al., 2013).
2.3.3 Exogenous GFR markers
There are few exogenous substances which can be used for measurement of
GFR. Among them are the inulin and the radioactive tracers such as the 99m-Tc
DTPA and 51-Cr EDTA. Inulin, a group of naturally occurring polysaccharides
produced by many types of plants, has the properties of an ideal tracer. It is neither
secreted nor reabsorbed at the nephron allowing accurate GFR to be calculated. It is
the gold standard for measuring GFR but is rarely used clinically due to its technical
difficulty, expensive, time consuming, require multiple urine samples and is
problematic to be done in patients with urologic disease and in children. Though it
still remains as the gold standard method, it has lost its popularity due to its
cumbersome procedure and technically difficult to be performed (Murray et al.,
2013).
Radionuclide method using plasma sample clearance has been found to
produce accurate GFR measurement (Brøchner-Mortensen, 1978). However, Itoh et.
al concluded that this technique is laborious and therefore its use is reserved for
specific indication that strictly requires accurate quantification of renal function (Itoh,
2003). After all, we need to understand that the ideal characteristics of tracer
properties used in GFR measurement shall include:
15
i) It undergoes only glomerular filtration and thus has identical plasma and
urinary clearance.
ii) It has a low molecular weight and small molecular size to allow free filtering
through the glomerular membrane.
iii) It has no entry into the intracellular space.
iv) It has no interference with renal function.
v) It has no extrarenal excretion or clearance to other organs.
vi) It has no tubular secretion or absorption.
vii) It has no nephrotoxicity.
Theoretically, a tracer that follows any processes other than glomerular
filtration is not an ideal tracer and the resulting GFR is not equal to its plasma
clearance. Those processes include radionuclide dissociation, metabolic degradation,
plasma protein binding, tubular reabsorption and secretion. This phenomenon may
lead to inaccuracy in GFR reading resulting from unwanted retention or clearance of
the tracer. However, in real clinical practice, it is almost impossible to have an ideal
tracer exactly as discussed above. Nevertheless, we still have the option of using near
ideal properties to deal with the difficulty and impracticality of using an ideal tracer
(Murray et al., 2013).
Radionuclide based techniques allow for the rapid and reliable measurement
of GFR from plasma samples taken following IV bolus of radiotracer (Kuster, Cristol
et al. 2014). The tracer diffuses across the capillary endothelium and between
intravascular and extra vascular spaces and mixes throughout the extra vascular fluid
volume (ECV). GFR can be measured through the quantification of plasma and
standard-volume sample activity using a gamma counter. These techniques hold the
16
central assumption that the tracer is cleared solely by glomerular filtration (Murray et
al., 2013).
Two of the most frequently used tracers for GFR measurement with near ideal
properties are Cr-51 EDTA and Tc-99m DTPA. Cr-51 allows more time between the
drawing of blood and counting of the samples due to its relatively long half-life of
27.7 days. However, the disadvantage of using Cr-51 is that not only it is expensive, it
also has associated tubular reabsorption as well as issue in handling storage of Cr-51
waste. A reported practical advantage for Cr-51 EDTA studies is that any plasma
samples with an existing Tc-99m concentration can be left to decay until no Tc-99m
remains before processing. Whereas for Tc-99m DTPA, it has the advantage that it is
readily available and can be produced with a Mo-99/Tc-99m generator already in
house for diagnostic work thus reducing expenses. Its disadvantage is that processing
is required within 24 hours of taking plasma samples due to its shorter half life of 6
hours (Murray et al., 2013).
There is still a big challenge to get simple yet accurate method for GFR
determination. Another radionuclide technique using gamma camera uptake known as
Gates method where GFR is calculated without blood or urine sampling. This method
has been the most common in routine setting, although diagnostic accuracy of gamma
camera is debatable (Itoh, 2003). Due to that the same author has conducted a study to
assess the clinical validity of single-sample methods and gamma camera uptake
methods with Tc-99m DTPA for the estimation of GFR in patients with various
degree of renal dysfunction. The reference for the “true” GFR (GFRt) was determined
from plasma clearance by means of the two-compartment model curve fitting 10
plasma samples. The author found out that the single sample method in GFR
≥30ml/min was more accurate than the gamma camera method, and the gamma
17
camera method was accurate than 24hour creatinine clearance. Due to that he
concluded that the single sample method should be recommended for the accurate
determination of the GFR with Tc-99m DTPA in a patient with mild to moderate
renal dysfunction (Itoh et al., 2000). The same author again conducted another study
aiming towards the assessment of clinical accuracy of single, two and multi sample
methods. He proposed the use of single sample method at 180 min as the first choice
in a routine practice in view of its accuracy and technical simplicity. The two-sample
method at 120 min and 240 min is chosen selectively for a patient with severe renal
failure where serum creatinine at the time of the test may help for the choice of either
the single or the two-sample method (Itoh et al., 2000). This result is in agreement
with the study conducted by Christensen and Groth among cancer patients referred for
routine determination of Tc-99m DTPA clearance by comparing single and multiple
plasma sample methods. The authors have concluded that the single method is
accurate and that may prove useful as a routine method provided that the method is
not used in patients with Tc-99m DTPA clearance less than 30ml/min and the plasma
samples drawn between 180 to 300 min (Christensen and Groth, 1986).
In this study, the two plasma sampling method using Tc-99m DTPA has been
used as the standard for comparison among other methods which are creatinine-based
GFR. Its principle of GFR measurement is based on clearance of plasma radioactivity
via single and two-blood sample using the well counter where by the blood was taken
at 60 and 180 minutes post tracer injection and to compare with the clearance of
radioactivity from plasma sampling taken at 180 minutes alone. Comparing to the
study conducted by Waller and Keast, their measurement of GFR was taken from
plasma radioactivity using single and two blood samples, tissue clearance with probe
detectors, renal uptake and excretion using scintillation camera and combination of
18
single blood sample and external detector clearance rate. Those methods were
compared with multiple plasma sampling where blood was taken at 1 hour post
injection and again every 30 min for a period of 4 hour. Apart from comparing the
individual accuracy of each method as well as its suitability for routine clinical use in
the assessment of adult patients, the study was also done to assess how much data
reduction was possible without impairing the accuracy of the result. From the analysis
using 2 blood samples, the correlation with multiple-point plasma clearance was
excellent, and in fact improved results was obtained by using the later blood samples.
This was probably due to incomplete equilibration at earlier sampling times and this
can be reduced by increasing the time between the samples. The results for single
blood sample show inferior correlation compared with two blood samples taken at
around the same time. However, the correlation improves when the time of sampling
post injection is longer, reaching an optimum between 3 and 4 hour then deteriorating
significantly at 5 hour. Meanwhile, the author did not recommend the use of less
invasive external counter clearance rate without blood sampling since it does not
correlate well enough with GFR (Waller et al., 1987).
On average, most of the studies conducted supported the use of single plasma
sample of Tc-99m DTPA method for accurate measurement of GFR provided the
GFR measured is ≥30 ml/min. This means that in view of its technical simplicity, time
and cost saving, it is acceptable to implement this method in the clinical practice to
evaluate kidney function where GFR is ≥ 30ml/min.
19
2.3.3.1 Clearance characterization
2.3.3.1.1 GFR Introduction
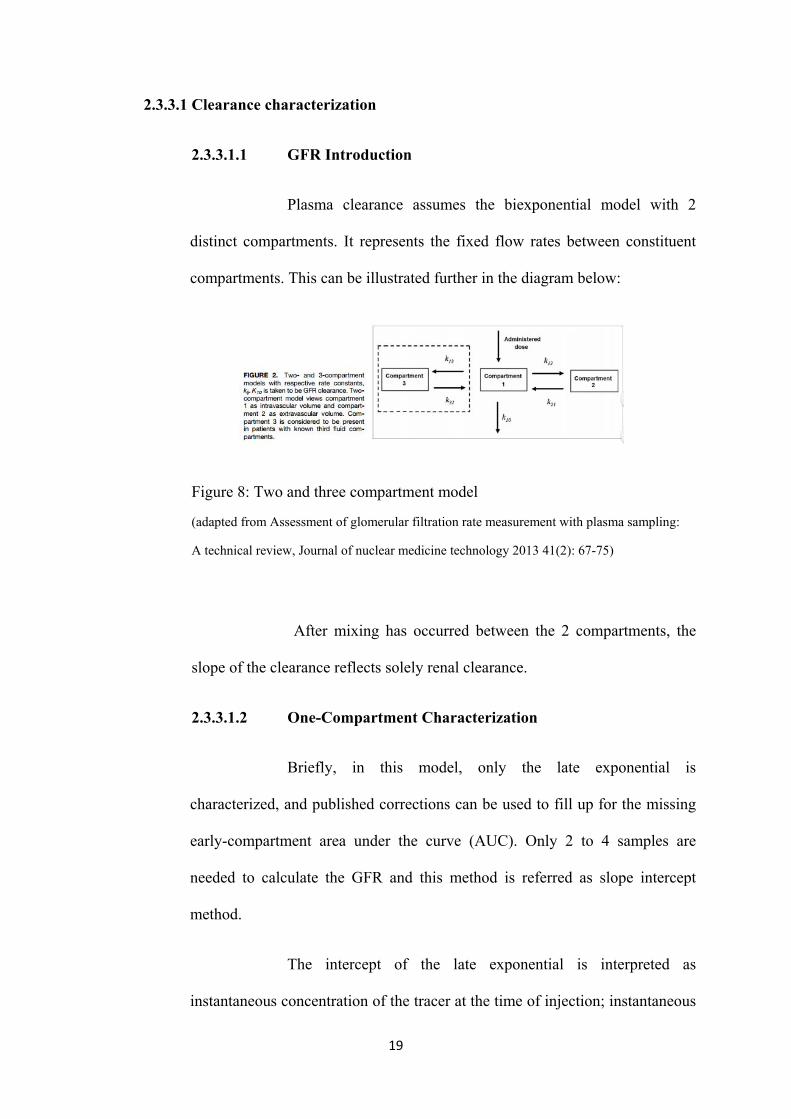
Plasma clearance assumes the biexponential model with 2
distinct compartments. It represents the fixed flow rates between constituent
compartments. This can be illustrated further in the diagram below:
Figure 8: Two and three compartment model
(adapted from Assessment of glomerular filtration rate measurement with plasma sampling:
A technical review, Journal of nuclear medicine technology 2013 41(2): 67-75)
After mixing has occurred between the 2 compartments, the
slope of the clearance reflects solely renal clearance.
2.3.3.1.2 One-Compartment Characterization
Briefly, in this model, only the late exponential is
characterized, and published corrections can be used to fill up for the missing
early-compartment area under the curve (AUC). Only 2 to 4 samples are
needed to calculate the GFR and this method is referred as slope intercept
method.
The intercept of the late exponential is interpreted as
instantaneous concentration of the tracer at the time of injection; instantaneous