Embed Size (px)
Citation preview

Quality Costs How Much? Es ma ng the Cost of Quality Child Care in New Jersey
APRIL 2017
35 Halsey Street, 2nd Floor, Newark, NJ 07102 • (973) 643‐3876 • Fax ( 973) 643‐9153 • [email protected]
www.acnj.org
Giving Every Child A Chance
A RESEARCH STUDY
Quality Costs How Much? Es ma ng the Cost of Quality Child Care in New Jersey
ACNJ Board of Trustees
Officers: Robert Sterling, Chair Gerard Thiers, Vice Chair Ma hew Loncar, Esq., Treasurer Louise Eagle, Secretary Members: Darrin Anderson, Sr., MS, Ph.D. John Boyne, L.C.S.W. Brenda Considine Cynthia Crenshaw Maurice Elias, Ph.D. F. Lee Forrester, J.S.C. Re red Laurence E. Fundler, Esq. Vito Gagliardi, Ed.D. Stuart Grant Gail Houlihan Nancy Lauter, Ed.D. Eileen Leahey Reginald Lewis Nicole McGrath, D.D.S. Margaret McLeod Jose Carlos Montes, M.Div. Jennifer J. Robinson, Ed.D. Kendell Spro , M.D., J.D. Sara D. Thom Richard Trenk, Esq. Charles Ven
ACNJ Staff
Cecilia Zalkind, President & CEO Mary Coogan, Vice President
Staff contribu ng to this report
Diane Dellanno, Policy Analyst Kristen Brady, Research Assistant Jaime Kaiser, Student Intern
Acknowledgements
Anne Mitchell, President of Early Childhood Policy Research
Research consultant for the project.
Special Thanks to the Nicholson Founda on for their funding and
support of this project.
Advocates for Children of New Jersey is the trusted,
independent voice pu ng children’s needs first for more
than 35 years. Our work results in be er laws and
policies, more effec ve funding and stronger services for
children and families. And it means that more children
are given the chance to grow up safe, healthy, and
educated.
A
Use #NJVotes4kids to join the discussion
on children’s issues in the 2017 state elec ons.
Find us on Facebook
Follow us on Twitter
View our videos
Connect with us!
35 eeNewark, NJ 07102
643‐3876 643‐9153

1 Giving Every Child a Chance
Introduc on
Quality child care for young children is essen al. During a
child’s first five years, the brain develops more than at
any other me of their lives; therefore, it is impera ve
that children spend those early days in a nurturing, s m‐
ula ng environment. Decades of research demonstrate
that children who experience high‐quality child care have
a be er chance of arriving at kindergarten with the foun‐
da on they need for school and life success.
However, while it has been established that quality early
learning experiences ma er, the quality of care in New
Jersey’s child care centers and family child care homes
varies greatly across the state. Annually more than
400,000 New Jersey children age 5 and under are in need
of some form of child care because both parents work;
therefore, it is cri cal to ensure access to high‐quality
child care op ons.
In 2013, as part of a statewide effort to improve and rate
the quality of care young children receive, New Jersey
launched a child care quality ra ng and improvement
system (QRIS) named Grow NJ Kids. This system is de‐
signed to provide resources for early learning programs
to help raise their quality and con nuously improve their
programs, as well as cri cal informa on to help parents
select a quality provider. Programs are rated on a 5‐star
scale with 1 star programs mee ng basic licensing stand‐
ards and 5 star programs demonstra ng higher quality
prac ces. Similar systems have been ini ated in 49 states
and the District of Columbia.
With funding from a 4‐year federal Race to the Top Early
Learning Challenge grant, New Jersey expects to enroll
approximately 1,800 early learning programs in Grow NJ
Kids, or about 22 percent of all sites serving infants and
young children by the me the grant ends in 2017. As
stated in the Race to the Top Early Learning Challenge
applica on, the state plans to con nue Grow NJ Kids
a er grant comple on with a goal of enrolling “all public‐
ly funded programs within eight years of roll out.” As of
December 2016, 944 child care centers and 167 family
child care homes were par cipa ng in the program.
But what would it cost to ensure all children are cared
for in high‐quality child care se ngs?
To answer this ques on, Advocates for Children of New
Jersey (ACNJ), in collabora on with na onal early child‐
hood financing expert Anne Mitchell and New Jersey
child care providers and stakeholders, conducted a cost‐
es ma on study to examine what it would cost to oper‐
ate a child care center or a family child care home at the
various levels of Grow NJ Kids. This innova ve approach
has been used by early care and educa on advocacy or‐
ganiza ons in several states, including Ohio, Rhode Is‐
land, Washington, Louisiana and Delaware, to help in‐
form child care policy and financing. The cost‐es ma on
method is also recommended in the reauthorized federal
Child Care and Development Block Grant Act of 2014 as a
valid and reliable means of es ma ng costs to provide
child care services and determining payment rates for
child care subsidies.
Data from the New Jersey Cost of Quality study will be
u lized to:
▪ Iden fy issues and challenges involved in crea ng a
high quality early care and educa on system;
▪ Determine if the current New Jersey child care
subsidy reimbursement rate is sufficient to support
the costs of opera ng a quality program; and
▪ Make recommenda ons regarding resources
necessary to support and sustain a quality ra ng and
improvement system.
Methodology
In order to understand and es mate the costs involved in
delivering child care services in a center or home, a varie‐
ty of state‐specific data was collected and analyzed.
Quality Costs How Much? Es ma ng the Cost of Quality Child Care in New Jersey
2 www.acnj.org
Borrowing from methods commonly u lized by public
school systems, the study relied on both “professional
judgment” and “successful school” approaches. Profes‐
sional judgment asks educators to review school stand‐
ards and then iden fy the resources needed to meet
those expecta ons and educate the students. The suc‐
cessful school method examines and analyzes the actual
costs of opera ng schools that are currently mee ng
standard expecta ons.
To obtain input from the field, a diverse group of early
care and educa on professionals from across the state,
including directors of community‐based centers and
owners of family child care homes, Abbo preschool pro‐
grams, Early Head Start/Head Start programs, quality im‐
provement specialists, child care resource and referral
personnel, subsidy specialists, and early childhood advo‐
cates were invited to a end a full‐day stakeholder
mee ng facilitated by Anne Mitchell of Early Childhood
Policy Research. Since the ra ng tool is different for cen‐
ters and homes, one mee ng was held specifically for
child care centers and another for family child care
homes.
At these mee ngs, par cipants met in small groups to
review the Grow NJ Kids ra ng tool and iden fy one‐ me
costs as well as ongoing or recurring expenses, called
cost‐drivers, at each level of Grow NJ Kids in all five cate‐
gories of the scale:
1. Safe, Healthy Learning Environments
2. Curriculum and Learning
3. Family and Community Engagement
4. Workforce/Professional Development
5. Administra on and Management.
Cost drivers in quality ra ng and improvement systems
(QRIS) tend to fall into the following three categories:
Qualifica ons: Nearly all QRIS have increasing per‐
sonnel qualifica ons by level.
Ra os: Reduced ra os for all, or for younger chil‐
dren, are in some QRIS; these are o en at the higher
levels. Reducing ra os reduces revenue and increas‐
es the cost per child since costs are spread among
fewer children.
Time: Most QRIS include some criteria that add staff
me beyond what state regula ons require, e.g.,
staff mee ngs, paid planning me, child assessment,
parent engagement, and transi on ac vi es.
To determine if an item on the GNJK ra ng tool was a
cost driver, the groups were asked to consider the fol‐
lowing ques ons:
▪ Does the GNJK item require more than licensing re‐
quirements?
▪ Is this an on‐going cost per year (per child, per class‐
room/home or per site)?
▪ If it takes staff /owner me, is it changing the use of
current me or adding me?
▪ Can it be incorporated into current prac ce (i.e. in‐
cluded in content of regular staff mee ng or a focus
of professional development)?
Following the mee ng, child care centers and family child
care homes were invited to complete a survey regarding
their annual expenses such as salaries, benefits, and non‐
personnel costs, as well as informa on on enrollment,
bad debt, revenues, and a endance. This data was then
compiled and analyzed to determine if there were any
significant differences among programs throughout New
Jersey.
A smaller advisory commi ee, composed of a endees from the ini al stakeholder mee ng, reviewed the ex‐pense and revenue data collected. The resul ng data was then used to create a base scenario for a child care center and for a family child care home that can be modi‐fied to reflect varia ons in size, popula on served, reve‐nue sources, and quality level according to the QRIS scale. The data from the base scenario was then entered into the Provider Cost of Quality Calculator (PCQC), a web‐based interac ve tool designed to help understand the cost of opera ng early care and educa on programs at
3 Giving Every Child a Chance
different levels of quality as defined by a state’s QRIS. The PCQC produces an annual revenue and expense statement for a center or home of a specified size, age mix, and quality level. All the typical expense and reve‐nue categories for an early learning/child care program are included in the calculator and can be customized to the characteris cs of any state or other jurisdic on. The PCQC models the essen al determinants of financial sus‐tainability: revenue sources sufficient to cover costs, full enrollment, and full revenue collec on. A key feature of the PCQC is inclusion of opera onal efficiency factors for enrollment and revenue collec on, which can be adjust‐ed. As with any es ma on tool, the accuracy of the output is dependent on credible and accurate data and is informed by the field survey results and focus group feedback from early care and educa on experts. It is important to note that the PCQC does not account for the ini al cost of a aining a par cular ra ng, but u lizes state‐specific data on expenses and revenues to develop a reasonable es mate of the cost of ongoing opera on at a given level. The calculator requires the user input data into nearly 200 fields that capture personnel and non‐personnel ex‐penses and revenue streams of a typical center/home. The calculator includes default values specific to New Jersey for a small por on of the fields, while a majority of the fields u lize the data collected from the study’s sam‐ple.
The New Jersey Cost of Quality Study: Child Care Center Budgets were collected from a total of 47 diverse early
care and educa on programs represen ng fi een of the
twenty‐one coun es: Bergen, Camden, Cape May, Cum‐
berland, Essex, Gloucester, Hudson, Hunterdon, Mercer,
Middlesex, Monmouth, Morris, Ocean, Passaic and Un‐
ion. For analysis purposes, programs were divided into
three regions: north, central and south. The north in‐
cluded Bergen, Essex, Passaic, Hudson, Morris, Sussex
and Warren coun es; Hunterdon, Somerset, Union, Mid‐
dlesex, Monmouth, and Mercer comprised the central
region; and the south included Ocean, Burlington, Atlan‐
c, Cape May, Cumberland, Salem, Gloucester and Cam‐
den coun es.
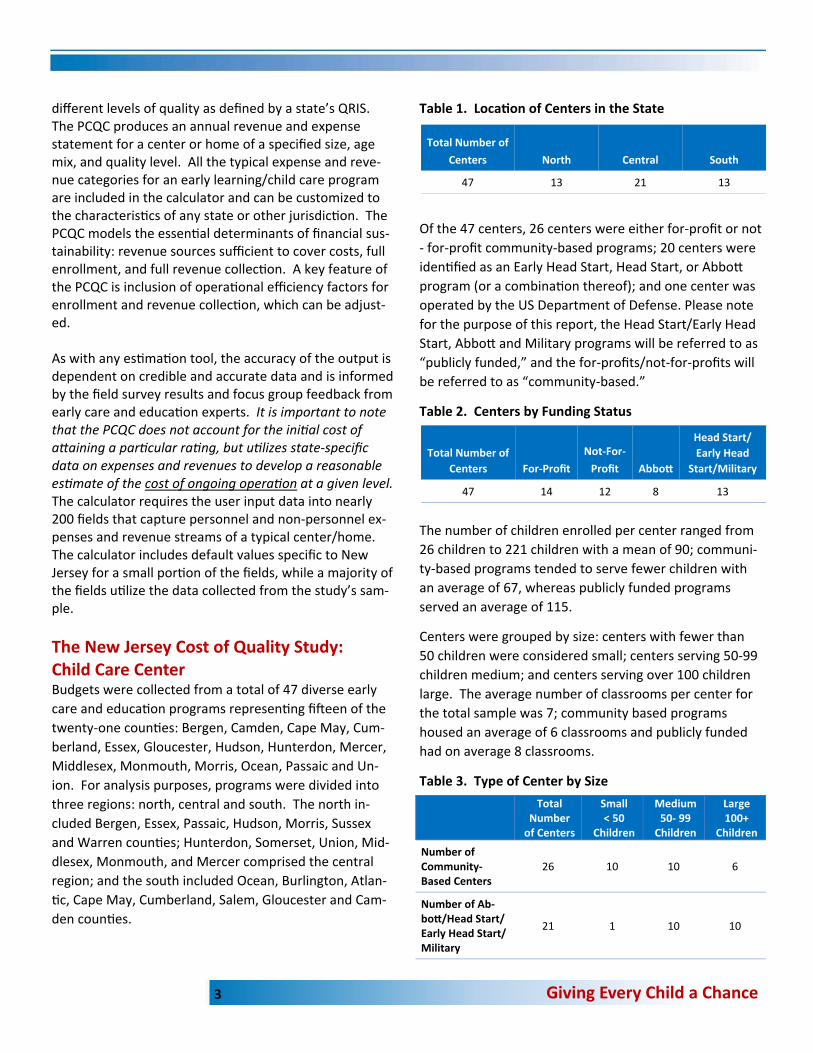
Table 1. Loca on of Centers in the State
Of the 47 centers, 26 centers were either for‐profit or not
‐ for‐profit community‐based programs; 20 centers were
iden fied as an Early Head Start, Head Start, or Abbo
program (or a combina on thereof); and one center was
operated by the US Department of Defense. Please note
for the purpose of this report, the Head Start/Early Head
Start, Abbo and Military programs will be referred to as
“publicly funded,” and the for‐profits/not‐for‐profits will
be referred to as “community‐based.”
Table 2. Centers by Funding Status
The number of children enrolled per center ranged from
26 children to 221 children with a mean of 90; communi‐
ty‐based programs tended to serve fewer children with
an average of 67, whereas publicly funded programs
served an average of 115.
Centers were grouped by size: centers with fewer than
50 children were considered small; centers serving 50‐99
children medium; and centers serving over 100 children
large. The average number of classrooms per center for
the total sample was 7; community based programs
housed an average of 6 classrooms and publicly funded
had on average 8 classrooms.
Table 3. Type of Center by Size
Total Number of
Centers North Central South
47 13 21 13
Total Number of
Centers For‐Profit
Not‐For‐
Profit Abbo
Head Start/
Early Head
Start/Military
47 14 12 8 13
Total Number
of Centers
Small < 50
Children
Medium 50‐ 99
Children
Large 100+
Children
Number of Community‐ Based Centers
26 10 10 6
Number of Ab‐bo /Head Start/ Early Head Start/Military
21 1 10 10

4 www.acnj.org
There was nearly an equal distribu on of ages served, with 24 programs serving children from infancy through preschool‐age, while 23 served only preschool‐age chil‐dren. At the me of the study, five of the community‐based programs were accredited by the Na onal Associa‐on for the Educa on of Young Children.
Table 4. Age‐Group Served
Cost Drivers in Grow NJ Kids for Child Care Centers The cost‐drivers iden fied for each level of Grow NJ Kids
for child care centers were as follows:
Level 1: No addi onal costs. Includes basic
costs associated with mee ng licensing requirements
mainly determined by requirements for group sizes and
ra os by child ages, and the staff qualifica on minimums
specified in regula ons.
Level 2: Costs to a ain a Level 2 were determined to be
minimal to the early care and educa on program. At this
level, a program is expected to:
▪ Conduct a self‐assessment using the Environment
Ra ng Scale (ERS) with an average score of 4 with no
subscale below 3 (scores can range from 1‐7 on the
ERS).
▪ Prepare to adopt a research‐based, validated curricu‐
lum that is aligned with the NJ Birth to Three Stand‐
ards and/or the NJ Preschool Teaching and Learning
Standards. State‐approved curricula include
HighScope, Crea ve Curriculum, Tools of the Mind,
and Curiosity Corner.
▪ U lize the Strengthening Families Protec ve Factors
Framework to assess engagement of interac ons
with parents and families.
▪ Register all classroom staff in the NJ Registry .
▪ Engage in appropriate business and administra ve
prac ces and conduct a self‐assessment using the
Program Administra on Scale earning a score of 3
(scores on the PAS can range from 1‐7).
While several of these criteria may require addi onal
staff training, primarily for the director or other designee,
current licensing requirements specify that the director,
teachers, and program supervisor must have 20 hours of
ongoing professional development each year. Therefore,
Total Number of
Centers
Infants, Toddlers and Preschoolers
Preschool Only (30 ‐ 60 months)
Number of Community‐ Based Centers
26 20 6
Number of Abbo /Head Start/Early Head Start
21 4 17
Figure 1. Size of Community‐Based Programs Figure 2. Size of Publicly Funded Programs

5 Giving Every Child a Chance
the ac vi es and training needed to achieve a Level 2
score could be met through this exis ng mandate. The
other costs associated with Level 2 were considered to
be one‐ me efforts and part of the daily responsibili es
of the director, not an ongoing addi onal work ac vity.
Levels 3‐5: A star ra ng of 3, 4 or 5 is awarded to a cen‐
ter based on a combina on of factors including:
▪ Mee ng specific threshold scores on the Environ‐
ment Ra ng Scale or Classroom Assessment Scoring
System (CLASS);
▪ Number of training hours in a state‐approved curric‐
ulum; and
▪ Points earned by mee ng standards across the five
categories of GNJK (Level 3 = 30‐59 points; Level 4 =
60‐85 points and Level 5 = 86‐100 points).
The Grow NJ Kids indicators are based on a points system
rather than a block system. In a block system, all indica‐
tors in a category must be met in order to achieve credit
for the category; whereas a points system allows pro‐
grams to accumulate points in a variety of categories.
This allows programs to select their area of focus among
each category and dedicate resources to achieve specific
indicators.
The primary cost drivers iden fied in Levels 3, 4 and 5
were related to staff qualifica ons and to the addi onal
me needed to implement the ac vi es expected at
each level. To a ain higher scores, teachers with higher
qualifica ons will be needed and will command higher
compensa on, both wages and benefits. The ra os and
group sizes set in New Jersey’s regula ons are consid‐
ered reasonable and therefore were not addressed in
Grow NJ Kids.
Other cost drivers iden fied at Level’s 3‐5 include:
▪ Performance‐Based Child Assessment ‐ this is a set
annual expense based on the assessment tool associ‐
ated with the curriculum selected and is calculated
per child at the same rate for each Level 3‐5.
▪ Ongoing cost of educa onal materials and equip‐
ment required to maintain an Environment Ra ng
Scale score of 3, 5 and 7. (See Appendix A for spe‐
cifics).
▪ Family Engagement ‐ costs related to hos ng work‐
shops, support groups, advisory commi ee mee ngs
and conduc ng home visits (i.e. refreshments, securi‐
ty, travel, and added insurance).
In addi on, if a center experiences high staff turnover,
there will be on‐going expenses related to training in the
selected curriculum for new staff members. Appendix B
provides a complete list of the iden fied cost drivers for
Levels 3‐5 by category. The list also includes one‐ me
costs related to improving quality such as curriculum,
facility modifica ons and policy changes.
A er reviewing each level and the related requirements,
the stakeholders determined that the greatest amount of
resources will be required for a program to move from a
Level 2 to a Level 3. To a ain a Level 3, programs will
need to: train staff on a chosen curriculum, purchase the
bulk of educa onal, curriculum and training materials,
and invest me in crea ng new policies. The costs asso‐
ciated with Levels 4 and 5 are primarily associated with
having more creden aled staff with exposure to ad‐
vanced training and use of more sophis cated evalua‐
on, supervision, and accoun ng procedures.
Personnel and Benefits
The cost of opera ng an early care and educa on pro‐
gram is driven largely by labor costs: the number of staff
(determined by staff: child ra os) and staff compensa on
(salary and benefits). The salary and benefits of an early
care and educa on center typically account for the ma‐
jority of total expenses. Staffing pa erns u lized in the
analysis were informed by New Jersey’s child care center
licensing regula ons which are based on size of the cen‐
ter and ages of children served.
6 www.acnj.org
According to 2013‐2016 New Jersey child care regula‐
ons, centers are required at a minimum to have:
1. A sponsor/sponsor representa ve who may
serve as the director and/or other staff member.
2. A director who may serve as another staff mem‐
ber.
Table 5 outlines the addi onal staff requirements.
Table 5. Staff Requirements by Licensed Capacity
Although a center may have other staff, the PCQC only
incorporates salaries for six occupa ons: Director, Educa‐
on Coordinator/Assistant Director, Classroom Teacher/
Head Teacher, Teacher Assistant/Group Teacher, Admin‐
istra ve Assistant, and Health Consultant. Since New
Jersey no longer supports health care consulta on, this
tle was excluded from the analysis.
The following assump ons were used in the develop‐
ment of the budgets:
Assump on: Salaries will increase with Grow NJ Kids
Levels
A er closely examining the expected staff creden als
and addi onal ac vi es required at each sequen al stage
of Grow NJ Kids, it was determined that both compensa‐
on and amount of staff me necessary to maintain qual‐
ity will increase with each level. The budgets were con‐
structed to reflect these increasing requirements.
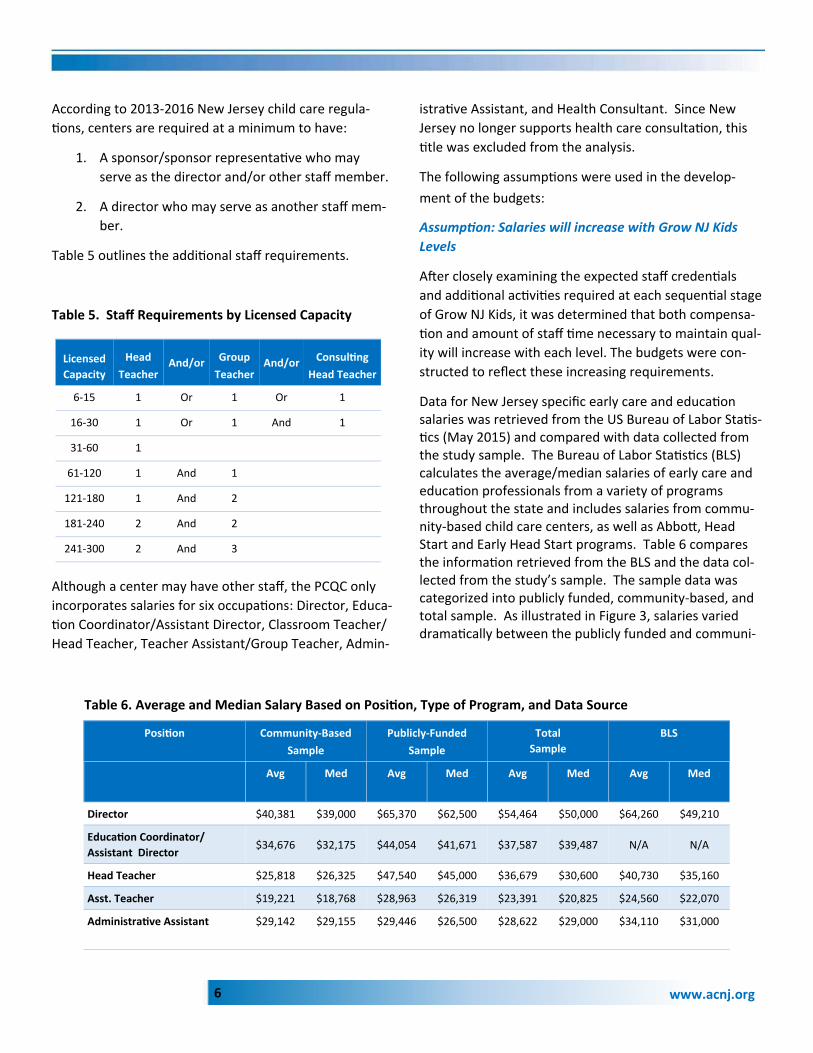
Data for New Jersey specific early care and educa on salaries was retrieved from the US Bureau of Labor Sta s‐cs (May 2015) and compared with data collected from
the study sample. The Bureau of Labor Sta s cs (BLS) calculates the average/median salaries of early care and educa on professionals from a variety of programs throughout the state and includes salaries from commu‐nity‐based child care centers, as well as Abbo , Head Start and Early Head Start programs. Table 6 compares the informa on retrieved from the BLS and the data col‐lected from the study’s sample. The sample data was categorized into publicly funded, community‐based, and total sample. As illustrated in Figure 3, salaries varied drama cally between the publicly funded and communi‐
Licensed
Capacity
Head
Teacher And/or Group
Teacher And/or Consul ng
Head Teacher
6‐15 1 Or 1 Or 1
16‐30 1 Or 1 And 1
31‐60 1
61‐120 1 And 1
121‐180 1 And 2
181‐240 2 And 2
241‐300 2 And 3
Posi on Publicly‐Funded
Sample
Total
Sample
BLS
Avg Med Avg Med Avg Med Avg Med
Director $40,381 $39,000 $65,370 $62,500 $54,464 $50,000 $64,260 $49,210
Educa on Coordinator/
Assistant Director $34,676 $32,175 $44,054 $41,671 $37,587 $39,487 N/A N/A
Head Teacher $25,818 $26,325 $47,540 $45,000 $36,679 $30,600 $40,730 $35,160
Asst. Teacher $19,221 $18,768 $28,963 $26,319 $23,391 $20,825 $24,560 $22,070
Administra ve Assistant $29,142 $29,155 $29,446 $26,500 $28,622 $29,000 $34,110 $31,000
Community‐Based
Sample
Table 6. Average and Median Salary Based on Posi on, Type of Program, and Data Source

7 Giving Every Child a Chance
ty‐based centers while the study’s total sample closely resembles the BLS data. Although the total sample data closely resembled the BLS data for New Jersey, it was decided to u lize the salaries reported by the community‐based programs for the base scenario in this study for several reasons. First, commu‐nity‐based centers represent the majority of early care and educa on centers throughout the state. Addi onal‐ly, the revenue streams and resources available to public‐ly‐funded programs differ dras cally from the community‐based programs. Finally, publicly‐funded programs are required to meet higher standards and staff must a ain higher levels of educa on resul ng in compensa on that tends to be higher than community‐based centers. Based on the assump on that salaries will increase as
centers a ain higher levels of the QRIS, Level 1 salaries
were set to reflect the 10th percen le of salaries reported
by community‐based centers, Level 2 the 25th percen le,
Level 3 the 50th percen le, Level 4 the 75th percen le and
Level 5 the 90th percen le (see Table 7). The Educa on
Coordinator/Assistant Director posi on was included at
Level 3 to reflect the need for addi onal staff at higher
levels of quality. The Educa on Coordinator/Assistant
Director posi on salary was set at 75% of the Director’s
salary at each level of the QRIS.
The progression in salary across the levels reflects the
more complex demands and expecta ons required at
each increasing level of the ra ng scale. A center will
likely need more qualified staff to maintain opera ons at
a Level 3 and should pay them accordingly. In addi on,
to obtain the higher CLASS and Environment Ra ng Scale
scores required at Levels 4 and 5, programs will most
likely need staff who possess a bachelor’s or a master’s
degree. A rac ng and retaining staff with these qualifi‐
ca ons will require higher wages.
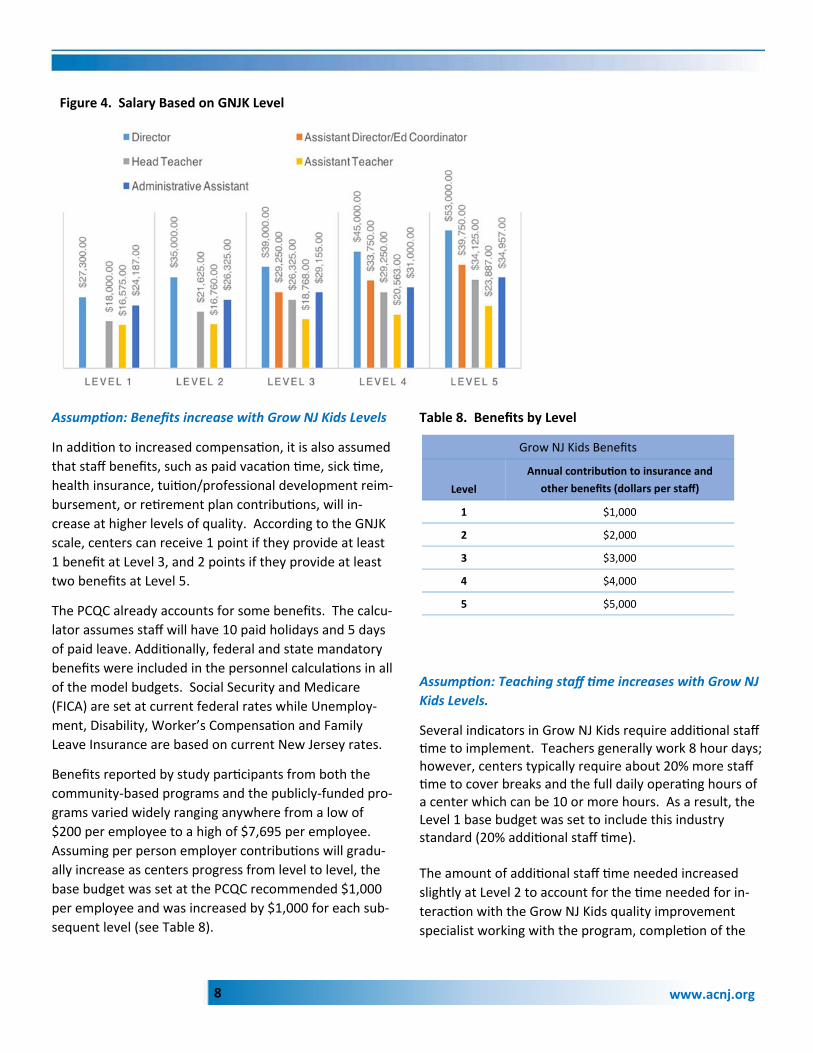
Table 7. Salary Based on GNJK Level
Figure 3. Median Salary Based on Posi on, Type of Program and Data Source
Grow NJ Kids
Staff Salary Level 1 Level 2 Level 3 Level 4 Level 5
Director $27,300 $35,000 $39,000 $45,000 $53,000
Ed Coordinator/Assistant Director
$29,250 $33.750 $39,750
Head Teacher $18,000 $21,625 $26,325 $29,250 $34,125
Teacher Assistant $16,575 $16,760 $18,768 $20,563 $23,887
Administra ve Assistant
$24,187 $26,325 $29,155 $31,000 $34,057
8 www.acnj.org
Assump on: Benefits increase with Grow NJ Kids Levels
In addi on to increased compensa on, it is also assumed
that staff benefits, such as paid vaca on me, sick me,
health insurance, tui on/professional development reim‐
bursement, or re rement plan contribu ons, will in‐
crease at higher levels of quality. According to the GNJK
scale, centers can receive 1 point if they provide at least
1 benefit at Level 3, and 2 points if they provide at least
two benefits at Level 5.
The PCQC already accounts for some benefits. The calcu‐
lator assumes staff will have 10 paid holidays and 5 days
of paid leave. Addi onally, federal and state mandatory
benefits were included in the personnel calcula ons in all
of the model budgets. Social Security and Medicare
(FICA) are set at current federal rates while Unemploy‐
ment, Disability, Worker’s Compensa on and Family
Leave Insurance are based on current New Jersey rates.
Benefits reported by study par cipants from both the
community‐based programs and the publicly‐funded pro‐
grams varied widely ranging anywhere from a low of
$200 per employee to a high of $7,695 per employee.
Assuming per person employer contribu ons will gradu‐
ally increase as centers progress from level to level, the
base budget was set at the PCQC recommended $1,000
per employee and was increased by $1,000 for each sub‐
sequent level (see Table 8).
Table 8. Benefits by Level
Assump on: Teaching staff me increases with Grow NJ
Kids Levels.
Several indicators in Grow NJ Kids require addi onal staff me to implement. Teachers generally work 8 hour days;
however, centers typically require about 20% more staff me to cover breaks and the full daily opera ng hours of
a center which can be 10 or more hours. As a result, the Level 1 base budget was set to include this industry standard (20% addi onal staff me). The amount of addi onal staff me needed increased
slightly at Level 2 to account for the me needed for in‐
terac on with the Grow NJ Kids quality improvement
specialist working with the program, comple on of the
Figure 4. Salary Based on GNJK Level
Level
Annual contribu on to insurance and
other benefits (dollars per staff)
1 $1,000
2 $2,000
3 $3,000
4 $4,000
5 $5,000
Grow NJ Kids Benefits

9 Giving Every Child a Chance
Environment Ra ng Scale, and increased family engage‐
ment ac vi es. The budgets for Levels 3‐5 included more
hours of floater‐assistant me accordingly to allow me
for the teachers to conduct the required child assessments
and family engagement work, and for all staff to have
more planning and mee ng me (see Table 9).
Table 9. Addi onal Staff Time Required by GNJK Levels
Revenue Sources
In order to cover the costs related to providing higher
quality child care (i.e. increased salaries, benefits, training,
curriculum, etc.), it is assumed that programs will need to
increase their revenue. The primary revenue sources
available to support the cost of opera ng any early learn‐
ing program include:
1. Private tui on paid by families;
2. Public state and federal funds for child care subsidy
(i.e. NJ Cares for Kids, Work First NJ); and
3. Public federal funds for food/food service (USDA Child
and Adult Care Food Program [CACFP] reimbursement
for all children).
A few centers also reported income from grants, dona‐
ons and fundraising ac vi es; the range was from a few
hundred to $175,000 per year. Since this type of revenue
is generally unique to non‐profits, it was not included in
the cost model. However, the not‐for‐profit programs in
this study’s sample reported that they rely on this type of
revenue in order to remain opera onal.
Assump on: Private tui on rates increase with Grow NJ
Kids Levels.
In order to determine annual tui on costs for the calcula‐
tor, several resources were reviewed and analyzed. A er
reviewing the data collected from this study’s par cipants
and the Child Care Aware of New Jersey’s most recent The
High Price of Child Care 2013 report, it was determined the
informa on from the Child Care Aware of NJ survey pro‐
vided more recent, robust and reliable data. The 2012
average tui on rate reported for each county was ranked
from the lowest to highest and then adjusted to reflect
rates as of September of 2016 using the US Bureau of La‐
bor Sta s cs’ infla on calculator. Next, the average 2016
adjusted tui on rates by county were broken down into
the 50th, 60th, 70th, 80th and 90th percen les which then
informed the data used for the calculator. The 50th‐90th
percen le ranks were used to set rates for Levels 1‐5 re‐
spec vely of the GNJK scale (see Table 10).
Grow NJ Kids
Levels
Percent of
Addi onal Staff Time
1 20%
2 22%
3 30%
4 35%
5 40%
2012 Tui on Rates
2016 Tui on Rates
(adjusted for infla on 9/2016)
Percen le Infant Toddler Preschooler
Infant Toddler Preschooler
50th $11,128 $10,556 $9,256 $11,664 $11,065 $9,702
60th $12,168 $10,972 $9,620 $12,754 $11,501 $10,084
70th $12,272 $11,492 $9,776 $12,863 $12,046 $10,247
80th $13,364 $12,376 $11,076 $14,008 $12,972 $11,610
90th $14,300 $13,416 $11,388 $14,962 $14,062 $11,937
Table 10: 2012 and 2016 Average Annual New Jersey Child Care Tui on By Age

10 www.acnj.org
Grow NJ Kids
Level
Infant Toddler Preschool
1 $11,664 $11,065 $9,702
2 $12,754 $11,501 $10,084
3 $12,863 $12,046 $10,247
4 $14,008 $12,972 $11,610
5 $14,962 $14,062 $11,937
Table 12. Weekly Center Private Tui on Rates by Quality Level Compared to Subsidy Rates
(Infants, Toddlers and Preschoolers)
Toddler Preschool Age
QRIS Level Private Tui on Subsidy Rate Private Tui on Subsidy Rate Private Tui on Subsidy Rate
1 $224.31 $160.60 $212.78 $160.60 $186.57 $132.40
2 $245.27 $160.60 $221.16 $160.60 $193.91 $132.40
3 $247.37 $160.60 $231.64 $160.60 $197.06 $132.40
4 $269.38 $160.60 $249.46 $160.60 $223.26 $132.40
5 $288.24 $160.60 $270.43 $160.60 $229.55 $132.40
Infant
Figure 5: Weekly Private Tui on Compared to Subsidy Rates
Table 11: Annual Tui on Rates for the
GNJK Levels by Age
Assump on: Child care subsidy rates vary only by child age
The subsidy rates used in the model are those funded through
the federal Child Care and Development Fund, Temporary Assis‐
tance for Needy Families (TANF), and state dollars commonly
known as NJ Cares for Kids (NJCK) or WorkFirst New Jersey. The
rates are dependent on a child’s age and have remained un‐
changed since 2008. Depending on a family’s income and work
status, a child may receive the full subsidy amount or the family
may be responsible for a co‐payment which is paid directly to the
child care center. The assump on is that centers collect the full
subsidy amount for each child receiving the subsidy. Table 12
illustrates the current subsidy rate and the es mated cost of tui‐
on at each level of quality.
Data was not available to determine the average number of sub‐
sidy children enrolled per center; therefore, the model used an
es mate of 25% of a center’s total enrollment as receiving a sub‐
sidy. This percent was selected to align with the percent of low
income children a for‐profit center must enroll in order to par ci‐
pate in the Child and Adult Care Food Program (CCAFP).

11 Giving Every Child a Chance
Assump on: The income range of families served by the
center affects revenue.
In New Jersey, families with income below 200% of the
federal poverty level and who are working and/or in a
training program at the me of the ini al applica on are
poten ally eligible for a child care subsidy through the
federal Child Care and Development Fund, also known as,
New Jersey Cares for Kids, or WorkFirst New Jersey. New
Jersey reviews a family’s applica on annually; as long as
a family’s income falls under 250% of the FPL at the me
of reauthoriza on, the child(ren) will con nue to receive
the subsidy. All other families are assumed to be paying
the full private tui on rates.
The propor on of children receiving a subsidy and those
paying full tui on is a variable in the model. It can be ad‐
justed to model different situa ons. For example, to
model programs with no subsidy revenue, the family in‐
come mix is set to 100% paying full tui on.
Assump on: Programs par cipate in the Child and Adult
Care Food Program (CACFP).
The federal Child and Adult Care Food Program, adminis‐
tered through the New Jersey Department of Agriculture,
enhances the quality of child care programs by sup‐
por ng the cost of providing nutri ous meals and snacks
to eligible children. Well balanced meals and snacks are
provided to children and the center is reimbursed at
three different rates: free meals (highest reimbursement
rate) for children whose family income is below 130% of
the federal poverty level (FPL); reduced‐price rate for
children whose family income is between 130% and
185% of FPL; and paid meal rate (lowest reimbursement
rate) for children whose family income is above 185%
FPL.
The only programs not eligible for CACFP are for‐profit
centers enrolling fewer than 25% low‐income children.
The model assumes that centers will par cipate in the
program and claim up to two reimbursable meals
(breakfast, lunch, or supper) and one snack, or two
snacks and one meal per day.
Size, Age and Efficiency Factors
Assump on: The number of children and the ages of
children served affect revenue.
The age mix of children and enrollment size of a center
are variables in the model. In general, larger programs
are more cost‐efficient than smaller ones in that fixed
costs such as administra on are spread among more chil‐
dren.
As illustrated previously, tui on rates vary by child age;
infant tui on rates are higher than toddler rates, which
are higher than preschool rates. Staffing pa erns are
based on staff to child ra os and group sizes. Because
infants have a smaller staff to child ra o (1:4) with a max‐
imum group size of 12, centers with numerous infant
classrooms will need to employ more staff members and
serve fewer children which increases personnel
costs. Compara vely, preschool classrooms have a staff
to child ra o of 1:10 and a group size of 20 which result
in fewer staff for more children.
The centers in this study ranged in size from fewer than
50 children to more than 200. However, the average size
was close to 5 classrooms and 81 children. We used this
data to then create the base scenario for the calculator.
For the purpose of this study, the ‘base scenario’ repre‐
sented as closely as possible the average size center with
88 children and 5 classrooms: 1 infant room (12 chil‐
dren), 2 toddler rooms (36 children), and 2 preschool
rooms (40 children). Please note, NJ’s Child Care Manual
states the group size for toddler classrooms is 20 children
and a ra o of 1 staff for every 6 children. However, due
to the calcula on protocol used in the calculator, the
base scenario included only 18 toddlers per classroom.
Assump on: Full enrollment and mely collec on of all
revenue are essen al to a program’s financial sustaina‐
bility.
Financial sustainability for a center is largely determined
by three factors: full enrollment every day; tui on and
fees collected in full and on‐ me; and annual revenues
that sufficiently cover annual expenses. In order to re‐
main viable, centers must set tui on rates that will cover
the full cost of opera on.

12 www.acnj.org
In each budget, the maximum poten al revenue from all
sources is calculated and then reduced by a percentage
to model the fact that 100% enrollment (and 100% reve‐
nue receipt) is not typically achievable. In prac ce, this
factor depends on a center’s ability to quickly fill vacan‐
cies and to collect full payment from all payers. The en‐
rollment efficiency factor is set ini ally at 85% in all budg‐
ets and can be varied.
The propor on of revenue that is uncollec ble,
commonly called ‘bad debt,’ can be varied in the model
as well. The industry standard is to keep bad debt to less
than 3% of revenue; programs with clear tui on payment
policies and effec ve collec on prac ces may do be er.
In the PCQC, the bad debt is ini ally set at 3% and can be
varied.
Non‐personnel Expenses
Informa on was also collected on the annual cost of
food, kitchen supplies, educa on supplies and equip‐
ment, office supplies and equipment, insurance, postage,
and adver sing. In addi on, the survey examined the
cost of rent/lease, u li es, maintenance, telephone and
internet, audits, fees and permits, payroll services, ac‐
coun ng fees, training and professional development.
The data provided by New Jersey community‐based cen‐
ters did not vary significantly between the region, size of
a center, and/or profit status and thus informed the non‐
personnel fields in the base model. Non‐personnel items
are grouped into four categories:
1. Those that vary by the number of children (e.g.,
classroom materials, food, office supplies);
2. Those that are related to the number of classrooms
in a site (e.g., occupancy costs including rent, u li‐
es and maintenance);
3. Those that are site‐wide (e.g., audit, permits/fees);
4. Those that vary per staff (e.g., training costs).
Assump on: Scores on the Environment Ra ng Scales
are related to the presence of specific items such as
books, science materials, gross motor equipment, etc.
Centers may have upfront costs associated with ini ally
purchasing materials aside from typical supplies and
equipment each year in order to a ain higher scores on
the Environment Ra ng Scale. The calculator accounts
for educa on supplies and equipment per child per year
which would be used to then replace the items as need‐
ed.
Assump on: Maintaining Levels 3, 4 or 5 requires using
a child assessment system.
Beginning at Level 3, the model includes the cost of a
child assessment system. This rate was set at $35 which
represents the average cost per child in most assessment
systems.
Base Model
The PCQC requires the user create a “base scenario”
which reflects the typical child care program in New Jer‐
sey. For the purpose of this study, the model reflected a
center that serves 88 children and has 5 classrooms: 1
infant room (12 children), 2 toddler rooms (36 children),
and 2 preschool rooms (40 children). The model also as‐
sumed 25% of the children were receiving a child care
subsidy, and 15% of the children received free meals
through the Child and Adult Care Food Program while
10% received the reduced meal price. Addi onally, the
base scenario incorporated the assump ons men oned
in the above text into the model.
Findings
1. The typical center portrayed in this study is not sus‐
tainable at the higher levels of Grow NJ Kids.
To determine sustainability by quality level, costs related
to opera ng an average size center in New Jersey were
entered into the PCQC. The comparison of financial sus‐

13 Giving Every Child a Chance
tainability is based on the net annual revenue of this typi‐
cal center at each level of quality.
In the scenario below, u lizing the community‐based da‐
ta and applying the assump ons stated above, the typical
center will be able to end the year with a posi ve net
revenue at Levels 1 and 2, but will be completely unsus‐
tainable at higher‐quality levels (Levels 3, 4 and 5). It is
important to note that centers are only able to make a
profit at Levels 1 and 2 due to lean staffing pa erns,
meager salaries and minimal benefits. Level 1 only in‐
cludes teaching staff, an administra ve assistant, and a
Director, who are paid close to, or just above minimum
wage, and all receive minimal benefits. The salaries in
Level 2 reflect wages slightly above minimum wage and
the benefits are just nominally be er than Level 1.
Please note, the industry standard is to have a net reve‐
nue as a percentage of the total at or above 7%. This
profit provides centers with savings to account for unfor‐
seen needs that may arise such as facility repairs, such as
fluctua ons and enrollment, uncollected fees, etc.
Figure 6a. Net Annual Revenue for Base Scenario at
GNJK Levels
Figure 6b. Base Scenario – Net Revenue as a Percentage
of Total
When the model is adjusted to use the salaries from the
total sample which includes both publicly funded and
community‐based salaries, programs are less sustainable
at Levels 1 and 2, and significantly less sustainable at
Level 3 and higher. (see Figure 7).
Figure 7. Net Revenue by GNJK Levels Using Total Sam‐
ple Salaries vs Community‐Based Salaries

14 www.acnj.org
2. When the number of children receiving a child care
subsidy at the typical center is increased, the center is
not sustainable at the higher levels of GNJK.
Next, the base scenario was modified to examine the im‐
pact of par cipa on in the child care subsidy program.
The base model was adjusted to look at sustainability at
the following subsidy par cipa on rates: 25% of families
receiving a subsidy (all private tui on and no involve‐
ment in CACFP), 50% receiving subsidy and 100% receiv‐
ing subsidy (Note: it is assumed centers receiving subsidy
are also par cipa ng in the CACFP). As indicated in the
chart below, centers serving 50% or more subsidy chil‐
dren will only be able to reach a healthy year‐end reve‐
nue at Level 1; centers with 50% subsidy children could
s ll earn a profit at Level 2, but all programs will be com‐
pletely unsustainable at higher‐quality levels with the
current subsidy rate.
3. When the typical center was modified to serve pre‐
schoolers only, the center was more sustainable than
when the center was only serving infants and tod‐
dlers or mixed age groups.
To determine how the age mix of children in a center im‐
pacts expenses and revenues, the model was adjusted to
look at centers serving only infants and toddlers and cen‐
ters serving only preschoolers. Other than changing the
age mix, all variables from the base model remain the
same. The infant/toddler program includes a total of 5
classrooms, 2 infant and 3 toddler, and the preschool
only programs have 5 classrooms total. As illustrated in
Figure 9, centers serving infants/toddlers only are not
sustainable beginning at Level 2, while preschool only
programs are able to make a profit at all levels except
Level 5.
Figure 9. Revenue Based on Popula on Served
Figure 8. Annual Net Revenue Based on Percent of Subsidy Families Served

15 Giving Every Child a Chance
4. Larger child care centers were more likely to sustain
quality at higher levels of GNJK than smaller centers.
Understanding that the size of the child care program has
a role in the sustainability of a program, with larger pro‐
grams assumed to be more cost‐efficient due to econo‐
mies of scale, the model was further adjusted to com‐
pare sustainability of smaller programs versus larger pro‐
grams. In Figure 12, a large center with a total of 12
classrooms, 3 infant, 4 toddler, and 5 preschool rooms, is
compared to a small center with a total of 3 classrooms,
1 of each age group. All other variables remained the
same. As shown in Figure 10, although larger centers are
not sustainable star ng at level 3, they are losing signifi‐
cantly less money each year compared to their smaller
counterparts.
5. The type of funding centers receive greatly impacts
the ability of centers to sustain quality.
As an cipated, the type of funding a center receives greatly impacts their ability to sustain quality. Publicly funded programs have a more reliable and robust fund‐ing source that enables them to provide high quality ser‐vices. Figure 11 compares the base model serving 100% of chil‐dren on a subsidy with the current subsidy rate for each age group ($160.60 for infants and toddlers and $132.40 for preschoolers) with the base model that has a subsidy rate that mirrors the consistent funding a publicly‐funded program receives per child per week. For the publicly funded scenario, a subsidy rate of $263 was used as a subsidy amount for infants, toddlers and preschoolers. As indicated in Figure 11, a community based program with a more robust subsidy rate is able to reach all levels of Grow NJ Kids up to Level 4.
Figure 10. Revenue Based on Size Figure 11. Net Revenue Based on Funding
16 www.acnj.org
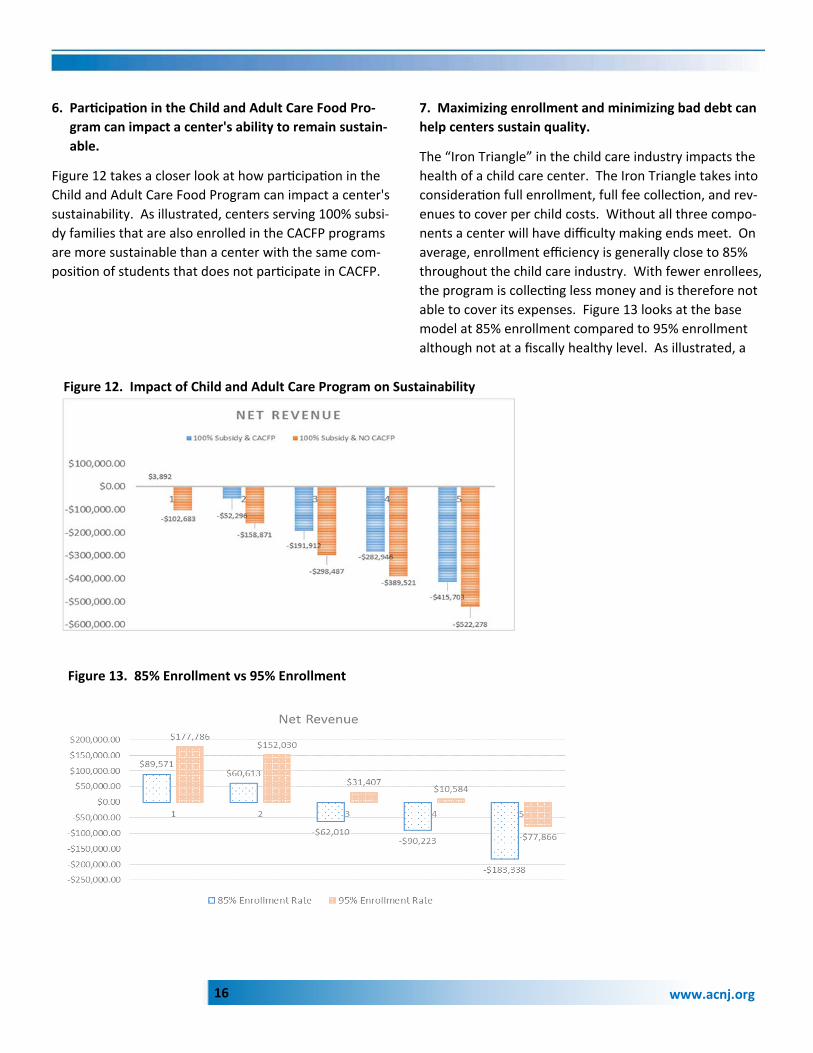
6. Par cipa on in the Child and Adult Care Food Pro‐
gram can impact a center's ability to remain sustain‐
able.
Figure 12 takes a closer look at how par cipa on in the
Child and Adult Care Food Program can impact a center's
sustainability. As illustrated, centers serving 100% subsi‐
dy families that are also enrolled in the CACFP programs
are more sustainable than a center with the same com‐
posi on of students that does not par cipate in CACFP.
7. Maximizing enrollment and minimizing bad debt can
help centers sustain quality.
The “Iron Triangle” in the child care industry impacts the
health of a child care center. The Iron Triangle takes into
considera on full enrollment, full fee collec on, and rev‐
enues to cover per child costs. Without all three compo‐
nents a center will have difficulty making ends meet. On
average, enrollment efficiency is generally close to 85%
throughout the child care industry. With fewer enrollees,
the program is collec ng less money and is therefore not
able to cover its expenses. Figure 13 looks at the base
model at 85% enrollment compared to 95% enrollment
although not at a fiscally healthy level. As illustrated, a
Figure 12. Impact of Child and Adult Care Program on Sustainability
Figure 13. 85% Enrollment vs 95% Enrollment

17 Giving Every Child a Chance
center with 95% enrollment will be able to sustain quality
up to Level 4.
Another integral component of the child care industry is
bad debt. Bad debt is the propor on of revenue that is
uncollec ble. The industry standard is to keep bad debt to
less than 3% of revenue; programs with clear tui on pay‐
ment policies and effec ve collec on prac ces may do
be er. This graph compares the base model which reflect‐
ed the industry standard of 3% bad debt compared to a
center that has 10% bad debt. As shown, bad debt signifi‐
cantly influences the overall revenue of a program and
prohibits centers from sustaining at higher levels of GNJK.
8. The current subsidy rates need to be increased sub‐
stan ally in order to help sustain quality improve‐
ments.
In order to determine what it would take to bring pro‐
grams receiving subsidy into the sustainable range, subsidy
rates were adjusted as follows:
▪ Infants (0‐18 months) – the current subsidy rate of
$160.60 was increased by 5% annually beginning in
2009 and ending in 2016. The resul ng rate, $237.28,
was then used to establish the rate for Level 2 centers.
This rate was then increased by 3% for each subse‐
quent level to create a ered reimbursement system.
The rate was then decreased by 3% to establish a Level
1 rate.
▪ Toddlers – a new toddler was proposed for ages 19 to
30 months. The current infant/toddler subsidy rate of
$160.60 was increased by 3% annually beginning in
2009. The resul ng rate $203.41 was then used to
establish the rate for level 2 centers and the same pro‐
cess was then used to determine the remaining levels
of GNJK.
▪ Preschool – the current subsidy rate of $132.40 was
increased by 5% annually beginning in 2009 and end‐
ing in 2016. The resul ng rate, $195.62 was then used
Figure 14. 3% Bad Debt vs 10% Bad Debt
Table 13. Proposed Subsidy Rates
GNJK Level Infant Toddler Preschool
1 $230.16 $197.30 $189.75
2 $237.28 $203.41 $195.62
3 $244.40 $209.51 $201.49
4 $251.74 $215.80 $207.53
5 $259.30 $222.28 $213.76
18 www.acnj.org
to establish the rate for Level 2 centers. This rate was
then increased by 3% for each subsequent level and
decreased by 3% to establish a Level 1 rate.
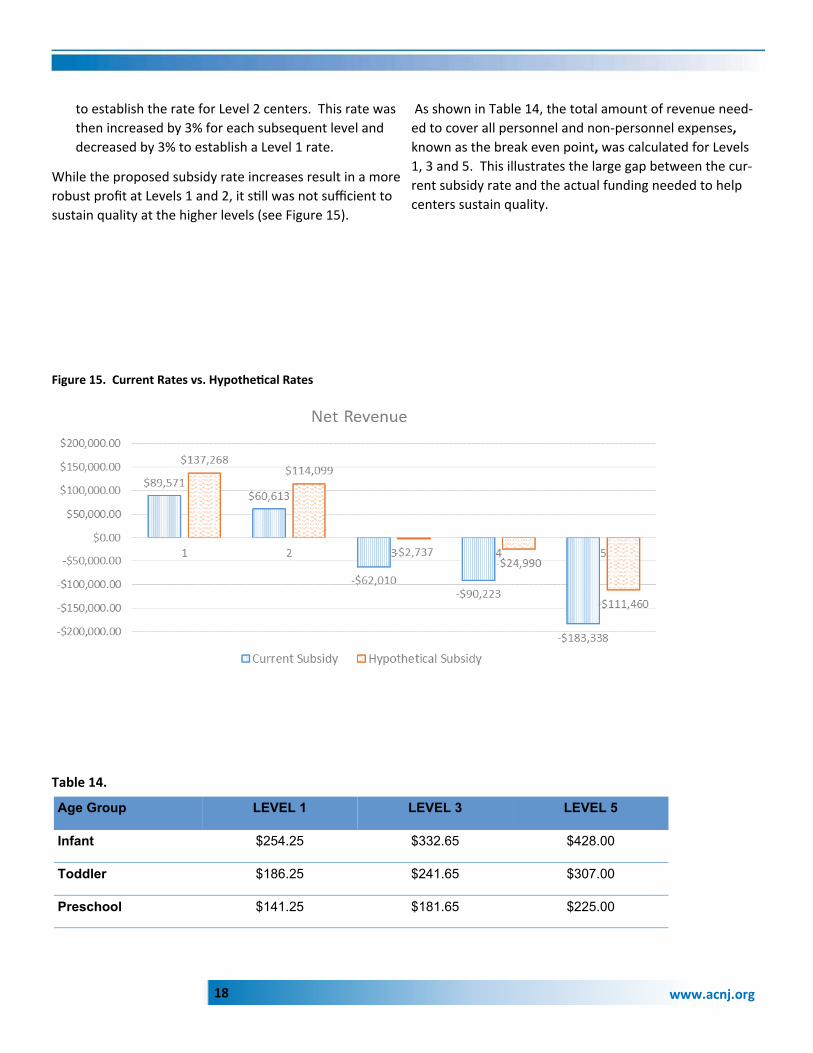
While the proposed subsidy rate increases result in a more
robust profit at Levels 1 and 2, it s ll was not sufficient to
sustain quality at the higher levels (see Figure 15).
As shown in Table 14, the total amount of revenue need‐
ed to cover all personnel and non‐personnel expenses,
known as the break even point, was calculated for Levels
1, 3 and 5. This illustrates the large gap between the cur‐
rent subsidy rate and the actual funding needed to help
centers sustain quality.
Figure 15. Current Rates vs. Hypothe cal Rates
Table 14.
Age Group LEVEL 1 LEVEL 3 LEVEL 5
Infant $254.25 $332.65 $428.00
Toddler $186.25 $241.65 $307.00
Preschool $141.25 $181.65 $225.00

19 Giving Every Child a Chance
Family Child Care Homes
Family child care homes are small for‐profit businesses
owned and operated by a provider who voluntarily regis‐
ters with the state and agrees to comply with a set of
regula ons. Family child care homes are a cri cal com‐
ponent of New Jersey’s early care and educa on system
serving approximately 10,000 children annually. As of
December 2016, there were 1,907 registered family child
care homes opera ng throughout the state.
Study Sample
Using the same methodology as was u lized with child
care centers, budgets were collected from a total of 9
family child care providers represen ng Essex, Mercer,
Union, Burlington, Somerset and Middlesex coun es; 2
homes were based in the northern part of the state, 5 in
the central part, and one in the southern region.
In New Jersey, registered family child care providers can
enroll up to 5 children, with no more than 2 children be‐
ing under the age of 12 months. The average number of
children served in the sample size was 4 and the ages of
the children ranged from infants to school‐age children.
All of the homes in the sample accepted the state subsi‐
dy. Three of the nine providers surveyed also par cipat‐
ed in the Child and Adult Care Food Program.
Cost Drivers for Family Child Care Homes
The family child care ra ng tool is similar to the point structure of the center‐based tool. However, the cost drivers and quality measures differ. The primary cost drivers by level as iden fied by family child care stake‐holders at the cost of quality mee ng include:
Level 1: No addi onal costs. Includes basic
costs associated with mee ng family child care registra‐
on requirements.
Level 2: Costs to a ain a Level 2 were determined to be
minimal and include a modest amount of me to meet
with a quality improvement specialist, conduct a self‐
assessment, and prepare a quality improvement plan.
Levels 3‐5: As with centers, the Grow NJ Kids indicators are based on a points system that allows programs to accumulate points in a variety of categories. This allows programs to select their area of focus among each cate‐gory and dedicate resources to achieve specific indica‐tors. A star ra ng of 3, 4 or 5 is awarded to a family child care home based on mee ng specific threshold scores on the Family Child Care Environmental Ra ng Scale (FCCERS) and
points earned by mee ng standards across the five cate‐gories of GNJK (Level 3 = 19‐29 points; Level 4 = 30‐40 points and Level 5 = 41‐50 points). The primary cost drivers iden fied in Levels 3, 4 and 5 were related to professional development ac vi es and addi onal me needed to create lesson plans, evaluate the children, engage with parents, and implement be er business prac ces. Other cost drivers iden fied at Level’s 3‐5 include:
▪ Performance‐Based Child Assessment ‐ this is a set
annual expense based on the assessment tool associ‐ated with the curriculum selected and is calculated per child at the same rate for each Level 3‐5.
▪ Ongoing cost of educa onal materials and equip‐
ment required to maintain an Environment Ra ng Scale score of 3, 5 and 7. (See Appendix A for spe‐cifics)
▪ Family Engagement ac vi es
Personnel, Benefits and Professional Development
Unlike child care centers, the cost of opera ng a family child care home is not largely driven by personnel costs. Since the maximum number of children that can be served at one me in a family child care home is limited

20 www.acnj.org
to five, personnel in a family child care home is usually limited to just the provider. Subs tutes/assistants may be used if the provider is sick or if the provider needs to a end a training or other off‐site ac vity. Only one home in the study sample reported u lizing an assistant for part of the day. Because assistants are not the norm in NJ, the cost for an assistant was not included in the base scenario for the family child care cost model.
Because insurance costs vary dras cally from provider to provider, the calculator does not account for that expense which was a large cost driver in the center based scenari‐os. The assump on used in the family child care model is that individuals spend $500 per month on personal bene‐fits, such as insurance, which equates to $6,000 per year. Therefore, the net revenue was reduced by $6,000 in or‐der to reflect the actual money earned at the end of the year. Beginning at Level 3, providers are required to earn their Family Child Care Child Development Associate (CDA). Ad‐di onal professional development required at the higher levels include training in developmental screening, curricu‐lum, pyramid model, social‐emo onal health, and addi‐onal “formal professional development that builds upon
the required training for FCC registra on.”
Although the acquisi on of creden als and college credits is currently supported through New Jersey’s Early Learning Challenge Race to The Top grant, this is a me limited grant that is set to expire in December 2017. Providers in the sample reported spending an average of $250.00 an‐nually for on‐going professional development costs which was included in the cost model.
Assump on: The amount of me a provider invests in the family child care program increases with Grow NJ Kids Levels.
The number of hours a family child care provider works was calculated based on the me from when the first child arrives in the morning un l the last child leaves for the day. In addi on, the number of hours a provider spends conduc ng child care‐related chores when there are no children present such as purchasing food, lesson planning, meal prepara on, bookkeeping, cleaning, and hours spent in professional development, are also included to deter‐
mine the total number of hours a provider spends per week opera ng the family child care home.
According to the Na onal Survey of Early Care and Educa‐on (2014), regulated family child care providers generally
spend an average of 54 hours or more each week in direct care and an addi onal 10 hours per week on child care related ac vi es when no children are present. Providers in the NJ sample reported spending an average of 67 hours or more each week on both direct and indirect ac vi es.
As was the case with centers, it is assumed that the amount of me a provider spends on their business will increase as quality increases (see Table___)
Table15. Number of Hours per Week Spent on
FCC Business
Revenue
Homes have access to the same range of revenue as cen‐
ters including private tui on, subsidy, and the Child and
Adult Care Food Program. As was the case with centers,
private tui on rates used in the cost model were based on
rates from Child Care Aware of NJ’s 2013 High Price of
Child Care study and then adjusted for infla on. Since
there were no significant differences between rates for
infants versus toddlers, only an infant‐toddler rate was
calculated.
Assump on: Private tui on rates increase with Grow NJ
Kids Levels.
The same methodology used to determine annual tui on
costs for child care centers was used to determine the
rates for family child care. A er reviewing the data col‐
1 2 3 4 5
Hours Spent per
Week
60 62 68 70 72
Grow NJ Kids Levels

21 Giving Every Child a Chance
lected from the par cipants and reviewing Child Care
Aware of New Jersey’s most recent The High Price of
Child Care 2013 report it was determined the informa on
from the market rate survey was the most recent, robust
and reliable data. As a result, the average tui on rates
for family child care homes reported in 2012 were ranked
into the 50th, 60th, 70th, 80th and 90th percen les and ad‐
justed for infla on as of September 2016. These percen‐
le ranks were used to set rates for Levels 1‐5 respec ve‐
ly of the GNJK scale (see table 16) .
Table 16. Family Child Care Tui on Rates
Assump on: Child care subsidy rates vary only by child
age and centers receive the full subsidy amount.
The subsidy rates used in the model are those funded
through the federal Child Care and Development Fund,
Temporary Assistance for Needy Families (TANF), and
state dollars commonly known as NJ Cares for Kids (NJCK)
or WorkFirst New Jersey. These rates are dependent on
the child’s age and have remained unchanged since 2008.
The assump on is that centers collect the full subsidy
amount for each child receiving the subsidy. Table ___
highlights the current subsidy rate and the es mated
cost of tui on at each level of quality.
Table 17. Current Subsidy Rate Compared to Private Tui‐
on Rates
Data was not available to determine the average number
of children receiving a subsidy enrolled per family child
care home; therefore, the base model assumed two of
the five children in the home received a subsidy.
Assump on: The income range of families served by the
family child care provider affects revenue.
The eligibility criteria to receive a subsidy through the
federal Child Care and Development Fund, commonly
known as New Jersey Cares for Kids or WorkFirst New
Jersey, is the same for families seeking a child care center
subsidy. At the me of the ini al applica on, a family’s
income must fall below 200% of the Federal Poverty Lev‐
el and the family meets work/training requirements. A
family’s applica on for the child care subsidy is reviewed
annually. At the me of redetermina on, as long as the
family’s income remains under 250% of the FPL and the
work/training requirement is met, the family con nues
to receive the child care subsidy.
As with child care centers, the propor on of children re‐
ceiving a subsidy and those paying full tui on are varia‐
bles in the calculator. The composi on of tui on and
subsidy revenue can be adjusted to model different situa‐
ons.
Preschool
QRIS
Level
Private
Tui on
Subsidy
Rate
Private
Tui on
Subsidy
Rate
1 $157.85 $154.80 $137.99 $121.60
2 $157.85 $154.80 $146.35 $121.60
3 $167.26 $154.80 $156.80 $121.60
4 $177.71 $154.80 $162.03 $121.60
5 $201.23 $154.80 $182.94 $121.60
Infant/Toddler
2012 Tui on Rates
2016 Tui on Rat
(adjusted for infla on
9/2016)
Infant‐
Toddler Preschool
Infant‐
Toddler Preschool
50th $151.00 $132.00 $157.85 $137.99
60th $151.00 $140.00 $157.85 $146.35
70th $160.00 $150.00 $167.26 $156.80
80th $170.00 $155.00 $177.71 $162.03
90th $192.50 $175.00 $201.23 $182.94
Percen le

22 www.acnj.org
Assump on: Family child care providers par cipate in
the Child and Adult Care Food Program (CACFP).
The federal Child and Adult Care Food Program is availa‐
ble for family child care providers and the base model
used for the calculator assumed all providers par cipated
in the program. Similarly to child care centers, the nutri‐
ous meals and snacks are reimbursed at three different
rates: free meals (highest reimbursement rate), reduced‐
price rate, and the paid meal rate (lowest reimbursement
rate).
Size, Age and Efficiency Factors
Assump on: The number of children and the ages
served affect revenue.
Family child care providers are permi ed to have up to 5
children at one me with only two children under the age
of 12 months per the one caregiver. The child care subsi‐
dy reimbursement is dependent on the child’s age de‐
spite the overall ra o for family child care being 1 to 5.
As a result, family child care providers receive a higher
subsidy rate for infants and toddlers than preschoolers,
but are limited in the number of infants and toddlers
they can enroll which impacts the subsidy revenue
stream.
Although the age and number of children enrolled in a
family child care home impacts the revenue, it is not as
drama c as with child care centers simply because the
ra o and group size is much smaller in family child care
homes.
Assump on: Full enrollment and mely collec on of all
revenue are essen al to a program’s financial stability.
Similarly to child care centers, the financial stability of a
family child care home is dependent on full enrollment
every day, the mely collec on of tui on and fees, and
annual revenues that sufficiently cover annual expenses.
The enrollment efficiency and “bad debt” of a family
child care home are variables in the calculator and can be
altered to reflect different situa ons.
Non‐personnel Expenses
Direct expenses for homes somewhat mirror those in the
child care centers and include items such as educa on
supplies and materials, food, office supplies, telephone
and internet, adver sing, and licenses/permits. Providers
are required to purchase their own benefits such as
health care, life insurance and pension. Actual expense
data collected from the sample was used to inform the
cost model.
As a home‐based business, the provider also considers
part of the expenses of the home (i.e rent/mortgage,
property taxes, renters/homeowners insurance, u li es,
home maintenance) as a business expense. The share of
these expenses that is a ributable to the family child
care business, called the ‘ me‐space percent’ for federal
income tax purposes, is based on the propor on of space
in the home used for child care and the number of hours
per week during which children are present.
Providers in the study group reported using an average of
50% of their homes for child care and an average of 67
hours per week that the home is used for child care. This
results in a me‐space percent of 40% which was applied
to the shared expenses.
Assump on: Scores on the Family Child Care Environ‐
ment Ra ng Scales are related to the presence of spe‐
cific items such as books, science materials, gross motor
equipment, etc.
Higher scores on the FCCERS‐R result in more points ac‐
crued on the Grow NJ Kids scale. Family child care pro‐
viders may have upfront costs associated with purchasing
the specific items, but the ongoing cost to replace the

23 Giving Every Child a Chance
items as needed is included in the annual material/supply
cost in the calculator.
Assump on: Maintaining Levels 3, 4, or 5 requires using a
child assessment system.
Beginning at Level 3, the model includes the cost of a child assessment system. This rate was set at $35.00 per child which represents the average per child cost in most as‐sessment systems.
Base Scenario
The PCQC requires the user create a “base scenario” which
reflects the typical family child care program in New Jer‐
sey. For the purpose of this study, the base scenario incor‐
porated the assump ons men oned above into the model
and also assumed the provider was caring for 1 infant un‐
der 12 months, 2 toddlers ages 12‐30 months, and 2 pre‐
schoolers over 30 months old. Enrollment was set at 85%
and bad debt at 3%. It was also assumed that the number
of children receiving the subsidy was set at 2 and the pro‐
gram was par cipa ng in the Child and Adult Care Food
Program (CACFP).
Findings
1. The typical family child care provider is making a
minimal profit at the end of each year.
As illustrated in figure 16, family child care providers make
a minimal profit at the end of the year.
Figure 16 Net Annual Revenue by Quality Level.
Determining the level of sustainability in a family child care
home is dras cally different than assessing the sustainabil‐
ity in center‐based programs. As illustrated in the first sec‐
on of this report, center‐based programs are opera ng at
a loss each year as the programs climb the levels of Grow
NJ Kids. Although family child care providers are not losing
money each year, the amount of me spent on their busi‐
ness increases which nega vely impacts their hourly rate.
One method of determining the financial sustainability of a
family child care provider is to compare the net revenue
with the salary of a director and/or teacher of a child care
program. The second method is calcula ng the hourly
wage of a family child care provider which looks at the to‐
tal hours worked per year and the net revenue.
Figure 17 represents data from the study’s total sample.
The director and teacher salary are the average salaries
reported for those posi ons in center‐based child care
programs while the family child care salary is the average
net revenue reported by the family child care provider
sample. As an cipated, family child care homes are mak‐
ing an annual salary that pales in comparison to their
counterparts in child care centers.

24 www.acnj.org
Figure 17. Comparison of Annual Salaries
U lizing the second method of determining the sustaina‐
bility of a family child care program, the net revenue of a
family child care home was divided by the average total
number of hours the family child care providers reported
they worked each year. As men oned earlier, the sam‐
ple reported that the providers spent an average of 67
hours per week on their program which equates to 3,484
hours per year. The average number of hours per year
(3,484) was then used to determine the hourly wage of
the family child care provider and the hourly wages of
the director and teacher. As an cipated, the hourly
wage of family child care providers is significantly less
than their counterparts in center‐based programs, but
also do not even reach New Jersey’s minimum wage re‐
quirement. Figure 18 illustrates the great discrepancy in
hourly wages.
Figure 18. Comparison of Hourly Wages for Child Care
Professionals
2. When the number of children receiving a child care
subsidy increased, the net revenue of the program
decreases at the higher levels of GNJK.
The base scenario was then modified to explore varia‐
ons in the composi on of the revenue streams. Figure
19 examines the impact of the par cipa on in the child
care subsidy program and no par cipa on in the Child
and Adult Care Food Program (CACFP). As expected, the
family child care provider’s net revenue is affected dra‐
ma cally and providers make an excep onally low profit
at the end of the year.
Figure 19. Tui on vs Subsidy

25 Giving Every Child a Chance
3. Maximizing enrollment and minimizing bad debt can
help centers sustain quality.
Similar to the outcome in center‐based programs, family
child care providers who are able to mi gate the factors
of the “Iron Triangle” by maintaining full enrollment and
limi ng bad debt are able to increase their net revenue
at the end of the year. Figure 20 looks at the base model
with 85% enrollment compared to 95% enrollment.
Figure 20. Enrollment Efficiency
4. Par cipa on in the Child and Adult Care Food Pro‐
gram can impact a family child care provider’s net
revenue.
Figure 21 examines the importance of par cipa ng in the
Child and Adult Care Food Program. The base model was
used to compare a family child care program that par ci‐
pates in the program with a home that does not par ci‐
pate. Providers stand to gain close to $4,000 annually
from the federal program which helps offset the cost of
providing food to the children.
Figure 21. Importance of CACFP
Conclusion
Results indicate that at current funding levels, most early
care and educa on providers will not be sustainable at
the higher levels of Grow NJ Kids, which is the States defi‐
ni on of quality. For programs that provide care for large
percentages of children, whose families receive a child
care subsidy, a aining quality is even more difficult. Ad‐
di onal funding as well as changes to current policy are
needed to ensure a sustainable high quality child care
system in New Jersey.