Embed Size (px)
Citation preview

Quality Assurance Project Plan
Inland Empire Paper Company
Nutrients and Common Ions
Source Water Study May 2012
Publication No. 12-03-101

Publication Information
Each study conducted by the Washington State Department of Ecology (Ecology) must have an
approved Quality Assurance Project Plan. The plan describes the objectives of the study and the
procedures to be followed to achieve those objectives. After completing the study, Ecology will
post the final report of the study to the Internet.
The plan for this study is available on Ecology’s website at
www.ecy.wa.gov/biblio/1203101.html.
Data for this project will be available on Ecology’s Environmental Information Management
(EIM) website at www.ecy.wa.gov/eim/index.htm. Search User Study ID, JROS0022.
Ecology’s Activity Tracker Code for this study is 13-008.
Waterbody Number: WA-57-1010.
Author and Contact Information
James Ross
P.O. Box 47600
Environmental Assessment Program
Washington State Department of Ecology
Olympia, WA 98504-7710
For more information contact: Communications Consultant, phone 360-407-6834.
Washington State Department of Ecology - www.ecy.wa.gov/
o Headquarters, Olympia 360-407-6000
o Northwest Regional Office, Bellevue 425-649-7000
o Southwest Regional Office, Olympia 360-407-6300
o Central Regional Office, Yakima 509-575-2490
o Eastern Regional Office, Spokane 509-329-3400
Any use of product or firm names in this publication is for descriptive purposes only
and does not imply endorsement by the author or the Department of Ecology.
If you need this document in a format for the visually impaired, call 360-407-6834.
Persons with hearing loss can call 711 for Washington Relay Service.
Persons with a speech disability can call 877- 833-6341.
Page 1
Quality Assurance Project Plan
Inland Empire Paper Company
Nutrients and Common Ions
Source Water Study
May 2012
Approved by:
Signature:
Date: April 2012
Pat Hallinan, Client, Water Quality Program, ERO
Signature: Date: May 2012
Diana Washington, Client’s Unit Supervisor, Water Quality Program, ERO
Signature: Date: April 2012
James Bellatty, Client’s Section Manager, Water Quality Program, ERO
Signature: Date: March 2012
James Ross, Author / Project Manager, Eastern Operations Section, EAP
Signature: Date: March 2012
Gary Arnold, Author’s Unit Supervisor, Eastern Operations Section, EAP
Signature: Date: April 2012
Doug Krapas, Environmental Manager, Inland Empire Paper Company
Signature: Date: March 2012
Dean Momohara, Interim Director, Manchester Environmental Lab, EAP
Signature: Date: March 2012
Bill Kammin, Ecology Quality Assurance Officer
Signature: Date: March 2012
Martha Maggi, Unit Supervisor, Groundwater/Forests & Fish Unit, EAP
Signatures are not available on the Internet version.
ERO: Eastern Regional Office
EAP: Environmental Assessment Program
EIM: Environmental Information Management database
Page 2
Table of Contents
Page
List of Figures and Tables....................................................................................................3
Abstract ................................................................................................................................4
Background and Project Description ...................................................................................4
Organization and Schedule ..................................................................................................7
Data Quality Objectives .......................................................................................................8
Study Design ......................................................................................................................10
Groundwater/Surface Water Interactions ....................................................................12
Water Quality Surveys .................................................................................................13
Field Measurements and Sampling Procedures .................................................................15 Surface Water...............................................................................................................15
Groundwater ................................................................................................................15
Quality Control Procedures................................................................................................18
Field Quality Control ...................................................................................................18 Laboratory Quality Control..........................................................................................19
Data Management Procedures ...........................................................................................19
Audits and Reports .............................................................................................................20
Data Verification and Validation .......................................................................................20
Precision .......................................................................................................................20
Bias ..............................................................................................................................20
Completeness ...............................................................................................................21
Data Quality (Usability) Assessment .................................................................................21
Reporting............................................................................................................................21
References ..........................................................................................................................22
Appendix. Glossary, Acronyms, and Abbreviations ........................................................24
Page 3
List of Figures and Tables
Page
Figures
Figure 1. Inland Empire Paper NCCW study vicinity map. ...............................................5
Figure 2. IEP NCCW study project area. ..........................................................................10
Figure 3. Orthophoto view of IEP facility showing NCCW supply well and upstream
river sampling location. ......................................................................................11
Figure 4. Instream piezometer conceptual diagram ..........................................................13
Figure 5. Schematic of the apparatus typically used for supply well purging and
sample collection (after Marti, 2011). ................................................................16
Tables
Table 1. Organization of project staff and responsibilities. ................................................7
Table 2. Proposed schedule for field and laboratory work, data entry, and reports. ..........8
Table 3. Data quality objectives..........................................................................................9
Table 4. Measurement quality objectives for Hydrolab post-deployment checks ..............9
Table 5. Sampling schedule. .............................................................................................14
Table 6. Project cost estimate. ..........................................................................................14
Table 7. Sample containers, preservation, and holding times. ..........................................17
Table 8. Field and laboratory quality control samples. .....................................................19
.
.

Page 4
Abstract
The Washington State Department of Ecology (Ecology) will sample and analyze water from the
Spokane River and the Inland Empire Paper Company’s (IEP’s) supply well to determine if an
allowance for phosphorus from the well water is merited.
The purpose of this study is to determine whether the cooling water extracted by the IEP supply
well is chemically similar to Spokane River water in the vicinity of IEP. To accomplish this
task, Ecology will:
Collect and analyze water samples from the IEP supply well, Spokane River, and instream
piezometers for one year.
Characterize the direction and magnitude of the hydraulic connection between the Spokane
River and underlying aquifer at the IEP facility.
Perform an evaluation of the study water quality results based on the river/aquifer
interactions.
Samples will be analyzed for pH, dissolved oxygen, conductivity, temperature, alkalinity, anions,
and cations.
Ecology’s Water Quality Program, Eastern Regional Office, asked Ecology’s Environmental
Assessment Program to conduct this sampling and analysis.
Background and Project Description
In May 2010, the U.S. Environmental Protection Agency (EPA) approved a dissolved oxygen
(DO) total maximum dissolved load (TMDL) assessment for Lake Spokane1 and the Spokane
River. Both the lake and river have a history of DO problems, particularly during April to
October when streamflow is typically lowest. These problems originate from nutrient inputs,
especially phosphorus, which cause excessive aquatic plant growth that contributes to depressed
DO concentrations in the lake (Cusimano, 2004).
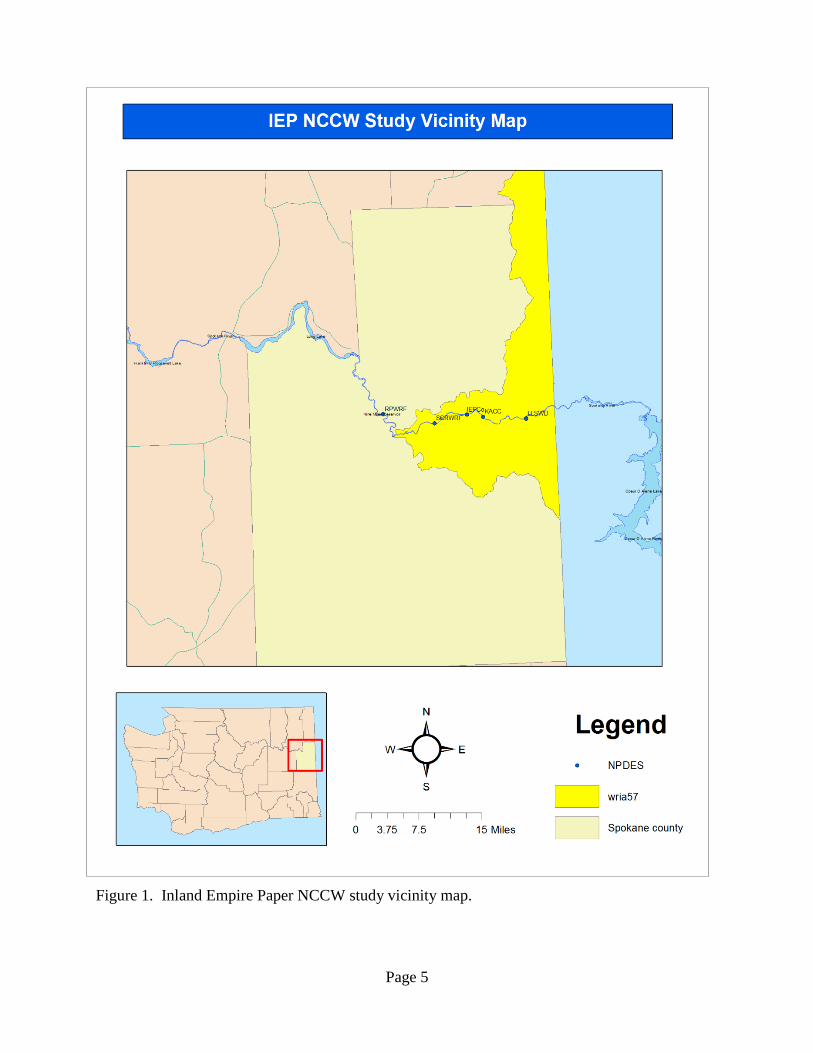
To support implementation of the Spokane River TMDL, Ecology has issued discharge permits
with wasteload allocations for five permitted facilities (Figure 1) that discharge to the Spokane
River between Lake Spokane and the Washington-Idaho border:
The City of Spokane Advanced Wastewater Treatment Plant (AWWTP)
The Liberty Lake Sewer and Water District (LLSWD).
The Kaiser Aluminum Industrial Wastewater Treatment Plant (KACC), at Trentwood.
The new Spokane County Regional Water Reclamation Facility (SCRWRF).
The Inland Empire Paper (IEP) Company Inland Wastewater Treatment Plant, at Millwood.
1 Lake Spokane (also known as Long Lake) is a 24-mile long reservoir west of the City of Spokane that was created
when a hydroelectric dam was constructed at river mile (RM) 33.9 on the Spokane River.
Page 5
Figure 1. Inland Empire Paper NCCW study vicinity map.
Page 6
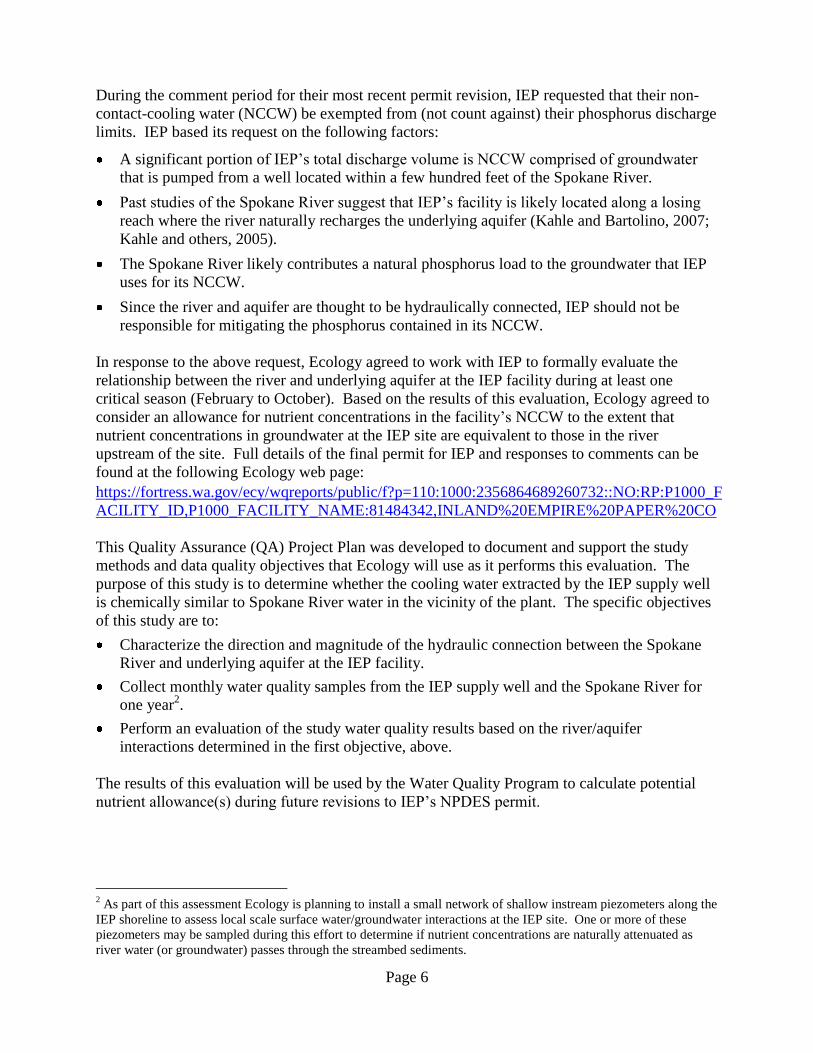
During the comment period for their most recent permit revision, IEP requested that their non-
contact-cooling water (NCCW) be exempted from (not count against) their phosphorus discharge
limits. IEP based its request on the following factors:
A significant portion of IEP’s total discharge volume is NCCW comprised of groundwater
that is pumped from a well located within a few hundred feet of the Spokane River.
Past studies of the Spokane River suggest that IEP’s facility is likely located along a losing
reach where the river naturally recharges the underlying aquifer (Kahle and Bartolino, 2007;
Kahle and others, 2005).
The Spokane River likely contributes a natural phosphorus load to the groundwater that IEP
uses for its NCCW.
Since the river and aquifer are thought to be hydraulically connected, IEP should not be
responsible for mitigating the phosphorus contained in its NCCW.
In response to the above request, Ecology agreed to work with IEP to formally evaluate the
relationship between the river and underlying aquifer at the IEP facility during at least one
critical season (February to October). Based on the results of this evaluation, Ecology agreed to
consider an allowance for nutrient concentrations in the facility’s NCCW to the extent that
nutrient concentrations in groundwater at the IEP site are equivalent to those in the river
upstream of the site. Full details of the final permit for IEP and responses to comments can be
found at the following Ecology web page:
https://fortress.wa.gov/ecy/wqreports/public/f?p=110:1000:2356864689260732::NO:RP:P1000_F
ACILITY_ID,P1000_FACILITY_NAME:81484342,INLAND%20EMPIRE%20PAPER%20CO
This Quality Assurance (QA) Project Plan was developed to document and support the study
methods and data quality objectives that Ecology will use as it performs this evaluation. The
purpose of this study is to determine whether the cooling water extracted by the IEP supply well
is chemically similar to Spokane River water in the vicinity of the plant. The specific objectives
of this study are to:
Characterize the direction and magnitude of the hydraulic connection between the Spokane
River and underlying aquifer at the IEP facility.
Collect monthly water quality samples from the IEP supply well and the Spokane River for
one year2.
Perform an evaluation of the study water quality results based on the river/aquifer
interactions determined in the first objective, above.
The results of this evaluation will be used by the Water Quality Program to calculate potential
nutrient allowance(s) during future revisions to IEP’s NPDES permit.
2 As part of this assessment Ecology is planning to install a small network of shallow instream piezometers along the
IEP shoreline to assess local scale surface water/groundwater interactions at the IEP site. One or more of these
piezometers may be sampled during this effort to determine if nutrient concentrations are naturally attenuated as
river water (or groundwater) passes through the streambed sediments.
Page 7
Organization and Schedule
Table 1 lists the key people involved in this project and their responsibilities. Additional
Ecology staff will be involved with field support, QA Project Plan and report reviews, and
technical assistance as needed. The proposed project schedule is detailed in Table 2.
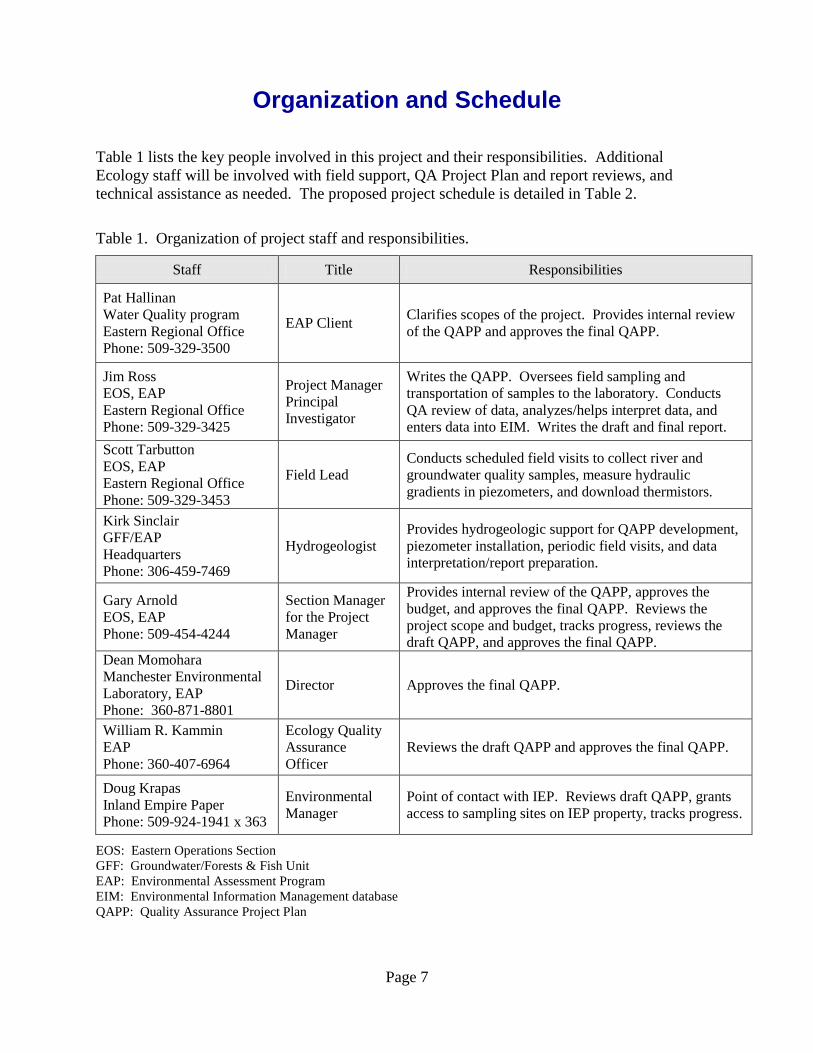
Table 1. Organization of project staff and responsibilities.
Staff Title Responsibilities
Pat Hallinan
Water Quality program
Eastern Regional Office
Phone: 509-329-3500
EAP Client Clarifies scopes of the project. Provides internal review
of the QAPP and approves the final QAPP.
Jim Ross
EOS, EAP
Eastern Regional Office
Phone: 509-329-3425
Project Manager
Principal
Investigator
Writes the QAPP. Oversees field sampling and
transportation of samples to the laboratory. Conducts
QA review of data, analyzes/helps interpret data, and
enters data into EIM. Writes the draft and final report.
Scott Tarbutton
EOS, EAP
Eastern Regional Office
Phone: 509-329-3453
Field Lead
Conducts scheduled field visits to collect river and
groundwater quality samples, measure hydraulic
gradients in piezometers, and download thermistors.
Kirk Sinclair
GFF/EAP
Headquarters
Phone: 306-459-7469
Hydrogeologist
Provides hydrogeologic support for QAPP development,
piezometer installation, periodic field visits, and data
interpretation/report preparation.
Gary Arnold
EOS, EAP
Phone: 509-454-4244
Section Manager
for the Project
Manager
Provides internal review of the QAPP, approves the
budget, and approves the final QAPP. Reviews the
project scope and budget, tracks progress, reviews the
draft QAPP, and approves the final QAPP.
Dean Momohara
Manchester Environmental
Laboratory, EAP
Phone: 360-871-8801
Director Approves the final QAPP.
William R. Kammin
EAP
Phone: 360-407-6964
Ecology Quality
Assurance
Officer
Reviews the draft QAPP and approves the final QAPP.
Doug Krapas
Inland Empire Paper
Phone: 509-924-1941 x 363
Environmental
Manager
Point of contact with IEP. Reviews draft QAPP, grants
access to sampling sites on IEP property, tracks progress.
EOS: Eastern Operations Section
GFF: Groundwater/Forests & Fish Unit
EAP: Environmental Assessment Program
EIM: Environmental Information Management database
QAPP: Quality Assurance Project Plan
Page 8
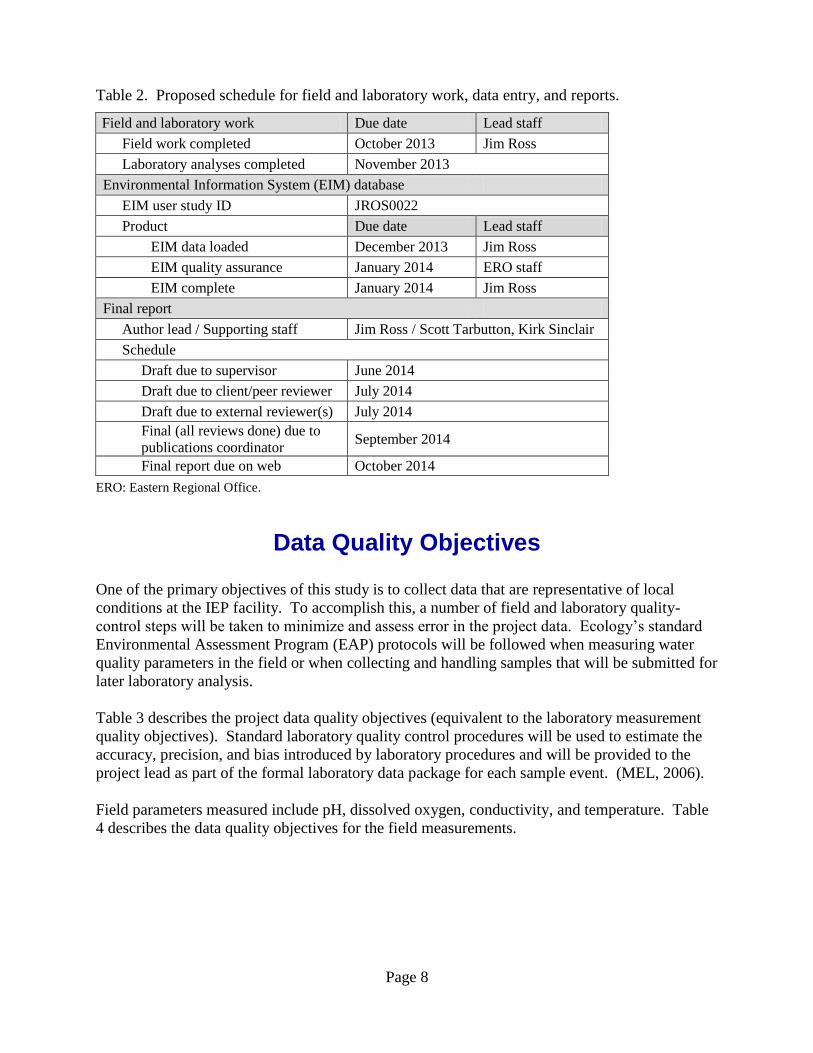
Table 2. Proposed schedule for field and laboratory work, data entry, and reports.
Field and laboratory work Due date Lead staff
Field work completed October 2013 Jim Ross
Laboratory analyses completed November 2013
Environmental Information System (EIM) database
EIM user study ID JROS0022
Product Due date Lead staff
EIM data loaded December 2013 Jim Ross
EIM quality assurance January 2014 ERO staff
EIM complete January 2014 Jim Ross
Final report
Author lead / Supporting staff Jim Ross / Scott Tarbutton, Kirk Sinclair
Schedule
Draft due to supervisor June 2014
Draft due to client/peer reviewer July 2014
Draft due to external reviewer(s) July 2014
Final (all reviews done) due to
publications coordinator September 2014
Final report due on web October 2014
ERO: Eastern Regional Office.
Data Quality Objectives
One of the primary objectives of this study is to collect data that are representative of local
conditions at the IEP facility. To accomplish this, a number of field and laboratory quality-
control steps will be taken to minimize and assess error in the project data. Ecology’s standard
Environmental Assessment Program (EAP) protocols will be followed when measuring water
quality parameters in the field or when collecting and handling samples that will be submitted for
later laboratory analysis.
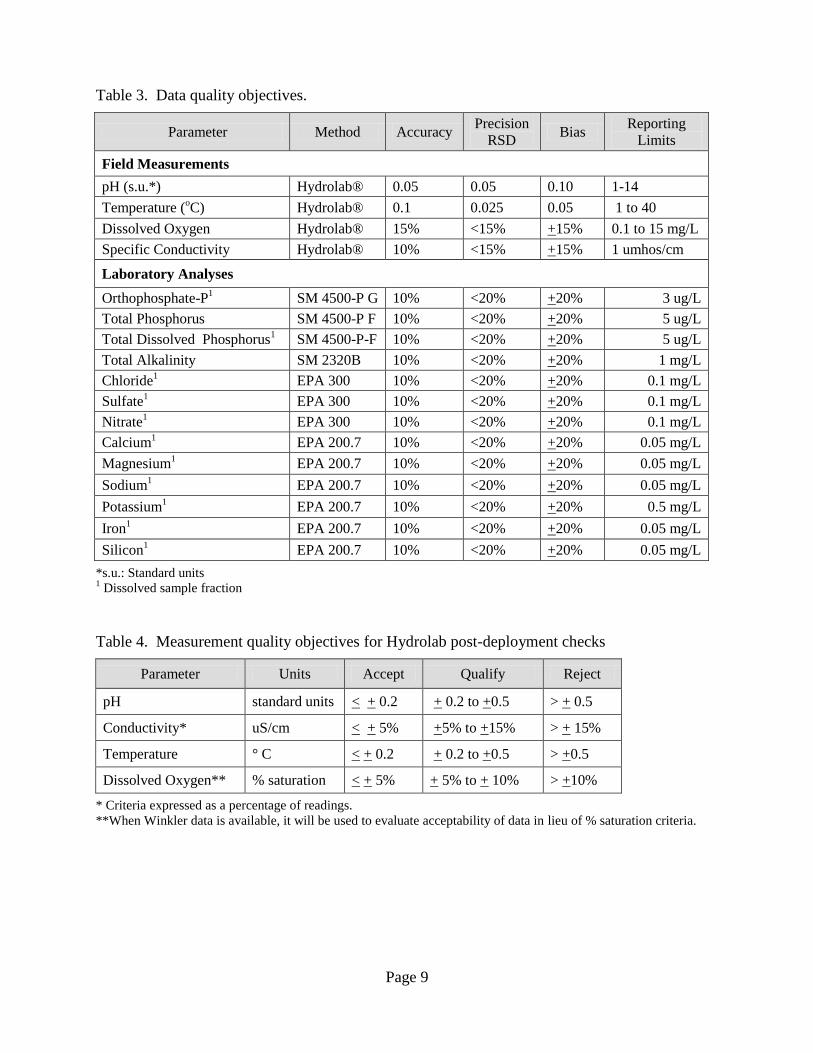
Table 3 describes the project data quality objectives (equivalent to the laboratory measurement
quality objectives). Standard laboratory quality control procedures will be used to estimate the
accuracy, precision, and bias introduced by laboratory procedures and will be provided to the
project lead as part of the formal laboratory data package for each sample event. (MEL, 2006).
Field parameters measured include pH, dissolved oxygen, conductivity, and temperature. Table
4 describes the data quality objectives for the field measurements.
Page 9
Table 3. Data quality objectives.
Parameter Method Accuracy Precision
RSD Bias
Reporting
Limits
Field Measurements
pH (s.u.*) Hydrolab® 0.05 0.05 0.10 1-14
Temperature (oC) Hydrolab® 0.1 0.025 0.05 1 to 40
Dissolved Oxygen Hydrolab® 15% <15% +15% 0.1 to 15 mg/L
Specific Conductivity Hydrolab® 10% <15% +15% 1 umhos/cm
Laboratory Analyses
Orthophosphate-P1 SM 4500-P G 10% <20% +20% 3 ug/L
Total Phosphorus SM 4500-P F 10% <20% +20% 5 ug/L
Total Dissolved Phosphorus1 SM 4500-P-F 10% <20% +20% 5 ug/L
Total Alkalinity SM 2320B 10% <20% +20% 1 mg/L
Chloride1 EPA 300 10% <20% +20% 0.1 mg/L
Sulfate1 EPA 300 10% <20% +20% 0.1 mg/L
Nitrate1 EPA 300 10% <20% +20% 0.1 mg/L
Calcium1 EPA 200.7 10% <20% +20% 0.05 mg/L
Magnesium1 EPA 200.7 10% <20% +20% 0.05 mg/L
Sodium1 EPA 200.7 10% <20% +20% 0.05 mg/L
Potassium1 EPA 200.7 10% <20% +20% 0.5 mg/L
Iron1 EPA 200.7 10% <20% +20% 0.05 mg/L
Silicon1 EPA 200.7 10% <20% +20% 0.05 mg/L
*s.u.: Standard units 1 Dissolved sample fraction
Table 4. Measurement quality objectives for Hydrolab post-deployment checks
Parameter Units Accept Qualify Reject
pH standard units < + 0.2 + 0.2 to +0.5 > + 0.5
Conductivity* uS/cm < + 5% +5% to +15% > + 15%
Temperature ° C < + 0.2 + 0.2 to +0.5 > +0.5 Dissolved Oxygen** % saturation < + 5% + 5% to + 10% > +10%
* Criteria expressed as a percentage of readings.
**When Winkler data is available, it will be used to evaluate acceptability of data in lieu of % saturation criteria.
Page 10
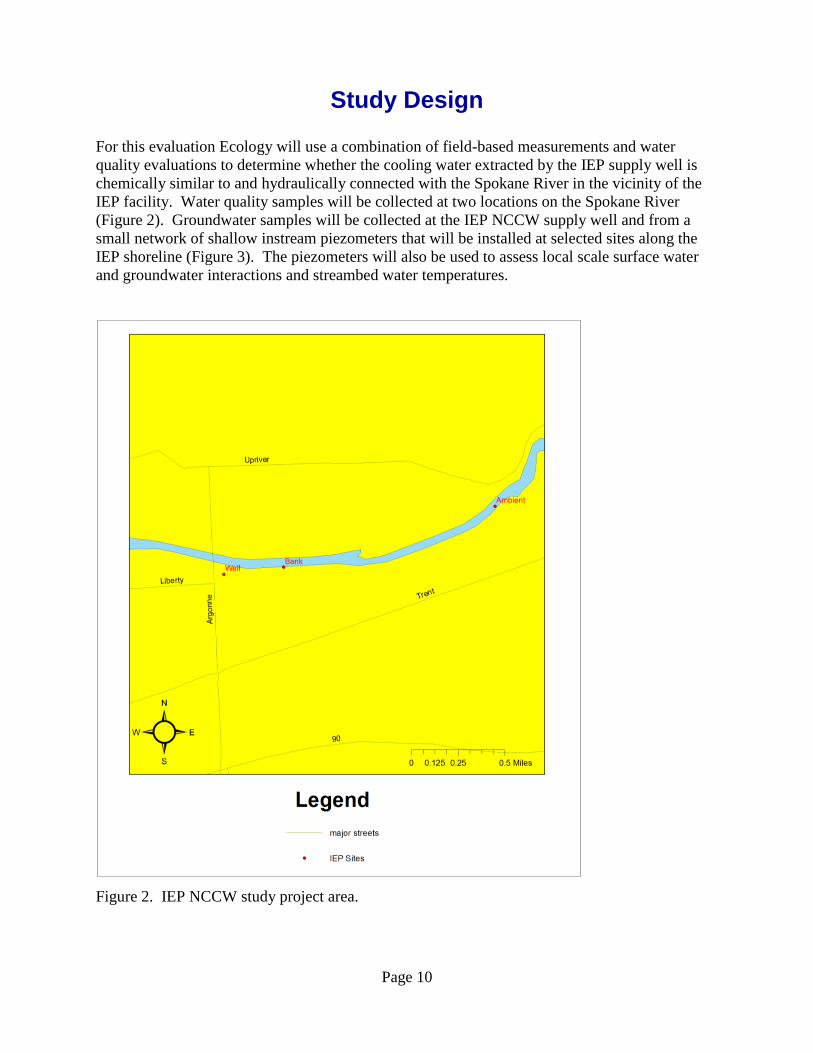
Study Design
For this evaluation Ecology will use a combination of field-based measurements and water
quality evaluations to determine whether the cooling water extracted by the IEP supply well is
chemically similar to and hydraulically connected with the Spokane River in the vicinity of the
IEP facility. Water quality samples will be collected at two locations on the Spokane River
(Figure 2). Groundwater samples will be collected at the IEP NCCW supply well and from a
small network of shallow instream piezometers that will be installed at selected sites along the
IEP shoreline (Figure 3). The piezometers will also be used to assess local scale surface water
and groundwater interactions and streambed water temperatures.
Figure 2. IEP NCCW study project area.
Page 11
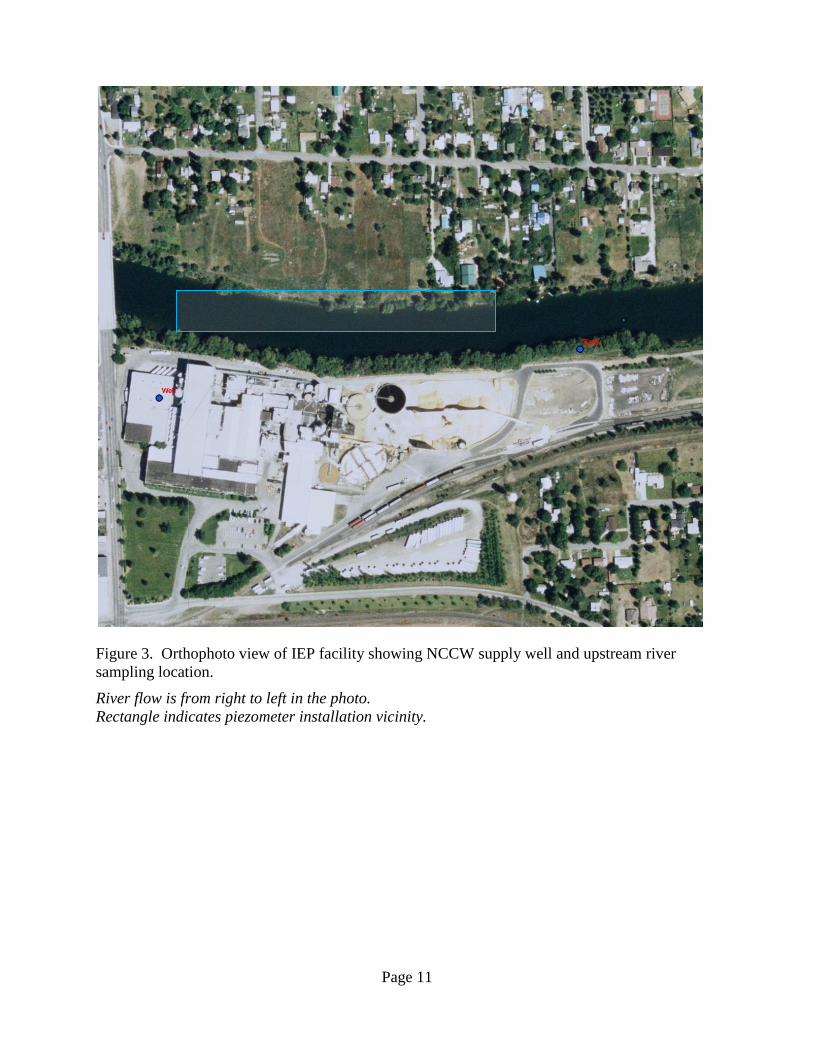
Figure 3. Orthophoto view of IEP facility showing NCCW supply well and upstream river
sampling location.
River flow is from right to left in the photo.
Rectangle indicates piezometer installation vicinity.
Page 12
Groundwater/Surface Water Interactions
Groundwater and surface-water interactions at the IEP site will be evaluated using a combination
of common field techniques. If site conditions permit, hand-driven instream piezometers will be
installed along the Spokane River in July, 2012 at 3 to 5 sites along the IEP shoreline. The
piezometers will be installed in accordance with standard EAP methodology (Sinclair and Pitz,
2010). The piezometers will be used to monitor surface-water and groundwater head
relationships, streambed water temperatures, and near-stream groundwater quality.
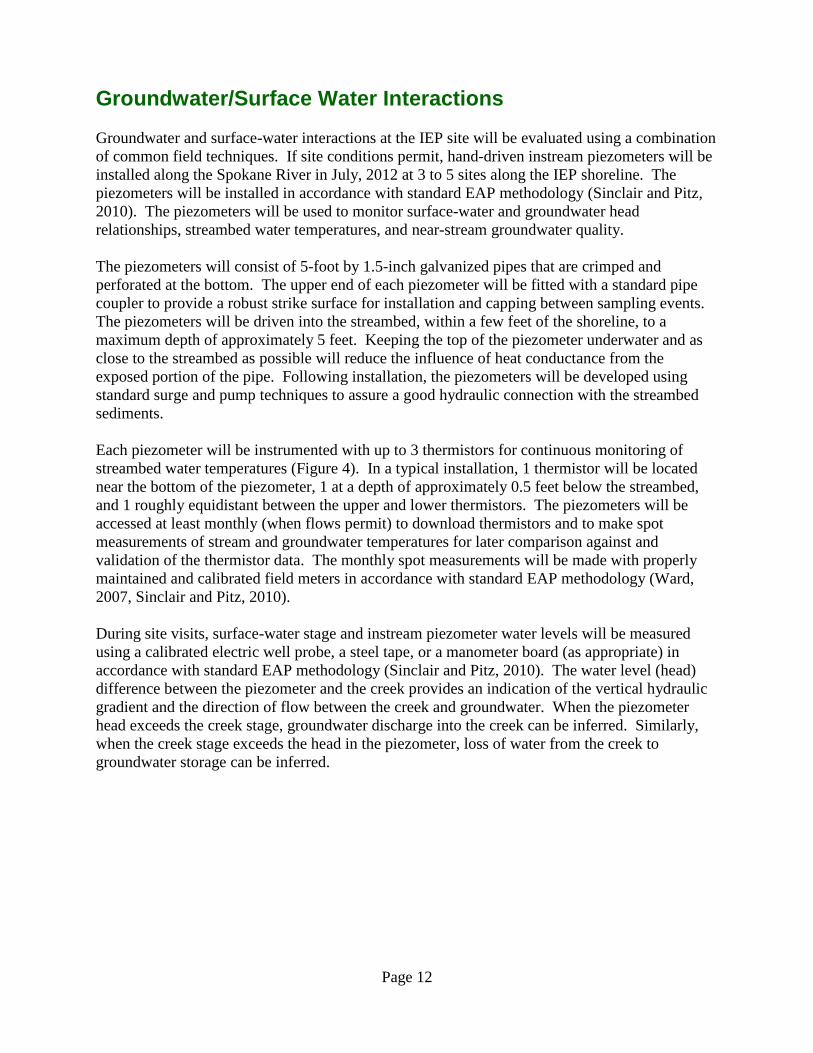
The piezometers will consist of 5-foot by 1.5-inch galvanized pipes that are crimped and
perforated at the bottom. The upper end of each piezometer will be fitted with a standard pipe
coupler to provide a robust strike surface for installation and capping between sampling events.
The piezometers will be driven into the streambed, within a few feet of the shoreline, to a
maximum depth of approximately 5 feet. Keeping the top of the piezometer underwater and as
close to the streambed as possible will reduce the influence of heat conductance from the
exposed portion of the pipe. Following installation, the piezometers will be developed using
standard surge and pump techniques to assure a good hydraulic connection with the streambed
sediments.
Each piezometer will be instrumented with up to 3 thermistors for continuous monitoring of
streambed water temperatures (Figure 4). In a typical installation, 1 thermistor will be located
near the bottom of the piezometer, 1 at a depth of approximately 0.5 feet below the streambed,
and 1 roughly equidistant between the upper and lower thermistors. The piezometers will be
accessed at least monthly (when flows permit) to download thermistors and to make spot
measurements of stream and groundwater temperatures for later comparison against and
validation of the thermistor data. The monthly spot measurements will be made with properly
maintained and calibrated field meters in accordance with standard EAP methodology (Ward,
2007, Sinclair and Pitz, 2010).
During site visits, surface-water stage and instream piezometer water levels will be measured
using a calibrated electric well probe, a steel tape, or a manometer board (as appropriate) in
accordance with standard EAP methodology (Sinclair and Pitz, 2010). The water level (head)
difference between the piezometer and the creek provides an indication of the vertical hydraulic
gradient and the direction of flow between the creek and groundwater. When the piezometer
head exceeds the creek stage, groundwater discharge into the creek can be inferred. Similarly,
when the creek stage exceeds the head in the piezometer, loss of water from the creek to
groundwater storage can be inferred.
Page 13
Figure 4. Instream piezometer conceptual diagram
Diagram not to scale.
Water Quality Surveys For this assessment Ecology will conduct monthly water quality sampling at 2 sites on the
Spokane River from April 2012 through October 2013. One site will be near the firehouse intake
at the eastern end of the IEP property. The second site will be approximately 1.2 miles up-river
of IEP at the Ecology ambient monitoring station at the centennial trail bridge downstream of
Plantes Ferry Park.
Backwater effects from the up-river dam (located downstream of IEP) may make it difficult to
collect representative surface-water samples from the river bank at IEP during low flows. To
assess potential backwater effects we will initially sample both river sites (IEP and the ambient
station) to ensure the IEP bank samples are reasonable and representative of local conditions and
thus usable for this evaluation.
Groundwater samples will be collected during the monthly surveys from the IEP NCCW supply
well. If conditions allow, water quality samples will also be collected from up to 3 of the project
instream piezometers to assess the quality of near-stream groundwater as it enters or leaves the
river.
2-piece galvanized-pipe
piezometer (shown with
2 foot upper section
coupled to 5 foot lower
section)
Stream surface
Streambed surface
Midpoint of perforations
dl
dh
Water level in piezometer
(diagram not to scale)
Piezometer cap
Instream thermistor
2-piece galvanized-pipe
piezometer (shown with
2 foot upper section
coupled to 5 foot lower
section)
Stream surface
Streambed surface
Midpoint of perforations
dl
dh
Water level in piezometer
(diagram not to scale)
Piezometer cap
Instream thermistor
Page 14
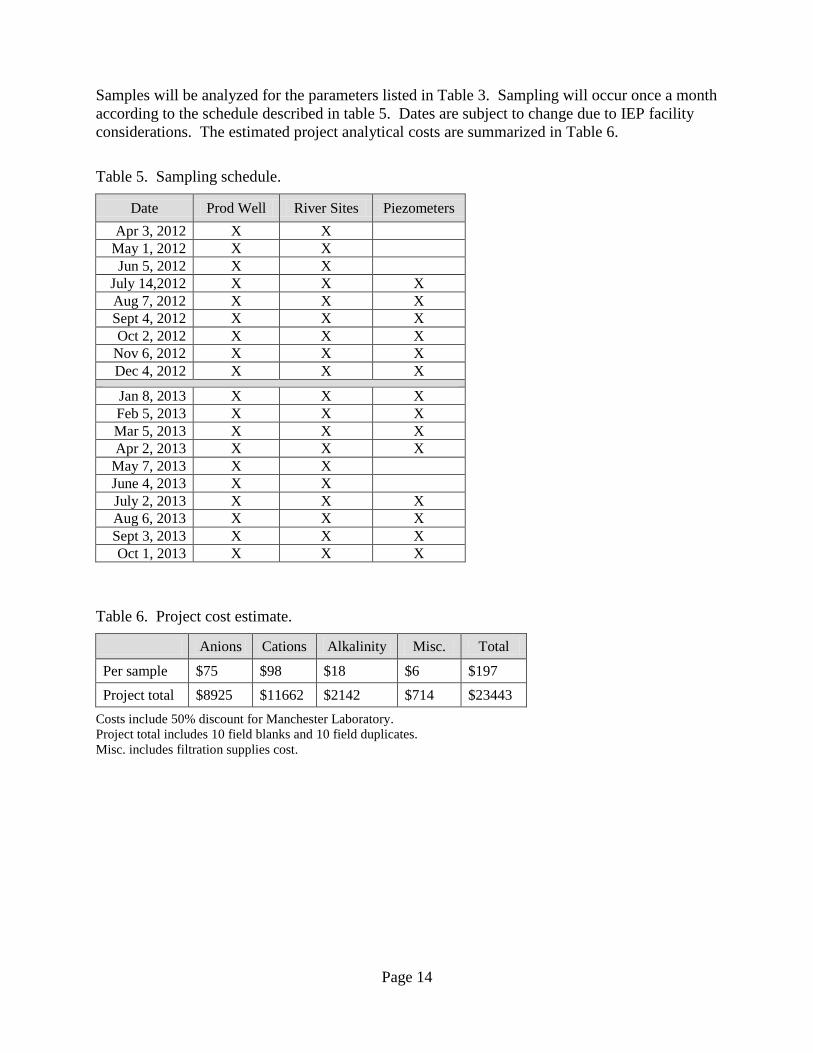
Samples will be analyzed for the parameters listed in Table 3. Sampling will occur once a month
according to the schedule described in table 5. Dates are subject to change due to IEP facility
considerations. The estimated project analytical costs are summarized in Table 6.
Table 5. Sampling schedule.
Date Prod Well River Sites Piezometers
Apr 3, 2012 X X
May 1, 2012 X X
Jun 5, 2012 X X
July 14,2012 X X X
Aug 7, 2012 X X X
Sept 4, 2012 X X X
Oct 2, 2012 X X X
Nov 6, 2012 X X X
Dec 4, 2012 X X X
Jan 8, 2013 X X X
Feb 5, 2013 X X X
Mar 5, 2013 X X X
Apr 2, 2013 X X X
May 7, 2013 X X
June 4, 2013 X X
July 2, 2013 X X X
Aug 6, 2013 X X X
Sept 3, 2013 X X X
Oct 1, 2013 X X X
Table 6. Project cost estimate.
Anions Cations Alkalinity Misc. Total
Per sample $75 $98 $18 $6 $197
Project total $8925 $11662 $2142 $714 $23443
Costs include 50% discount for Manchester Laboratory.
Project total includes 10 field blanks and 10 field duplicates.
Misc. includes filtration supplies cost.
Page 15
Field Measurements and Sampling Procedures
Each of the project monitoring sites will be field located via handheld GPS units (where
possible) and on paper orthophotos for subsequent analysis and plotting of locations using GIS
software (Janisch, 2006). The paper orthophoto locations will be used as a secondary in-office
confirmation of GPS-derived site coordinates. All monitoring locations will be described and
documented in the field data sheets for each site.
Surface Water
Surface water samples will be collected from the river bank at IEP using a peristaltic pump and
laboratory grade ¼-inch inside diameter (ID) polyethylene tubing. To facilitate deployment, the
polyethylene tubing will be temporarily inserted into a piece of rigid PVC pipe to enable the
intake end of the tubing to be safely extended several feet beyond the river bank and into the
river. Samples at the ambient station will be collected from the bridge midstream using a rope
and standard ambient sampling protocols (Joy, 2006; Ward, 2007). A Hydrolab DataSonde® ®
will be used at both sites to measure the river water temperature, pH, conductivity, and DO
concentrations (Swanson, 2007).
Groundwater
If conditions permit, groundwater levels will be measured at the IEP study well and project
piezometers prior to purging and sampling. Water levels will be measured using a calibrated
electric well probe or a steel tape (Marti, 2011). The piezometers will be measured using
Ecology’s standard operating procedures (Sinclair and Pitz, 2010).
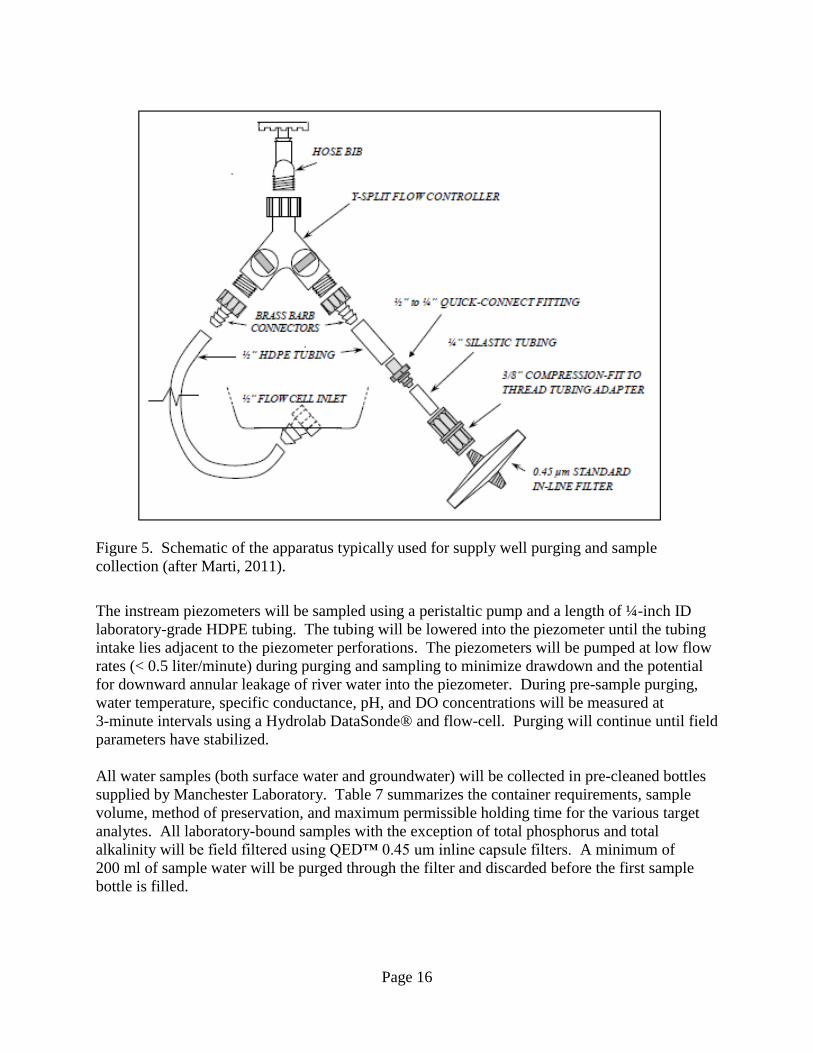
To sample the IEP NCCW supply well, a clean plastic Y-splitter will be attached to a hose bib
that is located ahead of any water treatment or filtration that could potentially influence the water
quality parameters of interest. One channel of the Y-splitter will be used to direct water to a
Hydrolab DataSonde® ®
with attached closed-atmosphere low cell (Figure 5). The water
temperature, pH, DO concentration, and specific conductance will be measured while the well
and hose bib supply lines are purged of standing water. Field parameters will be measured and
recorded at approximately 3-minute intervals during purging. Purging will continue until field
parameters have stabilized3. When purging is complete, the second channel of the Y-splitter will
be used to collect water either directly into analyte-specific sample containers in the case of
unfiltered samples or to route water through an in-line filter for collection of dissolved analytes
(Figure 5). Sampling personnel will follow Ecology’s standard operating procedures for
sampling water supply wells when conducting this work (Marti, 2011).
3 Stabilization is defined as less than a 10% difference between successive 3-minute measurement periods for all
field parameters.
Page 16
Figure 5. Schematic of the apparatus typically used for supply well purging and sample
collection (after Marti, 2011).
The instream piezometers will be sampled using a peristaltic pump and a length of ¼-inch ID
laboratory-grade HDPE tubing. The tubing will be lowered into the piezometer until the tubing
intake lies adjacent to the piezometer perforations. The piezometers will be pumped at low flow
rates (< 0.5 liter/minute) during purging and sampling to minimize drawdown and the potential
for downward annular leakage of river water into the piezometer. During pre-sample purging,
water temperature, specific conductance, pH, and DO concentrations will be measured at
3-minute intervals using a Hydrolab DataSonde® and flow-cell. Purging will continue until field
parameters have stabilized.
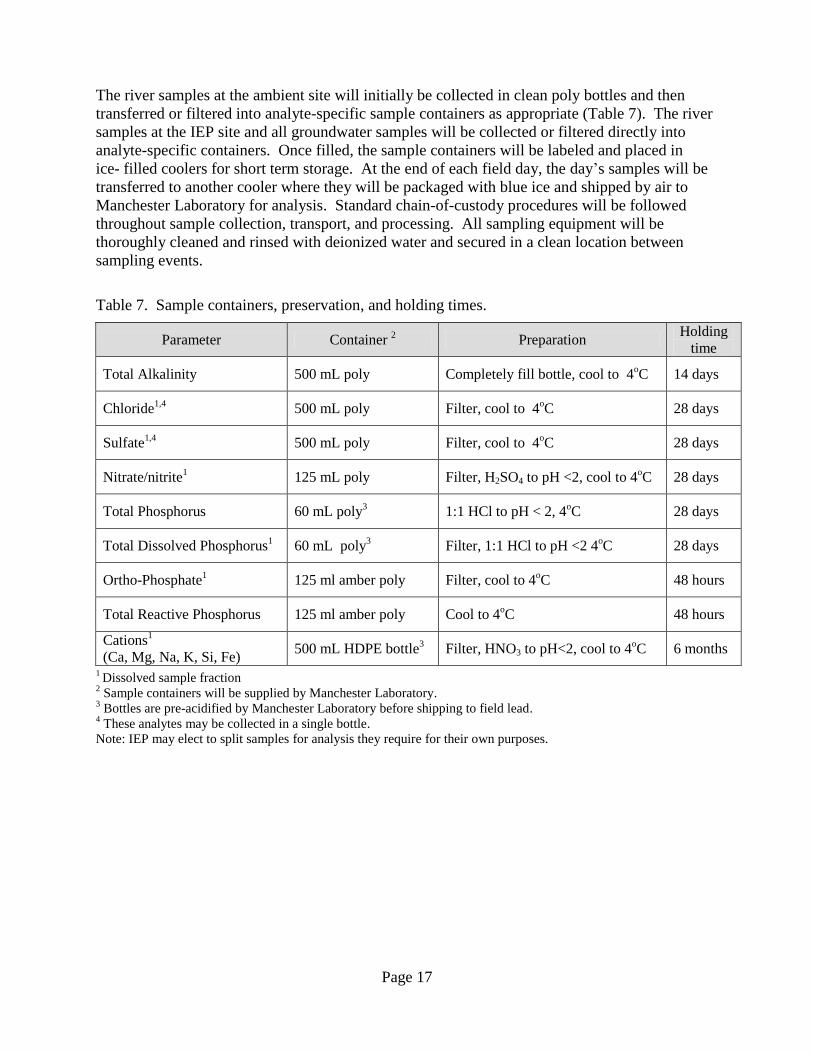
All water samples (both surface water and groundwater) will be collected in pre-cleaned bottles
supplied by Manchester Laboratory. Table 7 summarizes the container requirements, sample
volume, method of preservation, and maximum permissible holding time for the various target
analytes. All laboratory-bound samples with the exception of total phosphorus and total
alkalinity will be field filtered using QED™ 0.45 um inline capsule filters. A minimum of
200 ml of sample water will be purged through the filter and discarded before the first sample
bottle is filled.
Page 17
The river samples at the ambient site will initially be collected in clean poly bottles and then
transferred or filtered into analyte-specific sample containers as appropriate (Table 7). The river
samples at the IEP site and all groundwater samples will be collected or filtered directly into
analyte-specific containers. Once filled, the sample containers will be labeled and placed in
ice- filled coolers for short term storage. At the end of each field day, the day’s samples will be
transferred to another cooler where they will be packaged with blue ice and shipped by air to
Manchester Laboratory for analysis. Standard chain-of-custody procedures will be followed
throughout sample collection, transport, and processing. All sampling equipment will be
thoroughly cleaned and rinsed with deionized water and secured in a clean location between
sampling events.
Table 7. Sample containers, preservation, and holding times.
Parameter Container 2 Preparation
Holding
time
Total Alkalinity 500 mL poly Completely fill bottle, cool to 4oC 14 days
Chloride1,4
500 mL poly Filter, cool to 4oC 28 days
Sulfate1,4
500 mL poly Filter, cool to 4oC 28 days
Nitrate/nitrite1 125 mL poly Filter, H2SO4 to pH <2, cool to 4
oC 28 days
Total Phosphorus 60 mL poly3 1:1 HCl to pH < 2, 4
oC 28 days
Total Dissolved Phosphorus1 60 mL poly
3 Filter, 1:1 HCl to pH <2 4
oC 28 days
Ortho-Phosphate1 125 ml amber poly Filter, cool to 4
oC 48 hours
Total Reactive Phosphorus 125 ml amber poly Cool to 4oC 48 hours
Cations1
(Ca, Mg, Na, K, Si, Fe) 500 mL HDPE bottle
3 Filter, HNO3 to pH<2, cool to 4
oC 6 months
1 Dissolved sample fraction
2 Sample containers will be supplied by Manchester Laboratory.
3 Bottles are pre-acidified by Manchester Laboratory before shipping to field lead.
4 These analytes may be collected in a single bottle.
Note: IEP may elect to split samples for analysis they require for their own purposes.
Page 18
Quality Control Procedures
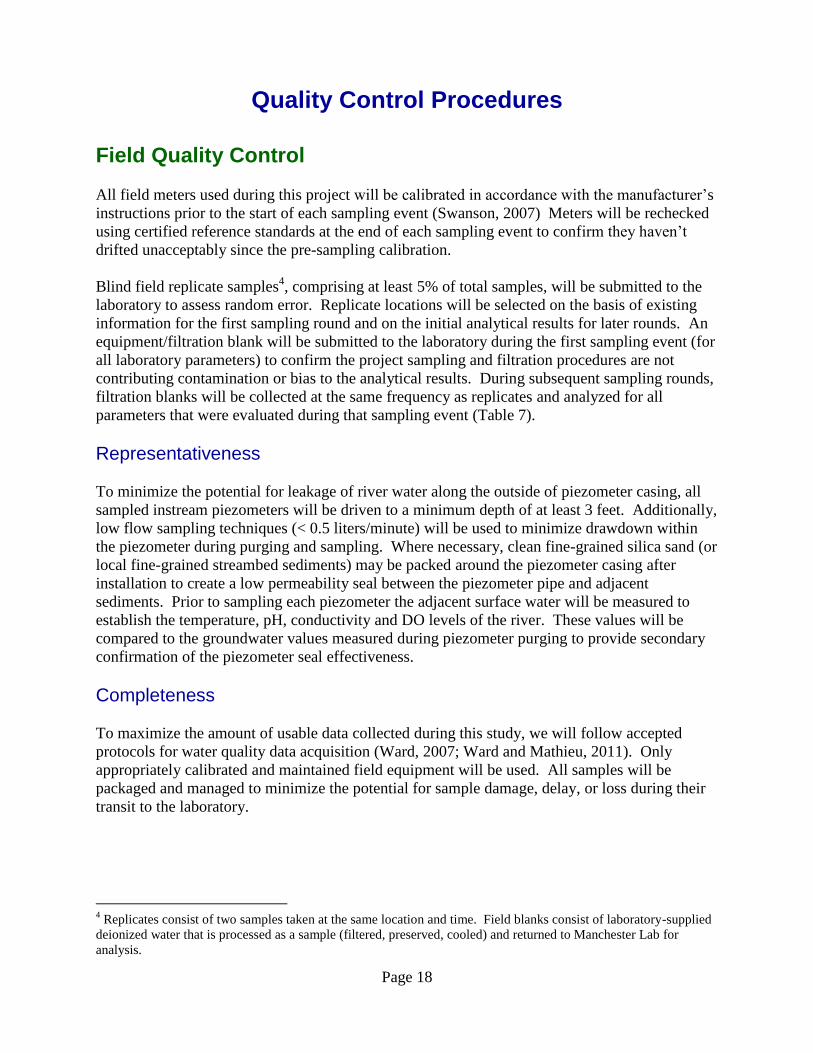
Field Quality Control
All field meters used during this project will be calibrated in accordance with the manufacturer’s
instructions prior to the start of each sampling event (Swanson, 2007) Meters will be rechecked
using certified reference standards at the end of each sampling event to confirm they haven’t
drifted unacceptably since the pre-sampling calibration.
Blind field replicate samples4, comprising at least 5% of total samples, will be submitted to the
laboratory to assess random error. Replicate locations will be selected on the basis of existing
information for the first sampling round and on the initial analytical results for later rounds. An
equipment/filtration blank will be submitted to the laboratory during the first sampling event (for
all laboratory parameters) to confirm the project sampling and filtration procedures are not
contributing contamination or bias to the analytical results. During subsequent sampling rounds,
filtration blanks will be collected at the same frequency as replicates and analyzed for all
parameters that were evaluated during that sampling event (Table 7).
Representativeness
To minimize the potential for leakage of river water along the outside of piezometer casing, all
sampled instream piezometers will be driven to a minimum depth of at least 3 feet. Additionally,
low flow sampling techniques (< 0.5 liters/minute) will be used to minimize drawdown within
the piezometer during purging and sampling. Where necessary, clean fine-grained silica sand (or
local fine-grained streambed sediments) may be packed around the piezometer casing after
installation to create a low permeability seal between the piezometer pipe and adjacent
sediments. Prior to sampling each piezometer the adjacent surface water will be measured to
establish the temperature, pH, conductivity and DO levels of the river. These values will be
compared to the groundwater values measured during piezometer purging to provide secondary
confirmation of the piezometer seal effectiveness.
Completeness
To maximize the amount of usable data collected during this study, we will follow accepted
protocols for water quality data acquisition (Ward, 2007; Ward and Mathieu, 2011). Only
appropriately calibrated and maintained field equipment will be used. All samples will be
packaged and managed to minimize the potential for sample damage, delay, or loss during their
transit to the laboratory.
4 Replicates consist of two samples taken at the same location and time. Field blanks consist of laboratory-supplied
deionized water that is processed as a sample (filtered, preserved, cooled) and returned to Manchester Lab for
analysis.
Page 19
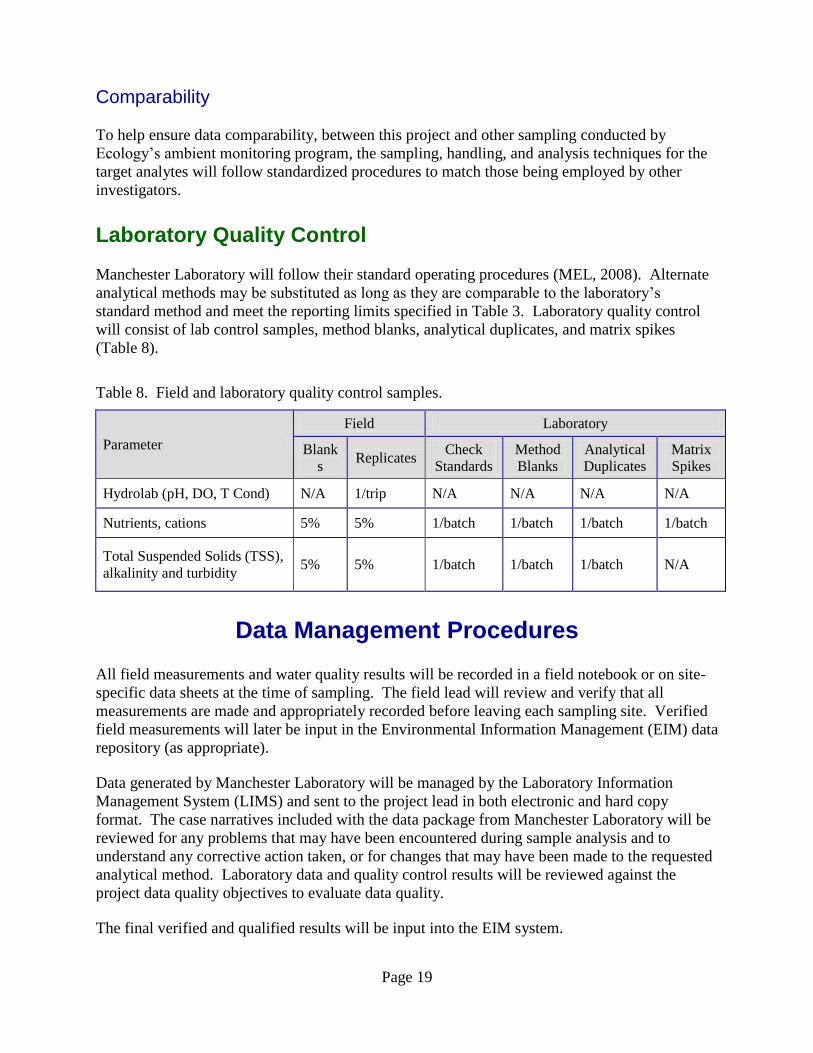
Comparability
To help ensure data comparability, between this project and other sampling conducted by
Ecology’s ambient monitoring program, the sampling, handling, and analysis techniques for the
target analytes will follow standardized procedures to match those being employed by other
investigators.
Laboratory Quality Control
Manchester Laboratory will follow their standard operating procedures (MEL, 2008). Alternate
analytical methods may be substituted as long as they are comparable to the laboratory’s
standard method and meet the reporting limits specified in Table 3. Laboratory quality control
will consist of lab control samples, method blanks, analytical duplicates, and matrix spikes
(Table 8).
Table 8. Field and laboratory quality control samples.
Parameter
Field Laboratory
Blank
s Replicates
Check
Standards
Method
Blanks
Analytical
Duplicates
Matrix
Spikes
Hydrolab (pH, DO, T Cond) N/A 1/trip N/A N/A N/A N/A
Nutrients, cations 5% 5% 1/batch 1/batch 1/batch 1/batch
Total Suspended Solids (TSS),
alkalinity and turbidity 5% 5% 1/batch 1/batch 1/batch N/A
Data Management Procedures
All field measurements and water quality results will be recorded in a field notebook or on site-
specific data sheets at the time of sampling. The field lead will review and verify that all
measurements are made and appropriately recorded before leaving each sampling site. Verified
field measurements will later be input in the Environmental Information Management (EIM) data
repository (as appropriate).
Data generated by Manchester Laboratory will be managed by the Laboratory Information
Management System (LIMS) and sent to the project lead in both electronic and hard copy
format. The case narratives included with the data package from Manchester Laboratory will be
reviewed for any problems that may have been encountered during sample analysis and to
understand any corrective action taken, or for changes that may have been made to the requested
analytical method. Laboratory data and quality control results will be reviewed against the
project data quality objectives to evaluate data quality.
The final verified and qualified results will be input into the EIM system.
Page 20
Audits and Reports
Manchester Laboratory participates in performance and system audits of their routine
procedures. The audit results are available upon request.
Data Verification and Validation
Verification of laboratory results is normally performed by a Manchester Laboratory unit
supervisor or an analyst experienced with the analytical method. Verification involves a detailed
examination of each data package to determine whether method data quality objectives have
been met. Manchester Laboratory’s standard operating procedures and EPA’s functional
guidelines are followed when performing the data assessment. Manchester Laboratory staff will
provide a written report of their data review detailing whether:
Measurement quality objectives were met.
Proper analytical methods and protocols were followed.
Calibrations and control were within limits.
Data were consistent, correct, and complete. (MEL, 2008)
After receiving each laboratory-verified data package, the project lead will compare the quality
assurance and analysis performance information against the project data quality objectives. Data
will be assessed for completeness and for indications of bias introduced by field procedures. If
necessary the sampling approach, quality control steps, or analytical procedures will be modified
for future sampling rounds to address identified problems.
Precision The percent relative standard deviation (%RSD) will be calculated for duplicate sample results to
define the degree of random variability introduced by sampling and analytical procedures. The
resulting values will be compared to the project data quality objectives (Table 3).
Bias The laboratory’s reported results for spike recoveries, blanks, instrument calibration, and control
samples will be evaluated to determine the extent of any analytical bias in the sampling results.
The evaluation results will be compared to the project data quality objectives (Table 3).

Page 21
Completeness The precision and bias assessments will be used to identify those analytical results that fail to
meet the data quality objectives of the project. In addition, the required versus actual holding
times prior to analysis for each sample will be evaluated to confirm the reported values are valid.
Based on the assessments described above, the data will be accepted, accepted with
qualifications, or rejected as unusable. The project manager will decide on final acceptance of
the project data.
Data Quality (Usability) Assessment
After the final round of analytical results is received from the laboratory, the overall project data
set will be evaluated for representativeness and completeness by the project manager. Data
error(s) will be assessed against the initial project goals and the project manager will determine
whether the data are of sufficient quality to meet the project objectives.
Reporting
A draft report will be prepared and forwarded to the internal reviewers in EAP and Ecology’s
Eastern Regional Office within six months of receiving the final round of sample results from
Manchester Laboratory. The report will include the following elements:
A description of the project purpose, goals, and objectives.
Map(s) of the study area and sampling sites.
Descriptions of field and laboratory methods.
A discussion of data quality and the significance of any problems encountered in the
analyses.
Summary tables of field and laboratory chemical data.
Observations about significant or potentially significant findings.
Possible recommendations related to the project goals.
The final data report should be ready for publication within three months of receiving review
comments on the draft report.
Page 22
References
Cusimano, B., 2004. Spokane River and Lake Spokane (Long Lake) Pollutant Loading
Assessment for Protecting Dissolved Oxygen. Washington State Department of Ecology,
Publication No. 04-03-006. 101 p. plus appendices. www.ecy.wa.gov/biblio/0403006.html
Janisch, J., 2006. Standard Operating Procedure for Determining Global Position System
Coordinates, Version 1.0. Washington State Department of Ecology, Olympia, WA.
SOP Number EAP013. www.ecy.wa.gov/programs/eap/quality.html
Joy, J., 2006. Standard Operating Procedure for Manually Obtaining Surface Water Samples,
Version 1.0. Washington State Department of Ecology, Olympia, WA. SOP Number EAP015.
www.ecy.wa.gov/programs/eap/quality.html
Kahle, S.C., Caldwell, R.R., and Bartolino, J.R., 2005. Compilation of geologic, hydrologic, and
ground-water flow modeling information for the Spokane Valley-Rathdrum Prairie aquifer,
Spokane County, Washington, and Bonner and Kootenai Counties, Idaho. U.S. Geological
Survey Scientific Investigations Report 2005-5227, 64 p. plus 2 plates.
Kahle, S.C., and Bartolino, J.R., 2007. Hydrogeologic framework and ground-water budget of
the Spokane Valley-Rathdrum Prairie Aquifer, Spokane County, Washington, and Bonner and
Kootenai Counties, Idaho. U.S. Geological Survey Scientific Investigations Report 2007-5041.
50 p. plus 2 plates.
Marti, P.B., 2011, Standard Operating Procedure for Purging and Sampling Water Supply Wells.
Washington State Department of Ecology, Olympia, WA. SOP Number EAP077, Version 1.0.
www.ecy.wa.gov/programs/eap/quality.html
MEL, 2006. Manchester Environmental Laboratory Quality Assurance Manual. Manchester
Environmental Laboratory, Washington State Department of Ecology, Manchester, WA.
MEL, 2008. Manchester Environmental Laboratory Lab Users Manual, Ninth Edition.
Manchester Environmental Laboratory, Washington State Department of Ecology, Manchester,
WA.
Sinclair, K. and Pitz, C., 2010, Standard Operating Procedure for installing, measuring, and
decommissioning hand-driven in-water piezometers. Washington State Department of Ecology,
Olympia, WA. SOP Number EAP061. Version 1.1.
www.ecy.wa.gov/programs/eap/quality.html
Swanson, T., 2007. Standard Operating Procedure for Hydrolab® DataSonde® ® and
MiniSonde® Multiprobes, Version 1.0. Washington State Department of Ecology,
Olympia, WA. SOP Number EAP033. www.ecy.wa.gov/programs/eap/quality.html
Page 23
Ward, W.J., 2007. Collection, Processing, and Analysis of Stream Samples, Version 1.3.
Washington State Department of Ecology, Olympia, WA. SOP Number EAP034.
www.ecy.wa.gov/programs/eap/quality.html
Ward, W.J., and N. Mathieu, 2011. Standard Operating Procedures for the Collection and
Analysis of Dissolved Oxygen (Winkler method), Version 2.1. Washington State Department of
Ecology, Olympia, WA. SOP Number EAP023. www.ecy.wa.gov/programs/eap/quality.html
WA0000825 Final Permit Inland Empire Paper CO and
APPENDIX D2 - RESPONSE TO COMMENTS FOR AMENDMENT TO PROPOSED NPDES
PERMIT WA-0000825
https://fortress.wa.gov/ecy/wqreports/public/f?p=110:1000:2356864689260732::NO:RP:P1000_F
ACILITY_ID,P1000_FACILITY_NAME:81484342,INLAND%20EMPIRE%20PAPER%20CO
Page 24
Appendix. Glossary, Acronyms, and Abbreviations
Glossary
Ambient: Background or away from point sources of contamination.
Conductivity: A measure of water’s ability to conduct an electrical current. Conductivity is
related to the concentration and charge of dissolved ions in water.
Dissolved oxygen (DO): A measure of the amount of oxygen dissolved in water.
National Pollutant Discharge Elimination System (NPDES): National program for issuing,
modifying, revoking and reissuing, terminating, monitoring, and enforcing permits, and
imposing and enforcing pretreatment requirements under the Clean Water Act. The NPDES
program regulates discharges from wastewater treatment plants, large factories, and other
facilities that use, process, and discharge water back into lakes, streams, rivers, bays, and oceans.
Nutrient: Substance such as carbon, nitrogen, and phosphorus used by organisms to live and
grow. Too many nutrients in the water can promote algal blooms and rob the water of oxygen
vital to aquatic organisms.
Parameter: A physical chemical or biological property whose values determine environmental
characteristics or behavior.
pH: A measure of the acidity or alkalinity of water. A low pH value (0 to 7) indicates that an
acidic condition is present, while a high pH (7 to 14) indicates a basic or alkaline condition. A
pH of 7 is considered to be neutral. Since the pH scale is logarithmic, a water sample with a pH
of 8 is ten times more basic than one with a pH of 7.
Point source: Sources of pollution that discharge at a specific location from pipes, outfalls, and
conveyance channels to a surface water. Examples of point source discharges include municipal
wastewater treatment plants, municipal stormwater systems, industrial waste treatment facilities,
and construction sites that clear more than 5 acres of land.
Total Maximum Daily Load (TMDL): A distribution of a substance in a waterbody designed
to protect it from not meeting (exceeding) water quality standards. A TMDL is equal to the sum
of all of the following: (1) individual wasteload allocations for point sources, (2) the load
allocations for nonpoint sources, (3) the contribution of natural sources, and (4) a margin of
safety to allow for uncertainty in the wasteload determination. A reserve for future growth is
also generally provided.
Total Suspended Solids (TSS): The portion of total solids retained by a glass fiber filter and
dried at 103-105oC
Page 25
Acronyms and Abbreviations
DO (See Glossary above)
Ecology Washington State Department of Ecology
EAP Environmental Assessment Program
EPA U.S. Environmental Protection Agency
EIM Environmental Information Management database
GPS Global Positioning System
IEP Inland Empire Paper
NCCW Non-contact-cooling water
NPDES (See Glossary above)
QA Quality assurance
RSD Relative standard deviation
SOP Standard operating procedure
TMDL (See Glossary above)
TSS (See Glossary above)
WRIA Waster Resource Inventory Area
Units of Measurement
°C degrees centigrade
s.u. standard units
mg/L milligrams per liter
ug/L micrograms per liter (parts per billion)
umhos/cm micromhos per centimeter, a unit of conductivity