Embed Size (px)
Citation preview

QAPP: Assessing Sources of Toxic Chemicals Impacting Juvenile Chinook Salmon i
Quality Assurance Project Plan
Assessing Sources of Toxic Chemicals Impacting Juvenile Chinook Salmon
August 2019
Publication No. 19-03-110

Publication Information
Each study conducted by the Washington State Department of Ecology must have an approved Quality
Assurance Project Plan (QAPP). The plan describes the objectives of the study and the procedures to be
followed to achieve those objectives. After completing the study, Ecology will post the final report of the
study to the Internet.
This Quality Assurance Project Plan is available on Ecology’s website at
https://fortress.wa.gov/ecy/publications/SummaryPages/1903110.html
Data for this project are available in Ecology’s EIM Database.
Study ID: WHOB010.
The Activity Tracker Code for this study is 20-002.
This QAPP was written using QAPP Template Version 1.0. Revision date: 8/27/2018.
Contact Information
For more information contact:
Publications Coordinator
Environmental Assessment Program
P.O. Box 47600, Olympia, WA 98504-7600
Phone: (360) 407-6764
Washington State Department of Ecology – https://ecology.wa.gov
Headquarters, Olympia 360-407-6000
Northwest Regional Office, Bellevue 425-649-7000
Southwest Regional Office, Olympia 360-407-6300
Central Regional Office, Union Gap 509-575-2490
Eastern Regional Office, Spokane 509-329-3400
Any use of product or firm names in this publication is for descriptive purposes only and
does not imply endorsement by the author or the Department of Ecology.
To request ADA accommodation for disabilities or printed materials in a format for the visually impaired,
call Ecology at 360-407-6764 or visit https://ecology.wa.gov/accessibility. People with impaired hearing
may call Washington Relay Service at 711. People with speech disability may call TTY at 877-833-6341.

QAPP: Assessing Sources of Toxic Chemicals Impacting Juvenile Chinook Salmon i
Quality Assurance Project Plan
Assessing Sources of Toxic Chemicals Impacting Juvenile Chinook Salmon
August 2019
Approved by:
Signature: Date:
Jessica Archer, Client and Author’s Section Manager, EAP
Signature: Date:
William Hobbs, Author / Project Manager, EAP
Signature: Date:
Jim Medlen, Author’s Acting Unit Supervisor, EAP
Signature: Date:
Dale Norton, Section Manager for Project Study Area, EAP
Signature: Date:
Alan Rue, Acting Director, Manchester Environmental Laboratory Signature: Date:
Arati Kaza, Ecology Quality Assurance Officer
Signatures are not available on the Internet version.
EAP: Environmental Assessment Program

ii August 2019
1.0 Table of Contents Page
List of Figures ......................................................................................................................v
List of Tables .......................................................................................................................v
2.0 Abstract ....................................................................................................................1
3.0 Background ..............................................................................................................1
3.1 Introduction and problem statement ............................................................1 3.2 Study area and surroundings ........................................................................3
3.2.1 History of study area .......................................................................3 3.2.2 Summary of previous studies and existing data ..............................6 3.2.3 Parameters of interest and potential sources ...................................8
3.2.4 Regulatory criteria or standards ......................................................9
3.3 Water quality impairment studies ..............................................................11
4.0 Project Description.................................................................................................12
4.1 Project goals ...............................................................................................12 4.2 Project objectives .......................................................................................12
4.3 Information needed and sources ................................................................12 4.4 Tasks required ............................................................................................12 4.5 Systematic planning process ......................................................................12
5.0 Organization and Schedule ....................................................................................13 5.1 Key individuals and their responsibilities ..................................................13
5.2 Special training and certifications ..............................................................14 5.3 Organization chart ......................................................................................14
5.4 Proposed project schedule ..........................................................................14
5.5 Budget and funding ....................................................................................14
6.0 Quality Objectives .................................................................................................16
6.1 Data quality objectives ...............................................................................16 6.2 Measurement quality objectives ................................................................16
6.2.1 Targets for precision, bias, and sensitivity ....................................17
6.2.2 Targets for comparability, representativeness, and completeness 18 6.3 Acceptance criteria for quality of existing data .........................................19
6.4 Model quality objectives ............................................................................19
7.0 Study Design ..........................................................................................................20 7.1 Study boundaries ........................................................................................20 7.2 Field data collection ...................................................................................21
7.2.1 Sampling locations and frequency .................................................21
7.2.2 Field parameters and laboratory analytes to be measured..............24 7.3 Modeling and analysis design ....................................................................24 7.4 Assumptions underlying design .................................................................24
7.5 Possible challenges and contingencies .......................................................24 7.5.1 Logistical problems ...........................................................................24 7.5.2 Practical constraints ..........................................................................24 7.5.3 Schedule limitations ..........................................................................24
8.0 Field Procedures.....................................................................................................25

QAPP: Assessing Sources of Toxic Chemicals Impacting Juvenile Chinook Salmon iii
8.1 Invasive species evaluation ........................................................................25
8.2 Measurement and sampling procedures .....................................................25
Semi-permeable membrane devices ..........................................................25 In Situ solid-phase extraction disks............................................................27 Surface water grab samples .......................................................................28 Collection and Analyses of Biofilm ...........................................................28 Invertebrate tissues.....................................................................................29
Sediment Sampling ....................................................................................29 8.3 Containers, preservation methods, holding times ......................................30 8.4 Equipment decontamination ......................................................................30 8.5 Sample ID ..................................................................................................30 8.6 Chain of custody ........................................................................................30
8.7 Field log requirements ...............................................................................31 8.8 Other activities ...........................................................................................31
9.0 Laboratory Procedures ...........................................................................................32
9.1 Lab procedures table ..................................................................................32 9.2 Sample preparation method(s) ...................................................................33 9.3 Special method requirements .....................................................................33
9.4 Laboratories accredited for methods ..........................................................33
10.0 Quality Control Procedures....................................................................................34 10.1 Table of field and laboratory quality control .............................................34 10.2 Corrective action processes ........................................................................34
11.0 Data Management Procedures ...............................................................................35
11.1 Data recording and reporting requirements ...............................................35 11.2 Laboratory data package requirements ......................................................35
11.3 Electronic transfer requirements ................................................................36 11.4 EIM/STORET data upload procedures ......................................................36
11.5 Model information management ................................................................36
12.0 Audits and Reports .................................................................................................37
12.1 Field, laboratory, and other audits .............................................................37 12.2 Responsible personnel ...............................................................................37 12.3 Frequency and distribution of reports ........................................................37 12.4 Responsibility for reports ...........................................................................37
13.0 Data Verification ....................................................................................................38
13.1 Field data verification, requirements, and responsibilities ........................38 13.2 Laboratory data verification .......................................................................38 13.3 Validation requirements, if necessary ........................................................38
13.4 Model quality assessment ..........................................................................38
14.0 Data Quality (Usability) Assessment .....................................................................39
14.1 Process for determining project objectives were met ................................39 14.2 Treatment of non-detects and data qualifiers .............................................39 14.3 Data analysis and presentation methods ....................................................39 14.4 Sampling design evaluation .......................................................................40 14.5 Documentation of assessment ....................................................................40
15.0 References ..............................................................................................................41

iv August 2019
16.0 Appendices .............................................................................................................46
Appendix A. Results of Previous Fish Tissue Studies ...........................................47
Appendix B. Glossaries, Acronyms, and Abbreviations .......................................49 Glossary of General Terms ........................................................................49 Acronyms and Abbreviations ....................................................................51 Units of Measurement ................................................................................51 Quality Assurance Glossary .......................................................................52
References for QA Glossary ......................................................................56

QAPP: Assessing Sources of Toxic Chemicals Impacting Juvenile Chinook Salmon v
List of Figures Page
Figure 1. Geographic extent of the presence of Chinook salmon throughout
Washington State (data courtesy WDFW). ..........................................................3
Figure 2. Land use map for the Snohomish River Basin. ....................................................4
Figure 3. Discharge of the Snohomish River from 2000–2019. ..........................................5
Figure 4. Extent of Chinook salmon in the Snohomish River Basin and previous fish
and mussel monitoring locations. .........................................................................6
Figure 5. Empirical cumulative distribution function of PBDEs in Washington State
fish tissues. ...........................................................................................................7
Figure 6. Snohomish River Basin showing potential sample sites. ...................................21
Figure 7. An SPMD canister showing the upper membrane. ............................................26
Figure 8. Schematic of the C.L.A.M. sampler with SPE media in a disk housing. ...........27
Figure 9. Example of a biofilm being scraped from a rock. ..............................................28
List of Tables Table 1. Previous samples of PBDE concentrations in WWTP effluent discharging to
Puget Sound (Ecology and Herrera, 2010). ..........................................................8
Table 2. Environment Canada Federal Environmental Quality Guidelines for PBDEs
(Environment Canada, 2013). ............................................................................10
Table 3. Water quality impairments in the Snohomish River Basin under section
303(d) of the Clean Water Act. ..........................................................................11
Table 4. Organization of project staff and responsibilities. ...............................................13
Table 5. Proposed schedule for completing field and laboratory work, data entry into
EIM, and reports. ...............................................................................................14
Table 6. Project budget and funding. .................................................................................15
Table 7. Measurement quality objectives. .........................................................................17
Table 8. Measurement quality objectives for multi-probe sonde calibration checks. .......18
Table 9. Proposed sample locations and rationale. ............................................................22
Table 10. WWTP discharge rates (MG/day) in the Snohomish basin. ..............................23
Table 11. Sample containers, preservation, and holding times. .........................................30
Table 12. Measurement methods (laboratory). ..................................................................32
Table 13. Quality control samples, types, and frequency. .................................................34

vi August 2019
This page is purposely left blank.
QAPP: Assessing Sources of Toxic Chemicals Impacting Juvenile Chinook Salmon 1
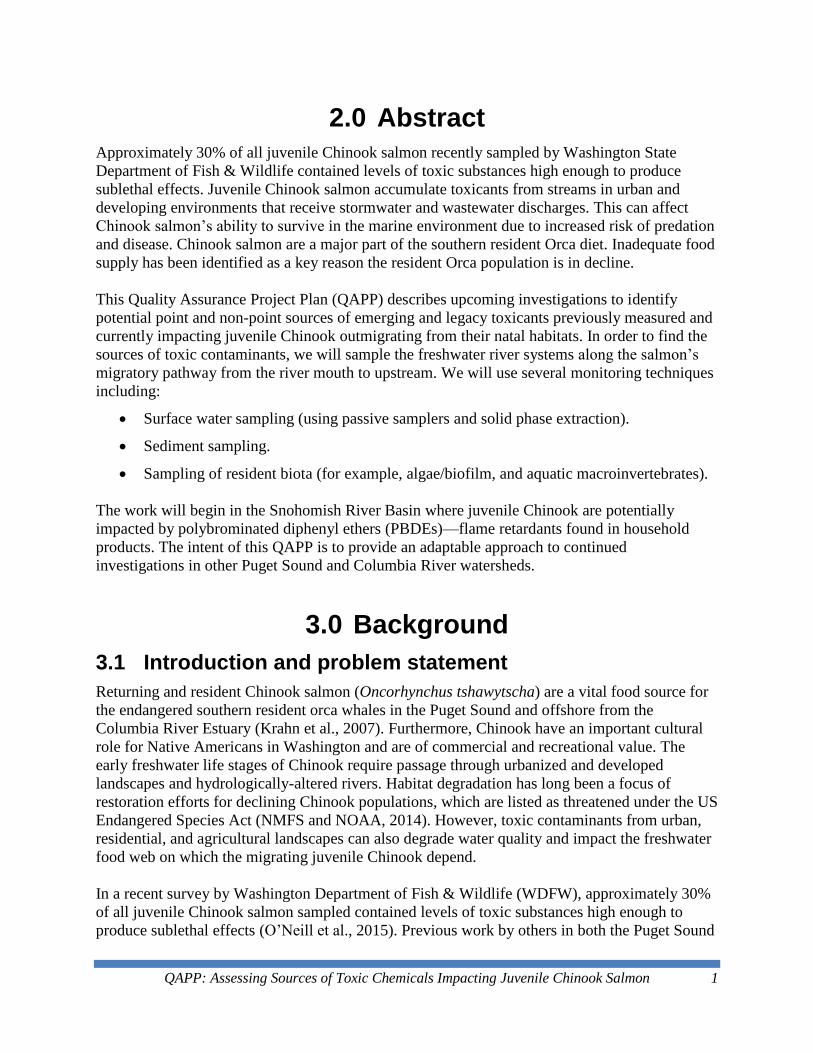
2.0 Abstract Approximately 30% of all juvenile Chinook salmon recently sampled by Washington State
Department of Fish & Wildlife contained levels of toxic substances high enough to produce
sublethal effects. Juvenile Chinook salmon accumulate toxicants from streams in urban and
developing environments that receive stormwater and wastewater discharges. This can affect
Chinook salmon’s ability to survive in the marine environment due to increased risk of predation
and disease. Chinook salmon are a major part of the southern resident Orca diet. Inadequate food
supply has been identified as a key reason the resident Orca population is in decline.
This Quality Assurance Project Plan (QAPP) describes upcoming investigations to identify
potential point and non-point sources of emerging and legacy toxicants previously measured and
currently impacting juvenile Chinook outmigrating from their natal habitats. In order to find the
sources of toxic contaminants, we will sample the freshwater river systems along the salmon’s
migratory pathway from the river mouth to upstream. We will use several monitoring techniques
including:
Surface water sampling (using passive samplers and solid phase extraction).
Sediment sampling.
Sampling of resident biota (for example, algae/biofilm, and aquatic macroinvertebrates).
The work will begin in the Snohomish River Basin where juvenile Chinook are potentially
impacted by polybrominated diphenyl ethers (PBDEs)—flame retardants found in household
products. The intent of this QAPP is to provide an adaptable approach to continued
investigations in other Puget Sound and Columbia River watersheds.
3.0 Background
3.1 Introduction and problem statement
Returning and resident Chinook salmon (Oncorhynchus tshawytscha) are a vital food source for
the endangered southern resident orca whales in the Puget Sound and offshore from the
Columbia River Estuary (Krahn et al., 2007). Furthermore, Chinook have an important cultural
role for Native Americans in Washington and are of commercial and recreational value. The
early freshwater life stages of Chinook require passage through urbanized and developed
landscapes and hydrologically-altered rivers. Habitat degradation has long been a focus of
restoration efforts for declining Chinook populations, which are listed as threatened under the US
Endangered Species Act (NMFS and NOAA, 2014). However, toxic contaminants from urban,
residential, and agricultural landscapes can also degrade water quality and impact the freshwater
food web on which the migrating juvenile Chinook depend.
In a recent survey by Washington Department of Fish & Wildlife (WDFW), approximately 30%
of all juvenile Chinook salmon sampled contained levels of toxic substances high enough to
produce sublethal effects (O’Neill et al., 2015). Previous work by others in both the Puget Sound

2 August 2019
and Columbia River Basin also documented tissue burdens of toxics at concentrations high
enough to suggest a possible impact to marine survival (Meador et al., 2010; Sloan et al., 2010;
Johnson et al., 2013). The impairment of juvenile Chinook salmon’s ability to survive in the
marine environment, with a tissue burden of toxics above a certain threshold, is due to increased
risk of predation and disease (Arkoosh et al., 2010; Meador et al., 2010). The implication of
previous surveys is that juvenile Chinook are accumulating sublethal amounts of toxics from
urbanized and developing watersheds. Though many of these watersheds have undergone habitat
restoration efforts, receiving waters can be impacted by storm and wastewater containing toxic
chemicals.
From their natal streams in the Puget Sound, juvenile Chinook either migrate directly to
saltwater or spend up to several months rearing in freshwater (Quinn, 2005). Most juveniles enter
the estuary in the spring and early summer. There are 29 stocks of Chinook in the Puget Sound
region considered as one Puget Sound evolutionary significant unit (ESU), and the proportion
supplemented by hatchery salmon varies from north to south (Duffy et al., 2011). Hatchery
Chinook are held back to increase growth; they migrate directly to saltwater, whereas wild
Chinook stocks tend to remain in the estuary for a few weeks (Quinn, 2005). Because of the
different migratory habits, hatchery Chinook tend to have significantly lower contaminant
burdens (Sloan et al., 2010).
Juvenile Chinook of the Columbia River Basin have much greater variability in early freshwater
life stages, including run timing, geographic ranges, and length of freshwater and estuary
residence (Fresh et al., 2005). A major life-history difference is based on emigration from
freshwater, where yearlings spend their first year in freshwater tributaries and migrate the
following spring (stream-type) and subyearlings migrate their first year and rear for up to several
months in the Columbia River Estuary (ocean-type) (Johnson et al., 2013). Chinook in the
Columbia River Basin can be grouped into 13 distinct ESUs. In general, the migratory and
rearing habitat of juvenile Chinook in the Columbia Basin is more heavily influenced by forestry
and agricultural land uses; however, this changes in the lower Columbia River and Willamette
River where industrial and urban land uses are more prominent.
The presence (including rearing and spawning habitat) of Chinook salmon in Washington’s
rivers and streams can be divided by the timing of runs in the spring, summer, and fall (Figure
1). Many of the runs in the Columbia River Basin region are earlier spring runs, while the Puget
Sound runs are predominately fall runs. Run timing is driven by migratory distance to natal
spawning habitat. The damming of the Columbia River presents a number of anthropogenic
obstacles that potentially impact the return and outward migration of Chinook smolts. Continued
study and uncertainties surround the survival of adult and yearling salmon through hydrosystems
(ISAB/ISRP, 2016).
The goal of this project is to identify contaminant sources along the salmon’s migratory pathway,
and develop a prioritized list of sources to control toxic effects on the early marine survival of
juvenile Chinook salmon. This Quality Assurance Project Plan (QAPP) describes a broad
approach to the source identification work that will take place in watersheds previously surveyed
by WDFW. The work will begin in the Snohomish River Basin (WRIA 7) and is described in
greater detail throughout this QAPP.

QAPP: Assessing Sources of Toxic Chemicals Impacting Juvenile Chinook Salmon 3
Figure 1. Geographic extent of the presence of Chinook salmon throughout Washington State (data courtesy WDFW).
Green lines are spring runs. Red lines are summer runs. Blue lines are fall runs. Grey lines are rivers and streams with no documented Chinook presence.
3.2 Study area and surroundings
3.2.1 History of study area
The Snohomish River Basin is located in the Puget Sound drainage. The Snohomish is formed by
the confluence of the Snoqualmie and Skykomish Rivers, which drain from headwaters in the
Cascade Mountains. Approximately 75% of the 1,856 sq mile drainage basin is forested lands; in
the lowland regions of the basin, agricultural and rural residential land uses become more
prevalent. (Figure 2). There are a number of towns and smaller unincorporated, residential areas
along the Snoqualmie and Skykomish Rivers within the urban growth area for the basin. The
largest incorporated urban areas in the basin are the cities of Everett, Marysville, and Lake
Stevens.

4 August 2019
Figure 2. Land use map for the Snohomish River Basin.
The hydrology of the Snohomish River is both rainfall and snowmelt-dominated, and flow is
typically highest from April through June (Figure 3). Low flow in the river occurs during August
and September. There is considerable tidal influence in the lower Snohomish River, up to
approximately river mile 20 where the Skykomish and Snoqualmie Rivers converge. Salt water
wedges have been observed and modeled in the lower Snohomish during previous water quality
studies by Ecology (Cusimano, 1997). The influence of saltwater in the lower Snohomish is
dependent on the time of year, tidal cycles, and upstream freshwater flow.

QAPP: Assessing Sources of Toxic Chemicals Impacting Juvenile Chinook Salmon 5
Figure 3. Discharge of the Snohomish River from 2000–2019.
Red dots are the monthly harmonic means. Station is USGS 12150800—Snohomish River near Monroe.
Chinook (Oncorhynchus tshawytscha) use many of the major rivers and tributaries in the
Snohomish Basin for migrating, rearing, and spawning (Figure 4). In addition to Chinook, there
are a number of anadromous and non-anadromous salmonid species that utilize the basin: coho
(O. kisutch), chum (O. keta), pink (O. gorbuscha), and sockeye salmon (O. nerka); steelhead and
rainbow (O. mykiss), cutthroat (O. clarki), and bull trout (Salvelinus confluentus); and mountain
whitefish (Prosopium williamsoni). Efforts to conserve and recover salmon stocks within the
basin are ongoing (e.g., SBSRF, 2005). These efforts focus largely on habitat restoration and
conventional water quality parameters such as temperature.

6 August 2019
Figure 4. Extent of Chinook salmon in the Snohomish River Basin and previous fish and mussel monitoring locations.
Red lines show the presence of fall Chinook runs. Blue lines show the presence of summer Chinook runs. Circles are sample locations from previous studies (section 3.2.2).
3.2.2 Summary of previous studies and existing data
Previous sampling by Ecology and WDFW have suggested that resident and juvenile Chinook in
the Snohomish River Basin are impacted by polybrominated diphenyl ethers (PBDEs), which are
flame retardants found in products, such as plastics, furniture, upholstery, electrical equipment,
and textiles. Sampling by Ecology in 2005, 2007, 2008, and 2014 all showed measurable
concentrations of PBDEs in a variety of resident fish species from the Snohomish River Basin,
including some lakes (Table A-1). Concentrations measured in the mountain whitefish tissues
were generally the highest among species, and samples collected from the Snohomish River are

QAPP: Assessing Sources of Toxic Chemicals Impacting Juvenile Chinook Salmon 7
in the 90th percentile range among 460 samples taken in Washington State (Figure 5) (Johnson et
al., 2006; Seiders et al., 2007; Mathieu and Wong, 2016). Total PBDEs in the tissue samples are
dominated by congeners BDE-47 and BDE-99/100.
Figure 5. Empirical cumulative distribution function of PBDEs in Washington State fish tissues.
Samples collected from the Snohomish River Basin are shown as larger dots – river (red) and lakes (black).
Juvenile Chinook tissues from O’Neill et al., (2015) showed evidence of elevated PBDE
concentrations in samples collected from the lower Snohomish River (Table A-1). Follow-up
sampling (including wild and hatchery fish samples within the distributary channels of the
estuary and the mainstem Snohomish River upstream from the estuary) have suggested that the
juveniles are accumulating PBDEs in the lower Snohomish estuary (O’Neill unpublished data
and personal communication). Furthermore, similar to previous work by Sloan et al., (2010) it
appears that the hatchery individuals have much lower PBDE concentrations than the wild
individuals.
There has been some previous sampling of PBDEs in wastewater effluent from major treatment
plants in the Puget Sound, including the Everett facility in the Snohomish River Basin (Ecology
and Herrera, 2010; Ecology and King County, 2011). In 2009, effluent samples were collected in
winter and summer from 10 major WWTPs. The Everett WWTP’s outfall 100, which discharges
into Gardner Bay, contained the highest concentrations of total PBDEs (Table 1). In all of the
WWTP effluent, three main congeners dominated the total-BDE concentrations: BDE-47, BDE-
99 and BDE-209. Concentrations of PBDEs showed little evidence of seasonal differences.

8 August 2019
Table 1. Previous samples of PBDE concentrations in WWTP effluent discharging to Puget Sound (Ecology and Herrera, 2010).
WWTP location Date Tetra-BDEs (pg/L)
Penta-BDEs (pg/L)
Deca-BDEs (pg/L)
Total-BDEs (pg/L)
Bellingham WWTP 2/12/2009 5453 5712 2000 14396
7/16/2009 4083 3712 1390 U 8607
Bremerton WWTP 2/10/2009 5538 6328 3340 16829
7/14/2009 5937 6030 750 UJ 13277
Burlington WWTP 2/10/2009 3565 2860 3060 10974
7/14/2009 7697 7991 4460 22809
Chambers Cr WWTP 2/19/2009 8807 8623 2870 23838
7/16/2009 7202 6058 250 U 15115
Everett WWTP (Outfall 100) 2/12/2009 34267 40280 35500 125387
7/16/2009 44945 45920 22000 134737
Gig Harbor WWTP 2/10/2009 4960 5017 10700 22272
7/14/2009 9980 10876 18800 45799
King Co West Pt 2/10/2009 6400 7094 2540 17894
7/14/2009 7207 7824 2150 18273
Shelton WWTP 2/10/2009 15072 23132 10600 54393
7/14/2009 6741 8178 5610 24478
Sumner WWTP 2/12/2009 3786 2732 1780 9096
7/17/2009 7423 18316 250 UJ 30423
City of Tacoma (Central 1) 2/19/2009 15160 16954 6830 43492
7/16/2009 15703 17848 8870 47070
U = Analyte was not detected at or above the detection limits. UJ = Analyte was not detected at or above the estimated reporting limit.
3.2.3 Parameters of interest and potential sources
In the Snohomish River Basin, polybrominated diphenyl ethers (PBDEs) are the main group of
organic chemicals that are of concern, due to the possible impairment of juvenile Chinook.
PBDEs—brominated flame-retardants—are a class of 209 congeners that resemble the structure
of PCBs except they contain bromine instead of chlorine. They are manufactured as flame-
retardants and used in a large variety of products (e.g., plastics, furniture, upholstery, electrical
equipment, and textiles) (Hale et al., 2003). There are three main homologue groups of PBDEs:
penta-, octa-, and deca-brominated diphenyl ethers (BDEs). The manufacturers of PBDEs
voluntarily ceased production of penta-, and octa- BDE formulations in 2004 following human
health concerns (Ecology, 2006). The deca-BDE formulation was also largely phased out by the
end of 2012. Like PCBs, PBDEs are bioaccumulative and bind to the fats of organisms. The fate
and toxicity of PBDEs varies; the heavier congeners tend to bind more readily to dust and solids,

QAPP: Assessing Sources of Toxic Chemicals Impacting Juvenile Chinook Salmon 9
and the lighter congeners are more volatile (Hale et al., 2003). Once in the body, PBDEs can
inhibit the transport of thyroid hormones affecting metabolic functions and interfering with fetal
development (Birnbaum and Staskal, 2003).
PBDEs are released and transported in the environment via atmospheric pathways and
stormwater runoff pathways (Sutton et al., 2019). PBDEs are also contributed to the environment
through household grey water that is treated and discharged via WWTPs. Current treatment
technologies were not designed to remove PBDEs, but appear to partially reduce PBDE mass in
wastewater (Song et al., 2006).
In addition to PBDEs there are several novel brominated flame retardants (NBFRs) that are of
interest due to their use as replacement chemicals; they include: Pentabromoethylbenzene
(PBEB), Hexabromobenzene (HBB), 1,2-Bis(2,4,6-tribromophenoxy)ethane (BTBPE), and
Decabromodiphenylethane (DBDPE). These chemicals are halogenated and can have similar fate
and transport characteristics (Zhang et al., 2016). They have similar sources in the urban
environment to PBDEs and are measured using similar laboratory techniques.
3.2.4 Regulatory criteria or standards
There are no regulatory levels in Washington State for PBDEs. Previous work by WDFW has
compared the tissue burden of PBDEs in juvenile Chinook to an effects threshold derived from
laboratory studies at NOAA (Arkoosh et al., 2010; 2015). The work of Arkoosh et al. (2010;
2015) established a non-monotonic relationship between PBDE dose, tissue burden, and disease
susceptibility, where an increased disease susceptibility was found at concentrations ≥ 470 ng
PBDE / g lipid; however, this risk declines at concentrations ≥ 2,500 ng PBDE/ g lipid. O’Neill
et al. (2015) relied on these tissue burdens in their assessment of juvenile Chinook throughout
Puget Sound.
Environment Canada has produced Federal Environmental Quality Guidelines (2013) for PBDEs
in water, sediment, and tissue that can be used for assessment of environmental quality (Table 2).
Water quality guidelines are benchmarks for aquatic ecosystems that are intended to protect all
forms of aquatic life (vertebrates, invertebrates, and plants) from direct adverse effects for
indefinite exposure periods via the water column. Fish tissue concentrations are intended to
protect fish from potential adverse effects. Sediment guidelines for the protection of aquatic life
are intended to protect sediment-dwelling animals as well as pelagic animals that bioaccumulate
PBDEs from sediments. The wildlife dietary guidelines are intended to protect mammalian and
avian consumers of aquatic biota.

10 August 2019
Table 2. Environment Canada Federal Environmental Quality Guidelines for PBDEs (Environment Canada, 2013).
Homologue[*] Congener Water (ng/L)
Fish Tissue
(ng/g ww)
Sediment[**] (ng/g dw)
Wildlife Diet[1] (ng/g ww food source)
triBDE total 46 120 44 –
tetraBDE total 24 88 39 44
pentaBDE total 0.2 1 0.4 3 (mammal) 13 (birds)
pentaBDE BDE-99 4 1 0.4 3
pentaBDE BDE-100 0.2 1 0.4 –
hexaBDE total 120 420 440 4
heptaBDE total 17[3] – – 64
octaBDE total 17[3], [4] – 5600[4] 63[4]
nonaBDE total – – – 78
decaBDE total – – 19[4], [5] 9
[*]Guidelines for triBDE (tribromodiphenyl ether), tetraBDE (tetrabromodiphenyl ether), hexaBDE (hexabromodiphenyl ether), heptaBDE (heptabromodiphenyl ether), nonaBDE (nonabromodiphenyl ether) and decaBDE (decabromodiphenyl ether) are based on data for the congeners: BDE-28, BDE-47, BDE-153, BDE-183, BDE-206, and BDE-209, respectively unless otherwise noted. [**] Values normalized to 1% organic carbon. [1] Applies to mammalian wildlife unless otherwise noted. [2] Value based on the commercial PentaBDE formulation, DE-71, which contains mostly pentaBDE and some tetraBDE. [3] Values based on commercial OctaBDE mixture DE-79, which is composed mainly of heptaBDE and octaBDE (octabromodiphenyl ether). [4] Values adopted from Ecological Screening Assessment Report (Environment Canada 2006). Sediment guidelines for octaBDE and decaBDE were adapted from the SAR by being corrected for the sediment organic carbon in the actual tests, then normalized to 1% organic carbon instead of the 4% in the SAR. [5] Values based on commercial decaBDE mixture, which is composed mainly of nonaBDE and decaBDE.
Washington State Department of Health (DOH) has calculated a human health screening level
for BDE-047 in fish tissues, based on neurobehavioral effects for high consumer populations (34
ng/g ww). This screening level is used by DOH in assessing waterbodies for fish consumption
advisories, after taking into account risk management and risk communication.

QAPP: Assessing Sources of Toxic Chemicals Impacting Juvenile Chinook Salmon 11
3.3 Water quality impairment studies
There are no water quality impairments under CWA section 303(d) for PBDEs because there are
no regulatory criteria for these contaminants. However, there are existing impairments in the
Snohomish River basin for toxic chemicals. Table 3 details the current listings and contaminants.
Table 3. Water quality impairments in the Snohomish River Basin under section 303(d) of the Clean Water Act.
Waterbody Name Listing
ID Medium Parameter
Calligan Lake
43225 Tissue Alpha-BHC
43233 Tissue 2,3,7,8-TCDD (Dioxin)
43251 Tissue PCBs
Dorothy Lake 43094 Tissue Dioxin
Goodwin Lake
75640 Tissue Hexachlorobenzene
77215 Tissue Toxaphene
78920 Tissue PCBs
Powder Mill Creek 78305 Water Copper
Skykomish River 78961 Tissue PCBs
Snohomish River 51584 Tissue 2,3,7,8-TCDD (Dioxin)
52699 Tissue PCBs
Snoqualmie River 78966 Tissue PCBs
76547 Tissue Toxaphene
Stevens Lake
75636 Tissue Hexachlorobenzene
76309 Tissue Dieldrin
76548 Tissue Toxaphene
78970 Tissue PCBs
Unnamed Creek (tributary to Evans Creek)
79779 Water Mercury
Unnamed Creek (tributary to Snohomish River)
79781 Water Mercury
The chlorinated pesticides and PCBs listed for impairments in the Snohomish River were not
found to be accumulating in tissues of juvenile Chinook at concentrations that would suggest
sublethal effects (6,000 ng DDT / g lipid, Beckvar et al., 2005; 2,400 ng PCB / g lipid, Meador et
al., 2002). Analytical budgets limit our ability to investigate the sources of additional toxic
chemicals. In addition, the sources and pathways of PCBs and chlorinated pesticides could differ
from PBDEs and would require a different sampling approach. We are therefore not
investigating PCBs or chlorinated pesticides in the Snohomish Basin at this time.
12 August 2019
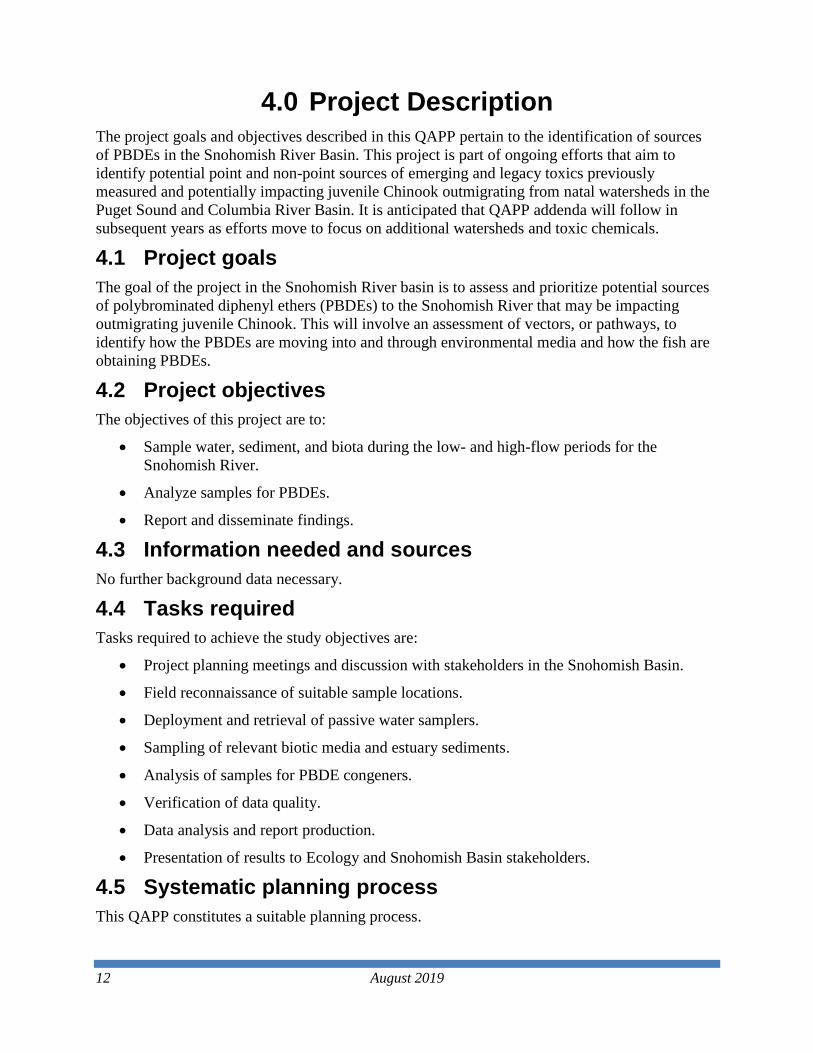
4.0 Project Description The project goals and objectives described in this QAPP pertain to the identification of sources
of PBDEs in the Snohomish River Basin. This project is part of ongoing efforts that aim to
identify potential point and non-point sources of emerging and legacy toxics previously
measured and potentially impacting juvenile Chinook outmigrating from natal watersheds in the
Puget Sound and Columbia River Basin. It is anticipated that QAPP addenda will follow in
subsequent years as efforts move to focus on additional watersheds and toxic chemicals.
4.1 Project goals
The goal of the project in the Snohomish River basin is to assess and prioritize potential sources
of polybrominated diphenyl ethers (PBDEs) to the Snohomish River that may be impacting
outmigrating juvenile Chinook. This will involve an assessment of vectors, or pathways, to
identify how the PBDEs are moving into and through environmental media and how the fish are
obtaining PBDEs.
4.2 Project objectives
The objectives of this project are to:
Sample water, sediment, and biota during the low- and high-flow periods for the
Snohomish River.
Analyze samples for PBDEs.
Report and disseminate findings.
4.3 Information needed and sources
No further background data necessary.
4.4 Tasks required
Tasks required to achieve the study objectives are:
Project planning meetings and discussion with stakeholders in the Snohomish Basin.
Field reconnaissance of suitable sample locations.
Deployment and retrieval of passive water samplers.
Sampling of relevant biotic media and estuary sediments.
Analysis of samples for PBDE congeners.
Verification of data quality.
Data analysis and report production.
Presentation of results to Ecology and Snohomish Basin stakeholders.
4.5 Systematic planning process
This QAPP constitutes a suitable planning process.

QAPP: Assessing Sources of Toxic Chemicals Impacting Juvenile Chinook Salmon 13
5.0 Organization and Schedule
5.1 Key individuals and their responsibilities
Table 4. Organization of project staff and responsibilities.
Staff Title Responsibilities
Jessica Archer EAP Headquarters Phone: 360-407-6698
Client and Section Manager for the Project Manager
Clarifies scope of the project. Reviews the project scope and budget, tracks progress, reviews the draft QAPP, and approves the final QAPP.
William Hobbs Toxic Studies Unit, SCS Phone: 360-407-7512
Project Manager
Writes the QAPP. Oversees field sampling and transportation of samples to the laboratory. Conducts QA review of data, analyzes and interprets data. Writes the draft and final report.
Sandra O’Neill T-BioS Washington Department of Fish and Wildlife Phone: 360-902-2666
Project Scientist
Reviews QAPP. Assists with study development. Directs the use of WDFW resources when necessary. Collaborates with project scientists.
Patti Sandvik Toxic Studies Unit, SCS Phone: 360-407-7198
Field Assistant Advises during sample site selection. Helps collect samples and records field information.
Siana Wong Toxic Studies Unit, SCS Phone: 360-407-6432
Field Assistant Helps collect samples and records field information. Oversees data management in EIM.
Jim Medlen Toxic Studies Unit, SCS Phone: 360-407-6139
Acting Unit Supervisor for the Project Manager
Provides internal review of the QAPP, approves the budget, and approves the final QAPP.
Dale Norton WOS Phone: 360-407-6765
Section Manager for the Study Area
Reviews the project scope and budget, tracks progress, reviews the draft QAPP, and approves the final QAPP.
Alan Rue Manchester Environmental Laboratory Phone: 360-871-8801
Manchester Lab Director
Reviews and approves the final QAPP.
Contract Laboratory, TBD Project Manager Reviews draft QAPP, coordinates with MEL QA Coordinator
Arati Kaza Phone: 360-407-6964
Ecology Quality Assurance Officer
Reviews and approves the draft and final QAPP.
EAP: Environmental Assessment Program EIM: Environmental Information Management database QAPP: Quality Assurance Project Plan SCS: Statewide Coordination Section WOS: Western Operations Section T-BioS: Toxics-focused Biological Observing System for the Salish Sea

14 August 2019
5.2 Special training and certifications
No special training necessary. Experience with passive samplers and boats is relevant.
5.3 Organization chart
See Table 4.
5.4 Proposed project schedule
Table 5. Proposed schedule for completing field and laboratory work, data entry into EIM, and reports.
Field and laboratory work Due date Lead staff
Synoptic Survey – low flow October 2019 William Hobbs
Synpotic Survey – high flow May 2020 William Hobbs
Fieldwork completed June 2020 William Hobbs
Laboratory analyses completed August 2020
Laboratory Data Validation complete December 2020
Environmental Information System (EIM) database
EIM Study ID WHOB010
Product Due date Lead staff
EIM data loaded January 2021 Siana Wong
EIM data entry review February 2021 Siana Wong
EIM complete February 2021 Siana Wong
Final report
Author lead / Support staff William Hobbs / Patti Sandvik and Siana Wong
Schedule
Draft due to supervisor February 2021
Draft due to client/peer reviewer March 2021
Draft due to external reviewer(s) April 2021
Final (all reviews done) due to publications coordinator
May 2021
Final report due on web July 2021
5.5 Budget and funding
Funding for this work was received through the United States Environmental Protection Agency
under assistance agreement 01J18101 (National Estuary Program Funds for Puget Sound).
Additional funding for a broader geographic mandate was received under the Washington State
Legislature, Model Toxics Control Operating Account. See Table 6 for a budget overview and
detailed budget for the first two years of the project.

QAPP: Assessing Sources of Toxic Chemicals Impacting Juvenile Chinook Salmon 15
Table 6. Project budget and funding.
Budget Overview Per fiscal year
Salary, benefits, and indirect/overhead $135,000
Equipment $1,000
Travel and goods and services $7,000
Contracts (WDFW) $30,000
Laboratory $72,500
Parameter Number of Samples
Number of QA Samples
Total Number of Samples
Cost Per Sample
Lab Subtotal (per Biennium)
PBDE Congeners and NBFRs
SPMD/SPE 40 12 52 $1000 $52,000
Tissue/sediment 30 4 34 $800 $35,200
Conventionals (water)
SSC 120 12 132 $20 $2,640
TOC/DOC 120 12 132 $75 $9,900
Conventionals (tissue/sediment)
C and N (TOC, TN, and isotopes)
30 30 60 $15 $900
Grain size 20 2 22 $100 $2,200
Data validation (Manchester Environmental Lab) – 30% surcharge on contract* $30,810
Lab contingency (PBDE analysis) $11,200
Lab total (Year 1 and 2) $145,010
NBFRs: novel brominated flame retardants SSC: suspended sediment concentrations TOC: total organic carbon DOC: dissolved organic carbon * Includes all PBDE analysis and contingency laboratory funds.

16 August 2019
6.0 Quality Objectives
6.1 Data quality objectives
The main data quality objective (DQO) for this project is to collect sufficient samples of biota
and passive water samples to characterize possible sources of PBDEs in the Snohomish River.
The analysis will use EPA methods with high-resolution gas chromatography-mass spectrometry
to resolve the congener distribution present in all sample media. Measurement quality objectives
described in the subsequent section detail the targets for analytical precision, bias, and
sensitivity.
6.2 Measurement quality objectives
The MQOs for this study are detailed in Table 7. The MQOs for the field parameters (pH,
dissolved oxygen, temperature, and conductivity) are in Table 8.

QAPP: Assessing Sources of Toxic Chemicals Impacting Juvenile Chinook Salmon 17
6.2.1 Targets for precision, bias, and sensitivity
Table 7. Measurement quality objectives.
MQO → Precision (% RPD) Bias Recovery Limits (%) Sensitivity
Concentration Units
Parameter Duplicate Samples
Matrix Spike-
Duplicates
Verification Standards
(LCS,CRM,CCV) Matrix Spikes
Surrogate Standards*
MDL or Lowest Conc.
of Interest
Water
Suspended Sediment Concentration
± 20% ± 20% 80–120% NA NA 0.5 mg L-1
Total Organic Carbon
± 20% ± 20% 80–120% 75–125% NA 0.5 mg L-1
Dissolved Organic Carbon
± 20% ± 20% 80–120% 75–125% NA 0.5 mg L-1
Passive water samplers (SPMDs) and In situ SPE media
PBDE congeners
± 50% NA 50–150% NA 25–150%a 5.0–500.0 pg per sample**
NBFRs ± 50% NA 50–150% NA 25–150% 30–50,000 pg per sample
Tissue (invertebrate or biofilm)
PBDE congeners
± 50% NA 50–150% NA 25–150%a 0.1–10.0 pg/g per cong**
NBFRs ± 50% NA 50–150% NA 25–150% 0.3–500 pg/g
C and N ± 20% NA 80–120% NA NA 0.10%
Sediments
PBDE congeners
± 50% NA 50–150% NA 25–150%a 0.1–100.0 pg/g per cong
NBFRs ± 50% NA 50–150% NA 25–150% 0.3–500 pg/g
Total organic carbon
± 20% NA 80–120% NA NA 1%
*Surrogate recoveries are compound specific.
**MDLs will vary among congeners. Deca and nona-BDEs have substantially higher MDLs. LCS = laboratory control sample CRM = certified reference materials CCV = continuing calibration verification standards RPD = relative percent difference a PBDE 209 recovery of 20-200% SPE = in situ solid phase extraction media (C.L.A.M. device) SPMD = semi-permeable membrane device

18 August 2019
Table 8. Measurement quality objectives for multi-probe sonde calibration checks.
Parameter Units Accept Qualify Reject
pH std. units < or = + 0.2 > + 0.2 and < or = + 0.8 > + 0.8
Conductivity* uS/cm < or = + 5 > + 5 and < or = + 15 > + 15
Temperature ° C < or = + 0.2 > + 0.2 and < or = + 0.8 > + 0.8
Dissolved Oxygen % saturation < or = + 5% > + 5% and < or = + 15% > + 15%
Dissolved Oxygen mg/L < or = + 0.3 > + 0.3 and < or = + 0.8 > + 0.8
* Criteria expressed as a percentage of readings; for example, buffer = 100.2 uS/cm and Hydrolab = 98.7 uS/cm; (100.2–98.7)/100.2 = 1.49% variation, which would fall into the acceptable data criteria of less than 5%.
6.2.1.1 Precision Precision is a measure of the variability in the results of replicate measurements due to random
error. Precision for two replicate samples is measured as the relative percent difference (RPD)
between the two results. If there are more than two replicate samples, then precision is measured
as the relative standard deviation (RSD).
Measurement quality objectives for the precision of laboratory duplicate samples and matrix
spike duplicate samples are shown in Table 7.
6.2.1.2 Bias Bias is the difference between the population mean and the true value. For this project, bias is
measured as acceptable % recovery. Acceptance limits for laboratory verification standards,
matrix spikes, and surrogate standards are shown in Table 7.
6.2.1.3 Sensitivity Sensitivity is a measure of the capability of a method to detect a substance above the background
noise of the analytical system. For the high-resolution methods being used in this study, each
congener is assessed for sensitivity and qualified or censored if the sample is not above five
times the laboratory blank. The laboratory reporting limits (RLs) for the project are described in
Section 9.2.
6.2.2 Targets for comparability, representativeness, and completeness
6.2.2.1 Comparability Section 8.2 lists the standard operating procedures (SOPs) to be followed for field sampling. All
analytical methods used for the project are approved methods commonly used by Ecology for
monitoring of toxic chemicals.

QAPP: Assessing Sources of Toxic Chemicals Impacting Juvenile Chinook Salmon 19
6.2.2.2 Representativeness Representativeness is a measure of whether the sample media reflects reality. We will ensure
proper representatives by adhering to the approved SOPs and sampling protocols. Samples will
be preserved and stored in a way that ensures holding conditions and lab holding times are met.
Samples will be collected to represent high-flow and low-flow conditions in one river.
Additional samples will be collected to represent high-flow conditions in a second river.
6.2.2.3 Completeness The data for this project will be considered complete if 95% of the planned samples were
collected and analyzed acceptably.
6.3 Acceptance criteria for quality of existing data
All data used to support the findings of this project will meet project DQOs. Any previous data
used will also be evaluated for compliance with current DQOs.
6.4 Model quality objectives
NA
20 August 2019
7.0 Study Design
7.1 Study boundaries
This study will focus on identifying sources and environmental pathways of PBDEs in the
Snohomish River Basin (WRIA 7). PBDEs are released to the environment via air, enabling
atmospheric transport and stormwater runoff pathways. PBDEs also accumulate in indoor dust
from PBDE-containing consumer products, adhering to fabrics and surfaces and are then washed
and transported to domestic wastewater. The PBDEs are then released into the environment from
domestic (or municipal) wastewater (Song et al., 2006; Ecology, 2006), which is treated and
discharged through wastewater treatment plants (WWTPs) under NPDES permits (Figure 6).
Current wastewater treatment technologies are not designed to remove PBDEs. This study will
assess the relative importance of potential transport pathways in the Snohomish River basin.
This study will begin with an assessment of the basin during low-flow conditions to assess
ambient exposure concentrations. Low-flow conditions are intended to represent the following
known and potential PBDE transport pathways: domestic wastewater, aerial deposition to the
surface of the waterbodies, and sediment flux.
During the spring when wet weather conditions prevail, this study will assess the potential
pathways from stormwater runoff, combined sewer overflows, and higher groundwater table
discharges to the Snohomish River. Throughout the investigation, this study will assess both the
spatial prevalence of PBDEs and the potential food-web based transport mechanisms to juvenile
Chinook.

QAPP: Assessing Sources of Toxic Chemicals Impacting Juvenile Chinook Salmon 21
Figure 6. Snohomish River Basin showing potential sample sites.
Red circles are potential sample sites. Black circles are WWTP outfalls. Grey circles are WWTP CSOs.
7.2 Field data collection
7.2.1 Sampling locations and frequency
Sample locations for the initial synoptic survey will be situated near the WWTP outfalls and
throughout the lower Snohomish River estuary. Exact locations will be dependent on site access,
security, and access permissions. Final site locations will be decided following site
reconnaissance. The tentative locations of 19 sample sites are detailed in Table 9 and Figure 6.
22 August 2019
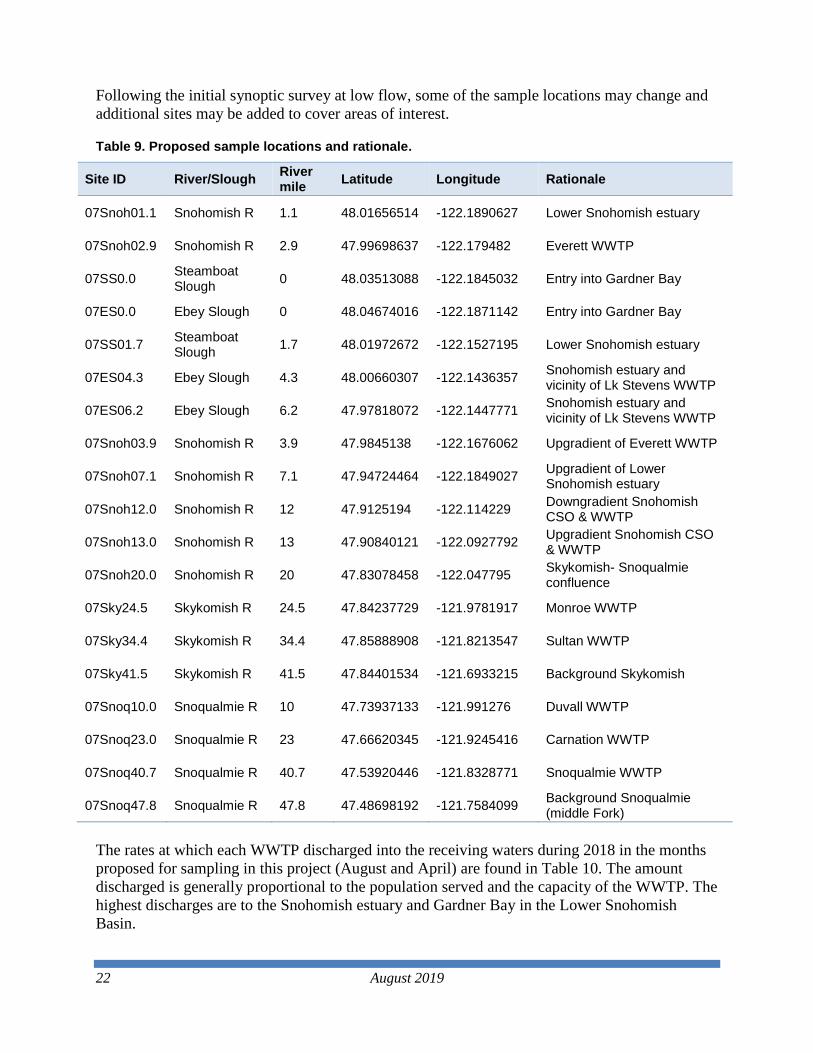
Following the initial synoptic survey at low flow, some of the sample locations may change and
additional sites may be added to cover areas of interest.
Table 9. Proposed sample locations and rationale.
Site ID River/Slough River mile
Latitude Longitude Rationale
07Snoh01.1 Snohomish R 1.1 48.01656514 -122.1890627 Lower Snohomish estuary
07Snoh02.9 Snohomish R 2.9 47.99698637 -122.179482 Everett WWTP
07SS0.0 Steamboat Slough
0 48.03513088 -122.1845032 Entry into Gardner Bay
07ES0.0 Ebey Slough 0 48.04674016 -122.1871142 Entry into Gardner Bay
07SS01.7 Steamboat Slough
1.7 48.01972672 -122.1527195 Lower Snohomish estuary
07ES04.3 Ebey Slough 4.3 48.00660307 -122.1436357 Snohomish estuary and vicinity of Lk Stevens WWTP
07ES06.2 Ebey Slough 6.2 47.97818072 -122.1447771 Snohomish estuary and vicinity of Lk Stevens WWTP
07Snoh03.9 Snohomish R 3.9 47.9845138 -122.1676062 Upgradient of Everett WWTP
07Snoh07.1 Snohomish R 7.1 47.94724464 -122.1849027 Upgradient of Lower Snohomish estuary
07Snoh12.0 Snohomish R 12 47.9125194 -122.114229 Downgradient Snohomish CSO & WWTP
07Snoh13.0 Snohomish R 13 47.90840121 -122.0927792 Upgradient Snohomish CSO & WWTP
07Snoh20.0 Snohomish R 20 47.83078458 -122.047795 Skykomish- Snoqualmie confluence
07Sky24.5 Skykomish R 24.5 47.84237729 -121.9781917 Monroe WWTP
07Sky34.4 Skykomish R 34.4 47.85888908 -121.8213547 Sultan WWTP
07Sky41.5 Skykomish R 41.5 47.84401534 -121.6933215 Background Skykomish
07Snoq10.0 Snoqualmie R 10 47.73937133 -121.991276 Duvall WWTP
07Snoq23.0 Snoqualmie R 23 47.66620345 -121.9245416 Carnation WWTP
07Snoq40.7 Snoqualmie R 40.7 47.53920446 -121.8328771 Snoqualmie WWTP
07Snoq47.8 Snoqualmie R 47.8 47.48698192 -121.7584099 Background Snoqualmie (middle Fork)
The rates at which each WWTP discharged into the receiving waters during 2018 in the months
proposed for sampling in this project (August and April) are found in Table 10. The amount
discharged is generally proportional to the population served and the capacity of the WWTP. The
highest discharges are to the Snohomish estuary and Gardner Bay in the Lower Snohomish
Basin.

QAPP: Assessing Sources of Toxic Chemicals Impacting Juvenile Chinook Salmon 23
Table 10. WWTP discharge rates (MG/day) in the Snohomish basin.
Discharge rates accessed through Discharge Monitoring Reports in Ecology’s Water Quality Permitting and Reporting Information System (PARIS); WWTPs are ordered by highest mean discharge.
Mean
Standard deviation Median** Minimum** Maximum
April 2018
Everett Outfall 100* 13.23 8.40 14.60 0.00 27.10
Everett Outfall 015 8.54 7.55 8.00 0.00 21.10
Marysville Outfall 001 5.57 3.98 7.69 0.00 9.68
Lake Stevens 3.52 0.71 3.31 2.54 5.27
Marysville Outfall 100* 2.45 3.49 0.00 0.00 8.33
Snohomish 2.45 1.40 2.09 1.35 6.47
Monroe 2.09 0.40 1.98 1.53 3.27
Snoqualmie 1.30 0.32 1.21 1.02 2.10
North Bend 1.01 0.38 0.83 0.66 2.02
Duvall 0.78 0.21 0.72 0.52 1.41
Sultan 0.58 0.20 0.53 0.34 1.17
Granite 0.44 0.09 0.42 0.32 0.69
Carnation 0.10 0.01 0.10 0.08 0.11
August 2018
Everett Outfall 100* 6.31 4.65 5.60 0.00 16.30
Marysville Outfall 100* 3.77 0.57 3.88 1.28 4.35
Everett Outfall 015 3.11 2.37 5.00 0.00 5.10
Lake Stevens 2.15 0.09 2.16 2.02 2.37
Monroe 1.43 0.07 1.43 1.31 1.69
Snohomish 0.62 0.31 0.76 0.00 0.86
Duvall 0.42 0.03 0.41 0.36 0.48
North Bend 0.39 0.01 0.39 0.36 0.42
Sultan 0.31 0.03 0.31 0.24 0.36
Granite 0.22 0.01 0.22 0.21 0.25
Snoqualmie 0.04 0.11 0.00 0.00 0.52
Marysville Outfall 001 0.02 0.08 0.00 0.00 0.47
Carnation 0.00 0.00 0.00 0.00 0.00
* Outfall 100 for the Everett and Marysville WWTP discharges into Gardner Bay. ** Discharges of 0.00 MG/day are recorded in Ecology’s PARIS database when flow is directed to an alternate outfall or discharge is to ground (e.g., Carnation WWTP in August).

24 August 2019
7.2.2 Field parameters and laboratory analytes to be measured
The complete parameter list has been discussed in section 6.2 Measurement Quality Objectives.
7.3 Modeling and analysis design
NA
7.4 Assumptions underlying design
Assumptions associated with the study design are that we will be able to accurately measure
PBDEs in the relevant environmental media and at an appropriate spatial scale to resolve
possible transport pathways and identify any outlier sources for further investigation. It may be
necessary to alter the timing or repeat some of the sampling if the environmental media chosen
do not provide the necessary data.
Additionally, the study design assumes that a comparison of dry-weather and wet-weather
sample results, coupled with surface sediment samples, will allow conclusions as to the relative
importance of different PBDE pathways: domestic wastewater, aerial deposition, stormwater
runoff, and sediment deposition.
7.5 Possible challenges and contingencies
7.5.1 Logistical problems
The challenges impacting the study design are limited to the logistics of suitable field sampling
sites. The Snohomish River is a large, high-energy river above the tidally influenced reaches,
which drains into a complex estuarine environment. There is therefore a large gradient in salinity
and material (sediment) flow and deposition along the river. This variability in the conditions
poses a challenge to the availability of comparable sample media throughout the river basin. To
alleviate this issue, adequate time for reconnaissance of field sites and confirmation of sample
media will take place well in advance of any sampling.
7.5.2 Practical constraints
Practical constraints on the field aspect of this project are having adequate personnel support for
sampling. Regional collaborators may be brought in to assist in the field.
7.5.3 Schedule limitations
The possible logistical issues in capturing representative samples in such a large, complex river
basin may require an additional sampling event. Contingency laboratory funding has been built
in to the budget for this project. This would cause a delay in the completion of the project.
Additional schedule limitations may occur during external data validation and QAPP and report
production. Current scheduling is based on recent estimates of the time required under current
workloads.

QAPP: Assessing Sources of Toxic Chemicals Impacting Juvenile Chinook Salmon 25
8.0 Field Procedures
8.1 Invasive species evaluation
Field personnel for this project are required to be familiar with and follow the procedures
described in SOP EAP070 (Parsons et al., 2018), Minimizing the Spread of Invasive Species. The
Union Slough in the Snohomish River estuary is designated as an area of extreme concern due to
New Zealand mudsnail. Should any samples be taken in this area of the lower Snohomish, they
will be taken last and decontamination protocols will be followed throughout the basin.
8.2 Measurement and sampling procedures
A number of sample media will be collected under this project. Sampling methods for this study
have been employed in other source identification studies for toxics (Johnson et al., 2010;
Hobbs, 2018). A number of field SOPs will be followed during the study, including:
Seiders et al. (2012a) — Standard Operating Procedure for Conducting Studies Using
SPMDs.
Seiders et al. (2012b) — Standard Operating Procedure for Semipermeable Membrane
Devices (SPMD) Data Management and Data Reduction.
Wong (2019) — Standard Operating Procedure for Sampling Trace Contaminants using
Continuous Low-Level Monitoring Devices (CLAMs).
Blakely (2008) — Standard Operating Procedure for Obtaining Freshwater Sediment
Samples.
Semi-permeable membrane devices
The initial synoptic survey of the basin for PBDEs in water will rely heavily on passive
samplers, semi-permeable membrane devices (SPMDs). SPMDs are composed of a thin-walled,
layflat polyethylene tube (91.4 cm x 2.5 cm x 70–95 um thickness) filled with 1 ml of triolein, a
neutral lipid compound (Figure 7). The goal of SPMDs is to emulate natural biological uptake by
allowing chemicals to diffuse through the membrane and concentrate over time (typically a 28-
day deployment). After deployment, the membranes are removed, extracted, and analyzed for the
contaminant of interest.

26 August 2019
Figure 7. An SPMD canister showing the upper membrane.
Note: some biofouling on the membrane is evident.
In this study, SPMDs will be deployed in secure areas (i.e., to minimize vandalism and avoid
strong currents), using stainless steel canisters and spindle devices provided by Environmental
Sampling Technologies (EST). In areas where security may be an issue, two canisters/SPMDs
will be placed at each site, however, only one will be analyzed for the presence of PBDEs. The
second canister/SPMDs are backups that would only be analyzed if the other canister/SPMD at
the site is lost. Each site canister/SPMD will contain five membranes preloaded onto spindles by
EST, and shipped in solvent-rinsed metal cans under argon gas. Prior to deployment,
performance reference compounds (PRCs) will be spiked into the membranes in order to assess
biofouling and the non-equilibrium uptake of the compounds of interest (Huckins et al., 2006).
The use of PRCs is essentially an in situ, site-specific calibration technique based on the
observation that the rate of analyte loss is proportional to the rate of analyte uptake. A labeled
congener (BDE-138L) and two native congeners (BDE-10 and BDE-38) will be used as PRCs.
PRCs will be added at a concentration of 2.5 ng per SPMD.

QAPP: Assessing Sources of Toxic Chemicals Impacting Juvenile Chinook Salmon 27
A StowAway® TidbiTTM temperature logger will be attached to each canister to continuously
monitor the water temperature during deployment. A second data logger will be attached nearby
to monitor air temperature. The data collected from the temperature loggers will be used to
confirm that the SPMD remained submerged during the sampling period and incorporated into
the uptake rates for PBDEs.
SPMDs will be exposed to ambient air for no more than 45 seconds at each site during
deployment and retrieval. Nitrile gloves will be used at all times. SPMDs will be deployed for
approximately 28 days in the late summer (i.e., August to September), when water flows are low.
The same laboratory-supplied shipping cans will be used during retrieval. They will be properly
sealed, cooled, and kept near freezing until arrival at the contract lab for the extraction of the
membranes (dialysis). PBDE analysis will be performed via EPA Method 1614.
In Situ solid-phase extraction disks
Solid-phase extraction (SPE) disks may be used during the project to actively sample the waters
of the Snohomish River. SPE disks will be deployed in continuous low-flow sampling devices
(C.L.A.M.s) and deployed for a period of 24 to 36 hours, following Wong (2019). Briefly, the
SPE media is mounted in front of a small pump (C.L.A.M.) that pulls water through the disk.
Organic contaminants are bound to the SPE media. The media is removed from the disk housing
and shipped to the contract lab for extraction and analysis. C.L.A.M.s will be suspended in the
water column or mounted to concrete blocks on the riverbed. All water pumped through the
device will be collected to measure the precise volume pumped, in order to calculate a PBDE
concentration.
Stainless steel housings for the SPE media will be used in this project, similar to Hobbs et al.
(2018) (Figure 8). Prior to the first sampling event, the housing and SPE media will be tested for
blank contamination by the contract lab. We will assess the retention of the analytes bound to the
SPE media using the same performance reference compounds as the SPMDs, injected into the
SPE media by the contract lab prior to deployment. The contract lab will be responsible for
cleaning the disk housing, conditioning the SPE media, and shipping the disk ready for
deployment into the field.
Figure 8. Schematic of the C.L.A.M. sampler with SPE media in a disk housing.

28 August 2019
Surface water grab samples
Water grab samples will be taken to measure the total and dissolved organic carbon (TOC/DOC)
and suspended sediment concentrations (SSC) at each site during the time the SPMDs are
exposed. These parameters will be used as ancillary data to help understand relationships
between suspended matter and the PBDE contaminants. Water grab samples will be collected
three times over the duration of the SPMD exposure to get an integrated measure of the
conditions. Grab samples will be collected using Ecology standard operating procedures (Joy,
2006).
Additional field parameters will be measured in situ at the time of water sampling using a multi-
probe sonde (Swanson, 2007). Parameters include: temperature, pH, dissolved oxygen, and
conductivity.
Collection and Analyses of Biofilm
Biofilm refers to the mixture of periphyton, microbial biomass, and fine sediments. Periphyton is
algae attached to the river bottom, rocks, or debris in the river (Figure 9). Standard protocols for
sampling attached algae will be followed to collect biofilm samples (Stevenson and Bahls, 1999;
Larson and Collyard, 2019). Biofilm will be scraped from rocks and collected in a stainless bowl
for weighing in the field to confirm that sufficient biomass is retrieved (~10 g ww). Samples will
be transferred from the bowl to a cleaned glass jar. A sample to assess areal biomass (g dry
weight / cm2) will be collected separately; each rock scraped for biofilm will be measured by
cutting a piece of aluminum foil tracing the sample area. The aluminum foil is then measured at
Ecology using software.
Figure 9. Example of a biofilm being scraped from a rock.

QAPP: Assessing Sources of Toxic Chemicals Impacting Juvenile Chinook Salmon 29
Biofilms will be analyzed for PBDEs, ash-free dry weight (areal biomass), and carbon (C) and
nitrogen (N) abundance and stable isotope ratios. Stable isotopes of the biofilms will assist in
detecting changes in nutrient and wastewater inputs over the study area.
Invertebrate tissues
In order to measure the PBDE concentrations and potential bioaccumulation of PBDEs from the
food source of the juvenile Chinook, we may include the analysis of invertebrates in the
sampling. Chinook will go through ontogenetic changes during their migration (Duffy et al.,
2010), however they generally feed on aquatic insects in the freshwater and then calanoid
copepods, crab larvae, polychaetes and gammarids in the estuary and nearshore environments.
The limiting factor in collections of invertebrate tissues for the analysis of contaminants is the
mass required (~ 10g wet weight). Therefore, sampling of invertebrate biomass will need to be
assessed as the project progresses. Possible sampling approaches include:
Picking invertebrates from rocks or debris in the freshwater environment.
Sorting sediment dredge samples for sediment-dwelling invertebrates.
Establishing drift nets to capture invertebrates drifting downstream at night.
Carrying out plankton tows in the estuary.
Sediment Sampling
Sediments will be sampled throughout the basin, but will likely focus on the lower Snohomish
River estuary where finer sediments are likely to accumulate. Verification of the presence and
approximate grain size will be characterized during site reconnaissance. Sediment collection will
follow Blakely (2008) and rely on composite samples from a ponar sampler. Because organic
chemicals tend to bind to finer sediments with higher organic content, all sediments will be
sieved to less than 2mm and total organic content and grain size assessed at each site. If possible,
the <63µm fraction will also be isolated in the field for analysis. Sediment grain size and organic
carbon content are particularly important for the binding of PBDEs to sediments and uptake by
the benthos (Dinn et al., 2012; Frouin et al., 2017).
The Marine Monitoring Unit of EAP will be conducting an intensive study of the offshore and
nearshore sediments in Gardner Bay/Everett Harbor during the summer of 2019 (Dutch et al.,
2018). This coincident sampling may provide an opportunity to collect additional sediment
samples in the nearshore areas just downstream of the Snohomish River estuary. These
opportunities will be explored as this project proceeds. All sampling methods and quality
assurance for the MMU are detailed in the approved Quality Assurance Monitoring Plan
(QAMP) (Dutch et al., 2018).

30 August 2019
8.3 Containers, preservation methods, holding times
Table 11. Sample containers, preservation, and holding times.
Parameter Matrix Minimum Quantity Required
Container Preservative Holding
Time
PBDE congeners and NBFRs
SPMD 3 SPMDs Stainless steel
carrier and can
cool to 4°C 14 days
SPE 20L of water processed
HDPE filter case; CLAM
sampler cool to 4°C 14 days
Biofilms/ invertebrates/
sediment 10g ww
8 oz glass jar w/ teflon lid
cool to 4°C 14 days
C and N (TOC, TN and isotopes)
Biofilms/ invertebrates/
sediment 0.5 g
2 oz clear glass jar w/
teflon lid cool to 4°C 14 days
Grain size Sediment 100 g 8 oz plastic jar cool to 4°C 6 months
DOC/TOC
Surface water
60ml 125 mL pre-
acidified poly bottle
1:1 HCl to pH<2;
Cool to 6°C 28 days
SSC 2 L 2L HDPE container
Cool to 6°C 7 days
8.4 Equipment decontamination
Decontamination of equipment will follow Friese (2014). Field blanks and manufacturing blanks
of the SPMDs will be analyzed as part of the QA program for this project. No decontamination
in the field (between sample sites) is necessary for this project.
8.5 Sample ID
Laboratory sample IDs will be assigned by MEL and the contract lab.
8.6 Chain of custody
Chain of custody will be maintained for all samples throughout the project.

QAPP: Assessing Sources of Toxic Chemicals Impacting Juvenile Chinook Salmon 31
8.7 Field log requirements
Field data will be recorded in a bound, waterproof notebook on Rite in the Rain paper.
Corrections will be made with single line strikethroughs, initials, and date.
The following information will be recorded in the project field log:
Name and location of project
Field personnel
Sequence of events
Any changes or deviations from the QAPP
Environmental conditions
Date, time, location, ID, and description of each sample
Field instrument calibration procedures
Field measurement results
Identity of QC samples collected
Unusual circumstances that might affect interpretation of results
8.8 Other activities
No additional activities require description.

32 August 2019
9.0 Laboratory Procedures
9.1 Lab procedures table
Table 12. Measurement methods (laboratory).
Analytical Lab
Analyte Sample Matrix Samples (Number)
Expected Range of Results
Detection or
Reporting Limit
Sample Prep
Method
Analytical (Instrumental)
Method
Water Samples
MEL
Suspended
sediment
concentrations
(mg / L)
Surface water 120 0.5–50 0.5 N/A ASTM D3977
B
MEL
Total Organic
Carbon
(mg / L)
Surface water 120 1–20 1 N/A SM 5310B
MEL
Dissolved
Organic Carbon
(mg / L)
Surface water 120 0.5–20 0.5 N/A SM 5310B
CL
PBDE
congeners
(pg / sample)
SPMD and SPE
extract 40
5–10,000
per cong 10–100 EPA 1614 EPA 1614
CL NBFRs (pg /
sample)
SPMD and SPE
extract 40
30–
10,000 30–50000 EPA 1614
Amended EPA
1614
Sediment and Tissue Samples
CL
PBDE
congeners (ng /
Kg)
Sediments/tissue 40
0.5–
25000
per cong
10–100 EPA 1614 EPA 1614
CL NBFRs (pg / g) Sediments/tissue 40 0.3–5000 0.3–500 EPA 1614 Amended EPA
1614
MEL Total organic
carbon (%) Sediments 30 1–15% 0.1% PSEP TOC PSEP TOC
UW C and N
isotopes Sediments/tissue 60
0.1–2.0
(%N);
1.0–15
(%C)
0.10% lyophilization
ǂ stable
isotopes of N
and C
CL Grain size Sediment 20 1–15% 0.1% N/A PSEP
MEL = Manchester Environmental Lab CL = contract Lab UW = University of Washington IsoLab ǂ Costech Elemental Analyzer, Conflo III, MAT253

QAPP: Assessing Sources of Toxic Chemicals Impacting Juvenile Chinook Salmon 33
9.2 Sample preparation method(s)
Laboratory sample preparation methods are found in Table 12.
9.3 Special method requirements
There are no special method requirements.
9.4 Laboratories accredited for methods
A summary of lab responsibilities can be found in Table 12. A contract laboratory will be sought
for the PBDE analysis on all environmental media. A laboratory waiver will be sought for the C
and N stable isotope analysis on tissues. The UW IsoLab will be used for this analysis.

34 August 2019
10.0 Quality Control Procedures
10.1 Table of field and laboratory quality control
Table 13. Quality control samples, types, and frequency.
Parameter
Field Laboratory
Blanks Replicates Check
Standards Method Blanks
Analytical Duplicates
Matrix Spikes
OPR Standards
Water or SPMD samples
Suspended sediment concentrations
10% of
samples 1/batch 1/batch 1/batch
TOC/DOC 10% of
samples 1/batch 1/batch 1/batch 1/batch
PBDE congeners and NBFRs
3/sample collection
10% of samples
1/batch 1/batch 1/batch 1/batch 1/sample collection
Sediment and Tissue Samples
PBDE congeners and NBFRs
10% of
samples 1/batch 1/batch 1/batch
All samples
Total organic carbon
10% of
samples 1/batch 1/batch 1/batch
C and N isotopes
10% of
samples 1/batch 1/batch
Grain size 10% of
samples 1/batch 1/batch
10.2 Corrective action processes
The laboratory analysts will document whether project data meets method QC criteria. Any
departures from normal analytical methods will be documented by the laboratory and described
in the data package from the laboratories as well as in the final report for the project. If any
samples do not meet QC criteria, the project manager will determine whether data should be re-
analyzed, rejected, or used with appropriate qualification.
Field instruments will be checked and calibrated prior to the fieldwork. The post-field check of
the instrument should be within the MQOs defined in Table 8. The appropriate qualification or
rejection threshold is detailed in the MQOs.

QAPP: Assessing Sources of Toxic Chemicals Impacting Juvenile Chinook Salmon 35
11.0 Data Management Procedures
11.1 Data recording and reporting requirements
Field data will be recorded in a bound, waterproof notebook on Rite in the Rain paper.
Corrections will be made with single line strikethroughs, initials, and date. Data will be
transferred to Microsoft Excel templates for creating data tables and entry into EIM. Data will be
entered into EIM by the project data steward. Once entered into EIM, the project manager will
verify the sample locations and project description. An R script will be used to verify each entry
with the original laboratory data EDD and data tables.
11.2 Laboratory data package requirements
The laboratory data package will be generated or overseen by MEL. MEL will provide a project
data package that will include: a narrative discussing any problems encountered in the analyses,
corrective actions taken, changes to the referenced method, and an explanation of data qualifiers.
Quality control results will be evaluated by MEL (discussed below in Section 13.0 Data
Verification). A level 4 data package will be required from the contract lab.
The following data qualifiers will be used:
“J” – The analyte was positively identified. The associated numerical result is an estimate.
“UJ” – The analyte was not detected at or above the estimated reporting limit.
“NJ” – The analysis indicates the presence of an analyte that has been “tentatively identified”
and the associated numerical value represents its approximate concentration.
The qualifiers will be used in accordance with the method reporting limits such that:
For non-detect values, the estimated detection limit (EDL) is recorded in the “Result
Reported Value” column and a “UJ” in the “Result Data Qualifier” column.
No results are reported below the EDL.
Only results reported are for those congeners that have a value at least FIVE times the signal-
to-noise ratio, and that meet ion abundance ratios required by the method.
Detected values that are below the quantitation limits (QL) are reported and qualified as
estimates (“J”).
Results that do not meet ion abundance ratio criteria are reported with “NJ.” If an Estimated
Maximum Possible Concentration (EMPC) value is calculated and reported, the calculation is
explained in the narrative, and an example calculation used for this value is provided.
Results that contain interference from polychlorinated diphenyl ethers (PCDEs) are qualified
with “NJ.”

36 August 2019
11.3 Electronic transfer requirements
All laboratory data will be accessed and downloaded from MEL’s Laboratory Information
Management System (LIMS) into Excel spreadsheets. The contract lab will provide an electronic
data deliverable (EDD) that meets the format defined by MEL.
11.4 EIM/STORET data upload procedures
All completed project data will be entered into Ecology’s Environmental Information
Management (EIM) database for availability to the public and interested parties, with the
exception of the surface water data generated using SPMDs. Concentrations of PBDEs generated
using SPMDs are considered estimates by Ecology and are not entered into EIM.
Data entered into EIM follow a formal data review process where data are reviewed by the
project manager, the person entering the data, and an independent reviewer.
EIM can be accessed on Ecology’s Internet homepage at www.ecology.wa.gov. The project will
be searchable under Study ID WHOB010.
11.5 Model information management
NA

QAPP: Assessing Sources of Toxic Chemicals Impacting Juvenile Chinook Salmon 37
12.0 Audits and Reports
12.1 Field, laboratory, and other audits
No defined audit exists for the fieldwork in this project.
The Ecology Environmental Laboratory Accreditation Program evaluates a laboratory’s quality
system, staff, facilities and equipment, test methods, records, and reports. It also establishes that
the laboratory is capable of providing accurate, defensible data. All assessments are available
from Ecology upon request, including MEL’s internal performance and audits.
12.2 Responsible personnel
The project manager will be responsible for all reporting.
12.3 Frequency and distribution of reports
One final report will be written at the end of the project summarizing the study and describing
the assessment of PBDE pathways and potential sources in the Snohomish River Basin.
12.4 Responsibility for reports
The report will be authored by William Hobbs.

38 August 2019
13.0 Data Verification
13.1 Field data verification, requirements, and responsibilities
The field assistant will review field notes once they are entered into Excel spreadsheets.
Oversight will be provided by the project manager.
13.2 Laboratory data verification
As previously described, MEL will oversee the review and verification of all laboratory data
packages. All data generated by the contract lab must be included in the final data package,
including but not limited to:
A text narrative.
Analytical result reports.
Analytical sequence (run) logs.
Chromatograms.
Spectra for all standards.
Environmental samples.
Batch QC samples.
Preparation benchsheets.
All of the necessary QA/QC documentation must be provided, including results from matrix
spikes, replicates, and blanks.
13.3 Validation requirements, if necessary
A level 2B data validation will be requested for this project, but will include the conversion of
contract laboratory flags to MEL-amended qualifiers. Data validation will be carried out by the
MEL QA Coordinator. A level 4 data package will be required from the contract lab, should a
level 4 data validation be necessary in the future.
13.4 Model quality assessment
NA

QAPP: Assessing Sources of Toxic Chemicals Impacting Juvenile Chinook Salmon 39
14.0 Data Quality (Usability) Assessment
14.1 Process for determining project objectives were met
The project manager will determine if the project data are useable by assessing whether the data
have met the MQOs outlined in Tables 7 and 8. Based on this assessment, the data will either be
accepted, accepted with appropriate qualifications, or rejected and re-analysis considered.
14.2 Treatment of non-detects and data qualifiers
The handling of non-detects will be relevant to the summing of PBDE congeners. Non-detect
values (U, UJ) are assigned a value of zero for the summing process when the group of analytes
being summed has both detected and non-detected results. Alternatively, for results with large
numbers of non-detects, the Kaplan-Meier method can be used to compute the mean
concentration that is then multiplied by the number of analytes (Helsel, 2012).
If qualified data comprise more than 10% of the total summed concentration, then the total
concentration should be qualified. If qualified data make up less than 10% of the total summed
concentration, the total should not be qualified. Data sums will be qualified with:
“J” if that is the only qualifier used.
“NJ” if that is the only qualifier used.
“J” if there is a mix of “J” and “NJ” qualifiers.
When all values for individual analytes in the group are reported as non-detects and the reporting
limits are different, the highest value present is assigned as the “total” value. The sum “total”
will be qualified with:
“U” if that is the only qualifier used.
“UJ” if that is the only qualifier used.
“U” if there is a mix of both “U” and “UJ.”
14.3 Data analysis and presentation methods
No specific numerical analyses are necessary for this project. The data analysis will follow the
approach of Hobbs (2018). Time-integrated samples (SPMDs and biofilms) do alleviate some of
the replication necessary for instantaneous grab samples because they represent average
exposure concentrations. However, if possible, the sample collections will be of sufficient size
(minimum three) to statistically compare different sections of the river, including regional
background samples. In order to determine whether there are true differences between upstream
and downstream samples, efforts will be made to constrain the local variability of the sample
media (through replication) and use this as a confidence interval when comparing sample
concentrations.

40 August 2019
14.4 Sampling design evaluation
The sampling design of this project will undergo evaluation between sampling events. The
effectiveness of the sample media, the spatial resolution of the samples, and our ability to access
the necessary sample sites will undergo revision if necessary.
14.5 Documentation of assessment
The final report will present the findings, interpretations, and recommendations from this study

QAPP: Assessing Sources of Toxic Chemicals Impacting Juvenile Chinook Salmon 41
15.0 References Arkoosh, M.R., Boylen, D., Dietrich, J., Anulacion, B.F., Bravo, C.F., Johnson, L.L., Loge, F.J.
and Collier, T.K. 2010. Disease susceptibility of salmon exposed to polybrominated diphenyl
ethers (PBDEs). Aquatic toxicology, 98: 51-59.
Arkoosh, M.R., Van Gaest, A.L., Strickland, S.A., Hutchinson, G.P., Krupkin, A.B., and
Dietrich, J.P. 2015. Dietary exposure to individual polybrominated diphenyl ether congeners
BDE-47 and BDE-99 alters innate immunity and disease susceptibility in juvenile Chinook
salmon. Environmental science & technology, 49: 6974-6981.
Beckvar, N. 2005. Approaches for linking whole-body fish tissue residues of mercury or DDT to
biological effects thresholds. Environ. Toxicol. Chem. 24(8): 2094-2105.
Birnbaum, L.S. and Staskal, D.F. 2003. Brominated Flame Retardants: Cause for Concern?
Environmental Health Perspectives. 112(1):9 – 17.
Blakely, N. 2008. Standard Operating Procedure for Obtaining Freshwater Sediment Samples.
Washington State Department of Ecology, Olympia. SOP Number EAP040.
www.ecology.wa.gov/quality.html
Cusimano, R.F. 1997. Snohomish River Estuary Dry Season TMDL Study – Phase II.
Washington State Department of Ecology, Olympia, WA. Publication No. 97-325.
https://fortress.wa.gov/ecy/publications/SummaryPages/97325.html
Dinn, P.M., Johannessen, S.C., Ross, P.S., Macdonald, R.W., Whiticar, M.J., Lowe, C.J. and van
Roodselaar, A. 2012. PBDE and PCB accumulation in benthos near marine wastewater outfalls:
the role of sediment organic carbon. Environmental pollution 171: 241-248.
Duffy, E.J. and Beauchamp, D.A. 2011. Rapid growth in the early marine period improves the
marine survival of Chinook salmon (Oncorhynchus tshawytscha) in Puget Sound, Washington.
Canadian Journal of Fisheries and Aquatic Sciences, 68: 232-240.
Duffy, E.J., Beauchamp, D.A., Sweeting, R.M., Beamish, R.J. and Brennan, J.S. 2010.
Ontogenetic diet shifts of juvenile Chinook salmon in nearshore and offshore habitats of Puget
Sound. Transactions of the American Fisheries Society, 139: 803-823.
Dutch, M., Partridge, V., Weakland, S., Burgess, D., and Eagleston A. 2018. Quality Assurance
Monitoring Plan: The Puget Sound Sediment Monitoring Program. Washington State
Department of Ecology, Olympia. Publication 18-03-109.
https://fortress.wa.gov/ecy/publications/summarypages/1803109.html
Ecology. 2006. Washington State Polybrominated Diphenyl Ether (PBDE) Chemical Action
Plan: Final Plan. Washington State Department of Ecology, Olympia. Publication 05-07-048.
https://fortress.wa.gov/ecy/publications/summarypages/0507048.html
Ecology and Herrera Environmental Consultants. 2010. Summary Technical Report, Control of
Toxic Chemicals in Puget Sound, Phase 3: Loadings from POTW Discharge of Treated

42 August 2019
Wastewater. Washington State Department of Ecology, Olympia. Publication 10-10-057.
https://fortress.wa.gov/ecy/publications/summarypages/1010057.html
Ecology and King County. 2011. Control of Toxic Chemicals in Puget Sound: Assessment of
Selected Toxic Chemicals in the Puget Sound Basin, 2007-2011. Washington State Department
of Ecology, Olympia, and King County Department of Natural Resources, Seattle, WA. Ecology
Publication No. 11-03-055. https://fortress.wa.gov/ecy/publications/documents/1103055.pdf
Environment Canada. 2006. Supporting Working Document for the Environmental Screening
Assessment of Polybrominated Diphenyl Ethers. Environment Canada, Gatineau, June 2006,
222pp.
Environment Canada. 2013. Federal Environmental Quality Guidelines: Polybrominated
Diphenyl Ethers (PBDEs). Environment Canada, Government of Canada.
Fresh, K. L., E. Casillas, L. L. Johnson, and D. L. Bottom. 2005. Role of the estuary in the
recovery of Columbia River basin salmon and steelhead: an evaluation of the effects of selected
factors on salmonid population viability. NOAA Technical Memorandum NMFS-NWFSC-69.
Friese, M. 2014. Standard Operating Procedures for Decontaminating Field Equipment for
Sampling Toxics in the Environment. Washington State Department of Ecology, Olympia. SOP
Number EAP090. www.ecology.wa.gov/quality.html
Frouin, H., Jackman, P., Dangerfield, N.D., and Ross, P.S. 2017. Effects of Feeding Strategy,
Sediment Characteristics, and Chemical Properties on Polychlorinated Biphenyl and
Polybrominated Diphenyl Ether Bioaccumulation from Marine Sediments in Two Invertebrates.
Archives of environmental contamination and toxicology, 73: 256-269.
Hale, R.C., Alaee, M., Manchester-Neesvig, J.B., Stapleton, H.M., and Ikonomou, M.G. 2003.
Polybrominated diphenyl ether flame retardants in the North American environment.
Environment International. 29: 771-779
Helsel, D.R. 2012. Statistics for Censored Environmental Data Using Minitab and R, 2nd edition.
John Wiley and Sons, New Jersey. p. 324.
Hobbs, W. 2018. Wenatchee River PCB Source Assessment: 2016 and 2017. Washington State
Department of Ecology, Olympia. Publication No. 18-03-010.
https://fortress.wa.gov/ecy/publications/summarypages/1803010.html
Huckins, J.N., Petty, J.D., and Booij, K. 2006. Monitors of organic chemicals in the
environment: Semipermeable membrane devices. Springer, New York, USA. 223p.
ISAB/ISRP (Independent Scientific Advisory Board/Independent Scientific Review Panel).
2016. Northwest Power and Conservation Council, Columbia River Indian Tribes, and National
Marine Fisheries Service. Northwest Power and Conservation Council, Portland OR. Report
2016-1. https://www.nwcouncil.org/sites/default/files/isabisrp2016-1.pdf
Johnson, A., Seiders, K., Deligeannis, C., Kinney, K., Sandvik, P., Era-Miller, B., and Alkire, D.
2006. PBDE Flame Retardants in Washington Rivers and Lakes: Concentrations in Fish and

QAPP: Assessing Sources of Toxic Chemicals Impacting Juvenile Chinook Salmon 43
Water, 2005–06. Washington State Department of Ecology, Olympia. Publication No. 06-03-
027. https://fortress.wa.gov/ecy/publications/SummaryPages/0603027.html
Johnson, A., Carmack, K., Era-Miller, B., Lubliner, B., Golding, S., and Coots, R. 2010. Yakima
River Pesticides and PCBs Total Maximum Daily Load: Volume 1. Water Quality Study
Findings. Washington State Department of Ecology, Olympia. Publication No. 10-03-018.
https://fortress.wa.gov/ecy/publications/SummaryPages/1003018.html
Johnson, L., Anulacion, B., Arkoosh, M., Olson, O.P., Sloan, C., Sol, S.Y., Spromberg, J., Teel,
D.J., Yanagida, G. and Ylitalo, G., 2013. Persistent organic pollutants in juvenile Chinook
salmon in the Columbia River basin: implications for stock recovery. Transactions of the
American Fisheries Society, 142(1), pp.21–40.
Joy, J. 2006. Standard Operating Procedure for Grab Sampling – Fresh Water, Version
1.0. Washington State Department of Ecology, Olympia. SOP Number EAP015.
www.ecology.wa.gov/quality.html
Krahn, M.M., Hanson, M.B., Baird, R.W., Boyer, R.H., Burrows, D.G., Emmons, C.K., Ford,
J.K., Jones, L.L., Noren, D.P., Ross, P.S. and Schorr, G.S. 2007. Persistent organic pollutants
and stable isotopes in biopsy samples (2004/2006) from Southern Resident killer whales. Marine
pollution bulletin, 54(12), pp.1903–1911.
Larson, C. and Collyard, S. 2019. Standard Operating Procedure EAP111, Version 1.14:
Periphyton Sampling, Processing, and Identification in Streams and Rivers. Washington State
Department of Ecology, Olympia. Publication No. 19-03-207.
https://fortress.wa.gov/ecy/publications/SummaryPages/1903207.html
Mathieu, C. and Wong, S. 2016. Brominated Flame Retardants, Alkylphenolic Compounds, and
Hexabromocyclododecane in Freshwater Fish of Washington State Rivers and Lakes.
Washington State Department of Ecology, Olympia. Publication No. 16-03-012.
https://fortress.wa.gov/ecy/publications/SummaryPages/1603012.html
Meador, J.P., Collier, T.K., and Stein, J.E. 2002. Use of tissue and sediment-based threshold
concentrations of polychlorinated biphenyls (PCBs) to protect juvenile salmonids listed under
the US Endangered Species Act. Aquat. Conserv.: Mar. Freshwat. Ecosyst. 12(5): 493-516.
Meador, J.P., Ylitalo, G.M., Sommers, F.C. and Boyd, D.T. 2010. Bioaccumulation of
polychlorinated biphenyls in juvenile Chinook salmon (Oncorhynchus tshawytscha)
outmigrating through a contaminated urban estuary: dynamics and application. Ecotoxicology,
19: 141-152.
NMFS (National Marine Fisheries Service) and NOAA (National Oceanic and Atmospheric
Administration). 2014. Endangered and Threatened Wildlife; Final Rule to Revise the Code of
Federal Regulations for Species Under the Jurisdiction of the National Marine Fisheries Service.
Federal Register 79 (71) 20802.
O’Neill, S.M., Carey, A.J., Lanksbury, J.A., Niewolny, L.A., Ylitalo, G., Johnson, L. and West,
J.E. 2015. Toxic contaminants in juvenile Chinook salmon (Oncorhynchus tshawytscha)
migrating through estuary, nearshore and offshore habitats of Puget Sound. Washington
Department of Fish and Wildlife Report FPT16-02. https://wdfw.wa.gov/publications/01796

44 August 2019
O’Neill, S.M, Research Scientist, Washington Department of Fish and Wildlife. Personal
communication 6/5/19.
Parsons, J., Hallock, D., Seiders, K., Ward, B., Coffin, C., Newell, E., Deligeannis, C., and
Welch, K. 2018. Standard Operating Procedure EAP070, Version 2.2: Minimize the Spread of
Invasive Species. Washington State Department of Ecology, Olympia. Publication No. 18-03-
201. https://fortress.wa.gov/ecy/publications/SummaryPages/1803201.html
Quinn, T.P. 2005. The Behavior and Ecology of Pacific Salmon and Trout. University of
Washington Press, Seattle, WA.
Seiders, K., Deligannis, C., and Sandvik, P. 2007. Washington State Toxics Monitoring
Program: Contaminants in Fish Tissue from Freshwater Environments in 2004 and 2005.
Washington State Department of Ecology, Olympia. Publication No. 07-03-024.
https://fortress.wa.gov/ecy/publications/SummaryPages/0703024.html
Seiders, K., Sandvik, P., and Johnson, A. 2012a. Standard Operating Procedures for Conducting
Studies using Semi-Permeable Membrane Devices (SPMDs). Washington State Department of
Ecology, Olympia. SOP Number EAP001. www.ecology.wa.gov/quality.html
Seiders, K. and Sandvik, P. 2012b. Standard Operating Procedure for Semi-Permeable
Membrane Devices (SPMDs) Data Management and Data Reduction. Washington State
Department of Ecology, Olympia. SOP Number EAP079. www.ecology.wa.gov/quality.html
Sloan, C.A., Anulacion, B.F., Bolton, J.L., Boyd, D., Olson, O.P., Sol, S.Y., Ylitalo, G.M. and
Johnson, L.L. 2010. Polybrominated diphenyl ethers in outmigrant juvenile Chinook salmon
from the lower Columbia River and Estuary and Puget Sound, Washington. Archives of
environmental contamination and toxicology, 58: 403-414.
SBSRF [Snohomish Basin Salmon Recovery Forum]. June 2005. Snohomish River Basin
Salmon Conservation Plan. Snohomish County Department of Public Works, Surface Water
Management Division. Everett, WA.
https://snohomishcountywa.gov/ArchiveCenter/ViewFile/Item/2153
Song, M., Chu, S., Letcher, R.J. and Seth, R. 2006. Fate, partitioning, and mass loading of
polybrominated diphenyl ethers (PBDEs) during the treatment processing of municipal sewage.
Environmental science & technology, 40: 6241-6246.
Stevenson, R.J. and Bahls, L. “Periphyton Protocols” in Barbour, M.T., J. Gerritsen, B.D.
Snyder, and J.B. Stribling, 1999. Rapid Bioassessment Protocols for Use in Streams and
Wadeable Rivers: Periphyton, Benthic Macroinvertebrates and Fish, Second Edition. EPA 841-
B-99-002. U.S. Environmental Protection Agency; Office of Water; Washington, D.C.
Sutton, R., Chen, D., Sun, J., Greig, D.J., and Wu, Y. 2019. Characterization of brominated,
chlorinated, and phosphate flame retardants in San Francisco Bay, an urban estuary. Science of
the Total Environment, Vol. 652: 212-223.
Swanson, T. 2007. Standard Operating Procedure for Hydrolab® DataSonde® and MiniSonde®
Multiprobes, Version 1.0. Washington State Department of Ecology, Olympia. SOP Number
EAP033. www.ecology.wa.gov/quality.html

QAPP: Assessing Sources of Toxic Chemicals Impacting Juvenile Chinook Salmon 45
WAC 173-204. Sediment Management Standards in the State of Washington. Washington State
Department of Ecology, Olympia, WA. www.ecology.wa.gov/laws-rules/ecywac.html.
Wong, S. 2019. Standard Operating Procedure EAP094, Version 1.0: Sampling Trace
Contaminants Using Continuous Low-Level Monitoring Devices (CLAMs). Washington State
Department of Ecology, Olympia. Publication No. 19-03-213.
https://fortress.wa.gov/ecy/publications/SummaryPages/1903213.html

46 August 2019
16.0 Appendices

Appendix A. Results of Previous Fish Tissue Studies
Table A-1. Results of PBDE concentrations in fish tissues from previous studies in the Snohomish River Basin.
All samples are composites of muscle tissue, concentrations are in wet weight.
Waterbody Year Study ID Species Lat Long t-PBDEs (ppb) % lipids
Snohomish R 2014 EAP 16-03-012 MWF 47.8754 -122.087 5.03 3.2
Snohomish R 2014 EAP 16-03-012 MWF 47.8754 -122.087 36.97 2.5
Snohomish R 2014 EAP 16-03-012 PEA 47.8754 -122.087 1.99 1.8
Snohomish R 2014 EAP 16-03-012 PEA 47.8754 -122.087 2.78 1.7
Snohomish R 2005 EAP 06-03-027 LSS 47.8754 -122.087 11.37 2.4
Snohomish R 2005 EAP 06-03-027 MWF 47.8754 -122.087 33.20 4.1
Snohomish R 2005 EAP 06-03-027 CTT 47.8754 -122.087 25.18 3.6
Snohomish R 2005 EAP 06-03-027 NPM 47.8754 -122.087 12.07 2.5
Skykomish R 2008 WSTMP08 MWF 47.8436 -121.695 10.00 3.2
Snoqualmie R 2008 WSTMP08 MWF 47.6921 -121.966 25.80 4.2
Lake Stevens 2014 EAP 16-03-012 BBH 48.005 -122.082 4.56 3.8
Lake Stevens 2014 EAP 16-03-012 BBH 48.005 -122.082 5.23 3.0
Lake Stevens 2014 EAP 16-03-012 LMB 48.005 -122.082 3.63 1.2
Lake Stevens 2014 EAP 16-03-012 LMB 48.005 -122.082 4.40 1.8
Lake Stevens 2008 WSTMP08 RBT 48.005 -122.082 4.90 0.7
Lake Stevens 2008 WSTMP08 KOK 48.005 -122.082 17.20 2.0
Goodwin Lake 2008 WSTMP08 LMB 48.1462 -122.295 5.20 0.7
Goodwin Lake 2008 WSTMP08 RBT 48.1462 -122.295 7.30 1.9
Goodwin Lake 2008 WSTMP08 SMB 48.1462 -122.295 5.20 0.6
Spada Lake 2007 WSTMP07 CTT 47.97 -121.65 1.52 0.4
Port Gardner Bay 2013 13WB_EHN-MXW01 Mussel 47.9721 -122.232 3.35 unk
Port Gardner Bay 2013 13WB_EH-MTW01 Mussel 47.9721 -122.232 1.64 unk
Tulalip Bay 2013 13WB_HP-MTW01 Mussel 48.06175 -122.293 0.99 unk

Waterbody Year Study ID Species Lat Long t-PBDEs (ppb) % lipids
Tulalip Bay 2013 13WB_HPN-MXW01 Mussel 48.06175 -122.293 2.13 unk
Port Gardner Bay 2013 13SNME01-TW01 Juv Chin 48.03284 -122.244 3.84 unk
Port Gardner Bay 2013 13SNME01-TW02 Juv Chin 48.03284 -122.244 3.01 unk
Port Gardner Bay 2013 13SNME01-TW03 Juv Chin 48.03284 -122.244 3.98 unk
Port Gardner Bay 2013 13SNME01-TW04 Juv Chin 48.03284 -122.244 4.41 unk
Port Gardner Bay 2013 13SNME01-TW05 Juv Chin 48.03284 -122.244 3.58 unk
Port Gardner Bay 2013 13SNME02-TW01 Juv Chin 47.95964 -122.264 3.37 unk
Port Gardner Bay 2013 13SNME02-TW02 Juv Chin 47.95964 -122.264 4.42 unk
Port Gardner Bay 2013 13SNME02-TW03 Juv Chin 47.95964 -122.264 5.58 unk
Port Gardner Bay 2013 13SNME02-TW04 Juv Chin 47.95964 -122.264 18.98 unk
Port Gardner Bay 2013 13SNME02-TW05 Juv Chin 47.95964 -122.264 7.61 unk
Port Gardner Bay 2013 13WB-TW01A Juv Chin 48.01221 -122.343 4.33 unk
Snohomish R 2013 13SNMR-TW01 Juv Chin 48.00422 -122.178 31.57 unk
Snohomish R 2013 13SNMR-TW02 Juv Chin 48.00422 -122.178 16.69 unk
Snohomish R 2013 13SNMR-TW03 Juv Chin 48.00422 -122.178 38.88 unk
Snohomish R 2013 13SNMR-TW04 Juv Chin 48.00422 -122.178 34.16 unk
MWF – mountain whitefish (Prosopium williamsoni) PEA – peamouth chub (Mylocheilus caurinus) LSS – largescale sucker (Catostomus macrocheilus) NPM – northern pikeminnow (Ptychocheilus oregonensis) BBH – black bullhead (Ameiurus melas) LMB – largemouth bass (Micropterus salmoides) SMB – smallmouth bass (Micropterus dolomieu) CTT – cutthroat trout (Oncorhynchus clarkia) RBT – rainbow trout (Oncorhynchus mykiss) Juv Chin – juvenile Chinook salmon (Oncorhynchus tshawytscha) KOK – kokanee salmon (Oncorhynchus nerka) Mussel – nearshore bay mussel, Mytilus trossulus

QAPP: Assessing Sources of Toxic Chemicals Impacting Juvenile Chinook Salmon 49
Appendix B. Glossaries, Acronyms, and Abbreviations
Glossary of General Terms
Clean Water Act: A federal act passed in 1972 that contains provisions to restore and maintain
the quality of the nation’s waters. Section 303(c) requires the adoption of water quality
standards. Section 303(d) of the Clean Water Act establishes the TMDL program. Section 304(a)
establishes the publication of federally recommended water quality criteria. Section 402
establishes the National Pollutant Discharge Elimination System (NPDES).
Dissolved oxygen (DO): A measure of the amount of oxygen dissolved in water.
Effluent: An outflowing of water from a natural body of water or from a human-made structure.
For example, the treated outflow from a wastewater treatment plant.
National Pollutant Discharge Elimination System (NPDES): National program for issuing,
modifying, revoking and reissuing, terminating, monitoring, and enforcing permits, and
imposing and enforcing pretreatment requirements under the Clean Water Act. The NPDES
program regulates discharges from wastewater treatment plants, large factories, and other
facilities that use, process, and discharge water back into lakes, streams, rivers, bays, and oceans.
Nonpoint source: Pollution that enters any waters of the state from any dispersed land-based or
water-based activities, including but not limited to atmospheric deposition, surface-water runoff
from agricultural lands, urban areas, or forest lands, subsurface or underground sources, or
discharges from boats or marine vessels not otherwise regulated under the NPDES program.
Generally, any unconfined and diffuse source of contamination. Legally, any source of water
pollution that does not meet the legal definition of “point source” in section 502(14) of the Clean
Water Act.
pH: A measure of the acidity or alkalinity of water. A low pH value (0 to 7) indicates that an
acidic condition is present, while a high pH (7 to 14) indicates a basic or alkaline condition. A
pH of 7 is considered to be neutral. Since the pH scale is logarithmic, a water sample with a pH
of 8 is ten times more basic than one with a pH of 7.
Point source: Source of pollution that discharges at a specific location from pipes, outfalls, and
conveyance channels to a surface water. Examples of point source discharges include domestic
wastewater treatment plants, industrial wastewater treatment facilities, and stormwater from
certain municipal systems and industrial and construction activities.
Salmonid: Fish that belong to the family Salmonidae. Species of salmon, trout, or char.
Sediment: Settled particulate matter located in the biologically active aquatic zone, or exposed
to the water column (for example, river or lake bottom). Refer to WAC 173-204-200(24).
Stormwater: The portion of precipitation that does not naturally percolate into the ground or
evaporate but instead runs off roads, pavement, and roofs during rainfall or snow melt.
Stormwater can also come from hard or saturated grass surfaces such as lawns, pastures,
playfields, and from gravel roads and parking lots.

50 August 2019
Synoptic survey: Data collected simultaneously or over a short period of time.
Total suspended solids (TSS): Portion of solids retained by a filter.
Watershed: A drainage area or basin in which all land and water areas drain or flow toward a
central collector such as a stream, river, or lake at a lower elevation.
303(d) list: Section 303(d) of the federal Clean Water Act, requiring Washington State to
periodically prepare a list of all surface waters in the state for which beneficial uses of the water
– such as for drinking, recreation, aquatic habitat, and industrial use – are impaired by pollutants.
These are water quality-limited estuaries, lakes, and streams that fall short of state surface water
quality standards and are not expected to improve within the next two years.

QAPP: Assessing Sources of Toxic Chemicals Impacting Juvenile Chinook Salmon 51
Acronyms and Abbreviations
DO (see Glossary above)
DOC Dissolved organic carbon
Ecology Washington State Department of Ecology
EIM Environmental Information Management database
et al. And others
MEL Manchester Environmental Laboratory
MQO Measurement quality objective
NBFR Novel Brominated Flame Retardant
NPDES (See Glossary above)
PBDE polybrominated diphenyl ethers
PCB polychlorinated biphenyls
QA Quality assurance
QC Quality control
RM River mile
RPD Relative percent difference
SOP Standard operating procedures
SSC Suspended Sediment Concentrations
TOC Total organic carbon
TSS (See Glossary above)
WAC Washington Administrative Code
WDFW Washington Department of Fish and Wildlife
WRIA Water Resource Inventory Area
WWTP Wastewater treatment plant
Units of Measurement
cfs cubic feet per second
MG/day millions of gallons per day
mg/L milligrams per liter (parts per million)
ng/kg nanograms per kilogram (parts per trillion)
pg/g picograms per gram (parts per trillion)
pg/L picograms per liter (parts per quadrillion)
μg/kg micrograms per kilogram (parts per billion)
μg/L micrograms per liter (parts per billion)
ww wet weight

52 August 2019
Quality Assurance Glossary
Accreditation: A certification process for laboratories, designed to evaluate and document a
lab’s ability to perform analytical methods and produce acceptable data. For Ecology, it is
“Formal recognition by (Ecology)…that an environmental laboratory is capable of producing
accurate analytical data.” [WAC 173-50-040] (Kammin, 2010)
Accuracy: The degree to which a measured value agrees with the true value of the measured
property. USEPA recommends that this term not be used, and that the terms precision and bias
be used to convey the information associated with the term accuracy (USGS, 1998).
Analyte: An element, ion, compound, or chemical moiety (pH, alkalinity) which is to be
determined. The definition can be expanded to include organisms, e.g., fecal coliform, Klebsiella
(Kammin, 2010).
Bias: The difference between the sample mean and the true value. Bias usually describes a
systematic difference reproducible over time and is characteristic of both the measurement
system and the analyte(s) being measured. Bias is a commonly used data quality indicator (DQI)
(Kammin, 2010; Ecology, 2004).
Blank: A synthetic sample, free of the analyte(s) of interest. For example, in water analysis, pure
water is used for the blank. In chemical analysis, a blank is used to estimate the analytical
response to all factors other than the analyte in the sample. In general, blanks are used to assess
possible contamination or inadvertent introduction of analyte during various stages of the
sampling and analytical process (USGS, 1998).
Calibration: The process of establishing the relationship between the response of a
measurement system and the concentration of the parameter being measured (Ecology, 2004).
Check standard: A substance or reference material obtained from a source independent from
the source of the calibration standard; used to assess bias for an analytical method. This is an
obsolete term, and its use is highly discouraged. See Calibration Verification Standards, Lab
Control Samples (LCS), Certified Reference Materials (CRM), and/or spiked blanks. These are
all check standards but should be referred to by their actual designator, e.g., CRM, LCS
(Kammin, 2010; Ecology, 2004).
Comparability: The degree to which different methods, data sets and/or decisions agree or can
be represented as similar; a data quality indicator (USEPA, 1997).
Completeness: The amount of valid data obtained from a project compared to the planned
amount. Usually expressed as a percentage. A data quality indicator (USEPA, 1997).
Continuing Calibration Verification Standard (CCV): A quality control (QC) sample
analyzed with samples to check for acceptable bias in the measurement system. The CCV is
usually a midpoint calibration standard that is re-run at an established frequency during the
course of an analytical run (Kammin, 2010).

QAPP: Assessing Sources of Toxic Chemicals Impacting Juvenile Chinook Salmon 53
Control chart: A graphical representation of quality control results demonstrating the
performance of an aspect of a measurement system (Kammin, 2010; Ecology 2004).
Control limits: Statistical warning and action limits calculated based on control charts. Warning
limits are generally set at +/- 2 standard deviations from the mean, action limits at +/- 3 standard
deviations from the mean (Kammin, 2010).
Data integrity: A qualitative DQI that evaluates the extent to which a data set contains data that
is misrepresented, falsified, or deliberately misleading (Kammin, 2010).
Data quality indicators (DQI): Commonly used measures of acceptability for environmental
data. The principal DQIs are precision, bias, representativeness, comparability, completeness,
sensitivity, and integrity (USEPA, 2006).
Data quality objectives (DQO): Qualitative and quantitative statements derived from
systematic planning processes that clarify study objectives, define the appropriate type of data,
and specify tolerable levels of potential decision errors that will be used as the basis for
establishing the quality and quantity of data needed to support decisions (USEPA, 2006).
Data set: A grouping of samples organized by date, time, analyte, etc. (Kammin, 2010).
Data validation: An analyte-specific and sample-specific process that extends the evaluation of
data beyond data verification to determine the usability of a specific data set. It involves a
detailed examination of the data package, using both professional judgment and objective
criteria, to determine whether the MQOs for precision, bias, and sensitivity have been met. It
may also include an assessment of completeness, representativeness, comparability, and
integrity, as these criteria relate to the usability of the data set. Ecology considers four key
criteria to determine if data validation has actually occurred. These are:
Use of raw or instrument data for evaluation.
Use of third-party assessors.
Data set is complex.
Use of EPA Functional Guidelines or equivalent for review.
Examples of data types commonly validated would be:
Gas Chromatography (GC).
Gas Chromatography-Mass Spectrometry (GC-MS).
Inductively Coupled Plasma (ICP).
The end result of a formal validation process is a determination of usability that assigns
qualifiers to indicate usability status for every measurement result. These qualifiers include:
No qualifier – data are usable for intended purposes.
J (or a J variant) – data are estimated, may be usable, may be biased high or low.
REJ – data are rejected, cannot be used for intended purposes.
(Kammin, 2010; Ecology, 2004).
Data verification: Examination of a data set for errors or omissions, and assessment of the Data
Quality Indicators related to that data set for compliance with acceptance criteria (MQOs).
Verification is a detailed quality review of a data set (Ecology, 2004).

54 August 2019
Detection limit (limit of detection): The concentration or amount of an analyte which can be
determined to a specified level of certainty to be greater than zero (Ecology, 2004).
Duplicate samples: Two samples taken from and representative of the same population, and
carried through and steps of the sampling and analytical procedures in an identical manner.
Duplicate samples are used to assess variability of all method activities including sampling and
analysis (USEPA, 1997).
Field blank: A blank used to obtain information on contamination introduced during sample
collection, storage, and transport (Ecology, 2004).
Initial Calibration Verification Standard (ICV): A QC sample prepared independently of
calibration standards and analyzed along with the samples to check for acceptable bias in the
measurement system. The ICV is analyzed prior to the analysis of any samples (Kammin, 2010).
Laboratory Control Sample (LCS): A sample of known composition prepared using
contaminant-free water or an inert solid that is spiked with analytes of interest at the midpoint of
the calibration curve or at the level of concern. It is prepared and analyzed in the same batch of
regular samples using the same sample preparation method, reagents, and analytical methods
employed for regular samples (USEPA, 1997).
Matrix spike: A QC sample prepared by adding a known amount of the target analyte(s) to an
aliquot of a sample to check for bias due to interference or matrix effects (Ecology, 2004).
Measurement Quality Objectives (MQOs): Performance or acceptance criteria for individual
data quality indicators, usually including precision, bias, sensitivity, completeness,
comparability, and representativeness (USEPA, 2006).
Measurement result: A value obtained by performing the procedure described in a method
(Ecology, 2004).
Method: A formalized group of procedures and techniques for performing an activity (e.g.,
sampling, chemical analysis, data analysis), systematically presented in the order in which they
are to be executed (EPA, 1997).
Method blank: A blank prepared to represent the sample matrix, prepared and analyzed with a
batch of samples. A method blank will contain all reagents used in the preparation of a sample,
and the same preparation process is used for the method blank and samples (Ecology, 2004;
Kammin, 2010).
Method Detection Limit (MDL): This definition for detection was first formally advanced in
40CFR 136, October 26, 1984 edition. MDL is defined there as the minimum concentration of an
analyte that, in a given matrix and with a specific method, has a 99% probability of being
identified, and reported to be greater than zero (Federal Register, October 26, 1984).

QAPP: Assessing Sources of Toxic Chemicals Impacting Juvenile Chinook Salmon 55
Percent Relative Standard Deviation (%RSD): A statistic used to evaluate precision in
environmental analysis. It is determined in the following manner:
%RSD = (100 * s)/x
where s is the sample standard deviation and x is the mean of results from more than two
replicate samples (Kammin, 2010).
Parameter: A specified characteristic of a population or sample. Also, an analyte or grouping of
analytes. Benzene and nitrate + nitrite are all parameters (Kammin, 2010; Ecology, 2004).
Population: The hypothetical set of all possible observations of the type being investigated
(Ecology, 2004).
Precision: The extent of random variability among replicate measurements of the same property;
a data quality indicator (USGS, 1998).
Quality assurance (QA): A set of activities designed to establish and document the reliability
and usability of measurement data (Kammin, 2010).
Quality Assurance Project Plan (QAPP): A document that describes the objectives of a
project, and the processes and activities necessary to develop data that will support those
objectives (Kammin, 2010; Ecology, 2004).
Quality control (QC): The routine application of measurement and statistical procedures to
assess the accuracy of measurement data (Ecology, 2004).
Relative Percent Difference (RPD): RPD is commonly used to evaluate precision. The
following formula is used:
[Abs(a-b)/((a + b)/2)] * 100
where “Abs()” is absolute value and a and b are results for the two replicate samples. RPD can
be used only with 2 values. Percent Relative Standard Deviation is (%RSD) is used if there are
results for more than 2 replicate samples (Ecology, 2004).
Replicate samples: Two or more samples taken from the environment at the same time and
place, using the same protocols. Replicates are used to estimate the random variability of the
material sampled (USGS, 1998).
Representativeness: The degree to which a sample reflects the population from which it is
taken; a data quality indicator (USGS, 1998).
Sample (field): A portion of a population (environmental entity) that is measured and assumed
to represent the entire population (USGS, 1998).
Sample (statistical): A finite part or subset of a statistical population (USEPA, 1997).

56 August 2019
Sensitivity: In general, denotes the rate at which the analytical response (e.g., absorbance,
volume, meter reading) varies with the concentration of the parameter being determined. In a
specialized sense, it has the same meaning as the detection limit (Ecology, 2004).
Spiked blank: A specified amount of reagent blank fortified with a known mass of the target
analyte(s); usually used to assess the recovery efficiency of the method (USEPA, 1997).
Spiked sample: A sample prepared by adding a known mass of target analyte(s) to a specified
amount of matrix sample for which an independent estimate of target analyte(s) concentration is
available. Spiked samples can be used to determine the effect of the matrix on a method’s
recovery efficiency (USEPA, 1997).
Split sample: A discrete sample subdivided into portions, usually duplicates (Kammin, 2010).
Standard Operating Procedure (SOP): A document which describes in detail a reproducible
and repeatable organized activity (Kammin, 2010).
Surrogate: For environmental chemistry, a surrogate is a substance with properties similar to
those of the target analyte(s). Surrogates are unlikely to be native to environmental samples.
They are added to environmental samples for quality control purposes, to track extraction
efficiency and/or measure analyte recovery. Deuterated organic compounds are examples of
surrogates commonly used in organic compound analysis (Kammin, 2010).
Systematic planning: A step-wise process which develops a clear description of the goals and
objectives of a project, and produces decisions on the type, quantity, and quality of data that will
be needed to meet those goals and objectives. The DQO process is a specialized type of
systematic planning (USEPA, 2006).
References for QA Glossary
Ecology, 2004. Guidance for the Preparation of Quality Assurance Project Plans for
Environmental Studies. Washington State Department of Ecology, Olympia, WA.
https://fortress.wa.gov/ecy/publications/SummaryPages/0403030.html
Kammin, B., 2010. Definition developed or extensively edited by William Kammin, 2010.
Washington State Department of Ecology, Olympia, WA.
USEPA, 1997. Glossary of Quality Assurance Terms and Related Acronyms. U.S.
Environmental Protection Agency.
USEPA, 2006. Guidance on Systematic Planning Using the Data Quality Objectives Process
EPA QA/G-4.
http://www.epa.gov/quality/qs-docs/g4-final.pdf
USGS, 1998. Principles and Practices for Quality Assurance and Quality Control. Open-File
Report 98-636. U.S. Geological Survey.
http://ma.water.usgs.gov/fhwa/products/ofr98-636.pdf