Embed Size (px)
Citation preview

Q4 – 2017Interim reportJanuary – December 2017

Contents
Highlights and Group performance 1Outlook for 2018 1
Interim report 5Telenor’s operations 5
Group performance 11
Interim condensed financial information 14Notes to the interim consolidated financial statements 19
Definitions 24
1 TELENOR FOURTH QUARTER 2017
Key figures Telenor Group
Fourth quarter Year
(NOK in millions) 2017 2016 2017 2016
Revenues 32 093 31 727 124 756 125 395
Organic revenue growth (%) (0.5) 0.6 0.7 0.8
Organic subscription and traffic revenue growth (%) 2.6 0.8 2.2 1.9
EBITDA before other income and other expenses 11 835 10 649 48 992 45 966
EBITDA before other income and other expenses/Revenues (%) 36.9 33.6 39.3 36.7
Net income attributable to equity holders of Telenor ASA 2 226 2 286 11 983 2 832
Capex excl. licences and spectrum/Revenues (%) 17.1 21.3 14.6 17.4
Capex/Revenues (%) 19.2 21.3 17.1 20.2
Free cash flow 3 327 1 509 24 867 10 300
Mobile subscriptions - Change in quarter/Total (mill.) 2.0 4.0 178 170
With effect from the first quarter 2017, Telenor India is treated as an asset held for sale and discontinued operations in Telenor’s financial reporting.
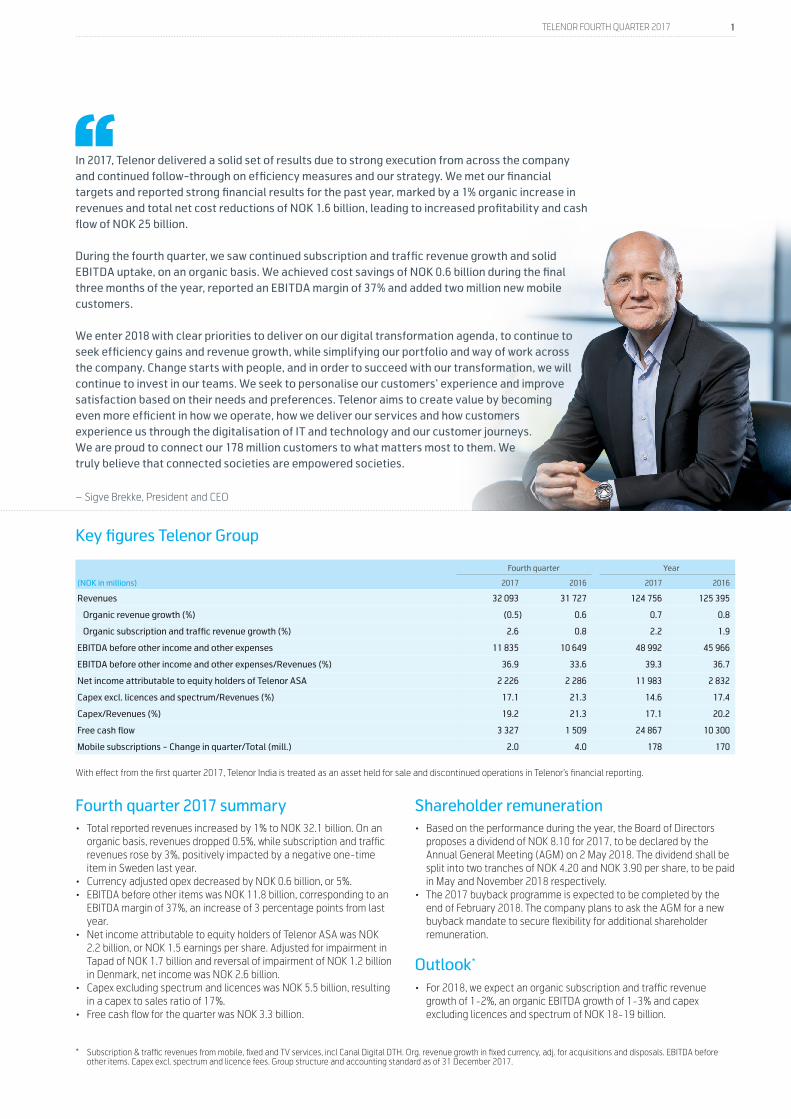
Fourth quarter 2017 summary• Total reported revenues increased by 1% to NOK 32.1 billion. On an
organic basis, revenues dropped 0.5%, while subscription and traffic revenues rose by 3%, positively impacted by a negative one-time item in Sweden last year.
• Currency adjusted opex decreased by NOK 0.6 billion, or 5%.• EBITDA before other items was NOK 11.8 billion, corresponding to an
EBITDA margin of 37%, an increase of 3 percentage points from last year.
• Net income attributable to equity holders of Telenor ASA was NOK 2.2 billion, or NOK 1.5 earnings per share. Adjusted for impairment in Tapad of NOK 1.7 billion and reversal of impairment of NOK 1.2 billion in Denmark, net income was NOK 2.6 billion.
• Capex excluding spectrum and licences was NOK 5.5 billion, resulting in a capex to sales ratio of 17%.
• Free cash flow for the quarter was NOK 3.3 billion.
Shareholder remuneration• Based on the performance during the year, the Board of Directors
proposes a dividend of NOK 8.10 for 2017, to be declared by the Annual General Meeting (AGM) on 2 May 2018. The dividend shall be split into two tranches of NOK 4.20 and NOK 3.90 per share, to be paid in May and November 2018 respectively.
• The 2017 buyback programme is expected to be completed by the end of February 2018. The company plans to ask the AGM for a new buyback mandate to secure flexibility for additional shareholder remuneration.
Outlook*
• For 2018, we expect an organic subscription and traffic revenue growth of 1-2%, an organic EBITDA growth of 1-3% and capex excluding licences and spectrum of NOK 18-19 billion.
In 2017, Telenor delivered a solid set of results due to strong execution from across the company and continued follow-through on efficiency measures and our strategy. We met our financial targets and reported strong financial results for the past year, marked by a 1% organic increase in revenues and total net cost reductions of NOK 1.6 billion, leading to increased profitability and cash flow of NOK 25 billion.
During the fourth quarter, we saw continued subscription and traffic revenue growth and solid EBITDA uptake, on an organic basis. We achieved cost savings of NOK 0.6 billion during the final three months of the year, reported an EBITDA margin of 37% and added two million new mobile customers.
We enter 2018 with clear priorities to deliver on our digital transformation agenda, to continue to seek efficiency gains and revenue growth, while simplifying our portfolio and way of work across the company. Change starts with people, and in order to succeed with our transformation, we will continue to invest in our teams. We seek to personalise our customers’ experience and improve satisfaction based on their needs and preferences. Telenor aims to create value by becoming even more efficient in how we operate, how we deliver our services and how customers experience us through the digitalisation of IT and technology and our customer journeys. We are proud to connect our 178 million customers to what matters most to them. We truly believe that connected societies are empowered societies.
– Sigve Brekke, President and CEO
* Subscription & traffic revenues from mobile, fixed and TV services, incl Canal Digital DTH. Org. revenue growth in fixed currency, adj. for acquisitions and disposals. EBITDA before other items. Capex excl. spectrum and licence fees. Group structure and accounting standard as of 31 December 2017.
2 TELENOR FOURTH QUARTER 2017
REVENUES
OPERATING EXPENDITURES (OPEX)
EBITDA BEFORE OTHER INCOME AND OTHER EXPENSES (EBITDA)
Group performance in the fourth quarter 20171)
1) The comments are related to Telenor’s development in the fourth quarter of 2017 compared to the fourth quarter of 2016 unless otherwise stated. Please refer to Definitions on page 24 for descriptions of alternative performance measures.
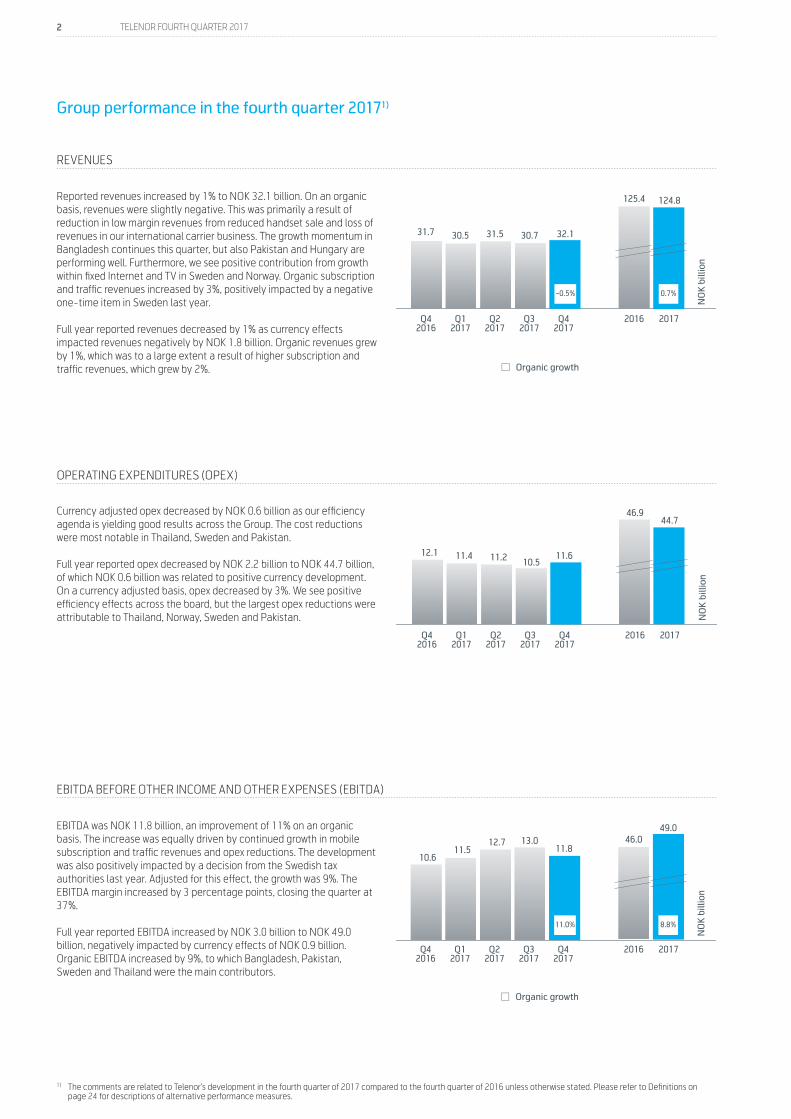
Reported revenues increased by 1% to NOK 32.1 billion. On an organic basis, revenues were slightly negative. This was primarily a result of reduction in low margin revenues from reduced handset sale and loss of revenues in our international carrier business. The growth momentum in Bangladesh continues this quarter, but also Pakistan and Hungary are performing well. Furthermore, we see positive contribution from growth within fixed Internet and TV in Sweden and Norway. Organic subscription and traffic revenues increased by 3%, positively impacted by a negative one-time item in Sweden last year.
Full year reported revenues decreased by 1% as currency effects impacted revenues negatively by NOK 1.8 billion. Organic revenues grew by 1%, which was to a large extent a result of higher subscription and traffic revenues, which grew by 2%.
EBITDA was NOK 11.8 billion, an improvement of 11% on an organic basis. The increase was equally driven by continued growth in mobile subscription and traffic revenues and opex reductions. The development was also positively impacted by a decision from the Swedish tax authorities last year. Adjusted for this effect, the growth was 9%. The EBITDA margin increased by 3 percentage points, closing the quarter at 37%.
Full year reported EBITDA increased by NOK 3.0 billion to NOK 49.0 billion, negatively impacted by currency effects of NOK 0.9 billion. Organic EBITDA increased by 9%, to which Bangladesh, Pakistan, Sweden and Thailand were the main contributors.
Currency adjusted opex decreased by NOK 0.6 billion as our efficiency agenda is yielding good results across the Group. The cost reductions were most notable in Thailand, Sweden and Pakistan.
Full year reported opex decreased by NOK 2.2 billion to NOK 44.7 billion, of which NOK 0.6 billion was related to positive currency development. On a currency adjusted basis, opex decreased by 3%. We see positive efficiency effects across the board, but the largest opex reductions were attributable to Thailand, Norway, Sweden and Pakistan.
Revenues
Opex
EBITDA
Capex
Net income
Free cash flow
Mobile
0
10
20
30
40
50
0
14
28
42
56
70
NO
K b
illio
n
Q42017
Q42016
Q12017
Q22017
Q32017
2016 2017
Q42017
Q42016
Q12017
Q22017
Q32017
2016 2017
Q42017
Q42016
Q12017
Q22017
Q32017
2016 2017
Q42017
Q42016
Q12017
Q22017
Q32017
2016 2017
Q42017
Q42016
Q12017
Q22017
Q32017
2016 2017
Q42017
Q42016
Q12017
Q22017
Q32017
2016 2017
31.7 30.5 31.5 30.7 32.1
125.4 124.8
0
5
10
15
20
0
5
10
15
20
25
30
NO
K b
illio
n
11.612.1 11.4 11.2 10.5
46.944.7
-0.5% 0.7%
0
5
10
15
150,00
156,25
162,50
168,75
175,00
0
5
10
15
20
25
NO
K b
illio
n
11.810.6
11.512.7 13.0 46.0
49.0
6.26.8
4.55.6 5.0
25.3
21.3
2.22.3
4.2
-0.2
5.8
2.8
12.0
9.4
3.31.5 2.2
9.9 10.3
24.9
11.0% 8.8%
0
5
10
15
0,000000
2,833333
5,666667
8,500000
11,333333
14,166667
17,000000
-5,000000-3,333333-1,6666670,0000001,6666673,3333335,0000006,6666678,333333
NO
K b
illio
nN
OK
bill
ion
NO
K b
illio
n
Q42017
Q42016
Q12017
Q22017
Q32017
177,8
169.8172.0
173.9175.8
50% 50% 50% 52% 52%
20
40
60
Q42015
Q12016
Q22016
Q32016
Q42016
203208 211 211
214
0
5
10
15
20
25
Mobile subscriptions of which active data users (%)
Capex Capex/Sales
Organic growth
Organic growth
0
20
40
60
80
19%21%15% 18% 16%
20% 17%

3 TELENOR FOURTH QUARTER 2017
NET INCOME
FREE CASH FLOW
CAPITAL EXPENDITURES (CAPEX)
Capex was NOK 6.2 billion, to which continued network expansion in Norway and Thailand were still the primary drivers. Capex for the quarter includes NOK 0.7 billion from the acquisition of 2x10MHz in the 1800 MHz spectrum band in Myanmar.
Full year capex decreased by NOK 4.1 billion to NOK 21.3 billion. The reduction was primarily explained by higher network expansion investments last year. During the year, NOK 3.1 billion was invested in spectrum and licences.
Free cash flow in the fourth quarter was NOK 3.3 billion. This is an increase of NOK 1.8 billion from last year. Improved EBITDA and lower spectrum payments were partly offset by higher tax and capex payments.
Full year free cash flow amounts to NOK 24.9 billion, which is an increase of NOK 14.6 billion compared to last year. This is mainly a result of higher EBITDA, lower capex and spectrum payments and proceeds from the online classifieds transaction, as well as the acquisition of Tapad in the previous year.
Reported net income to equity holders of Telenor ASA in the fourth quarter was NOK 2.2 billion, which is on level with last year. Improved operating profit was offset by reversal of VEON impairment last year.
Year to date, the net income to equity holders of Telenor ASA was NOK 12.0 billion, compared to 2.8 billion last year. Net income for both 2017 and 2016 were impacted by effects related to the disposal of shares in VEON and the sale of Telenor India. The improvement in net income in 2017 was primarily a result of lower losses from discontinued operations of NOK 7.4 billion and improved operating profit of NOK 2.4 billion.
Revenues
Opex
EBITDA
Capex
Net income
Free cash flow
Mobile
0
10
20
30
40
50
0
14
28
42
56
70
NO
K b
illio
n
Q42017
Q42016
Q12017
Q22017
Q32017
2016 2017
Q42017
Q42016
Q12017
Q22017
Q32017
2016 2017
Q42017
Q42016
Q12017
Q22017
Q32017
2016 2017
Q42017
Q42016
Q12017
Q22017
Q32017
2016 2017
Q42017
Q42016
Q12017
Q22017
Q32017
2016 2017
Q42017
Q42016
Q12017
Q22017
Q32017
2016 2017
31.7 30.5 31.5 30.7 32.1
125.4 124.8
0
5
10
15
20
0
5
10
15
20
25
30
NO
K b
illio
n
11.612.1 11.4 11.2 10.5
46.944.7
-0.5% 0.7%
0
5
10
15
150,00
156,25
162,50
168,75
175,00
0
5
10
15
20
25
NO
K b
illio
n
11.810.6
11.512.7 13.0 46.0
49.0
6.26.8
4.55.6 5.0
25.3
21.3
2.22.3
4.2
-0.2
5.8
2.8
12.0
9.4
3.31.5 2.2
9.9 10.3
24.9
11.0% 8.8%
0
5
10
15
0,000000
2,833333
5,666667
8,500000
11,333333
14,166667
17,000000
-5,000000-3,333333-1,6666670,0000001,6666673,3333335,0000006,6666678,333333
NO
K b
illio
nN
OK
bill
ion
NO
K b
illio
n
Q42017
Q42016
Q12017
Q22017
Q32017
177,8
169.8172.0
173.9175.8
50% 50% 50% 52% 52%
20
40
60
Q42015
Q12016
Q22016
Q32016
Q42016
203208 211 211
214
0
5
10
15
20
25
Mobile subscriptions of which active data users (%)
Capex Capex/Sales
Organic growth
Organic growth
0
20
40
60
80
19%21%15% 18% 16%
20% 17%
4 TELENOR FOURTH QUARTER 2017
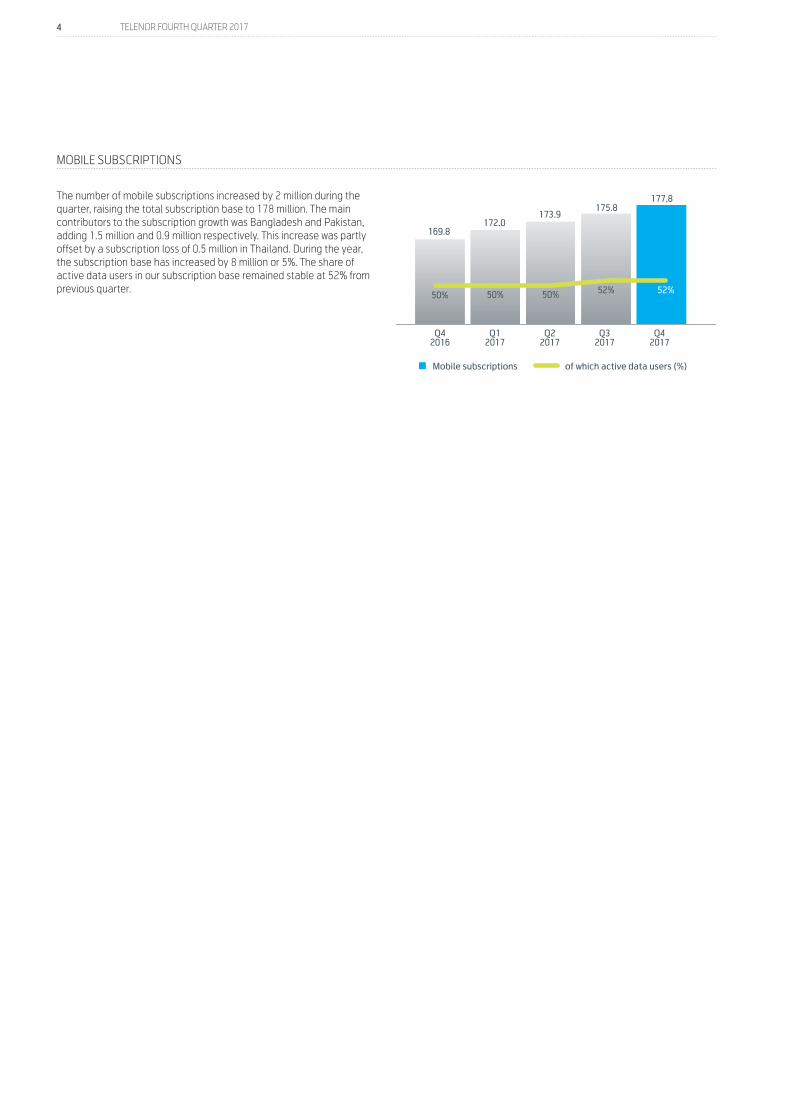
The number of mobile subscriptions increased by 2 million during the quarter, raising the total subscription base to 178 million. The main contributors to the subscription growth was Bangladesh and Pakistan, adding 1.5 million and 0.9 million respectively. This increase was partly offset by a subscription loss of 0.5 million in Thailand. During the year, the subscription base has increased by 8 million or 5%. The share of active data users in our subscription base remained stable at 52% from previous quarter.
MOBILE SUBSCRIPTIONS
Revenues
Opex
EBITDA
Capex
Net income
Free cash flow
Mobile
0
10
20
30
40
50
0
14
28
42
56
70
NO
K b
illio
n
Q42017
Q42016
Q12017
Q22017
Q32017
2016 2017
Q42017
Q42016
Q12017
Q22017
Q32017
2016 2017
Q42017
Q42016
Q12017
Q22017
Q32017
2016 2017
Q42017
Q42016
Q12017
Q22017
Q32017
2016 2017
Q42017
Q42016
Q12017
Q22017
Q32017
2016 2017
Q42017
Q42016
Q12017
Q22017
Q32017
2016 2017
31.7 30.5 31.5 30.7 32.1
125.4 124.8
0
5
10
15
20
0
5
10
15
20
25
30
NO
K b
illio
n
11.612.1 11.4 11.2 10.5
46.944.7
-0.5% 0.7%
0
5
10
15
150,00
156,25
162,50
168,75
175,00
0
5
10
15
20
25
NO
K b
illio
n
11.810.6
11.512.7 13.0 46.0
49.0
6.26.8
4.55.6 5.0
25.3
21.3
2.22.3
4.2
-0.2
5.8
2.8
12.0
9.4
3.31.5 2.2
9.9 10.3
24.9
11.0% 8.8%
0
5
10
15
0,000000
2,833333
5,666667
8,500000
11,333333
14,166667
17,000000
-5,000000-3,333333-1,6666670,0000001,6666673,3333335,0000006,6666678,333333
NO
K b
illio
nN
OK
bill
ion
NO
K b
illio
n
Q42017
Q42016
Q12017
Q22017
Q32017
177,8
169.8172.0
173.9175.8
50% 50% 50% 52% 52%
20
40
60
Q42015
Q12016
Q22016
Q32016
Q42016
203208 211 211
214
0
5
10
15
20
25
Mobile subscriptions of which active data users (%)
Capex Capex/Sales
Organic growth
Organic growth
0
20
40
60
80
19%21%15% 18% 16%
20% 17%
5 TELENOR FOURTH QUARTER 2017
Norway
Fourth quarter Year
(NOK in millions)2017 2016
Restated*2017 2016
Restated*
Revenues mobile operation
Subscription and traffic 2 746 2 774 11 030 11 288
Interconnect revenues 139 141 551 585
Other mobile revenues 270 267 1 138 1 064
Non-mobile revenues 823 701 2 314 2 114
Total revenues mobile operation 3 978 3 883 15 033 15 052
Revenues fixed operation
Telephony 348 428 1 498 1 806
Internet and TV 1 507 1 408 5 851 5 446
Data services 132 127 504 503
Other fixed revenues 413 483 1 603 1 715
Total retail revenues 2 401 2 446 9 456 9 470
Wholesale revenues 345 368 1 437 1 508
Total revenues fixed operation 2 745 2 814 10 893 10 978
Total revenues 6 723 6 697 25 926 26 030
Operating expenditures 2 368 2 445 9 171 9 493
EBITDA before other items 2 723 2 643 11 114 10 946
Operating profit 1 484 1 360 6 903 6 726
EBITDA before other items/Total revenues (%) 40.5 39.5 42.9 42.1
Capex 1 096 1 512 4 987 4 780
Investments in businesses 4 - 215 100
Statistics (monthly in NOK):
Mobile ARPU 322 316 320 319
Fixed Telephony ARPU 242 257 246 259
Fixed Internet ARPU 379 361 369 352
TV ARPU 320 292 312 284
No. of subscriptions - Change in quarter/Total (in thousands):
Mobile (10) (15) 2 984 3 066
Fixed telephony (20) (18) 472 546
Fixed Internet (4) 5 859 865
TV - 7 546 541
* Refer to note 10.
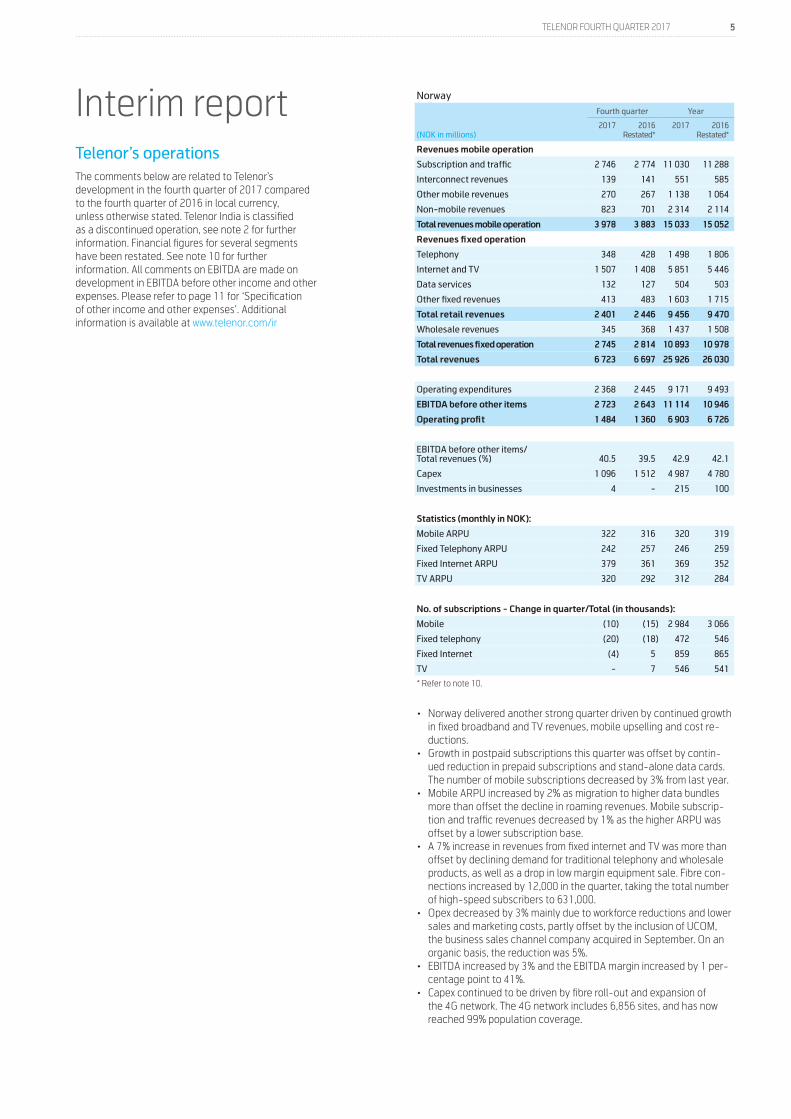
• Norway delivered another strong quarter driven by continued growth in fixed broadband and TV revenues, mobile upselling and cost re-ductions.
• Growth in postpaid subscriptions this quarter was offset by contin-ued reduction in prepaid subscriptions and stand-alone data cards. The number of mobile subscriptions decreased by 3% from last year.
• Mobile ARPU increased by 2% as migration to higher data bundles more than offset the decline in roaming revenues. Mobile subscrip-tion and traffic revenues decreased by 1% as the higher ARPU was offset by a lower subscription base.
• A 7% increase in revenues from fixed internet and TV was more than offset by declining demand for traditional telephony and wholesale products, as well as a drop in low margin equipment sale. Fibre con-nections increased by 12,000 in the quarter, taking the total number of high-speed subscribers to 631,000.
• Opex decreased by 3% mainly due to workforce reductions and lower sales and marketing costs, partly offset by the inclusion of UCOM, the business sales channel company acquired in September. On an organic basis, the reduction was 5%.
• EBITDA increased by 3% and the EBITDA margin increased by 1 per-centage point to 41%.
• Capex continued to be driven by fibre roll-out and expansion of the 4G network. The 4G network includes 6,856 sites, and has now reached 99% population coverage.
Interim report Telenor’s operations The comments below are related to Telenor’s development in the fourth quarter of 2017 compared to the fourth quarter of 2016 in local currency, unless otherwise stated. Telenor India is classified as a discontinued operation, see note 2 for further information. Financial figures for several segments have been restated. See note 10 for further information. All comments on EBITDA are made on development in EBITDA before other income and other expenses. Please refer to page 11 for ‘Specification of other income and other expenses’. Additional information is available at www.telenor.com/ir
6 TELENOR FOURTH QUARTER 2017
Sweden
Fourth quarter Year
(NOK in millions)2017 2016
Restated*2017 2016
Restated*
Revenues mobile operation
Subscription and traffic 1 557 1 235 6 123 5 926
Interconnect revenues 137 126 596 557
Other mobile revenues 102 86 379 351
Non-mobile revenues 735 822 2 219 2 256
Total revenues mobile operation 2 531 2 269 9 317 9 090
Revenues fixed operation
Telephony 66 75 285 346
Internet and TV 706 637 2 660 2 492
Data services 53 38 201 171
Other fixed revenues 113 25 303 97
Total retail revenues 938 775 3 448 3 106
Wholesale revenues 46 46 172 188
Total revenues fixed operation 984 821 3 620 3 294
Total revenues 3 514 3 090 12 938 12 384
Operating expenditures 1 076 1 118 4 211 4 375
EBITDA before other items 1 066 615 4 136 3 538
Operating profit 727 43 2 730 1 759
EBITDA before other items/Total revenues (%) 30.3 19.9 32.0 28.6
Capex 611 586 1 690 1 560
Investments in businesses - - 113 -
Statistics (monthly in NOK):
Mobile ARPU 210 177 210 210
Fixed Telephony ARPU 64 67 67 75
Fixed Internet ARPU 217 205 213 216
TV ARPU 147 122 139 122
No. of subscriptions - Change in quarter/Total (in thousands):
Mobile 7 34 2 689 2 624
Fixed telephony (9) (7) 185 215
Fixed Internet (1) 6 679 657
TV (5) (21) 470 469
Exchange rate (SEK) 0.9680 0.9814
* Refer to note 10.
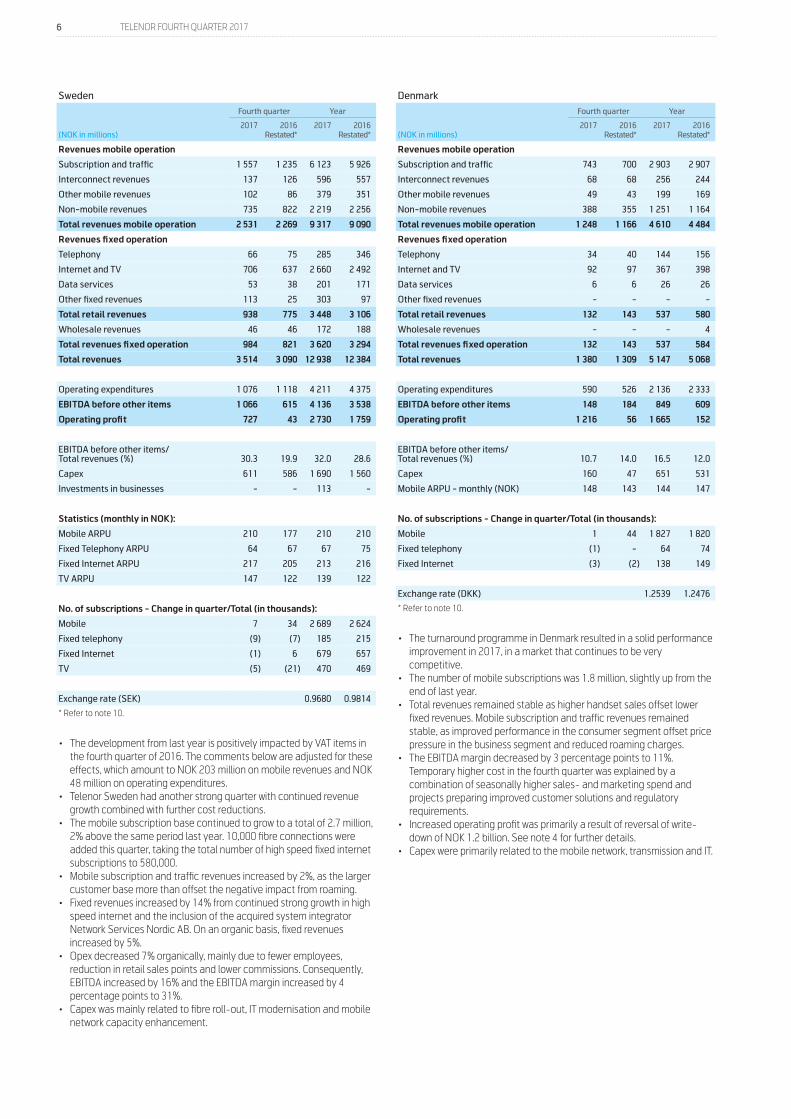
• The development from last year is positively impacted by VAT items in the fourth quarter of 2016. The comments below are adjusted for these effects, which amount to NOK 203 million on mobile revenues and NOK 48 million on operating expenditures.
• Telenor Sweden had another strong quarter with continued revenue growth combined with further cost reductions.
• The mobile subscription base continued to grow to a total of 2.7 million, 2% above the same period last year. 10,000 fibre connections were added this quarter, taking the total number of high speed fixed internet subscriptions to 580,000.
• Mobile subscription and traffic revenues increased by 2%, as the larger customer base more than offset the negative impact from roaming.
• Fixed revenues increased by 14% from continued strong growth in high speed internet and the inclusion of the acquired system integrator Network Services Nordic AB. On an organic basis, fixed revenues increased by 5%.
• Opex decreased 7% organically, mainly due to fewer employees, reduction in retail sales points and lower commissions. Consequently, EBITDA increased by 16% and the EBITDA margin increased by 4 percentage points to 31%.
• Capex was mainly related to fibre roll-out, IT modernisation and mobile network capacity enhancement.
Denmark
Fourth quarter Year
(NOK in millions)2017 2016
Restated*2017 2016
Restated*
Revenues mobile operation
Subscription and traffic 743 700 2 903 2 907
Interconnect revenues 68 68 256 244
Other mobile revenues 49 43 199 169
Non-mobile revenues 388 355 1 251 1 164
Total revenues mobile operation 1 248 1 166 4 610 4 484
Revenues fixed operation
Telephony 34 40 144 156
Internet and TV 92 97 367 398
Data services 6 6 26 26
Other fixed revenues - - - -
Total retail revenues 132 143 537 580
Wholesale revenues - - - 4
Total revenues fixed operation 132 143 537 584
Total revenues 1 380 1 309 5 147 5 068
Operating expenditures 590 526 2 136 2 333
EBITDA before other items 148 184 849 609
Operating profit 1 216 56 1 665 152
EBITDA before other items/Total revenues (%) 10.7 14.0 16.5 12.0
Capex 160 47 651 531
Mobile ARPU - monthly (NOK) 148 143 144 147
No. of subscriptions - Change in quarter/Total (in thousands):
Mobile 1 44 1 827 1 820
Fixed telephony (1) - 64 74
Fixed Internet (3) (2) 138 149
Exchange rate (DKK) 1.2539 1.2476
* Refer to note 10.
• The turnaround programme in Denmark resulted in a solid performance improvement in 2017, in a market that continues to be very competitive.
• The number of mobile subscriptions was 1.8 million, slightly up from the end of last year.
• Total revenues remained stable as higher handset sales offset lower fixed revenues. Mobile subscription and traffic revenues remained stable, as improved performance in the consumer segment offset price pressure in the business segment and reduced roaming charges.
• The EBITDA margin decreased by 3 percentage points to 11%.Temporary higher cost in the fourth quarter was explained by a combination of seasonally higher sales- and marketing spend and projects preparing improved customer solutions and regulatory requirements.
• Increased operating profit was primarily a result of reversal of write-down of NOK 1.2 billion. See note 4 for further details.
• Capex were primarily related to the mobile network, transmission and IT.

7 TELENOR FOURTH QUARTER 2017
Hungary
Fourth quarter Year
(NOK in millions) 2017 2016 2017 2016
Revenues
Subscription and traffic 954 863 3 686 3 561
Interconnect revenues 75 67 278 269
Other mobile revenues 27 19 100 80
Non-mobile revenues 180 146 570 526
Total revenues 1 237 1 094 4 634 4 436
Operating expenditures 400 405 1 500 1 576
EBITDA before other items 341 294 1 503 1 369
Operating profit 190 171 951 773
EBITDA before other items/ Total revenues (%) 27.6 26.9 32.4 30.9
Capex 88 163 309 390
No. of subscriptions - Change in quarter/Total (in thousands): 43 (41) 3 125 3 148
ARPU - monthly (NOK) 111 98 106 101
Exchange rate (HUF) 0.0302 0.0298
• Hungary sees a strong performance this quarter, with a solid revenue growth on top of significant cost reductions.
• The number of mobile subscriptions increased by 43,000 driven by strong consumer postpaid uptake and prepaid growth. The subscription base was 1% lower than last year due to the reduction in the prepaid segment.
• Total revenues increased by 7%, driven by higher ARPU from continued upselling within the consumer postpaid segment and migration from prepaid to postpaid. Mobile subscription and traffic revenues improved by 5%.
• As a result of the revenue growth combined with a 6% opex reduction, EBITDA increased by 9%.
Bulgaria
Fourth quarter Year
(NOK in millions) 2017 2016 2017 2016
Revenues
Subscription and traffic 591 576 2 287 2 297
Interconnect revenues 69 68 261 269
Other mobile revenues 11 8 54 42
Non-mobile revenues 201 175 618 560
Total revenues 871 827 3 220 3 168
Operating expenditures 264 268 996 1 040
EBITDA before other items 276 287 1 179 1 191
Operating profit 137 150 598 616
EBITDA before other items/ Total revenues (%) 31.7 34.6 36.6 37.6
Capex 106 154 221 320
No. of subscriptions - Change in quarter/Total (in thousands): (80) (111) 3 153 3 429
ARPU - monthly (NOK) 69 62 65 61
Exchange rate (BGN) 4.7689 4.7494
• In Bulgaria we continue to see solid momentum on cost reductions.• Mobile subscriptions decreased by 80.000 driven by a combination
of seasonal churn and continued market decline within prepaid subscriptions. The subscription base was 8% lower than last year.
• Total revenues decreased by 1% as lower mobile subscription and traffic revenues were partly offset by increased handset revenues. Mobile subscription and traffic revenues decreased as higher ARPU did not compensate for the lower number of subscribers, especially within prepaid.
• EBITDA decreased by 10% as an opex reduction of 7% was more than offset by lower revenues and increased roaming cost following roaming regulation.
Montenegro & Serbia
Fourth quarter Year
(NOK in millions)2017 2016
Restated*2017 2016
Restated*
Revenues
Subscription and traffic 640 595 2 501 2 486
Interconnect revenues 172 174 630 752
Other mobile revenues 20 17 96 106
Non-mobile revenues 217 136 676 491
Total revenues 1 049 924 3 903 3 835
Operating expenditures 263 259 997 1 039
EBITDA before other items 357 306 1 456 1 395
Operating profit 217 168 909 883
EBITDA before other items/ Total revenues (%) 34.0 33.1 37.3 36.4
Capex 98 145 321 490
No. of subscriptions - Change in quarter/Total (in thousands): (135) (148) 3 166 3 339
ARPU - monthly (NOK) 84 75 80 79
Exchange rate (RSD) 0.0767 0.0755
Exchange rate (EUR) 9.3271 9.2889
* Refer to note 10.
• In Montenegro and Serbia we continue to see results of solid execution on cost efficiency initiatives.
• The number of mobile subscriptions decreased by 135,000, driven by seasonal churn and an overall declining trend in the prepaid segment. At the end of fourth quarter, the subscription base was 5% lower than at the same period last year.
• Total revenues increased by 4% driven by increased handset sale, partly offset by reduced interconnect and mobile subscription and traffic revenues. There was a significant increase in sale of handsets on instalment plans, shifting revenues from mobile subscription and traffic revenues to handset revenues.
• EBITDA increased by 6% driven by continued strong focus on operational efficiency, resulting in a solid 7% opex reduction.
8 TELENOR FOURTH QUARTER 2017
dtac - Thailand
Fourth quarter Year
(NOK in millions) 2017 2016 2017 2016
Revenues
Subscription and traffic 3 980 3 756 15 620 15 237
Interconnect revenues 208 259 841 1 085
Other mobile revenues 46 37 184 174
Non-mobile revenues 799 1 035 2 444 3 151
Total revenues 5 033 5 086 19 089 19 647
Operating expenditures 1 763 1 828 6 969 7 404
EBITDA before other items 1 938 1 599 7 413 6 645
Operating profit 229 129 1 086 1 160
EBITDA before other items/Total revenues (%) 38.5 31.4 38.8 33.8
Capex 1 088 1 413 4 027 4 835
No. of subscriptions - Change in quarter/Total (in thousands): (460) (340) 22 652 24 480
ARPU - monthly (NOK) 61 55 58 54
Exchange rate (THB) 0.2435 0.2381
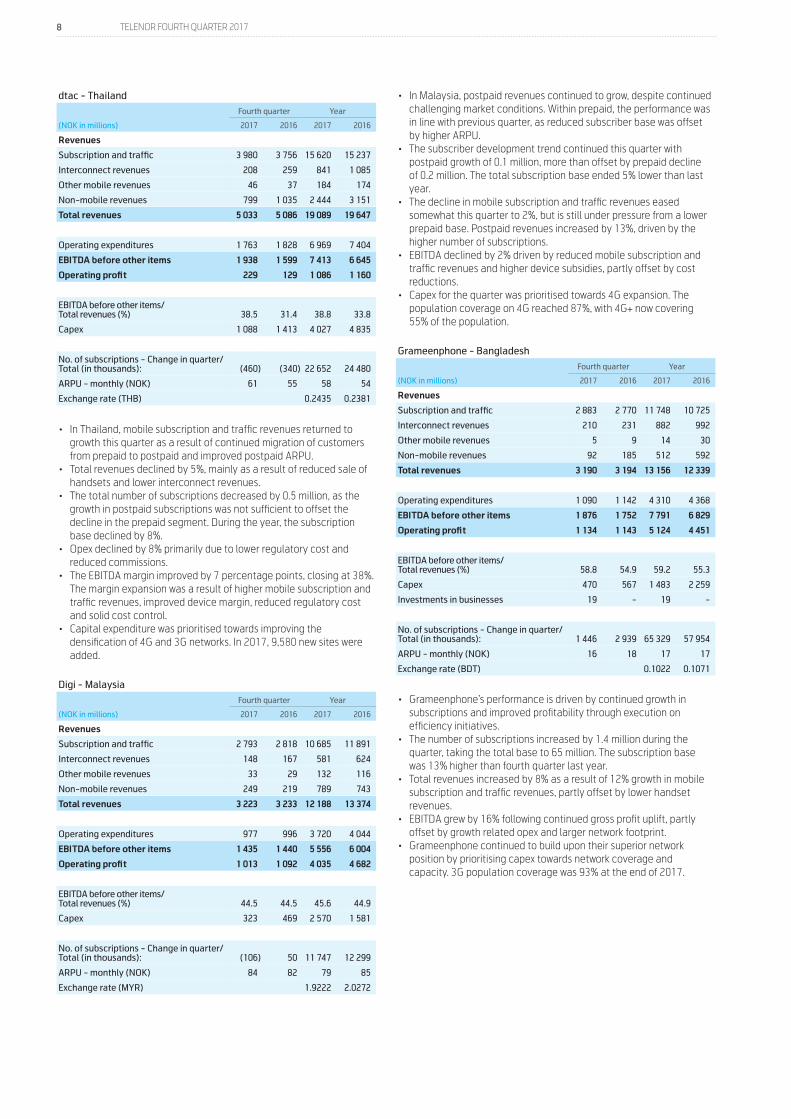
• In Thailand, mobile subscription and traffic revenues returned to growth this quarter as a result of continued migration of customers from prepaid to postpaid and improved postpaid ARPU.
• Total revenues declined by 5%, mainly as a result of reduced sale of handsets and lower interconnect revenues.
• The total number of subscriptions decreased by 0.5 million, as the growth in postpaid subscriptions was not sufficient to offset the decline in the prepaid segment. During the year, the subscription base declined by 8%.
• Opex declined by 8% primarily due to lower regulatory cost and reduced commissions.
• The EBITDA margin improved by 7 percentage points, closing at 38%. The margin expansion was a result of higher mobile subscription and traffic revenues, improved device margin, reduced regulatory cost and solid cost control.
• Capital expenditure was prioritised towards improving the densification of 4G and 3G networks. In 2017, 9,580 new sites were added.
Digi - Malaysia
Fourth quarter Year
(NOK in millions) 2017 2016 2017 2016
Revenues
Subscription and traffic 2 793 2 818 10 685 11 891
Interconnect revenues 148 167 581 624
Other mobile revenues 33 29 132 116
Non-mobile revenues 249 219 789 743
Total revenues 3 223 3 233 12 188 13 374
Operating expenditures 977 996 3 720 4 044
EBITDA before other items 1 435 1 440 5 556 6 004
Operating profit 1 013 1 092 4 035 4 682
EBITDA before other items/Total revenues (%) 44.5 44.5 45.6 44.9
Capex 323 469 2 570 1 581
No. of subscriptions - Change in quarter/Total (in thousands): (106) 50 11 747 12 299
ARPU - monthly (NOK) 84 82 79 85
Exchange rate (MYR) 1.9222 2.0272
• In Malaysia, postpaid revenues continued to grow, despite continued challenging market conditions. Within prepaid, the performance was in line with previous quarter, as reduced subscriber base was offset by higher ARPU.
• The subscriber development trend continued this quarter with postpaid growth of 0.1 million, more than offset by prepaid decline of 0.2 million. The total subscription base ended 5% lower than last year.
• The decline in mobile subscription and traffic revenues eased somewhat this quarter to 2%, but is still under pressure from a lower prepaid base. Postpaid revenues increased by 13%, driven by the higher number of subscriptions.
• EBITDA declined by 2% driven by reduced mobile subscription and traffic revenues and higher device subsidies, partly offset by cost reductions.
• Capex for the quarter was prioritised towards 4G expansion. The population coverage on 4G reached 87%, with 4G+ now covering 55% of the population.
Grameenphone - Bangladesh
Fourth quarter Year
(NOK in millions) 2017 2016 2017 2016
Revenues
Subscription and traffic 2 883 2 770 11 748 10 725
Interconnect revenues 210 231 882 992
Other mobile revenues 5 9 14 30
Non-mobile revenues 92 185 512 592
Total revenues 3 190 3 194 13 156 12 339
Operating expenditures 1 090 1 142 4 310 4 368
EBITDA before other items 1 876 1 752 7 791 6 829
Operating profit 1 134 1 143 5 124 4 451
EBITDA before other items/Total revenues (%) 58.8 54.9 59.2 55.3
Capex 470 567 1 483 2 259
Investments in businesses 19 - 19 -
No. of subscriptions - Change in quarter/Total (in thousands): 1 446 2 939 65 329 57 954
ARPU - monthly (NOK) 16 18 17 17
Exchange rate (BDT) 0.1022 0.1071
• Grameenphone’s performance is driven by continued growth in subscriptions and improved profitability through execution on efficiency initiatives.
• The number of subscriptions increased by 1.4 million during the quarter, taking the total base to 65 million. The subscription base was 13% higher than fourth quarter last year.
• Total revenues increased by 8% as a result of 12% growth in mobile subscription and traffic revenues, partly offset by lower handset revenues.
• EBITDA grew by 16% following continued gross profit uplift, partly offset by growth related opex and larger network footprint.
• Grameenphone continued to build upon their superior network position by prioritising capex towards network coverage and capacity. 3G population coverage was 93% at the end of 2017.
9 TELENOR FOURTH QUARTER 2017
Pakistan
Fourth quarter Year
(NOK in millions)2017 2016
Restated*2017 2016
Restated*
Revenues
Subscription and traffic 1 603 1 612 6 644 6 315
Interconnect revenues 282 297 1 174 1 162
Other mobile revenues 6 6 20 (25)
Non-mobile revenues 117 62 342 247
Total revenues 2 008 1 976 8 181 7 698
Operating expenditures 715 840 2 788 3 050
EBITDA before other items 966 844 4 204 3 441
Operating profit 552 470 2 678 2 166
EBITDA before other items/Total revenues (%) 48.1 42.7 51.4 44.7
Capex 532 621 1 438 4 898
No. of subscriptions - Change in quarter/Total (in thousands): 924 1 195
41 625 39 428
ARPU - monthly (NOK) 15 16 16 17
Exchange rate (PKR) 0.0785 0.0802
* Refer to note 10.
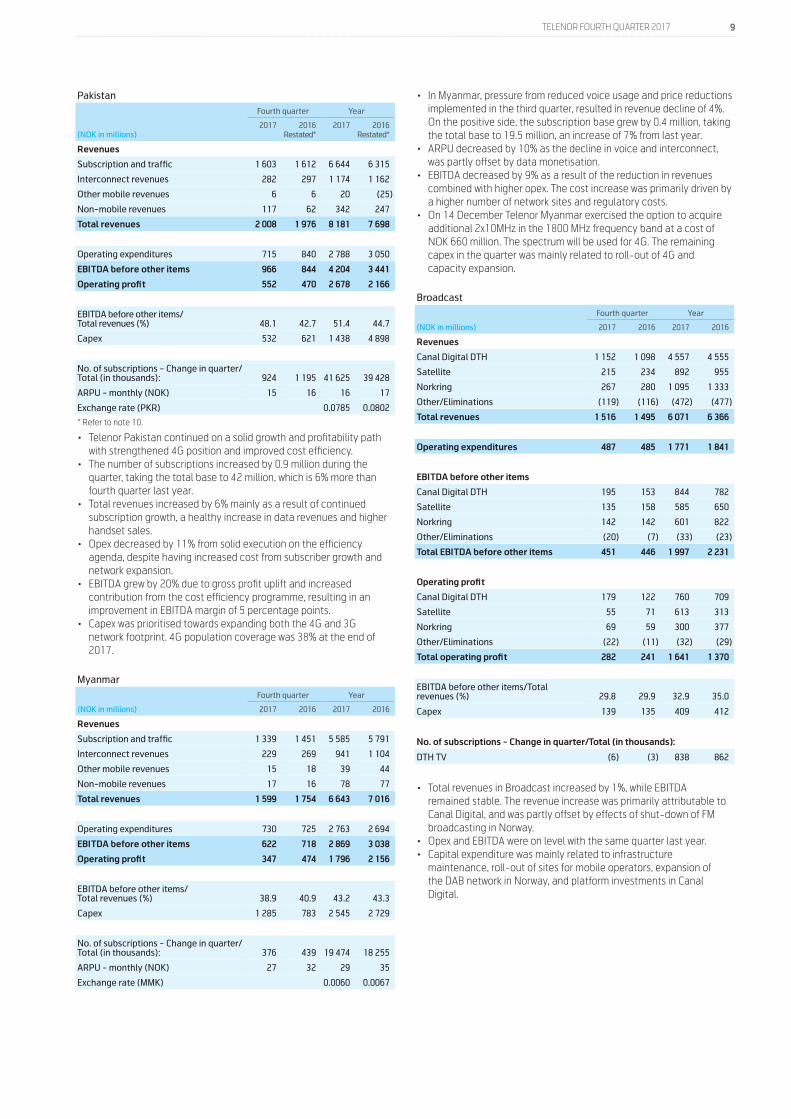
• Telenor Pakistan continued on a solid growth and profitability path with strengthened 4G position and improved cost efficiency.
• The number of subscriptions increased by 0.9 million during the quarter, taking the total base to 42 million, which is 6% more than fourth quarter last year.
• Total revenues increased by 6% mainly as a result of continued subscription growth, a healthy increase in data revenues and higher handset sales.
• Opex decreased by 11% from solid execution on the efficiency agenda, despite having increased cost from subscriber growth and network expansion.
• EBITDA grew by 20% due to gross profit uplift and increased contribution from the cost efficiency programme, resulting in an improvement in EBITDA margin of 5 percentage points.
• Capex was prioritised towards expanding both the 4G and 3G network footprint. 4G population coverage was 38% at the end of 2017.
Myanmar
Fourth quarter Year
(NOK in millions) 2017 2016 2017 2016
Revenues
Subscription and traffic 1 339 1 451 5 585 5 791
Interconnect revenues 229 269 941 1 104
Other mobile revenues 15 18 39 44
Non-mobile revenues 17 16 78 77
Total revenues 1 599 1 754 6 643 7 016
Operating expenditures 730 725 2 763 2 694
EBITDA before other items 622 718 2 869 3 038
Operating profit 347 474 1 796 2 156
EBITDA before other items/ Total revenues (%) 38.9 40.9 43.2 43.3
Capex 1 285 783 2 545 2 729
No. of subscriptions - Change in quarter/Total (in thousands): 376 439
19 474 18 255
ARPU - monthly (NOK) 27 32 29 35
Exchange rate (MMK) 0.0060 0.0067
• In Myanmar, pressure from reduced voice usage and price reductions implemented in the third quarter, resulted in revenue decline of 4%. On the positive side, the subscription base grew by 0.4 million, taking the total base to 19.5 million, an increase of 7% from last year.
• ARPU decreased by 10% as the decline in voice and interconnect, was partly offset by data monetisation.
• EBITDA decreased by 9% as a result of the reduction in revenues combined with higher opex. The cost increase was primarily driven by a higher number of network sites and regulatory costs.
• On 14 December Telenor Myanmar exercised the option to acquire additional 2x10MHz in the 1800 MHz frequency band at a cost of NOK 660 million. The spectrum will be used for 4G. The remaining capex in the quarter was mainly related to roll-out of 4G and capacity expansion.
Broadcast
Fourth quarter Year
(NOK in millions) 2017 2016 2017 2016
Revenues
Canal Digital DTH 1 152 1 098 4 557 4 555
Satellite 215 234 892 955
Norkring 267 280 1 095 1 333
Other/Eliminations (119) (116) (472) (477)
Total revenues 1 516 1 495 6 071 6 366
Operating expenditures 487 485 1 771 1 841
EBITDA before other items
Canal Digital DTH 195 153 844 782
Satellite 135 158 585 650
Norkring 142 142 601 822
Other/Eliminations (20) (7) (33) (23)
Total EBITDA before other items 451 446 1 997 2 231
Operating profit
Canal Digital DTH 179 122 760 709
Satellite 55 71 613 313
Norkring 69 59 300 377
Other/Eliminations (22) (11) (32) (29)
Total operating profit 282 241 1 641 1 370
EBITDA before other items/Total revenues (%) 29.8 29.9 32.9 35.0
Capex 139 135 409 412
No. of subscriptions - Change in quarter/Total (in thousands):
DTH TV (6) (3) 838 862
• Total revenues in Broadcast increased by 1%, while EBITDA remained stable. The revenue increase was primarily attributable to Canal Digital, and was partly offset by effects of shut-down of FM broadcasting in Norway.
• Opex and EBITDA were on level with the same quarter last year.• Capital expenditure was mainly related to infrastructure
maintenance, roll-out of sites for mobile operators, expansion of the DAB network in Norway, and platform investments in Canal Digital.

10 TELENOR FOURTH QUARTER 2017
Other units
Fourth quarter Year
(NOK in millions)2017 2016
Restated*2017 2016
Restated*
Revenues
Global wholesale 670 777 2 995 3 117
Corporate functions 830 667 3 179 2 933
Digital Businesses incl. Financial services 670 665 2 461 2 263
Other / eliminations 72 107 364 557
Total revenues 2 242 2 216 8 998 8 870
Operating expenditures 1 732 1 747 6 519 6 483
EBITDA before other items
Global wholesale 28 14 135 120
Corporate functions (229) (357) (811) (1 125)
Digital Businesses incl. Financial services (58) (127) (308) (295)
Other / eliminations (12) (3) 19 34
Total EBITDA before other items (271) (473) (965) (1 266)
Operating profit (loss)
Global wholesale 8 2 56 72
Corporate functions (313) (60) (712) (1 162)
Digital Businesses incl. Financial services (1 791) (1 197) (2 731) (1 476)
Other / eliminations (34) (26) 24 (18)
Total operating profit (loss) (2 130) (1 281) (3 363) (2 585)
Capex 171 181 660 564
Investments in businesses 29 21 1 905 3 488
* Refer to note 10.
• In Global Wholesale, revenues decreased by NOK 107 million as volume related increase could not fully compensate for the drop in prices. EBITDA increased by NOK 14 million.
• EBITDA in Corporate Functions improved due to lower costs in shared service centres.
• In Digital Businesses, revenues remained flat in the quarter as growth in Financial Services and the inclusion of the Online Classifieds operations from 1 July was offset by decline in Tapad. EBITDA improved mainly due to improvement in financial services and cost reductions in Tapad.
• Operating profit for Other Units decreased by NOK 0.8 billion mainly as a result of impairment in Tapad. See note 4 for further information.
11 TELENOR FOURTH QUARTER 2017
Group performance 2017
The comments below are related to Telenor’s development in 2017 compared to 2016. Current quarter developments are commented on if considered material. Telenor India is classified as discontinued operation. Consequently, historical Group income statement has been re-presented accordingly. Please refer to note 2 for further information.
Specification of other income and other expenses
Fourth quarter Year
(NOK in millions) 2017 2016 2017 2016
EBITDA before other income and other expenses 11 835 10 649 48 992 45 966
EBITDA before other income and other expenses (%) 36.9 33.6 39.3 36.7
Other income - - 140 -
Gains on disposals of fixed assets and operations 56 478 1 171 528
Losses on disposals of fixed assets and operations (98) (457) (260) (593)
Workforce reductions, onerous (loss) contracts and one-time pension costs (353) (395) (1 152) (853)
EBITDA 11 441 10 275 48 891 45 049
EBITDA margin (%) 35.6 32.4 39.2 35.9
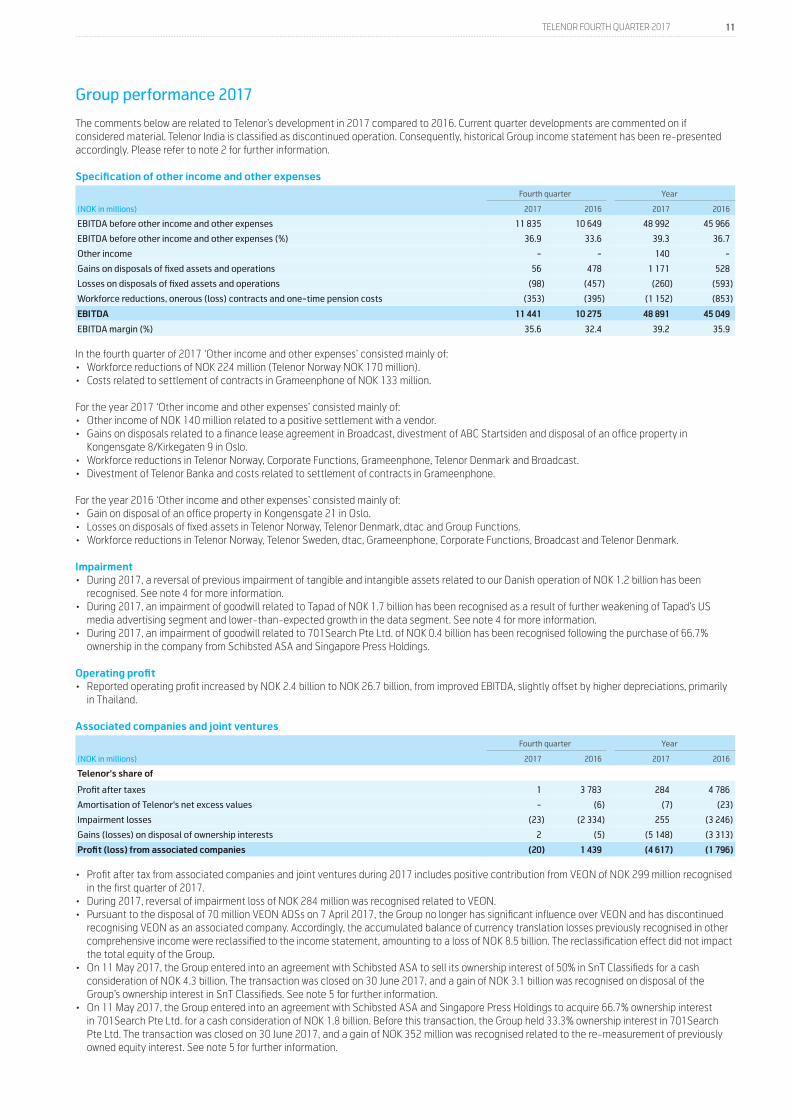
In the fourth quarter of 2017 ‘Other income and other expenses’ consisted mainly of:• Workforce reductions of NOK 224 million (Telenor Norway NOK 170 million).• Costs related to settlement of contracts in Grameenphone of NOK 133 million.
For the year 2017 ‘Other income and other expenses’ consisted mainly of:• Other income of NOK 140 million related to a positive settlement with a vendor.• Gains on disposals related to a finance lease agreement in Broadcast, divestment of ABC Startsiden and disposal of an office property in
Kongensgate 8/Kirkegaten 9 in Oslo.• Workforce reductions in Telenor Norway, Corporate Functions, Grameenphone, Telenor Denmark and Broadcast.• Divestment of Telenor Banka and costs related to settlement of contracts in Grameenphone.
For the year 2016 ‘Other income and other expenses’ consisted mainly of:• Gain on disposal of an office property in Kongensgate 21 in Oslo.• Losses on disposals of fixed assets in Telenor Norway, Telenor Denmark, dtac and Group Functions.• Workforce reductions in Telenor Norway, Telenor Sweden, dtac, Grameenphone, Corporate Functions, Broadcast and Telenor Denmark.
Impairment• During 2017, a reversal of previous impairment of tangible and intangible assets related to our Danish operation of NOK 1.2 billion has been
recognised. See note 4 for more information.• During 2017, an impairment of goodwill related to Tapad of NOK 1.7 billion has been recognised as a result of further weakening of Tapad’s US
media advertising segment and lower-than-expected growth in the data segment. See note 4 for more information.• During 2017, an impairment of goodwill related to 701Search Pte Ltd. of NOK 0.4 billion has been recognised following the purchase of 66.7%
ownership in the company from Schibsted ASA and Singapore Press Holdings. Operating profit• Reported operating profit increased by NOK 2.4 billion to NOK 26.7 billion, from improved EBITDA, slightly offset by higher depreciations, primarily
in Thailand.
Associated companies and joint ventures
Fourth quarter Year
(NOK in millions) 2017 2016 2017 2016
Telenor's share of
Profit after taxes 1 3 783 284 4 786
Amortisation of Telenor's net excess values - (6) (7) (23)
Impairment losses (23) (2 334) 255 (3 246)
Gains (losses) on disposal of ownership interests 2 (5) (5 148) (3 313)
Profit (loss) from associated companies (20) 1 439 (4 617) (1 796)
• Profit after tax from associated companies and joint ventures during 2017 includes positive contribution from VEON of NOK 299 million recognised in the first quarter of 2017.
• During 2017, reversal of impairment loss of NOK 284 million was recognised related to VEON. • Pursuant to the disposal of 70 million VEON ADSs on 7 April 2017, the Group no longer has significant influence over VEON and has discontinued
recognising VEON as an associated company. Accordingly, the accumulated balance of currency translation losses previously recognised in other comprehensive income were reclassified to the income statement, amounting to a loss of NOK 8.5 billion. The reclassification effect did not impact the total equity of the Group.
• On 11 May 2017, the Group entered into an agreement with Schibsted ASA to sell its ownership interest of 50% in SnT Classifieds for a cash consideration of NOK 4.3 billion. The transaction was closed on 30 June 2017, and a gain of NOK 3.1 billion was recognised on disposal of the Group’s ownership interest in SnT Classifieds. See note 5 for further information.
• On 11 May 2017, the Group entered into an agreement with Schibsted ASA and Singapore Press Holdings to acquire 66.7% ownership interest in 701Search Pte Ltd. for a cash consideration of NOK 1.8 billion. Before this transaction, the Group held 33.3% ownership interest in 701Search Pte Ltd. The transaction was closed on 30 June 2017, and a gain of NOK 352 million was recognised related to the re-measurement of previously owned equity interest. See note 5 for further information.
12 TELENOR FOURTH QUARTER 2017
Financial items
Fourth quarter Year
(NOK in millions) 2017 2016 2017 2016
Financial income 159 109 1 652 420
Financial expenses (746) (799) (3 061) (2 929)
Net currency gains (losses) (1 126) (776) 1 036 (143)
Net change in fair value of financial instruments 455 (230) 425 (558)
Net gains (losses and impairment) of financial assets and liabilities (6) 7 (216) 1
Net financial income (expenses) (1 264) (1 690) (164) (3 209)
Gross interest expenses (612) (683) (2 599) (2 417)
Net interest expenses (506) (629) (2 192) (2 229)
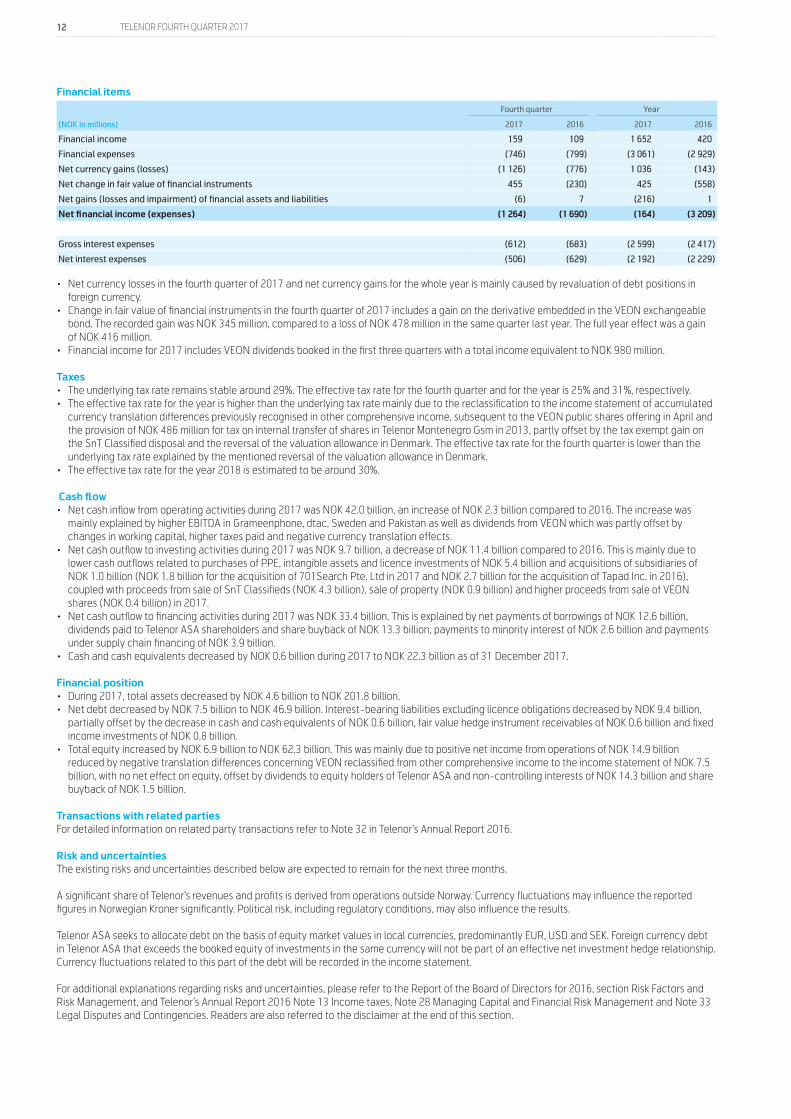
• Net currency losses in the fourth quarter of 2017 and net currency gains for the whole year is mainly caused by revaluation of debt positions in foreign currency.
• Change in fair value of financial instruments in the fourth quarter of 2017 includes a gain on the derivative embedded in the VEON exchangeable bond. The recorded gain was NOK 345 million, compared to a loss of NOK 478 million in the same quarter last year. The full year effect was a gain of NOK 416 million.
• Financial income for 2017 includes VEON dividends booked in the first three quarters with a total income equivalent to NOK 980 million.
Taxes• The underlying tax rate remains stable around 29%. The effective tax rate for the fourth quarter and for the year is 25% and 31%, respectively. • The effective tax rate for the year is higher than the underlying tax rate mainly due to the reclassification to the income statement of accumulated
currency translation differences previously recognised in other comprehensive income, subsequent to the VEON public shares offering in April and the provision of NOK 486 million for tax on internal transfer of shares in Telenor Montenegro Gsm in 2013, partly offset by the tax exempt gain on the SnT Classified disposal and the reversal of the valuation allowance in Denmark. The effective tax rate for the fourth quarter is lower than the underlying tax rate explained by the mentioned reversal of the valuation allowance in Denmark.
• The effective tax rate for the year 2018 is estimated to be around 30%.
Cash flow• Net cash inflow from operating activities during 2017 was NOK 42.0 billion, an increase of NOK 2.3 billion compared to 2016. The increase was
mainly explained by higher EBITDA in Grameenphone, dtac, Sweden and Pakistan as well as dividends from VEON which was partly offset by changes in working capital, higher taxes paid and negative currency translation effects.
• Net cash outflow to investing activities during 2017 was NOK 9.7 billion, a decrease of NOK 11.4 billion compared to 2016. This is mainly due to lower cash outflows related to purchases of PPE, intangible assets and licence investments of NOK 5.4 billion and acquisitions of subsidiaries of NOK 1.0 billion (NOK 1.8 billion for the acquisition of 701Search Pte. Ltd in 2017 and NOK 2.7 billion for the acquisition of Tapad Inc. in 2016), coupled with proceeds from sale of SnT Classifieds (NOK 4.3 billion), sale of property (NOK 0.9 billion) and higher proceeds from sale of VEON shares (NOK 0.4 billion) in 2017.
• Net cash outflow to financing activities during 2017 was NOK 33.4 billion. This is explained by net payments of borrowings of NOK 12.6 billion, dividends paid to Telenor ASA shareholders and share buyback of NOK 13.3 billion, payments to minority interest of NOK 2.6 billion and payments under supply chain financing of NOK 3.9 billion.
• Cash and cash equivalents decreased by NOK 0.6 billion during 2017 to NOK 22.3 billion as of 31 December 2017.
Financial position• During 2017, total assets decreased by NOK 4.6 billion to NOK 201.8 billion.• Net debt decreased by NOK 7.5 billion to NOK 46.9 billion. Interest-bearing liabilities excluding licence obligations decreased by NOK 9.4 billion,
partially offset by the decrease in cash and cash equivalents of NOK 0.6 billion, fair value hedge instrument receivables of NOK 0.6 billion and fixed income investments of NOK 0.8 billion.
• Total equity increased by NOK 6.9 billion to NOK 62.3 billion. This was mainly due to positive net income from operations of NOK 14.9 billion reduced by negative translation differences concerning VEON reclassified from other comprehensive income to the income statement of NOK 7.5 billion, with no net effect on equity, offset by dividends to equity holders of Telenor ASA and non-controlling interests of NOK 14.3 billion and share buyback of NOK 1.5 billion.
Transactions with related partiesFor detailed information on related party transactions refer to Note 32 in Telenor’s Annual Report 2016.
Risk and uncertaintiesThe existing risks and uncertainties described below are expected to remain for the next three months. A significant share of Telenor’s revenues and profits is derived from operations outside Norway. Currency fluctuations may influence the reported figures in Norwegian Kroner significantly. Political risk, including regulatory conditions, may also influence the results. Telenor ASA seeks to allocate debt on the basis of equity market values in local currencies, predominantly EUR, USD and SEK. Foreign currency debt in Telenor ASA that exceeds the booked equity of investments in the same currency will not be part of an effective net investment hedge relationship. Currency fluctuations related to this part of the debt will be recorded in the income statement. For additional explanations regarding risks and uncertainties, please refer to the Report of the Board of Directors for 2016, section Risk Factors and Risk Management, and Telenor’s Annual Report 2016 Note 13 Income taxes, Note 28 Managing Capital and Financial Risk Management and Note 33 Legal Disputes and Contingencies. Readers are also referred to the disclaimer at the end of this section.

13 TELENOR FOURTH QUARTER 2017
New developments of risks and uncertainties since the publication of Telenor’s Annual Report for 2016 are: Legal disputesSee note 8 for details.
Financial aspectsIn relation to the licence issuance in Myanmar, a performance bond of USD 110 million has been issued to Myanmar authorities as a guarantee towards coverage and quality of service commitments during the next two years of the licence.
DisclaimerThis report contains statements regarding the future in connection with Telenor’s growth initiatives, profit figures, outlook, strategies and objectives. In particular, the section ‘Outlook’ contains forward-looking statements regarding the Group’s expectations. All statements regarding the future are subject to inherent risks and uncertainties, and many factors can lead to actual profits and developments deviating substantially from what has been expressed or implied in such statements.
Fornebu, 30 January 2018The Board of Directors of Telenor ASA
14 TELENOR FOURTH QUARTER 2017
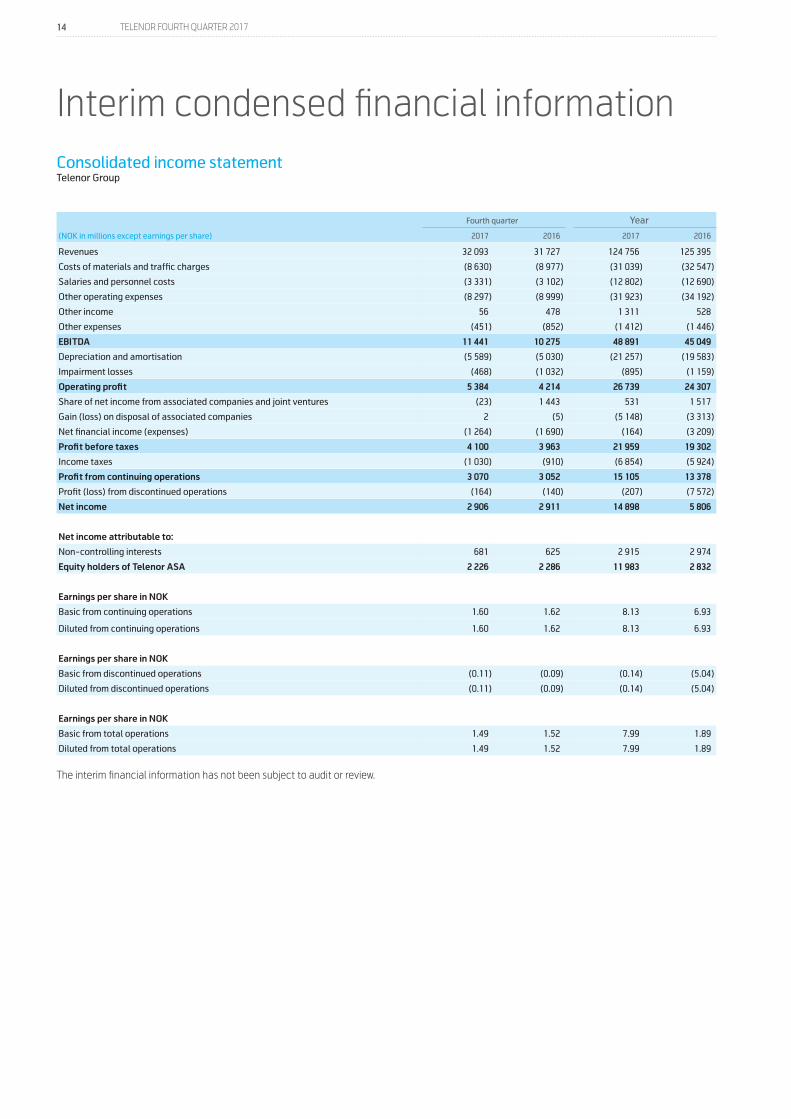
Consolidated income statementTelenor Group
Fourth quarter Year
(NOK in millions except earnings per share) 2017 2016 2017 2016
Revenues 32 093 31 727 124 756 125 395
Costs of materials and traffic charges (8 630) (8 977) (31 039) (32 547)
Salaries and personnel costs (3 331) (3 102) (12 802) (12 690)
Other operating expenses (8 297) (8 999) (31 923) (34 192)
Other income 56 478 1 311 528
Other expenses (451) (852) (1 412) (1 446)
EBITDA 11 441 10 275 48 891 45 049
Depreciation and amortisation (5 589) (5 030) (21 257) (19 583)
Impairment losses (468) (1 032) (895) (1 159)
Operating profit 5 384 4 214 26 739 24 307
Share of net income from associated companies and joint ventures (23) 1 443 531 1 517
Gain (loss) on disposal of associated companies 2 (5) (5 148) (3 313)
Net financial income (expenses) (1 264) (1 690) (164) (3 209)
Profit before taxes 4 100 3 963 21 959 19 302
Income taxes (1 030) (910) (6 854) (5 924)
Profit from continuing operations 3 070 3 052 15 105 13 378
Profit (loss) from discontinued operations (164) (140) (207) (7 572)
Net income 2 906 2 911 14 898 5 806
Net income attributable to:
Non-controlling interests 681 625 2 915 2 974
Equity holders of Telenor ASA 2 226 2 286 11 983 2 832
Earnings per share in NOK
Basic from continuing operations 1.60 1.62 8.13 6.93
Diluted from continuing operations 1.60 1.62 8.13 6.93
Earnings per share in NOK
Basic from discontinued operations (0.11) (0.09) (0.14) (5.04)
Diluted from discontinued operations (0.11) (0.09) (0.14) (5.04)
Earnings per share in NOK
Basic from total operations 1.49 1.52 7.99 1.89
Diluted from total operations 1.49 1.52 7.99 1.89
The interim financial information has not been subject to audit or review.
Interim condensed financial information
15 TELENOR FOURTH QUARTER 2017
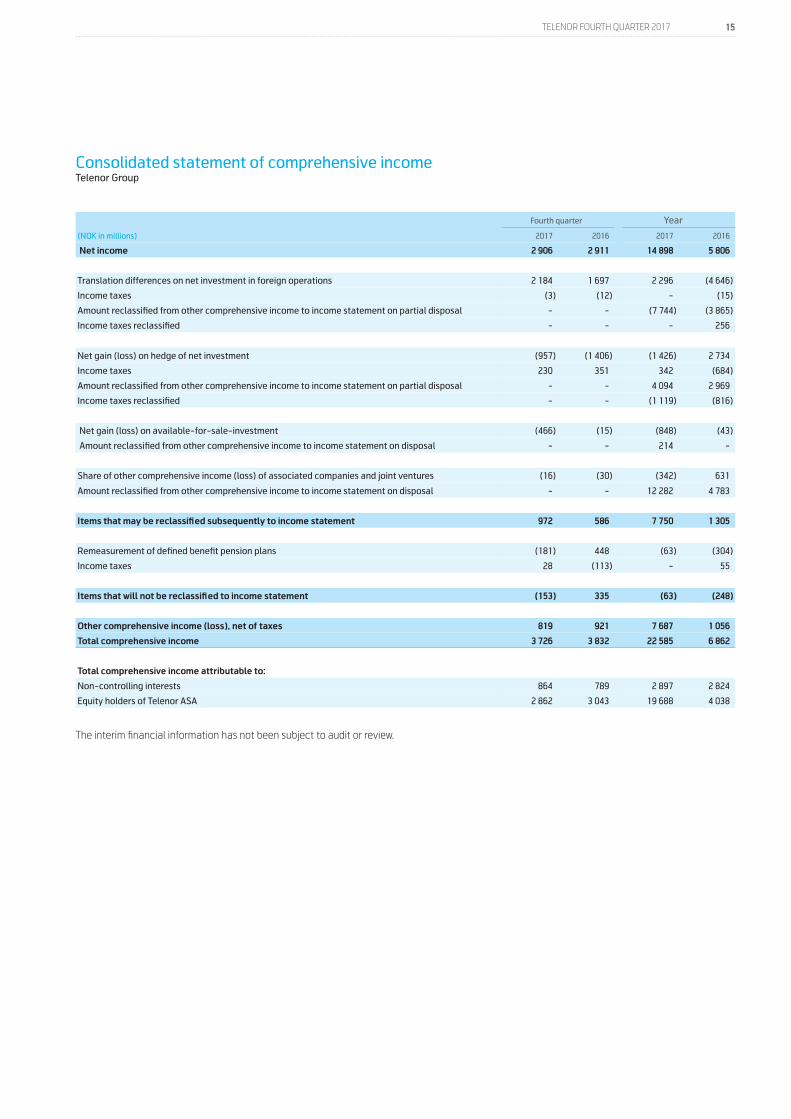
Consolidated statement of comprehensive income Telenor Group
Fourth quarter Year
(NOK in millions) 2017 2016 2017 2016
Net income 2 906 2 911 14 898 5 806
Translation differences on net investment in foreign operations 2 184 1 697 2 296 (4 646)
Income taxes (3) (12) - (15)
Amount reclassified from other comprehensive income to income statement on partial disposal - - (7 744) (3 865)
Income taxes reclassified - - - 256
Net gain (loss) on hedge of net investment (957) (1 406) (1 426) 2 734
Income taxes 230 351 342 (684)
Amount reclassified from other comprehensive income to income statement on partial disposal - - 4 094 2 969
Income taxes reclassified - - (1 119) (816)
Net gain (loss) on available-for-sale-investment (466) (15) (848) (43)
Amount reclassified from other comprehensive income to income statement on disposal - - 214 -
Share of other comprehensive income (loss) of associated companies and joint ventures (16) (30) (342) 631
Amount reclassified from other comprehensive income to income statement on disposal - - 12 282 4 783
Items that may be reclassified subsequently to income statement 972 586 7 750 1 305
Remeasurement of defined benefit pension plans (181) 448 (63) (304)
Income taxes 28 (113) - 55
Items that will not be reclassified to income statement (153) 335 (63) (248)
Other comprehensive income (loss), net of taxes 819 921 7 687 1 056
Total comprehensive income 3 726 3 832 22 585 6 862
Total comprehensive income attributable to:
Non-controlling interests 864 789 2 897 2 824
Equity holders of Telenor ASA 2 862 3 043 19 688 4 038
The interim financial information has not been subject to audit or review.
16 TELENOR FOURTH QUARTER 2017
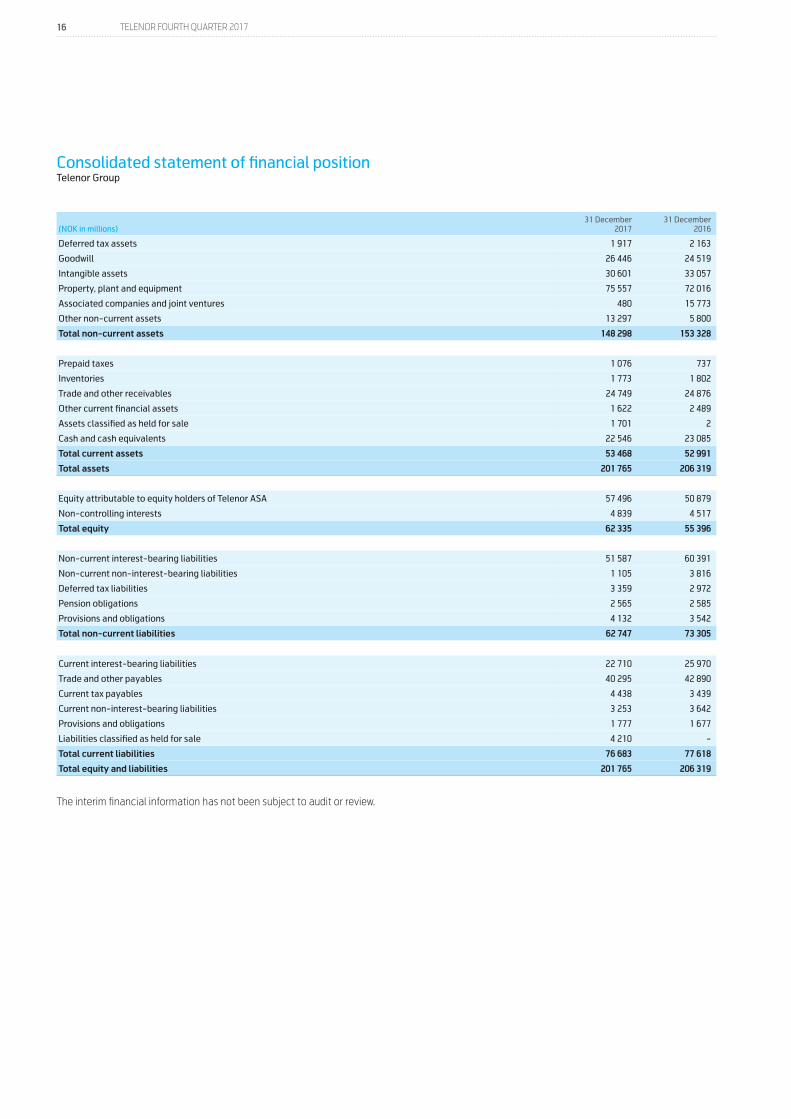
Consolidated statement of financial position Telenor Group
(NOK in millions)31 December
201731 December
2016
Deferred tax assets 1 917 2 163
Goodwill 26 446 24 519
Intangible assets 30 601 33 057
Property, plant and equipment 75 557 72 016
Associated companies and joint ventures 480 15 773
Other non-current assets 13 297 5 800
Total non-current assets 148 298 153 328
Prepaid taxes 1 076 737
Inventories 1 773 1 802
Trade and other receivables 24 749 24 876
Other current financial assets 1 622 2 489
Assets classified as held for sale 1 701 2
Cash and cash equivalents 22 546 23 085
Total current assets 53 468 52 991
Total assets 201 765 206 319
Equity attributable to equity holders of Telenor ASA 57 496 50 879
Non-controlling interests 4 839 4 517
Total equity 62 335 55 396
Non-current interest-bearing liabilities 51 587 60 391
Non-current non-interest-bearing liabilities 1 105 3 816
Deferred tax liabilities 3 359 2 972
Pension obligations 2 565 2 585
Provisions and obligations 4 132 3 542
Total non-current liabilities 62 747 73 305
Current interest-bearing liabilities 22 710 25 970
Trade and other payables 40 295 42 890
Current tax payables 4 438 3 439
Current non-interest-bearing liabilities 3 253 3 642
Provisions and obligations 1 777 1 677
Liabilities classified as held for sale 4 210 -
Total current liabilities 76 683 77 618
Total equity and liabilities 201 765 206 319
The interim financial information has not been subject to audit or review.
17 TELENOR FOURTH QUARTER 2017
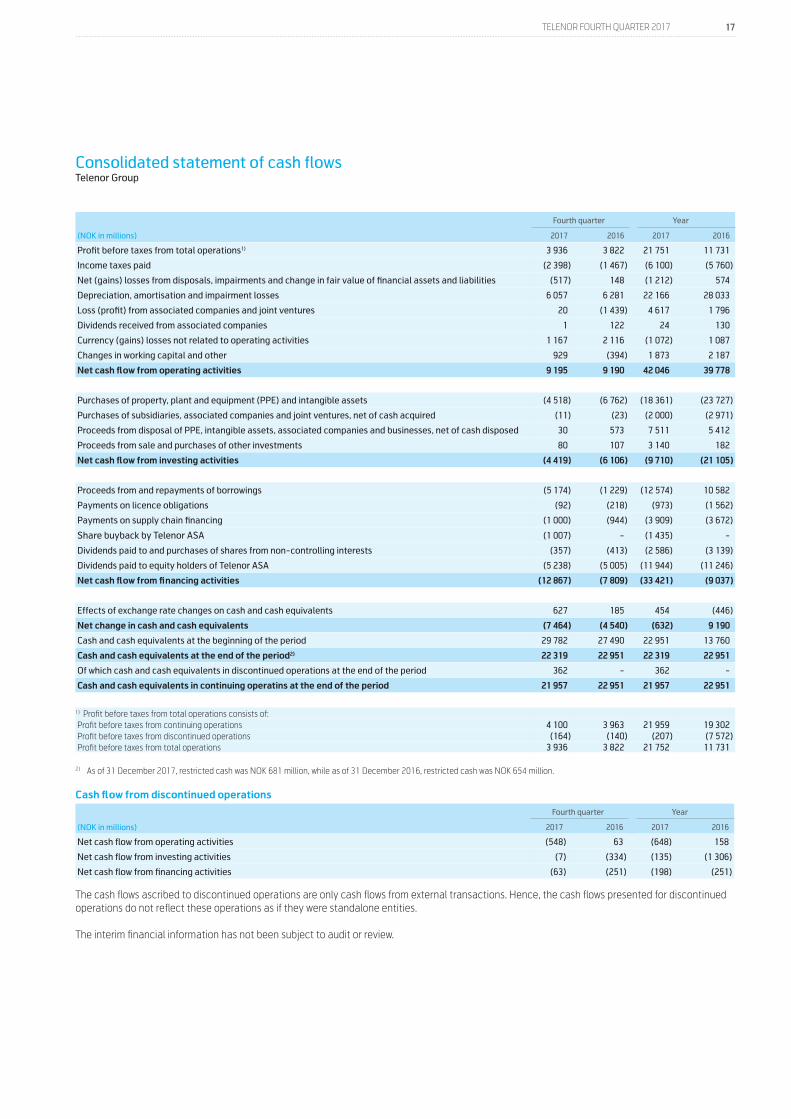
Consolidated statement of cash flows Telenor Group
Fourth quarter Year
(NOK in millions) 2017 2016 2017 2016
Profit before taxes from total operations1) 3 936 3 822 21 751 11 731
Income taxes paid (2 398) (1 467) (6 100) (5 760)
Net (gains) losses from disposals, impairments and change in fair value of financial assets and liabilities (517) 148 (1 212) 574
Depreciation, amortisation and impairment losses 6 057 6 281 22 166 28 033
Loss (profit) from associated companies and joint ventures 20 (1 439) 4 617 1 796
Dividends received from associated companies 1 122 24 130
Currency (gains) losses not related to operating activities 1 167 2 116 (1 072) 1 087
Changes in working capital and other 929 (394) 1 873 2 187
Net cash flow from operating activities 9 195 9 190 42 046 39 778
Purchases of property, plant and equipment (PPE) and intangible assets (4 518) (6 762) (18 361) (23 727)
Purchases of subsidiaries, associated companies and joint ventures, net of cash acquired (11) (23) (2 000) (2 971)
Proceeds from disposal of PPE, intangible assets, associated companies and businesses, net of cash disposed 30 573 7 511 5 412
Proceeds from sale and purchases of other investments 80 107 3 140 182
Net cash flow from investing activities (4 419) (6 106) (9 710) (21 105)
Proceeds from and repayments of borrowings (5 174) (1 229) (12 574) 10 582
Payments on licence obligations (92) (218) (973) (1 562)
Payments on supply chain financing (1 000) (944) (3 909) (3 672)
Share buyback by Telenor ASA (1 007) - (1 435) -
Dividends paid to and purchases of shares from non-controlling interests (357) (413) (2 586) (3 139)
Dividends paid to equity holders of Telenor ASA (5 238) (5 005) (11 944) (11 246)
Net cash flow from financing activities (12 867) (7 809) (33 421) (9 037)
Effects of exchange rate changes on cash and cash equivalents 627 185 454 (446)
Net change in cash and cash equivalents (7 464) (4 540) (632) 9 190
Cash and cash equivalents at the beginning of the period 29 782 27 490 22 951 13 760
Cash and cash equivalents at the end of the period2) 22 319 22 951 22 319 22 951
Of which cash and cash equivalents in discontinued operations at the end of the period 362 - 362 -
Cash and cash equivalents in continuing operatins at the end of the period 21 957 22 951 21 957 22 951
1) Profit before taxes from total operations consists of: Profit before taxes from continuing operations 4 100 3 963 21 959 19 302 Profit before taxes from discontinued operations (164) (140) (207) (7 572) Profit before taxes from total operations 3 936 3 822 21 752 11 731
2) As of 31 December 2017, restricted cash was NOK 681 million, while as of 31 December 2016, restricted cash was NOK 654 million.
Cash flow from discontinued operations
Fourth quarter Year
(NOK in millions) 2017 2016 2017 2016
Net cash flow from operating activities (548) 63 (648) 158
Net cash flow from investing activities (7) (334) (135) (1 306)
Net cash flow from financing activities (63) (251) (198) (251)
The cash flows ascribed to discontinued operations are only cash flows from external transactions. Hence, the cash flows presented for discontinued operations do not reflect these operations as if they were standalone entities.
The interim financial information has not been subject to audit or review.
18 TELENOR FOURTH QUARTER 2017
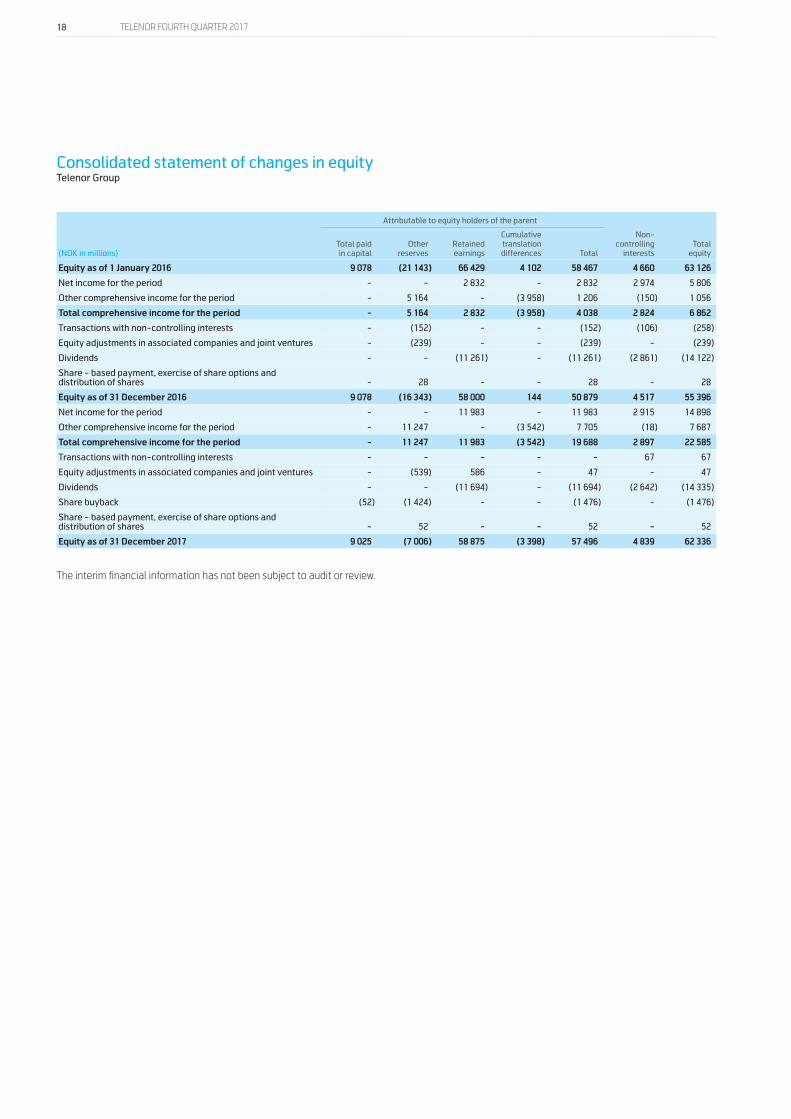
Consolidated statement of changes in equity Telenor Group
Attributable to equity holders of the parent
(NOK in millions) Total paid
in capital Other
reserves Retained earnings
Cumulative translation differences Total
Non-controlling
interests Total
equity
Equity as of 1 January 2016 9 078 (21 143) 66 429 4 102 58 467 4 660 63 126
Net income for the period - - 2 832 - 2 832 2 974 5 806
Other comprehensive income for the period - 5 164 - (3 958) 1 206 (150) 1 056
Total comprehensive income for the period - 5 164 2 832 (3 958) 4 038 2 824 6 862
Transactions with non-controlling interests - (152) - - (152) (106) (258)
Equity adjustments in associated companies and joint ventures - (239) - - (239) - (239)
Dividends - - (11 261) - (11 261) (2 861) (14 122)
Share - based payment, exercise of share options and distribution of shares - 28 - - 28 - 28
Equity as of 31 December 2016 9 078 (16 343) 58 000 144 50 879 4 517 55 396
Net income for the period - - 11 983 - 11 983 2 915 14 898
Other comprehensive income for the period - 11 247 - (3 542) 7 705 (18) 7 687
Total comprehensive income for the period - 11 247 11 983 (3 542) 19 688 2 897 22 585
Transactions with non-controlling interests - - - - - 67 67
Equity adjustments in associated companies and joint ventures - (539) 586 - 47 - 47
Dividends - - (11 694) - (11 694) (2 642) (14 335)
Share buyback (52) (1 424) - - (1 476) - (1 476)
Share - based payment, exercise of share options and distribution of shares - 52 - - 52 - 52
Equity as of 31 December 2017 9 025 (7 006) 58 875 (3 398) 57 496 4 839 62 336
The interim financial information has not been subject to audit or review.

19 TELENOR FOURTH QUARTER 2017
Note 1 – General accounting principlesTelenor (the Group) consists of Telenor ASA (the Company) and its subsidiaries. Telenor ASA is a limited liability company, incorporated in Norway. The condensed consolidated interim financial statements consist of the Group and the Group’s interests in associated companies and joint arrangements. As a result of rounding differences, numbers or percentages may not add up to the total.
These condensed consolidated interim financial statements for the year ending 31 December 2017, have been prepared in accordance with IAS 34 Interim Financial Reporting. The condensed consolidated interim financial statements do not include all the information and disclosures required in the annual financial statements and should be read in conjunction with the Group’s Annual financial statements 2016. The accounting policies adopted in the preparation of the condensed consolidated interim financial statements are consistent with those followed in the preparation of the Group’s Annual Financial Statements for the year ended 31 December 2016.
For information about the standards and interpretations effective from 1 January 2017, please refer to Note 1 in the Group’s Annual Report 2016. The standards and interpretations effective from 1 January 2017 do not have a significant impact on the Group’s consolidated interim financial statements.
Note 2 – Discontinued operations and held for sale Telenor IndiaOn 23 February 2017, the Group entered into a definitive agreement with Bharti Airtel Limited (Airtel), whereby Airtel will take full ownership of Telenor India. According to the agreement, Airtel and Telenor India will merge and Airtel will take over Telenor India as soon as all necessary approvals are received. As part of the agreement, Airtel will take over outstanding spectrum payments and other operational contracts, including tower lease.
The transaction is subject to requisite regulatory approvals, including approvals from the Department of Telecommunications in India (DoT) and the Competition Commission of India. The exposure to claims related to the period Telenor owned the business, will remain with Telenor.
The transaction is expected to close within first quarter 2018. With effect from the first quarter of 2017, Telenor India is presented as discontinued operation in the consolidated income statement and comparative periods are represented. In the consolidated statement of financial position 31 December 2017 Telenor India is classified as held for sale.
The results of Telenor India for the fourth quarter of 2016 and 2017, the years 2016 and 2017 are presented below:
Fourth quarter Year
(NOK in millions) 2017 2016 2017 2016
Revenue 770 1 417 4 346 6 032
EBITDA (161) 192 (86) 54
Operating profit (161) (27) (100) (7 237)
Profit before tax (164) (140) (207) (7 572)
Income tax - - - -
Assets and liabilities held for saleIn the statement of financial position as of 31 December 2017, Telenor India and Telenor Banka are classified as held for sale.
The major classes of assets and liabilities of Telenor India classified as held for sale as of 31 December 2017:(NOK in millions) 31 December 2017
Assets
Intangible assets 261
Other non-current assets 326
Inventory 2
Trade and other receivables 353
Cash and cash equivalents 33
Total assets classified as held for sale 975
Liabilities
Non-current liabilities 2 135
Current liabilities 1 237
Total liabilities held for sale 3 373
(NOK in millions) Assets held for sale Liabilities held for sale
Telenor India 975 3 373
Telenor Banka 727 837
Total 1 701 4 210
Note 3 – Business combinationsOn 11 May 2017 Telenor ASA entered into an agreement with Schibsted ASA and Singapore Press Holdings regarding its joint ventures within online classifieds, whereby Telenor acquired Schibsted’s and Singapore Press Holdings’ stakes of in total 66.7% in the joint venture 701Search Pte. Ltd, with operations in Malaysia, Vietnam and Myanmar, for NOK 1,753 million. The consideration was paid in cash and the transaction was closed 30 June 2017. Following these transactions, Telenor owns 100% of the shares in the leading online classifieds services Mudah (Malaysia), Chotot (Vietnam), OneKyat (Myanmar) and ImSold (Malaysia and Vietnam).
Prior to the transaction with Schibsted and Singapore Press Holdings, Telenor held an interest of 33.3% in these companies which has been revalued to fair value as of the acquisition date and a gain of NOK 352 million was recognised. The gain is classified as Gain (loss) on disposal of associates and joint ventures in the income statement.
Notes to the interim consolidated financial statements
20 TELENOR FOURTH QUARTER 2017
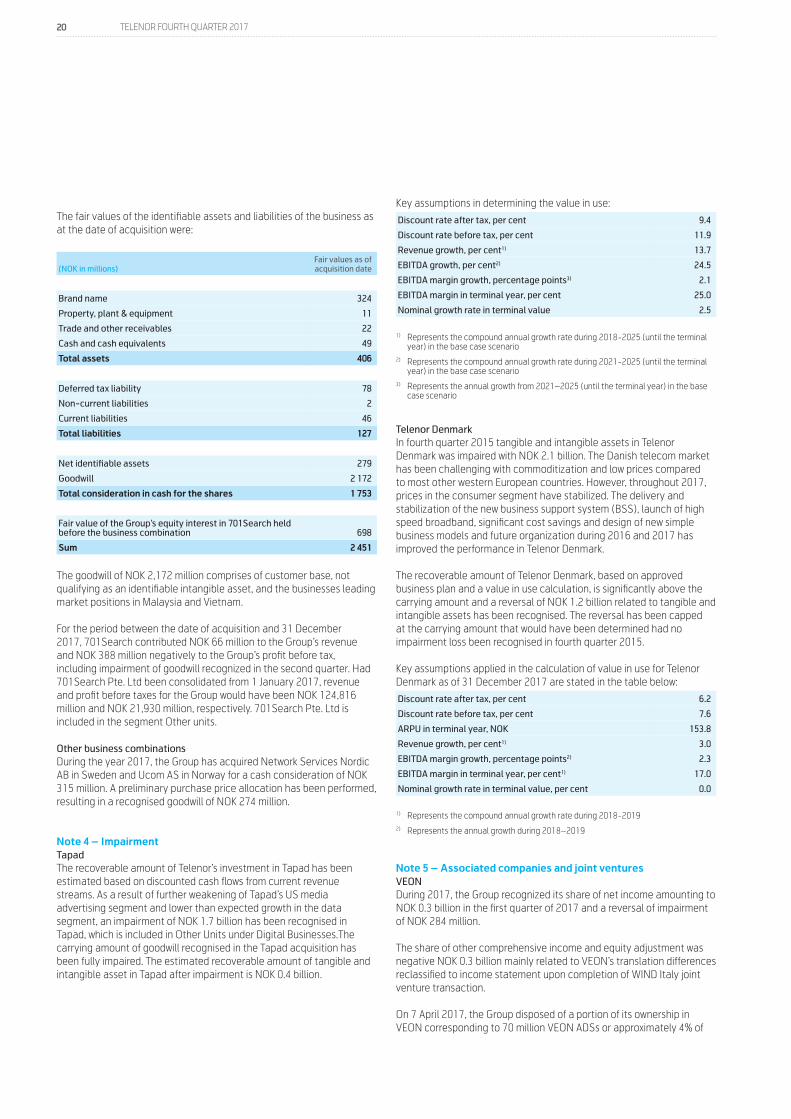
The fair values of the identifiable assets and liabilities of the business as at the date of acquisition were:
(NOK in millions)Fair values as of acquisition date
Brand name 324
Property, plant & equipment 11
Trade and other receivables 22
Cash and cash equivalents 49
Total assets 406
Deferred tax liability 78
Non-current liabilities 2
Current liabilities 46
Total liabilities 127
Net identifiable assets 279
Goodwill 2 172
Total consideration in cash for the shares 1 753
Fair value of the Group’s equity interest in 701Search held before the business combination 698
Sum 2 451
The goodwill of NOK 2,172 million comprises of customer base, not qualifying as an identifiable intangible asset, and the businesses leading market positions in Malaysia and Vietnam.
For the period between the date of acquisition and 31 December 2017, 701Search contributed NOK 66 million to the Group’s revenue and NOK 388 million negatively to the Group’s profit before tax, including impairment of goodwill recognized in the second quarter. Had 701Search Pte. Ltd been consolidated from 1 January 2017, revenue and profit before taxes for the Group would have been NOK 124,816 million and NOK 21,930 million, respectively. 701Search Pte. Ltd is included in the segment Other units.
Other business combinationsDuring the year 2017, the Group has acquired Network Services Nordic AB in Sweden and Ucom AS in Norway for a cash consideration of NOK 315 million. A preliminary purchase price allocation has been performed, resulting in a recognised goodwill of NOK 274 million.
Note 4 – ImpairmentTapadThe recoverable amount of Telenor’s investment in Tapad has been estimated based on discounted cash flows from current revenue streams. As a result of further weakening of Tapad’s US media advertising segment and lower than expected growth in the data segment, an impairment of NOK 1.7 billion has been recognised in Tapad, which is included in Other Units under Digital Businesses.The carrying amount of goodwill recognised in the Tapad acquisition has been fully impaired. The estimated recoverable amount of tangible and intangible asset in Tapad after impairment is NOK 0.4 billion.
Key assumptions in determining the value in use:
Discount rate after tax, per cent 9.4
Discount rate before tax, per cent 11.9
Revenue growth, per cent1) 13.7
EBITDA growth, per cent2) 24.5
EBITDA margin growth, percentage points3) 2.1
EBITDA margin in terminal year, per cent 25.0
Nominal growth rate in terminal value 2.5
1) Represents the compound annual growth rate during 2018-2025 (until the terminal year) in the base case scenario
2) Represents the compound annual growth rate during 2021-2025 (until the terminal year) in the base case scenario
3) Represents the annual growth from 2021–2025 (until the terminal year) in the base case scenario
Telenor DenmarkIn fourth quarter 2015 tangible and intangible assets in Telenor Denmark was impaired with NOK 2.1 billion. The Danish telecom market has been challenging with commoditization and low prices compared to most other western European countries. However, throughout 2017, prices in the consumer segment have stabilized. The delivery and stabilization of the new business support system (BSS), launch of high speed broadband, significant cost savings and design of new simple business models and future organization during 2016 and 2017 has improved the performance in Telenor Denmark.
The recoverable amount of Telenor Denmark, based on approved business plan and a value in use calculation, is significantly above the carrying amount and a reversal of NOK 1.2 billion related to tangible and intangible assets has been recognised. The reversal has been capped at the carrying amount that would have been determined had no impairment loss been recognised in fourth quarter 2015.
Key assumptions applied in the calculation of value in use for Telenor Denmark as of 31 December 2017 are stated in the table below:
Discount rate after tax, per cent 6.2
Discount rate before tax, per cent 7.6
ARPU in terminal year, NOK 153.8
Revenue growth, per cent1) 3.0
EBITDA margin growth, percentage points2) 2.3
EBITDA margin in terminal year, per cent1) 17.0
Nominal growth rate in terminal value, per cent 0.0
1) Represents the compound annual growth rate during 2018-20192) Represents the annual growth during 2018–2019
Note 5 – Associated companies and joint venturesVEONDuring 2017, the Group recognized its share of net income amounting to NOK 0.3 billion in the first quarter of 2017 and a reversal of impairment of NOK 284 million.
The share of other comprehensive income and equity adjustment was negative NOK 0.3 billion mainly related to VEON’s translation differences reclassified to income statement upon completion of WIND Italy joint venture transaction.
On 7 April 2017, the Group disposed of a portion of its ownership in VEON corresponding to 70 million VEON ADSs or approximately 4% of
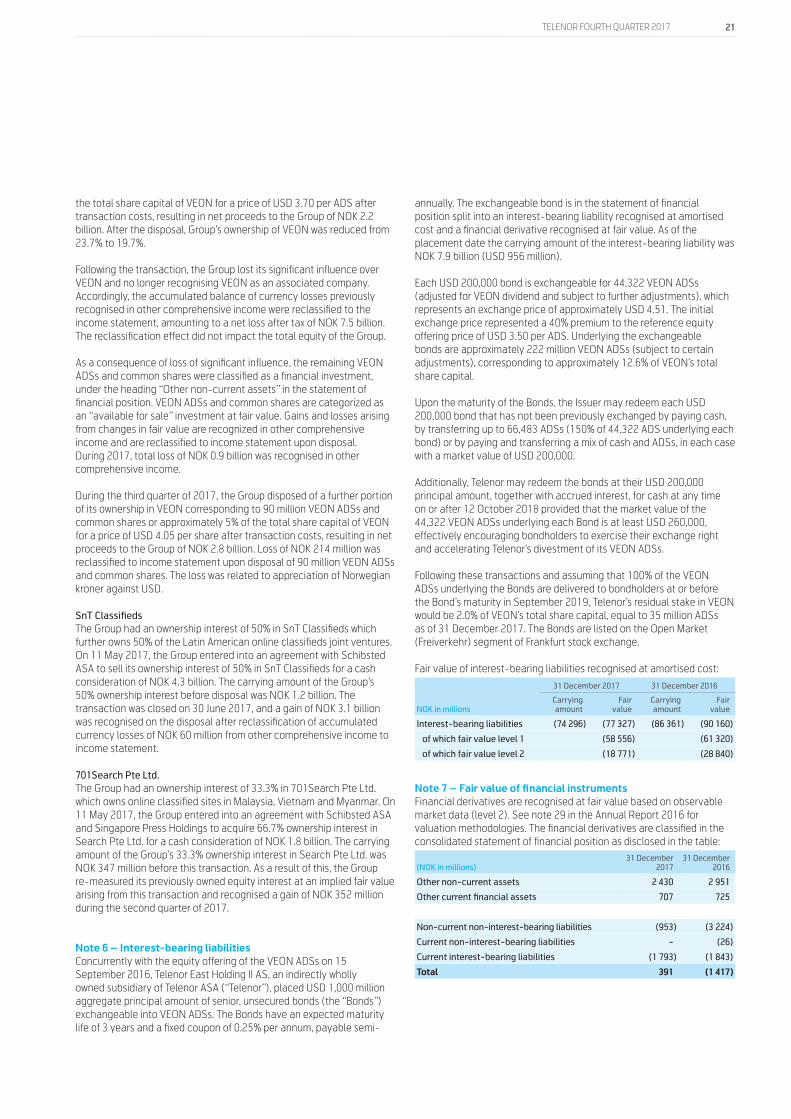
21 TELENOR FOURTH QUARTER 2017
the total share capital of VEON for a price of USD 3.70 per ADS after transaction costs, resulting in net proceeds to the Group of NOK 2.2 billion. After the disposal, Group’s ownership of VEON was reduced from 23.7% to 19.7%.
Following the transaction, the Group lost its significant influence over VEON and no longer recognising VEON as an associated company. Accordingly, the accumulated balance of currency losses previously recognised in other comprehensive income were reclassified to the income statement, amounting to a net loss after tax of NOK 7.5 billion. The reclassification effect did not impact the total equity of the Group.
As a consequence of loss of significant influence, the remaining VEON ADSs and common shares were classified as a financial investment, under the heading “Other non-current assets” in the statement of financial position. VEON ADSs and common shares are categorized as an “available for sale” investment at fair value. Gains and losses arising from changes in fair value are recognized in other comprehensive income and are reclassified to income statement upon disposal. During 2017, total loss of NOK 0.9 billion was recognised in other comprehensive income.
During the third quarter of 2017, the Group disposed of a further portion of its ownership in VEON corresponding to 90 million VEON ADSs and common shares or approximately 5% of the total share capital of VEON for a price of USD 4.05 per share after transaction costs, resulting in net proceeds to the Group of NOK 2.8 billion. Loss of NOK 214 million was reclassified to income statement upon disposal of 90 million VEON ADSs and common shares. The loss was related to appreciation of Norwegian kroner against USD.
SnT ClassifiedsThe Group had an ownership interest of 50% in SnT Classifieds which further owns 50% of the Latin American online classifieds joint ventures. On 11 May 2017, the Group entered into an agreement with Schibsted ASA to sell its ownership interest of 50% in SnT Classifieds for a cash consideration of NOK 4.3 billion. The carrying amount of the Group’s 50% ownership interest before disposal was NOK 1.2 billion. The transaction was closed on 30 June 2017, and a gain of NOK 3.1 billion was recognised on the disposal after reclassification of accumulated currency losses of NOK 60 million from other comprehensive income to income statement.
701Search Pte Ltd.The Group had an ownership interest of 33.3% in 701Search Pte Ltd. which owns online classified sites in Malaysia, Vietnam and Myanmar. On 11 May 2017, the Group entered into an agreement with Schibsted ASA and Singapore Press Holdings to acquire 66.7% ownership interest in Search Pte Ltd. for a cash consideration of NOK 1.8 billion. The carrying amount of the Group’s 33.3% ownership interest in Search Pte Ltd. was NOK 347 million before this transaction. As a result of this, the Group re-measured its previously owned equity interest at an implied fair value arising from this transaction and recognised a gain of NOK 352 million during the second quarter of 2017.
Note 6 – Interest-bearing liabilitiesConcurrently with the equity offering of the VEON ADSs on 15 September 2016, Telenor East Holding II AS, an indirectly wholly owned subsidiary of Telenor ASA (“Telenor”), placed USD 1,000 million aggregate principal amount of senior, unsecured bonds (the “Bonds”) exchangeable into VEON ADSs. The Bonds have an expected maturity life of 3 years and a fixed coupon of 0.25% per annum, payable semi-
annually. The exchangeable bond is in the statement of financial position split into an interest-bearing liability recognised at amortised cost and a financial derivative recognised at fair value. As of the placement date the carrying amount of the interest-bearing liability was NOK 7.9 billion (USD 956 million).
Each USD 200,000 bond is exchangeable for 44,322 VEON ADSs (adjusted for VEON dividend and subject to further adjustments), which represents an exchange price of approximately USD 4.51. The initial exchange price represented a 40% premium to the reference equity offering price of USD 3.50 per ADS. Underlying the exchangeable bonds are approximately 222 million VEON ADSs (subject to certain adjustments), corresponding to approximately 12.6% of VEON’s total share capital.
Upon the maturity of the Bonds, the Issuer may redeem each USD 200,000 bond that has not been previously exchanged by paying cash, by transferring up to 66,483 ADSs (150% of 44,322 ADS underlying each bond) or by paying and transferring a mix of cash and ADSs, in each case with a market value of USD 200,000.
Additionally, Telenor may redeem the bonds at their USD 200,000 principal amount, together with accrued interest, for cash at any time on or after 12 October 2018 provided that the market value of the 44,322 VEON ADSs underlying each Bond is at least USD 260,000, effectively encouraging bondholders to exercise their exchange right and accelerating Telenor’s divestment of its VEON ADSs.
Following these transactions and assuming that 100% of the VEON ADSs underlying the Bonds are delivered to bondholders at or before the Bond’s maturity in September 2019, Telenor’s residual stake in VEON would be 2.0% of VEON’s total share capital, equal to 35 million ADSs as of 31 December 2017. The Bonds are listed on the Open Market (Freiverkehr) segment of Frankfurt stock exchange.
Fair value of interest-bearing liabilities recognised at amortised cost:
31 December 2017 31 December 2016
NOK in millionsCarrying amount
Fair value
Carrying amount
Fair value
Interest-bearing liabilities (74 296) (77 327) (86 361) (90 160)
of which fair value level 1 (58 556) (61 320)
of which fair value level 2 (18 771) (28 840)
Note 7 – Fair value of financial instrumentsFinancial derivatives are recognised at fair value based on observable market data (level 2). See note 29 in the Annual Report 2016 for valuation methodologies. The financial derivatives are classified in the consolidated statement of financial position as disclosed in the table:
(NOK in millions)31 December
201731 December
2016
Other non-current assets 2 430 2 951
Other current financial assets 707 725
Non-current non-interest-bearing liabilities (953) (3 224)
Current non-interest-bearing liabilities - (26)
Current interest-bearing liabilities (1 793) (1 843)
Total 391 (1 417)
22 TELENOR FOURTH QUARTER 2017
Note 8 – Legal disputesTelenor NorwayThe Norwegian Competition Authority (NCA) and EFTA Surveillance Authority (ESA) carried out an inspection of Telenor Norge AS on 4-13 December 2012 based on suspected abuse of dominant position and/or anti-competitive collaboration concerning Telenor Norway’s mobile operation. On 23 November 2016, Norwegian Competition Authority sent a Statement of Objection setting out its preliminary assessment of Telenor’s behaviour in the mobile market; NCA is considering imposing a fine of NOK 906 million against Telenor for an alleged breach of competition law. Telenor submitted its response to the NCA on 7 April 2017 in which it contests the allegations of having breached the competition law.
Telenor SwedenOn 25 April, the European Commission has initiated an investigation on the premises of Telenor Sverige in Stockholm regarding possible abuse of a collective dominant market position and/or possible anti-competitive practices between mobile network operators in Sweden. Similar investigations were simultaneously initiated towards other Swedish mobile network operators.
Telenor PakistanChina Mobile Pak Ltd (with its brand name Zong) has filed a petition before the Islamabad High Court, whereby it challenges the legality of the Telecommunication Policy 2015 (“Policy”) and the Policy Directive (“Directive”) dated 26 April 2017, pursuant to which Telenor Pakistan has been granted the 4G License in 850 MHz spectrum. The primary ground on which the petition has been filed is that, based on the Supreme Court’s decision in a separate matter, allegedly the Policy and the Directive did not receive the sanction of the Federal Government, as constituted by the Prime Minister and the Federal Cabinet. Therefore, it is claimed by Zong that the Directive was not validly issued and therefore all decisions taken under the authority of the Directive have no legal effect. Telenor Pakistan was initially not a party to this case, but has now joined the proceedings since it is the beneficiary of the decisions taken under the Policy and the Directive. Telenor Pakistan has followed the spectrum auction process in a transparent manner and any decision by the Court against the Policy/Directive would be on account of procedural error by the Government of Pakistan and such a decision would be vigorously appealed by Telenor Pakistan.
GrameenphoneSIM tax on replacement SIM cards case as referred in the Annual Report 2016 note 33 for the period July 2007 to December 2011. In July 2017 LTU-VAT issued a show-cause notice to Grameenphone relating to SIM tax on replacement SIMs, for the period July 2012 – June 2015. To the extent this Show Cause Notice could lead to a final Tax Demand, the total demand for the period from July 2007 to December 2011 and July 2012 to June 2015 may be up to NOK 1.4 billion, without interests. Grameenphone is preparing next course of action on the notice.
Note 9 – Events after the reporting periodTelenor Hungary On 24 January 2018, the Hungarian competition authorities initiated an investigation on the premises of Telenor Hungary outside Budapest. The investigation pertains to network cooperation and allegations of anticompetitive behavior in relation to a frequency auction in 2014.
Digi – MalaysiaOn 23 January 2018, the Board of Directors og Digi declared the fourth interim dividend for 2017 of MYR 0.046 per share, which corresponds to approximately NOK 0.7 billion total dividend and approximately NOK 0.34 billion for Telenor ownership share.
Grameenphone – BangladeshOn 29 January 2018, the Board of Directors of Grameenphone Ltd. proposed final dividend for 2017 of BDT 10.00 per share, which corresponds to approximately NOK 1.3 billion total dividend and approximately NOK 0.75 billion for Telenor ownership share.
dtacOn 30 January 2018, the Board of Directors of Total Access Communication Public Company Limited (dtac) proposed annual dividend for 2017 of THB 0.24 per share which corresponds to approximately NOK 143 million total dividend and approximately NOK 93 million for Telenor ownership share.
Note 10 – Segment information and reconciliation of EBITDA before other income and other expensesFinancial information related to Telenor Banka, previously reported as part of Telenor Montenegro and Serbia, Telenor Microfinance Bank including Easypaisa, previously reported as part of Telenor Pakistan is now reported as part of Other units. The segment information for 2016 has been restated to reflect this.
Daxcom AB, previously reported as part of Telenor Norway is now reported as part of Telenor Sweden. Daxcom AB delivers customer specific solutions in Sweden. The segment information for 2016 has been restated to reflect this.
Telenor Cloud Services AS, previously reported as part of Other units is now reported as part of Telenor Norway. Telenor Cloud Services AS delivers internet-based services like webhosting, office tools (Office 365), messaging and communication solutions. The segment information for 2016 has been restated to reflect this.
Telenor IT Partner A/S (TIP), previously reported as part of other units is now reported as part of Telenor Denmark. TIP developed the new business support system, now used by Telenor Denmark. The segment information for 2016 has been restated to reflect this.
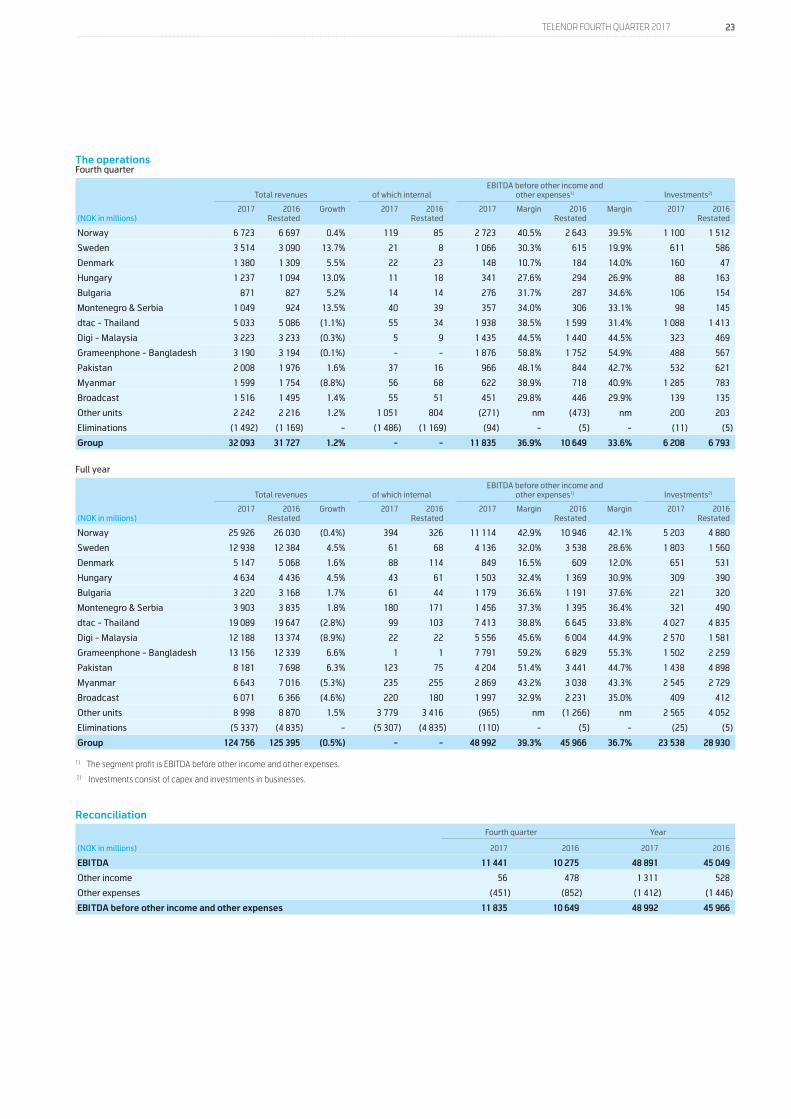
23 TELENOR FOURTH QUARTER 2017
The operationsFourth quarter
Total revenues of which internalEBITDA before other income and
other expenses1) Investments2)
(NOK in millions)2017 2016
RestatedGrowth 2017 2016
Restated2017 Margin 2016
RestatedMargin 2017 2016
Restated
Norway 6 723 6 697 0.4% 119 85 2 723 40.5% 2 643 39.5% 1 100 1 512
Sweden 3 514 3 090 13.7% 21 8 1 066 30.3% 615 19.9% 611 586
Denmark 1 380 1 309 5.5% 22 23 148 10.7% 184 14.0% 160 47
Hungary 1 237 1 094 13.0% 11 18 341 27.6% 294 26.9% 88 163
Bulgaria 871 827 5.2% 14 14 276 31.7% 287 34.6% 106 154
Montenegro & Serbia 1 049 924 13.5% 40 39 357 34.0% 306 33.1% 98 145
dtac - Thailand 5 033 5 086 (1.1%) 55 34 1 938 38.5% 1 599 31.4% 1 088 1 413
Digi - Malaysia 3 223 3 233 (0.3%) 5 9 1 435 44.5% 1 440 44.5% 323 469
Grameenphone - Bangladesh 3 190 3 194 (0.1%) - - 1 876 58.8% 1 752 54.9% 488 567
Pakistan 2 008 1 976 1.6% 37 16 966 48.1% 844 42.7% 532 621
Myanmar 1 599 1 754 (8.8%) 56 68 622 38.9% 718 40.9% 1 285 783
Broadcast 1 516 1 495 1.4% 55 51 451 29.8% 446 29.9% 139 135
Other units 2 242 2 216 1.2% 1 051 804 (271) nm (473) nm 200 203
Eliminations (1 492) (1 169) - (1 486) (1 169) (94) - (5) - (11) (5)
Group 32 093 31 727 1.2% - - 11 835 36.9% 10 649 33.6% 6 208 6 793
Full year
Total revenues of which internalEBITDA before other income and
other expenses1) Investments2)
(NOK in millions)2017 2016
RestatedGrowth 2017 2016
Restated2017 Margin 2016
RestatedMargin 2017 2016
Restated
Norway 25 926 26 030 (0.4%) 394 326 11 114 42.9% 10 946 42.1% 5 203 4 880
Sweden 12 938 12 384 4.5% 61 68 4 136 32.0% 3 538 28.6% 1 803 1 560
Denmark 5 147 5 068 1.6% 88 114 849 16.5% 609 12.0% 651 531
Hungary 4 634 4 436 4.5% 43 61 1 503 32.4% 1 369 30.9% 309 390
Bulgaria 3 220 3 168 1.7% 61 44 1 179 36.6% 1 191 37.6% 221 320
Montenegro & Serbia 3 903 3 835 1.8% 180 171 1 456 37.3% 1 395 36.4% 321 490
dtac - Thailand 19 089 19 647 (2.8%) 99 103 7 413 38.8% 6 645 33.8% 4 027 4 835
Digi - Malaysia 12 188 13 374 (8.9%) 22 22 5 556 45.6% 6 004 44.9% 2 570 1 581
Grameenphone - Bangladesh 13 156 12 339 6.6% 1 1 7 791 59.2% 6 829 55.3% 1 502 2 259
Pakistan 8 181 7 698 6.3% 123 75 4 204 51.4% 3 441 44.7% 1 438 4 898
Myanmar 6 643 7 016 (5.3%) 235 255 2 869 43.2% 3 038 43.3% 2 545 2 729
Broadcast 6 071 6 366 (4.6%) 220 180 1 997 32.9% 2 231 35.0% 409 412
Other units 8 998 8 870 1.5% 3 779 3 416 (965) nm (1 266) nm 2 565 4 052
Eliminations (5 337) (4 835) - (5 307) (4 835) (110) - (5) - (25) (5)
Group 124 756 125 395 (0.5%) - - 48 992 39.3% 45 966 36.7% 23 538 28 930
1) The segment profit is EBITDA before other income and other expenses. 2) Investments consist of capex and investments in businesses.
Reconciliation
Fourth quarter Year
(NOK in millions) 2017 2016 2017 2016
EBITDA 11 441 10 275 48 891 45 049
Other income 56 478 1 311 528
Other expenses (451) (852) (1 412) (1 446)
EBITDA before other income and other expenses 11 835 10 649 48 992 45 966
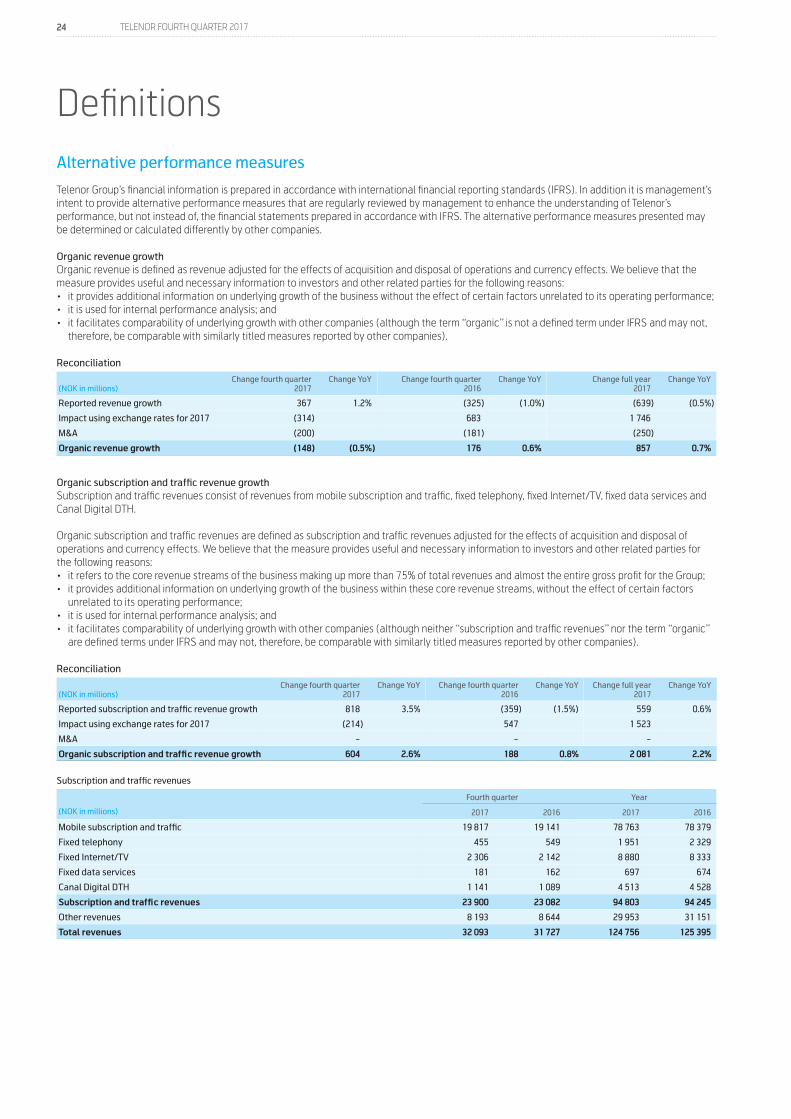
24 TELENOR FOURTH QUARTER 2017
Alternative performance measures
Telenor Group’s financial information is prepared in accordance with international financial reporting standards (IFRS). In addition it is management’s intent to provide alternative performance measures that are regularly reviewed by management to enhance the understanding of Telenor’s performance, but not instead of, the financial statements prepared in accordance with IFRS. The alternative performance measures presented may be determined or calculated differently by other companies.
Organic revenue growthOrganic revenue is defined as revenue adjusted for the effects of acquisition and disposal of operations and currency effects. We believe that the measure provides useful and necessary information to investors and other related parties for the following reasons:• it provides additional information on underlying growth of the business without the effect of certain factors unrelated to its operating performance;• it is used for internal performance analysis; and• it facilitates comparability of underlying growth with other companies (although the term “organic” is not a defined term under IFRS and may not,
therefore, be comparable with similarly titled measures reported by other companies).
Reconciliation
(NOK in millions)Change fourth quarter
2017Change YoY Change fourth quarter
2016Change YoY Change full year
2017Change YoY
Reported revenue growth 367 1.2% (325) (1.0%) (639) (0.5%)
Impact using exchange rates for 2017 (314) 683 1 746
M&A (200) (181) (250)
Organic revenue growth (148) (0.5%) 176 0.6% 857 0.7%
Organic subscription and traffic revenue growthSubscription and traffic revenues consist of revenues from mobile subscription and traffic, fixed telephony, fixed Internet/TV, fixed data services and Canal Digital DTH.
Organic subscription and traffic revenues are defined as subscription and traffic revenues adjusted for the effects of acquisition and disposal of operations and currency effects. We believe that the measure provides useful and necessary information to investors and other related parties for the following reasons:• it refers to the core revenue streams of the business making up more than 75% of total revenues and almost the entire gross profit for the Group;• it provides additional information on underlying growth of the business within these core revenue streams, without the effect of certain factors
unrelated to its operating performance;• it is used for internal performance analysis; and• it facilitates comparability of underlying growth with other companies (although neither “subscription and traffic revenues” nor the term “organic”
are defined terms under IFRS and may not, therefore, be comparable with similarly titled measures reported by other companies).
Reconciliation
(NOK in millions)Change fourth quarter
2017Change YoY Change fourth quarter
2016Change YoY Change full year
2017Change YoY
Reported subscription and traffic revenue growth 818 3.5% (359) (1.5%) 559 0.6%
Impact using exchange rates for 2017 (214) 547 1 523
M&A - - -
Organic subscription and traffic revenue growth 604 2.6% 188 0.8% 2 081 2.2%
Subscription and traffic revenues
Fourth quarter Year
(NOK in millions) 2017 2016 2017 2016
Mobile subscription and traffic 19 817 19 141 78 763 78 379
Fixed telephony 455 549 1 951 2 329
Fixed Internet/TV 2 306 2 142 8 880 8 333
Fixed data services 181 162 697 674
Canal Digital DTH 1 141 1 089 4 513 4 528
Subscription and traffic revenues 23 900 23 082 94 803 94 245
Other revenues 8 193 8 644 29 953 31 151
Total revenues 32 093 31 727 124 756 125 395
Definitions
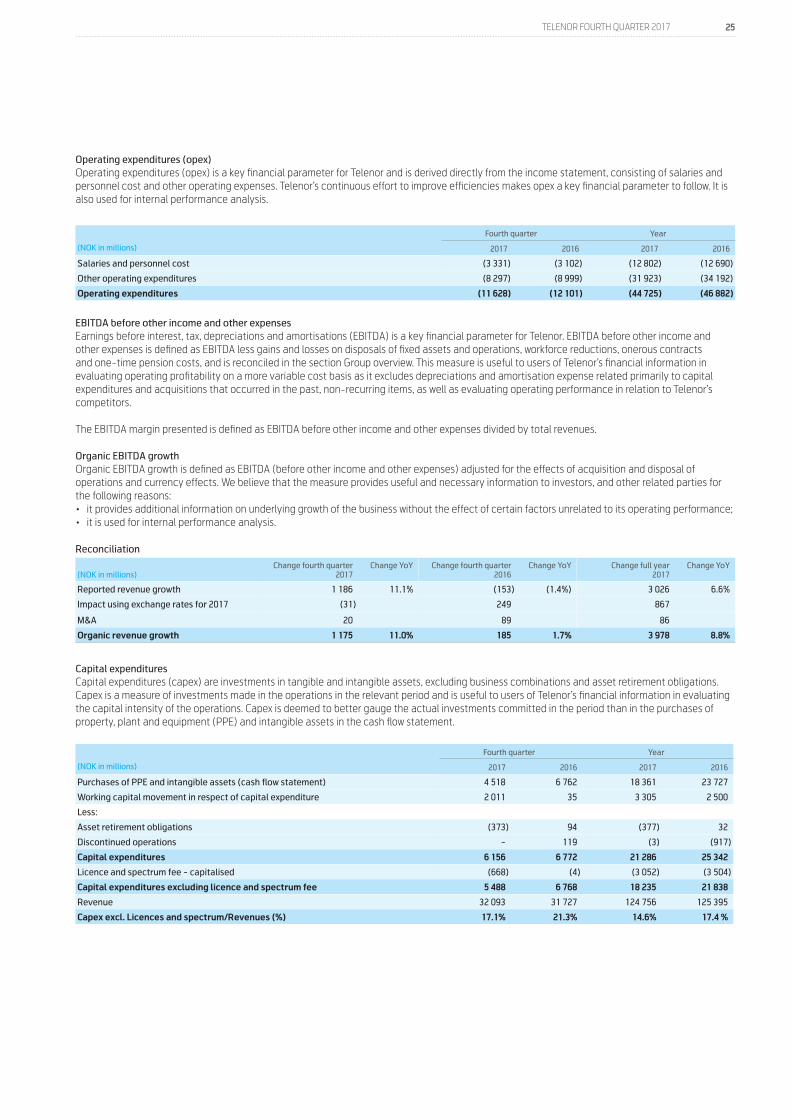
25 TELENOR FOURTH QUARTER 2017
Operating expenditures (opex)Operating expenditures (opex) is a key financial parameter for Telenor and is derived directly from the income statement, consisting of salaries and personnel cost and other operating expenses. Telenor’s continuous effort to improve efficiencies makes opex a key financial parameter to follow. It is also used for internal performance analysis.
Fourth quarter Year
(NOK in millions) 2017 2016 2017 2016
Salaries and personnel cost (3 331) (3 102) (12 802) (12 690)
Other operating expenditures (8 297) (8 999) (31 923) (34 192)
Operating expenditures (11 628) (12 101) (44 725) (46 882)
EBITDA before other income and other expensesEarnings before interest, tax, depreciations and amortisations (EBITDA) is a key financial parameter for Telenor. EBITDA before other income and other expenses is defined as EBITDA less gains and losses on disposals of fixed assets and operations, workforce reductions, onerous contracts and one-time pension costs, and is reconciled in the section Group overview. This measure is useful to users of Telenor’s financial information in evaluating operating profitability on a more variable cost basis as it excludes depreciations and amortisation expense related primarily to capital expenditures and acquisitions that occurred in the past, non-recurring items, as well as evaluating operating performance in relation to Telenor’s competitors.
The EBITDA margin presented is defined as EBITDA before other income and other expenses divided by total revenues.
Organic EBITDA growthOrganic EBITDA growth is defined as EBITDA (before other income and other expenses) adjusted for the effects of acquisition and disposal of operations and currency effects. We believe that the measure provides useful and necessary information to investors, and other related parties for the following reasons:• it provides additional information on underlying growth of the business without the effect of certain factors unrelated to its operating performance;• it is used for internal performance analysis.
Reconciliation
(NOK in millions)Change fourth quarter
2017Change YoY Change fourth quarter
2016Change YoY Change full year
2017Change YoY
Reported revenue growth 1 186 11.1% (153) (1.4%) 3 026 6.6%
Impact using exchange rates for 2017 (31) 249 867
M&A 20 89 86
Organic revenue growth 1 175 11.0% 185 1.7% 3 978 8.8%
Capital expendituresCapital expenditures (capex) are investments in tangible and intangible assets, excluding business combinations and asset retirement obligations. Capex is a measure of investments made in the operations in the relevant period and is useful to users of Telenor’s financial information in evaluating the capital intensity of the operations. Capex is deemed to better gauge the actual investments committed in the period than in the purchases of property, plant and equipment (PPE) and intangible assets in the cash flow statement.
Fourth quarter Year
(NOK in millions) 2017 2016 2017 2016
Purchases of PPE and intangible assets (cash flow statement) 4 518 6 762 18 361 23 727
Working capital movement in respect of capital expenditure 2 011 35 3 305 2 500
Less:
Asset retirement obligations (373) 94 (377) 32
Discontinued operations - 119 (3) (917)
Capital expenditures 6 156 6 772 21 286 25 342
Licence and spectrum fee - capitalised (668) (4) (3 052) (3 504)
Capital expenditures excluding licence and spectrum fee 5 488 6 768 18 235 21 838
Revenue 32 093 31 727 124 756 125 395
Capex excl. Licences and spectrum/Revenues (%) 17.1% 21.3% 14.6% 17.4 %
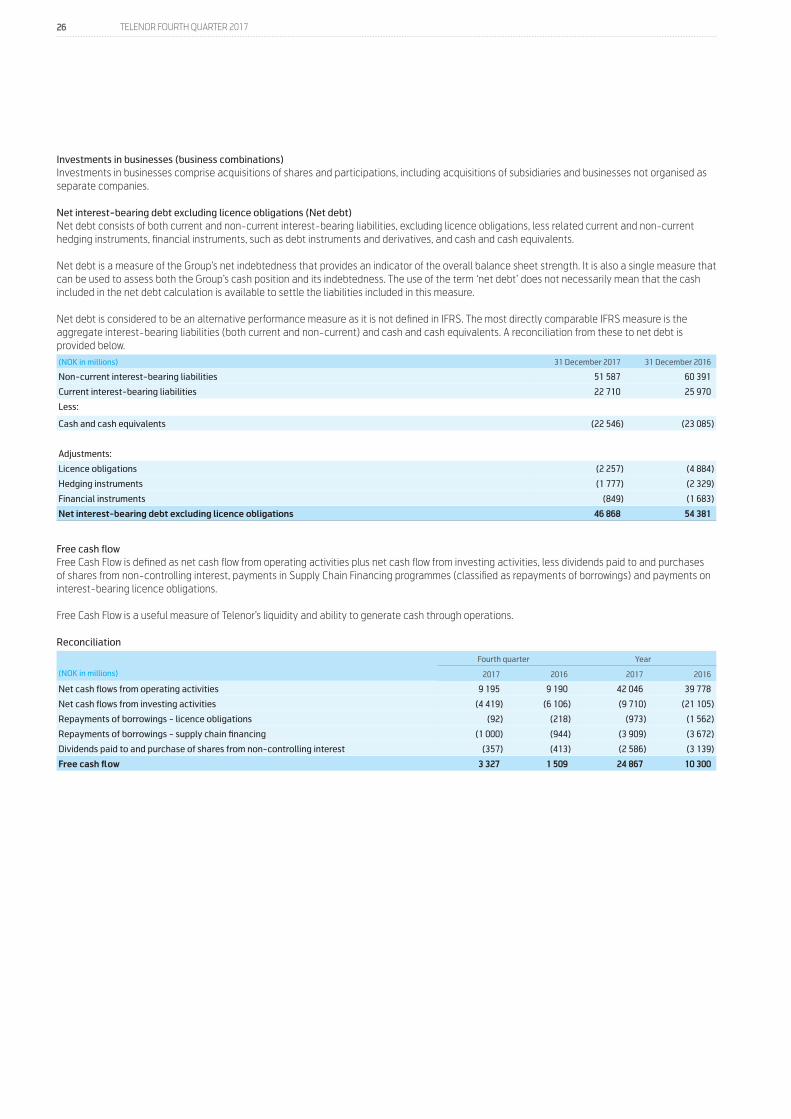
26 TELENOR FOURTH QUARTER 2017
Investments in businesses (business combinations) Investments in businesses comprise acquisitions of shares and participations, including acquisitions of subsidiaries and businesses not organised as separate companies.
Net interest-bearing debt excluding licence obligations (Net debt)Net debt consists of both current and non-current interest-bearing liabilities, excluding licence obligations, less related current and non-current hedging instruments, financial instruments, such as debt instruments and derivatives, and cash and cash equivalents.
Net debt is a measure of the Group’s net indebtedness that provides an indicator of the overall balance sheet strength. It is also a single measure that can be used to assess both the Group’s cash position and its indebtedness. The use of the term ‘net debt’ does not necessarily mean that the cash included in the net debt calculation is available to settle the liabilities included in this measure.
Net debt is considered to be an alternative performance measure as it is not defined in IFRS. The most directly comparable IFRS measure is the aggregate interest-bearing liabilities (both current and non-current) and cash and cash equivalents. A reconciliation from these to net debt is provided below. (NOK in millions) 31 December 2017 31 December 2016
Non-current interest-bearing liabilities 51 587 60 391
Current interest-bearing liabilities 22 710 25 970
Less:
Cash and cash equivalents (22 546) (23 085)
Adjustments:
Licence obligations (2 257) (4 884)
Hedging instruments (1 777) (2 329)
Financial instruments (849) (1 683)
Net interest-bearing debt excluding licence obligations 46 868 54 381
Free cash flowFree Cash Flow is defined as net cash flow from operating activities plus net cash flow from investing activities, less dividends paid to and purchases of shares from non-controlling interest, payments in Supply Chain Financing programmes (classified as repayments of borrowings) and payments on interest-bearing licence obligations.
Free Cash Flow is a useful measure of Telenor’s liquidity and ability to generate cash through operations.
Reconciliation
Fourth quarter Year
(NOK in millions) 2017 2016 2017 2016
Net cash flows from operating activities 9 195 9 190 42 046 39 778
Net cash flows from investing activities (4 419) (6 106) (9 710) (21 105)
Repayments of borrowings - licence obligations (92) (218) (973) (1 562)
Repayments of borrowings - supply chain financing (1 000) (944) (3 909) (3 672)
Dividends paid to and purchase of shares from non-controlling interest (357) (413) (2 586) (3 139)
Free cash flow 3 327 1 509 24 867 10 300
27 TELENOR FOURTH QUARTER 2017
Mobile operations
RevenuesMobile subscription and trafficConsist of subscription and connection fees, revenues from voice (outgoing traffic) and non-voice traffic, outbound roaming and other mobile service revenues. Subscription and traffic includes only revenues from the company’s own subscriptions.
InterconnectConsist of revenues from incoming traffic related to the company’s own subscriptions. Revenues from incoming traffic related to service provider or MVNO subscriptions are not included.
Other mobileConsist of inbound roaming, national roaming, telemetric and revenues related to service providers and MVNOs (Mobile Virtual Network Operators). Telemetric is defined as machine-to-machine SIM cards (M2M), for example vending machines and meter readings.
Non-mobileConsist of revenues from customer equipment and businesses that are not directly related to mobile operations.
Mobile revenues from company’s own subscriptionsConsist of ‘Mobile subscription and traffic’ and ‘Interconnect’ and do not include revenues from inbound roaming, national roaming, service providers, MVNOs, sale of customer equipment and incoming traffic related to service provider subscriptions.
Key FiguresSubscriptionsContract subscriptions are counted until the subscription is terminated or until there has been no revenues or outgoing/incoming traffic during the last three months. Prepaid subscriptions are counted as active if there has been outgoing or incoming traffic or if the SIM card has been reloaded during the last three months. Service provider and MVNO subscriptions are not included. Data only SIM cards are included, but SIM cards used for telemetric applications and twin/multi SIM cards are excluded. Total subscriptions are voice SIM cards plus data only SIM cards used for mobile broadband.
Active mobile internet usersActive mobile internet users are subscriptions with at least 150 KB of data during the last three months.
Average traffic minutes per subscription per month (AMPU)Traffic minutes per subscription per month are calculated based on total outgoing and incoming rated minutes from the company’s own subscriptions less data only subscriptions. This includes zero rated minutes and outgoing minutes from own subscriptions while roaming. Outgoing and incoming minutes related to inbound roaming, national roaming, service providers and MVNOs are not included.
Average revenue per subscription per month (ARPU)ARPU is calculated based on mobile revenues from the company’s own subscriptions, divided by the average number of subscriptions for the relevant period.
28 TELENOR FOURTH QUARTER 2017
Fixed operations
RevenuesTelephonyConsist of subscription and connection fees, traffic (fixed to fixed, fixed to mobile, to other countries, value added services, other traffic) for PSTN/ISDN and Voice over Internet Protocol (VoIP).
Internet and TVConsist of subscription, traffic charges and connection fees for xDSL, cable and fibre, in addition to revenues from TV services. High speed fixed internet include fibre, cable and VDSL.
Data servicesConsist of Nordic Connect/IP-VPN and security.
OtherConsist of leased lines, managed services and other retail products.
WholesaleConsist of sale to service providers of telephony (PSTN/ISDN), Bitstream, LLUB, national and international interconnect, transit traffic, leased lines and other wholesale products.
Key FiguresSubscriptionsTelephony consists of PSTN, ISDN and VoIP subscriptions. Internet consists of broadband access over xDSL, fibre and cable. TV consists of TV services over fibre and cable. Subscriptions are counted until the subscription is terminated.
Average revenue per subscription per month (ARPU)ARPU is calculated based on revenues from the company’s own subscriptions, divided by the average number of subscriptions for the relevant period. Internet ARPU is calculated based on Internet revenues as defined above except TV service revenues. TV ARPU is calculated based on revenues from TV services.
BroadcastRevenuesCanal Digital DTHConsist of revenues from Nordic DTH subscribers and households in SMATV networks.
SatelliteConsist of revenues from satellite services from the satellite position 1-degree west.
NorkringConsist of revenues from terrestrial radio and TV transmission in Norway and Belgium.

Fourth quarter 2017Published by Telenor ASAN-1360 Fornebu, NorwayPhone: +47 67 89 00 00
Investor Relations:E-mail: [email protected]
www.telenor.com
2181
027
• B
olt C
omm
unic
atio
n AS
• b
oltc
omm
unic
atio
n.no