Embed Size (px)
Citation preview

Q2 – 2017Interim reportJanuary – June 2017
Contents
Highlights and Group performance 1Outlook for 2017 1
Interim report 5Telenor’s operations 5
Group performance 11
Interim condensed financial information 14Notes to the interim consolidated financial statements 19
Definitions 25
1 TELENOR SECOND QUARTER 2017
Key figures Telenor Group
Second quarter First half year Year
(NOK in millions) 2017 2016 2017 2016 2016
Revenues 31 470 30 926 61 927 62 420 125 395
Organic revenue growth (%) 2.1 0.0 1.2 0.7 0.8
EBITDA before other income and other expenses 12 719 11 381 24 181 23 010 45 966
EBITDA before other income and other expenses/Revenues (%) 40.4 36.8 39.0 36.9 36.7
Net income attributable to equity holders of Telenor ASA (167) 1 111 4 001 5 367 2 832
Capex excl. licences and spectrum/Revenues (%) 14.0 16.3 14.4 16.3 17.4
Capex/Revenues (%) 17.9 27.2 16.4 21.8 20.2
Free cash flow 9 946 497 12 113 (272) 10 300
Mobile subscriptions - Change in quarter/Total (mill.) 1.9 2.7 174 167 170
With effect from the first quarter 2017, Telenor India is treated as an asset held for sale and discontinued operations in Telenor’s financial reporting.
Second quarter 2017 summary
• Total reported revenues increased by 2% to NOK 31.5 billion. Reported mobile subscription & traffic revenues increased by 3%.• Reported EBITDA before other items increased by 12% to NOK 12.7 billion, corresponding to an EBITDA margin of 40%, which is an
increase of 4 percentage points from last year.• Reported capex excluding spectrum licences was NOK 4.4 billion, resulting in a capex to sales ratio of 14%.• Free cash flow for the quarter was NOK 9.9 billion.
Outlook
• Based on the performance in the first half of 2017 and our current expectations for the remainder of the year, we revise the financial guidance for 2017. We lift the EBITDA margin guidance to 38–39%, from previously around 37%. We still expect an organic revenue growth in the range of 1% to 2% and capex to sales ratio excluding spectrum licences of 15% to 16%.
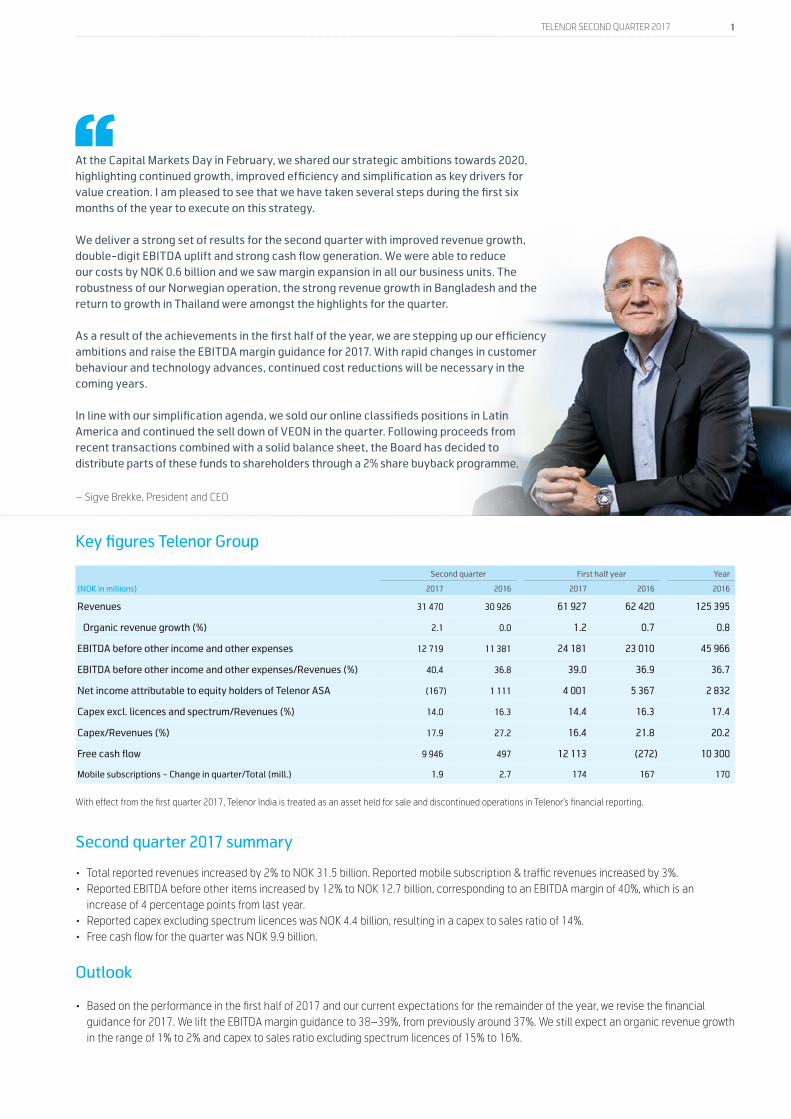
At the Capital Markets Day in February, we shared our strategic ambitions towards 2020, highlighting continued growth, improved efficiency and simplification as key drivers for value creation. I am pleased to see that we have taken several steps during the first six months of the year to execute on this strategy.
We deliver a strong set of results for the second quarter with improved revenue growth, double-digit EBITDA uplift and strong cash flow generation. We were able to reduce our costs by NOK 0.6 billion and we saw margin expansion in all our business units. The robustness of our Norwegian operation, the strong revenue growth in Bangladesh and the return to growth in Thailand were amongst the highlights for the quarter.
As a result of the achievements in the first half of the year, we are stepping up our efficiency ambitions and raise the EBITDA margin guidance for 2017. With rapid changes in customer behaviour and technology advances, continued cost reductions will be necessary in the coming years.
In line with our simplification agenda, we sold our online classifieds positions in Latin America and continued the sell down of VEON in the quarter. Following proceeds from recent transactions combined with a solid balance sheet, the Board has decided to distribute parts of these funds to shareholders through a 2% share buyback programme.
– Sigve Brekke, President and CEO
2 TELENOR SECOND QUARTER 2017
REVENUES
OPERATING EXPENDITURES (OPEX)
EBITDA BEFORE OTHER INCOME AND OTHER EXPENSES (EBITDA)
Group performance in the first quarter 20171)
1) The comments are related to Telenor Group’s development in the second quarter of 2017 compared to the second quarter of 2016 unless otherwise stated. Please refer to Definitions on page 25 for descriptions of alternative performance measures.
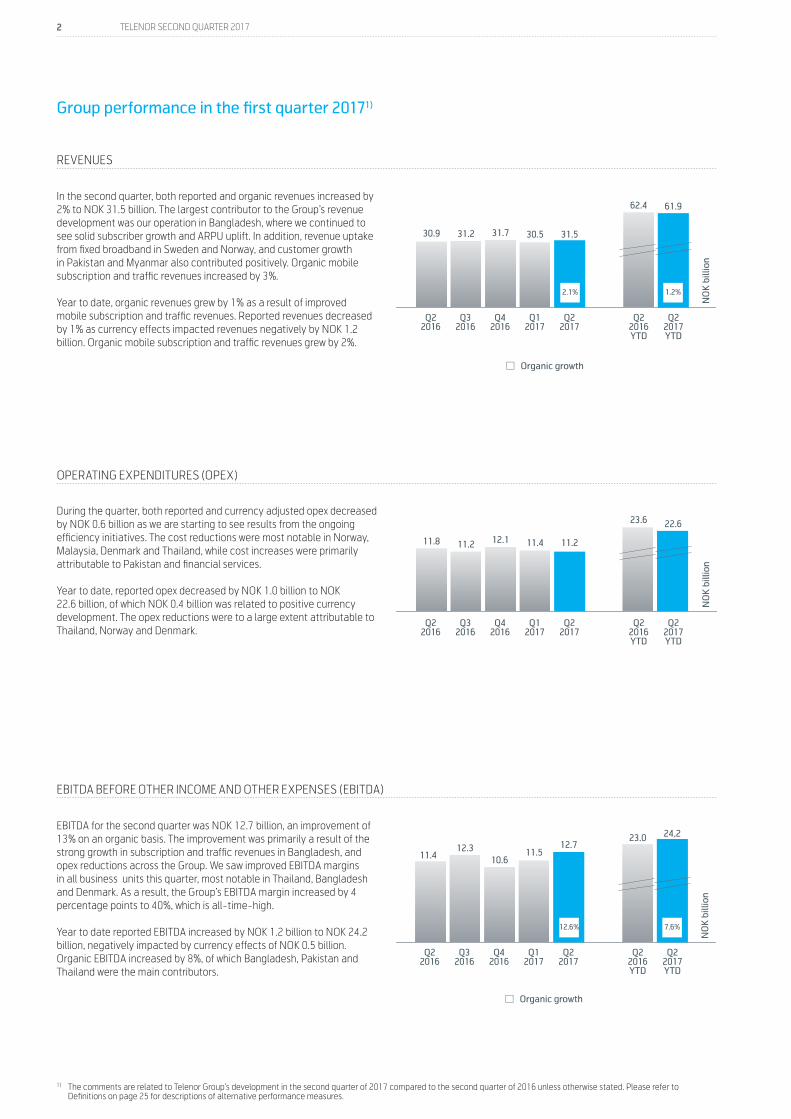
In the second quarter, both reported and organic revenues increased by 2% to NOK 31.5 billion. The largest contributor to the Group’s revenue development was our operation in Bangladesh, where we continued to see solid subscriber growth and ARPU uplift. In addition, revenue uptake from fixed broadband in Sweden and Norway, and customer growth in Pakistan and Myanmar also contributed positively. Organic mobile subscription and traffic revenues increased by 3%.
Year to date, organic revenues grew by 1% as a result of improved mobile subscription and traffic revenues. Reported revenues decreased by 1% as currency effects impacted revenues negatively by NOK 1.2 billion. Organic mobile subscription and traffic revenues grew by 2%.
EBITDA for the second quarter was NOK 12.7 billion, an improvement of 13% on an organic basis. The improvement was primarily a result of the strong growth in subscription and traffic revenues in Bangladesh, and opex reductions across the Group. We saw improved EBITDA margins in all business units this quarter, most notable in Thailand, Bangladesh and Denmark. As a result, the Group’s EBITDA margin increased by 4 percentage points to 40%, which is all-time-high.
Year to date reported EBITDA increased by NOK 1.2 billion to NOK 24.2 billion, negatively impacted by currency effects of NOK 0.5 billion. Organic EBITDA increased by 8%, of which Bangladesh, Pakistan and Thailand were the main contributors.
During the quarter, both reported and currency adjusted opex decreased by NOK 0.6 billion as we are starting to see results from the ongoing efficiency initiatives. The cost reductions were most notable in Norway, Malaysia, Denmark and Thailand, while cost increases were primarily attributable to Pakistan and financial services.
Year to date, reported opex decreased by NOK 1.0 billion to NOK 22.6 billion, of which NOK 0.4 billion was related to positive currency development. The opex reductions were to a large extent attributable to Thailand, Norway and Denmark.
Revenues
Opex
EBITDA
Capex
Net income
Free cash flow
Mobile
0
10
20
30
40
50
0
14
28
42
56
70
NO
K b
illio
n
Q22016
Q32016
Q42016
Q12017
Q22017
Q22016YTD
Q22017YTD
Q22016
Q32016
Q42016
Q12017
Q22017
Q22016YTD
Q22017YTD
Q22016
Q32016
Q42016
Q12017
Q22017
Q22016YTD
Q22017YTD
Q22016
Q32016
Q42016
Q12017
Q22017
Q22016YTD
Q22017YTD
Q22016
Q32016
Q42016
Q12017
Q22017
Q22016YTD
Q22017YTD
Q22016
Q32016
Q42016
Q12017
Q22017
Q22016YTD
Q22017YTD
30.9 31.2 31.7 30.5 31.5
62.4 61.9
0
5
10
15
20
0
5
10
15
20
25
30
NO
K b
illio
n
11.8 11.2 12.1 11.4 11.2
23.6 22.6
2.1% 1.2%
0
5
10
15
150,00
156,25
162,50
168,75
175,00
0
5
10
15
20
25
NO
K b
illio
n
11.412.3
10.611.5
12.723.0 24,2
8.4
5.06.8
4.55.6
13.6
10.2
1.1
-4.8
2.3
4.2
-0.2
5.4
4.0
0.5
9.1
1.52.2
9.9
-0.3
12.1
12.6% 7.6%
0
5
10
15
0,000000
2,833333
5,666667
8,500000
11,333333
14,166667
17,000000
-5
-3
-1
1
3
5
NO
K b
illio
nN
OK
bill
ion
Q22016
Q32016
Q42016
Q12017
Q22017
166.5 165.8
169.8172.0
173.9
47%
49%50% 50% 50%
40
50
Q42015
Q12016
Q22016
Q32016
Q42016
203208 211 211
214
-3
0
3
6
9
12
15
Mobile subscriptions of which active data users (%)
Capex Capex/Sales
Organic growth
Organic growth
0
20
40
60
80
27%16% 21%
15% 18% 22%16%
3 TELENOR SECOND QUARTER 2017
NET INCOME
FREE CASH FLOW
CAPITAL EXPENDITURES (CAPEX)
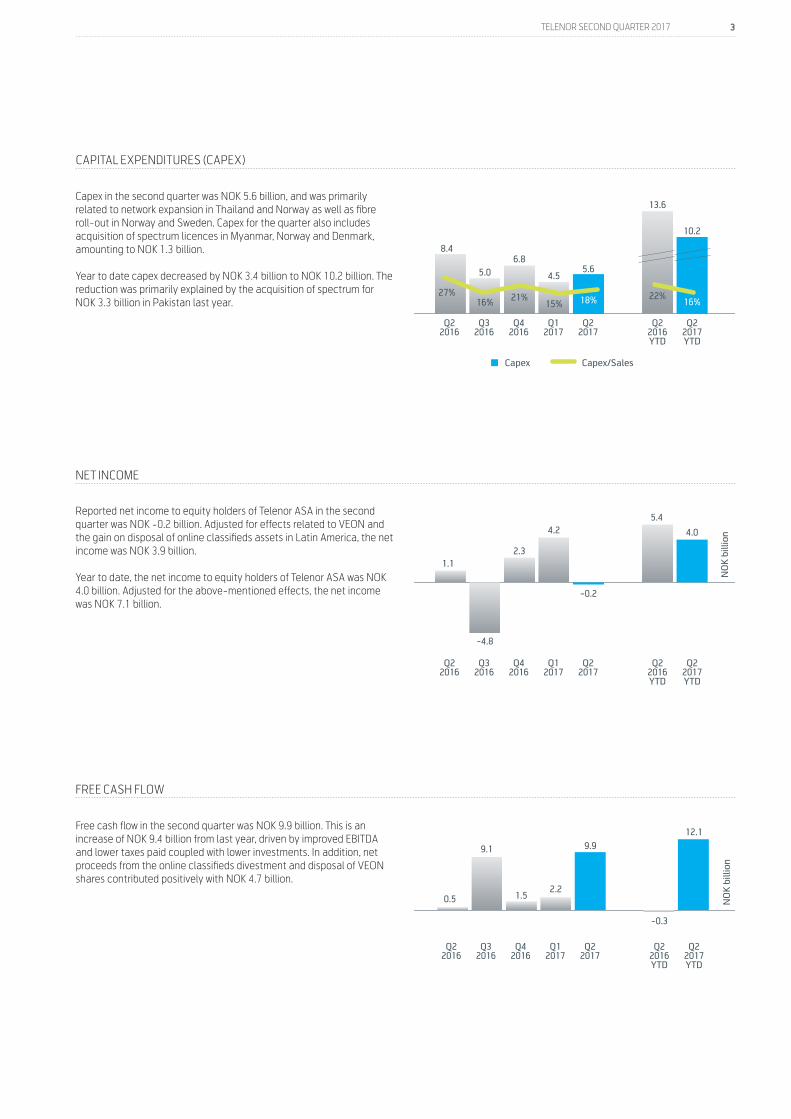
Capex in the second quarter was NOK 5.6 billion, and was primarily related to network expansion in Thailand and Norway as well as fibre roll-out in Norway and Sweden. Capex for the quarter also includes acquisition of spectrum licences in Myanmar, Norway and Denmark, amounting to NOK 1.3 billion.
Year to date capex decreased by NOK 3.4 billion to NOK 10.2 billion. The reduction was primarily explained by the acquisition of spectrum for NOK 3.3 billion in Pakistan last year.
Free cash flow in the second quarter was NOK 9.9 billion. This is an increase of NOK 9.4 billion from last year, driven by improved EBITDA and lower taxes paid coupled with lower investments. In addition, net proceeds from the online classifieds divestment and disposal of VEON shares contributed positively with NOK 4.7 billion.
Reported net income to equity holders of Telenor ASA in the second quarter was NOK -0.2 billion. Adjusted for effects related to VEON and the gain on disposal of online classifieds assets in Latin America, the net income was NOK 3.9 billion.
Year to date, the net income to equity holders of Telenor ASA was NOK 4.0 billion. Adjusted for the above-mentioned effects, the net income was NOK 7.1 billion.
Revenues
Opex
EBITDA
Capex
Net income
Free cash flow
Mobile
0
10
20
30
40
50
0
14
28
42
56
70
NO
K b
illio
n
Q22016
Q32016
Q42016
Q12017
Q22017
Q22016YTD
Q22017YTD
Q22016
Q32016
Q42016
Q12017
Q22017
Q22016YTD
Q22017YTD
Q22016
Q32016
Q42016
Q12017
Q22017
Q22016YTD
Q22017YTD
Q22016
Q32016
Q42016
Q12017
Q22017
Q22016YTD
Q22017YTD
Q22016
Q32016
Q42016
Q12017
Q22017
Q22016YTD
Q22017YTD
Q22016
Q32016
Q42016
Q12017
Q22017
Q22016YTD
Q22017YTD
30.9 31.2 31.7 30.5 31.5
62.4 61.9
0
5
10
15
20
0
5
10
15
20
25
30
NO
K b
illio
n
11.8 11.2 12.1 11.4 11.2
23.6 22.6
2.1% 1.2%
0
5
10
15
150,00
156,25
162,50
168,75
175,00
0
5
10
15
20
25
NO
K b
illio
n
11.412.3
10.611.5
12.723.0 24,2
8.4
5.06.8
4.55.6
13.6
10.2
1.1
-4.8
2.3
4.2
-0.2
5.4
4.0
0.5
9.1
1.52.2
9.9
-0.3
12.1
12.6% 7.6%
0
5
10
15
0,000000
2,833333
5,666667
8,500000
11,333333
14,166667
17,000000
-5
-3
-1
1
3
5
NO
K b
illio
nN
OK
bill
ion
Q22016
Q32016
Q42016
Q12017
Q22017
166.5 165.8
169.8172.0
173.9
47%
49%50% 50% 50%
40
50
Q42015
Q12016
Q22016
Q32016
Q42016
203208 211 211
214
-3
0
3
6
9
12
15
Mobile subscriptions of which active data users (%)
Capex Capex/Sales
Organic growth
Organic growth
0
20
40
60
80
27%16% 21%
15% 18% 22%16%
4 TELENOR SECOND QUARTER 2017
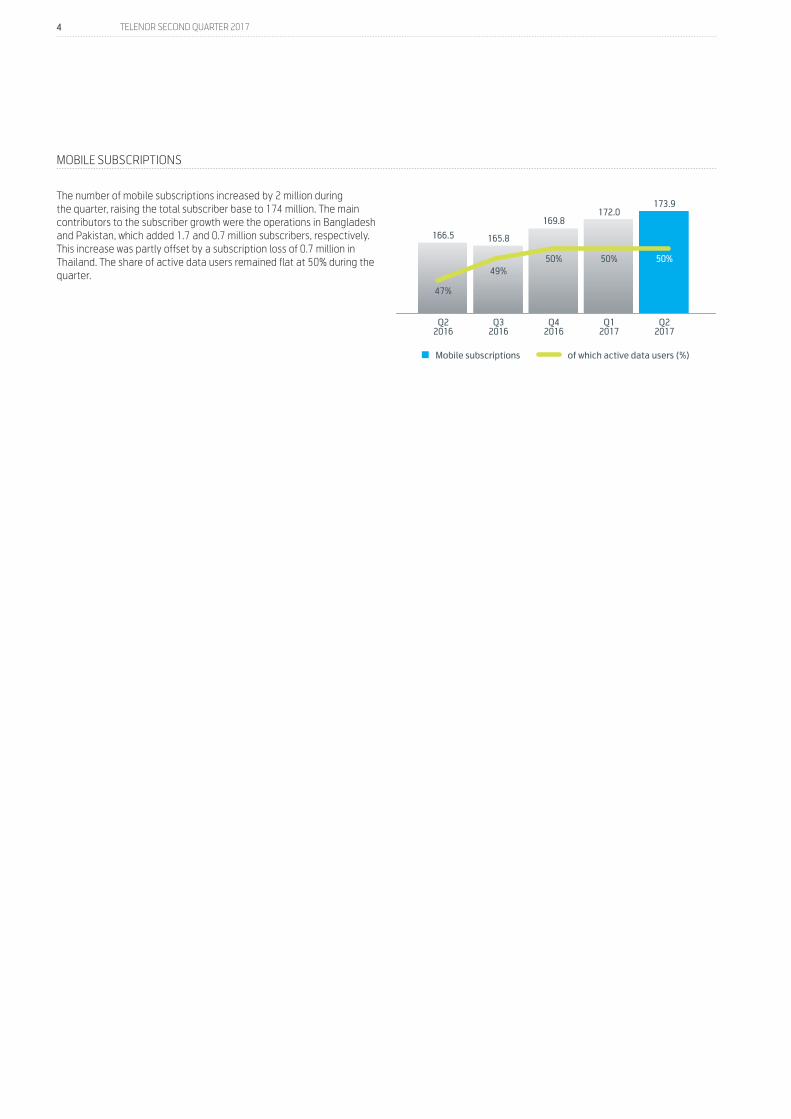
The number of mobile subscriptions increased by 2 million during the quarter, raising the total subscriber base to 174 million. The main contributors to the subscriber growth were the operations in Bangladesh and Pakistan, which added 1.7 and 0.7 million subscribers, respectively. This increase was partly offset by a subscription loss of 0.7 million in Thailand. The share of active data users remained flat at 50% during the quarter.
MOBILE SUBSCRIPTIONS
Revenues
Opex
EBITDA
Capex
Net income
Free cash flow
Mobile
0
10
20
30
40
50
0
14
28
42
56
70
NO
K b
illio
n
Q22016
Q32016
Q42016
Q12017
Q22017
Q22016YTD
Q22017YTD
Q22016
Q32016
Q42016
Q12017
Q22017
Q22016YTD
Q22017YTD
Q22016
Q32016
Q42016
Q12017
Q22017
Q22016YTD
Q22017YTD
Q22016
Q32016
Q42016
Q12017
Q22017
Q22016YTD
Q22017YTD
Q22016
Q32016
Q42016
Q12017
Q22017
Q22016YTD
Q22017YTD
Q22016
Q32016
Q42016
Q12017
Q22017
Q22016YTD
Q22017YTD
30.9 31.2 31.7 30.5 31.5
62.4 61.9
0
5
10
15
20
0
5
10
15
20
25
30
NO
K b
illio
n
11.8 11.2 12.1 11.4 11.2
23.6 22.6
2.1% 1.2%
0
5
10
15
150,00
156,25
162,50
168,75
175,00
0
5
10
15
20
25
NO
K b
illio
n
11.412.3
10.611.5
12.723.0 24,2
8.4
5.06.8
4.55.6
13.6
10.2
1.1
-4.8
2.3
4.2
-0.2
5.4
4.0
0.5
9.1
1.52.2
9.9
-0.3
12.1
12.6% 7.6%
0
5
10
15
0,000000
2,833333
5,666667
8,500000
11,333333
14,166667
17,000000
-5
-3
-1
1
3
5
NO
K b
illio
nN
OK
bill
ion
Q22016
Q32016
Q42016
Q12017
Q22017
166.5 165.8
169.8172.0
173.9
47%
49%50% 50% 50%
40
50
Q42015
Q12016
Q22016
Q32016
Q42016
203208 211 211
214
-3
0
3
6
9
12
15
Mobile subscriptions of which active data users (%)
Capex Capex/Sales
Organic growth
Organic growth
0
20
40
60
80
27%16% 21%
15% 18% 22%16%
5 TELENOR SECOND QUARTER 2017
Norway
Second quarter First half year Year
(NOK in millions)2017 2016
Restated*2017 2016
Restated*2016
Restated*
Revenues mobile operation
Subscription and traffic 2 776 2 792 5 431 5 623 11 288
Interconnect revenues 148 156 277 300 585
Other mobile revenues 285 259 549 509 1 064
Non-mobile revenues 539 533 994 896 2 114
Total revenues mobile operation 3 749 3 739 7 251 7 328 15 052
Revenues fixed operation
Telephony 379 465 788 943 1 806
Internet and TV 1 428 1 333 2 848 2 667 5 446
Data services 125 126 248 253 503
Other fixed revenues 425 439 833 853 1 715
Total retail revenues 2 357 2 364 4 718 4 717 9 470
Wholesale revenues 359 384 725 773 1 508
Total revenues fixed operation 2 716 2 747 5 443 5 490 10 978
Total revenues 6 464 6 487 12 694 12 818 26 030
Operating expenditures 2 271 2 468 4 616 4 806 9 493
EBITDA before other items 2 843 2 631 5 418 5 397 10 946
Operating profit 1 957 1 679 3 430 3 446 6 726
EBITDA before other items/Total revenues (%) 44.0 40.6 42.7 42.1 42.1
Capex 1 562 1 184 2 710 2 092 4 780
Investments in businesses 6 100 13 100 100
Statistics (monthly in NOK):
Mobile ARPU 323 315 314 315 319
Fixed Telephony ARPU 245 263 250 262 259
Fixed Internet ARPU 361 345 361 344 352
TV ARPU 298 279 359 281 284
No. of subscriptions - Change in quarter/Total (in thousands):
Mobile (19) (24) 3 007 3 105 3 066
Fixed telephony (17) (20) 508 581 546
Fixed Internet (3) 7 862 859 865
TV 2 (2) 547 527 541
* Refer to note 9.
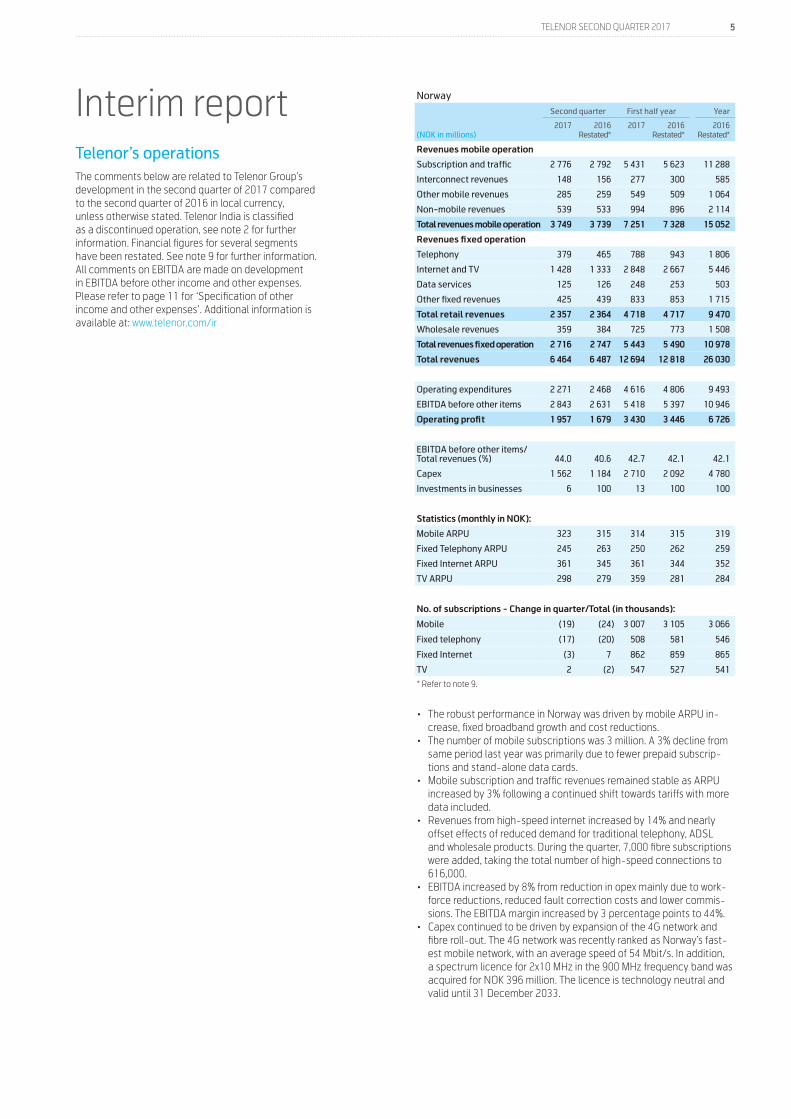
• The robust performance in Norway was driven by mobile ARPU in-crease, fixed broadband growth and cost reductions.
• The number of mobile subscriptions was 3 million. A 3% decline from same period last year was primarily due to fewer prepaid subscrip-tions and stand-alone data cards.
• Mobile subscription and traffic revenues remained stable as ARPU increased by 3% following a continued shift towards tariffs with more data included.
• Revenues from high-speed internet increased by 14% and nearly offset effects of reduced demand for traditional telephony, ADSL and wholesale products. During the quarter, 7,000 fibre subscriptions were added, taking the total number of high-speed connections to 616,000.
• EBITDA increased by 8% from reduction in opex mainly due to work-force reductions, reduced fault correction costs and lower commis-sions. The EBITDA margin increased by 3 percentage points to 44%.
• Capex continued to be driven by expansion of the 4G network and fibre roll-out. The 4G network was recently ranked as Norway’s fast-est mobile network, with an average speed of 54 Mbit/s. In addition, a spectrum licence for 2x10 MHz in the 900 MHz frequency band was acquired for NOK 396 million. The licence is technology neutral and valid until 31 December 2033.
Interim report Telenor’s operations The comments below are related to Telenor Group’s development in the second quarter of 2017 compared to the second quarter of 2016 in local currency, unless otherwise stated. Telenor India is classified as a discontinued operation, see note 2 for further information. Financial figures for several segments have been restated. See note 9 for further information. All comments on EBITDA are made on development in EBITDA before other income and other expenses. Please refer to page 11 for ‘Specification of other income and other expenses’. Additional information is available at: www.telenor.com/ir
6 TELENOR SECOND QUARTER 2017
Sweden
Second quarter First half year Year
(NOK in millions)2017 2016
Restated*2017 2016
Restated*2016
Restated*
Revenues mobile operation
Subscription and traffic 1 509 1 567 2 991 3 145 5 926
Interconnect revenues 139 147 326 291 557
Other mobile revenues 87 90 174 171 351
Non-mobile revenues 483 452 979 943 2 256
Total revenues mobile operation 2 219 2 256 4 470 4 549 9 090
Revenues fixed operation
Telephony 74 95 149 193 346
Internet and TV 660 618 1 279 1 238 2 492
Data services 59 44 99 90 171
Other fixed revenues 94 31 115 48 97
Total retail revenues 888 788 1 642 1 570 3 106
Wholesale revenues 32 48 83 96 188
Total revenues fixed operation 920 837 1 724 1 666 3 294
Total revenues 3 139 3 093 6 195 6 215 12 384
Operating expenditures 1 094 1 109 2 161 2 257 4 375
EBITDA before other items 1 009 990 1 929 1 884 3 538
Operating profit 651 587 1 213 1 066 1 759
EBITDA before other items/Total revenues (%) 32.1 32.0 31.1 30.3 28.6
Capex 427 336 733 672 1 560
Investments in businesses 112 - 112 - -
Statistics (monthly in NOK):
Mobile ARPU 207 224 209 225 210
Fixed Telephony ARPU 69 79 69 81 75
Fixed Internet ARPU 211 220 210 222 216
TV ARPU 135 121 133 120 122
No. of subscriptions - Change in quarter/Total (in thousands):
Mobile 13 4 2 662 2 555 2 624
Fixed telephony (6) (6) 201 230 215
Fixed Internet 6 7 674 647 657
TV 3 3 467 487 469
Exchange rate (SEK) 0.9561 1.0130 0.9814
* Refer to note 9.
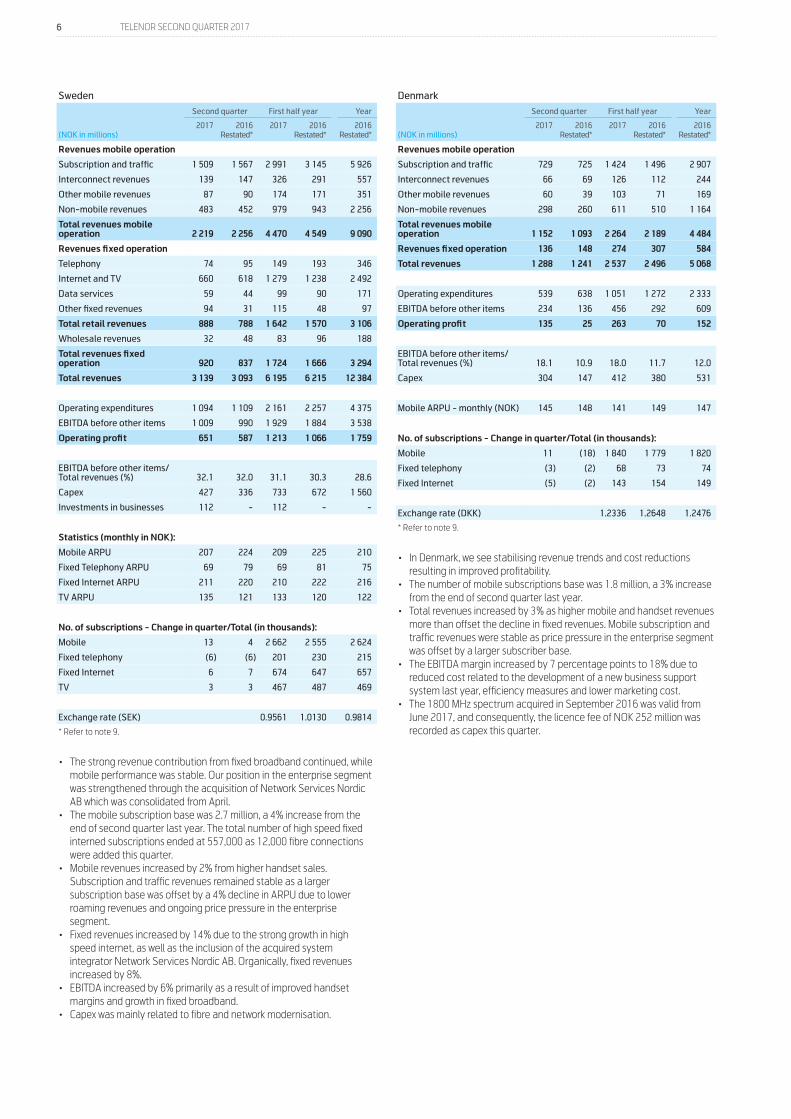
• The strong revenue contribution from fixed broadband continued, while mobile performance was stable. Our position in the enterprise segment was strengthened through the acquisition of Network Services Nordic AB which was consolidated from April.
• The mobile subscription base was 2.7 million, a 4% increase from the end of second quarter last year. The total number of high speed fixed interned subscriptions ended at 557,000 as 12,000 fibre connections were added this quarter.
• Mobile revenues increased by 2% from higher handset sales. Subscription and traffic revenues remained stable as a larger subscription base was offset by a 4% decline in ARPU due to lower roaming revenues and ongoing price pressure in the enterprise segment.
• Fixed revenues increased by 14% due to the strong growth in high speed internet, as well as the inclusion of the acquired system integrator Network Services Nordic AB. Organically, fixed revenues increased by 8%.
• EBITDA increased by 6% primarily as a result of improved handset margins and growth in fixed broadband.
• Capex was mainly related to fibre and network modernisation.
Denmark
Second quarter First half year Year
(NOK in millions)2017 2016
Restated*2017 2016
Restated*2016
Restated*
Revenues mobile operation
Subscription and traffic 729 725 1 424 1 496 2 907
Interconnect revenues 66 69 126 112 244
Other mobile revenues 60 39 103 71 169
Non-mobile revenues 298 260 611 510 1 164
Total revenues mobile operation 1 152 1 093 2 264 2 189 4 484
Revenues fixed operation 136 148 274 307 584
Total revenues 1 288 1 241 2 537 2 496 5 068
Operating expenditures 539 638 1 051 1 272 2 333
EBITDA before other items 234 136 456 292 609
Operating profit 135 25 263 70 152
EBITDA before other items/Total revenues (%) 18.1 10.9 18.0 11.7 12.0
Capex 304 147 412 380 531
Mobile ARPU - monthly (NOK) 145 148 141 149 147
No. of subscriptions - Change in quarter/Total (in thousands):
Mobile 11 (18) 1 840 1 779 1 820
Fixed telephony (3) (2) 68 73 74
Fixed Internet (5) (2) 143 154 149
Exchange rate (DKK) 1.2336 1.2648 1.2476
* Refer to note 9.
• In Denmark, we see stabilising revenue trends and cost reductions resulting in improved profitability.
• The number of mobile subscriptions base was 1.8 million, a 3% increase from the end of second quarter last year.
• Total revenues increased by 3% as higher mobile and handset revenues more than offset the decline in fixed revenues. Mobile subscription and traffic revenues were stable as price pressure in the enterprise segment was offset by a larger subscriber base.
• The EBITDA margin increased by 7 percentage points to 18% due to reduced cost related to the development of a new business support system last year, efficiency measures and lower marketing cost.
• The 1800 MHz spectrum acquired in September 2016 was valid from June 2017, and consequently, the licence fee of NOK 252 million was recorded as capex this quarter.
7 TELENOR SECOND QUARTER 2017
Hungary
Second quarter First half year Year
(NOK in millions) 2017 2016 2017 2016 2016
Revenues
Subscription and traffic 917 885 1 777 1 792 3 561
Interconnect revenues 69 68 133 136 269
Other mobile revenues 23 20 40 38 80
Non-mobile revenues 140 128 251 252 526
Total revenues 1 149 1 101 2 202 2 218 4 436
Operating expenditures 366 396 734 807 1 576
EBITDA before other items 398 332 746 686 1 369
Operating profit 265 173 471 362 773
EBITDA before other items/ Total revenues (%) 34.6 30.2 33.9 30.9 30.9
Capex 62 77 102 123 390
No. of subscriptions - Change in quarter/Total (in thousands): 18 27 3 121 3 178 3 148
ARPU - monthly (NOK) 106 100 102 102 101
Exchange rate (HUF) 0.0296 0.0301 0.0298
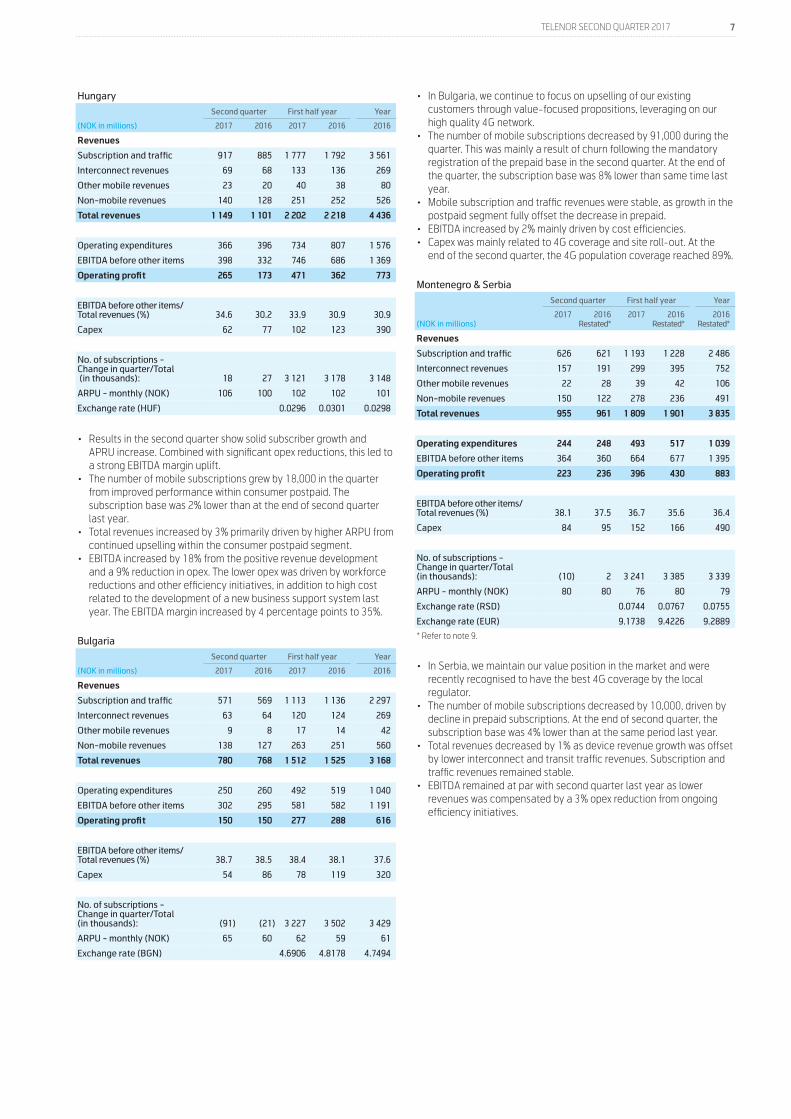
• Results in the second quarter show solid subscriber growth and APRU increase. Combined with significant opex reductions, this led to a strong EBITDA margin uplift.
• The number of mobile subscriptions grew by 18,000 in the quarter from improved performance within consumer postpaid. The subscription base was 2% lower than at the end of second quarter last year.
• Total revenues increased by 3% primarily driven by higher ARPU from continued upselling within the consumer postpaid segment.
• EBITDA increased by 18% from the positive revenue development and a 9% reduction in opex. The lower opex was driven by workforce reductions and other efficiency initiatives, in addition to high cost related to the development of a new business support system last year. The EBITDA margin increased by 4 percentage points to 35%.
Bulgaria
Second quarter First half year Year
(NOK in millions) 2017 2016 2017 2016 2016
Revenues
Subscription and traffic 571 569 1 113 1 136 2 297
Interconnect revenues 63 64 120 124 269
Other mobile revenues 9 8 17 14 42
Non-mobile revenues 138 127 263 251 560
Total revenues 780 768 1 512 1 525 3 168
Operating expenditures 250 260 492 519 1 040
EBITDA before other items 302 295 581 582 1 191
Operating profit 150 150 277 288 616
EBITDA before other items/ Total revenues (%) 38.7 38.5 38.4 38.1 37.6
Capex 54 86 78 119 320
No. of subscriptions - Change in quarter/Total (in thousands): (91) (21) 3 227 3 502 3 429
ARPU - monthly (NOK) 65 60 62 59 61
Exchange rate (BGN) 4.6906 4.8178 4.7494
• In Bulgaria, we continue to focus on upselling of our existing customers through value-focused propositions, leveraging on our high quality 4G network.
• The number of mobile subscriptions decreased by 91,000 during the quarter. This was mainly a result of churn following the mandatory registration of the prepaid base in the second quarter. At the end of the quarter, the subscription base was 8% lower than same time last year.
• Mobile subscription and traffic revenues were stable, as growth in the postpaid segment fully offset the decrease in prepaid.
• EBITDA increased by 2% mainly driven by cost efficiencies.• Capex was mainly related to 4G coverage and site roll-out. At the
end of the second quarter, the 4G population coverage reached 89%.
Montenegro & Serbia
Second quarter First half year Year
(NOK in millions)2017 2016
Restated*2017 2016
Restated*2016
Restated*
Revenues
Subscription and traffic 626 621 1 193 1 228 2 486
Interconnect revenues 157 191 299 395 752
Other mobile revenues 22 28 39 42 106
Non-mobile revenues 150 122 278 236 491
Total revenues 955 961 1 809 1 901 3 835
Operating expenditures 244 248 493 517 1 039
EBITDA before other items 364 360 664 677 1 395
Operating profit 223 236 396 430 883
EBITDA before other items/ Total revenues (%) 38.1 37.5 36.7 35.6 36.4
Capex 84 95 152 166 490
No. of subscriptions - Change in quarter/Total (in thousands): (10) 2 3 241 3 385 3 339
ARPU - monthly (NOK) 80 80 76 80 79
Exchange rate (RSD) 0.0744 0.0767 0.0755
Exchange rate (EUR) 9.1738 9.4226 9.2889
* Refer to note 9.
• In Serbia, we maintain our value position in the market and were recently recognised to have the best 4G coverage by the local regulator.
• The number of mobile subscriptions decreased by 10,000, driven by decline in prepaid subscriptions. At the end of second quarter, the subscription base was 4% lower than at the same period last year.
• Total revenues decreased by 1% as device revenue growth was offset by lower interconnect and transit traffic revenues. Subscription and traffic revenues remained stable.
• EBITDA remained at par with second quarter last year as lower revenues was compensated by a 3% opex reduction from ongoing efficiency initiatives.
8 TELENOR SECOND QUARTER 2017
dtac - Thailand
Second quarter First half year Year
(NOK in millions) 2017 2016 2017 2016 2016
Revenues
Subscription and traffic 4 022 3 710 7 862 7 633 15 237
Interconnect revenues 214 271 432 558 1 085
Other mobile revenues 48 45 110 116 174
Non-mobile revenues 535 604 1 165 1 583 3 151
Total revenues 4 818 4 629 9 569 9 890 19 647
Operating expenditures 1 707 1 806 3 542 3 773 7 404
EBITDA before other items 1 972 1 541 3 629 3 320 6 645
Operating profit 383 174 576 689 1 160
EBITDA before other items/Total revenues (%) 40.9 33.3 37.9 33.6 33.8
Capex 1 022 1 003 2 098 2 142 4 835
No. of subscriptions - Change in quarter/Total (in thousands): (705) (524)
23 605 24 953 24 480
ARPU - monthly (NOK) 59 53 57 54 54
Exchange rate (THB) 0.2441 0.2383 0.2381
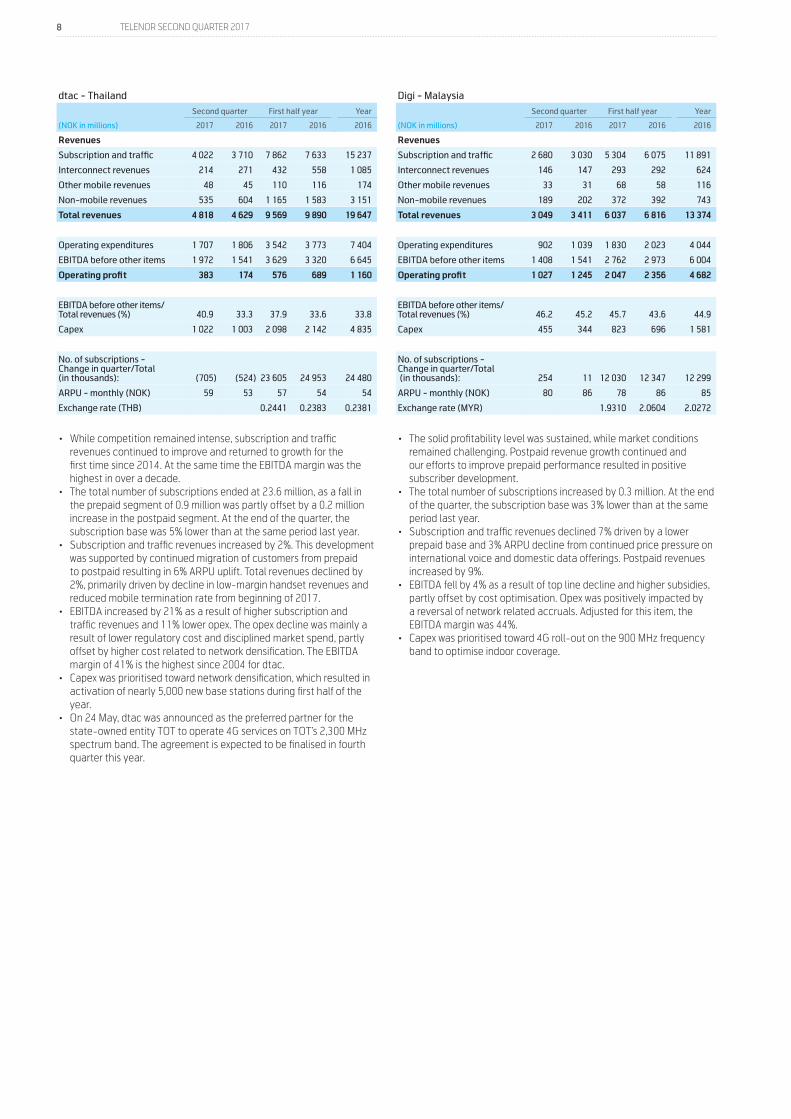
• While competition remained intense, subscription and traffic revenues continued to improve and returned to growth for the first time since 2014. At the same time the EBITDA margin was the highest in over a decade.
• The total number of subscriptions ended at 23.6 million, as a fall in the prepaid segment of 0.9 million was partly offset by a 0.2 million increase in the postpaid segment. At the end of the quarter, the subscription base was 5% lower than at the same period last year.
• Subscription and traffic revenues increased by 2%. This development was supported by continued migration of customers from prepaid to postpaid resulting in 6% ARPU uplift. Total revenues declined by 2%, primarily driven by decline in low-margin handset revenues and reduced mobile termination rate from beginning of 2017.
• EBITDA increased by 21% as a result of higher subscription and traffic revenues and 11% lower opex. The opex decline was mainly a result of lower regulatory cost and disciplined market spend, partly offset by higher cost related to network densification. The EBITDA margin of 41% is the highest since 2004 for dtac.
• Capex was prioritised toward network densification, which resulted in activation of nearly 5,000 new base stations during first half of the year.
• On 24 May, dtac was announced as the preferred partner for the state-owned entity TOT to operate 4G services on TOT’s 2,300 MHz spectrum band. The agreement is expected to be finalised in fourth quarter this year.
Digi - Malaysia
Second quarter First half year Year
(NOK in millions) 2017 2016 2017 2016 2016
Revenues
Subscription and traffic 2 680 3 030 5 304 6 075 11 891
Interconnect revenues 146 147 293 292 624
Other mobile revenues 33 31 68 58 116
Non-mobile revenues 189 202 372 392 743
Total revenues 3 049 3 411 6 037 6 816 13 374
Operating expenditures 902 1 039 1 830 2 023 4 044
EBITDA before other items 1 408 1 541 2 762 2 973 6 004
Operating profit 1 027 1 245 2 047 2 356 4 682
EBITDA before other items/Total revenues (%) 46.2 45.2 45.7 43.6 44.9
Capex 455 344 823 696 1 581
No. of subscriptions - Change in quarter/Total (in thousands): 254 11
12 030 12 347 12 299
ARPU - monthly (NOK) 80 86 78 86 85
Exchange rate (MYR) 1.9310 2.0604 2.0272
• The solid profitability level was sustained, while market conditions remained challenging. Postpaid revenue growth continued and our efforts to improve prepaid performance resulted in positive subscriber development.
• The total number of subscriptions increased by 0.3 million. At the end of the quarter, the subscription base was 3% lower than at the same period last year.
• Subscription and traffic revenues declined 7% driven by a lower prepaid base and 3% ARPU decline from continued price pressure on international voice and domestic data offerings. Postpaid revenues increased by 9%.
• EBITDA fell by 4% as a result of top line decline and higher subsidies, partly offset by cost optimisation. Opex was positively impacted by a reversal of network related accruals. Adjusted for this item, the EBITDA margin was 44%.
• Capex was prioritised toward 4G roll-out on the 900 MHz frequency band to optimise indoor coverage.
9 TELENOR SECOND QUARTER 2017
Grameenphone - Bangladesh
Second quarter First half year Year
(NOK in millions) 2017 2016 2017 2016 2016
Revenues
Subscription and traffic 3 056 2 583 5 952 5 216 10 725
Interconnect revenues 233 250 457 516 992
Other mobile revenues (2) (2) 4 13 30
Non-mobile revenues 146 135 296 266 592
Total revenues 3 432 2 965 6 709 6 010 12 339
Operating expenditures 1 062 1 085 2 137 2 167 4 368
EBITDA before other items 2 102 1 609 4 005 3 293 6 829
Operating profit 1 475 948 2 759 2 072 4 451
EBITDA before other items/Total revenues (%) 61.2 54.3 59.7 54.8 55.3
Capex 343 462 822 1 466 2 259
No. of subscriptions - Change in quarter/Total (in thousands): 1 713 624
61 581 56 909 57 954
ARPU - monthly (NOK) 18 17 18 17 17
Exchange rate (BDT) 0.1062 0.1078 0.1071
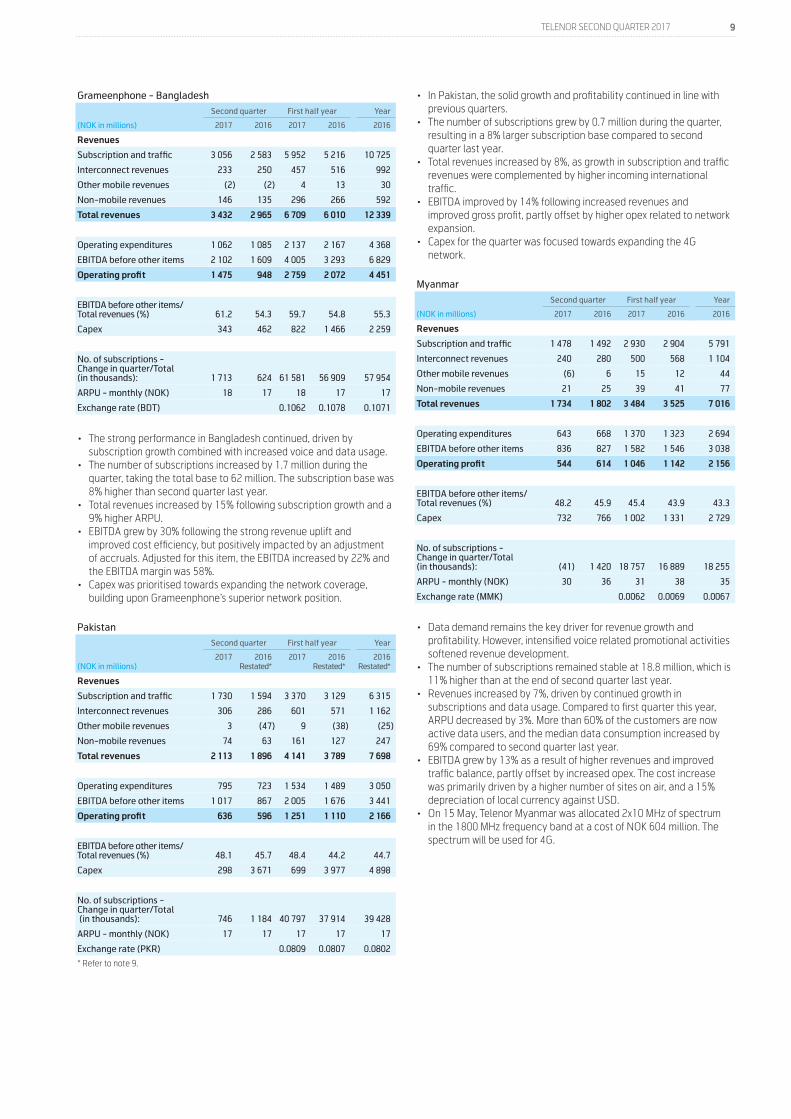
• The strong performance in Bangladesh continued, driven by subscription growth combined with increased voice and data usage.
• The number of subscriptions increased by 1.7 million during the quarter, taking the total base to 62 million. The subscription base was 8% higher than second quarter last year.
• Total revenues increased by 15% following subscription growth and a 9% higher ARPU.
• EBITDA grew by 30% following the strong revenue uplift and improved cost efficiency, but positively impacted by an adjustment of accruals. Adjusted for this item, the EBITDA increased by 22% and the EBITDA margin was 58%.
• Capex was prioritised towards expanding the network coverage, building upon Grameenphone’s superior network position.
Pakistan
Second quarter First half year Year
(NOK in millions)2017 2016
Restated*2017 2016
Restated*2016
Restated*
Revenues
Subscription and traffic 1 730 1 594 3 370 3 129 6 315
Interconnect revenues 306 286 601 571 1 162
Other mobile revenues 3 (47) 9 (38) (25)
Non-mobile revenues 74 63 161 127 247
Total revenues 2 113 1 896 4 141 3 789 7 698
Operating expenditures 795 723 1 534 1 489 3 050
EBITDA before other items 1 017 867 2 005 1 676 3 441
Operating profit 636 596 1 251 1 110 2 166
EBITDA before other items/Total revenues (%) 48.1 45.7 48.4 44.2 44.7
Capex 298 3 671 699 3 977 4 898
No. of subscriptions - Change in quarter/Total (in thousands): 746 1 184
40 797 37 914 39 428
ARPU - monthly (NOK) 17 17 17 17 17
Exchange rate (PKR) 0.0809 0.0807 0.0802
* Refer to note 9.
• In Pakistan, the solid growth and profitability continued in line with previous quarters.
• The number of subscriptions grew by 0.7 million during the quarter, resulting in a 8% larger subscription base compared to second quarter last year.
• Total revenues increased by 8%, as growth in subscription and traffic revenues were complemented by higher incoming international traffic.
• EBITDA improved by 14% following increased revenues and improved gross profit, partly offset by higher opex related to network expansion.
• Capex for the quarter was focused towards expanding the 4G network.
Myanmar
Second quarter First half year Year
(NOK in millions) 2017 2016 2017 2016 2016
Revenues
Subscription and traffic 1 478 1 492 2 930 2 904 5 791
Interconnect revenues 240 280 500 568 1 104
Other mobile revenues (6) 6 15 12 44
Non-mobile revenues 21 25 39 41 77
Total revenues 1 734 1 802 3 484 3 525 7 016
Operating expenditures 643 668 1 370 1 323 2 694
EBITDA before other items 836 827 1 582 1 546 3 038
Operating profit 544 614 1 046 1 142 2 156
EBITDA before other items/ Total revenues (%) 48.2 45.9 45.4 43.9 43.3
Capex 732 766 1 002 1 331 2 729
No. of subscriptions - Change in quarter/Total (in thousands): (41) 1 420
18 757 16 889 18 255
ARPU - monthly (NOK) 30 36 31 38 35
Exchange rate (MMK) 0.0062 0.0069 0.0067
• Data demand remains the key driver for revenue growth and profitability. However, intensified voice related promotional activities softened revenue development.
• The number of subscriptions remained stable at 18.8 million, which is 11% higher than at the end of second quarter last year.
• Revenues increased by 7%, driven by continued growth in subscriptions and data usage. Compared to first quarter this year, ARPU decreased by 3%. More than 60% of the customers are now active data users, and the median data consumption increased by 69% compared to second quarter last year.
• EBITDA grew by 13% as a result of higher revenues and improved traffic balance, partly offset by increased opex. The cost increase was primarily driven by a higher number of sites on air, and a 15% depreciation of local currency against USD.
• On 15 May, Telenor Myanmar was allocated 2x10 MHz of spectrum in the 1800 MHz frequency band at a cost of NOK 604 million. The spectrum will be used for 4G.
10 TELENOR SECOND QUARTER 2017
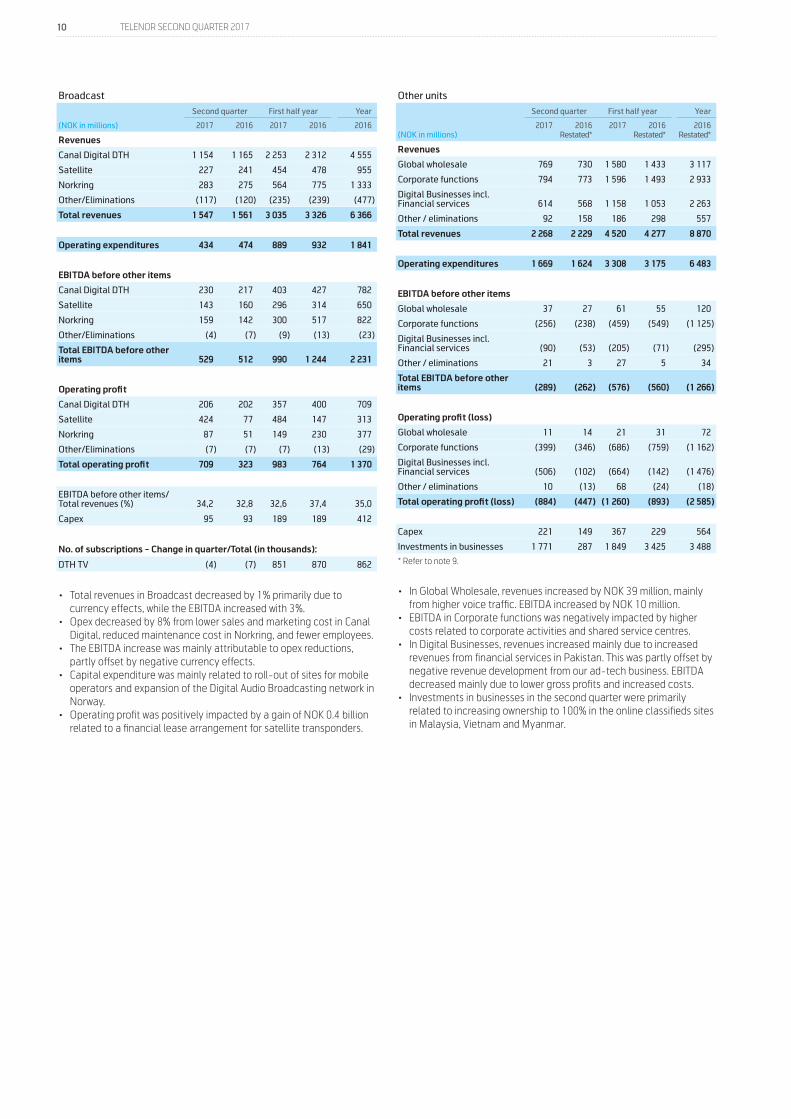
Broadcast
Second quarter First half year Year
(NOK in millions) 2017 2016 2017 2016 2016
Revenues
Canal Digital DTH 1 154 1 165 2 253 2 312 4 555
Satellite 227 241 454 478 955
Norkring 283 275 564 775 1 333
Other/Eliminations (117) (120) (235) (239) (477)
Total revenues 1 547 1 561 3 035 3 326 6 366
Operating expenditures 434 474 889 932 1 841
EBITDA before other items
Canal Digital DTH 230 217 403 427 782
Satellite 143 160 296 314 650
Norkring 159 142 300 517 822
Other/Eliminations (4) (7) (9) (13) (23)
Total EBITDA before other items 529 512 990 1 244 2 231
Operating profit
Canal Digital DTH 206 202 357 400 709
Satellite 424 77 484 147 313
Norkring 87 51 149 230 377
Other/Eliminations (7) (7) (7) (13) (29)
Total operating profit 709 323 983 764 1 370
EBITDA before other items/Total revenues (%) 34,2 32,8 32,6 37,4 35,0
Capex 95 93 189 189 412
No. of subscriptions - Change in quarter/Total (in thousands):
DTH TV (4) (7) 851 870 862
• Total revenues in Broadcast decreased by 1% primarily due to currency effects, while the EBITDA increased with 3%.
• Opex decreased by 8% from lower sales and marketing cost in Canal Digital, reduced maintenance cost in Norkring, and fewer employees.
• The EBITDA increase was mainly attributable to opex reductions, partly offset by negative currency effects.
• Capital expenditure was mainly related to roll-out of sites for mobile operators and expansion of the Digital Audio Broadcasting network in Norway.
• Operating profit was positively impacted by a gain of NOK 0.4 billion related to a financial lease arrangement for satellite transponders.
Other units
Second quarter First half year Year
(NOK in millions)2017 2016
Restated*2017 2016
Restated*2016
Restated*
Revenues
Global wholesale 769 730 1 580 1 433 3 117
Corporate functions 794 773 1 596 1 493 2 933
Digital Businesses incl. Financial services 614 568 1 158 1 053 2 263
Other / eliminations 92 158 186 298 557
Total revenues 2 268 2 229 4 520 4 277 8 870
Operating expenditures 1 669 1 624 3 308 3 175 6 483
EBITDA before other items
Global wholesale 37 27 61 55 120
Corporate functions (256) (238) (459) (549) (1 125)
Digital Businesses incl. Financial services (90) (53) (205) (71) (295)
Other / eliminations 21 3 27 5 34
Total EBITDA before other items (289) (262) (576) (560) (1 266)
Operating profit (loss)
Global wholesale 11 14 21 31 72
Corporate functions (399) (346) (686) (759) (1 162)
Digital Businesses incl. Financial services (506) (102) (664) (142) (1 476)
Other / eliminations 10 (13) 68 (24) (18)
Total operating profit (loss) (884) (447) (1 260) (893) (2 585)
Capex 221 149 367 229 564
Investments in businesses 1 771 287 1 849 3 425 3 488
* Refer to note 9.
• In Global Wholesale, revenues increased by NOK 39 million, mainly from higher voice traffic. EBITDA increased by NOK 10 million.
• EBITDA in Corporate functions was negatively impacted by higher costs related to corporate activities and shared service centres.
• In Digital Businesses, revenues increased mainly due to increased revenues from financial services in Pakistan. This was partly offset by negative revenue development from our ad-tech business. EBITDA decreased mainly due to lower gross profits and increased costs.
• Investments in businesses in the second quarter were primarily related to increasing ownership to 100% in the online classifieds sites in Malaysia, Vietnam and Myanmar.
11 TELENOR SECOND QUARTER 2017
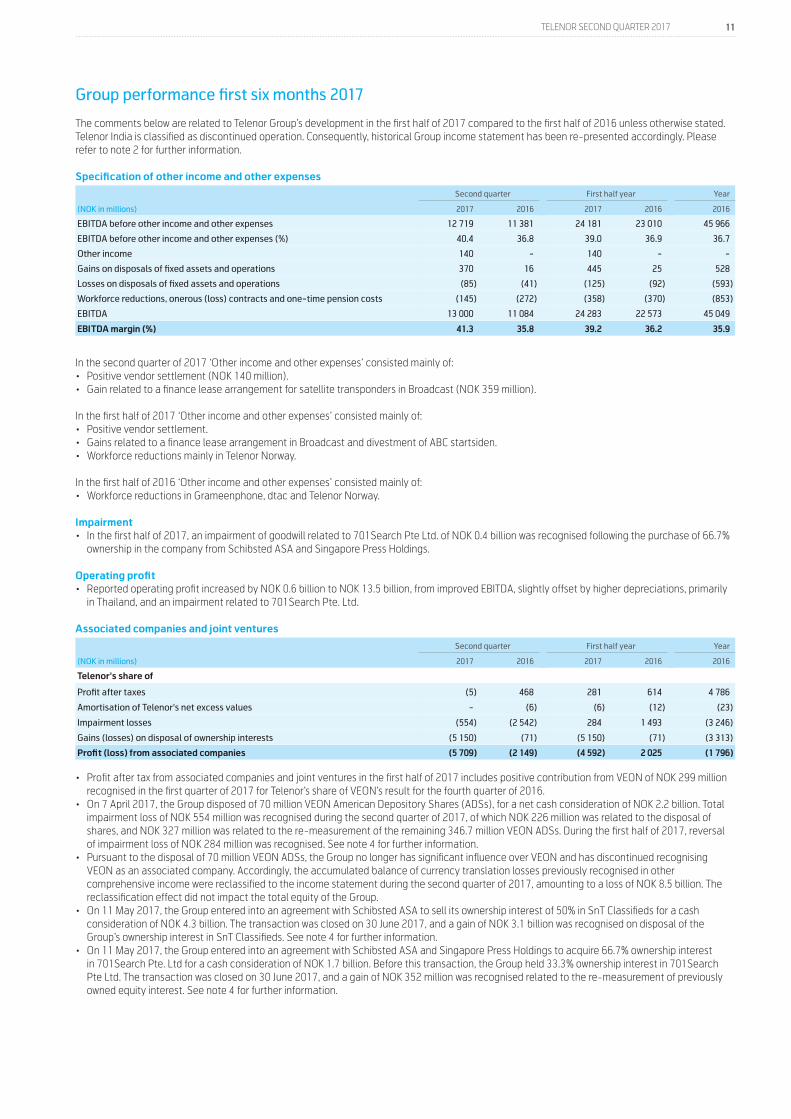
Group performance first six months 2017
The comments below are related to Telenor Group’s development in the first half of 2017 compared to the first half of 2016 unless otherwise stated. Telenor India is classified as discontinued operation. Consequently, historical Group income statement has been re-presented accordingly. Please refer to note 2 for further information.
Specification of other income and other expenses
Second quarter First half year Year
(NOK in millions) 2017 2016 2017 2016 2016
EBITDA before other income and other expenses 12 719 11 381 24 181 23 010 45 966
EBITDA before other income and other expenses (%) 40.4 36.8 39.0 36.9 36.7
Other income 140 - 140 - -
Gains on disposals of fixed assets and operations 370 16 445 25 528
Losses on disposals of fixed assets and operations (85) (41) (125) (92) (593)
Workforce reductions, onerous (loss) contracts and one-time pension costs (145) (272) (358) (370) (853)
EBITDA 13 000 11 084 24 283 22 573 45 049
EBITDA margin (%) 41.3 35.8 39.2 36.2 35.9
In the second quarter of 2017 ‘Other income and other expenses’ consisted mainly of:• Positive vendor settlement (NOK 140 million).• Gain related to a finance lease arrangement for satellite transponders in Broadcast (NOK 359 million).
In the first half of 2017 ‘Other income and other expenses’ consisted mainly of:• Positive vendor settlement.• Gains related to a finance lease arrangement in Broadcast and divestment of ABC startsiden.• Workforce reductions mainly in Telenor Norway.
In the first half of 2016 ‘Other income and other expenses’ consisted mainly of:• Workforce reductions in Grameenphone, dtac and Telenor Norway.
Impairment• In the first half of 2017, an impairment of goodwill related to 701Search Pte Ltd. of NOK 0.4 billion was recognised following the purchase of 66.7%
ownership in the company from Schibsted ASA and Singapore Press Holdings.
Operating profit• Reported operating profit increased by NOK 0.6 billion to NOK 13.5 billion, from improved EBITDA, slightly offset by higher depreciations, primarily
in Thailand, and an impairment related to 701Search Pte. Ltd.
Associated companies and joint ventures
Second quarter First half year Year
(NOK in millions) 2017 2016 2017 2016 2016
Telenor's share of
Profit after taxes (5) 468 281 614 4 786
Amortisation of Telenor's net excess values - (6) (6) (12) (23)
Impairment losses (554) (2 542) 284 1 493 (3 246)
Gains (losses) on disposal of ownership interests (5 150) (71) (5 150) (71) (3 313)
Profit (loss) from associated companies (5 709) (2 149) (4 592) 2 025 (1 796)
• Profit after tax from associated companies and joint ventures in the first half of 2017 includes positive contribution from VEON of NOK 299 million recognised in the first quarter of 2017 for Telenor’s share of VEON’s result for the fourth quarter of 2016.
• On 7 April 2017, the Group disposed of 70 million VEON American Depository Shares (ADSs), for a net cash consideration of NOK 2.2 billion. Total impairment loss of NOK 554 million was recognised during the second quarter of 2017, of which NOK 226 million was related to the disposal of shares, and NOK 327 million was related to the re-measurement of the remaining 346.7 million VEON ADSs. During the first half of 2017, reversal of impairment loss of NOK 284 million was recognised. See note 4 for further information.
• Pursuant to the disposal of 70 million VEON ADSs, the Group no longer has significant influence over VEON and has discontinued recognising VEON as an associated company. Accordingly, the accumulated balance of currency translation losses previously recognised in other comprehensive income were reclassified to the income statement during the second quarter of 2017, amounting to a loss of NOK 8.5 billion. The reclassification effect did not impact the total equity of the Group.
• On 11 May 2017, the Group entered into an agreement with Schibsted ASA to sell its ownership interest of 50% in SnT Classifieds for a cash consideration of NOK 4.3 billion. The transaction was closed on 30 June 2017, and a gain of NOK 3.1 billion was recognised on disposal of the Group’s ownership interest in SnT Classifieds. See note 4 for further information.
• On 11 May 2017, the Group entered into an agreement with Schibsted ASA and Singapore Press Holdings to acquire 66.7% ownership interest in 701Search Pte. Ltd for a cash consideration of NOK 1.7 billion. Before this transaction, the Group held 33.3% ownership interest in 701Search Pte Ltd. The transaction was closed on 30 June 2017, and a gain of NOK 352 million was recognised related to the re-measurement of previously owned equity interest. See note 4 for further information.
12 TELENOR SECOND QUARTER 2017
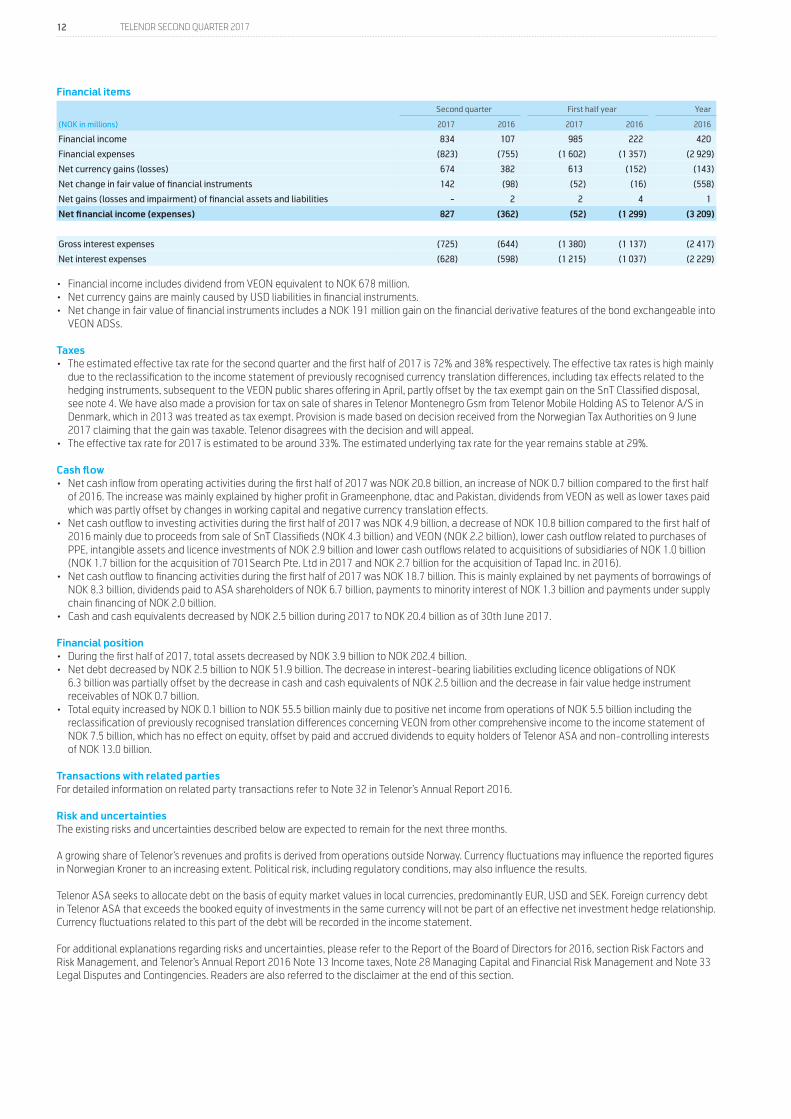
Financial items
Second quarter First half year Year
(NOK in millions) 2017 2016 2017 2016 2016
Financial income 834 107 985 222 420
Financial expenses (823) (755) (1 602) (1 357) (2 929)
Net currency gains (losses) 674 382 613 (152) (143)
Net change in fair value of financial instruments 142 (98) (52) (16) (558)
Net gains (losses and impairment) of financial assets and liabilities - 2 2 4 1
Net financial income (expenses) 827 (362) (52) (1 299) (3 209)
Gross interest expenses (725) (644) (1 380) (1 137) (2 417)
Net interest expenses (628) (598) (1 215) (1 037) (2 229)
• Financial income includes dividend from VEON equivalent to NOK 678 million. • Net currency gains are mainly caused by USD liabilities in financial instruments. • Net change in fair value of financial instruments includes a NOK 191 million gain on the financial derivative features of the bond exchangeable into
VEON ADSs.
Taxes• The estimated effective tax rate for the second quarter and the first half of 2017 is 72% and 38% respectively. The effective tax rates is high mainly
due to the reclassification to the income statement of previously recognised currency translation differences, including tax effects related to the hedging instruments, subsequent to the VEON public shares offering in April, partly offset by the tax exempt gain on the SnT Classified disposal, see note 4. We have also made a provision for tax on sale of shares in Telenor Montenegro Gsm from Telenor Mobile Holding AS to Telenor A/S in Denmark, which in 2013 was treated as tax exempt. Provision is made based on decision received from the Norwegian Tax Authorities on 9 June 2017 claiming that the gain was taxable. Telenor disagrees with the decision and will appeal.
• The effective tax rate for 2017 is estimated to be around 33%. The estimated underlying tax rate for the year remains stable at 29%.
Cash flow• Net cash inflow from operating activities during the first half of 2017 was NOK 20.8 billion, an increase of NOK 0.7 billion compared to the first half
of 2016. The increase was mainly explained by higher profit in Grameenphone, dtac and Pakistan, dividends from VEON as well as lower taxes paid which was partly offset by changes in working capital and negative currency translation effects.
• Net cash outflow to investing activities during the first half of 2017 was NOK 4.9 billion, a decrease of NOK 10.8 billion compared to the first half of 2016 mainly due to proceeds from sale of SnT Classifieds (NOK 4.3 billion) and VEON (NOK 2.2 billion), lower cash outflow related to purchases of PPE, intangible assets and licence investments of NOK 2.9 billion and lower cash outflows related to acquisitions of subsidiaries of NOK 1.0 billion (NOK 1.7 billion for the acquisition of 701Search Pte. Ltd in 2017 and NOK 2.7 billion for the acquisition of Tapad Inc. in 2016).
• Net cash outflow to financing activities during the first half of 2017 was NOK 18.7 billion. This is mainly explained by net payments of borrowings of NOK 8.3 billion, dividends paid to ASA shareholders of NOK 6.7 billion, payments to minority interest of NOK 1.3 billion and payments under supply chain financing of NOK 2.0 billion.
• Cash and cash equivalents decreased by NOK 2.5 billion during 2017 to NOK 20.4 billion as of 30th June 2017.
Financial position• During the first half of 2017, total assets decreased by NOK 3.9 billion to NOK 202.4 billion. • Net debt decreased by NOK 2.5 billion to NOK 51.9 billion. The decrease in interest-bearing liabilities excluding licence obligations of NOK
6.3 billion was partially offset by the decrease in cash and cash equivalents of NOK 2.5 billion and the decrease in fair value hedge instrument receivables of NOK 0.7 billion.
• Total equity increased by NOK 0.1 billion to NOK 55.5 billion mainly due to positive net income from operations of NOK 5.5 billion including the reclassification of previously recognised translation differences concerning VEON from other comprehensive income to the income statement of NOK 7.5 billion, which has no effect on equity, offset by paid and accrued dividends to equity holders of Telenor ASA and non-controlling interests of NOK 13.0 billion.
Transactions with related partiesFor detailed information on related party transactions refer to Note 32 in Telenor’s Annual Report 2016.
Risk and uncertaintiesThe existing risks and uncertainties described below are expected to remain for the next three months.
A growing share of Telenor’s revenues and profits is derived from operations outside Norway. Currency fluctuations may influence the reported figures in Norwegian Kroner to an increasing extent. Political risk, including regulatory conditions, may also influence the results.
Telenor ASA seeks to allocate debt on the basis of equity market values in local currencies, predominantly EUR, USD and SEK. Foreign currency debt in Telenor ASA that exceeds the booked equity of investments in the same currency will not be part of an effective net investment hedge relationship. Currency fluctuations related to this part of the debt will be recorded in the income statement.
For additional explanations regarding risks and uncertainties, please refer to the Report of the Board of Directors for 2016, section Risk Factors and Risk Management, and Telenor’s Annual Report 2016 Note 13 Income taxes, Note 28 Managing Capital and Financial Risk Management and Note 33 Legal Disputes and Contingencies. Readers are also referred to the disclaimer at the end of this section.

13 TELENOR SECOND QUARTER 2017
New developments of risks and uncertainties since the publication of Telenor’s Annual Report for 2016 are:
Legal disputesSee note 7 for details.
Financial aspectsIn relation to the licence issuance in Myanmar, a performance bond of USD 110 million has been issued to Myanmar authorities as a guarantee towards coverage and quality of service commitments during the next two years of the licence.
DisclaimerThis report contains statements regarding the future in connection with Telenor’s growth initiatives, profit figures, outlook, strategies and objectives. In particular, the section ‘Outlook for 2017’ contains forward-looking statements regarding the Group’s expectations. All statements regarding the future are subject to inherent risks and uncertainties, and many factors can lead to actual profits and developments deviating substantially from what has been expressed or implied in such statements.
Fornebu, 14 July 2017The Board of Directors of Telenor ASA
14 TELENOR SECOND QUARTER 2017
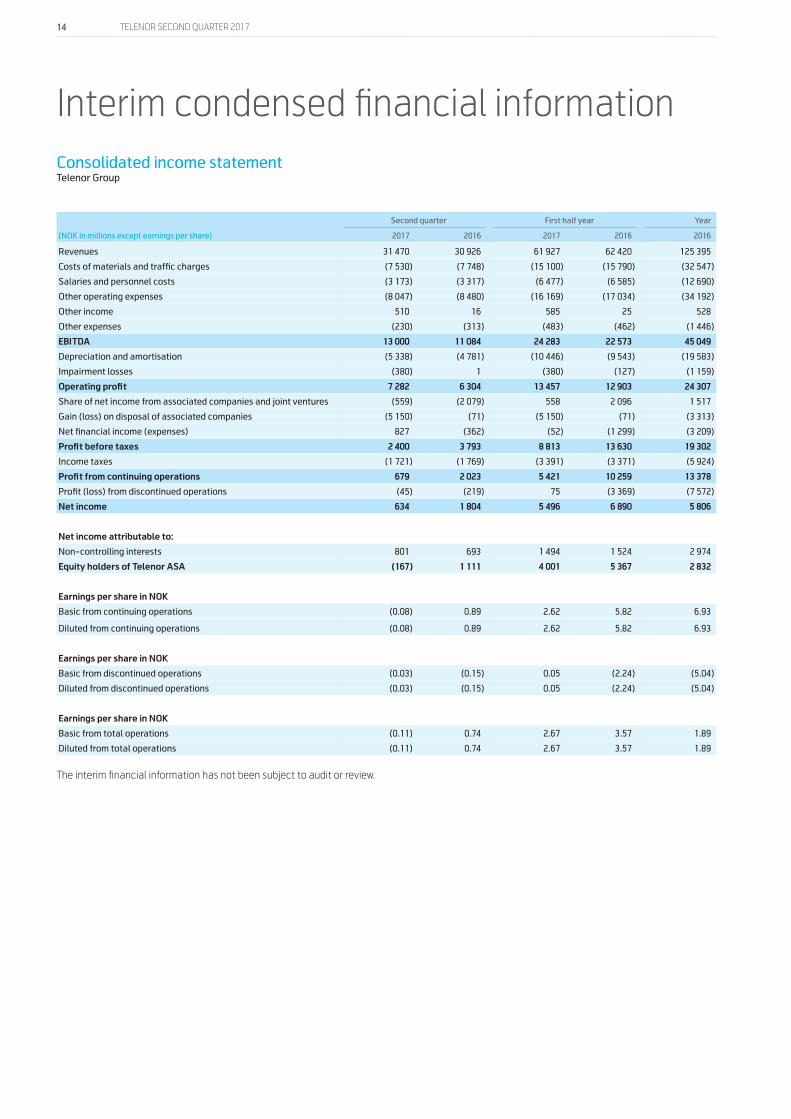
Consolidated income statementTelenor Group
Second quarter First half year Year
(NOK in millions except earnings per share) 2017 2016 2017 2016 2016
Revenues 31 470 30 926 61 927 62 420 125 395
Costs of materials and traffic charges (7 530) (7 748) (15 100) (15 790) (32 547)
Salaries and personnel costs (3 173) (3 317) (6 477) (6 585) (12 690)
Other operating expenses (8 047) (8 480) (16 169) (17 034) (34 192)
Other income 510 16 585 25 528
Other expenses (230) (313) (483) (462) (1 446)
EBITDA 13 000 11 084 24 283 22 573 45 049
Depreciation and amortisation (5 338) (4 781) (10 446) (9 543) (19 583)
Impairment losses (380) 1 (380) (127) (1 159)
Operating profit 7 282 6 304 13 457 12 903 24 307
Share of net income from associated companies and joint ventures (559) (2 079) 558 2 096 1 517
Gain (loss) on disposal of associated companies (5 150) (71) (5 150) (71) (3 313)
Net financial income (expenses) 827 (362) (52) (1 299) (3 209)
Profit before taxes 2 400 3 793 8 813 13 630 19 302
Income taxes (1 721) (1 769) (3 391) (3 371) (5 924)
Profit from continuing operations 679 2 023 5 421 10 259 13 378
Profit (loss) from discontinued operations (45) (219) 75 (3 369) (7 572)
Net income 634 1 804 5 496 6 890 5 806
Net income attributable to:
Non-controlling interests 801 693 1 494 1 524 2 974
Equity holders of Telenor ASA (167) 1 111 4 001 5 367 2 832
Earnings per share in NOK
Basic from continuing operations (0.08) 0.89 2.62 5.82 6.93
Diluted from continuing operations (0.08) 0.89 2.62 5.82 6.93
Earnings per share in NOK
Basic from discontinued operations (0.03) (0.15) 0.05 (2.24) (5.04)
Diluted from discontinued operations (0.03) (0.15) 0.05 (2.24) (5.04)
Earnings per share in NOK
Basic from total operations (0.11) 0.74 2.67 3.57 1.89
Diluted from total operations (0.11) 0.74 2.67 3.57 1.89
The interim financial information has not been subject to audit or review.
Interim condensed financial information
15 TELENOR SECOND QUARTER 2017
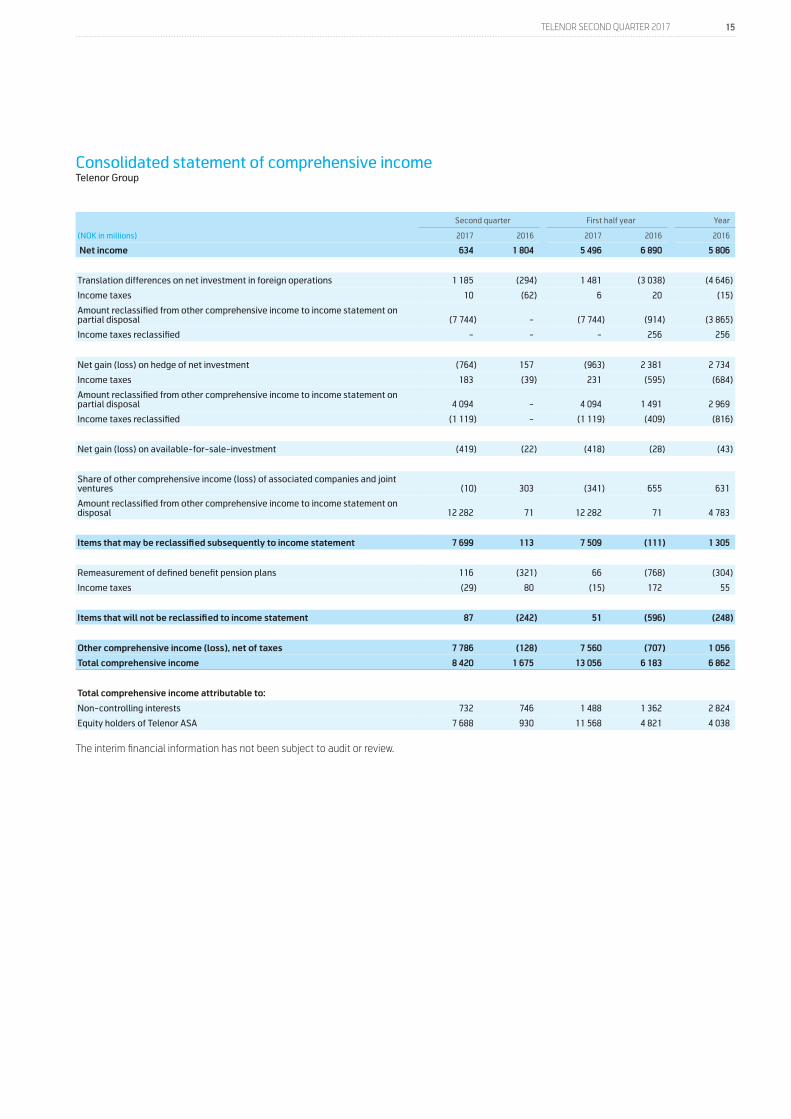
Consolidated statement of comprehensive income Telenor Group
Second quarter First half year Year
(NOK in millions) 2017 2016 2017 2016 2016
Net income 634 1 804 5 496 6 890 5 806
Translation differences on net investment in foreign operations 1 185 (294) 1 481 (3 038) (4 646)
Income taxes 10 (62) 6 20 (15)
Amount reclassified from other comprehensive income to income statement on partial disposal (7 744) - (7 744) (914) (3 865)
Income taxes reclassified - - - 256 256
Net gain (loss) on hedge of net investment (764) 157 (963) 2 381 2 734
Income taxes 183 (39) 231 (595) (684)
Amount reclassified from other comprehensive income to income statement on partial disposal 4 094 - 4 094 1 491 2 969
Income taxes reclassified (1 119) - (1 119) (409) (816)
Net gain (loss) on available-for-sale-investment (419) (22) (418) (28) (43)
Share of other comprehensive income (loss) of associated companies and joint ventures (10) 303 (341) 655 631
Amount reclassified from other comprehensive income to income statement on disposal 12 282 71 12 282 71 4 783
Items that may be reclassified subsequently to income statement 7 699 113 7 509 (111) 1 305
Remeasurement of defined benefit pension plans 116 (321) 66 (768) (304)
Income taxes (29) 80 (15) 172 55
Items that will not be reclassified to income statement 87 (242) 51 (596) (248)
Other comprehensive income (loss), net of taxes 7 786 (128) 7 560 (707) 1 056
Total comprehensive income 8 420 1 675 13 056 6 183 6 862
Total comprehensive income attributable to:
Non-controlling interests 732 746 1 488 1 362 2 824
Equity holders of Telenor ASA 7 688 930 11 568 4 821 4 038
The interim financial information has not been subject to audit or review.
16 TELENOR SECOND QUARTER 2017
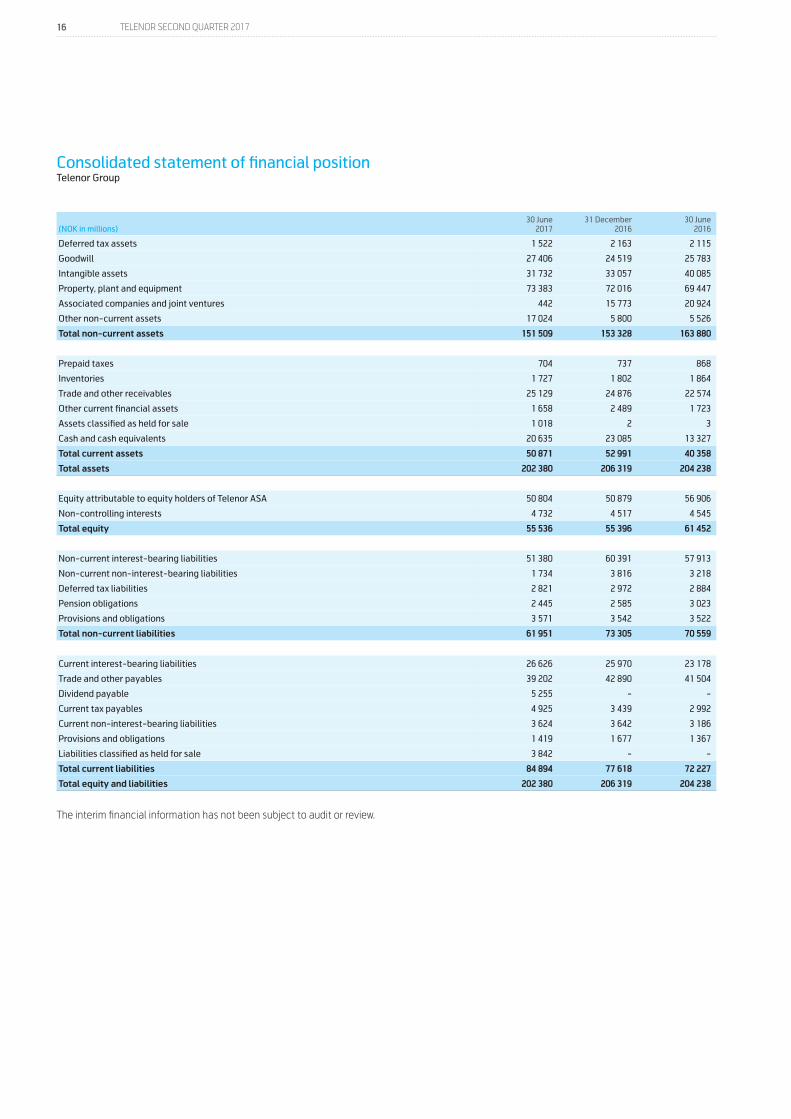
Consolidated statement of financial position Telenor Group
(NOK in millions)30 June
201731 December
201630 June
2016
Deferred tax assets 1 522 2 163 2 115
Goodwill 27 406 24 519 25 783
Intangible assets 31 732 33 057 40 085
Property, plant and equipment 73 383 72 016 69 447
Associated companies and joint ventures 442 15 773 20 924
Other non-current assets 17 024 5 800 5 526
Total non-current assets 151 509 153 328 163 880
Prepaid taxes 704 737 868
Inventories 1 727 1 802 1 864
Trade and other receivables 25 129 24 876 22 574
Other current financial assets 1 658 2 489 1 723
Assets classified as held for sale 1 018 2 3
Cash and cash equivalents 20 635 23 085 13 327
Total current assets 50 871 52 991 40 358
Total assets 202 380 206 319 204 238
Equity attributable to equity holders of Telenor ASA 50 804 50 879 56 906
Non-controlling interests 4 732 4 517 4 545
Total equity 55 536 55 396 61 452
Non-current interest-bearing liabilities 51 380 60 391 57 913
Non-current non-interest-bearing liabilities 1 734 3 816 3 218
Deferred tax liabilities 2 821 2 972 2 884
Pension obligations 2 445 2 585 3 023
Provisions and obligations 3 571 3 542 3 522
Total non-current liabilities 61 951 73 305 70 559
Current interest-bearing liabilities 26 626 25 970 23 178
Trade and other payables 39 202 42 890 41 504
Dividend payable 5 255 - -
Current tax payables 4 925 3 439 2 992
Current non-interest-bearing liabilities 3 624 3 642 3 186
Provisions and obligations 1 419 1 677 1 367
Liabilities classified as held for sale 3 842 - -
Total current liabilities 84 894 77 618 72 227
Total equity and liabilities 202 380 206 319 204 238
The interim financial information has not been subject to audit or review.
17 TELENOR SECOND QUARTER 2017
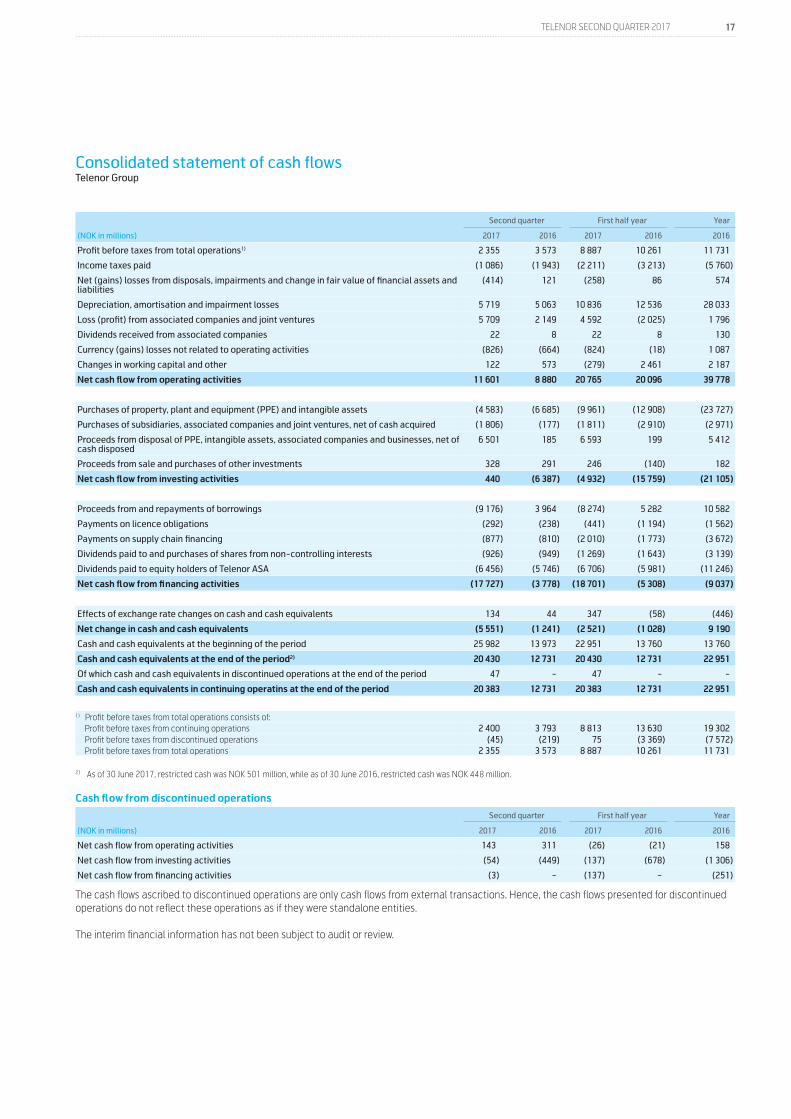
Consolidated statement of cash flows Telenor Group
Second quarter First half year Year
(NOK in millions) 2017 2016 2017 2016 2016
Profit before taxes from total operations1) 2 355 3 573 8 887 10 261 11 731
Income taxes paid (1 086) (1 943) (2 211) (3 213) (5 760)
Net (gains) losses from disposals, impairments and change in fair value of financial assets and liabilities
(414) 121 (258) 86 574
Depreciation, amortisation and impairment losses 5 719 5 063 10 836 12 536 28 033
Loss (profit) from associated companies and joint ventures 5 709 2 149 4 592 (2 025) 1 796
Dividends received from associated companies 22 8 22 8 130
Currency (gains) losses not related to operating activities (826) (664) (824) (18) 1 087
Changes in working capital and other 122 573 (279) 2 461 2 187
Net cash flow from operating activities 11 601 8 880 20 765 20 096 39 778
Purchases of property, plant and equipment (PPE) and intangible assets (4 583) (6 685) (9 961) (12 908) (23 727)
Purchases of subsidiaries, associated companies and joint ventures, net of cash acquired (1 806) (177) (1 811) (2 910) (2 971)
Proceeds from disposal of PPE, intangible assets, associated companies and businesses, net of cash disposed
6 501 185 6 593 199 5 412
Proceeds from sale and purchases of other investments 328 291 246 (140) 182
Net cash flow from investing activities 440 (6 387) (4 932) (15 759) (21 105)
Proceeds from and repayments of borrowings (9 176) 3 964 (8 274) 5 282 10 582
Payments on licence obligations (292) (238) (441) (1 194) (1 562)
Payments on supply chain financing (877) (810) (2 010) (1 773) (3 672)
Dividends paid to and purchases of shares from non-controlling interests (926) (949) (1 269) (1 643) (3 139)
Dividends paid to equity holders of Telenor ASA (6 456) (5 746) (6 706) (5 981) (11 246)
Net cash flow from financing activities (17 727) (3 778) (18 701) (5 308) (9 037)
Effects of exchange rate changes on cash and cash equivalents 134 44 347 (58) (446)
Net change in cash and cash equivalents (5 551) (1 241) (2 521) (1 028) 9 190
Cash and cash equivalents at the beginning of the period 25 982 13 973 22 951 13 760 13 760
Cash and cash equivalents at the end of the period2) 20 430 12 731 20 430 12 731 22 951
Of which cash and cash equivalents in discontinued operations at the end of the period 47 - 47 - -
Cash and cash equivalents in continuing operatins at the end of the period 20 383 12 731 20 383 12 731 22 951
1) Profit before taxes from total operations consists of: Profit before taxes from continuing operations 2 400 3 793 8 813 13 630 19 302 Profit before taxes from discontinued operations (45) (219) 75 (3 369) (7 572) Profit before taxes from total operations 2 355 3 573 8 887 10 261 11 731
2) As of 30 June 2017, restricted cash was NOK 501 million, while as of 30 June 2016, restricted cash was NOK 448 million.
Cash flow from discontinued operations
Second quarter First half year Year
(NOK in millions) 2017 2016 2017 2016 2016
Net cash flow from operating activities 143 311 (26) (21) 158
Net cash flow from investing activities (54) (449) (137) (678) (1 306)
Net cash flow from financing activities (3) - (137) - (251)
The cash flows ascribed to discontinued operations are only cash flows from external transactions. Hence, the cash flows presented for discontinued operations do not reflect these operations as if they were standalone entities.
The interim financial information has not been subject to audit or review.
18 TELENOR SECOND QUARTER 2017
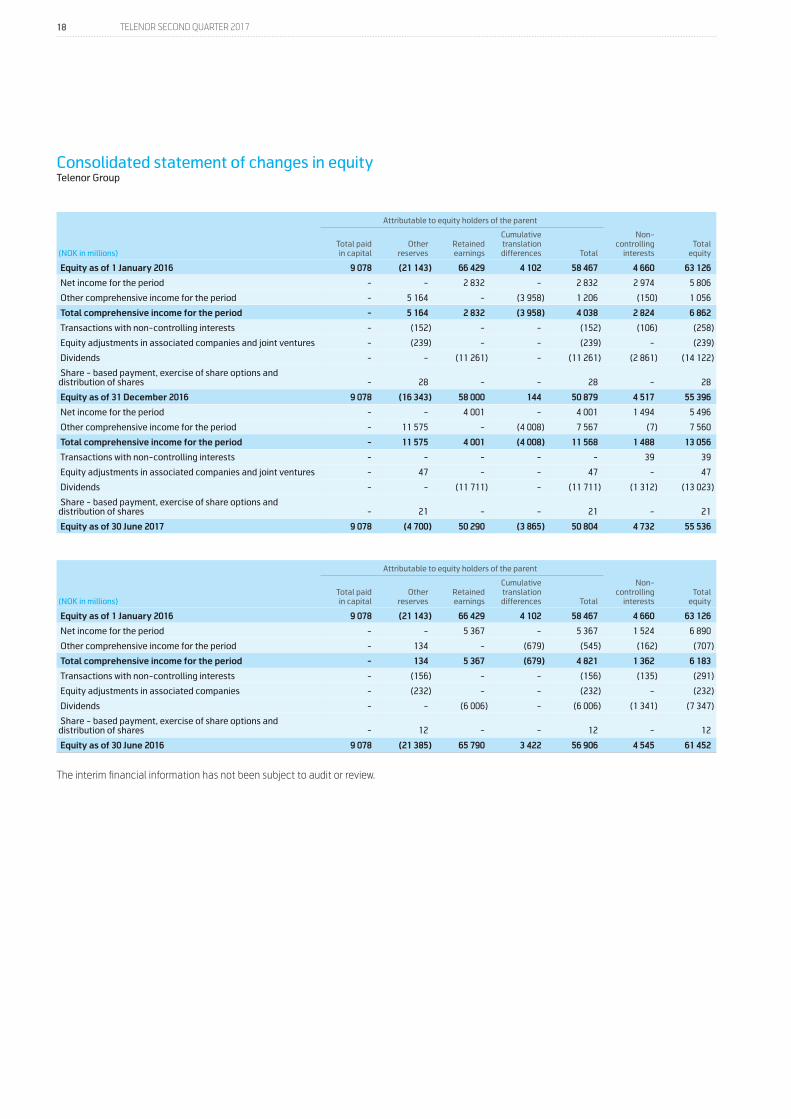
Consolidated statement of changes in equity Telenor Group
Attributable to equity holders of the parent
(NOK in millions) Total paid
in capital Other
reserves Retained earnings
Cumulative translation differences Total
Non-controlling
interests Total
equity
Equity as of 1 January 2016 9 078 (21 143) 66 429 4 102 58 467 4 660 63 126
Net income for the period - - 2 832 - 2 832 2 974 5 806
Other comprehensive income for the period - 5 164 - (3 958) 1 206 (150) 1 056
Total comprehensive income for the period - 5 164 2 832 (3 958) 4 038 2 824 6 862
Transactions with non-controlling interests - (152) - - (152) (106) (258)
Equity adjustments in associated companies and joint ventures - (239) - - (239) - (239)
Dividends - - (11 261) - (11 261) (2 861) (14 122)
Share - based payment, exercise of share options and distribution of shares - 28 - - 28 - 28
Equity as of 31 December 2016 9 078 (16 343) 58 000 144 50 879 4 517 55 396
Net income for the period - - 4 001 - 4 001 1 494 5 496
Other comprehensive income for the period - 11 575 - (4 008) 7 567 (7) 7 560
Total comprehensive income for the period - 11 575 4 001 (4 008) 11 568 1 488 13 056
Transactions with non-controlling interests - - - - - 39 39
Equity adjustments in associated companies and joint ventures - 47 - - 47 - 47
Dividends - - (11 711) - (11 711) (1 312) (13 023)
Share - based payment, exercise of share options and distribution of shares - 21 - - 21 - 21
Equity as of 30 June 2017 9 078 (4 700) 50 290 (3 865) 50 804 4 732 55 536
Attributable to equity holders of the parent
(NOK in millions) Total paid
in capital Other
reserves Retained earnings
Cumulative translation differences Total
Non-controlling
interests Total
equity
Equity as of 1 January 2016 9 078 (21 143) 66 429 4 102 58 467 4 660 63 126
Net income for the period - - 5 367 - 5 367 1 524 6 890
Other comprehensive income for the period - 134 - (679) (545) (162) (707)
Total comprehensive income for the period - 134 5 367 (679) 4 821 1 362 6 183
Transactions with non-controlling interests - (156) - - (156) (135) (291)
Equity adjustments in associated companies - (232) - - (232) - (232)
Dividends - - (6 006) - (6 006) (1 341) (7 347)
Share - based payment, exercise of share options and distribution of shares - 12 - - 12 - 12
Equity as of 30 June 2016 9 078 (21 385) 65 790 3 422 56 906 4 545 61 452
The interim financial information has not been subject to audit or review.
19 TELENOR SECOND QUARTER 2017
Note 1 – General accounting principlesTelenor (the Group) consists of Telenor ASA (the Company) and its subsidiaries. Telenor ASA is a limited liability company, incorporated in Norway. The condensed consolidated interim financial statements consist of the Group and the Group’s interests in associated companies and joint arrangements. As a result of rounding differences, numbers or percentages may not add up to the total.
These condensed consolidated interim financial statements for the six months ending 30 June 2017, have been prepared in accordance with IAS 34 Interim Financial Reporting. The condensed consolidated interim financial statements do not include all the information and disclosures required in the annual financial statements and should be read in conjunction with the Group’s Annual financial statements 2016. The accounting policies adopted in the preparation of the condensed consolidated interim financial statements are consistent with those followed in the preparation of the Group’s Annual Financial Statements for the year ended 31 December 2016.
For information about the standards and interpretations effective from 1 January 2017, please refer to Note 1 in the Group’s Annual Report 2016. The standards and interpretations effective from 1 January 2017 do not have a significant impact on the Group’s consolidated interim financial statements.
Note 2 – Discontinued operations and held for sale Telenor IndiaOn 23 February 2017, the Group entered into a definitive agreement with Bharti Airtel Limited (Airtel), whereby Airtel will take full ownership of Telenor India. According to the agreement, Airtel and Telenor India will merge and Airtel will take over Telenor India as soon as all necessary approvals are received. As part of the agreement, Airtel will take over outstanding spectrum payments and other operational contracts, including tower lease.
The transaction is subject to requisite regulatory approvals, including approvals from the Department of Telecommunications in India (DoT) and the Competition Commission of India. The exposure to claims related to the period Telenor owned the business, will remain with Telenor.
The transaction is expected to close within 12 months. With effect from the first quarter of 2017, Telenor India is presented as discontinued operation in the consolidated income statement and comparative periods are represented. In the consolidated statement of financial position 30 June 2017 Telenor India is classified as held for sale.
The results of Telenor India for the second quarter of 2016 and 2017, first half year of 2016 and 2017 and the year 2016 are presented below:
Second quarter First half year Year
(NOK in millions) 2017 2016 2017 2016 2016
Revenue 1 267 1 551 2 575 3 070 6 032
EBITDA 14 175 90 (321) 54
Operating profit 12 (109) 80 (3 188) (7 237)
Profit before tax (45) (219) 75 (3 369) (7 572)
Income tax - - - - -
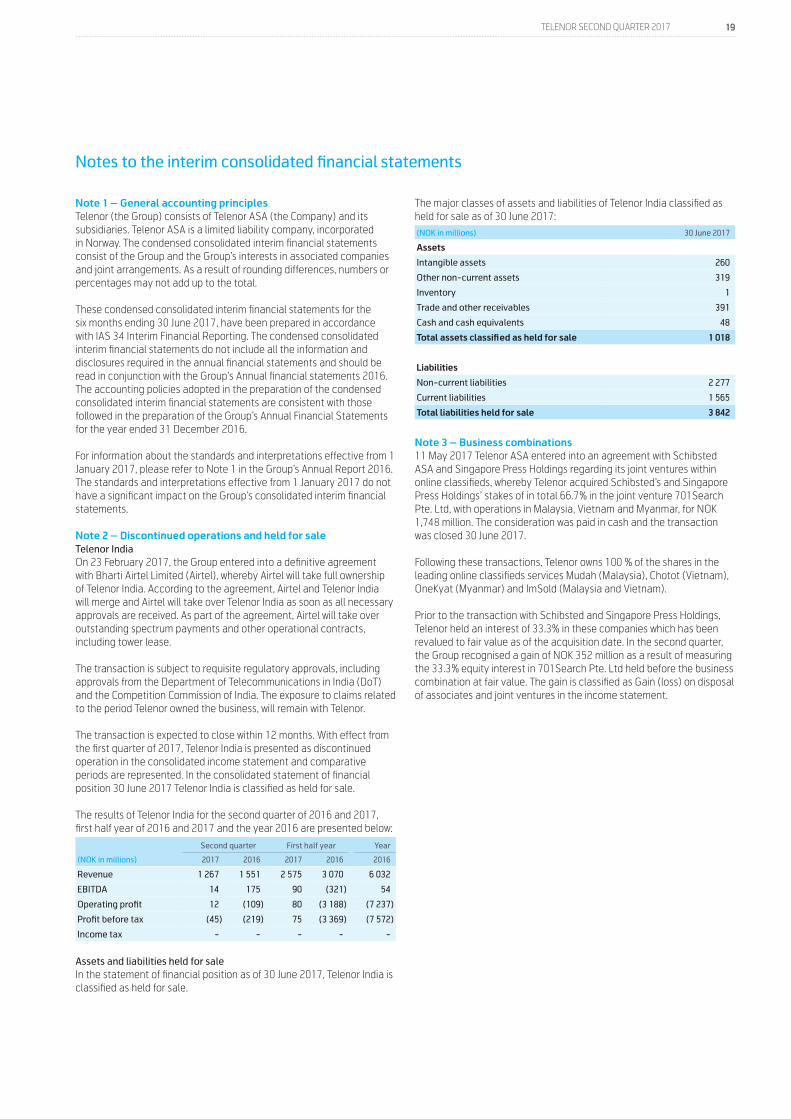
Assets and liabilities held for saleIn the statement of financial position as of 30 June 2017, Telenor India is classified as held for sale.
The major classes of assets and liabilities of Telenor India classified as held for sale as of 30 June 2017:(NOK in millions) 30 June 2017
Assets
Intangible assets 260
Other non-current assets 319
Inventory 1
Trade and other receivables 391
Cash and cash equivalents 48
Total assets classified as held for sale 1 018
Liabilities
Non-current liabilities 2 277
Current liabilities 1 565
Total liabilities held for sale 3 842
Note 3 – Business combinations11 May 2017 Telenor ASA entered into an agreement with Schibsted ASA and Singapore Press Holdings regarding its joint ventures within online classifieds, whereby Telenor acquired Schibsted’s and Singapore Press Holdings’ stakes of in total 66.7% in the joint venture 701Search Pte. Ltd, with operations in Malaysia, Vietnam and Myanmar, for NOK 1,748 million. The consideration was paid in cash and the transaction was closed 30 June 2017. Following these transactions, Telenor owns 100 % of the shares in the leading online classifieds services Mudah (Malaysia), Chotot (Vietnam), OneKyat (Myanmar) and ImSold (Malaysia and Vietnam).
Prior to the transaction with Schibsted and Singapore Press Holdings, Telenor held an interest of 33.3% in these companies which has been revalued to fair value as of the acquisition date. In the second quarter, the Group recognised a gain of NOK 352 million as a result of measuring the 33.3% equity interest in 701Search Pte. Ltd held before the business combination at fair value. The gain is classified as Gain (loss) on disposal of associates and joint ventures in the income statement.
Notes to the interim consolidated financial statements
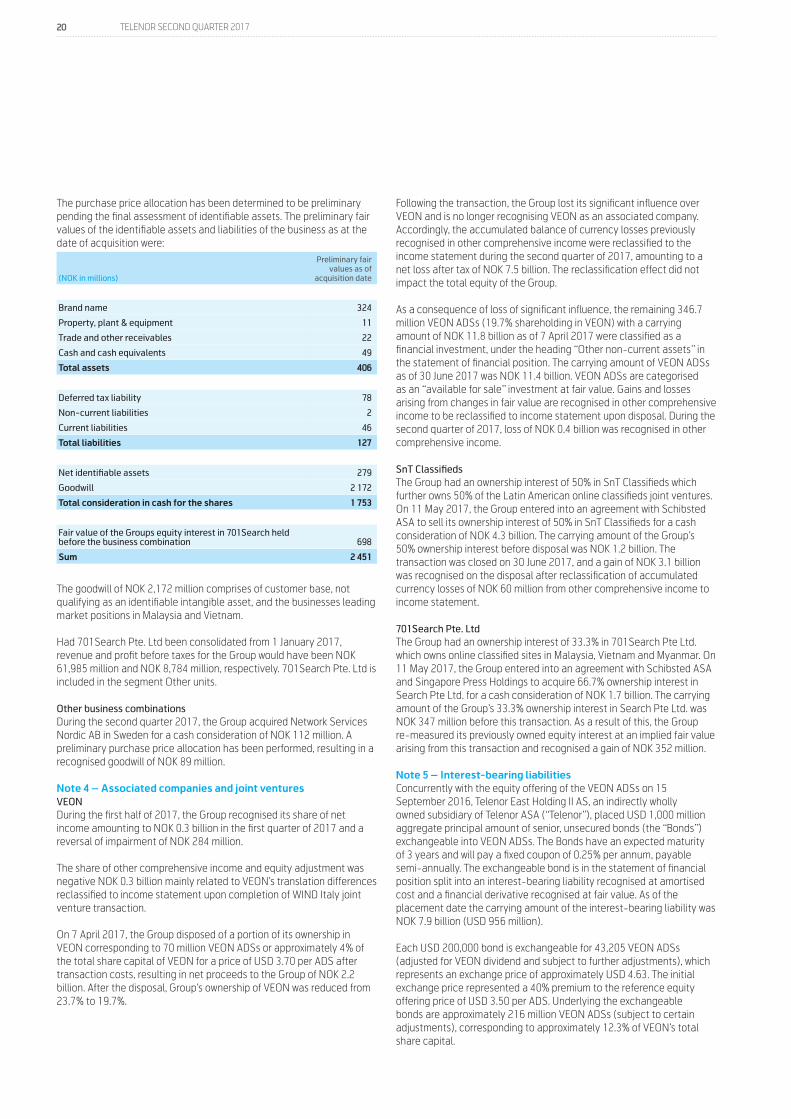
20 TELENOR SECOND QUARTER 2017
The purchase price allocation has been determined to be preliminary pending the final assessment of identifiable assets. The preliminary fair values of the identifiable assets and liabilities of the business as at the date of acquisition were:
(NOK in millions)
Preliminary fair values as of
acquisition date
Brand name 324
Property, plant & equipment 11
Trade and other receivables 22
Cash and cash equivalents 49
Total assets 406
Deferred tax liability 78
Non-current liabilities 2
Current liabilities 46
Total liabilities 127
Net identifiable assets 279
Goodwill 2 172
Total consideration in cash for the shares 1 753
Fair value of the Groups equity interest in 701Search held before the business combination 698
Sum 2 451
The goodwill of NOK 2,172 million comprises of customer base, not qualifying as an identifiable intangible asset, and the businesses leading market positions in Malaysia and Vietnam.
Had 701Search Pte. Ltd been consolidated from 1 January 2017, revenue and profit before taxes for the Group would have been NOK 61,985 million and NOK 8,784 million, respectively. 701Search Pte. Ltd is included in the segment Other units.
Other business combinationsDuring the second quarter 2017, the Group acquired Network Services Nordic AB in Sweden for a cash consideration of NOK 112 million. A preliminary purchase price allocation has been performed, resulting in a recognised goodwill of NOK 89 million.
Note 4 – Associated companies and joint venturesVEONDuring the first half of 2017, the Group recognised its share of net income amounting to NOK 0.3 billion in the first quarter of 2017 and a reversal of impairment of NOK 284 million.
The share of other comprehensive income and equity adjustment was negative NOK 0.3 billion mainly related to VEON’s translation differences reclassified to income statement upon completion of WIND Italy joint venture transaction.
On 7 April 2017, the Group disposed of a portion of its ownership in VEON corresponding to 70 million VEON ADSs or approximately 4% of the total share capital of VEON for a price of USD 3.70 per ADS after transaction costs, resulting in net proceeds to the Group of NOK 2.2 billion. After the disposal, Group’s ownership of VEON was reduced from 23.7% to 19.7%.
Following the transaction, the Group lost its significant influence over VEON and is no longer recognising VEON as an associated company. Accordingly, the accumulated balance of currency losses previously recognised in other comprehensive income were reclassified to the income statement during the second quarter of 2017, amounting to a net loss after tax of NOK 7.5 billion. The reclassification effect did not impact the total equity of the Group.
As a consequence of loss of significant influence, the remaining 346.7 million VEON ADSs (19.7% shareholding in VEON) with a carrying amount of NOK 11.8 billion as of 7 April 2017 were classified as a financial investment, under the heading “Other non-current assets” in the statement of financial position. The carrying amount of VEON ADSs as of 30 June 2017 was NOK 11.4 billion. VEON ADSs are categorised as an “available for sale” investment at fair value. Gains and losses arising from changes in fair value are recognised in other comprehensive income to be reclassified to income statement upon disposal. During the second quarter of 2017, loss of NOK 0.4 billion was recognised in other comprehensive income.
SnT ClassifiedsThe Group had an ownership interest of 50% in SnT Classifieds which further owns 50% of the Latin American online classifieds joint ventures. On 11 May 2017, the Group entered into an agreement with Schibsted ASA to sell its ownership interest of 50% in SnT Classifieds for a cash consideration of NOK 4.3 billion. The carrying amount of the Group’s 50% ownership interest before disposal was NOK 1.2 billion. The transaction was closed on 30 June 2017, and a gain of NOK 3.1 billion was recognised on the disposal after reclassification of accumulated currency losses of NOK 60 million from other comprehensive income to income statement.
701Search Pte. LtdThe Group had an ownership interest of 33.3% in 701Search Pte Ltd. which owns online classified sites in Malaysia, Vietnam and Myanmar. On 11 May 2017, the Group entered into an agreement with Schibsted ASA and Singapore Press Holdings to acquire 66.7% ownership interest in Search Pte Ltd. for a cash consideration of NOK 1.7 billion. The carrying amount of the Group’s 33.3% ownership interest in Search Pte Ltd. was NOK 347 million before this transaction. As a result of this, the Group re-measured its previously owned equity interest at an implied fair value arising from this transaction and recognised a gain of NOK 352 million.
Note 5 – Interest-bearing liabilitiesConcurrently with the equity offering of the VEON ADSs on 15 September 2016, Telenor East Holding II AS, an indirectly wholly owned subsidiary of Telenor ASA (“Telenor”), placed USD 1,000 million aggregate principal amount of senior, unsecured bonds (the “Bonds”) exchangeable into VEON ADSs. The Bonds have an expected maturity of 3 years and will pay a fixed coupon of 0.25% per annum, payable semi-annually. The exchangeable bond is in the statement of financial position split into an interest-bearing liability recognised at amortised cost and a financial derivative recognised at fair value. As of the placement date the carrying amount of the interest-bearing liability was NOK 7.9 billion (USD 956 million).
Each USD 200,000 bond is exchangeable for 43,205 VEON ADSs (adjusted for VEON dividend and subject to further adjustments), which represents an exchange price of approximately USD 4.63. The initial exchange price represented a 40% premium to the reference equity offering price of USD 3.50 per ADS. Underlying the exchangeable bonds are approximately 216 million VEON ADSs (subject to certain adjustments), corresponding to approximately 12.3% of VEON’s total share capital.
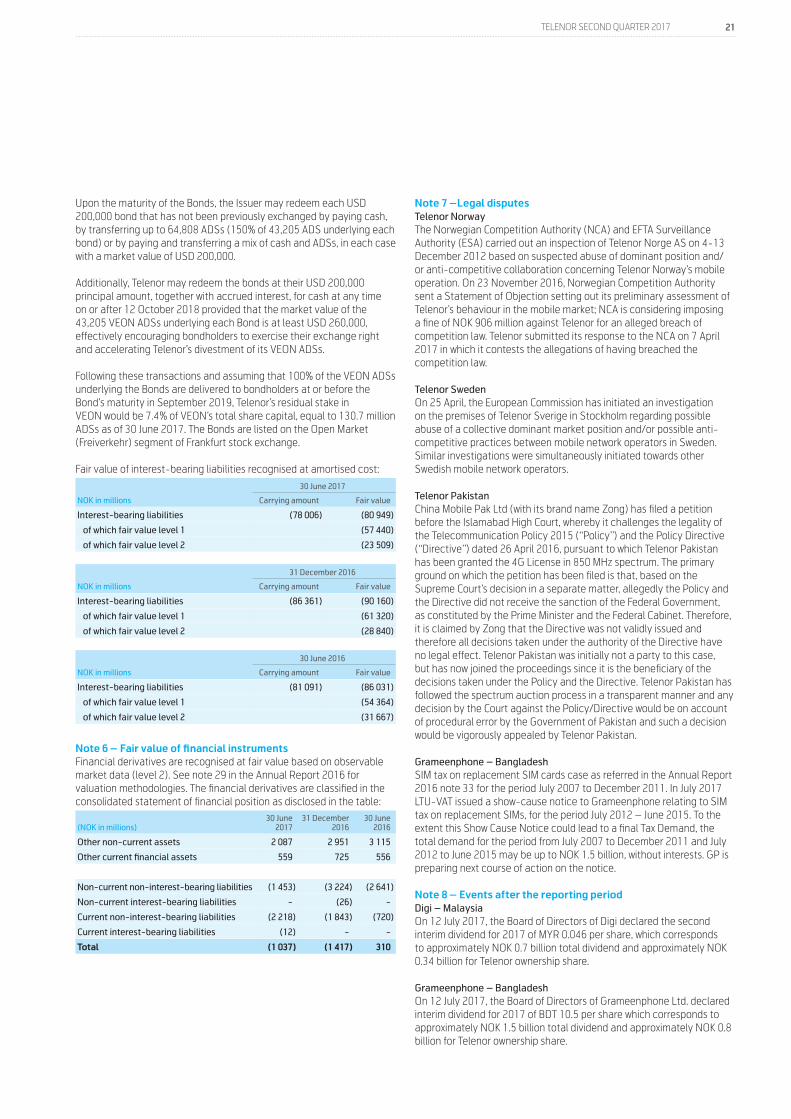
21 TELENOR SECOND QUARTER 2017
Upon the maturity of the Bonds, the Issuer may redeem each USD 200,000 bond that has not been previously exchanged by paying cash, by transferring up to 64,808 ADSs (150% of 43,205 ADS underlying each bond) or by paying and transferring a mix of cash and ADSs, in each case with a market value of USD 200,000.
Additionally, Telenor may redeem the bonds at their USD 200,000 principal amount, together with accrued interest, for cash at any time on or after 12 October 2018 provided that the market value of the 43,205 VEON ADSs underlying each Bond is at least USD 260,000, effectively encouraging bondholders to exercise their exchange right and accelerating Telenor’s divestment of its VEON ADSs.
Following these transactions and assuming that 100% of the VEON ADSs underlying the Bonds are delivered to bondholders at or before the Bond’s maturity in September 2019, Telenor’s residual stake inVEON would be 7.4% of VEON’s total share capital, equal to 130.7 million ADSs as of 30 June 2017. The Bonds are listed on the Open Market (Freiverkehr) segment of Frankfurt stock exchange.
Fair value of interest-bearing liabilities recognised at amortised cost:
30 June 2017
NOK in millions Carrying amount Fair value
Interest-bearing liabilities (78 006) (80 949)
of which fair value level 1 (57 440)
of which fair value level 2 (23 509)
31 December 2016
NOK in millions Carrying amount Fair value
Interest-bearing liabilities (86 361) (90 160)
of which fair value level 1 (61 320)
of which fair value level 2 (28 840)
30 June 2016
NOK in millions Carrying amount Fair value
Interest-bearing liabilities (81 091) (86 031)
of which fair value level 1 (54 364)
of which fair value level 2 (31 667)
Note 6 – Fair value of financial instrumentsFinancial derivatives are recognised at fair value based on observable market data (level 2). See note 29 in the Annual Report 2016 for valuation methodologies. The financial derivatives are classified in the consolidated statement of financial position as disclosed in the table:
(NOK in millions)30 June
201731 December
201630 June
2016
Other non-current assets 2 087 2 951 3 115
Other current financial assets 559 725 556
Non-current non-interest-bearing liabilities (1 453) (3 224) (2 641)
Non-current interest-bearing liabilities - (26) -
Current non-interest-bearing liabilities (2 218) (1 843) (720)
Current interest-bearing liabilities (12) - -
Total (1 037) (1 417) 310
Note 7 –Legal disputesTelenor NorwayThe Norwegian Competition Authority (NCA) and EFTA Surveillance Authority (ESA) carried out an inspection of Telenor Norge AS on 4-13 December 2012 based on suspected abuse of dominant position and/or anti-competitive collaboration concerning Telenor Norway’s mobile operation. On 23 November 2016, Norwegian Competition Authority sent a Statement of Objection setting out its preliminary assessment of Telenor’s behaviour in the mobile market; NCA is considering imposing a fine of NOK 906 million against Telenor for an alleged breach of competition law. Telenor submitted its response to the NCA on 7 April 2017 in which it contests the allegations of having breached the competition law.
Telenor SwedenOn 25 April, the European Commission has initiated an investigation on the premises of Telenor Sverige in Stockholm regarding possible abuse of a collective dominant market position and/or possible anti-competitive practices between mobile network operators in Sweden. Similar investigations were simultaneously initiated towards other Swedish mobile network operators.
Telenor PakistanChina Mobile Pak Ltd (with its brand name Zong) has filed a petition before the Islamabad High Court, whereby it challenges the legality of the Telecommunication Policy 2015 (“Policy”) and the Policy Directive (“Directive”) dated 26 April 2016, pursuant to which Telenor Pakistan has been granted the 4G License in 850 MHz spectrum. The primary ground on which the petition has been filed is that, based on the Supreme Court’s decision in a separate matter, allegedly the Policy and the Directive did not receive the sanction of the Federal Government, as constituted by the Prime Minister and the Federal Cabinet. Therefore, it is claimed by Zong that the Directive was not validly issued and therefore all decisions taken under the authority of the Directive have no legal effect. Telenor Pakistan was initially not a party to this case, but has now joined the proceedings since it is the beneficiary of the decisions taken under the Policy and the Directive. Telenor Pakistan has followed the spectrum auction process in a transparent manner and any decision by the Court against the Policy/Directive would be on account of procedural error by the Government of Pakistan and such a decision would be vigorously appealed by Telenor Pakistan.
Grameenphone – BangladeshSIM tax on replacement SIM cards case as referred in the Annual Report 2016 note 33 for the period July 2007 to December 2011. In July 2017 LTU-VAT issued a show-cause notice to Grameenphone relating to SIM tax on replacement SIMs, for the period July 2012 – June 2015. To the extent this Show Cause Notice could lead to a final Tax Demand, the total demand for the period from July 2007 to December 2011 and July 2012 to June 2015 may be up to NOK 1.5 billion, without interests. GP is preparing next course of action on the notice.
Note 8 – Events after the reporting periodDigi – MalaysiaOn 12 July 2017, the Board of Directors of Digi declared the second interim dividend for 2017 of MYR 0.046 per share, which corresponds to approximately NOK 0.7 billion total dividend and approximately NOK 0.34 billion for Telenor ownership share.
Grameenphone – BangladeshOn 12 July 2017, the Board of Directors of Grameenphone Ltd. declaredinterim dividend for 2017 of BDT 10.5 per share which corresponds toapproximately NOK 1.5 billion total dividend and approximately NOK 0.8billion for Telenor ownership share.
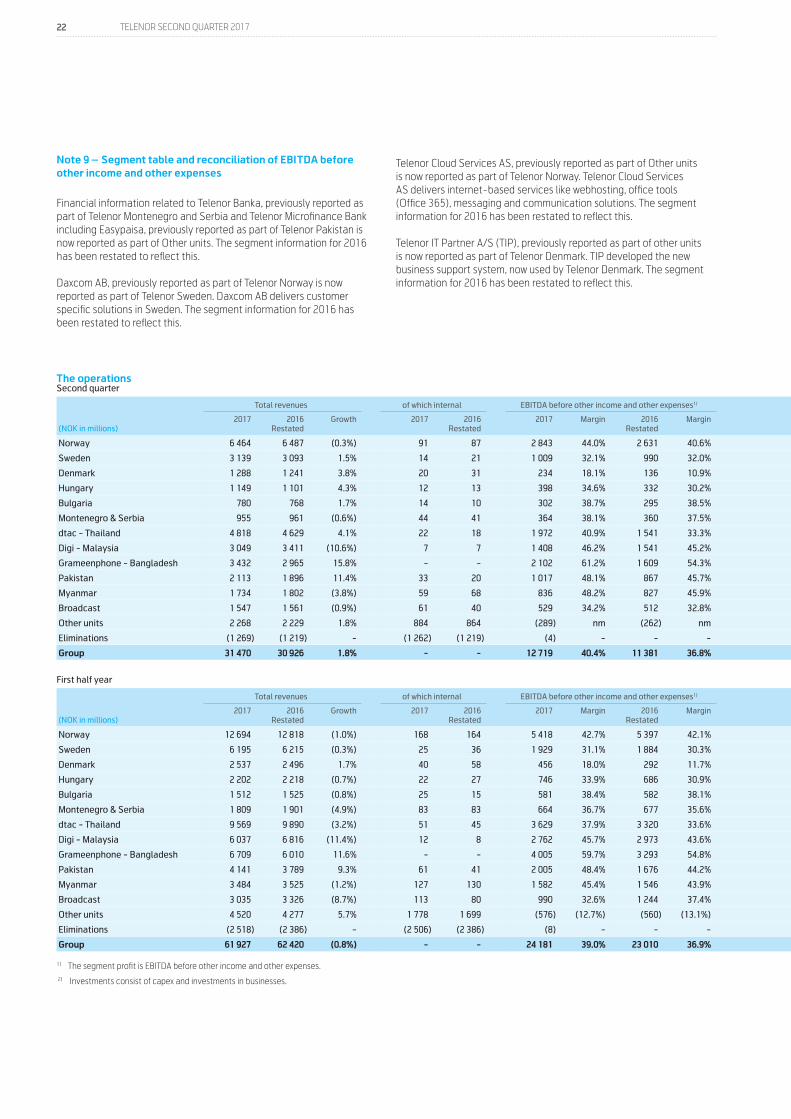
22 TELENOR SECOND QUARTER 2017
Note 9 – Segment table and reconciliation of EBITDA before other income and other expenses
Financial information related to Telenor Banka, previously reported as part of Telenor Montenegro and Serbia and Telenor Microfinance Bank including Easypaisa, previously reported as part of Telenor Pakistan is now reported as part of Other units. The segment information for 2016 has been restated to reflect this.
Daxcom AB, previously reported as part of Telenor Norway is now reported as part of Telenor Sweden. Daxcom AB delivers customer specific solutions in Sweden. The segment information for 2016 has been restated to reflect this.
The operationsSecond quarter
Total revenues of which internal EBITDA before other income and other expenses1) EBITDA Operating profit (loss) Investments2)
(NOK in millions)2017 2016
RestatedGrowth 2017 2016
Restated2017 Margin 2016
RestatedMargin 2017 Margin 2016
RestatedMargin 2017 Margin 2016
RestatedMargin 2017 2016
Restated
Norway 6 464 6 487 (0.3%) 91 87 2 843 44.0% 2 631 40.6% 2 922 45.2% 2 593 40.0% 1 957 30.3% 1 679 25.9% 1 568 1 284
Sweden 3 139 3 093 1.5% 14 21 1 009 32.1% 990 32.0% 999 31.8% 989 32.0% 651 20.7% 587 19.0% 538 336
Denmark 1 288 1 241 3.8% 20 31 234 18.1% 136 10.9% 224 17.4% 125 10.1% 135 10.5% 25 2.0% 304 147
Hungary 1 149 1 101 4.3% 12 13 398 34.6% 332 30.2% 382 33.3% 330 29.9% 265 23.0% 173 15.7% 62 77
Bulgaria 780 768 1.7% 14 10 302 38.7% 295 38.5% 290 37.1% 294 38.3% 150 19.3% 150 19.6% 54 86
Montenegro & Serbia 955 961 (0.6%) 44 41 364 38.1% 360 37.5% 361 37.8% 359 37.4% 223 23.3% 236 24.6% 84 95
dtac - Thailand 4 818 4 629 4.1% 22 18 1 972 40.9% 1 541 33.3% 1 940 40.3% 1 431 30.9% 383 8.0% 174 3.7% 1 022 1 003
Digi - Malaysia 3 049 3 411 (10.6%) 7 7 1 408 46.2% 1 541 45.2% 1 408 46.2% 1 541 45.2% 1 027 33.7% 1 245 36.5% 455 344
Grameenphone - Bangladesh 3 432 2 965 15.8% - - 2 102 61.2% 1 609 54.3% 2 100 61.2% 1 507 50.8% 1 475 43.0% 948 32.0% 343 462
Pakistan 2 113 1 896 11.4% 33 20 1 017 48.1% 867 45.7% 1 013 48.0% 868 45.8% 636 30.1% 596 31.4% 298 3 671
Myanmar 1 734 1 802 (3.8%) 59 68 836 48.2% 827 45.9% 804 46.4% 827 45.9% 544 31.4% 614 34.1% 732 766
Broadcast 1 547 1 561 (0.9%) 61 40 529 34.2% 512 32.8% 876 56.6% 499 31.9% 709 45.9% 323 20.7% 95 93
Other units 2 268 2 229 1.8% 884 864 (289) nm (262) nm (331) nm (280) nm (884) nm (447) nm 1 992 436
Eliminations (1 269) (1 219) - (1 262) (1 219) (4) - - - 9 - - - 9 - 1 - (13) -
Group 31 470 30 926 1.8% - - 12 719 40.4% 11 381 36.8% 13 000 41.3% 11 084 35.8% 7 282 23.1% 6 304 20.4% 7 534 8 801
First half year
Total revenues of which internal EBITDA before other income and other expenses1) EBITDA Operating profit (loss) Investments2)
(NOK in millions)2017 2016
RestatedGrowth 2017 2016
Restated2017 Margin 2016
RestatedMargin 2017 Margin 2016
RestatedMargin 2017 Margin 2016
RestatedMargin 2017 2016
Restated
Norway 12 694 12 818 (1.0%) 168 164 5 418 42.7% 5 397 42.1% 5 357 42.2% 5 282 41.2% 3 430 27.0% 3 446 26.9% 2 723 2 192
Sweden 6 195 6 215 (0.3%) 25 36 1 929 31.1% 1 884 30.3% 1 907 30.8% 1 882 30.3% 1 213 19.6% 1 066 17.1% 845 672
Denmark 2 537 2 496 1.7% 40 58 456 18.0% 292 11.7% 436 17.2% 273 11.0% 263 10.4% 70 2.8% 412 380
Hungary 2 202 2 218 (0.7%) 22 27 746 33.9% 686 30.9% 704 32.0% 681 30.7% 471 21.4% 362 16.3% 102 123
Bulgaria 1 512 1 525 (0.8%) 25 15 581 38.4% 582 38.1% 550 36.4% 581 38.1% 277 18.3% 288 18.9% 78 119
Montenegro & Serbia 1 809 1 901 (4.9%) 83 83 664 36.7% 677 35.6% 661 36.5% 677 35.6% 396 21.9% 430 22.6% 152 166
dtac - Thailand 9 569 9 890 (3.2%) 51 45 3 629 37.9% 3 320 33.6% 3 594 37.6% 3 172 32.1% 576 6.0% 689 7.0% 2 098 2 142
Digi - Malaysia 6 037 6 816 (11.4%) 12 8 2 762 45.7% 2 973 43.6% 2 762 45.7% 2 973 43.6% 2 047 33.9% 2 356 34.6% 823 696
Grameenphone - Bangladesh 6 709 6 010 11.6% - - 4 005 59.7% 3 293 54.8% 3 986 59.4% 3 190 53.1% 2 759 41.1% 2 072 34.5% 822 1 466
Pakistan 4 141 3 789 9.3% 61 41 2 005 48.4% 1 676 44.2% 1 998 48.3% 1 673 44.2% 1 251 30.2% 1 110 29.3% 699 3 977
Myanmar 3 484 3 525 (1.2%) 127 130 1 582 45.4% 1 546 43.9% 1 552 44.6% 1 545 43.8% 1 046 30.0% 1 142 32.4% 1 002 1 331
Broadcast 3 035 3 326 (8.7%) 113 80 990 32.6% 1 244 37.4% 1 320 43.5% 1 229 37.0% 983 32.4% 764 23.0% 189 189
Other units 4 520 4 277 5.7% 1 778 1 699 (576) (12.7%) (560) (13.1%) (550) nm (585) nm (1 260) nm (893) nm 2 216 3 654
Eliminations (2 518) (2 386) - (2 506) (2 386) (8) - - - 6 - - - 7 - 2 - (13) -
Group 61 927 62 420 (0.8%) - - 24 181 39.0% 23 010 36.9% 24 283 39.2% 22 573 36.2% 13 457 21.7% 12 903 20.7% 12 151 17 108
1) The segment profit is EBITDA before other income and other expenses. 2) Investments consist of capex and investments in businesses.
Telenor Cloud Services AS, previously reported as part of Other units is now reported as part of Telenor Norway. Telenor Cloud Services AS delivers internet-based services like webhosting, office tools (Office 365), messaging and communication solutions. The segment information for 2016 has been restated to reflect this.
Telenor IT Partner A/S (TIP), previously reported as part of other units is now reported as part of Telenor Denmark. TIP developed the new business support system, now used by Telenor Denmark. The segment information for 2016 has been restated to reflect this.
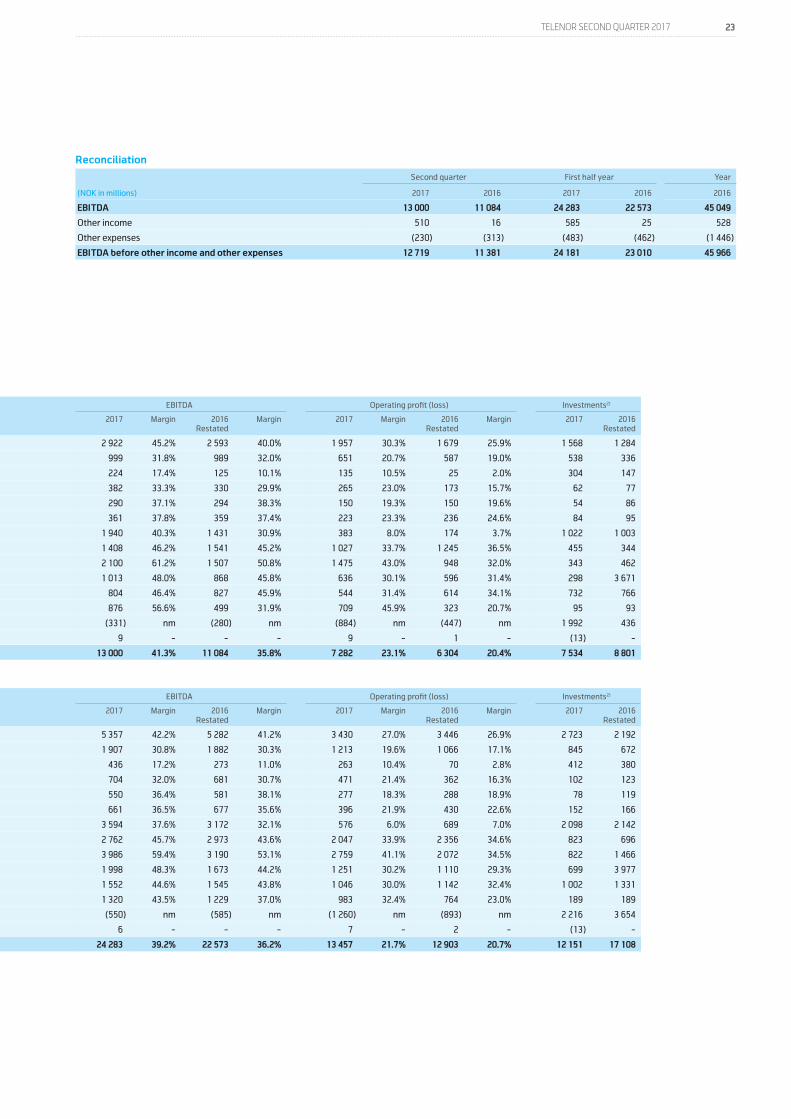
23 TELENOR SECOND QUARTER 2017
Reconciliation
Second quarter First half year Year
(NOK in millions) 2017 2016 2017 2016 2016
EBITDA 13 000 11 084 24 283 22 573 45 049
Other income 510 16 585 25 528
Other expenses (230) (313) (483) (462) (1 446)
EBITDA before other income and other expenses 12 719 11 381 24 181 23 010 45 966
The operationsSecond quarter
Total revenues of which internal EBITDA before other income and other expenses1) EBITDA Operating profit (loss) Investments2)
(NOK in millions)2017 2016
RestatedGrowth 2017 2016
Restated2017 Margin 2016
RestatedMargin 2017 Margin 2016
RestatedMargin 2017 Margin 2016
RestatedMargin 2017 2016
Restated
Norway 6 464 6 487 (0.3%) 91 87 2 843 44.0% 2 631 40.6% 2 922 45.2% 2 593 40.0% 1 957 30.3% 1 679 25.9% 1 568 1 284
Sweden 3 139 3 093 1.5% 14 21 1 009 32.1% 990 32.0% 999 31.8% 989 32.0% 651 20.7% 587 19.0% 538 336
Denmark 1 288 1 241 3.8% 20 31 234 18.1% 136 10.9% 224 17.4% 125 10.1% 135 10.5% 25 2.0% 304 147
Hungary 1 149 1 101 4.3% 12 13 398 34.6% 332 30.2% 382 33.3% 330 29.9% 265 23.0% 173 15.7% 62 77
Bulgaria 780 768 1.7% 14 10 302 38.7% 295 38.5% 290 37.1% 294 38.3% 150 19.3% 150 19.6% 54 86
Montenegro & Serbia 955 961 (0.6%) 44 41 364 38.1% 360 37.5% 361 37.8% 359 37.4% 223 23.3% 236 24.6% 84 95
dtac - Thailand 4 818 4 629 4.1% 22 18 1 972 40.9% 1 541 33.3% 1 940 40.3% 1 431 30.9% 383 8.0% 174 3.7% 1 022 1 003
Digi - Malaysia 3 049 3 411 (10.6%) 7 7 1 408 46.2% 1 541 45.2% 1 408 46.2% 1 541 45.2% 1 027 33.7% 1 245 36.5% 455 344
Grameenphone - Bangladesh 3 432 2 965 15.8% - - 2 102 61.2% 1 609 54.3% 2 100 61.2% 1 507 50.8% 1 475 43.0% 948 32.0% 343 462
Pakistan 2 113 1 896 11.4% 33 20 1 017 48.1% 867 45.7% 1 013 48.0% 868 45.8% 636 30.1% 596 31.4% 298 3 671
Myanmar 1 734 1 802 (3.8%) 59 68 836 48.2% 827 45.9% 804 46.4% 827 45.9% 544 31.4% 614 34.1% 732 766
Broadcast 1 547 1 561 (0.9%) 61 40 529 34.2% 512 32.8% 876 56.6% 499 31.9% 709 45.9% 323 20.7% 95 93
Other units 2 268 2 229 1.8% 884 864 (289) nm (262) nm (331) nm (280) nm (884) nm (447) nm 1 992 436
Eliminations (1 269) (1 219) - (1 262) (1 219) (4) - - - 9 - - - 9 - 1 - (13) -
Group 31 470 30 926 1.8% - - 12 719 40.4% 11 381 36.8% 13 000 41.3% 11 084 35.8% 7 282 23.1% 6 304 20.4% 7 534 8 801
First half year
Total revenues of which internal EBITDA before other income and other expenses1) EBITDA Operating profit (loss) Investments2)
(NOK in millions)2017 2016
RestatedGrowth 2017 2016
Restated2017 Margin 2016
RestatedMargin 2017 Margin 2016
RestatedMargin 2017 Margin 2016
RestatedMargin 2017 2016
Restated
Norway 12 694 12 818 (1.0%) 168 164 5 418 42.7% 5 397 42.1% 5 357 42.2% 5 282 41.2% 3 430 27.0% 3 446 26.9% 2 723 2 192
Sweden 6 195 6 215 (0.3%) 25 36 1 929 31.1% 1 884 30.3% 1 907 30.8% 1 882 30.3% 1 213 19.6% 1 066 17.1% 845 672
Denmark 2 537 2 496 1.7% 40 58 456 18.0% 292 11.7% 436 17.2% 273 11.0% 263 10.4% 70 2.8% 412 380
Hungary 2 202 2 218 (0.7%) 22 27 746 33.9% 686 30.9% 704 32.0% 681 30.7% 471 21.4% 362 16.3% 102 123
Bulgaria 1 512 1 525 (0.8%) 25 15 581 38.4% 582 38.1% 550 36.4% 581 38.1% 277 18.3% 288 18.9% 78 119
Montenegro & Serbia 1 809 1 901 (4.9%) 83 83 664 36.7% 677 35.6% 661 36.5% 677 35.6% 396 21.9% 430 22.6% 152 166
dtac - Thailand 9 569 9 890 (3.2%) 51 45 3 629 37.9% 3 320 33.6% 3 594 37.6% 3 172 32.1% 576 6.0% 689 7.0% 2 098 2 142
Digi - Malaysia 6 037 6 816 (11.4%) 12 8 2 762 45.7% 2 973 43.6% 2 762 45.7% 2 973 43.6% 2 047 33.9% 2 356 34.6% 823 696
Grameenphone - Bangladesh 6 709 6 010 11.6% - - 4 005 59.7% 3 293 54.8% 3 986 59.4% 3 190 53.1% 2 759 41.1% 2 072 34.5% 822 1 466
Pakistan 4 141 3 789 9.3% 61 41 2 005 48.4% 1 676 44.2% 1 998 48.3% 1 673 44.2% 1 251 30.2% 1 110 29.3% 699 3 977
Myanmar 3 484 3 525 (1.2%) 127 130 1 582 45.4% 1 546 43.9% 1 552 44.6% 1 545 43.8% 1 046 30.0% 1 142 32.4% 1 002 1 331
Broadcast 3 035 3 326 (8.7%) 113 80 990 32.6% 1 244 37.4% 1 320 43.5% 1 229 37.0% 983 32.4% 764 23.0% 189 189
Other units 4 520 4 277 5.7% 1 778 1 699 (576) (12.7%) (560) (13.1%) (550) nm (585) nm (1 260) nm (893) nm 2 216 3 654
Eliminations (2 518) (2 386) - (2 506) (2 386) (8) - - - 6 - - - 7 - 2 - (13) -
Group 61 927 62 420 (0.8%) - - 24 181 39.0% 23 010 36.9% 24 283 39.2% 22 573 36.2% 13 457 21.7% 12 903 20.7% 12 151 17 108
1) The segment profit is EBITDA before other income and other expenses. 2) Investments consist of capex and investments in businesses.
24 TELENOR SECOND QUARTER 2017
Responsibility statementWe confirm that, to the best of our knowledge, the condensed consolidated interim financial statements for the first half of 2017, which have been prepared in accordance with IFRS as adopted by EU and IAS 34 Interim Financial Reporting, give a true and fair view of the Company’s consolidated assets, liabilities, financial position and results of operations. To the best of our knowledge, the interim report for the first half of 2017 includes a fair review of important events that have occurred during the period and their impact on the condensed financial statements, the principal risks and uncertainties for the remaining half of 2017, and major related party transactions.
Fornebu, 14 July 2017
Gunn Wærsted Jørgen Kildahl Chair Deputy Chair
Jon Erik Reinhardsen Jacob Aqraou Grethe Viksaas Sally Davis Board member Board member Board member Board member
Sabah Qayyum Roger Rønning Harald Stavn Sigve Brekke Board member Board member Board member President & CEO
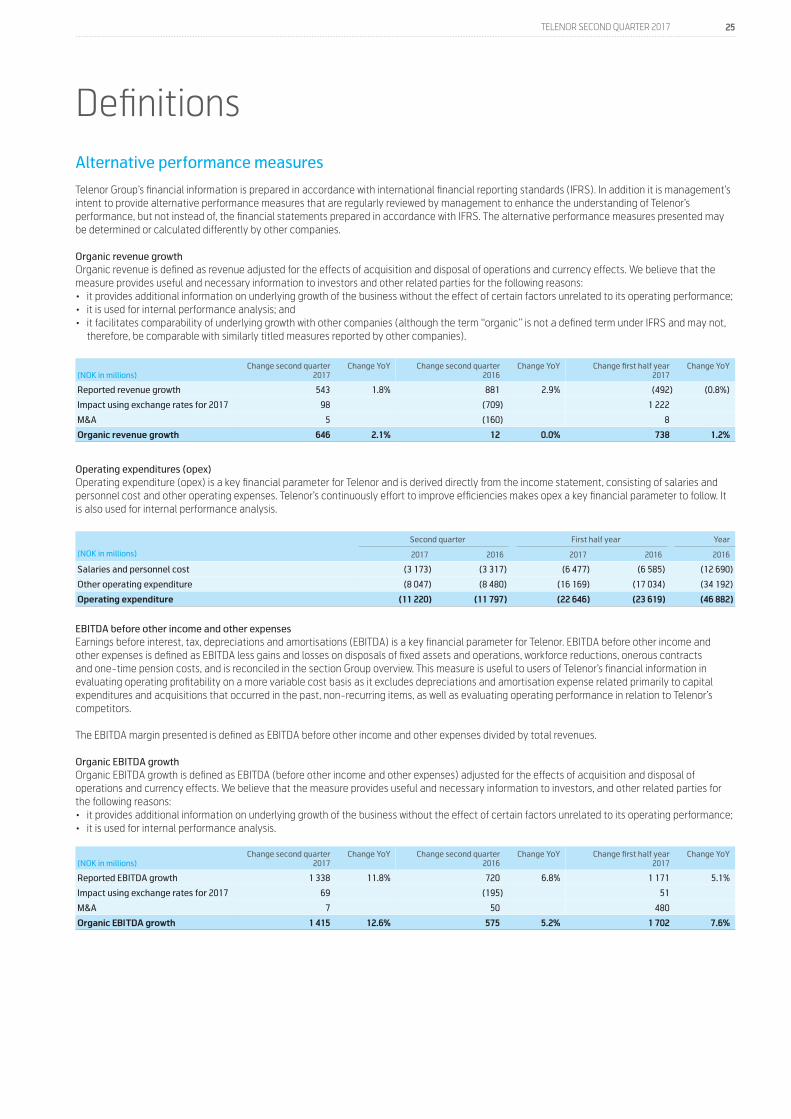
25 TELENOR SECOND QUARTER 2017
Alternative performance measures
Telenor Group’s financial information is prepared in accordance with international financial reporting standards (IFRS). In addition it is management’s intent to provide alternative performance measures that are regularly reviewed by management to enhance the understanding of Telenor’s performance, but not instead of, the financial statements prepared in accordance with IFRS. The alternative performance measures presented may be determined or calculated differently by other companies.
Organic revenue growthOrganic revenue is defined as revenue adjusted for the effects of acquisition and disposal of operations and currency effects. We believe that the measure provides useful and necessary information to investors and other related parties for the following reasons:• it provides additional information on underlying growth of the business without the effect of certain factors unrelated to its operating performance;• it is used for internal performance analysis; and• it facilitates comparability of underlying growth with other companies (although the term “organic” is not a defined term under IFRS and may not,
therefore, be comparable with similarly titled measures reported by other companies).
(NOK in millions)Change second quarter
2017Change YoY Change second quarter
2016Change YoY Change first half year
2017Change YoY
Reported revenue growth 543 1.8% 881 2.9% (492) (0.8%)
Impact using exchange rates for 2017 98 (709) 1 222
M&A 5 (160) 8
Organic revenue growth 646 2.1% 12 0.0% 738 1.2%
Operating expenditures (opex)Operating expenditure (opex) is a key financial parameter for Telenor and is derived directly from the income statement, consisting of salaries and personnel cost and other operating expenses. Telenor’s continuously effort to improve efficiencies makes opex a key financial parameter to follow. It is also used for internal performance analysis.
Second quarter First half year Year
(NOK in millions) 2017 2016 2017 2016 2016
Salaries and personnel cost (3 173) (3 317) (6 477) (6 585) (12 690)
Other operating expenditure (8 047) (8 480) (16 169) (17 034) (34 192)
Operating expenditure (11 220) (11 797) (22 646) (23 619) (46 882)
EBITDA before other income and other expensesEarnings before interest, tax, depreciations and amortisations (EBITDA) is a key financial parameter for Telenor. EBITDA before other income and other expenses is defined as EBITDA less gains and losses on disposals of fixed assets and operations, workforce reductions, onerous contracts and one-time pension costs, and is reconciled in the section Group overview. This measure is useful to users of Telenor’s financial information in evaluating operating profitability on a more variable cost basis as it excludes depreciations and amortisation expense related primarily to capital expenditures and acquisitions that occurred in the past, non-recurring items, as well as evaluating operating performance in relation to Telenor’s competitors.
The EBITDA margin presented is defined as EBITDA before other income and other expenses divided by total revenues.
Organic EBITDA growthOrganic EBITDA growth is defined as EBITDA (before other income and other expenses) adjusted for the effects of acquisition and disposal of operations and currency effects. We believe that the measure provides useful and necessary information to investors, and other related parties for the following reasons:• it provides additional information on underlying growth of the business without the effect of certain factors unrelated to its operating performance;• it is used for internal performance analysis.
(NOK in millions)Change second quarter
2017Change YoY Change second quarter
2016Change YoY Change first half year
2017Change YoY
Reported EBITDA growth 1 338 11.8% 720 6.8% 1 171 5.1%
Impact using exchange rates for 2017 69 (195) 51
M&A 7 50 480
Organic EBITDA growth 1 415 12.6% 575 5.2% 1 702 7.6%
Definitions
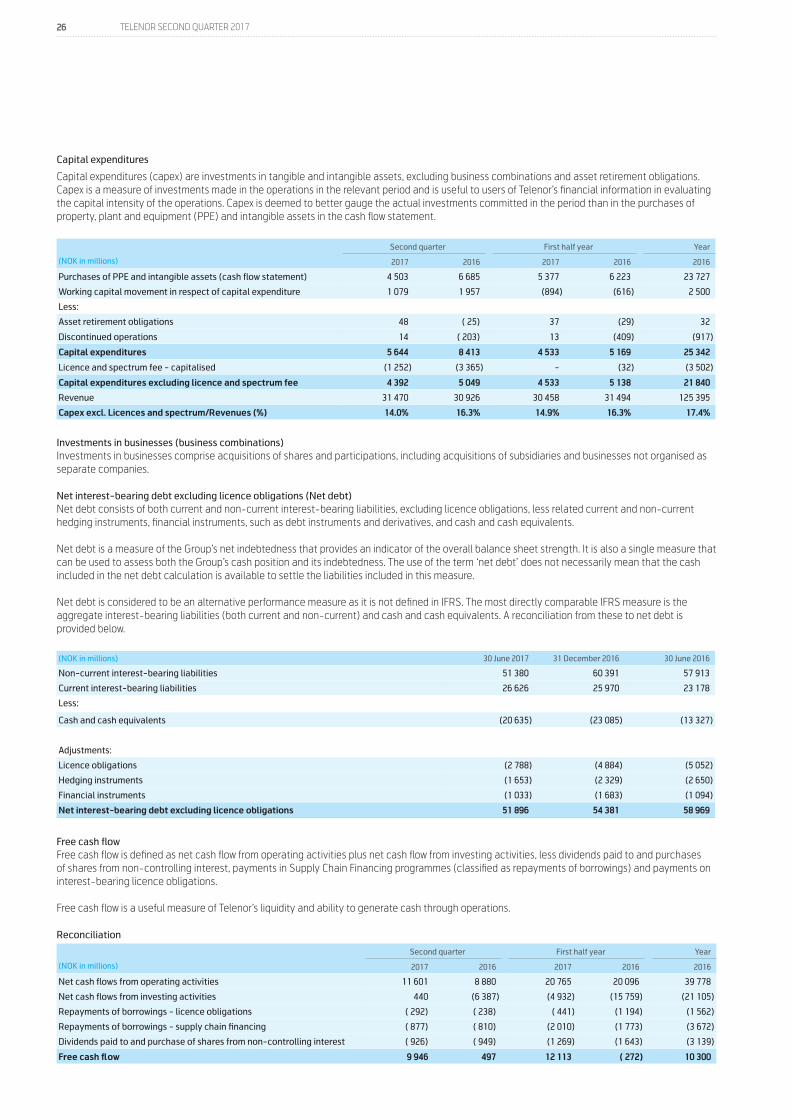
26 TELENOR SECOND QUARTER 2017
Capital expenditures
Capital expenditures (capex) are investments in tangible and intangible assets, excluding business combinations and asset retirement obligations. Capex is a measure of investments made in the operations in the relevant period and is useful to users of Telenor’s financial information in evaluating the capital intensity of the operations. Capex is deemed to better gauge the actual investments committed in the period than in the purchases of property, plant and equipment (PPE) and intangible assets in the cash flow statement.
Second quarter First half year Year
(NOK in millions) 2017 2016 2017 2016 2016
Purchases of PPE and intangible assets (cash flow statement) 4 503 6 685 5 377 6 223 23 727
Working capital movement in respect of capital expenditure 1 079 1 957 (894) (616) 2 500
Less:
Asset retirement obligations 48 ( 25) 37 (29) 32
Discontinued operations 14 ( 203) 13 (409) (917)
Capital expenditures 5 644 8 413 4 533 5 169 25 342
Licence and spectrum fee - capitalised (1 252) (3 365) - (32) (3 502)
Capital expenditures excluding licence and spectrum fee 4 392 5 049 4 533 5 138 21 840
Revenue 31 470 30 926 30 458 31 494 125 395
Capex excl. Licences and spectrum/Revenues (%) 14.0% 16.3% 14.9% 16.3% 17.4%
Investments in businesses (business combinations) Investments in businesses comprise acquisitions of shares and participations, including acquisitions of subsidiaries and businesses not organised as separate companies.
Net interest-bearing debt excluding licence obligations (Net debt)Net debt consists of both current and non-current interest-bearing liabilities, excluding licence obligations, less related current and non-current hedging instruments, financial instruments, such as debt instruments and derivatives, and cash and cash equivalents.
Net debt is a measure of the Group’s net indebtedness that provides an indicator of the overall balance sheet strength. It is also a single measure that can be used to assess both the Group’s cash position and its indebtedness. The use of the term ‘net debt’ does not necessarily mean that the cash included in the net debt calculation is available to settle the liabilities included in this measure.
Net debt is considered to be an alternative performance measure as it is not defined in IFRS. The most directly comparable IFRS measure is the aggregate interest-bearing liabilities (both current and non-current) and cash and cash equivalents. A reconciliation from these to net debt is provided below.
(NOK in millions) 30 June 2017 31 December 2016 30 June 2016
Non-current interest-bearing liabilities 51 380 60 391 57 913
Current interest-bearing liabilities 26 626 25 970 23 178
Less:
Cash and cash equivalents (20 635) (23 085) (13 327)
Adjustments:
Licence obligations (2 788) (4 884) (5 052)
Hedging instruments (1 653) (2 329) (2 650)
Financial instruments (1 033) (1 683) (1 094)
Net interest-bearing debt excluding licence obligations 51 896 54 381 58 969
Free cash flowFree cash flow is defined as net cash flow from operating activities plus net cash flow from investing activities, less dividends paid to and purchases of shares from non-controlling interest, payments in Supply Chain Financing programmes (classified as repayments of borrowings) and payments on interest-bearing licence obligations.
Free cash flow is a useful measure of Telenor’s liquidity and ability to generate cash through operations.
Reconciliation
Second quarter First half year Year
(NOK in millions) 2017 2016 2017 2016 2016
Net cash flows from operating activities 11 601 8 880 20 765 20 096 39 778
Net cash flows from investing activities 440 (6 387) (4 932) (15 759) (21 105)
Repayments of borrowings - licence obligations ( 292) ( 238) ( 441) (1 194) (1 562)
Repayments of borrowings - supply chain financing ( 877) ( 810) (2 010) (1 773) (3 672)
Dividends paid to and purchase of shares from non-controlling interest ( 926) ( 949) (1 269) (1 643) (3 139)
Free cash flow 9 946 497 12 113 ( 272) 10 300
27 TELENOR SECOND QUARTER 2017
Mobile operations
RevenuesSubscription and trafficConsist of subscription and connection fees, revenues from voice (outgoing traffic) and non-voice traffic, outbound roaming and other mobile service revenues. Subscription and traffic includes only revenues from the company’s own subscriptions.
InterconnectConsist of revenues from incoming traffic related to the company’s own subscriptions. Revenues from incoming traffic related to service provider or MVNO subscriptions are not included.
Other mobileConsist of inbound roaming, national roaming, telemetric and revenues related to service providers and MVNOs (Mobile Virtual Network Operators). Telemetric is defined as machine-to-machine SIM cards (M2M), for example vending machines and meter readings.
Non-mobileConsist of revenues from customer equipment and businesses that are not directly related to mobile operations.
Mobile revenues from company’s own subscriptionsConsist of ‘Subscription and traffic’ and ‘Interconnect’ and do not include revenues from inbound roaming, national roaming, service providers, MVNOs, sale of customer equipment and incoming traffic related to service provider subscriptions.
Key figuresSubscriptionsContract subscriptions are counted until the subscription is terminated or until there has been no revenues or outgoing/incoming traffic during the last three months. Prepaid subscriptions are counted as active if there has been outgoing or incoming traffic or if the SIM card has been reloaded during the last three months. Service provider and MVNO subscriptions are not included. Data only SIM cards are included, but SIM cards used for telemetric applications and twin/multi SIM cards are excluded. Total subscriptions are voice SIM cards plus data only SIM cards used for mobile broadband.
Active mobile internet usersActive mobile internet users are subscriptions with at least 150 KB of data during the last three months.
Average traffic minutes per subscription per month (AMPU)Traffic minutes per subscription per month are calculated based on total outgoing and incoming rated minutes from the company’s own subscriptions less data only subscriptions. This includes zero rated minutes and outgoing minutes from own subscriptions while roaming. Outgoing and incoming minutes related to inbound roaming, national roaming, service providers and MVNOs are not included.
Average revenue per subscription per month (ARPU)ARPU is calculated based on mobile revenues from the company’s own subscriptions, divided by the average number of subscriptions for the relevant period.
28 TELENOR SECOND QUARTER 2017
Fixed operations
RevenuesTelephonyConsist of subscription and connection fees, traffic (fixed to fixed, fixed to mobile, to other countries, value added services, other traffic) for PSTN/ISDN and Voice over Internet Protocol (VoIP).
Internet and TVConsist of subscription, traffic charges and connection fees for xDSL, cable and fibre, in addition to revenues from TV services. High speed fixed internet include fibre, cable and VDSL.
Data servicesConsist of Nordic Connect/IP-VPN and security.
OtherConsist of leased lines, managed services and other retail products.
WholesaleConsist of sale to service providers of telephony (PSTN/ISDN), Bitstream, LLUB, national and international interconnect, transit traffic, leased lines and other wholesale products.
Key FiguresSubscriptionsTelephony consist of PSTN, ISDN and VoIP subscriptions. Internet consists of broadband access over xDSL, fibre and cable. TV consists of TV services over fibre and cable. Subscriptions are counted until the subscription is terminated.
Average revenue per subscription per month (ARPU)ARPU is calculated based on revenues from the company’s own subscriptions, divided by the average number of subscriptions for the relevant period. Internet ARPU is calculated based on Internet revenues as defined above except TV service revenues. TV ARPU is calculated based on revenues from TV services.
BroadcastRevenuesCanal Digital DTHConsist of revenues from Nordic DTH subscribers, households in SMATV networks and DTT subscribers in Finland.
SatelliteConsist of revenues from satellite services from the satellite position 1-degree west.
NorkringConsist of revenues from terrestrial radio and TV transmission in Norway and Belgium.


Second quarter 2017Published by Telenor ASAN-1360 Fornebu, NorwayPhone: +47 67 89 00 00
Investor Relations:E-mail: [email protected]
www.telenor.com
2171
145
• Bo
lt Co
mm
unic
atio
n AS
• b
oltc
omm
unic
atio
n.no