Embed Size (px)
Citation preview

SMARTJOBNO: 05380 ediTiON: Quarter42012
CLieNT: manpower
SUBJeCT: meosglobalQ412–usletter–4colour
SiZe: usletter
dOCNAMe: 05380mpcp_global_us_4col_Q412 PAGe: 1
ARTwORkSiZe: 279.4mmx215.9mm dATe: 23.08.12
87ChARTeRhOUSeSTReeT•LONdONeC1M6hJ•TeL+44(0)2073241060
Manpower Employment Outlook Survey Global
Q4 2012
Manpower Employment Outlook Survey Global
SMARTJOBNO: 05380 ediTiON: Quarter42012
CLieNT: manpower
SUBJeCT: meosglobalQ412–usletter–4colour
SiZe: usletter
dOCNAMe: 05380mpcp_global_us_4col_Q412 PAGe: 2
ARTwORkSiZe: 279.4mmx215.9mm dATe: 23.08.12
87ChARTeRhOUSeSTReeT•LONdONeC1M6hJ•TeL+44(0)2073241060
Contents
Global Employment Outlook 1International Comparisons – Americas
International Comparisons – Asia Pacific
International Comparisons – EMEA
About the Survey 12
About ManpowerGroupTM 13
Q4/
12
1
SMARTJOBNO: 05380 ediTiON: Quarter42012
CLieNT: manpower
SUBJeCT: meosglobalQ412–usletter–4colour
SiZe: usletter
dOCNAMe: 05380mpcp_global_us_4col_Q412 PAGe: 1
ARTwORkSiZe: 279.4mmx215.9mm dATe: 23.08.12
87ChARTeRhOUSeSTReeT•LONdONeC1M6hJ•TeL+44(0)2073241060
Global Employment OutlookManpowerGroup interviewed nearly 66,000 hiring managers across 42 countries and territories to measure employer hiring expectations* between October and December 2012. Employers in Finland participate in the research for the first time this quarter.The Manpower Employment Outlook Survey is ManpowerGroup’s quarterly index of employer hiring confidence. All participants were asked, “How do you anticipate total employment at your location to change in the three months to the end of December 2012 as compared to the current quarter?”
The fourth-quarter research reveals that uncertainty in the global marketplace—particularly in Europe—as well as signals of slowdowns in India, mainland China and Brazil, is contributing to a generally weaker forecast. The overall hiring pace is expected to lose momentum on both a quarter-over-quarter and year-over-year basis, but hiring intentions still remain positive in nearly three-quarters of the countries and territories included in the survey. However, there is little evidence of overwhelming enthusiasm on the part of employers to add to their payrolls as Outlooks improve or remain relatively stable in only 15 countries and territories when compared to Quarter 4 2011.
The fourth quarter results are also notable for the decline in optimism among employers in India where the hiring pace is expected to remain active despite a considerably weaker Outlook in both quarter-over-quarter and year-over-year comparisons. Meanwhile, despite pockets of resilience, hiring plans among most European employers have shifted down a gear as many remain concerned that the sovereign debt crisis threatens to drag the entire eurozone toward another recession. In the U.S., employers expect the hiring pace to remain
at similarly steady levels seen throughout the past year, with positive forecasts reported by employers in all sectors and regions surveyed.
Worldwide, hiring expectations are strongest in Taiwan, India and Panama where preparations for the launch of the new canal expansion project, as well as the October ratification of the Free Trade Agreement with the U.S., is resulting in hiring optimism among employers in the Commerce and the Transportation & Communications industry sectors. On the other hand, opportunities for job seekers are expected to be weakest in Greece, Italy, Finland, Ireland, Spain, Slovakia, Netherlands, Czech Republic and Poland where employers report the least optimistic—and only negative—global hiring plans.
In the Americas, employers from all 10 countries surveyed report positive fourth-quarter hiring intentions. Job prospects are strongest in Panama and Brazil and weakest in Argentina. Employers in Mexico report their strongest hiring plans in over four years, driven by optimism among employers in Mexico City where the Outlook is the most optimistic since the survey began there in 2002.
Globally, the strongest hiring plans are reported by employers in Taiwan; the hiring pace is expected to remain robust, but job prospects are trending weaker as employers scale back their hiring plans in response to a softer export market. Like their counterparts in India, employers in mainland China are reporting generally weaker hiring intentions despite an overall Outlook that remains positive in all industry sectors and regions. Elsewhere, the Australian Outlook edges downward for the sixth consecutive quarter and now stands at its weakest level since Quarter 4 2009.
The European debt crisis remains a persistent drag on the confidence of employers throughout much of the Europe, Middle East & Africa (EMEA) region. However, job seekers may find some pockets of opportunity; viewed from a year-over-year perspective, job prospects are marginally stronger in Switzerland, Romania and Slovenia. Hiring intentions also grow slightly in the United Kingdom despite threats that the country’s double-dip recession will intensify. Elsewhere, the story is less promising. The nine negative Outlooks reported this quarter are all from the EMEA region, with employers in Poland and Slovakia reporting negative hiring plans for the first time since starting the survey.
* Commentary is based on seasonally adjusted data where available.
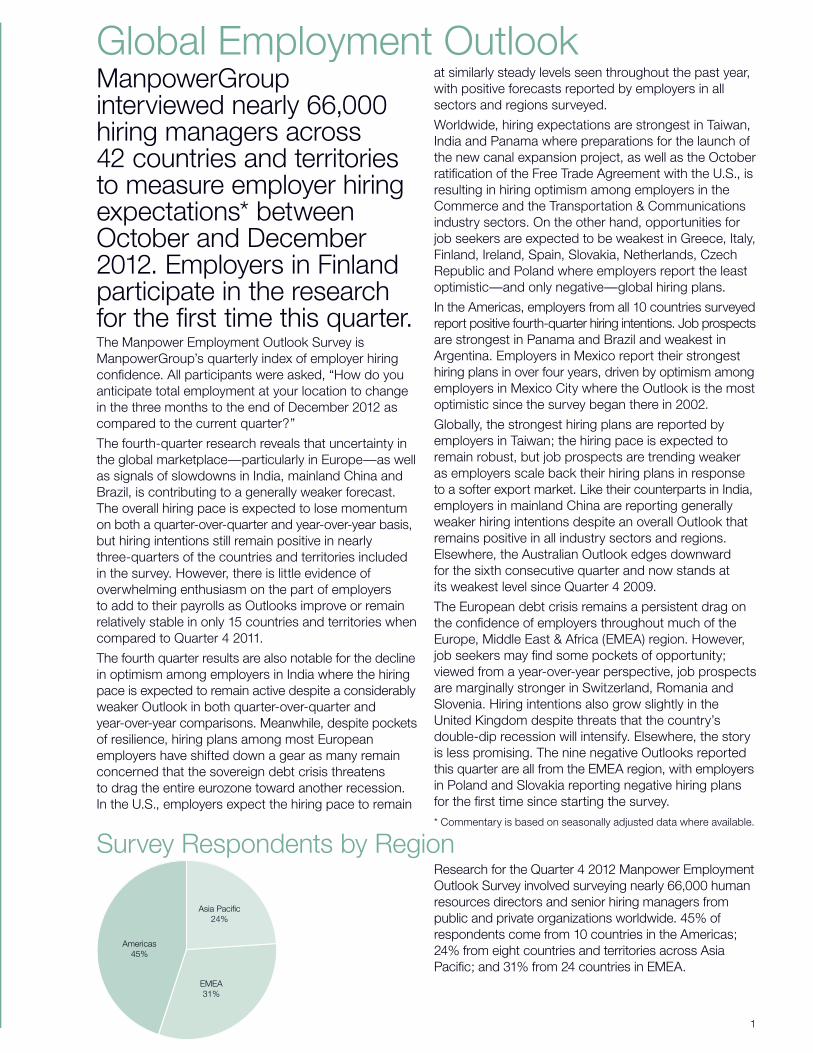
Survey Respondents by Region
Asia Pacific24%
EMEA31%
Americas45%
Research for the Quarter 4 2012 Manpower Employment Outlook Survey involved surveying nearly 66,000 human resources directors and senior hiring managers from public and private organizations worldwide. 45% of respondents come from 10 countries in the Americas; 24% from eight countries and territories across Asia Pacific; and 31% from 24 countries in EMEA.
Manpower Employment Outlook Survey Global
2
SMARTJOBNO: 05380 ediTiON: Quarter42012
CLieNT: manpower
SUBJeCT: meosglobalQ412–usletter–4colour
SiZe: usletter
dOCNAMe: 05380mpcp_global_us_4col_Q412 PAGe: 2
ARTwORkSiZe: 279.4mmx215.9mm dATe: 23.08.12
87ChARTeRhOUSeSTReeT•LONdONeC1M6hJ•TeL+44(0)2073241060
Americas
Asia PacificAustralia
China
Hong Kong
Japan
India
New Zealand
Singapore
Taiwan
EMEA*Austria
Belgium
Net Employment Outlook
Quarter 4 2012Quarter 3 2012
17 (19)1
9 (7)1
2 (2)1
%
9 (10)1
8 (11)1
16 (18)1
15 (14)1
53 (45)1
23 (23)1
40 (34)1
16 (14)1
4 (4)1
1 (2)1
%
9 (9)1
7 (10)1
19 (18)1
12 (11)1
18 (27)1
19 (17)1
34 (32)1
18 (12)1
16 (15)1
21 (23)1
9 (10)1
17 (17)1
23 (21)1
4 (2)1
3 (4)12 (2)1
6 (5)1
-1 (-2)1
-3 (0)1
-3 (-6)1
8 (5)1
-4 (-6)1
8 (6)1
27
-1 (-3)1
-1 (-2)1
5 (5)1
-7 (-7)1
8 (7)1
-8 (-7)1
3 (3)1
21
-11 (-9)1
Qtr on Qtr Change
Q3 2012 to Q4 2012
-1 (-5)1
-5 (-3)1
-1 (0)1
0 (-1)1
-1 (-1)1
3 (0)1
-3 (-3)1
-35 (-18)1
-4 (-6)1
-6 (-2)1
-9 (-7)1
-2 (-2)1
-3 (-2)1
-7 (-6)1
-1 (-1)1
-4 (-4)1
-9 (-10)1
-16 (-13)1
-12 (-12)1
-3 (-4)1
Yr on Yr Change
Q4 2011 to Q4 2012 Quarter 4 2011
%
16 (15)1
37 (36)1
25 (21)1
34 (40)121 (21)1
8 (11)1
23 (22)1
31 (29)1
6 (6)1
4 (4)1
Bulgaria 13 5 -8 -813
12 (13)1
13 (13)1
Costa Rica 10 (14)1 18 (16)1 8 (2)1 -1 (-1)119 (17)1Colombia 20 (18)1 19 (18)1 -1 (0)1 -3 (-3)122 (21)1
18 (16)1
United States 15 (11)1 8 (11)1 -7 (0)1 3 (3)15 (8)1
4 (4)1
Czech Republic 1 (-2)1 0 (-1)1 -1 (1)1 -1 (-1)11 (0)1
12 (11)1
Greece -9 (-14)1 -16 (-15)1 -7 (-1)1 -3 (-3)1-13 (-12)1
Hungary -2 0 2 -11
2 (2)1
0 (0)1
2 (1)1
14 (13)1
-2 (-1)1South Africa 4 (7)1 -1 (0)1 -5 (-7)1 -3 (-3)12 (3)1Slovenia 9 3 -6 5-2
Slovakia 5 -2 -7 -42
Poland 10 (5)1 -2 (-1)1 -12 (-6)1 -9 (-9)17 (8)1
Romania 17 (11)1 13 (14)1 -4 (3)1 2 (3)111 (11)1
11 (11)1
20
-11 (-9)1
Canada
Mexico
Peru
-9 (-2)1
1 (2)1
2 (-2)1
-3 (-3)131 2438Brazil -7 -14
7 (8)1 3 (4)117 (18)1Argentina -4 (-4)1 -14 (-14)1
4 (4)111 (12)1 14 (14)113 (13)1Guatemala 3 (2)1 1 (1)1
5 (5)122 2626Panama 4 0
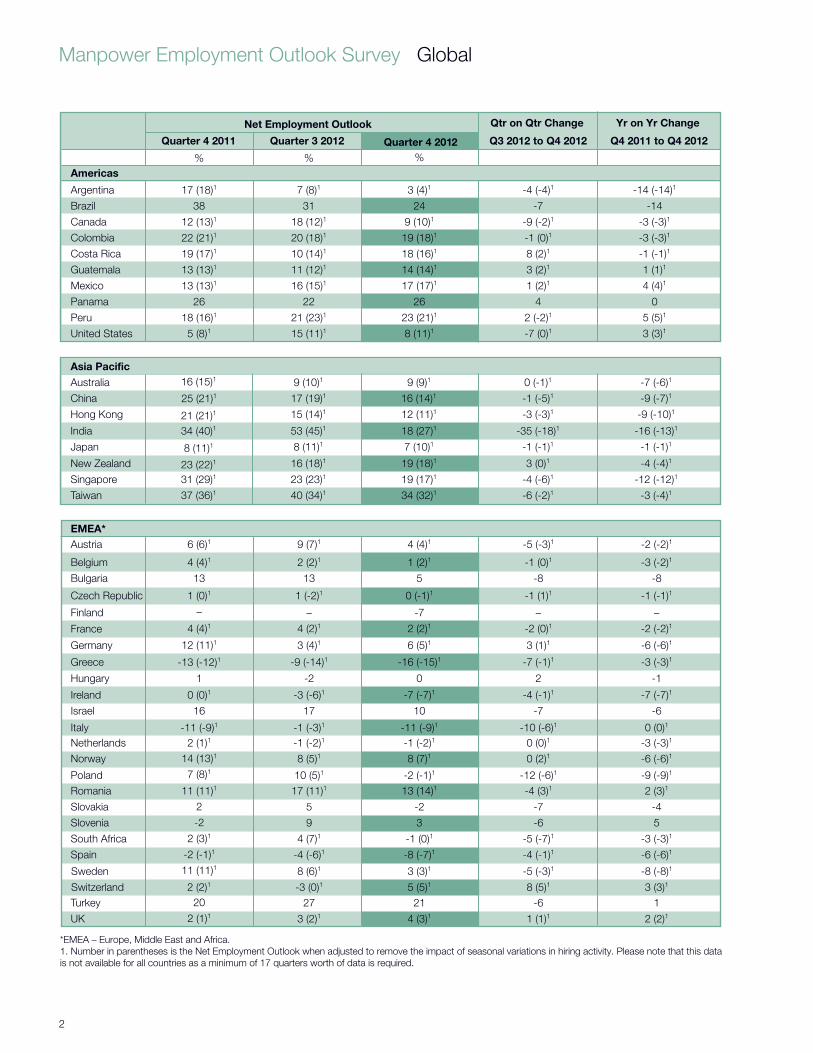
*EMEA – Europe, Middle East and Africa. 1. Number in parentheses is the Net Employment Outlook when adjusted to remove the impact of seasonal variations in hiring activity. Please note that this data is not available for all countries as a minimum of 17 quarters worth of data is required.
France
Germany
-2 (0)1
3 (1)1-2 (-2)1
– -7–Finland – –
-6 (-6)1
Ireland
Netherlands
Norway
Spain
Turkey
Italy
Switzerland
Sweden
0 (0)1
8 (5)1
-4 (-1)1
0 (2)1
-4 (-1)1
-5 (-3)1
-6
-10 (-6)1
-3 (-3)1
3 (3)1
-7 (-7)1
17 1016Israel -7 -6
-6 (-6)1
-6 (-6)1
-8 (-8)1
1
3 (2)1 4 (3)12 (1)1UK 1 (1)1 2 (2)1
0 (0)1
3
SMARTJOBNO: 05380 ediTiON: Quarter42012
CLieNT: manpower
SUBJeCT: meosglobalQ412–usletter–4colour
SiZe: usletter
dOCNAMe: 05380mpcp_global_us_4col_Q412 PAGe: 3
ARTwORkSiZe: 279.4mmx215.9mm dATe: 23.08.12
87ChARTeRhOUSeSTReeT•LONdONeC1M6hJ•TeL+44(0)2073241060
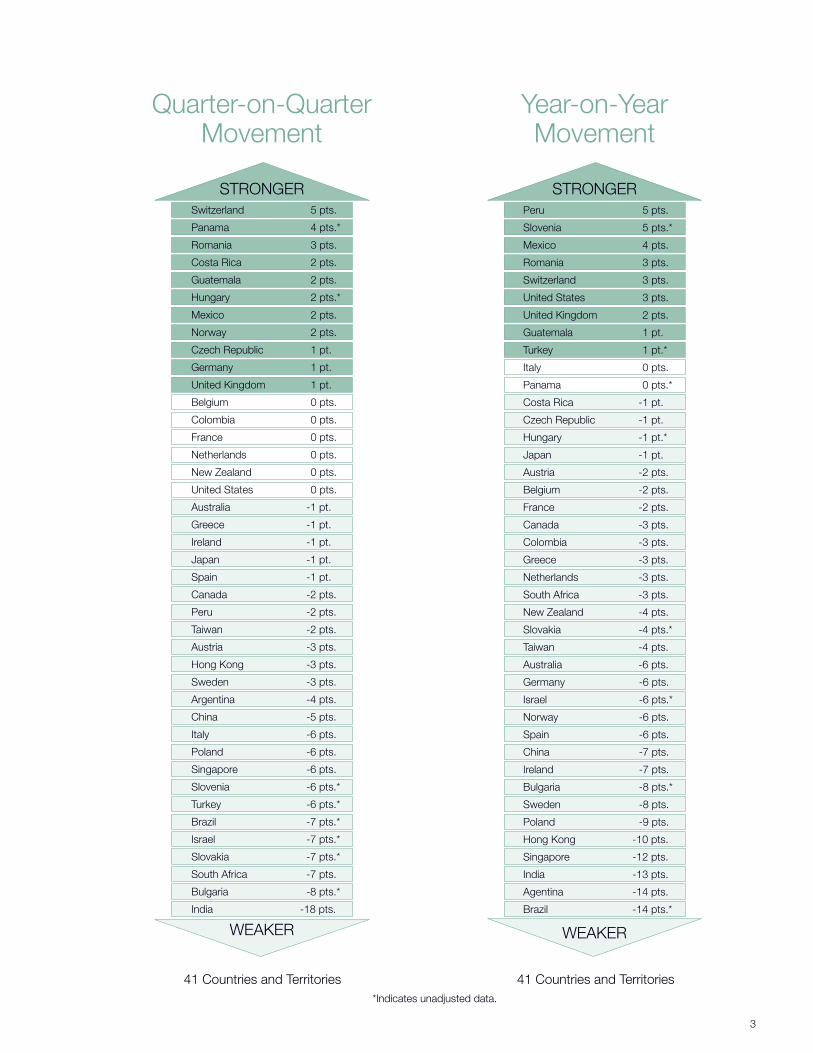
*Indicates unadjusted data.
41 Countries and Territories 41 Countries and Territories
STRONGER
WEAKER WEAKER
STRONGER
Quarter-on-QuarterMovement
Year-on-YearMovement
Switzerland 5 pts.
Panama 4 pts.*
Romania 3 pts.
Costa Rica 2 pts.
Guatemala 2 pts.
Hungary 2 pts.*
Mexico 2 pts.
Norway 2 pts.
Czech Republic 1 pt.
Germany 1 pt.
United Kingdom 1 pt.
Belgium 0 pts.
Colombia 0 pts.
France 0 pts.
Netherlands 0 pts.
New Zealand 0 pts.
United States 0 pts.
Australia -1 pt.
Greece -1 pt.
Ireland -1 pt.
Japan -1 pt.
Spain -1 pt.
Canada -2 pts.
Peru -2 pts.
Taiwan -2 pts.
Austria -3 pts.
Hong Kong -3 pts.
Sweden -3 pts.
Argentina -4 pts.
China -5 pts.
Italy -6 pts.
Poland -6 pts.
Singapore -6 pts.
Slovenia -6 pts.*
Turkey -6 pts.*
Brazil -7 pts.*
Israel -7 pts.*
Slovakia -7 pts.*
South Africa -7 pts.
Bulgaria -8 pts.*
India -18 pts.
Peru 5 pts.
Slovenia 5 pts.*
Mexico 4 pts.
Romania 3 pts.
Switzerland 3 pts.
United States 3 pts.
United Kingdom 2 pts.
Guatemala 1 pt.
Turkey 1 pt.*
Italy 0 pts.
Panama 0 pts.*
Costa Rica -1 pt.
Czech Republic -1 pt.
Hungary -1 pt.*
Japan -1 pt.
Austria -2 pts.
Belgium -2 pts.
France -2 pts.
Canada -3 pts.
Colombia -3 pts.
Greece -3 pts.
Netherlands -3 pts.
South Africa -3 pts.
New Zealand -4 pts.
Slovakia -4 pts.*
Taiwan -4 pts.
Australia -6 pts.
Germany -6 pts.
Israel -6 pts.*
Norway -6 pts.
Spain -6 pts.
China -7 pts.
Ireland -7 pts.
Bulgaria -8 pts.*
Sweden -8 pts.
Poland -9 pts.
Hong Kong -10 pts.
Singapore -12 pts.
India -13 pts.
Agentina -14 pts.
Brazil -14 pts.*
Manpower Employment Outlook Survey Global
4
SMARTJOBNO: 05380 ediTiON: Quarter42012
CLieNT: manpower
SUBJeCT: meosglobalQ412–usletter–4colour
SiZe: usletter
dOCNAMe: 05380mpcp_global_us_4col_Q412 PAGe: 4
ARTwORkSiZe: 279.4mmx215.9mm dATe: 23.08.12
87ChARTeRhOUSeSTReeT•LONdONeC1M6hJ•TeL+44(0)2073241060
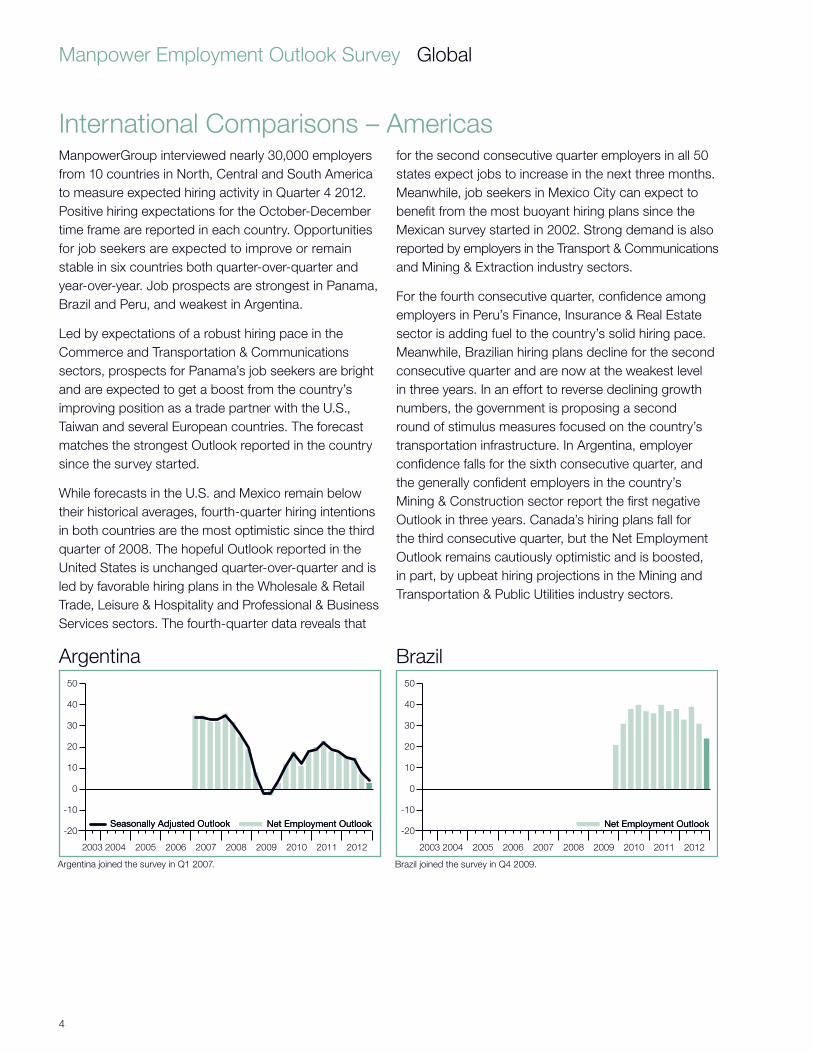
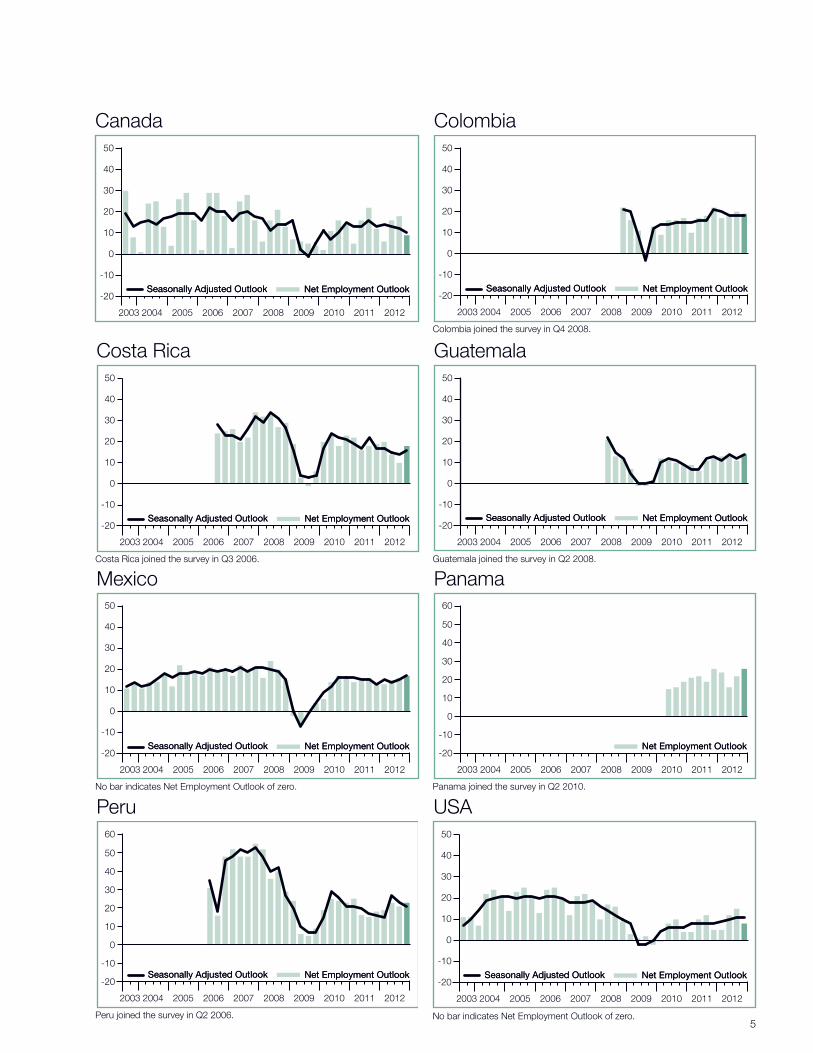
ManpowerGroup interviewed nearly 30,000 employers from 10 countries in North, Central and South America to measure expected hiring activity in Quarter 4 2012. Positive hiring expectations for the October-December time frame are reported in each country. Opportunities for job seekers are expected to improve or remain stable in six countries both quarter-over-quarter and year-over-year. Job prospects are strongest in Panama, Brazil and Peru, and weakest in Argentina.
Led by expectations of a robust hiring pace in the Commerce and Transportation & Communications sectors, prospects for Panama’s job seekers are bright and are expected to get a boost from the country’s improving position as a trade partner with the U.S., Taiwan and several European countries. The forecast matches the strongest Outlook reported in the country since the survey started.
While forecasts in the U.S. and Mexico remain below their historical averages, fourth-quarter hiring intentions in both countries are the most optimistic since the third quarter of 2008. The hopeful Outlook reported in the United States is unchanged quarter-over-quarter and is led by favorable hiring plans in the Wholesale & Retail Trade, Leisure & Hospitality and Professional & Business Services sectors. The fourth-quarter data reveals that
International Comparisons – Americasfor the second consecutive quarter employers in all 50 states expect jobs to increase in the next three months. Meanwhile, job seekers in Mexico City can expect to benefit from the most buoyant hiring plans since the Mexican survey started in 2002. Strong demand is also reported by employers in the Transport & Communications and Mining & Extraction industry sectors.
For the fourth consecutive quarter, confidence among employers in Peru’s Finance, Insurance & Real Estate sector is adding fuel to the country’s solid hiring pace. Meanwhile, Brazilian hiring plans decline for the second consecutive quarter and are now at the weakest level in three years. In an effort to reverse declining growth numbers, the government is proposing a second round of stimulus measures focused on the country’s transportation infrastructure. In Argentina, employer confidence falls for the sixth consecutive quarter, and the generally confident employers in the country’s Mining & Construction sector report the first negative Outlook in three years. Canada’s hiring plans fall for the third consecutive quarter, but the Net Employment Outlook remains cautiously optimistic and is boosted, in part, by upbeat hiring projections in the Mining and Transportation & Public Utilities industry sectors.
Argentina50
40
30
20
10
0
-10
-20
Argentina joined the survey in Q1 2007.
Seasonally Adjusted OutlookSeasonally Adjusted Outlook Net Employment OutlookNet Employment Outlook
2003 2004 2005 2006 2007 2008 2009 2010 2011 2012
Brazil50
40
30
20
10
0
-10
-20
Brazil joined the survey in Q4 2009.
Net Employment OutlookNet Employment Outlook
2003 2004 2005 2006 2007 2008 2009 2010 2011 2012
5
SMARTJOBNO: 05380 ediTiON: Quarter42012
CLieNT: manpower
SUBJeCT: meosglobalQ412–usletter–4colour
SiZe: usletter
dOCNAMe: 05380mpcp_global_us_4col_Q412 PAGe: 5
ARTwORkSiZe: 279.4mmx215.9mm dATe: 23.08.12
87ChARTeRhOUSeSTReeT•LONdONeC1M6hJ•TeL+44(0)2073241060
Canada50
40
30
20
10
0
-10
-20Seasonally Adjusted OutlookSeasonally Adjusted Outlook Net Employment OutlookNet Employment Outlook
2003 2004 2005 2006 2007 2008 2009 2010 2011 2012
Colombia50
40
30
20
10
0
-10
-20
Colombia joined the survey in Q4 2008.
2003 2004 2005 2006 2007 2008 2009 2010 2011 2012
Seasonally Adjusted OutlookSeasonally Adjusted Outlook Net Employment OutlookNet Employment Outlook
Costa Rica50
40
30
20
10
0
-10
-20
Costa Rica joined the survey in Q3 2006.
Seasonally Adjusted OutlookSeasonally Adjusted Outlook Net Employment OutlookNet Employment Outlook
2003 2004 2005 2006 2007 2008 2009 2010 2011 2012
Mexico50
40
30
20
10
0
-10
-20
No bar indicates Net Employment Outlook of zero.
Seasonally Adjusted OutlookSeasonally Adjusted Outlook Net Employment OutlookNet Employment Outlook
2003 2004 2005 2006 2007 2008 2009 2010 2011 2012
USA50
40
30
20
10
0
-10
-20
No bar indicates Net Employment Outlook of zero.
Seasonally Adjusted OutlookSeasonally Adjusted Outlook Net Employment OutlookNet Employment Outlook
2003 2004 2005 2006 2007 2008 2009 2010 2011 2012
Guatemala50
40
30
20
10
0
-10
-20
Guatemala joined the survey in Q2 2008.
2003 2004 2005 2006 2007 2008 2009 2010 2011 2012
Seasonally Adjusted OutlookSeasonally Adjusted Outlook Net Employment OutlookNet Employment Outlook
Panama60
-20
-10
0
10
20
30
40
50
Panama joined the survey in Q2 2010.
Net Employment OutlookNet Employment Outlook
2003 2004 2005 2006 2007 2008 2009 2010 2011 2012
Peru60
-20
-10
0
10
20
30
40
50
Peru joined the survey in Q2 2006.
Seasonally Adjusted OutlookSeasonally Adjusted Outlook Net Employment OutlookNet Employment Outlook
2003 2004 2005 2006 2007 2008 2009 2010 2011 2012
Manpower Employment Outlook Survey Global
6
SMARTJOBNO: 05380 ediTiON: Quarter42012
CLieNT: manpower
SUBJeCT: meosglobalQ412–usletter–4colour
SiZe: usletter
dOCNAMe: 05380mpcp_global_us_4col_Q412 PAGe: 6
ARTwORkSiZe: 279.4mmx215.9mm dATe: 23.08.12
87ChARTeRhOUSeSTReeT•LONdONeC1M6hJ•TeL+44(0)2073241060
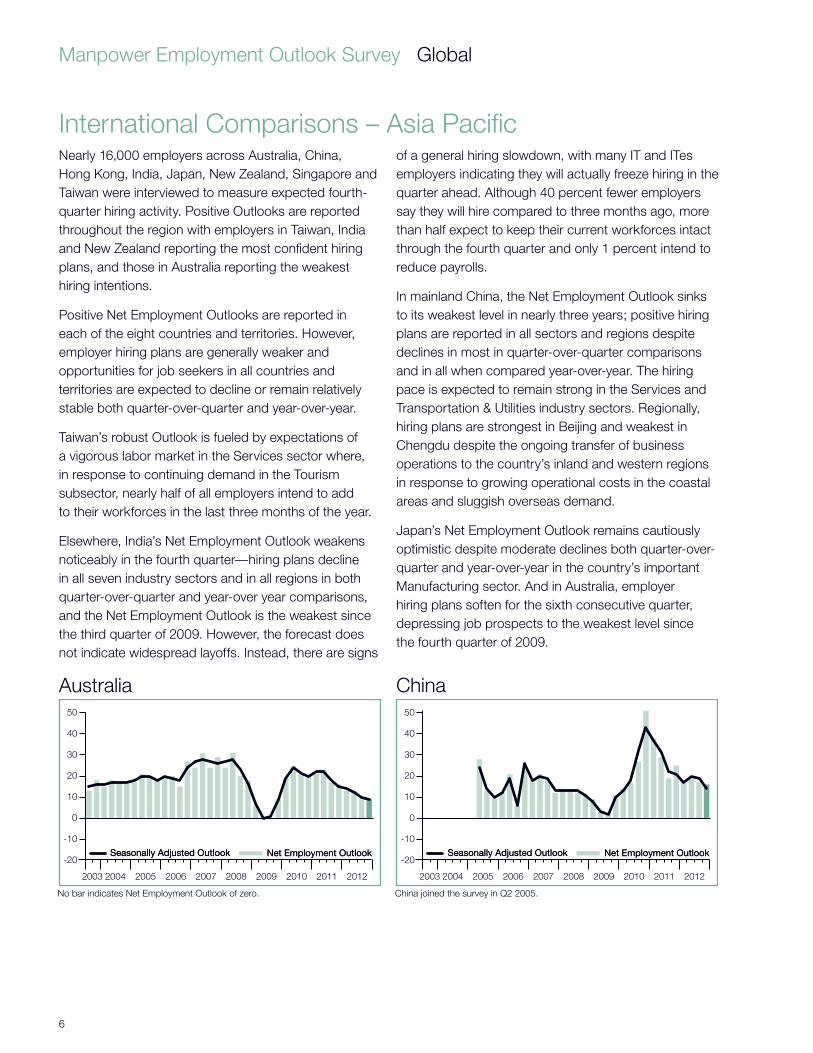
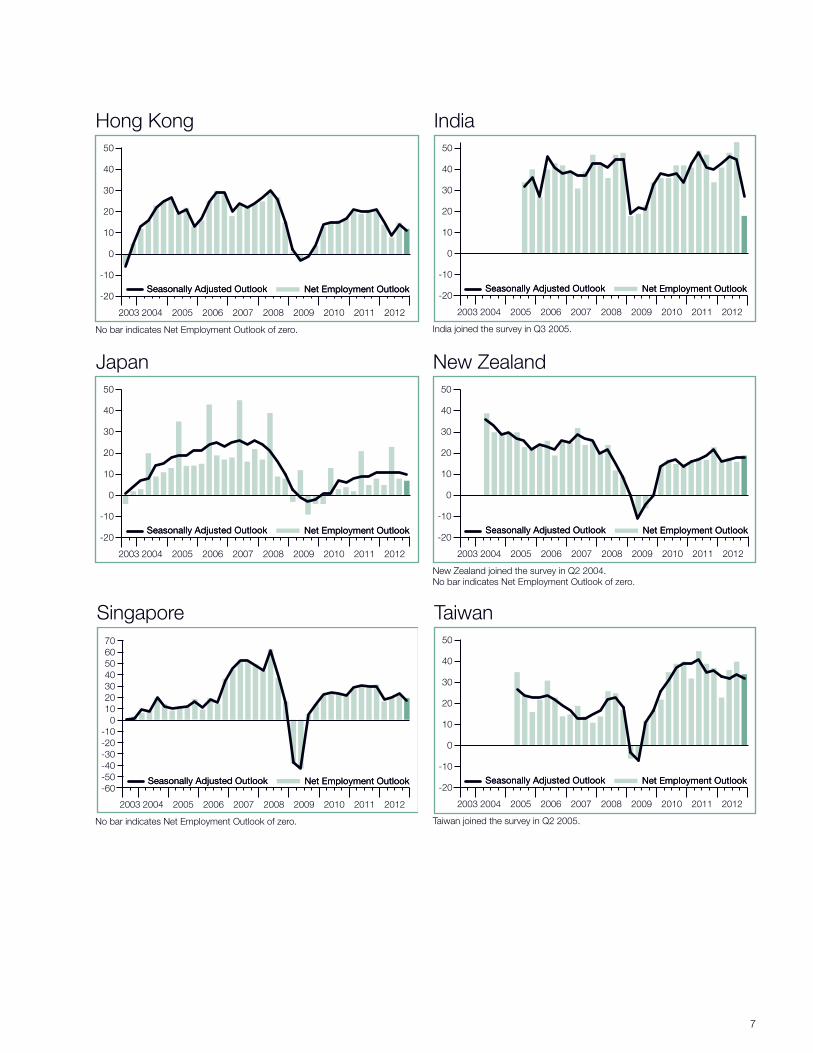
Nearly 16,000 employers across Australia, China, Hong Kong, India, Japan, New Zealand, Singapore and Taiwan were interviewed to measure expected fourth-quarter hiring activity. Positive Outlooks are reported throughout the region with employers in Taiwan, India and New Zealand reporting the most confident hiring plans, and those in Australia reporting the weakest hiring intentions.
Positive Net Employment Outlooks are reported in each of the eight countries and territories. However, employer hiring plans are generally weaker and opportunities for job seekers in all countries and territories are expected to decline or remain relatively stable both quarter-over-quarter and year-over-year.
Taiwan’s robust Outlook is fueled by expectations of a vigorous labor market in the Services sector where, in response to continuing demand in the Tourism subsector, nearly half of all employers intend to add to their workforces in the last three months of the year.
Elsewhere, India’s Net Employment Outlook weakens noticeably in the fourth quarter—hiring plans decline in all seven industry sectors and in all regions in both quarter-over-quarter and year-over year comparisons, and the Net Employment Outlook is the weakest since the third quarter of 2009. However, the forecast does not indicate widespread layoffs. Instead, there are signs
International Comparisons – Asia Pacificof a general hiring slowdown, with many IT and ITes employers indicating they will actually freeze hiring in the quarter ahead. Although 40 percent fewer employers say they will hire compared to three months ago, more than half expect to keep their current workforces intact through the fourth quarter and only 1 percent intend to reduce payrolls.
In mainland China, the Net Employment Outlook sinks to its weakest level in nearly three years; positive hiring plans are reported in all sectors and regions despite declines in most in quarter-over-quarter comparisons and in all when compared year-over-year. The hiring pace is expected to remain strong in the Services and Transportation & Utilities industry sectors. Regionally, hiring plans are strongest in Beijing and weakest in Chengdu despite the ongoing transfer of business operations to the country’s inland and western regions in response to growing operational costs in the coastal areas and sluggish overseas demand.
Japan’s Net Employment Outlook remains cautiously optimistic despite moderate declines both quarter-over-quarter and year-over-year in the country’s important Manufacturing sector. And in Australia, employer hiring plans soften for the sixth consecutive quarter, depressing job prospects to the weakest level since the fourth quarter of 2009.
Australia50
40
30
20
10
0
-10
-20
No bar indicates Net Employment Outlook of zero.
Seasonally Adjusted OutlookSeasonally Adjusted Outlook Net Employment OutlookNet Employment Outlook
2003 2004 2005 2006 2007 2008 2009 2010 2011 2012
China50
40
30
20
10
0
-10
-20
China joined the survey in Q2 2005.
Seasonally Adjusted OutlookSeasonally Adjusted Outlook Net Employment OutlookNet Employment Outlook
2003 2004 2005 2006 2007 2008 2009 2010 2011 2012
7
SMARTJOBNO: 05380 ediTiON: Quarter42012
CLieNT: manpower
SUBJeCT: meosglobalQ412–usletter–4colour
SiZe: usletter
dOCNAMe: 05380mpcp_global_us_4col_Q412 PAGe: 7
ARTwORkSiZe: 279.4mmx215.9mm dATe: 23.08.12
87ChARTeRhOUSeSTReeT•LONdONeC1M6hJ•TeL+44(0)2073241060
Hong Kong50
40
30
20
10
0
-10
-20
No bar indicates Net Employment Outlook of zero.
Seasonally Adjusted OutlookSeasonally Adjusted Outlook Net Employment OutlookNet Employment Outlook
2003 2004 2005 2006 2007 2008 2009 2010 2011 2012
India50
40
30
20
10
0
-10
-20
India joined the survey in Q3 2005.
Seasonally Adjusted OutlookSeasonally Adjusted Outlook Net Employment OutlookNet Employment Outlook
2003 2004 2005 2006 2007 2008 2009 2010 2011 2012
Japan50
40
30
20
10
0
-10
-20Seasonally Adjusted OutlookSeasonally Adjusted Outlook Net Employment OutlookNet Employment Outlook
2003 2004 2005 2006 2007 2008 2009 2010 2011 2012
Singapore
No bar indicates Net Employment Outlook of zero.
Seasonally Adjusted OutlookSeasonally Adjusted Outlook Net Employment OutlookNet Employment Outlook
2003 2004 2005 2006 2007 2008 2009 2010 2011 2012
-60-50-40-30-20-10
010203040506070
New Zealand50
40
30
20
10
0
-10
-20
New Zealand joined the survey in Q2 2004.No bar indicates Net Employment Outlook of zero.
Seasonally Adjusted OutlookSeasonally Adjusted Outlook Net Employment OutlookNet Employment Outlook
2003 2004 2005 2006 2007 2008 2009 2010 2011 2012
Taiwan50
40
30
20
10
0
-10
-20
Taiwan joined the survey in Q2 2005.
Seasonally Adjusted OutlookSeasonally Adjusted Outlook Net Employment OutlookNet Employment Outlook
2003 2004 2005 2006 2007 2008 2009 2010 2011 2012
Manpower Employment Outlook Survey Global
8
SMARTJOBNO: 05380 ediTiON: Quarter42012
CLieNT: manpower
SUBJeCT: meosglobalQ412–usletter–4colour
SiZe: usletter
dOCNAMe: 05380mpcp_global_us_4col_Q412 PAGe: 8
ARTwORkSiZe: 279.4mmx215.9mm dATe: 23.08.12
87ChARTeRhOUSeSTReeT•LONdONeC1M6hJ•TeL+44(0)2073241060
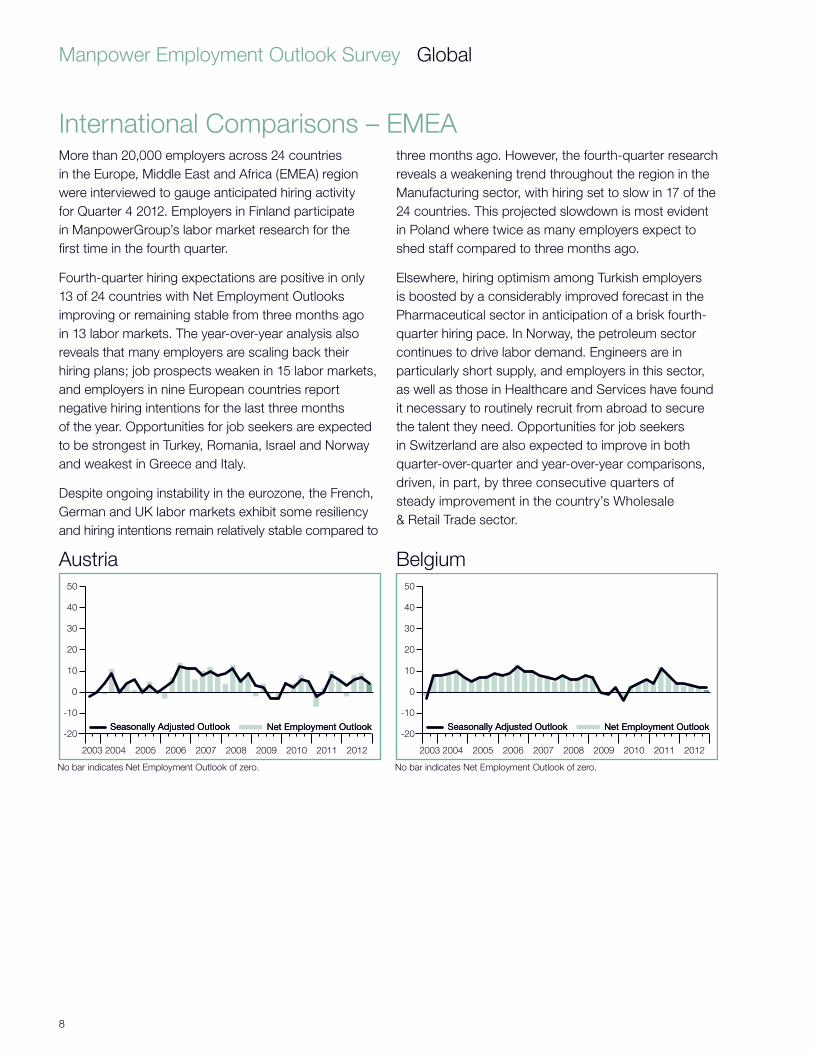
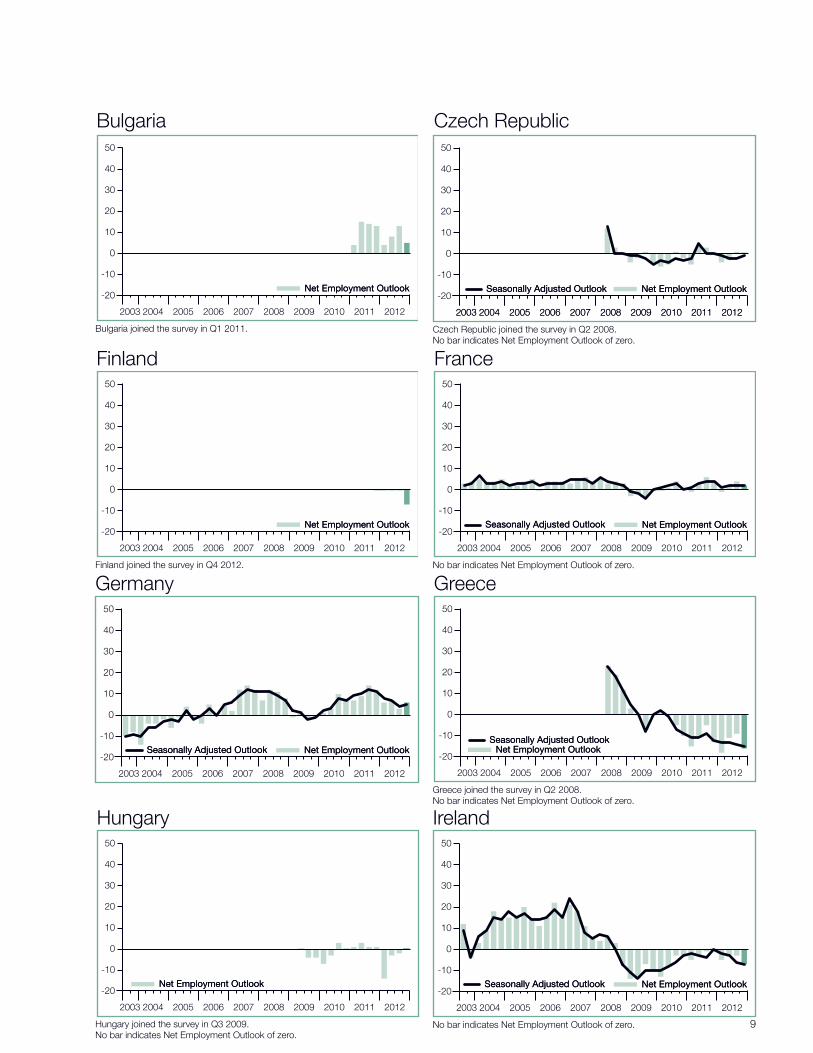
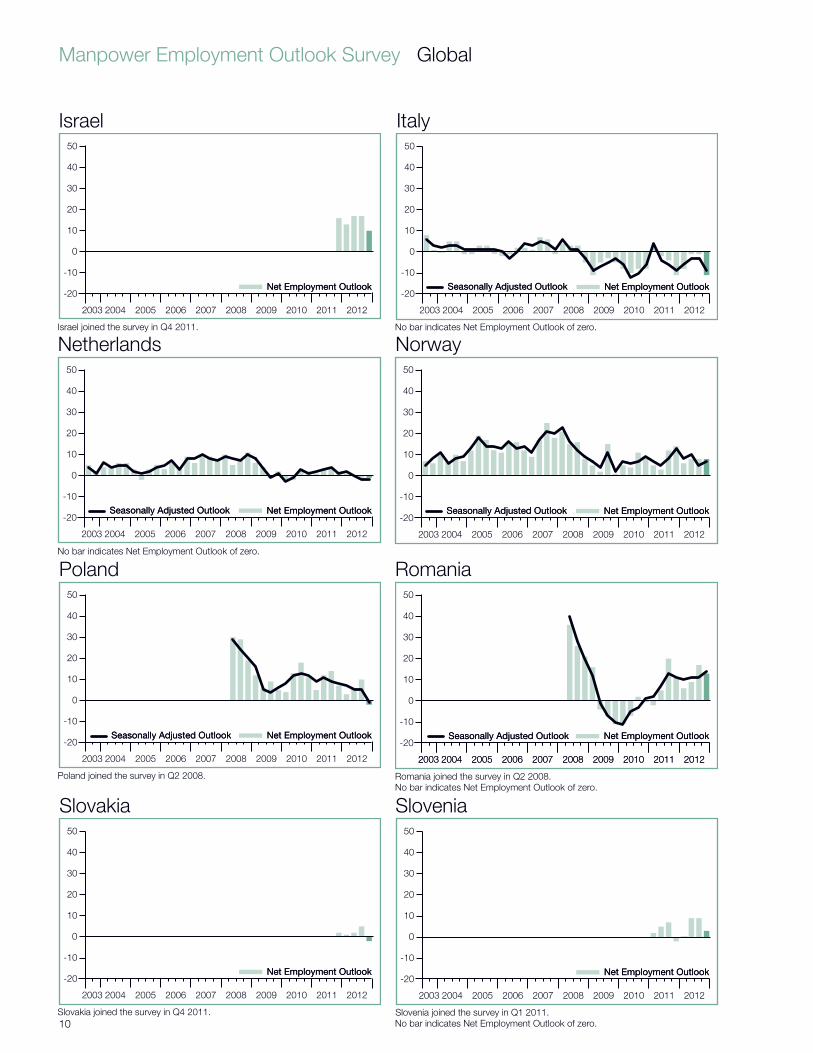
More than 20,000 employers across 24 countries in the Europe, Middle East and Africa (EMEA) region were interviewed to gauge anticipated hiring activity for Quarter 4 2012. Employers in Finland participate in ManpowerGroup’s labor market research for the first time in the fourth quarter.
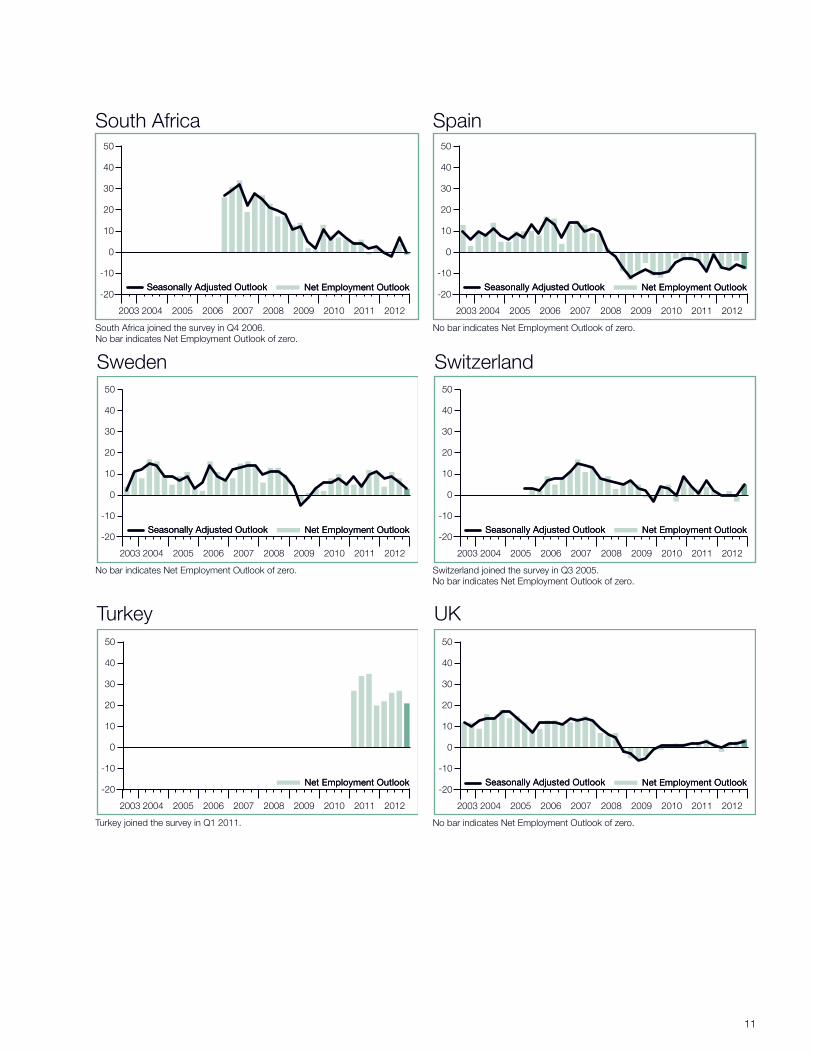
Fourth-quarter hiring expectations are positive in only 13 of 24 countries with Net Employment Outlooks improving or remaining stable from three months ago in 13 labor markets. The year-over-year analysis also reveals that many employers are scaling back their hiring plans; job prospects weaken in 15 labor markets, and employers in nine European countries report negative hiring intentions for the last three months of the year. Opportunities for job seekers are expected to be strongest in Turkey, Romania, Israel and Norway and weakest in Greece and Italy.
Despite ongoing instability in the eurozone, the French, German and UK labor markets exhibit some resiliency and hiring intentions remain relatively stable compared to
International Comparisons – EMEAthree months ago. However, the fourth-quarter research reveals a weakening trend throughout the region in the Manufacturing sector, with hiring set to slow in 17 of the 24 countries. This projected slowdown is most evident in Poland where twice as many employers expect to shed staff compared to three months ago.
Elsewhere, hiring optimism among Turkish employers is boosted by a considerably improved forecast in the Pharmaceutical sector in anticipation of a brisk fourth-quarter hiring pace. In Norway, the petroleum sector continues to drive labor demand. Engineers are in particularly short supply, and employers in this sector, as well as those in Healthcare and Services have found it necessary to routinely recruit from abroad to secure the talent they need. Opportunities for job seekers in Switzerland are also expected to improve in both quarter-over-quarter and year-over-year comparisons, driven, in part, by three consecutive quarters of steady improvement in the country’s Wholesale & Retail Trade sector.
Austria50
40
30
20
10
0
-10
-20
No bar indicates Net Employment Outlook of zero.
Seasonally Adjusted OutlookSeasonally Adjusted Outlook Net Employment OutlookNet Employment Outlook
2003 2004 2005 2006 2007 2008 2009 2010 2011 2012
Belgium50
40
30
20
10
0
-10
-20
No bar indicates Net Employment Outlook of zero.
Seasonally Adjusted OutlookSeasonally Adjusted Outlook Net Employment OutlookNet Employment Outlook
2003 2004 2005 2006 2007 2008 2009 2010 2011 2012
9
SMARTJOBNO: 05380 ediTiON: Quarter42012
CLieNT: manpower
SUBJeCT: meosglobalQ412–usletter–4colour
SiZe: usletter
dOCNAMe: 05380mpcp_global_us_4col_Q412 PAGe: 9
ARTwORkSiZe: 279.4mmx215.9mm dATe: 23.08.12
87ChARTeRhOUSeSTReeT•LONdONeC1M6hJ•TeL+44(0)2073241060
Bulgaria
Bulgaria joined the survey in Q1 2011.
Net Employment OutlookNet Employment Outlook
2003 2004 2005 2006 2007 2008 2009 2010 2011 2012
50
40
30
20
10
0
-10
-20
Czech Republic
Czech Republic joined the survey in Q2 2008.No bar indicates Net Employment Outlook of zero.
Net Employment OutlookNet Employment Outlook
2003 2004 2005 2006 2007 2008 2009 2010 2011 2012
50
40
30
20
10
0
-10
-20Seasonally Adjusted OutlookSeasonally Adjusted Outlook
2003 2004 2005 2006 2007 2008 2009 2010 2011 2012
Finland
Finland joined the survey in Q4 2012.
Net Employment OutlookNet Employment Outlook
2003 2004 2005 2006 2007 2008 2009 2010 2011 2012
50
40
30
20
10
0
-10
-20
France
No bar indicates Net Employment Outlook of zero.
Seasonally Adjusted OutlookSeasonally Adjusted Outlook Net Employment OutlookNet Employment Outlook
2003 2004 2005 2006 2007 2008 2009 2010 2011 2012
50
40
30
20
10
0
-10
-20
Germany50
40
30
20
10
0
-10
-20Seasonally Adjusted OutlookSeasonally Adjusted Outlook Net Employment OutlookNet Employment Outlook
2003 2004 2005 2006 2007 2008 2009 2010 2011 2012
Hungary50
40
30
20
10
0
-10
-20
Hungary joined the survey in Q3 2009.No bar indicates Net Employment Outlook of zero.
Net Employment OutlookNet Employment Outlook
2003 2004 2005 2006 2007 2008 2009 2010 2011 2012
Greece50
40
30
20
10
0
-10
-20
Greece joined the survey in Q2 2008.No bar indicates Net Employment Outlook of zero.
Net Employment OutlookNet Employment Outlook
2003 2004 2005 2006 2007 2008 2009 2010 2011 2012
Seasonally Adjusted OutlookSeasonally Adjusted Outlook
Ireland50
40
30
20
10
0
-10
-20
No bar indicates Net Employment Outlook of zero.
Seasonally Adjusted OutlookSeasonally Adjusted Outlook Net Employment OutlookNet Employment Outlook
2003 2004 2005 2006 2007 2008 2009 2010 2011 2012
Manpower Employment Outlook Survey Global
10
SMARTJOBNO: 05380 ediTiON: Quarter42012
CLieNT: manpower
SUBJeCT: meosglobalQ412–usletter–4colour
SiZe: usletter
dOCNAMe: 05380mpcp_global_us_4col_Q412 PAGe: 10
ARTwORkSiZe: 279.4mmx215.9mm dATe: 23.08.12
87ChARTeRhOUSeSTReeT•LONdONeC1M6hJ•TeL+44(0)2073241060
Romania
Romania joined the survey in Q2 2008.No bar indicates Net Employment Outlook of zero.
Net Employment OutlookNet Employment Outlook
2003 2004 2005 2006 2007 2008 2009 2010 2011 2012
50
40
30
20
10
0
-10
-20Seasonally Adjusted OutlookSeasonally Adjusted Outlook
2003 2004 2005 2006 2007 2008 2009 2010 2011 2012
Slovenia
Slovenia joined the survey in Q1 2011.
Net Employment OutlookNet Employment Outlook
2003 2004 2005 2006 2007 2008 2009 2010 2011 2012
50
40
30
20
10
0
-10
-20
No bar indicates Net Employment Outlook of zero.
Poland50
40
30
20
10
0
-10
-20
Poland joined the survey in Q2 2008.
Net Employment OutlookNet Employment Outlook
2003 2004 2005 2006 2007 2008 2009 2010 2011 2012
Seasonally Adjusted OutlookSeasonally Adjusted Outlook
Norway50
40
30
20
10
0
-10
-20Seasonally Adjusted OutlookSeasonally Adjusted Outlook Net Employment OutlookNet Employment Outlook
2003 2004 2005 2006 2007 2008 2009 2010 2011 2012
Slovakia
Slovakia joined the survey in Q4 2011.
Net Employment OutlookNet Employment Outlook
2003 2004 2005 2006 2007 2008 2009 2010 2011 2012
50
40
30
20
10
0
-10
-20
Netherlands50
40
30
20
10
0
-10
-20Seasonally Adjusted OutlookSeasonally Adjusted Outlook Net Employment OutlookNet Employment Outlook
2003 2004 2005 2006 2007 2008 2009 2010 2011 2012
No bar indicates Net Employment Outlook of zero.
Italy
No bar indicates Net Employment Outlook of zero.
Seasonally Adjusted OutlookSeasonally Adjusted Outlook Net Employment OutlookNet Employment Outlook
2003 2004 2005 2006 2007 2008 2009 2010 2011 2012
50
40
30
20
10
0
-10
-20
Israel
Israel joined the survey in Q4 2011.
Net Employment OutlookNet Employment Outlook
2003 2004 2005 2006 2007 2008 2009 2010 2011 2012
50
40
30
20
10
0
-10
-20
11
SMARTJOBNO: 05380 ediTiON: Quarter42012
CLieNT: manpower
SUBJeCT: meosglobalQ412–usletter–4colour
SiZe: usletter
dOCNAMe: 05380mpcp_global_us_4col_Q412 PAGe: 11
ARTwORkSiZe: 279.4mmx215.9mm dATe: 23.08.12
87ChARTeRhOUSeSTReeT•LONdONeC1M6hJ•TeL+44(0)2073241060
Spain50
40
30
20
10
0
-10
-20
No bar indicates Net Employment Outlook of zero.
Seasonally Adjusted OutlookSeasonally Adjusted Outlook Net Employment OutlookNet Employment Outlook
2003 2004 2005 2006 2007 2008 2009 2010 2011 2012
South Africa50
40
30
20
10
0
-10
-20
South Africa joined the survey in Q4 2006.No bar indicates Net Employment Outlook of zero.
Seasonally Adjusted OutlookSeasonally Adjusted Outlook Net Employment OutlookNet Employment Outlook
2003 2004 2005 2006 2007 2008 2009 2010 2011 2012
UK50
40
30
20
10
0
-10
-20
No bar indicates Net Employment Outlook of zero.
Seasonally Adjusted OutlookSeasonally Adjusted Outlook Net Employment OutlookNet Employment Outlook
2003 2004 2005 2006 2007 2008 2009 2010 2011 2012
Switzerland50
40
30
20
10
0
-10
-20
Switzerland joined the survey in Q3 2005.No bar indicates Net Employment Outlook of zero.
Seasonally Adjusted OutlookSeasonally Adjusted Outlook Net Employment OutlookNet Employment Outlook
2003 2004 2005 2006 2007 2008 2009 2010 2011 2012
Turkey
Turkey joined the survey in Q1 2011.
Net Employment OutlookNet Employment Outlook
2003 2004 2005 2006 2007 2008 2009 2010 2011 2012
50
40
30
20
10
0
-10
-20
Sweden50
40
30
20
10
0
-10
-20
No bar indicates Net Employment Outlook of zero.
Seasonally Adjusted OutlookSeasonally Adjusted Outlook Net Employment OutlookNet Employment Outlook
2003 2004 2005 2006 2007 2008 2009 2010 2011 2012
Manpower Employment Outlook Survey Global
12
SMARTJOBNO: 05380 ediTiON: Quarter42012
CLieNT: manpower
SUBJeCT: meosglobalQ412–usletter–4colour
SiZe: usletter
dOCNAMe: 05380mpcp_global_us_4col_Q412 PAGe: 12
ARTwORkSiZe: 279.4mmx215.9mm dATe: 23.08.12
87ChARTeRhOUSeSTReeT•LONdONeC1M6hJ•TeL+44(0)2073241060
The Manpower Employment Outlook Survey is conducted quarterly to measure employers’ intentions to increase or decrease the number of employees in their workforces during the next quarter. The survey has been running for 50 years and is one of the most trusted surveys of employment activity in the world. Various factors underpin the success of the Manpower Employment Outlook Survey:
Unique: It is unparalleled in its size, scope, longevity and area of focus.
Projective: The Manpower Employment Outlook Survey is the most extensive, forward-looking employment survey in the world, asking employers to forecast employment over the next quarter. In contrast, other surveys and studies focus on retrospective data to report on what occurred in the past.
Independent: The survey is conducted with a representative sample of employers from throughout the countries in which it is conducted. The survey participants are not derived from Manpower’s customer base.
Robust: The survey is based on interviews with nearly 66,000 public and private employers across 42 countries and territories to measure anticipated employment trends each quarter. This sample allows for analysis to be performed across specific sectors and regions to provide more detailed information.
Focused: For five decades the survey has derived all of its information from a single question.
Survey QuestionAll employers participating in the survey worldwide are asked the same question, “How do you anticipate total employment at your location to change in the three months to the end of December 2012 as compared to the current quarter?”
MethodologyThe Manpower Employment Outlook Survey is conducted using a validated methodology, in accordance with the highest standards in market research. The research team for the 42 countries and territories where the survey is currently conducted includes ManpowerGroup’s internal research team and Infocorp Ltd. The survey has been structured to be representative of each national economy. The margin of error for all national, regional and global data is not greater than +/- 3.9%.
Net Employment OutlookThroughout this report, we use the term “Net Employment Outlook.” This figure is derived by taking the percentage of employers anticipating an increase in hiring activity and subtracting from this the percentage of employers that expect to see a decrease in employment at their location in the next quarter. The result of this calculation is the Net Employment Outlook.
Seasonal AdjustmentSeasonal adjustments have been applied to the data for Argentina, Australia, Austria, Belgium, Canada, China, Colombia, Costa Rica, the Czech Republic, France, Germany, Greece, Guatemala, Hong Kong, India, Ireland, Italy, Japan, Mexico, Netherlands, New Zealand, Norway, Peru, Poland, Romania, Singapore, South Africa, Spain, Sweden, Switzerland, Taiwan, the United Kingdom and the United States to provide additional insight into the survey data. These adjustments make it possible to review the data without the employment fluctuations that normally occur at the same time each year, thus providing a clearer picture of the data over time. ManpowerGroup intends to add seasonal adjustments to the data for other countries in the future, as more historical data is compiled. Note that in Quarter 2 2008, ManpowerGroup adopted the TRAMO-SEATS method of seasonal adjustment for data.
About the Survey
SMARTJOBNO: 05380 ediTiON: Quarter42012
CLieNT: manpower
SUBJeCT: meosglobalQ412–usletter–4colour
SiZe: usletter
dOCNAMe: 05380mpcp_global_us_4col_Q412 PAGe: 13
ARTwORkSiZe: 279.4mmx215.9mm dATe: 23.08.12
87ChARTeRhOUSeSTReeT•LONdONeC1M6hJ•TeL+44(0)2073241060
History of the Survey1962 First generation of the Manpower Employment Outlook
Survey launched in the United States and Canada.
1966 ManpowerGroup’s United Kingdom operation launches the equivalent of the United States survey, naming the report the Quarterly Survey of Employment Prospects. The survey adopts the same forward-looking research format as the United States survey and is the first of its kind in Europe.
1976 Second generation of the Manpower Employment Outlook Survey launched in the United States and Canada. Research methodology is updated to evolve with advancements in the field of market research.
2002 ManpowerGroup United Kingdom’s Quarterly Survey of Employment Prospects is updated to adopt an enhanced research methodology. ManpowerGroup’s operations in Mexico and Ireland launch the survey in their respective countries.
2003 Third generation of the Manpower Employment Outlook Survey is launched, expanding the program to a total of 18 countries and territories worldwide: Australia, Austria, Belgium, Canada, France, Germany, Hong Kong, Ireland, Italy, Japan, Mexico, Netherlands, Norway, Singapore, Spain, Sweden, the United Kingdom and the United States.
2004 ManpowerGroup operations in New Zealand launch the Manpower Employment Outlook Survey.
2005 ManpowerGroup operations in China, India, Switzerland and Taiwan launch the Manpower Employment Outlook Survey.
2006 ManpowerGroup operations in Costa Rica, Peru and South Africa join the survey program. Surveys in Australia, Austria, Belgium, France, Germany, Hong Kong, Ireland, Italy, Japan, Mexico, Netherlands, Norway, Singapore, Spain and Sweden add seasonally adjusted data in the third quarter.
2007 ManpowerGroup operations in Argentina launch the Manpower Employment Outlook Survey. The survey in New Zealand adds seasonally adjusted data in the first quarter.
2008 ManpowerGroup operations in Colombia, the Czech Republic, Greece, Guatemala, Poland and Romania join the survey program. China and Taiwan add seasonally adjusted data in the second quarter. India and Switzerland add seasonally adjusted data in the third quarter.
2009 ManpowerGroup operations in Hungary and Brazil launch the Manpower Employment Outlook Survey.
2010 ManpowerGroup’s Panama operation launches the Manpower Employment Outlook Survey, expanding the program total to 36 countries and territories worldwide. Peru adds seasonally adjusted data in the second quarter. Costa Rica adds seasonally adjusted data in the fourth quarter.
2011 Beginning in the first quarter, operations in Bulgaria, Slovenia and Turkey join the Manpower Employment Outlook Survey. Additionally, seasonally adjusted data is added in the first quarter for Argentina and South Africa. Israel and Slovakia launch the Manpower Employment Outlook Survey in the fourth quarter.
2012 Beginning in the second quarter, ManpowerGroup operations in the Czech Republic, Greece, Guatemala, Poland and Romania initiate reporting of seasonally adjusted data. ManpowerGroup’s operation in Finland joins the survey in the fourth quarter. Seasonal variations are also removed from Colombian data for the first time.
About ManpowerGroupTM
ManpowerGroup™ (NYSE: MAN), the world leader in innovative workforce solutions, creates and delivers high-impact solutions that enable our clients to achieve their business goals and enhance their competitiveness. With over 60 years of experience, our $22 billion company creates unique time to value through a comprehensive suite of innovative solutions that help clients win in the Human Age. These solutions cover an entire range of talent-driven needs from recruitment and assessment, training and development, and career management, to outsourcing and workforce consulting. ManpowerGroup maintains the world's largest and industry-leading network of nearly 3,900 offices in over 80 countries and territories, generating a dynamic mix of an unmatched global footprint with valuable insight and local expertise to meet the needs of its 400,000 clients per year, across all industry sectors, small and medium-sized enterprises, local, multinational and global companies. By connecting our deep understanding of human potential to the ambitions of clients, ManpowerGroup helps the organizations and individuals we serve achieve more than they imagined—because their success leads to our success. And by creating these powerful connections, we create power that drives organizations forward, accelerates personal success and builds more sustainable communities. We help power the world of work. The ManpowerGroup suite of solutions is offered through ManpowerGroup™ Solutions, Manpower®, Experis™ and Right Management®. Learn more about how ManpowerGroup can help you win in the Human Age at www.manpowergroup.com.

SMARTJOBNO: 05380 ediTiON: Quarter42012
CLieNT: manpower
SUBJeCT: meosglobalQ412–usletter–4colour
SiZe: usletter
dOCNAMe: 05380mpcp_global_us_4col_Q412 PAGe: 14
ARTwORkSiZe: 279.4mmx215.9mm dATe: 23.08.12
87ChARTeRhOUSeSTReeT•LONdONeC1M6hJ•TeL+44(0)2073241060
ManpowerGroup, 100 Manpower Place, Milwaukee, WI 53212, USATel: +1 414 906 1000www.manpowergroup.com
© 2012, ManpowerGroup. All rights reserved.