Embed Size (px)
Citation preview

www.personagraph.com | © 2013-2015 Personagraph Corporation, an Intertrust company. All rights reserved.
Time spent on mobile skyrockets ..................1
Brand budgets low at 8%, study reveals 16% should be optimized for mobile ............2
First mover advantage is a reported market cap impact of $3.9 billion...................4
Retail spotlight: Path to purchase conversions high on mobile .............................5
Data spotlight: Audience segmentation......7
Tools for mobile: Programmatic data platform ...........................9
Marketers show strong interest in programmatic.................................................10
Mobile creatives: Merging art and science .................................11
Dear Reader,
Welcome to the third quarterly report by Personagraph
We are pleased to be an industry leader in audience data and programmatic, and to deliver trending
information on how to leverage data for your mobile business. We work with brand advertisers,
media agencies, publishers and other constituents who require a powerful data platform to segment
custom audiences.
This quarter, we track the maturation point for the entry of brand dollars on mobile. If publishers are
to survive what we dubbed “the cold winter” at GamesBeat 2015, then new revenue streams must
be sought. The problem is clear: brands have been timid to enter the space with single digit
allocations for mobile hovering at 8%. We dig deep to answer hard questions on why a budget
adjustment to 16% is more appropriate considering time spent on this device.
54% of consumers researched products on their mobile device before making a purchase decision,
a 59% increase year-on-year. Meanwhile, 86% of consumers say they are likely to discover new
brands or products using their mobile device.
According to a 2015 MMA Case study, the first mover advantage for a brand advertiser is a $3.9
billion market cap opportunity. With the stakes high for these demand partners, publishers will also
not want to be late to embrace audience segments.
By dollars and cents, this is our most exciting quarterly report yet – we hope you enjoy it!
Beth KindigProduct Evangelist, Personagraph
Table of Contents
How to Survive the Maturation
of Mobile Games: Beth Kindig
at GamesBeat 2015

www.personagraph.com | © 2013-2015 Personagraph Corporation, an Intertrust company. All rights reserved. 1
Time spent on mobile skyrocketsIn the last two years, time on mobile has skyrocketed, adding over an hour to screen consumption; and
now totaling more time spent than television. In 2012, the average daily use on mobile was clocked at 1
hour and 49 minutes compared to 2 hours and 57 minutes today. Power users are reportedly spending
an average of 3 hours and 30 minutes on mobile, whereas Millennials are spending a whopping 5 hours
and 12 minutes per day on the device. With this magnitude of screen consumption and global device
ubiquity, brand advertisers are preparing to embrace the digital migration of audiences. We will take
a look at how brand budgets are faring in the next section, which are quite low, however, it is easy to
predict mobile will be the dominating force in both technology and ad dollars as we move through the
next five years of maturation.
Q1 2013 Q1 2014Q1 2012 Q3 2014100
110
120
130
140
150
160
170
180
190Mobile Television
Time Spent on Mobile Devices and TV1
US Daily Average
Sources: 1Flurry Analytics, Comscore, US Bureau of Labor Statistics
1 hr.49 min.
2 hrs 48 min
2 hrs 48 min
2 hrs38 min
2 hrs42 min
2 hrs57 min
2 hrs 48 min
2 hrs 48 min

www.personagraph.com | © 2013-2015 Personagraph Corporation, an Intertrust company. All rights reserved. 2
Brand budgets low at 8%, study reveals 16% should be optimized for mobileMobile consumers have left brands behind with the adoption of mobile. With over
$30 billion reportedly missing in ad dollars, we are in a full-on race for technology
and in-house talent to keep up with what will become a $200 billion global
industry by 2020. Considering mobile now commands more time than television,
the current state for better tools and technology for brand advertisers is best
reflected in the allocation of budgets with 70-80% being dedicated to television
and a mere 8% dedicated to mobile.
Case Study1
The Mobile Marketers Association followed a campaign by AT&T which used
TV, Print, Online Desktop and Mobile, where AT&T spent 93% on television
compared to 1% on mobile, as shown on the table below. (continued...)
Awareness
Consideration / Image
Purchase
Media Share
TV 93%
Print 1%
Online Desktop 5%
Mobile 1%
Source: 1Mobile Marketers Association
www.personagraph.com | © 2013-2015 Personagraph Corporation, an Intertrust company. All rights reserved. 3
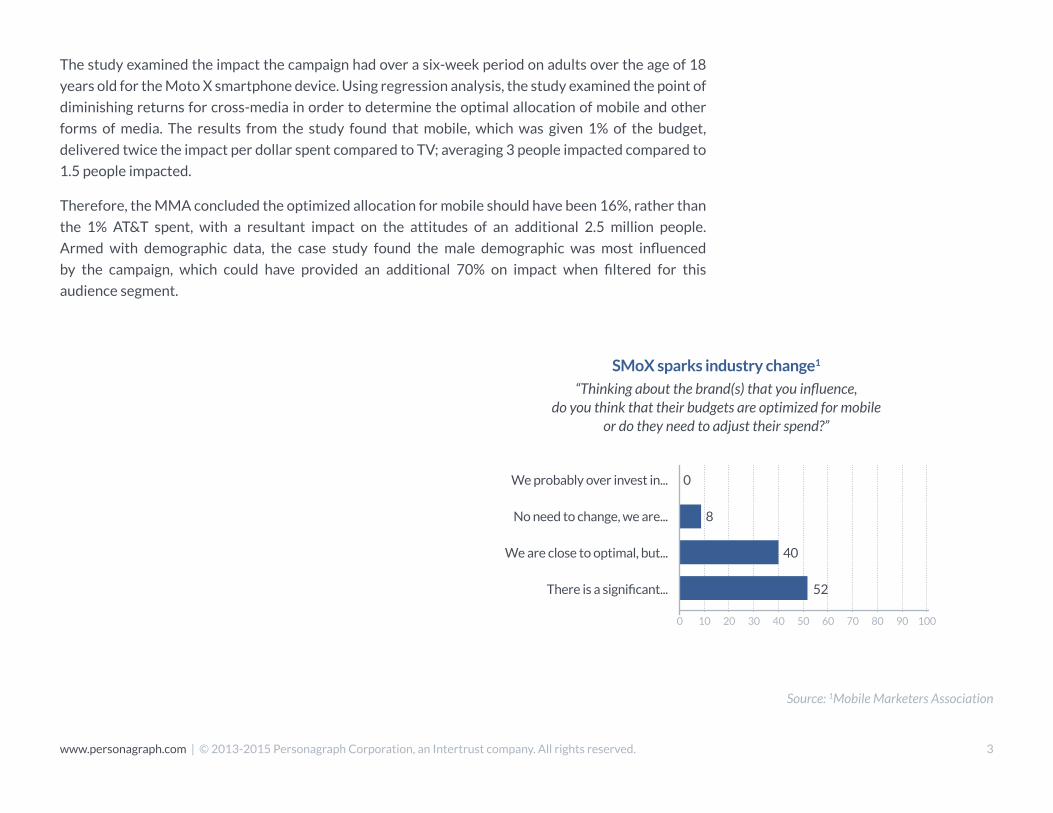
The study examined the impact the campaign had over a six-week period on adults over the age of 18
years old for the Moto X smartphone device. Using regression analysis, the study examined the point of
diminishing returns for cross-media in order to determine the optimal allocation of mobile and other
forms of media. The results from the study found that mobile, which was given 1% of the budget,
delivered twice the impact per dollar spent compared to TV; averaging 3 people impacted compared to
1.5 people impacted.
Therefore, the MMA concluded the optimized allocation for mobile should have been 16%, rather than
the 1% AT&T spent, with a resultant impact on the attitudes of an additional 2.5 million people.
Armed with demographic data, the case study found the male demographic was most influenced
by the campaign, which could have provided an additional 70% on impact when filtered for this
audience segment.
0 10 20 30 40 50 60 70 80 90 100
SMoX sparks industry change1
“Thinking about the brand(s) that you influence, do you think that their budgets are optimized for mobile
or do they need to adjust their spend?”
0
8
40
52There is a significant...
We are close to optimal, but...
No need to change, we are...
We probably over invest in...
Source: 1Mobile Marketers Association

www.personagraph.com | © 2013-2015 Personagraph Corporation, an Intertrust company. All rights reserved. 4
Auto-makers are the leading first adopters along with big box retailers, consumer-packaged goods,
quick-service restaurants and beauty brands. The first mover advantage for a marketer in these
industries has been found to be as high as $3.9 billion. The case study was for a CPG company with a
$185 billion current market cap and 2013 revenue of $43.9 billion. If the company were to allocate
$500 million to mobile spend worldwide with a 2% share shift revenue gain of $922 million, the market
cap gain would be 4.2 X $922 million, or $3.9 billion. Thus, there is a clear advantage to investing in
mobile and the technology which facilitates this medium – but most importantly, the stakes are high for
those brands who arrive first.
First mover advantage is a reported market cap impact of $3.9 billion
Does this Matter?1
Market cap impact by marketer for the first mover advantage
Using a large Consumer Goods company as
an example...
And the company’s current revenue
and market value...
Yields a material value creation
opportunity.
Move aggressively, bring mobile spend to about
$500m worldwide
Move revenue across the board by 2%
$185.28 Market Cap
2013 Revenue of $43.98
2% Share Shift Revenue Gain of $922m
MV/R = 4.2
Market Cap Gain = 4.2 x $922m
$3.9b
Source: 1Mobile Marketers Association

www.personagraph.com | © 2013-2015 Personagraph Corporation, an Intertrust company. All rights reserved. 5
Once a targeted ad reaches a mobile user, conversions are in real-time. 86% of consumers say they are
likely to discover new brands or products using their mobile device. And 54% of consumers researched
products on their mobile device before making a purchase decision, a 59% increase year-on-year. The
same conversion rate cannot be said for television, where branding is a formula of frequency and reach,
leaving little ability to measure the effectiveness in terms of purchase completions.
Location is a significant factor, with retail and
consumer packaged goods (CPG) mobile ads
performing best when delivered to consumers
within five miles of a store, while quick service
restaurant ads achieved the optimal ROI for
marketers when delivered to audiences between
five to ten miles from store branches.1
In-store marketing is still critical but mobile is
disrupting the path to purchase, placing more
pressure on real-time mobile ad response.
As products and brands compete inches from
each other in the store aisle, retail may become
the catalyst for many brands to invest in a
higher-level quality of data.
Retail spotlight: Path to purchase conversions high on mobile
2011 2012 2013 August 20142014
0
20%
40%
60%
80%
100%
Branding Brand, the leading m-commerce technology provider to merchants in the 2015 Internet Retailer Mobile 500, has measured traffic to its leading retailer clients for years. The tipping point came in August 2014, when 51% of retail traffice stemmed from smartphones and tablets.
The Ascension of Mobile Commerce2
% of retail traffic, mobile versus desktop, 2011-014, ending in August 2014
Mobile
Non-Mobile
51%
49%44%
56%
32%
68%
23%
77%
11%
89%
Sources: 1Mobile Marketing Magazine, 2Branding Brand (Sept. 2014), Internet Retailer, Direct Marketing News, comScore Inc. Jan 2015

www.personagraph.com | © 2013-2015 Personagraph Corporation, an Intertrust company. All rights reserved. 6
Brick-and-mortar retailers who have embraced mobile are among the first to readily measure the
impact of targeted ads. When following 1,500 shoppers over the course of three quarters, research has
concluded store visits shot up 80% the first day a mobile ad was run by a retailer, then tapered off to
18% above average the next day before leveling out to normal visits on day three.
Online retailers have also benefited from mobile consumption with the rise of show-rooming, the
practice of buying an item seen in-store at a cheaper price online with the aid of a mobile device.
A research study examined 461 shoppers across 11 touch points and found 75% of the store shoppers
used their mobile devices while shopping in-store, and 25% of those shoppers make a purchase.
In 2013, Internet and mobile measurement firm comScore began detecting a NW trend in e-retailing: the mobile-only shopper. By January 2015, some top retailers were seeing an explosion in customers who only access their digital properties using smartphones and tablets.
Source: 1ComScore Inc. January 2015
U.S. Shoppers Who Visit Top Retailers ONLY on Mobile Devices1
Unique Monthly Visitors, in Millions, January 2015
Total Digital Desktop Mobile Mobile-OnlyMobile-Only as %
of Total Digital
Total Digital 255,849 230,604 185,223 25,244 10%
Total Retail Digital 234,066 202,507 166,361 31,559 13%
1. Amazon.com 179,966 110,993 121,090 68,974 38%
2. eBay 122,083 68,465 81,919 53,618 44%
3. Wal-Mart 83,192 41,127 54,022 42,066 51%
4. Apple 79,065 32,405 55,079 46,660 59%
5. Netflix 67,637 47,908 34,219 19,729 29%
6. Target 50,156 23,333 31,440 26,823 53%
7. Best Buy 36,221 19,668 19,954 16,553 46%
8. Ticketmaster 33,363 13,800 21,807 19,563 59%
9. QVC 28,267 13,349 17,271 14,918 53%
10. Kohl’s 27,576 14,460 16,043 13,116 48%

www.personagraph.com | © 2013-2015 Personagraph Corporation, an Intertrust company. All rights reserved. 7
Data spotlight: Audience segmentationAudience segmentation, commonly found in television advertising, is rising in popularity in the mobile
space as a way to facilitate the personal nature of the device. Men and women of all ages and varying
interests are using mobile to make informed decisions, and advertisers are learning it is not a
one-size-fits-all approach. For a targeted mobile campaign to succeed in the 2 billion plus smartphone
ecosystem, the first step for serious brand advertisers is to understand target audiences including how and why they are engaging with the mobile device. These data points lead to the who – the person the
ad is targeting – which are the insights necessary to nurture larger brand budgets.
Male Female
Source: 1xAd, Inc. "Mobile Path to Purchase 2014"
Male Gen X
• Sports tickets
• Video Games
• Movie Tickets
• Car Parts
• New Cars
• Oil Change
• Festivals/Events
• Audio Books
• TV/Movie Downloads
• Music Downloads
• Concert Tickets
• Used Cars
• Car Service
Female Millennial
Sample Profiling1
by gender/category
48%52%
ENTERTAINMENT
39%61%
AUTOMOTIVE
Gender:
• Men spend most time on
mobile overall, but women
tend to spend more time
on each visit.
• Women engage with
mobile more frequently
at home while men use
their devices on the
go and to complete
transactions in person.
Age:
• GenX and Millennials
spend the most time on
mobile, hovering around
5 hours per day.
• For purchase decisions,
price drives Millennials
whereas brand motivates
older demographics.

www.personagraph.com | © 2013-2015 Personagraph Corporation, an Intertrust company. All rights reserved. 8
According to eMarketer, audience segments are the #1 priority of digital marketers with respondents
citing the need to create campaigns with a deeper understanding of audiences. Among advertisers,
auto-makers are the earliest adopters of audience segmentation at 49%, followed by big box retailers at
18%, quick service restaurants at 12% of requests, 11% consumer packaged goods, 8% beauty brand
and 2% health. The segments they are requesting are tech enthusiasts at 48%, ethnicity at 25%, fast
food consumers at 12%, auto intenders at 7%, income at 3%, gender at 3% and sports enthusiasts at 2%.
The current research proves that there is a large demand for this data beyond basic demographics of
age and income for targeted campaigns, with intent to purchase and ethnic background being the
dominant inquiries.
Audience-Targeted Mobile Programmatic Benchmark1
Who is Buying Audience-Targeted Mobile Programmatic?
Automotive brands were the greatest early adopters of audience-targeted mobile programmatic ads, making up 49% of total ad impressions.
Almost half of audience
segments targeted by mobile
programmatic campaigns
were tech enthusiasts (48%)
Advertisers were more than 8X as likely
to target audiences based on ethnicity
(25%) than income (3%) or gender (3%)
in their mobile programmatic ads.
Most Popular MobileProgrammatic Audience Segments
Sources: 1NinthDecimal 2015,2“Marin Software / 2015 Digital Marketers Census” Dec. 16, 2014
Top 5 Priorities for 2015 According to Digital Marketers
in the UK and US 2
% of respondents
51%
50%
46%
44%
33%
1. Creating campaigns based on deeper understanding of audiences
2. Cross-channel digital marketing
3. Better integration of online and offline marketing efforts
4. Better integration of digital marketing disciplines
5. Investing in more sophisticated technology to gain and act on insights about customers
48%
25%
12%
7%
Auto Intenders
Fast Food Consumers
(3%) Income
(3%) Gender(2%) Sports Enthusiasts
Tech Enthusiasts
Ethnicity
Auto
Big Box Retailer
49%
18%
12%
11%
8%
2% HealthBeauty
CPG
QSR
www.personagraph.com | © 2013-2015 Personagraph Corporation, an Intertrust company. All rights reserved. 9
Source: 1LUMA Partners, using eMarketer data
Tools for mobile: Programmatic data platform Brands who embrace mobile, and recognize its strength for speed and targeting accuracy will be able to harness the moments it can create. For
instance, with geo-targeting combined with programmatic, it’s possible to send messages based on where a customer is located within a store. If you
are a consumer packaged goods brand, such as cereal or snack food, imagine delivering a coupon to a customer while they’re standing directly in front
of your product.
The goal of advertising is to have the right audience at the right place, but in a way that is seamless with the experience of the customer at that very
moment. When this is accomplished, brands will drive an exponentially larger and deeper impact on core customers.
To accomplish this, data must be introduced at campaign inception, and be the driving force behind what inventory is bought and traded. By bringing
data into the process far earlier, it will help direct creatives, and ultimately bridge programmatic trading.
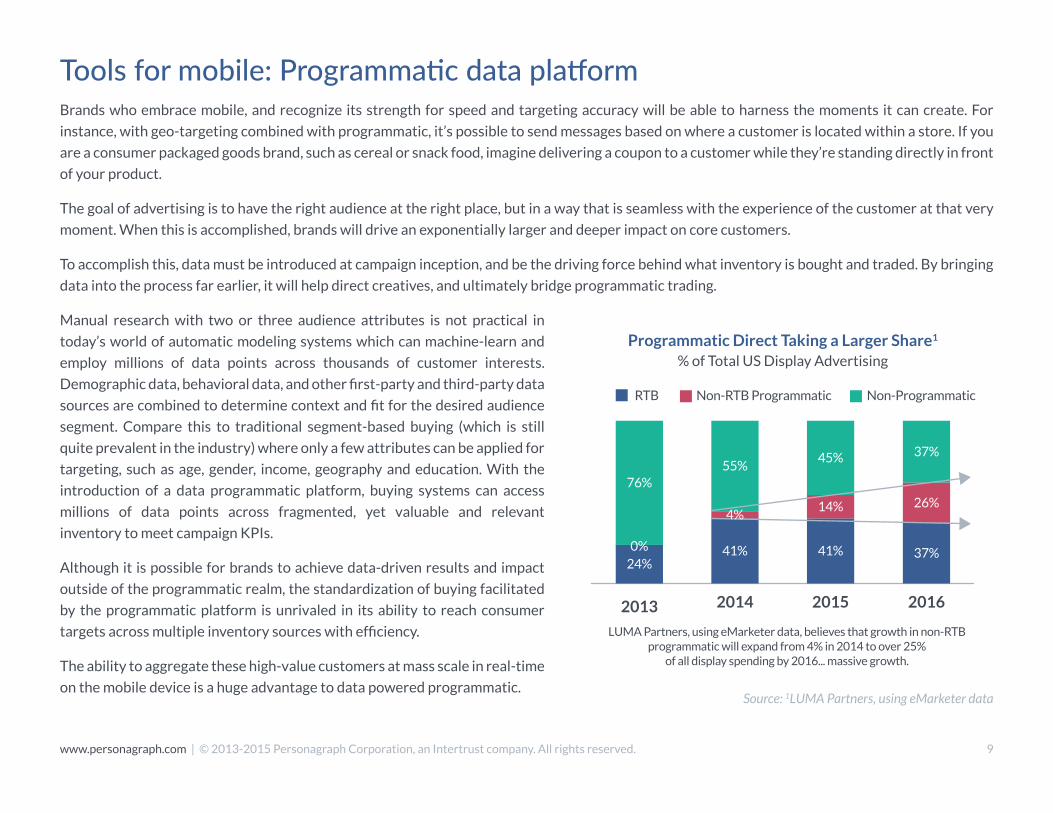
Manual research with two or three audience attributes is not practical in
today’s world of automatic modeling systems which can machine-learn and
employ millions of data points across thousands of customer interests.
Demographic data, behavioral data, and other first-party and third-party data
sources are combined to determine context and fit for the desired audience
segment. Compare this to traditional segment-based buying (which is still
quite prevalent in the industry) where only a few attributes can be applied for
targeting, such as age, gender, income, geography and education. With the
introduction of a data programmatic platform, buying systems can access
millions of data points across fragmented, yet valuable and relevant
inventory to meet campaign KPIs.
Although it is possible for brands to achieve data-driven results and impact
outside of the programmatic realm, the standardization of buying facilitated
by the programmatic platform is unrivaled in its ability to reach consumer
targets across multiple inventory sources with efficiency.
The ability to aggregate these high-value customers at mass scale in real-time
on the mobile device is a huge advantage to data powered programmatic.
Programmatic Direct Taking a Larger Share1
% of Total US Display Advertising
LUMA Partners, using eMarketer data, believes that growth in non-RTB programmatic will expand from 4% in 2014 to over 25%
of all display spending by 2016... massive growth.
RTB Non-RTB Programmatic Non-Programmatic
2013 2014 2015 2016
24%0%
76%
41%
4%
55%
41%
14%
45%
37%
26%
37%

www.personagraph.com | © 2013-2015 Personagraph Corporation, an Intertrust company. All rights reserved. 10
Marketers show strong interest in programmatic Marketers indicate a strong interest in mobile programmatic with 41% agreeing it will help them reach
target audiences. However, only a small percentage buy mobile inventory programmatically today: 18%
on private exchanges and 17% on open exchanges (source: IAB).
Most desktop marketers are aware of what programmatic’s efficacy could do for mobile given its
success in the online environment, however, there has been doubt about the technical limitations of a
cookie-less environment. With this largely now solved for, with IDFAs, UDIDs, PIIs, lookalikes, and
device fingerprinting, programmatic is expected to claim 1/3 of all US digital ad spend by 2016.
Source: 1eMarketer, Oct 2014
2013 2014 20162015
$2.92 $5.62 $6.26$6.52
- 92.9% -3.9%15.9%
68.7% 55.9% 30.7%43.8%
US Programmatic Digital Display Ad Spending by Device, 2013-20161
Billions, % change and % of total programmatic digital display ad spending
Desktop/laptop
—% change
—% of total programmatic digital display ad spending
$1.33 $4.44 $14.15$8.36
Note: Digital display ads transacted via an API, including everything from publisher-erected APIsto more standardized RTB technology; *ad spending on tablets is included.
- 234.3% 69.2%88.4%
31.3% 44.1% 69.3%56.2%
—% change
—% of total programmatic digital display ad spending
Mobile*

www.personagraph.com | © 2013-2015 Personagraph Corporation, an Intertrust company. All rights reserved. 11
“Even the most siloed creative sitting comfortably
under a rock has to bring data, and the insights that it provides, into their work to survive in the
business of selling things.”–Cannes Lions Jury
Mobile creatives: Merging art and scienceSpecs and standards may seem at odds with creativity, however, the word “mobile advertising” is a
complex reality burdened by a host of different devices, operating systems, and form factors, all of
which impact the creative process.
Most mobile video creative resembles TV-commercials with 15 or 30 second duration. However, there
are a few key things brands should consider when planning mobile video creatives1:
• Duration
Marketers should restrict creative length to 15 seconds or less.
• Orientation
Vertical video ad formats are relatively new and undergoing experimentation, however, the
early results are encouraging with some brands reporting completion rates 80% higher than
industry benchmarks. Some publishers offer ad formats that run as a banner on a device/app
in portrait mode, with a call to action that changes to landscape. Due to apps responding
differently to orientation changes, locking the orientation is advisable so that a viewer’s
experience is not disrupted.
• Interactive Elements
Interactive elements are not generally supported due to lack of support for creatives that play
in the native player on the device and are spotty for in-browser video.
• Companion banners and leave-behinds
Similar to interactive elements, companion banners and static units are not necessarily
common or effective in the mobile world today. However, there are some static skins which
wrap the video frame and help to reinforce the brand.
Download our Q2 Report
with indepth coverage of
mobile video metrics, including
CPI, CPC, CPCV and GRP
Source: 1Interactive Advertising Bureau

© 2013-2015 Personagraph Corporation, an Intertrust company. All rights reserved.
Conclusion
Thank you for reading our Q3 2015 report. At Personagraph, we are solving the mobile industry’s
biggest challenge by delivering data for all major constituents to reach their audience: advertiser, media
buyer and publisher. This level of data is the best choice for brands who need to reach their audience
and for publishers who want to open their inventory to the sustaining revenue stream of brand dollars
that awaits.
In 2015, a data programmatic platform equipped for mobile is essential for your company to succeed. If
you would like to learn more on how Personagraph can help you effectively reach your audience and
meet advertising KPIs, please contact us at: [email protected] for a demo.
Media Contacts
Beth Kindig
(415) 500-5637
Personagraph USA Headquarters920 Stewart Drive, Suite 100, Sunnyvale, CA 94085
+1 (408) [email protected] | [email protected] | [email protected]
www.personagraph.com