Embed Size (px)
Citation preview

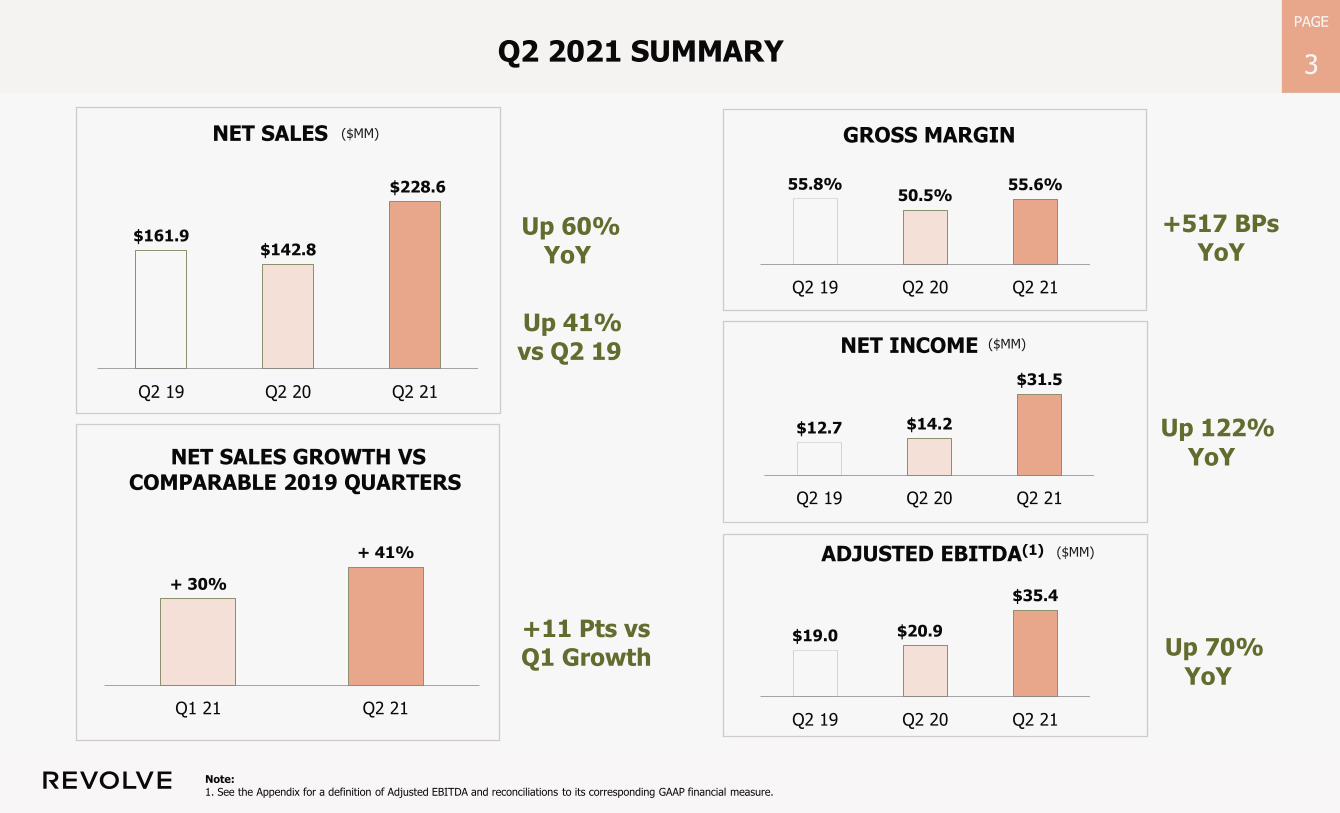
Q2 2021 FINANCIAL HIGHLIGHTS
August 4, 2021
PAGE
2
PAGE
1
PAGE
2
Note on Forward-Looking Statements
Information in this presentation contains forward-looking statements as defined within the meaning of U.S. federal securities laws, including, but not limited to, statements regarding our expectations around the continued impact of the COVID-19 pandemic on our business, operations and financial results. Forward-looking statements include all statements that are not historical facts and can be identified by terms such as “anticipate,” “believe,” “contemplate,” “continue,” “could,” “estimate,” “expect,” “intend,” “may,” “plan,” “potential,” “predict,” “project,” “should,” “target,” “will,” “would,” or similar expressions and the negatives of those terms.
Forward-looking statements are based on information available at the time those statements are made and on our current expectations and projections about future events, and are subject to risks and uncertainties. If any of these risks or uncertainties materialize or if any assumptions prove incorrect, actual performance or results may differ materially from those expressed in or suggested by the forward-looking statements. These risks and uncertainties include, without limitation, risks related to the continued impact of the COVID-19 pandemic on our business, operations and financial results; demand for our products; general economic conditions; our fluctuating operating results; seasonality in our business; our ability to acquire products on reasonable terms; our online business model; our ability to attract customers in a cost effective manner; the strength of our brand; competition; fraud; system interruptions; our ability to fulfill orders; and other risks and uncertainties included under the caption “Risk Factors” and elsewhere in our filings with the Securities and Exchange Commission, or SEC, including, without limitation, our Annual Report on Form 10-K for the year ended December 31, 2020 and our subsequent Quarterly Reports on Form 10-Q, including for the quarter ended June 30, 2021, which we expect to file with the SEC on August 5, 2021.
We undertake no obligation to update any forward-looking statements made in this presentation to reflect events or circumstances after the date of this presentation or to reflect new information or the occurrence of unanticipated events, except as required by law. We may not actually achieve the plans, intentions, or expectations disclosed in our forward-looking statements, and you should not place undue reliance on our forward-looking statements.
Unless otherwise indicated, all references in this presentation to “REVOLVE”, “we”, “our”, “us”, or similar terms refer to REVOLVE and Revolve Group, Inc. and its subsidiaries.
Use of Non-GAAP Financial Measures
In addition to U.S. GAAP financials, this presentation includes certain non-GAAP financial measures, including Adjusted EBITDA, Adjusted EBITDA margin, and free cash flow. These non-GAAP measures are in addition to, not a substitute for or superior to, measures of financial performance prepared in accordance with U.S. GAAP. The non-GAAP financial measures used by REVOLVE may differ from the non-GAAP financial measures used by other companies. We use these non-GAAP financial measures to evaluate our operating performance, generate future operating plans and make strategic decisions regarding the allocation of capital. Our management believes that these non-GAAP financial measures provide meaningful supplemental information regarding our performance and liquidity by excluding certain expenses that may not be indicative of our ongoing core operating performance. We believe that both management and investors benefit from referring to these non-GAAP financial measures in assessing our performance and when analyzing historical performance and liquidity and when planning, forecasting, and analyzing future periods.
For a reconciliation of these non-GAAP financial measures to GAAP measures, please refer to the Appendix.
PAGE
3
PAGE
1
PAGE
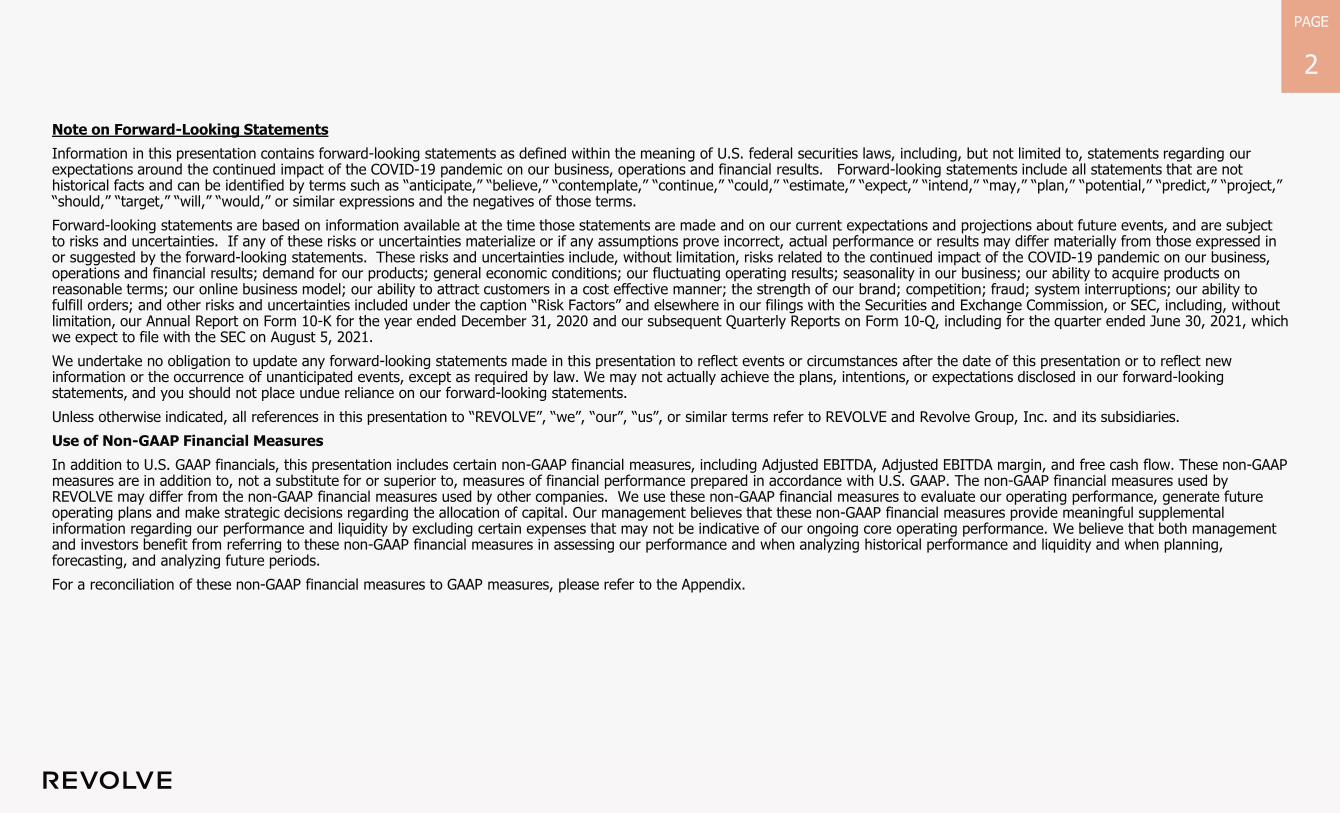
3Q2 2021 SUMMARY
NET SALES
$161.9$142.8
$228.6
Q2 19 Q2 20 Q2 21
GROSS MARGIN
NET INCOME
$12.7 $14.2
$31.5
Q2 19 Q2 20 Q2 21
$19.0 $20.9
$35.4
Q2 19 Q2 20 Q2 21
ADJUSTED EBITDA(1)
55.8%50.5%
55.6%
Q2 19 Q2 20 Q2 21
Up 60% YoY
+517 BPs YoY
Up 122%
YoY
+11 Pts vs Q1 Growth
Note:1. See the Appendix for a definition of Adjusted EBITDA and reconciliations to its corresponding GAAP financial measure.
($MM)
($MM)
($MM)
+ 30%
+ 41%
Q1 21 Q2 21
NET SALES GROWTH VS COMPARABLE 2019 QUARTERS
Up 70%
YoY
Up 41% vs Q2 19
PAGE
4
PAGE
1
PAGE
4
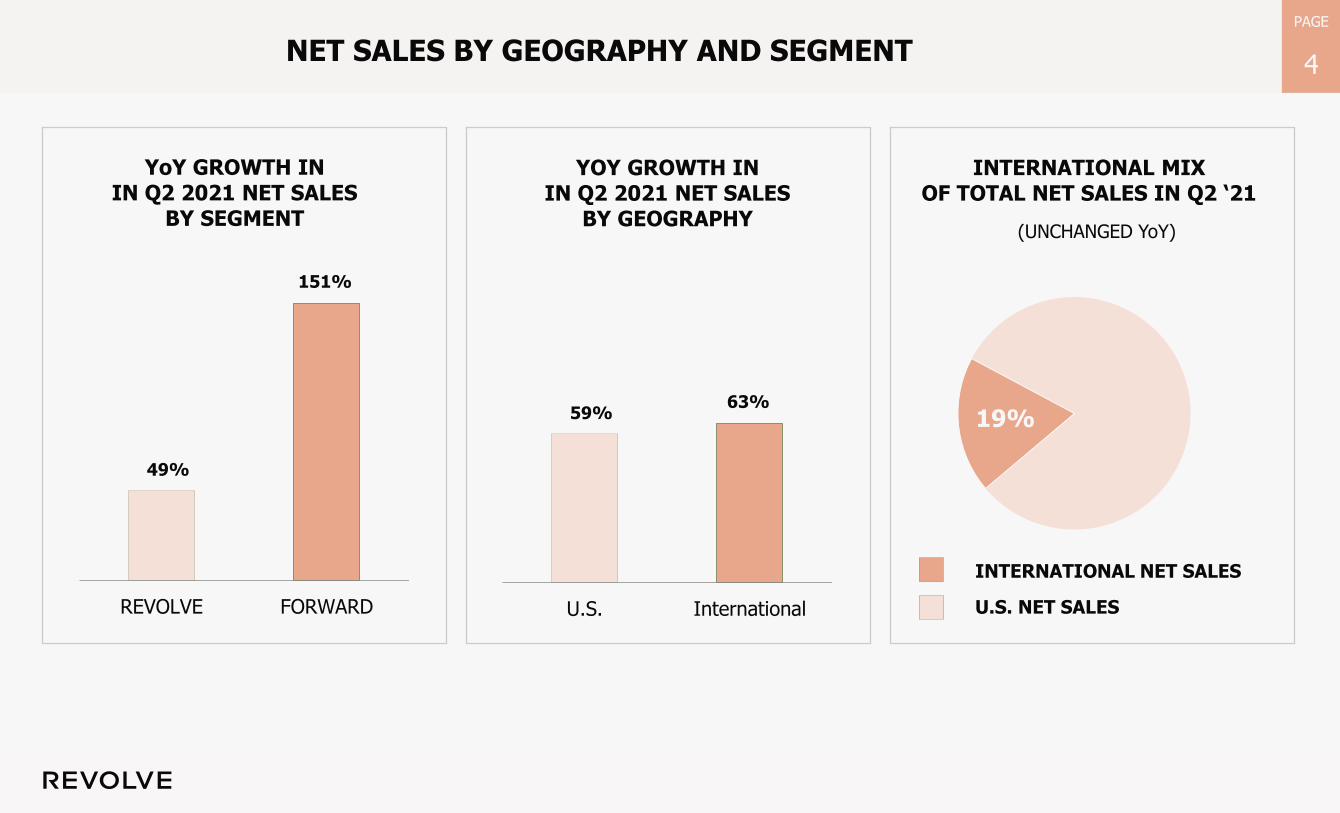
YOY GROWTH IN IN Q2 2021 NET SALES
BY GEOGRAPHY
INTERNATIONAL MIX OF TOTAL NET SALES IN Q2 ‘21
19%
U.S. NET SALES
INTERNATIONAL NET SALES
59%63%
U.S. International
NET SALES BY GEOGRAPHY AND SEGMENT
49%
151%
REVOLVE FORWARD
YoY GROWTH IN IN Q2 2021 NET SALES
BY SEGMENT(UNCHANGED YoY)
PAGE
5
PAGE
1
PAGE
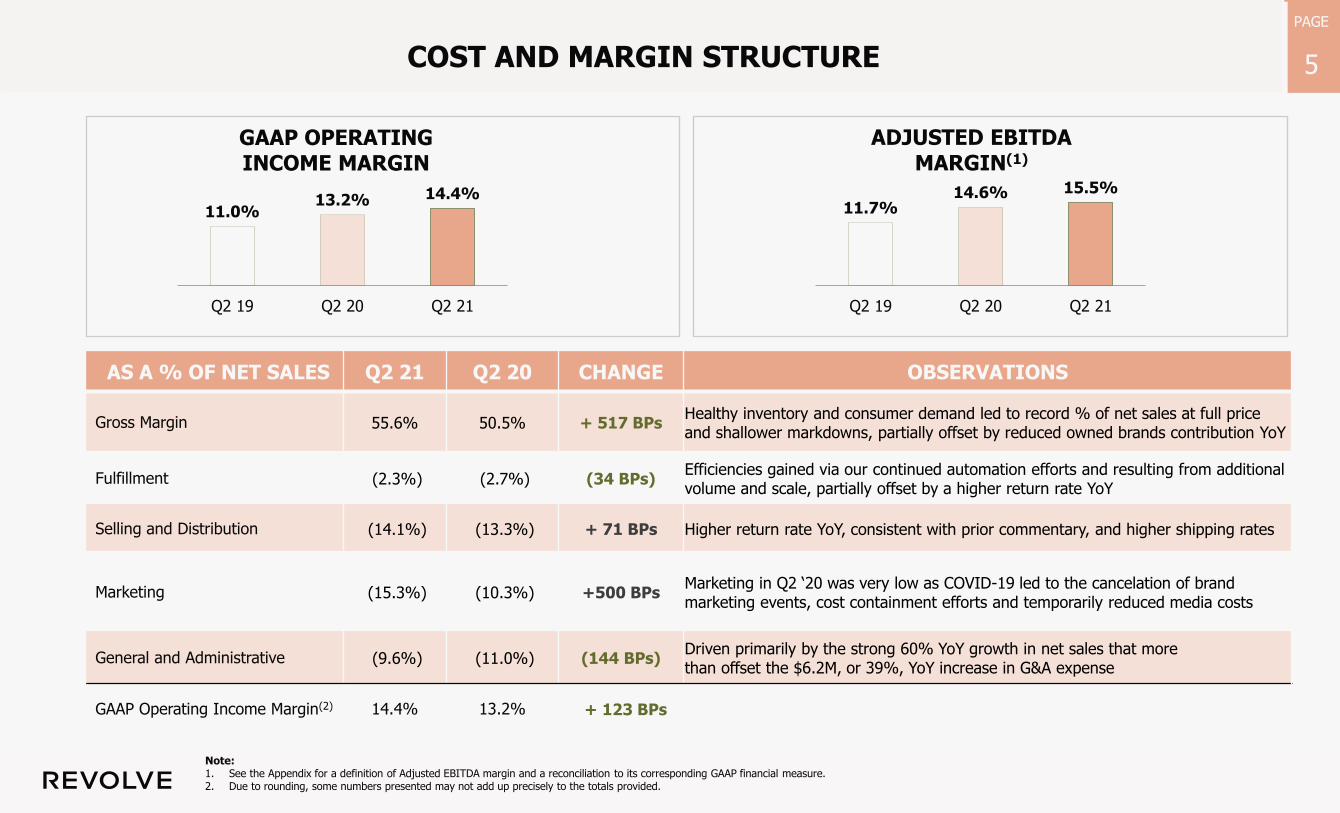
5COST AND MARGIN STRUCTURE
AS A % OF NET SALES Q2 21 Q2 20 CHANGE OBSERVATIONS
Gross Margin 55.6% 50.5% + 517 BPsHealthy inventory and consumer demand led to record % of net sales at full price and shallower markdowns, partially offset by reduced owned brands contribution YoY
Fulfillment (2.3%) (2.7%) (34 BPs)Efficiencies gained via our continued automation efforts and resulting from additional volume and scale, partially offset by a higher return rate YoY
Selling and Distribution (14.1%) (13.3%) + 71 BPs Higher return rate YoY, consistent with prior commentary, and higher shipping rates
Marketing (15.3%) (10.3%) +500 BPsMarketing in Q2 ‘20 was very low as COVID-19 led to the cancelation of brand marketing events, cost containment efforts and temporarily reduced media costs
General and Administrative (9.6%) (11.0%) (144 BPs)Driven primarily by the strong 60% YoY growth in net sales that more than offset the $6.2M, or 39%, YoY increase in G&A expense
GAAP Operating Income Margin(2) 14.4% 13.2% + 123 BPs
11.0%13.2% 14.4%
Q2 19 Q2 20 Q2 21
11.7%14.6% 15.5%
Q2 19 Q2 20 Q2 21
GAAP OPERATING INCOME MARGIN
ADJUSTED EBITDA MARGIN(1)
Note:1. See the Appendix for a definition of Adjusted EBITDA margin and a reconciliation to its corresponding GAAP financial measure.2. Due to rounding, some numbers presented may not add up precisely to the totals provided.
PAGE
6
PAGE
1
PAGE
6
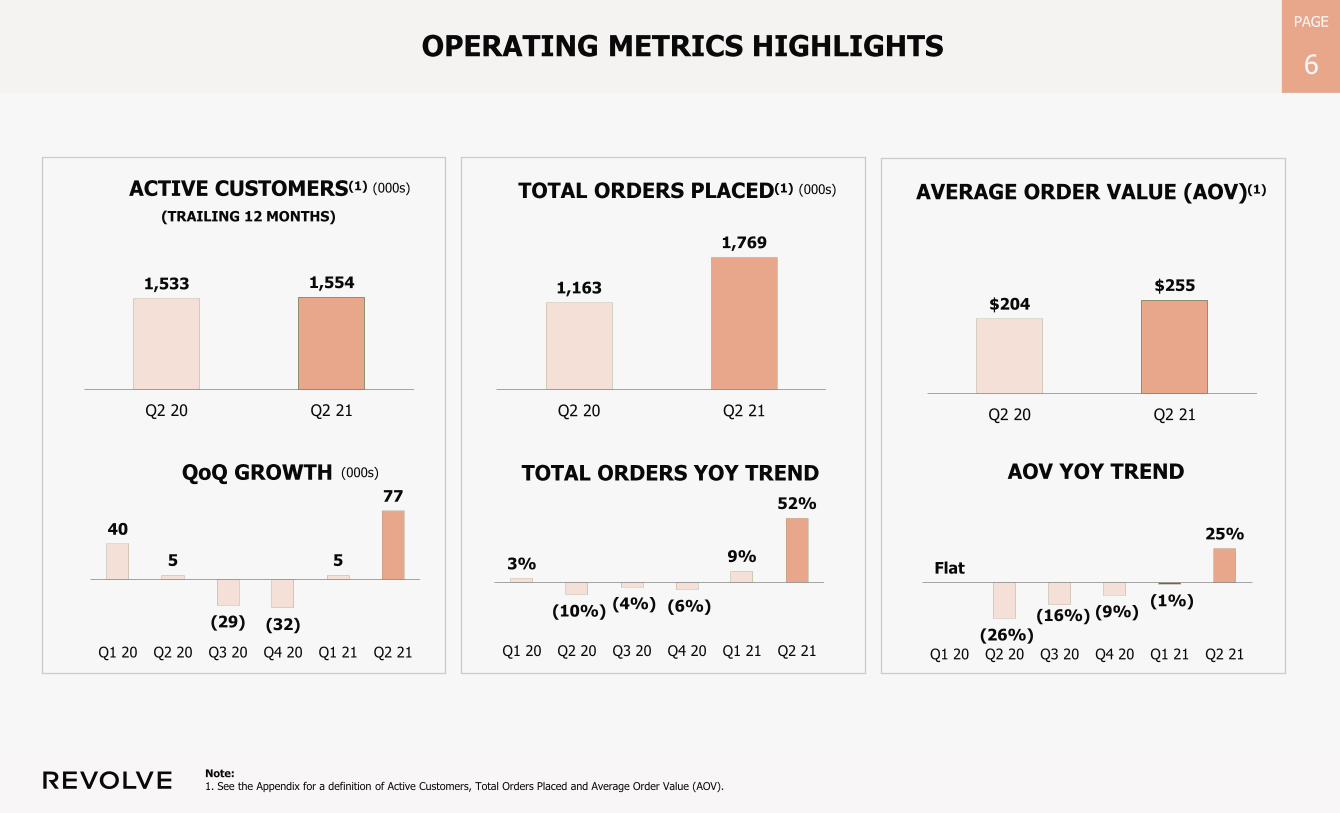
ACTIVE CUSTOMERS(1)
(TRAILING 12 MONTHS)
AVERAGE ORDER VALUE (AOV)(1)TOTAL ORDERS PLACED(1)
1,533 1,554
Q2 20 Q2 21
1,163
1,769
Q2 20 Q2 21
$204$255
Q2 20 Q2 21
(000s) (000s)
3%
(10%) (4%) (6%)
9%
52%
Q1 20 Q2 20 Q3 20 Q4 20 Q1 21 Q2 21
TOTAL ORDERS YOY TREND
Flat
(26%)
(16%) (9%)(1%)
25%
Q1 20 Q2 20 Q3 20 Q4 20 Q1 21 Q2 21
AOV YOY TRENDQoQ GROWTH
40
5
(29) (32)
5
77
Q1 20 Q2 20 Q3 20 Q4 20 Q1 21 Q2 21
Note:1. See the Appendix for a definition of Active Customers, Total Orders Placed and Average Order Value (AOV).
OPERATING METRICS HIGHLIGHTS
(000s)
PAGE
7
PAGE
1
PAGE
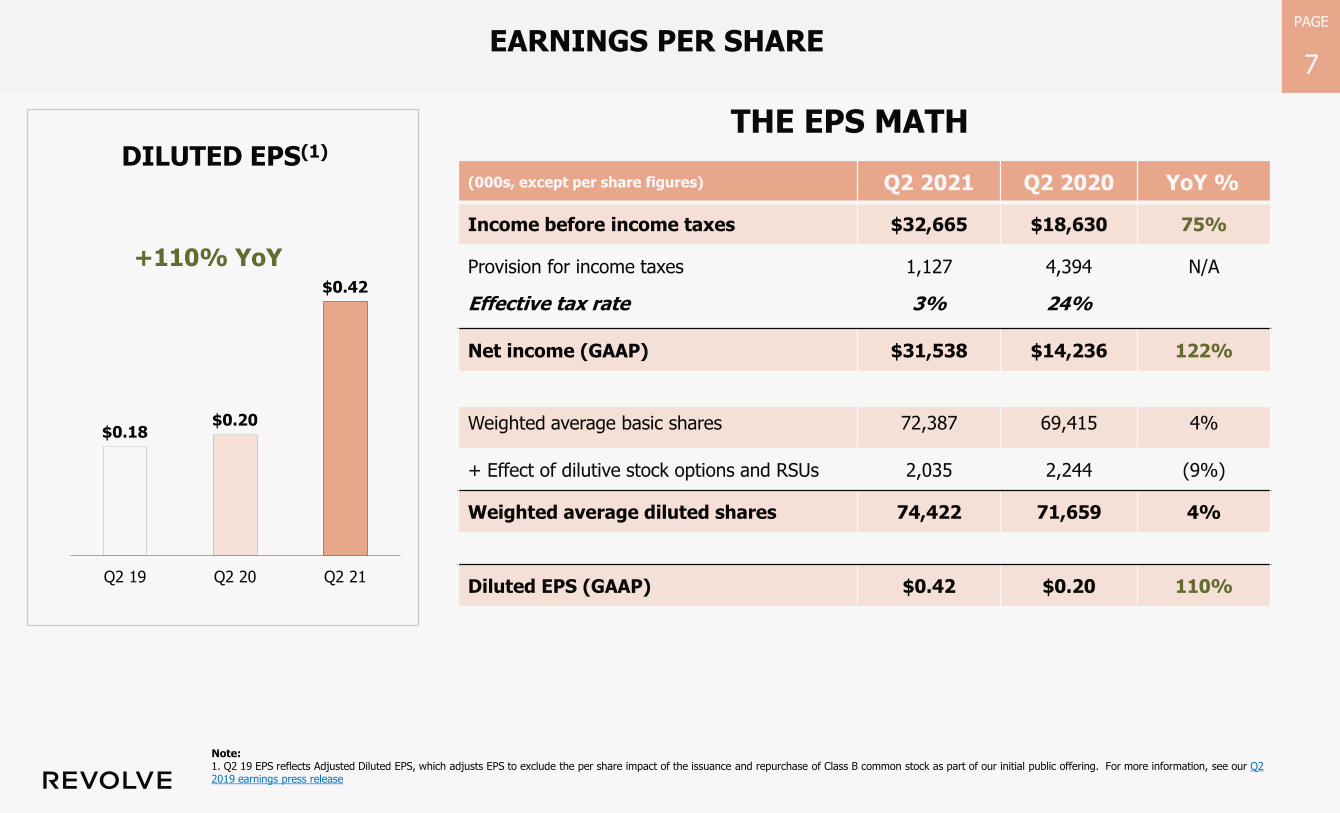
7EARNINGS PER SHARE
$0.18$0.20
$0.42
Q2 19 Q2 20 Q2 21
(000s, except per share figures) Q2 2021 Q2 2020 YoY %
Income before income taxes $32,665 $18,630 75%
Provision for income taxes 1,127 4,394 N/A
Effective tax rate 3% 24%
Net income (GAAP) $31,538 $14,236 122%
Weighted average basic shares 72,387 69,415 4%
+ Effect of dilutive stock options and RSUs 2,035 2,244 (9%)
Weighted average diluted shares 74,422 71,659 4%
Diluted EPS (GAAP) $0.42 $0.20 110%
THE EPS MATH DILUTED EPS(1)
+110% YoY
Note: 1. Q2 19 EPS reflects Adjusted Diluted EPS, which adjusts EPS to exclude the per share impact of the issuance and repurchase of Class B common stock as part of our initial public offering. For more information, see our Q2 2019 earnings press release

PAGE
8
CASH FLOW AND BALANCE SHEET
PAGE
8
PAGE
9
PAGE
1
PAGE
9
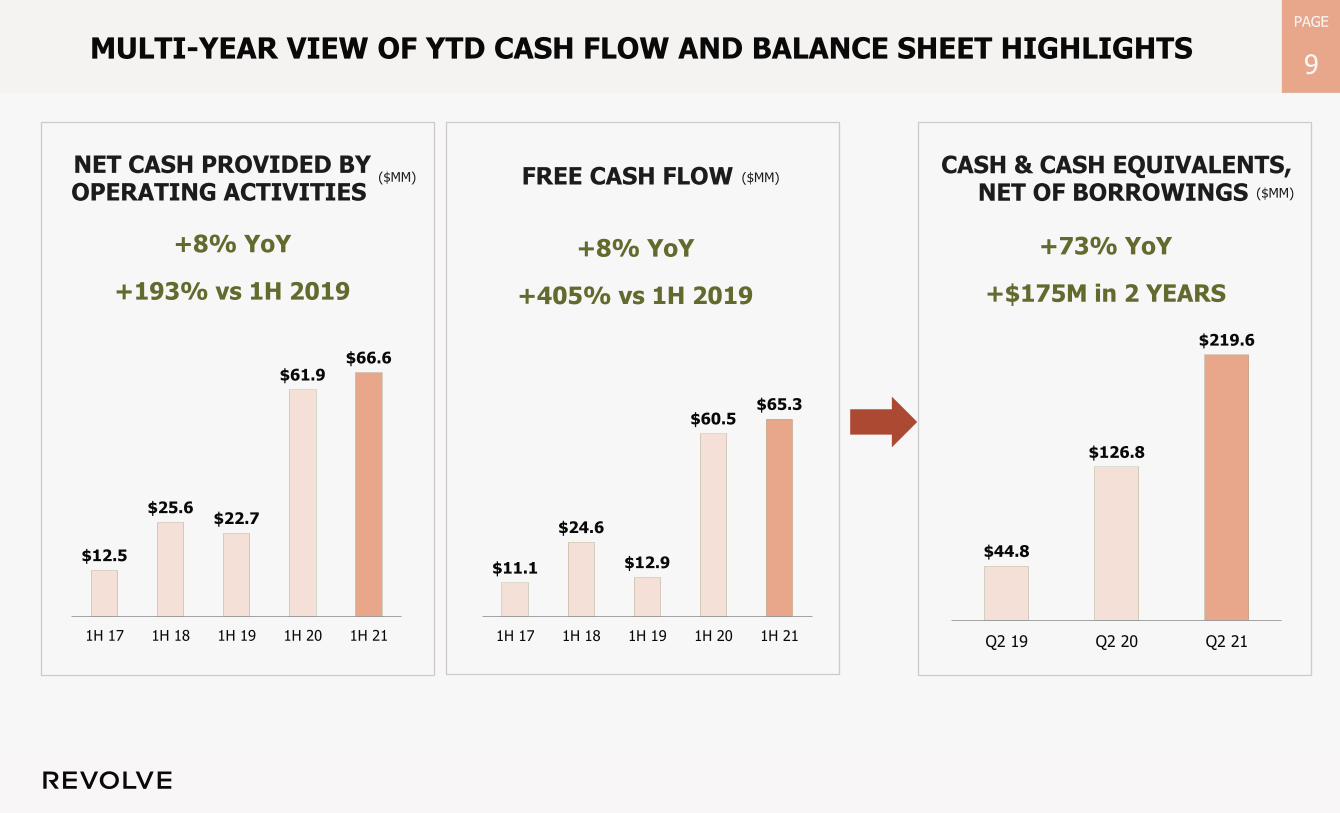
FREE CASH FLOW
(3%) YoY +59% YoY
$12.5
$25.6 $22.7
$61.9 $66.6
1H 17 1H 18 1H 19 1H 20 1H 21
$11.1
$24.6
$12.9
$60.5 $65.3
1H 17 1H 18 1H 19 1H 20 1H 21
$44.8
$126.8
$219.6
Q2 19 Q2 20 Q2 21
($MM) ($MM)
+8% YoY
+193% vs 1H 2019
($MM)
MULTI-YEAR VIEW OF YTD CASH FLOW AND BALANCE SHEET HIGHLIGHTS
NET CASH PROVIDED BY OPERATING ACTIVITIES
CASH & CASH EQUIVALENTS, NET OF BORROWINGS
+8% YoY
+405% vs 1H 2019
+73% YoY
+$175M in 2 YEARS
PAGE
10
PAGE
1
PAGE
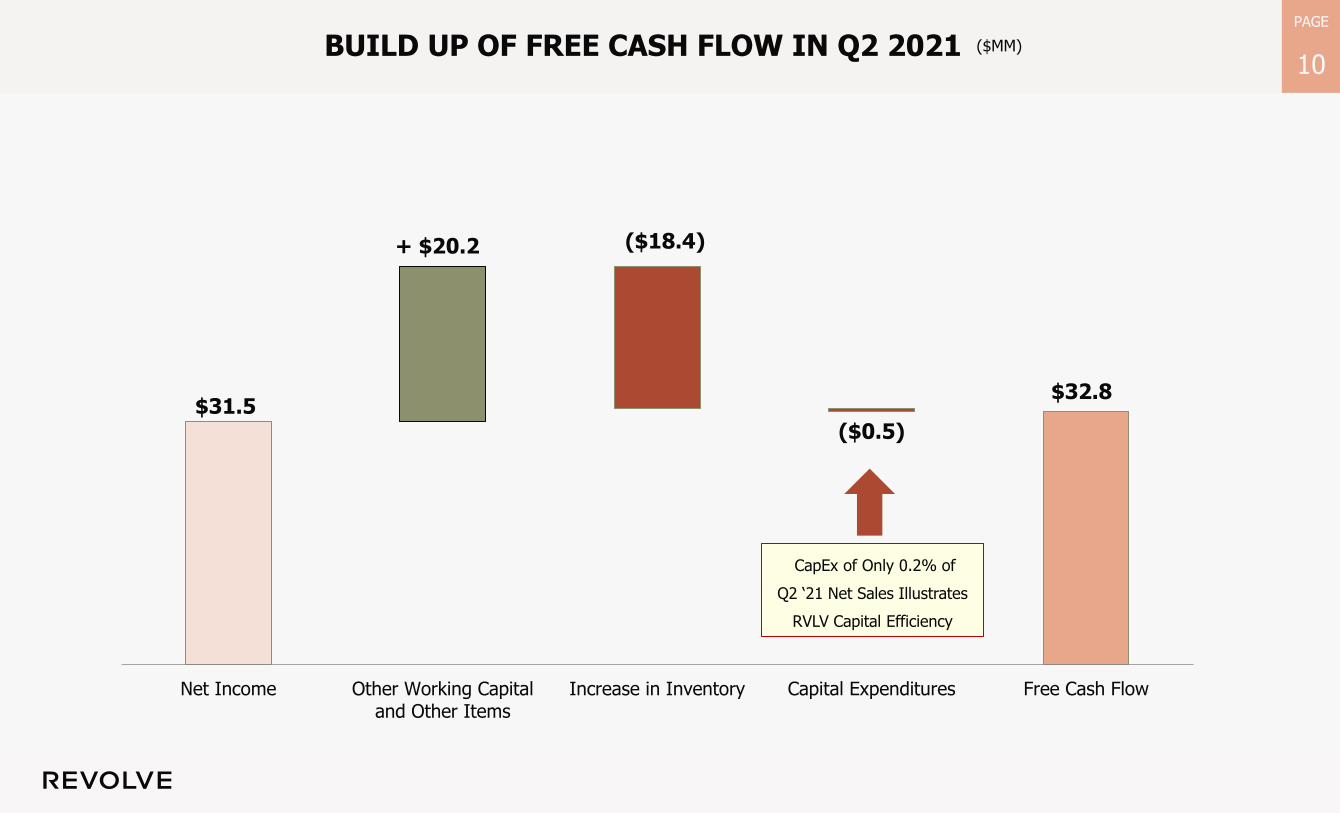
10BUILD UP OF FREE CASH FLOW IN Q2 2021
$31.5 $32.8
+ $20.2 ($18.4)
($0.5)
Net Income Other Working Capitaland Other Items
Increase in Inventory Capital Expenditures Free Cash Flow
($MM)
CapEx of Only 0.2% of
Q2 ‘21 Net Sales Illustrates
RVLV Capital Efficiency
PAGE
11
PAGE
1
PAGE
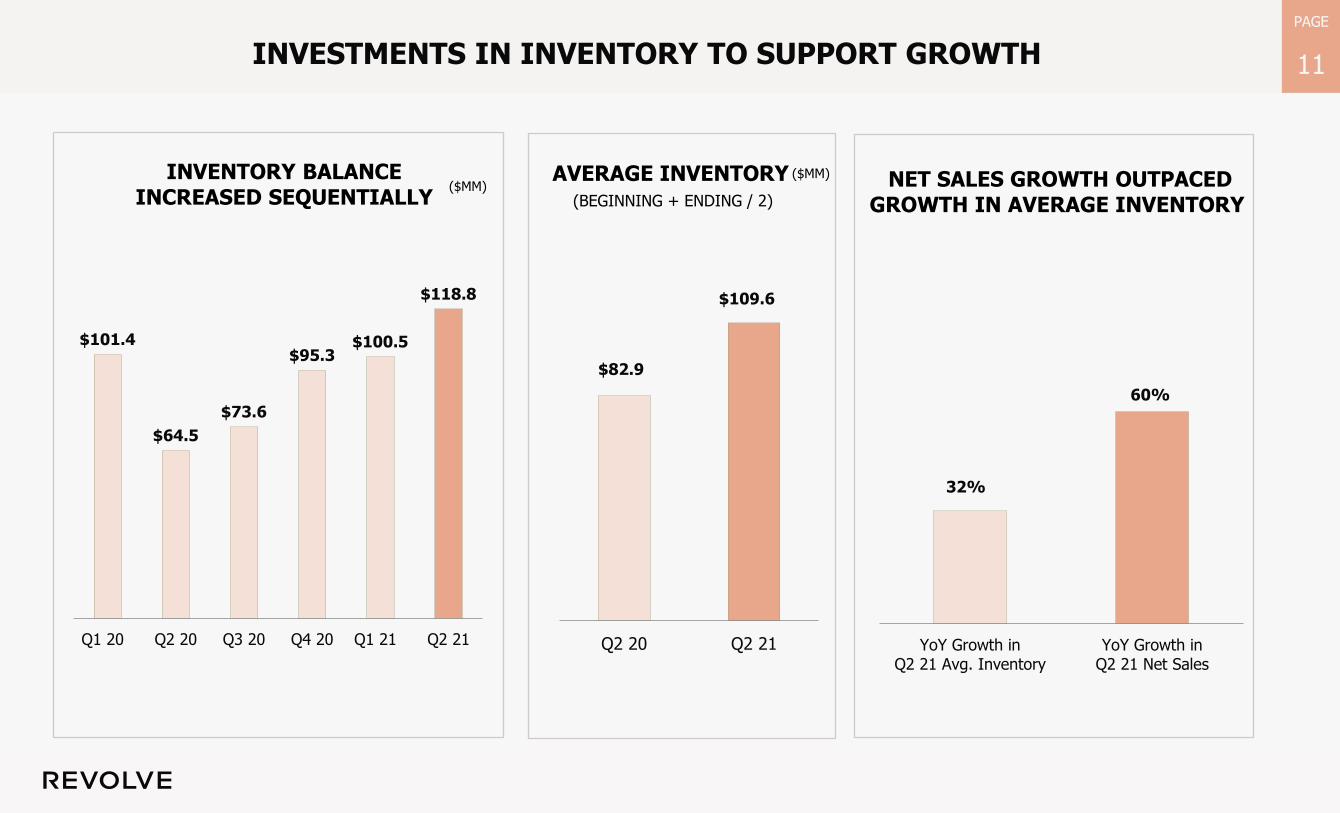
11INVESTMENTS IN INVENTORY TO SUPPORT GROWTH
($MM) NET SALES GROWTH OUTPACED GROWTH IN AVERAGE INVENTORY
INVENTORY BALANCE INCREASED SEQUENTIALLY
$101.4
$64.5
$73.6
$95.3$100.5
$118.8
Q1 20 Q2 20 Q3 20 Q4 20 Q1 21 Q2 21
32%
60%
YoY Growth inQ2 21 Avg. Inventory
YoY Growth inQ2 21 Net Sales
$82.9
$109.6
Q2 20 Q2 21
AVERAGE INVENTORY(BEGINNING + ENDING / 2)
($MM)

PAGE
12
PAGE
1
PAGE
12
SEGMENT RESULTS
PAGE
13
PAGE
1
PAGE
13
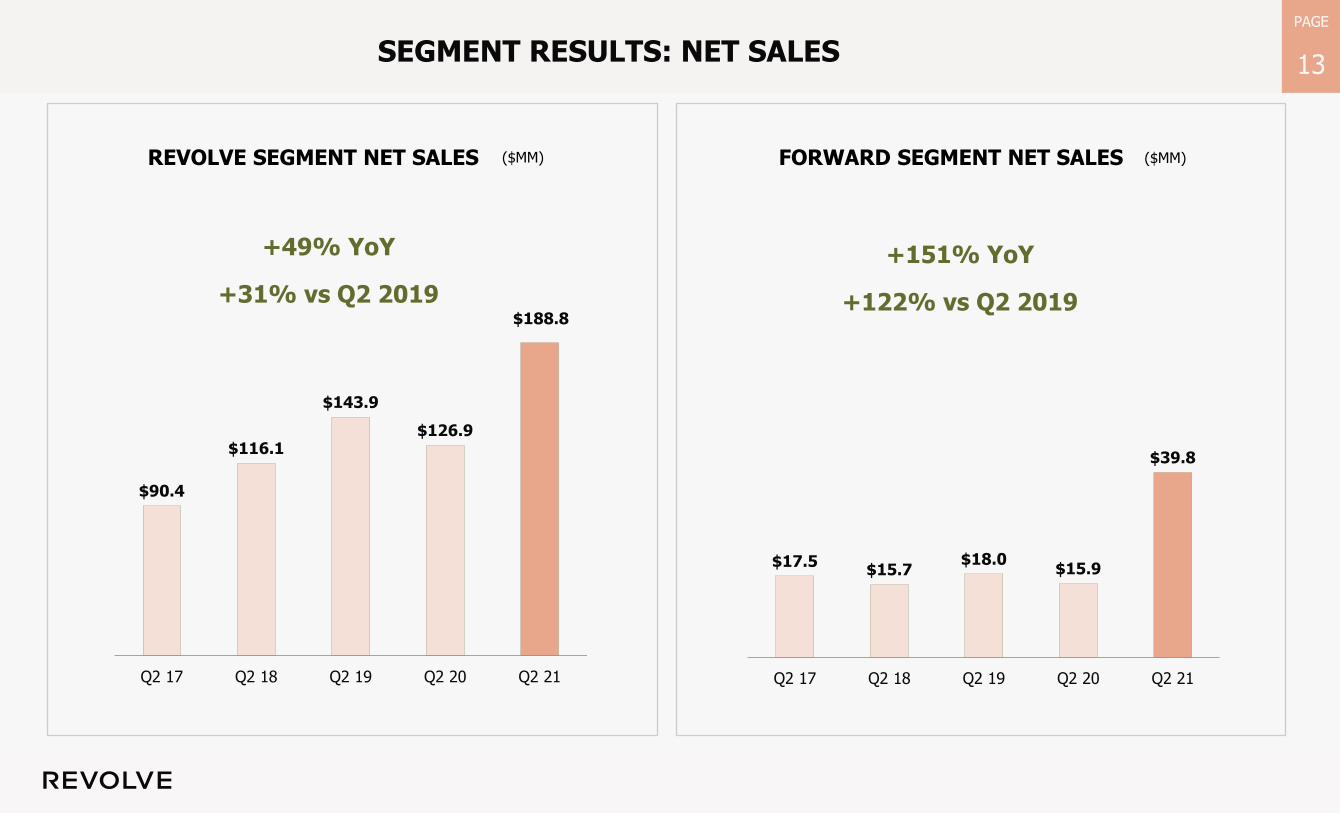
($MM)REVOLVE SEGMENT NET SALES
SEGMENT RESULTS: NET SALES
($MM)FORWARD SEGMENT NET SALES
$90.4
$116.1
$143.9
$126.9
$188.8
Q2 17 Q2 18 Q2 19 Q2 20 Q2 21
$17.5$15.7
$18.0$15.9
$39.8
Q2 17 Q2 18 Q2 19 Q2 20 Q2 21
+49% YoY
+31% vs Q2 2019
+151% YoY
+122% vs Q2 2019
PAGE
14
PAGE
1
PAGE
14
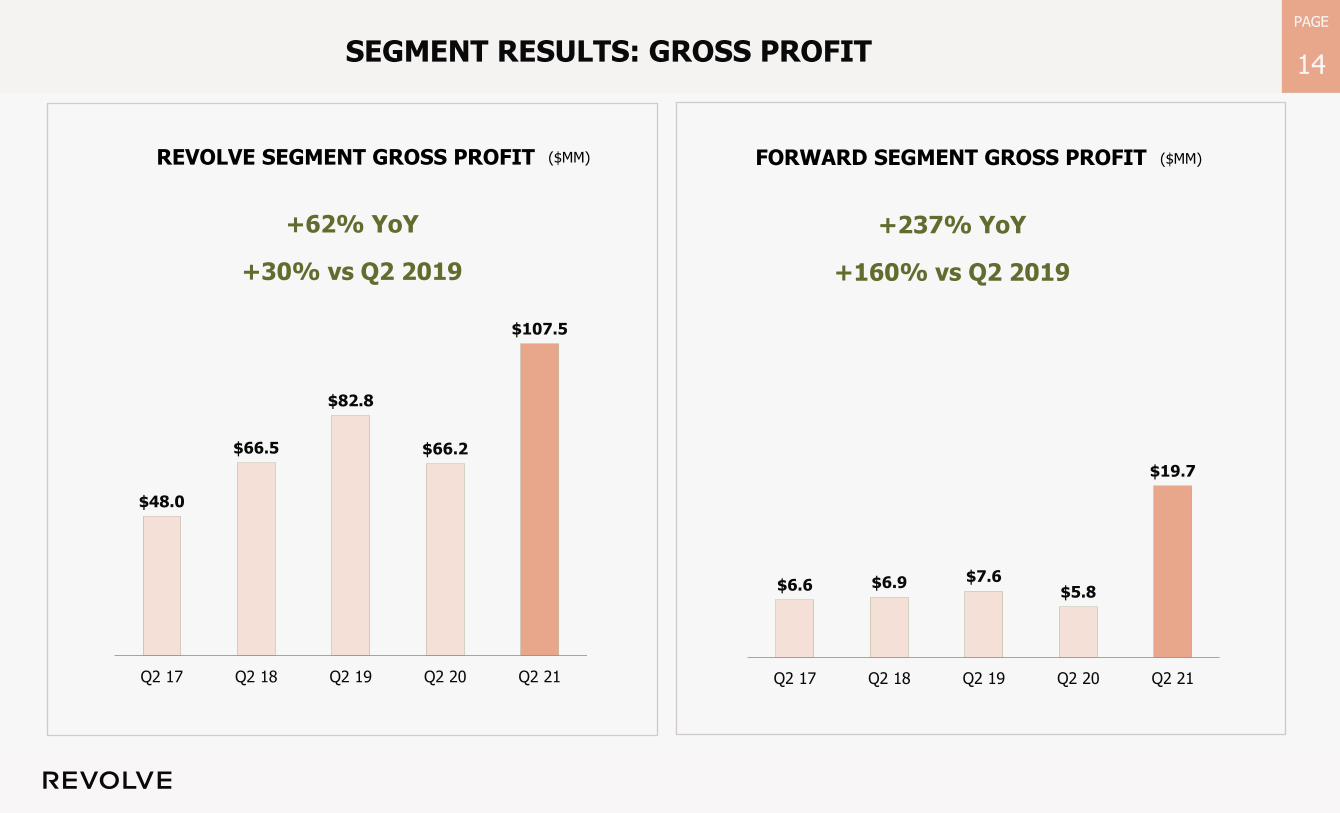
($MM)REVOLVE SEGMENT GROSS PROFIT
SEGMENT RESULTS: GROSS PROFIT
($MM)FORWARD SEGMENT GROSS PROFIT
$48.0
$66.5
$82.8
$66.2
$107.5
Q2 17 Q2 18 Q2 19 Q2 20 Q2 21
$6.6 $6.9 $7.6$5.8
$19.7
Q2 17 Q2 18 Q2 19 Q2 20 Q2 21
+62% YoY
+30% vs Q2 2019
+237% YoY
+160% vs Q2 2019

PAGE
15
PAGE
1
PAGE
15
KEYBANC TECHNOLOGY LEADERSHIP FORUM
• AUGUST 11, 2021
UPCOMING VIRTUAL INVESTOR CONFERENCE

PAGE
16
PAGE
1
PAGE
16
APPENDIX: DEFINITIONS AND RECONCILIATIONS
PAGE
17
PAGE
1
PAGE
17
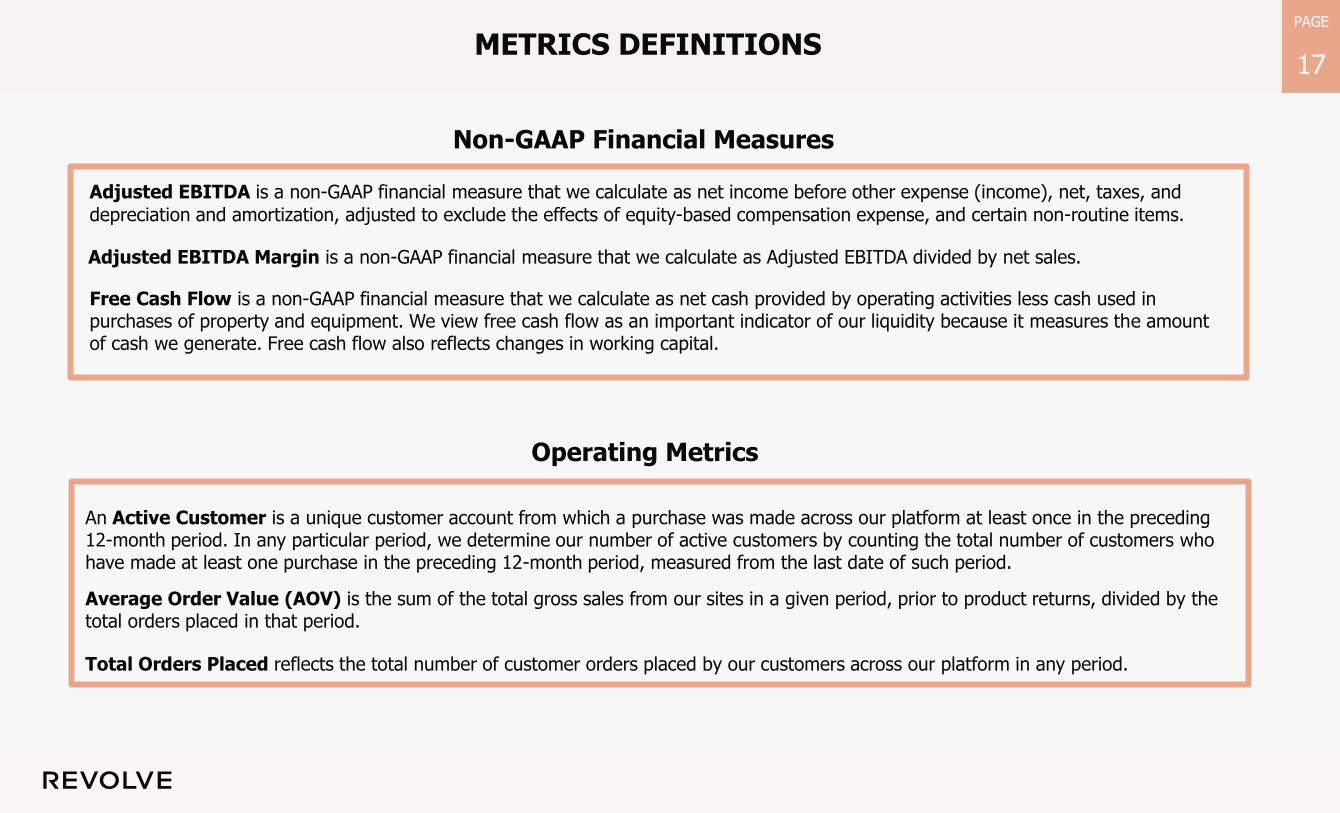
Free Cash Flow is a non-GAAP financial measure that we calculate as net cash provided by operating activities less cash used in purchases of property and equipment. We view free cash flow as an important indicator of our liquidity because it measures the amount of cash we generate. Free cash flow also reflects changes in working capital.
An Active Customer is a unique customer account from which a purchase was made across our platform at least once in the preceding 12-month period. In any particular period, we determine our number of active customers by counting the total number of customers who have made at least one purchase in the preceding 12-month period, measured from the last date of such period.
Adjusted EBITDA is a non-GAAP financial measure that we calculate as net income before other expense (income), net, taxes, and
depreciation and amortization, adjusted to exclude the effects of equity-based compensation expense, and certain non-routine items.
Total Orders Placed reflects the total number of customer orders placed by our customers across our platform in any period.
Average Order Value (AOV) is the sum of the total gross sales from our sites in a given period, prior to product returns, divided by the total orders placed in that period.
Operating Metrics
Non-GAAP Financial Measures
METRICS DEFINITIONS
Adjusted EBITDA Margin is a non-GAAP financial measure that we calculate as Adjusted EBITDA divided by net sales.
PAGE
18
PAGE
1
PAGE
18
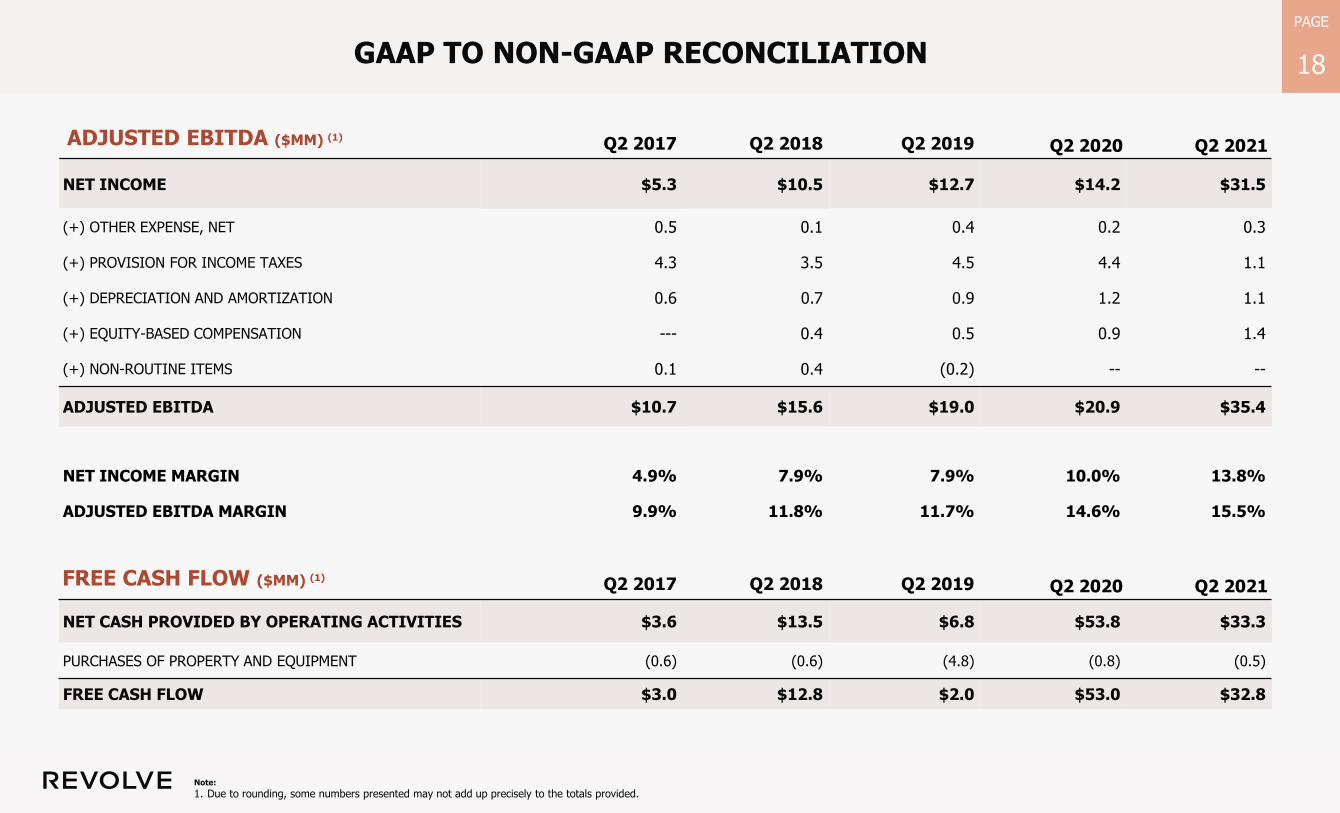
Q2 2017 Q2 2018 Q2 2019 Q2 2020 Q2 2021
NET INCOME $5.3 $10.5 $12.7 $14.2 $31.5
(+) OTHER EXPENSE, NET 0.5 0.1 0.4 0.2 0.3
(+) PROVISION FOR INCOME TAXES 4.3 3.5 4.5 4.4 1.1
(+) DEPRECIATION AND AMORTIZATION 0.6 0.7 0.9 1.2 1.1
(+) EQUITY-BASED COMPENSATION --- 0.4 0.5 0.9 1.4
(+) NON-ROUTINE ITEMS 0.1 0.4 (0.2) -- --
ADJUSTED EBITDA $10.7 $15.6 $19.0 $20.9 $35.4
NET INCOME MARGIN 4.9% 7.9% 7.9% 10.0% 13.8%
ADJUSTED EBITDA MARGIN 9.9% 11.8% 11.7% 14.6% 15.5%
Q2 2017 Q2 2018 Q2 2019 Q2 2020 Q2 2021
NET CASH PROVIDED BY OPERATING ACTIVITIES $3.6 $13.5 $6.8 $53.8 $33.3
PURCHASES OF PROPERTY AND EQUIPMENT (0.6) (0.6) (4.8) (0.8) (0.5)
FREE CASH FLOW $3.0 $12.8 $2.0 $53.0 $32.8
ADJUSTED EBITDA ($MM) (1)
FREE CASH FLOW ($MM) (1)
Note:
1. Due to rounding, some numbers presented may not add up precisely to the totals provided.
GAAP TO NON-GAAP RECONCILIATION