Embed Size (px)
Citation preview

Q2 2017 HIGHLIGHTS
August 9, 2017
Forward-looking statements are included in this presentation. These forward-looking statements are typically identified by the use of terms such as “outlook”, “guidance”, “target”,
“forecast”, “assumption” and other similar expressions or future or conditional terms such as "anticipate", "believe", "could", "estimate", "expect", "intend", "may", "plan", "predict",
"project", "will", "would", and “should”. Such statements may involve but are not limited to comments with respect to strategies, expectations, planned operations or future actions.
Forward-looking statements, by their nature, are based on assumptions and are subject to important risks and uncertainties. Any forecasts, predictions or forward-looking statements
cannot be relied upon due to, among other things, changing external events and general uncertainties of the business and its corporate structure. Results indicated in forward-looking
statements may differ materially from actual results for a number of reasons, including without limitation, dependency on significant Accumulation Partners and clients, failure to
safeguard databases, cyber security and consumer privacy, reliance on Redemption Partners, conflicts of interest, greater than expected air redemptions for rewards, regulatory matters,
retail market/economic conditions, industry competition, Air Canada liquidity issues, Air Canada or travel industry disruptions, airline industry changes and increased airline costs, supply
and capacity costs, unfunded future redemption costs, changes to coalition loyalty programs, seasonal nature of the business, other factors and prior performance, foreign operations,
legal proceedings, reliance on key personnel, labour relations, pension liability, technological disruptions, inability to use third-party software and outsourcing, failure to protect intellectual
property rights, interest rate and currency fluctuations (including currency risk or our foreign operations which are denominated in a currency other than the Canadian dollar, mainly
pound sterling, and subject to fluctuations as a result of foreign exchange rate variations), leverage and restrictive covenants in current and future indebtedness, uncertainty of dividend
declarations and/or payments on either common Shares or preferred shares, managing growth, credit ratings, audit by tax authorities, as well as the other factors identified throughout
Aimia’s MD&A and its other public disclosure records on file with the Canadian securities regulatory authorities.
In particular, slides 13-14, 16-17, 20-21, 36, 38, 43, 45-46, 58, and 64 of this presentation contain certain forward-looking statements with respect to certain financial metrics in 2017.
Aimia made a number of general economic and market assumptions in making these statements, including assumptions regarding currencies, the performance of the economies in
which the Corporation operates and market competition and tax laws applicable to the Corporation’s operations. The Corporation cautions that the assumptions used to make these
statements with respect to 2017, although reasonable at the time they were made, may prove to be incorrect or inaccurate. In addition, these statements do not reflect the potential
impact of any non-recurring or other special items or of any new material commercial agreements, dispositions, mergers, acquisitions, other business combinations or transactions that
may be announced or that may occur after August 9, 2017. The financial impact of these transactions and non-recurring and other special items can be complex and depends on the
facts particular to each of them. We therefore cannot describe the expected impact in a meaningful way or in the same way we present known risks affecting our business. Accordingly,
our actual results could differ materially from the statements made on slides 13-14, 16-17, 20-21, 36, 38, 43, 45-46, 58, and 64 of this presentation.
The forward-looking statements contained herein represent the Corporation’s expectations as of August 9, 2017 and are subject to change. However, Aimia disclaims any intention or
obligation to update or revise any forward-looking statements whether as a result of new information, future events or otherwise, except as required under applicable securities
regulations.
This presentation contains both IFRS and non-GAAP financial measures. Non-GAAP financial measures are defined and reconciled to the most comparable IFRS measures,
if applicable, in our MD&A and at slides 4, 5, and 7. See caution regarding Non-GAAP financial measures on slide 4.
FORWARD-LOOKING AND CAUTIONARY STATEMENTS
3

Aimia uses the following non-GAAP financial measures which it believes provides investors and analysts with additional information to better understand results as well as assess its potential. GAAP means generally accepted
accounting principles in Canada and represents International Financial Reporting Standards (“IFRS”). For a reconciliation of non-GAAP financial measures to the most comparable GAAP measure, please refer to the section
entitled “Performance Indicators (including certain non-GAAP financial measures)” in our Management Discussion & Analysis on pages 8 to 11 for the three and six months ended June 30, 2017 which can be accessed here:
https://www.aimia.com/en/investors/quarterly-reports.html. For ease of reference, we have also included a reconciliation table to the most directly comparable GAAP measure, if any, on slides 5 and 7.
Adjusted EBITDA
Adjusted EBITDA is not a measurement based on GAAP, is not considered an alternative to operating income or net earnings in measuring performance, and is not comparable to similar measures used by other issuers. We do not
believe that Adjusted EBITDA has an appropriate directly comparable GAAP measure. As an alternative, we do however provide a reconciliation to operating income in our MD&A and on slide 5 in this presentation.
Adjusted EBITDA is used by management to evaluate performance, and to measure compliance with debt covenants. Management believes Adjusted EBITDA assists investors in comparing the Corporation’s performance on a
consistent basis without regard to depreciation and amortization and impairment charges, which are non-cash in nature and can vary significantly depending on accounting methods and non-operating factors such as historical cost.
Adjusted EBITDA is operating income adjusted to exclude depreciation, amortization and impairment charges, as well as adjusted for certain factors particular to the business, such as changes in deferred revenue and Future
Redemption Costs. Adjusted EBITDA also includes distributions and dividends received or receivable from equity-accounted investments. Adjusted EBITDA should not be used as an exclusive measure of cash flow because it
does not account for the impact of working capital growth, capital expenditures, debt repayments and other sources and uses of cash, which are disclosed in the statements of cash flows.
Free Cash Flow
Free Cash Flow is not a measurement based on GAAP and is unlikely to be comparable to similar measures used by other issuers. Management believes Free cash flow (“Free Cash Flow”) provides a consistent and comparable
measurement of cash generated from operations and is used as an indicator of financial strength and performance. Free Cash Flow is defined as cash flows from operating activities, as reported in accordance with GAAP, less: (a)
total capital expenditures as reported in accordance with GAAP; and (b) dividends paid. For a reconciliation of Free Cash Flow before Dividends Paid to cash flows from operations (GAAP), please see slide 5 in this
presentation.
Free Cash Flow before Dividends Paid and Free Cash Flow before Dividends Paid per Common Share
Free Cash Flow before Dividends Paid are non-GAAP measures and are not comparable to similar measures used by other issuers. They are used in order to provide a consistent and comparable measurement of cash generated
from operations and used as indicators of financial strength and performance. Free Cash Flow before Dividends Paid is defined as cash flows from operating activities as reported in accordance with GAAP, less capital
expenditures as reported in accordance with GAAP. Free Cash Flow before Dividends Paid per Common Share is a measurement of cash flow generated from operations on a per share basis. It is calculated as follows: Free Cash
Flow before dividends paid minus dividends paid on preferred shares and non-controlling interests over the weighted average number of common shares outstanding. For a reconciliation of Free Cash Flow before Dividends
Paid and Free Cash Flow before Dividends Paid per Common Share to the most directly comparable GAAP measure, if any, please see slide 5 in this presentation.
ROIC
Return on invested capital (“ROIC”) is not a measurement based on GAAP and is not comparable to similar measures used by other issuers. ROIC is used by management to assess the efficiency with which it allocates its capital
to generate returns. ROIC is calculated as adjusted operating income after taxes expressed as a percentage of the average invested capital. Adjusted operating income after taxes is Adjusted EBITDA less depreciation and
amortization, tax effected at the Canadian statutory rate, on a rolling twelve-month basis. A description of Adjusted EBITDA as well as its reconciliation to operating income is presented in the preceding section. Invested capital is
the sum of total equity, deferred revenue margin (calculated as deferred revenue less future redemption cost liability, tax effected at the Canadian statutory rate), accumulated amortization of Accumulation Partners' contracts and
customer relationships, and net debt (calculated as long-term debt, including the current portion, less cash and cash equivalents, net of any contractually required redemption reserve amount included in cash and cash equivalents),
averaged between the beginning and ending balance over a rolling twelve-month period. For a reconciliation of ROIC to the most directly comparable GAAP measure, if any, please see slide 7 in this presentation.
Constant Currency
Because exchange rates are an important factor in understanding period to period comparisons, management believes that the presentation of various financial metrics on a constant currency basis or after giving effect to foreign
exchange translation, in addition to the reported metrics, helps improve the ability to understand operating results and evaluate performance in comparison to prior periods. Constant currency information compares results between
periods as if exchange rates had remained constant over the periods. Constant currency is derived by calculating current-year results using prior-year foreign currency exchange rates. Results calculated on a constant currency
basis should be considered in addition to, not as a substitute for, results reported in accordance with GAAP and may not be comparable to similarly titled measures used by other companies.
NON-GAAP FINANCIAL MEASURES
4

GAAP TO NON-GAAP RECONCILIATION*
5
*THIS SLIDE CONTAINS NON-GAAP FINANCIAL MEASURES. PLEASE REFER TO SLIDE 4 FOR A DETAILED DESCRIPTION OF SUCH NON-GAAP FINANCIAL
MEASURES.
Three months ended
June 30,
Six months ended
June 30,
2017 2016 2017 2016
Operating income (loss) (34.9) (17.1) (29.4) (26.0)
Depreciation and amortization 12.1 15.2 23.5 28.1
Amortization of Accumulation Partners' contracts, customer relationships and
technology36.2 32.5 62.0 65.3
Operating income excluding depreciation, amortization and impairment charges 13.4 30.6 56.1 67.4
Adjustments:
Change in deferred revenue
Gross Billings 520.3 560.7 1,045.5 1,133.7
Total revenue (470.5) (525.4) (995.3) (1,095.5)
Change in Future Redemption Costs (29.0) (19.0) (20.6) (15.4)
Distributions from equity-accounted investments 7.5 7.7 14.8 13.0
Subtotal of Adjustments 28.3 24.0 44.4 35.8
Adjusted EBITDA 41.7 54.6 100.5 103.2
Adjusted EBITDA as a % of total Gross Billings 8.0% 9.7% 9.6% 9.1%
Cash from operating activities 66.9 58.6 55.2 59.2
Capital expenditures (12.8) (14.4) (24.9) (33.9)
Free Cash Flow before Dividends Paid 54.1 44.2 30.3 25.3
Free Cash Flow before Dividends Paid per common share 0.36 0.26 0.17 0.11
Dividends paid to equity holders of the Corporation - (34.6) (34.7) (67.8)
Free Cash Flow 54.1 9.6 (4.4) (42.5)
Q2 AND YTD 2017 INCOME STATEMENT
6
Three Months Ended
June 30,
Six Months Ended
June 30,
(in millions of Canadian dollars, except per share
amounts)2017 2016 2017 2016
Revenue 470.5 525.4 $ 995.3 $ 1,095.5
Cost of sales
Cost of rewards and direct costs 300.7 331.3 632.1 700.8
Depreciation and amortization 12.1 15.2 23.5 28.1
Amortization of accumulation partners' contracts,
customer relationships and technology 36.2 32.5 62.0 65.3
349.0 379.0 717.6 794.2
Gross margin 121.5 146.4 277.7 301.3
Selling and marketing expenses 100.7 109.5 205.9 220.6
General and administrative expenses 55.7 54.0 101.2 106.7
Operating expenses 156.4 163.5 307.1 327.3
Operating loss (34.9) (17.1) (29.4) (26.0)
Gain on disposal of businesses and other assets 6.2 23.2 6.2 23.2
Financial income 10.0 1.7 12.9 3.9
Financial expenses (13.1) (11.4) (20.6) (25.4)
Net financial expenses (3.1) (9.7) (7.7) (21.5)
Share of net earnings of equity-accounted
investments 4.9 6.4 18.0 12.0
Earnings (loss) before income taxes (26.9) 2.8 (12.9) (12.3)
Income tax (expense) recovery 1.8 4.4 (2.6) 6.4
Net earnings (loss) for the period (25.1) 7.2 $ (15.5) $ (5.9)
Earnings (loss) per common share
Basic and fully diluted (0.19) 0.02 $ (0.16) $ (0.10)

ROIC RECONCILIATION*
7
*THIS SLIDE CONTAINS NON-GAAP FINANCIAL MEASURES. PLEASE REFER TO SLIDE 4 FOR A DETAILED DESCRIPTION OF SUCH NON-GAAP FINANCIAL
MEASURES.
Twelve Months Ended
June 30,
(in millions of Canadian dollars unless otherwise noted) 2017 2016
Calculation of adjusted operating income after taxes
Operating loss (89.8) (76.7)
Depreciation, amortization & impairment charges 241.2 209.4
Operating income excluding depreciation, amortization and impairment
charges 151.4 132.7
Adjustments:
Change in deferred revenue
Gross Billings 2,251.5 2,402.2
Total revenue (2,187.9) (2,359.1)
Change in Future Redemption Costs (14.3) 0.3
Distributions from equity-accounted investments 26.6 34.1
Subtotal of Adjustments 75.9 77.5
Adjusted EBITDA 227.3 210.2
Depreciation and amortization (52.8) (59.8)
Tax (46.4) (40.0)
Adjusted operating income after taxes 128.1 110.4
Calculation of invested capital
Total equity 27.2 266.1
Deferred revenue margin:
Deferred revenue 3,290.5 3,261.6
Future Redemption Cost liability - Unbroken Loyalty Units (2,242.0) (2,274.0)
Tax (278.7) (262.5)
Accumulated amortization of accumulation partners' contracts and customer
relationships 899.0 831.4
Net debt:
Long-term debt (including current portion) 449.1 647.7
Cash and cash equivalents (273.1) (352.2)
Contractually required redemption reserve included in cash & cash
equivalents 222.0 146.5
Total Invested capital 2,094.0 2,264.6
Average Invested capital 2,179.3 2,315.8
ROIC 5.9% 4.8%
Q2 2017 FINANCIAL HIGHLIGHTS*
(1) Year over year percentage variance.
(2) Constant Currency excludes the translation effect of foreign operations on the consolidated results. For more information on Constant Currency, please refer to slide 4.
Q2 2017
$520.3(7.2%)(1)
(6.3%) in c.c.(1)(2)
$41.78.0% margin
$54.1
$12.8
$156.4
Q2 2016
$560.7
$44.2
$14.4
$54.69.7% margin
$163.5
Gross
Billings
Operating
Expenses
Adjusted
EBITDA
FCF before
dividends paid
Capital
expenditures
(in millions of Canadian dollars)
*THIS SLIDE CONTAINS NON-GAAP FINANCIAL MEASURES. PLEASE REFER TO SLIDE 4 FOR A DETAILED DESCRIPTION OF SUCH NON-GAAP FINANCIAL
MEASURES AND SLIDE 5 AND 7 FOR A RECONCILIATION TABLE TO THE MOST DIRECTLY COMPARABLE GAAP MEASURE, IF ANY.
8
As Reported

TODAY’S SPEAKERS
9
• David Johnston, Group Chief Executive
• Tor Lønnum, Chief Financial Officer

AGENDA
10
• Introductions
• Quarterly highlights & Strategic update
• Financial highlights

QUARTERLY HIGHLIGHTS & STRATEGIC UPDATE
DAVID JOHNSTON
Q2 2017 FINANCIAL HIGHLIGHTS*
(1) Year over year percentage variance.
(2) Constant Currency excludes the translation effect of foreign operations on the consolidated results. For more information on Constant Currency, please refer to slide 4.
(3) Gross Billings excluding non-core items of $11.0 million and $43.7 million in Q2 2017 and 2016.
(4) Operating expenses excluding share-based compensation of ($9.5) million in Q2 2017 and $2.5 million in Q2 2016, and non-core items of $28.9 million and $27.7 million in Q2 2017 and 2016.
(5) Adjusted EBITDA excluding non-core items of $(20.1) million and $1.1 million in Q2 2017 and 2016.
(6) Gross Billings from the sale of Loyalty Units used as a proxy for coalition Gross Billings.
Q2 2017
$509.3(1.5%)(1)
(0.4%) in c.c.(1)(2)
$61.812.1% margin
$54.1
$12.8
$137.0
Q2 2016
$517.0
$44.2
$14.4
$53.510.3% margin
$133.3
Coalition Gross
Billings(6) growth
of 3% on a
constant currency
basis
Adjusted EBITDA
margin benefiting
from operational
efficiencies
FCF performance
reflecting
seasonality and
reduced capital
expenditure
Gross
Billings(3)
Operating
Expenses(4)
Adjusted
EBITDA(5)
FCF before
dividends paid
Capital
expenditures
(in millions of Canadian dollars)
*THIS SLIDE CONTAINS NON-GAAP FINANCIAL MEASURES. PLEASE REFER TO SLIDE 4 FOR A DETAILED DESCRIPTION OF SUCH NON-GAAP FINANCIAL
MEASURES AND SLIDE 5 AND 7 FOR A RECONCILIATION TABLE TO THE MOST DIRECTLY COMPARABLE GAAP MEASURE, IF ANY.
12
KEY TAKEAWAYS & AREAS OF FOCUS
13
Key Takeaways 1. Actively working on future Aeroplan member
offering
2. Aeroplan accumulation up in Q2, with no material
change to redemption trends
3. 2017 guidance maintained
Key Areas of Focus • Preserving a strong cash and liquidity position
• Ongoing business simplification and acceleration of
cost savings
• Progressing key strategic and commercial
partnership discussions and Aeroplan member
offering

BUILDING ADDITIONAL FINANCIAL FLEXIBILITY
14
*THIS SLIDE CONTAINS NON-GAAP FINANCIAL MEASURES. PLEASE REFER TO SLIDE 4 FOR A DETAILED DESCRIPTION OF SUCH NON-GAAP FINANCIAL
MEASURES AND SLIDE 5 AND 7 FOR A RECONCILIATION TABLE TO THE MOST DIRECTLY COMPARABLE GAAP MEASURE, IF ANY.
(3)
Increasing financial flexibility
beyond 2017Strong financial position with over half a
billion dollars on the balance sheet
(in millions of Canadian dollars)
1
2
3
4
Common dividend suspension
increases retained cash
Future FCF generation
$70M cost savings initiative
Potential for further asset salesRedemption reserves Other
$567 million
in cash and
investments*
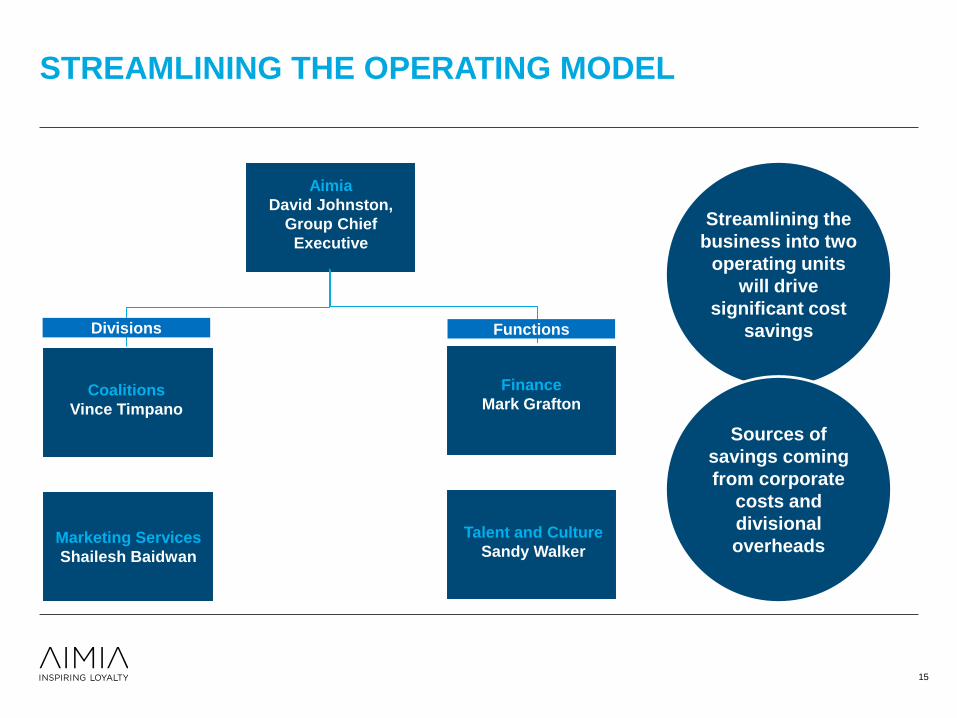
STREAMLINING THE OPERATING MODEL
15
Aimia
David Johnston,
Group Chief
Executive
Coalitions
Vince Timpano
Marketing Services
Shailesh Baidwan
Streamlining the
business into two
operating units
will drive
significant cost
savings
Sources of
savings coming
from corporate
costs and
divisional
overheads
Finance
Mark Grafton
Talent and Culture
Sandy Walker
Divisions Functions
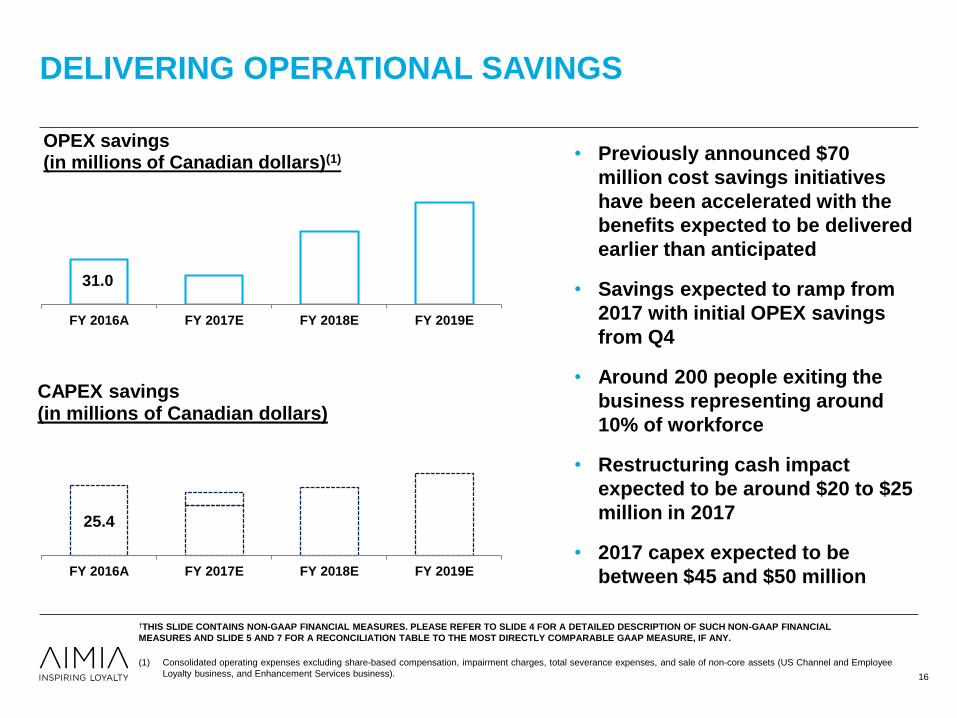
• Previously announced $70
million cost savings initiatives
have been accelerated with the
benefits expected to be delivered
earlier than anticipated
• Savings expected to ramp from
2017 with initial OPEX savings
from Q4
• Around 200 people exiting the
business representing around
10% of workforce
• Restructuring cash impact
expected to be around $20 to $25
million in 2017
• 2017 capex expected to be
between $45 and $50 million
DELIVERING OPERATIONAL SAVINGS
†THIS SLIDE CONTAINS NON-GAAP FINANCIAL MEASURES. PLEASE REFER TO SLIDE 4 FOR A DETAILED DESCRIPTION OF SUCH NON-GAAP FINANCIAL
MEASURES AND SLIDE 5 AND 7 FOR A RECONCILIATION TABLE TO THE MOST DIRECTLY COMPARABLE GAAP MEASURE, IF ANY.
(1) Consolidated operating expenses excluding share-based compensation, impairment charges, total severance expenses, and sale of non-core assets (US Channel and Employee
Loyalty business, and Enhancement Services business). 16
25.4
FY 2016A FY 2017E FY 2018E FY 2019E
CAPEX savings (in millions of Canadian dollars)
31.0
FY 2016A FY 2017E FY 2018E FY 2019E
OPEX savings (in millions of Canadian dollars)(1)
17
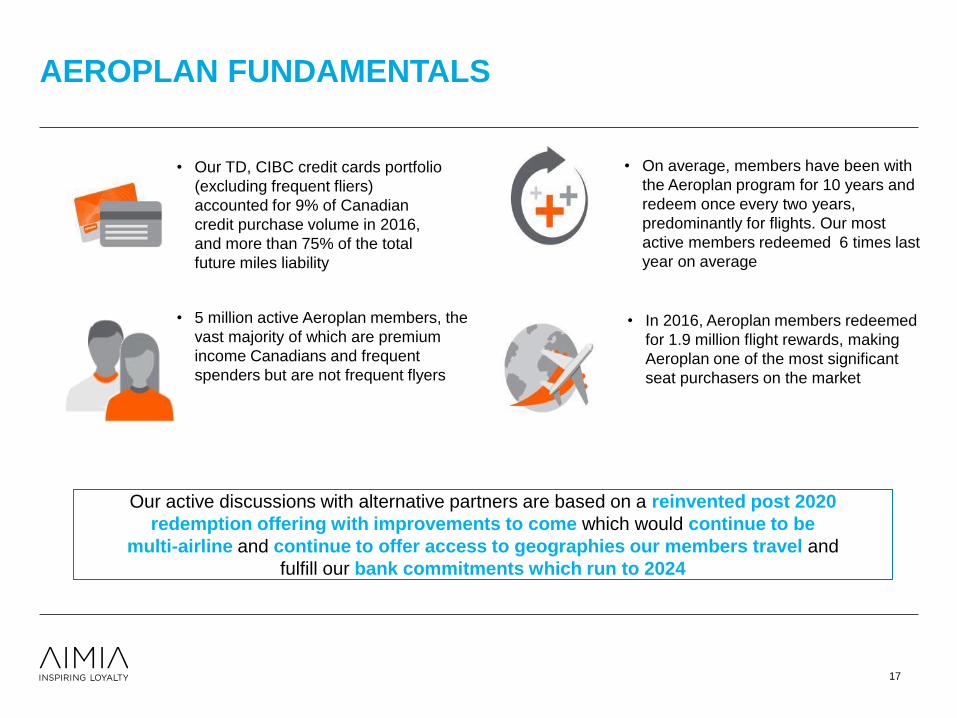
AEROPLAN FUNDAMENTALS
• 5 million active Aeroplan members, the
vast majority of which are premium
income Canadians and frequent
spenders but are not frequent flyers
• On average, members have been with
the Aeroplan program for 10 years and
redeem once every two years,
predominantly for flights. Our most
active members redeemed 6 times last
year on average
• Our TD, CIBC credit cards portfolio
(excluding frequent fliers)
accounted for 9% of Canadian
credit purchase volume in 2016,
and more than 75% of the total
future miles liability
• In 2016, Aeroplan members redeemed
for 1.9 million flight rewards, making
Aeroplan one of the most significant
seat purchasers on the market
Our active discussions with alternative partners are based on a reinvented post 2020
redemption offering with improvements to come which would continue to be
multi-airline and continue to offer access to geographies our members travel and
fulfill our bank commitments which run to 2024

2010 2011 2012 2013 2014 2015 2016 Q2 2017
One month average actives (1)
(Aeroplan TD + CIBC credit cardholders)
2013-2017 CAGR = 5%
AEROPLAN FINANCIAL CARD TRENDS
18
2010 to 2013 CAGR = 1%
Notes:
(1) One-month average active for the full-year unless other time period highlighted.
(2) 2010-2013 CAGR calculated based on Q4 2010-Q4 2013 time period and 2013-2017 CAGR calculated based on Q4 2013-Q2 2017 time period.
(3) One-month average active card base Q2 2017 compared to the Q2 2016.
Active base up
5% YOY in the
quarter(3)
Slowing new card
acquisition post
early campaigns
but improved
attrition in the
quarter

CONTINUED ACQUISITION AND ENGAGEMENT
19
Jan-17 Feb-17 Mar-17 Apr-17 May-17 Jun-17
6 month average
Monthly gross new card acquisitions
(Aeroplan TD + CIBC credit cardholders)
Q1 2017 Q2 2017
Some slowing
in June but
broadly
reflecting
expected
campaign
phasing
Marketing
campaign
focus on
member
engagement
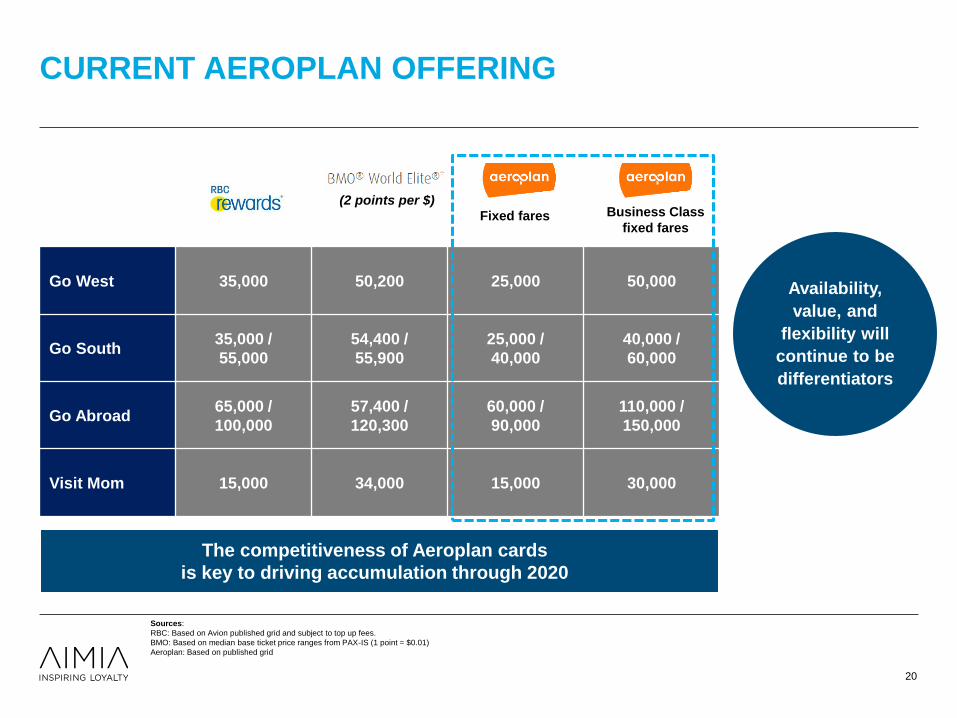
CURRENT AEROPLAN OFFERING
20
Availability,
value, and
flexibility will
continue to be
differentiators
Go West 35,000 50,200 25,000 50,000
Go South35,000 /
55,000
54,400 /
55,900
25,000 /
40,000
40,000 /
60,000
Go Abroad65,000 /
100,000
57,400 /
120,300
60,000 /
90,000
110,000 /
150,000
Visit Mom 15,000 34,000 15,000 30,000
The competitiveness of Aeroplan cards
is key to driving accumulation through 2020
(2 points per $)
Fixed fares Business Class
fixed fares
Sources:
RBC: Based on Avion published grid and subject to top up fees.
BMO: Based on median base ticket price ranges from PAX-IS (1 point = $0.01)
Aeroplan: Based on published grid

FOCUS ON ALTERNATIVES
21
Our active discussions with alternative partners are based on:
- a reinvented post 2020 redemption offering with improvements to
come which
- would continue to be multi-airline and
- continue to offer access to geographies our members travel
- and fulfill our bank commitments which run to 2024

OPERATING AND FINANCIAL HIGHLIGHTS
TOR LØNNUM

Q2 2017 GROSS BILLINGS AND OPERATIONAL HIGHLIGHTS*
(in millions of Canadian dollars and
reported YoY variance (%) )
Aimia Gross Billings**(core)
$509.3
Americas Coalitions
$338.566% of core
Gross Billings
19.0% AE
margin(3)
International Coalitions
$124.124% of core
Gross Billings
11.0% AE
margin(3)
Global Loyalty Solutions
$46.99% of core
Gross Billings
(10.0)% AE
margin
• New Zealand divestiture contributing
to top line decline
• Aeroplan Gross Billings up 3%(2),
contributing to divisional AE
margin improvement of 100 basis
points
• Currency impact of $7 million; Gross
Billings(2) up in constant currency
due to a successful bonus campaign
at Sainsbury’s
Q2 operational highlights
(1.5)%
+1.2%
(5.0)%
(9.5)%
**Differences may result due to rounding or inter-company eliminations.
(1) Including $5.1 million in severance expenses related to the organizational change announced on August 14, 2015 but excluding non-core items of $(20.1) million.
(2) Gross Billings from the sale of Loyalty Units.
(3) Americas Coalitions and International Coalitions includes $0.1 million and $1.1 million in severance expenses related to the organizational change announced on August 14, 2015.
(4) On a constant currency basis.
23
*THIS SLIDE CONTAINS NON-GAAP FINANCIAL MEASURES. PLEASE REFER TO SLIDE 4 FOR A DETAILED DESCRIPTION OF SUCH NON-GAAP FINANCIAL
MEASURES AND SLIDE 5 AND 7 FOR A RECONCILIATION TABLE TO THE MOST DIRECTLY COMPARABLE GAAP MEASURE, IF ANY.
Aimia Adjusted EBITDA(core)
$61.8(1)
12.1% margin
$509.3(2)(3) $520.3
($6.6) ($4.9)$3.9 $11.0
$517.0(2)(3)
Q2 2016Core Business
Q2 2017Core Business
Q2 2017Reported
(1) Constant Currency (c.c.) excludes the translation effect of foreign operations on the consolidated results. For more information on Constant Currency, please refer to
slide 4.
(2) Variance related to intercompany elimination of $0.1 million has been excluded from the bridge.
(3) Excludes non-core Gross Billings of $11.0 million and $43.7 million in Q2 2017 and Q2 2016.
Q2 2017 CONSOLIDATED GROSS BILLINGS
(in millions of Canadian dollars)
Americas
CoalitionsInternational
Coalitions
Global
Loyalty
Solutions
Americas Coalitions: 1.2%;
International Coalitions: 0.3% in c.c.(1);
Global Loyalty Solutions: (12.4)% in c.c. (1)
24
Non-core
• Aeroplan Loyalty
Units Gross
Billings up 3%;
• Loyalty Services
and Other down
$6M mainly
related to gross-
to-net revenue
impact
• Decreased
rewards
fulfillment
activity from
wind-down of a
client program
and NZ
divestiture
• $7M currency
impact; On a
constant
currency basis,
Nectar Loyalty
Units up $5M
offset primarily
by the
divestiture of
UK Cardlytics
business
Down 1.5%

$41.7
$61.8(2)
($1.9) ($4.8)
($20.1)$4.1
$10.9
$53.5(1)
Q2 2016Core
Q2 2017Core
Q2 2017Reported
Q2 2017 CONSOLIDATED ADJUSTED EBITDA*
Americas
Coalitions
International
Coalitions Global
Loyalty
Solutions
Corporate
and Other
AE margin
10.3%AE margin
8.0%
(1) Excludes $1.1 million from “Other” within Corporate and Other segment.
(2) Excludes ($20.1) million from “Other” within Corporate and Other segment.
(in millions of Canadian dollars)
25
*THIS SLIDE CONTAINS NON-GAAP FINANCIAL MEASURES. PLEASE REFER TO SLIDE 4 FOR A DETAILED DESCRIPTION OF SUCH NON-GAAP FINANCIAL
MEASURES AND SLIDE 5 AND 7 FOR A RECONCILIATION TABLE TO THE MOST DIRECTLY COMPARABLE GAAP MEASURE, IF ANY.
• Higher
Aeroplan
contribution;
higher
marketing
expenses
• Lower
loyalty
program
contribution;
lower
operating
expense
• Higher
spend on
IT and
operations;
lower
Gross
Billings
offset by
reduced
direct costs
AE margin
12.1%
Non-core
• Lower
share-based
compensation
expense
Up 15.5% YoY

$58.4
Q1 Q2 Q3 Q4 Q1 Q2 Q3 Q4 Q1 Q2 Q3 Q4 Q1 Q2
Normalized FCF before Dividends Paid
FREE CASH FLOW IN LINE WITH SEASONAL PATTERNS*
1) Excluding the TD upfront contribution of $100.0 million and $22.5 million HST receipt related to the CIBC Conveyance payment received in the first quarter of 2014. 2) Excluding the tax refund of $83.4 million
received in the second quarter of 2014. 3) Excluding the tax deposit of $20.7 million made in the third quarter of 2014. 4) Excluding the tax refund of $7.5 million received in the fourth quarter of 2014. 5) Excluding
the tax refund of $20.4 million received in the first quarter of 2015. 6) Excluding the tax deposit of $20.7 million received in the fourth quarter of 2015 and $4.5 million severance payments in relation to the
organizational changes announced on August 14, 2015. 7) Excluding the $6.9 million severance payments in the first quarter of 2016 in relation to the organizational changes announced on August 14, 2015. 8)
Excluding the $4.9 million severance payments in the second quarter of 2016 in relation to the organizational changes announced on August 14, 2015. 9) Excluding the $2.5 million severance payments in the
third quarter of 2016 in relation to the organizational changes announced on August 14, 2015 and $50.3 million tax refund in the third quarter of 2016. 10) Excluding the $2.0 million severance payments in the
fourth quarter of 2016 in relation to the organizational changes announced on August 14, 2015 and $6.5 million in prepayment of interest expense and related fees associated with the early redemption of the
Senior Secured Notes Series 3. 11) Excluding $3.7 million severance payments. 12) Excluding $4.3 million severance payments.
*THIS SLIDE CONTAINS NON-GAAP FINANCIAL MEASURES. PLEASE REFER TO SLIDE 4 FOR A DETAILED DESCRIPTION OF SUCH NON-GAAP FINANCIAL
MEASURES AND SLIDE 5 AND 7 FOR A RECONCILIATION TABLE TO THE MOST DIRECTLY COMPARABLE GAAP MEASURE, IF ANY.
Higher Q2 FCF
reflective of
reduced capex
and working
capital benefit
2014 2015 2016 2017
(1)
(2)
(3)
(4)
(5)
(6)
(7)
(8)
(9)
(10)
(11)
26
(12)
(in millions of Canadian dollars)

$165.9(1)
$137.0(1)(2)
($3.0)$1.4 $4.5 $0.9
$28.9
$133.3(1)(2)
Q2 2016Core
Q2 2017Core
Q2 2017Reported
• Higher
marketing and
IT spend
offsetting
benefits from
operational
efficiencies
• Impact of prior
year program
closure and
investment
exit
• Increased
spend on
IT
• Increased
severance
Q2 2017 PROGRESS ON OPERATING EXPENSES*
(in millions of Canadian dollars)
(1) Variance related to intercompany eliminations of $0.1 million has been excluded from the bridge.
(2) Operating expenses excluding share-based compensation of ($9.5) million in Q2 2017 and $2.5 million in Q2 2016, and non-core items of $28.9 million and $27.7 million
in Q2 2017 and 2016. 27
Americas
CoalitionsInternational
Coalitions
Global
Loyalty
Solutions
Corporate
and Other
*THIS SLIDE CONTAINS NON-GAAP FINANCIAL MEASURES. PLEASE REFER TO SLIDE 4 FOR A DETAILED DESCRIPTION OF SUCH NON-GAAP FINANCIAL
MEASURES AND SLIDE 5 AND 7 FOR A RECONCILIATION TABLE TO THE MOST DIRECTLY COMPARABLE GAAP MEASURE, IF ANY.
Non-core
WORKING CAPITAL QUARTERLY TRENDS
($46.1)($40.2)
($19.7)
$35.6
$7.4
($63.0)
$22.9
$76.4
($33.0)
($15.6)
($31.4)
$122.7
($58.8)
$20.4
Q12014
Q22014
Q32014
Q42014
Q12015
Q22015
Q32015
Q42015
Q12016
Q22016
Q32016
Q42016
Q12017
Q22017
Change in operating assets and liabilities and other
Normalized Free Cash Flow before Dividends Paid
Favourable
working capital
due to timing
(in millions of Canadian dollars)
28
$9.1$11.2
$12.2
$21.9 $21.6
$18.1
$11.8
$30.0
$20.5
$23.7
$20.0
$29.4
$19.5
$14.4$16.1
$18.2
$12.1 $12.8
Q12013
Q22013
Q32013
Q42013
Q12014
Q22014
Q32014
Q42014
Q12015
Q22015
Q32015
Q42015
Q12016
Q22016
Q32016
Q42016
Q12017
Q22017
CAPITAL EXPENDITURES
(in millions of Canadian dollars)
FY 2013: $54.4
FY 2014: $81.5
FY 2015: $93.6
FY 2016: $68.2
Focus on
delivering
improving
returns and
driving capital
efficiencies
29
Capex down
11% YoY in the
quarter
1H 2017: $24.9

AEROPLAN GROSS BILLINGS
$321.0 $330.7
10.0
15.0
20.0
25.0
30.0
35.0
270.0
280.0
290.0
300.0
310.0
320.0
330.0
340.0
Q12015
Q22015
Q32015
Q42015
Q12016
Q22016
Q32016
Q42016
Q12017
Q22017
Mil
es
Is
su
ed
(bil
lio
n m
ile
s)
Gro
ss
Billi
ng
s(m
illi
on
s C
AD
)
Gross Billings (millions of Canadian dollars)
Aeroplan Gross Billings (million CAD)
Miles Issued - Financial Cards (billion)
Miles Issued - Total (billion)
Aeroplan GBs up
3% YoY driven by
strong financial
cards and Air
Canada up 8%
+1.2%
YoY
Growth*
+0.2%
YoY
Growth
3.0% YoY
30
* Accumulation excluding promo miles up 2.9% YoY.

AEROPLAN ACCUMULATION PATTERN
31
Accumulation
grew in the
quarter up 1.2%
driven by
Financial cards
and Air Canada
Q2 2017: 1.2%
Accumulation
trending in-line
as expected on
monthly basis
-10.0%-10.5% -9.7%
-5.6%
-0.1%
4.1% 4.8%
0.8%
5.4%3.8%
0.5%
-0.5%
1.0%
Q12015
Q22015
Q32015
Q42015
Q12016
Q22016
Q32016
Q42016
Q12017
Apr2017
May2017
Jun2017
Jul2017
Miles accumulated y/y%
AEROPLAN REDEMPTION AND UNIT COST TRENDS
(1.3%)
3.6%
(0.7%)
2.1%
(3.6%)
4.9% 4.2%
(1.6%)
3.9%
-8.6%
11.9%2.4%
1.06 1.05 1.051.02
1.041.01
0.98
1.03 1.03 1.021.04
1.00
-20.0%
-15.0%
-10.0%
-5.0%
0.0%
5.0%
10.0%
15.0%
20.0%
25.0%
Q1 2
015
A
Q2 2
015
A
Q3 2
015
A
Q4 2
015
A
Q1 2
016
A
Q2 2
016
A
Q3 2
016
A
Q4 2
016
A
Q1 2
017
A
Apr-
17
Ma
y-1
7
Jun-1
7
Mileage burn and unit cost
Miles redeemed YoY % Cost per mile (cents/mile)
32
Q2 2017: 1.8%
Q2 2017: 1.02
Average unit cost
broadly stable at
1.02
Mileage burn up
1.8% YoY driven
by higher Market
Fare Flight
rewards and non-
air rewards
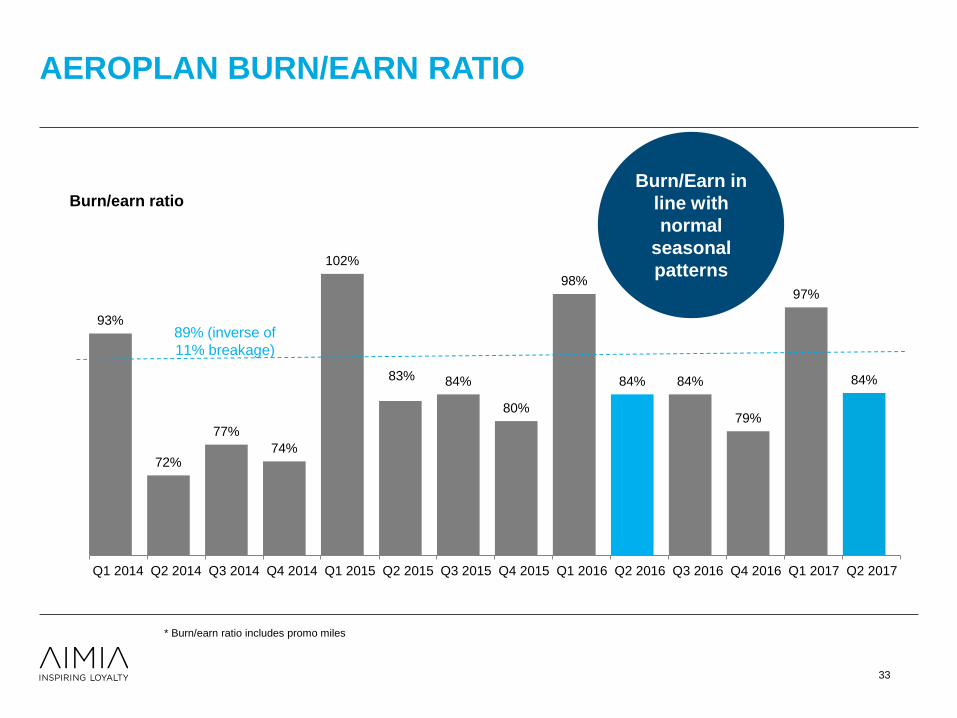
Improving accumulation trend
93%
72%
77%
74%
102%
83% 84%
80%
98%
84% 84%
79%
97%
84%
Q1 2014 Q2 2014 Q3 2014 Q4 2014 Q1 2015 Q2 2015 Q3 2015 Q4 2015 Q1 2016 Q2 2016 Q3 2016 Q4 2016 Q1 2017 Q2 2017
Burn/earn ratio
AEROPLAN BURN/EARN RATIO
Seasonally normal burn earn
Burn/Earn in
line with
normal
seasonal
patterns
89% (inverse of
11% breakage)
* Burn/earn ratio includes promo miles
33
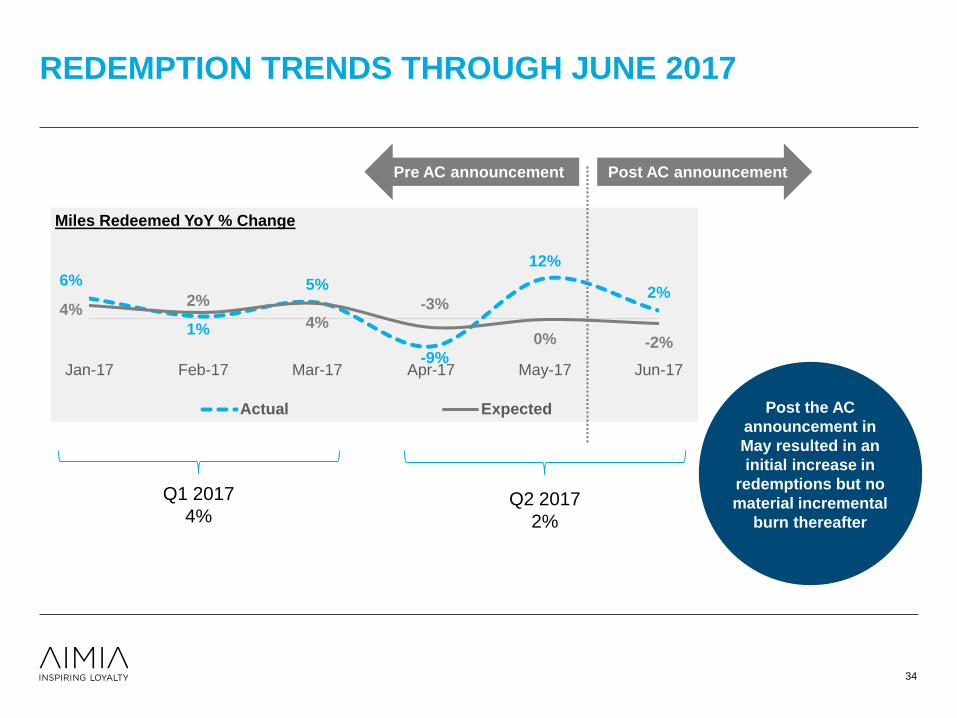
REDEMPTION TRENDS THROUGH JUNE 2017
34
6%
1%
5%
-9%
12%
2%4%
2%
4%-3%
0% -2%
Jan-17 Feb-17 Mar-17 Apr-17 May-17 Jun-17
Miles Redeemed YoY % Change
Actual Expected Post the AC
announcement in
May resulted in an
initial increase in
redemptions but no
material incremental
burn thereafter
Post AC announcementPre AC announcement
Q1 2017
4%Q2 2017
2%

11
-Ma
y
13
-Ma
y
15
-Ma
y
17
-Ma
y
19
-Ma
y
21
-Ma
y
23
-Ma
y
25
-Ma
y
27
-Ma
y
29
-Ma
y
31
-Ma
y
2-J
un
4-J
un
6-J
un
8-J
un
10
-Jun
12
-Jun
14
-Jun
16
-Jun
18
-Jun
20
-Jun
22
-Jun
24
-Jun
26
-Jun
28
-Jun
30
-Jun
Redemptions cash impact vs. prior year
Redemption expense
increased in the days post the
Air Canada non-renewal
announcement but this has
since moderated
REDEMPTION IMPACT POST AC ANNOUNCEMENT
35
(in millions of Canadian dollars)
Cumulative
cash impact of
$9 million above
prior year
represents 1%
of total annual
redemption
expense in 2016
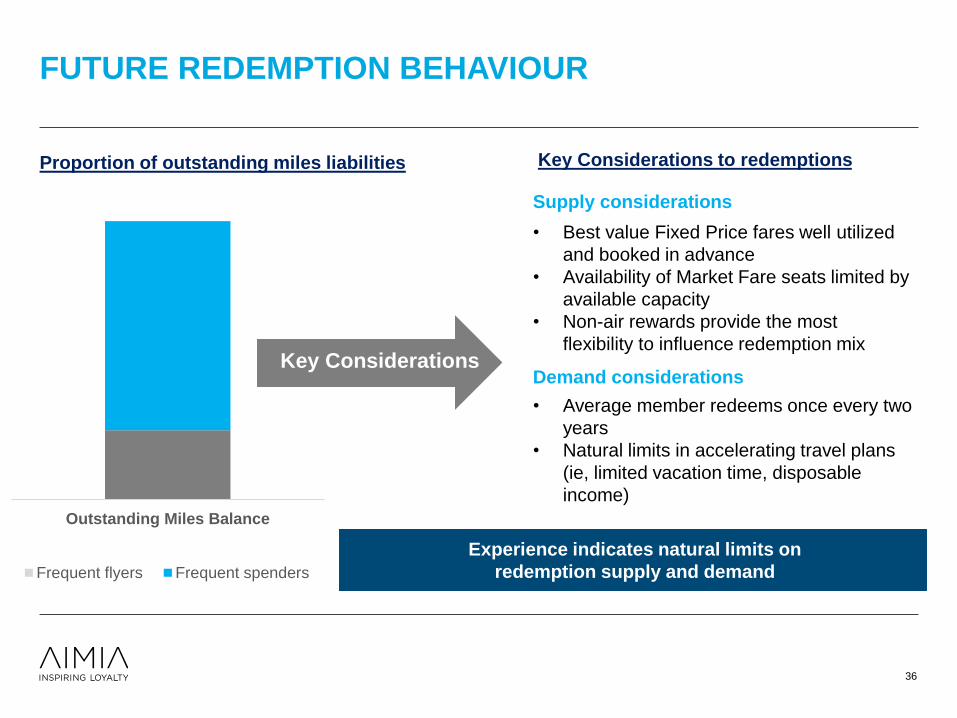
FUTURE REDEMPTION BEHAVIOUR
36
Outstanding Miles Balance
Frequent flyers Frequent spenders
Key Considerations to redemptionsProportion of outstanding miles liabilities
• Best value Fixed Price fares well utilized
and booked in advance
• Availability of Market Fare seats limited by
available capacity
• Non-air rewards provide the most
flexibility to influence redemption mix
• Average member redeems once every two
years
• Natural limits in accelerating travel plans
(ie, limited vacation time, disposable
income)
Key Considerations
Experience indicates natural limits on
redemption supply and demand
Supply considerations
Demand considerations
0
5,000
10,000
15,000
20,000
25,000
30,000
0.0
50.0
100.0
150.0
200.0
250.0
Q12015
Q22015
Q32015
Q42015
Q12016
Q22016
Q32016
Q42016
Q12017
Q22017
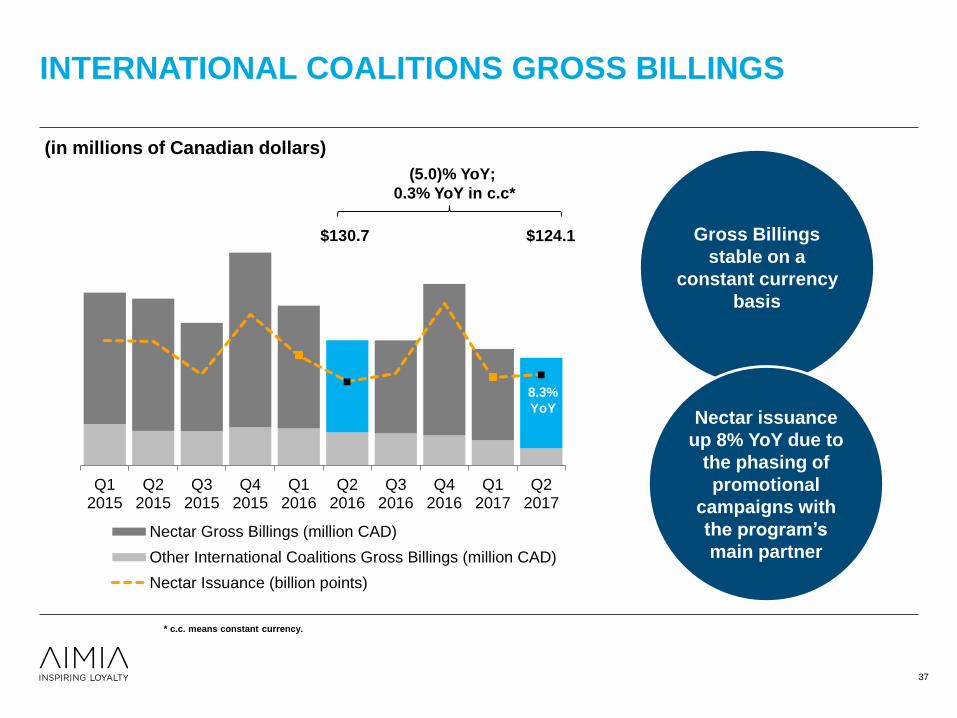
Nectar Gross Billings (million CAD)
Other International Coalitions Gross Billings (million CAD)
Nectar Issuance (billion points)
INTERNATIONAL COALITIONS GROSS BILLINGS
(in millions of Canadian dollars)
37
$124.1$130.7
(5.0)% YoY;
0.3% YoY in c.c*
Gross Billings
stable on a
constant currency
basis
Nectar issuance
up 8% YoY due to
the phasing of
promotional
campaigns with
the program’s
main partner
8.3%
YoY
* c.c. means constant currency.
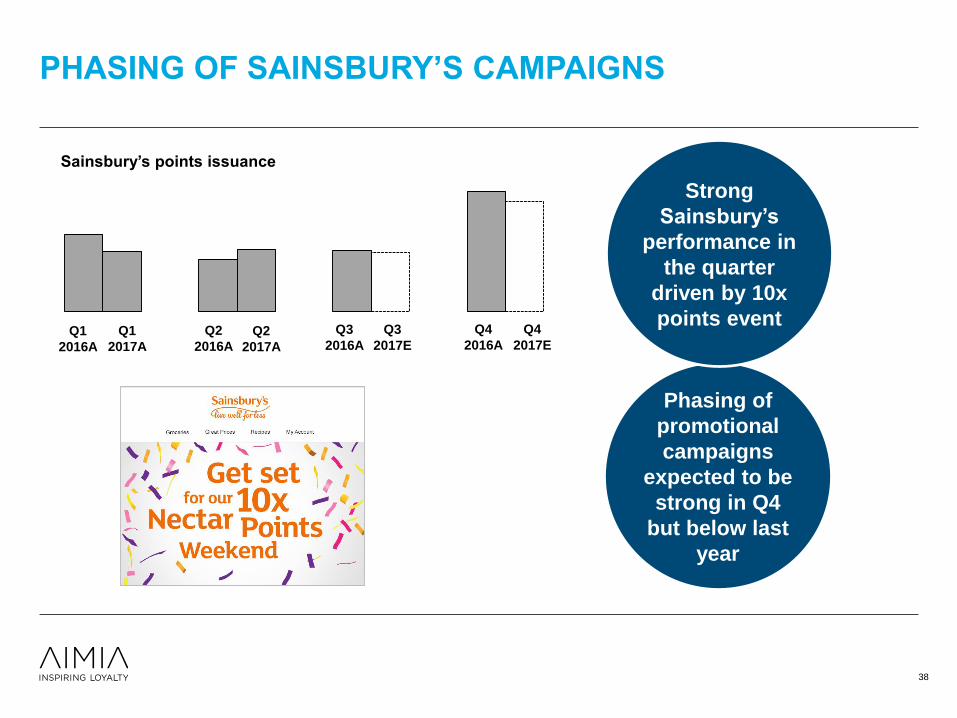
PHASING OF SAINSBURY’S CAMPAIGNS
Sainsbury’s points issuance
38
Q1
2016A
Q1
2017A
Q2
2016A
Q2
2017A
Q3
2016A
Q3
2017E
Q4
2016A
Q4
2017E
Phasing of
promotional
campaigns
expected to be
strong in Q4
but below last
year
Strong
Sainsbury’s
performance in
the quarter
driven by 10x
points event

GLOBAL LOYALTY SOLUTIONS GROSS BILLINGS
$51.8$46.9
Q12015
Q22015
Q32015
Q42015
Q12016
Q22016
Q32016
Q42016
Q12017
Q22017
(9.5)% YoY;
(12.4)% YoY in c.c.*
(in millions of Canadian dollars)
39
New Zealand
business
divestment of
around $6 million
driving lower
Gross Billings in
the quarter
* c.c. means constant currency.

$4.6 million
distribution
received in Q2
2017
CLUB PREMIER OVERVIEW
• Aimia owns 48.9% of PLM Premier, S.A.P.I. de C.V (PLM), which operates Club Premier.
• Club Premier is the leading coalition program in Mexico with a growing member base and over 100 partners,
and the operator of Aeromexico's frequent flyer program.
• Members enrolled at June 30, 2017: 5.1 million
Santander Bank
Aeromexico (15 years)
American Express
Over 100 retail &
other partners
40
Adjusted EBITDA:
Q2 2017:
US$19.0m
AE margin*: 34.5%
FY 2016:
US$48.1m
AE margin*: 24.9%
*As a percentage of Gross Billings.
*THIS SLIDE CONTAINS NON-GAAP FINANCIAL MEASURES. PLEASE REFER TO SLIDE 4 FOR A DETAILED DESCRIPTION OF SUCH NON-GAAP FINANCIAL
MEASURES.
Key partners and contract lengths:
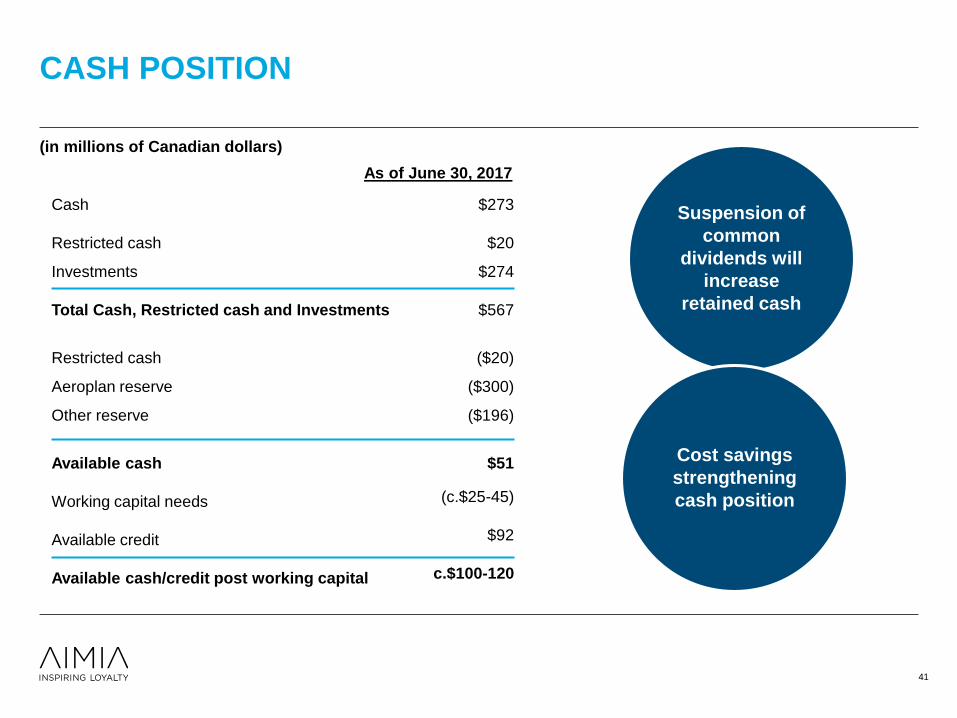
CASH POSITION
Cash
Restricted cash
$273
$20
Investments
Total Cash, Restricted cash and Investments
$274
$567
Restricted cash ($20)
Aeroplan reserve ($300)
Other reserve ($196)
Available cash
Working capital needs
Available credit
Available cash/credit post working capital
$51
(c.$25-45)
$92
c.$100-120
As of June 30, 2017
(in millions of Canadian dollars)
41
Suspension of
common
dividends will
increase
retained cash
Cost savings
strengthening
cash position

Debt/Adjusted
EBITDA*
below 2x
3,100
Aimia financing structure
(in millions of Canadian dollars)
FINANCING
Effective interest
rate at 4.5%
(1) At June 30, 2017 Aimia has issued irrevocable letters of credit in the aggregate amount of $8.4 million that reduce the available credit under the revolving facility.
Sept 30, 2016
June 30, 2017
$650
$250
$300(undrawn)
$300
$0
$100
$200
$300
$400
$500
$600
$700
$800
$900
$1,000
Senior secured notes Revolving credit facility
Maturity profile
extended to
2020 with early
redemption of
2018 senior
secured notes
(1)
*THIS SLIDE CONTAINS NON-GAAP FINANCIAL MEASURES. PLEASE REFER TO SLIDE 4 FOR A DETAILED DESCRIPTION OF SUCH NON-GAAP FINANCIAL
MEASURES AND SLIDE 5 AND 7 FOR A RECONCILIATION TABLE TO THE MOST DIRECTLY COMPARABLE GAAP MEASURE, IF ANY.
$200
(drawn)(1)
42

DIVIDENDS
43
• As communicated on June 14, 2017, the Company is prohibited from paying dividends
declared on May 10, 2017, and originally scheduled to have been paid on June 30,
2017, as well as declaring any further dividends on any of the outstanding Common
Shares or Preferred Shares, based on Aimia’s determination that the capital impairment
test set forth in paragraph 42(b) of the Canada Business Corporations Act (the “CBCA”)
would not be satisfied.
• Recognizing the need to preserve the Company’s financial flexibility, liquidity and capital
resources in the coming years, the Board has further determined that the Company will
not declare dividends on its Common Shares for the foreseeable future, irrespective of
the capital impairment test.
• Dividends continue to accrue to the Company’s Preferred Shares, in accordance with
their terms even if they are not declared.
• There can be no assurance that the Company will, at some future point in time, be in a
position to pay the dividends previously declared and declare and/or pay any future
dividends.
CONCLUDING REMARKS
DAVID JOHNSTON

2017 GUIDANCE*
*THIS SLIDE CONTAINS NON-GAAP FINANCIAL MEASURES. PLEASE REFER TO SLIDE 3 FOR A DESCRIPTION OF THE ASSUMPTIONS MADE WITH RESPECT TO
AND RISKS RELATED TO THE 2017 FORECASTS, SLIDE 4 FOR A DETAILED DESCRIPTION OF SUCH NON-GAAP FINANCIAL MEASURES, AND SLIDE 5 FOR A
RECONCILIATION TABLE TO THE MOST DIRECTLY COMPARABLE GAAP MEASURE, IF ANY.
(in millions of Canadian dollars) 2016 2017 Guidance(5)
Gross Billings (core business)
Gross Billings
$2,142(1)(2)
$2,340
Core business(4)
broadly stable
around $2.1 billion
Adjusted EBITDA
and margin
$239(1)
11.2% margin(1) Core business
(4)around 12.0%
Free Cash Flow before Dividends
Paid$206
(3)Above $220
Capital expenditures $68.2 Between $45 and $50
(1) Excluding the US Channel and Employee Loyalty business and Enhancement Services business and $9.0 million severance payments related to the organizational change announced on August 14, 2015.
(2) Excluding $31.0 million gross-to-net accounting impact in the rewards fulfilment business.
(3) Excludes $50.3 million in tax refunds received, $16.3 million in severance payments related to the organizational change announced on August 14, 2015, and $6.5 million in prepayment of interest expense and related fees associated with the early
redemption of the Senior Secured Notes Series 3.
(4) The “core business” excludes the results of the US CEL business within the Corporate & Other division as well as the results of the Enhancement Services business sold in July 2016. Guidance has not been adjusted for the results of the New Zealand
business which had been expected to deliver around $36 million of Gross Billings and $0.4 million of Adjusted EBITDA in 2017 and had been taken into account within the core business. At the sale completion date, the New Zealand business had
delivered Gross Billings of around $15 million and Adjusted EBITDA of $0.1 million.
(5) The guidance excludes the impact of actions related to restructuring, disposals of non-core assets or as a consequence of any changes in major partner contracts. Around $10 million of incremental interest expense was not contemplated in the guidance
and relates to the early redemption of the 2018 notes. 2017 costs related to restructuring actions are expected to be between $25 and $30 million and include the onerous provision of $20.3 million recorded in the second quarter, with cash expense in
2017 expected to be in the range of $20 to $25 million.
45
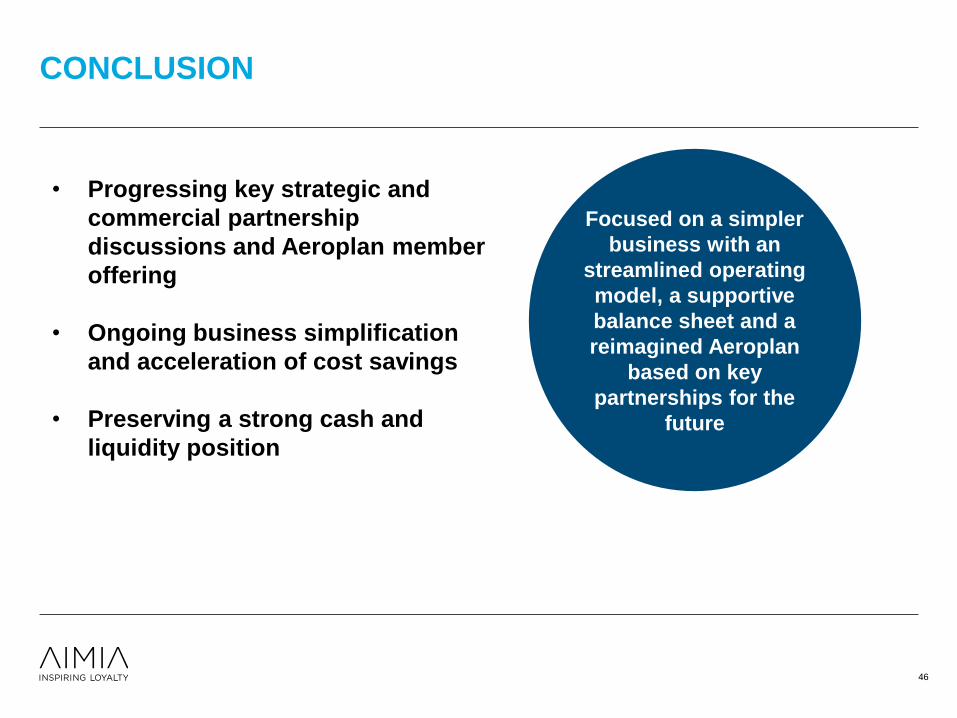
CONCLUSION
46
Focused on a simpler
business with an
streamlined operating
model, a supportive
balance sheet and a
reimagined Aeroplan
based on key
partnerships for the
future
• Progressing key strategic and
commercial partnership
discussions and Aeroplan member
offering
• Ongoing business simplification
and acceleration of cost savings
• Preserving a strong cash and
liquidity position

Q&A
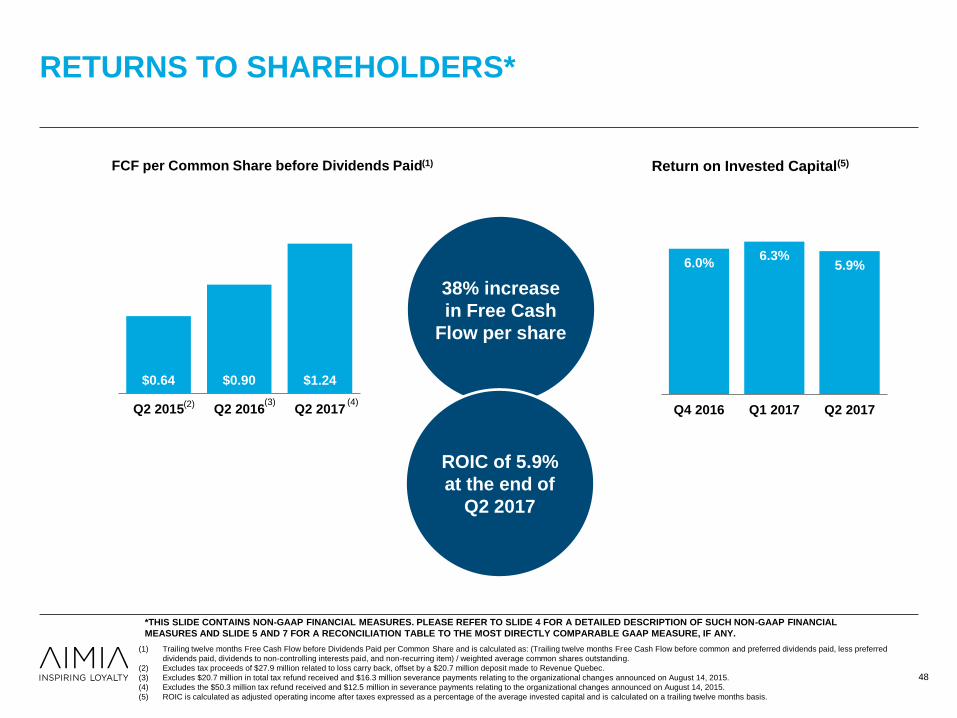
$0.64 $0.90 $1.24$0.00
$0.20
$0.40
$0.60
$0.80
$1.00
$1.20
$1.40
Q2 2015 Q2 2016 Q2 2017
RETURNS TO SHAREHOLDERS*
48
(1) Trailing twelve months Free Cash Flow before Dividends Paid per Common Share and is calculated as: (Trailing twelve months Free Cash Flow before common and preferred dividends paid, less preferred
dividends paid, dividends to non-controlling interests paid, and non-recurring item) / weighted average common shares outstanding.
(2) Excludes tax proceeds of $27.9 million related to loss carry back, offset by a $20.7 million deposit made to Revenue Quebec.
(3) Excludes $20.7 million in total tax refund received and $16.3 million severance payments relating to the organizational changes announced on August 14, 2015.
(4) Excludes the $50.3 million tax refund received and $12.5 million in severance payments relating to the organizational changes announced on August 14, 2015.
(5) ROIC is calculated as adjusted operating income after taxes expressed as a percentage of the average invested capital and is calculated on a trailing twelve months basis.
FCF per Common Share before Dividends Paid(1)
6.0%6.3%
5.9%
$0.00
$0.01
$0.02
$0.03
$0.04
$0.05
$0.06
$0.07
Q4 2016 Q1 2017 Q2 2017
38% increase
in Free Cash
Flow per share
Return on Invested Capital(5)
(2) (3) (4)
*THIS SLIDE CONTAINS NON-GAAP FINANCIAL MEASURES. PLEASE REFER TO SLIDE 4 FOR A DETAILED DESCRIPTION OF SUCH NON-GAAP FINANCIAL
MEASURES AND SLIDE 5 AND 7 FOR A RECONCILIATION TABLE TO THE MOST DIRECTLY COMPARABLE GAAP MEASURE, IF ANY.
ROIC of 5.9%
at the end of
Q2 2017

BALANCE SHEET
49
CASH & INVESTMENTS
(in millions of Canadian dollars)
June
30, 2017
Cash and cash equivalents 273
Restricted cash 20
Short-term investments 80
Long-term investments in bonds 194
Cash and Investments 567
Aeroplan reserves (300)
Other loyalty programs reserves (196)
Restricted cash (20)
Working capital requirements
Between
(25) and
(45)
Available credit 92
Surplus Cashc. between
100 and 120
DEBT
(in millions of Canadian
dollars)
Interest
Rate Maturing
June
30, 2017
Revolving Facility(1) 3.08% Apr. 23, 2020 200.0
Senior Secured Notes 5 4.35% Jan. 22, 2018 -
Senior Secured Notes 4 5.60% May 17, 2019 250.0
Total Long-Term Debt 450.0
Less Current Portion -
Long-Term Debt 450.0
(1) As of June 30, 2017, Aimia had a $300.0 million revolving credit facility maturing on April 23, 2020. Interest rates on this facility are tied to the Corporation’s credit ratings and range
between Canadian prime rate plus 0.20% to 1.50% and Bankers’ Acceptance and LIBOR rates plus 1.20% to 2.50%. As of June 30, 2017, Aimia also had irrevocable outstanding
letters of credit in the aggregate amount of $8.4 million which reduces the available credit under this facility.
(2) Annual dividend rate is subject to a rate reset on March 31, 2020 and every 5 years thereafter. No dividends declared in Q2 2017 due to restrictions under CBCA.
(3) Annual dividend rate is based on the 90-day Government of Canada Treasury Bill yield + 3.75%. No dividends declared in Q2 2017 due to restrictions under CBCA.
(4) Annual dividend rate is subject to a rate reset on March 31, 2019 and every 5 years thereafter. No dividends declared in Q2 2017 due to restrictions under CBCA.
PREFERRED SHARES
(in millions of Canadian
dollars)
Interest
Rate Maturing
June
30, 2017
Preferred Shares (Series 1) 4.50%(2) Perpetual 98.8
Preferred Shares (Series 2) Floating(3) Perpetual 73.7
Preferred Shares (Series 3) 6.25%(4) Perpetual 150.0
Total Preferred Shares 322.5
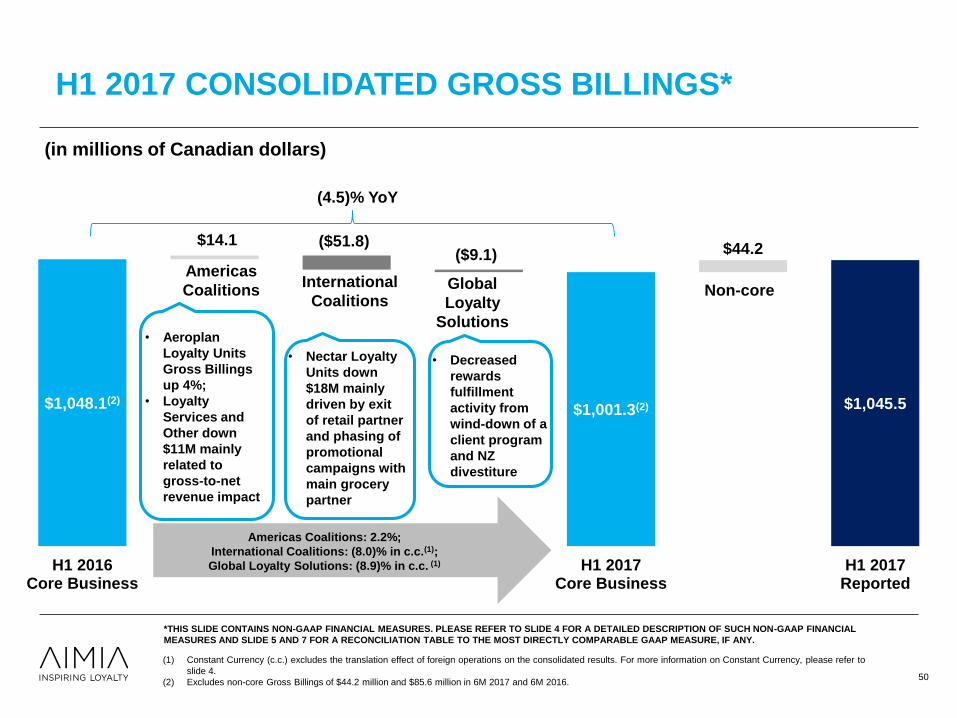
$1,001.3(2) $1,045.5
($51.8)($9.1)
$14.1$44.2
$1,048.1(2)
H1 2016Core Business
H1 2017Core Business
H1 2017Reported
(1) Constant Currency (c.c.) excludes the translation effect of foreign operations on the consolidated results. For more information on Constant Currency, please refer to
slide 4.
(2) Excludes non-core Gross Billings of $44.2 million and $85.6 million in 6M 2017 and 6M 2016.
H1 2017 CONSOLIDATED GROSS BILLINGS*
(in millions of Canadian dollars)
Americas
CoalitionsInternational
CoalitionsGlobal
Loyalty
Solutions
Americas Coalitions: 2.2%;
International Coalitions: (8.0)% in c.c.(1);
Global Loyalty Solutions: (8.9)% in c.c. (1)
50
*THIS SLIDE CONTAINS NON-GAAP FINANCIAL MEASURES. PLEASE REFER TO SLIDE 4 FOR A DETAILED DESCRIPTION OF SUCH NON-GAAP FINANCIAL
MEASURES AND SLIDE 5 AND 7 FOR A RECONCILIATION TABLE TO THE MOST DIRECTLY COMPARABLE GAAP MEASURE, IF ANY.
Non-core
• Aeroplan
Loyalty Units
Gross Billings
up 4%;
• Loyalty
Services and
Other down
$11M mainly
related to
gross-to-net
revenue impact
• Decreased
rewards
fulfillment
activity from
wind-down of a
client program
and NZ
divestiture
• Nectar Loyalty
Units down
$18M mainly
driven by exit
of retail partner
and phasing of
promotional
campaigns with
main grocery
partner
(4.5)% YoY
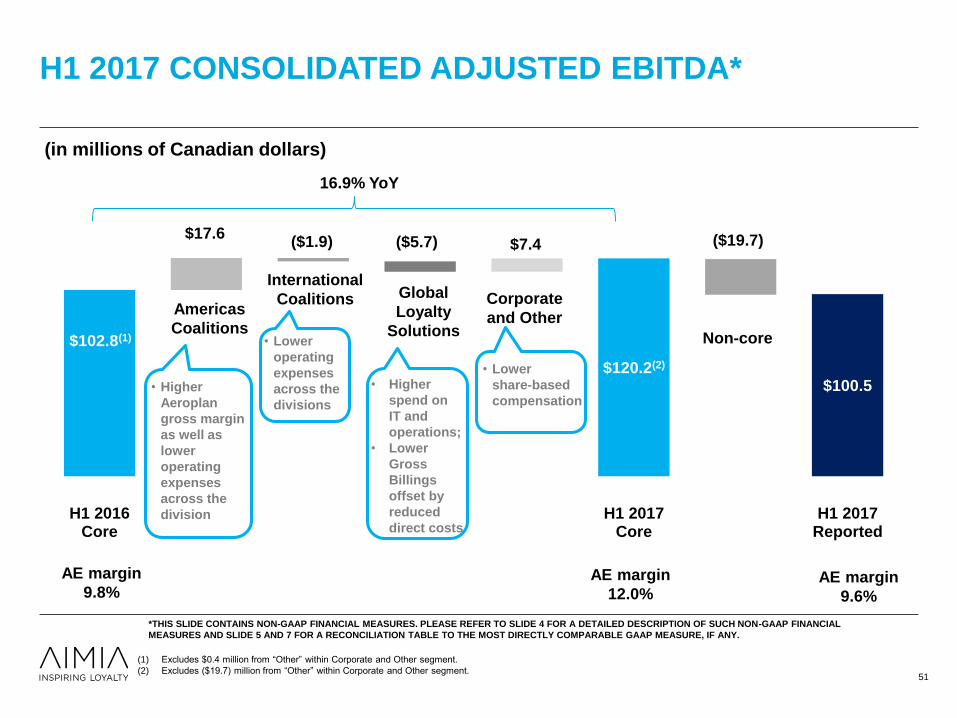
$100.5$120.2(2)
($1.9) ($5.7) ($19.7)$17.6$7.4
$102.8(1)
H1 2016Core
H1 2017Core
H1 2017Reported
H1 2017 CONSOLIDATED ADJUSTED EBITDA*
Americas
Coalitions
International
Coalitions Global
Loyalty
Solutions
Corporate
and Other
AE margin
9.8%AE margin
9.6%
(1) Excludes $0.4 million from “Other” within Corporate and Other segment.
(2) Excludes ($19.7) million from “Other” within Corporate and Other segment.
(in millions of Canadian dollars)
51
*THIS SLIDE CONTAINS NON-GAAP FINANCIAL MEASURES. PLEASE REFER TO SLIDE 4 FOR A DETAILED DESCRIPTION OF SUCH NON-GAAP FINANCIAL
MEASURES AND SLIDE 5 AND 7 FOR A RECONCILIATION TABLE TO THE MOST DIRECTLY COMPARABLE GAAP MEASURE, IF ANY.
• Higher
Aeroplan
gross margin
as well as
lower
operating
expenses
across the
division
• Lower
operating
expenses
across the
divisions
• Higher
spend on
IT and
operations;
• Lower
Gross
Billings
offset by
reduced
direct costs
AE margin
12.0%
Non-core
• Lower
share-based
compensation
16.9% YoY
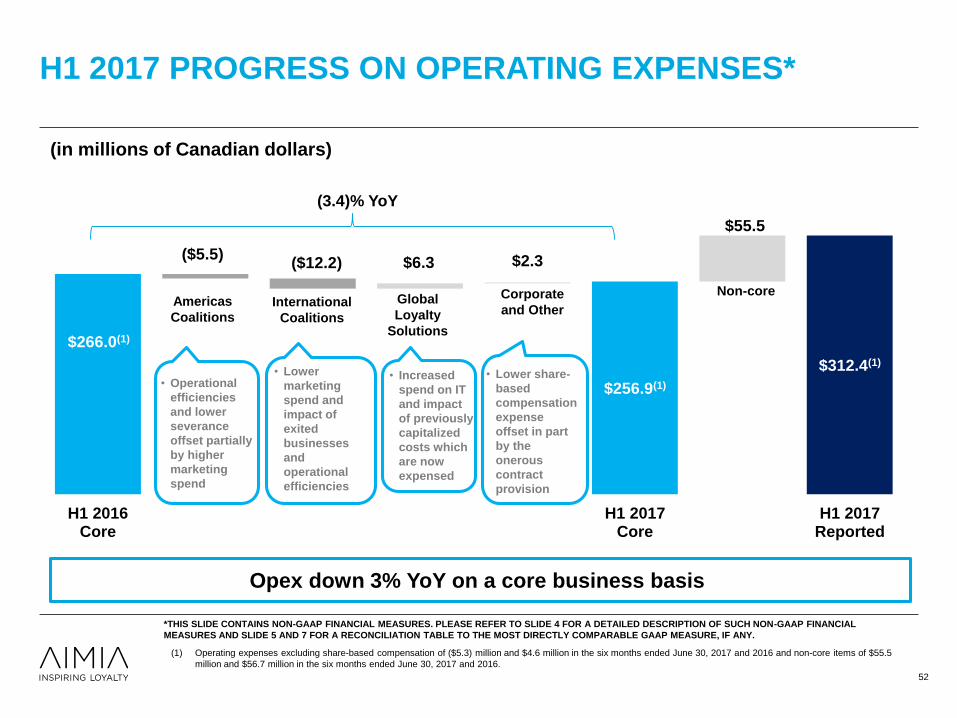
$312.4(1)
$256.9(1)
($5.5)($12.2) $6.3 $2.3
$55.5
$266.0(1)
H1 2016Core
H1 2017Core
H1 2017Reported
• Operational
efficiencies
and lower
severance
offset partially
by higher
marketing
spend
• Lower
marketing
spend and
impact of
exited
businesses
and
operational
efficiencies
• Increased
spend on IT
and impact
of previously
capitalized
costs which
are now
expensed
• Lower share-
based
compensation
expense
offset in part
by the
onerous
contract
provision
H1 2017 PROGRESS ON OPERATING EXPENSES*
(in millions of Canadian dollars)
(1) Operating expenses excluding share-based compensation of ($5.3) million and $4.6 million in the six months ended June 30, 2017 and 2016 and non-core items of $55.5
million and $56.7 million in the six months ended June 30, 2017 and 2016.
52
Opex down 3% YoY on a core business basis
Americas
CoalitionsInternational
Coalitions
Global
Loyalty
Solutions
Corporate
and Other
*THIS SLIDE CONTAINS NON-GAAP FINANCIAL MEASURES. PLEASE REFER TO SLIDE 4 FOR A DETAILED DESCRIPTION OF SUCH NON-GAAP FINANCIAL
MEASURES AND SLIDE 5 AND 7 FOR A RECONCILIATION TABLE TO THE MOST DIRECTLY COMPARABLE GAAP MEASURE, IF ANY.
Non-core
(3.4)% YoY

QUARTERLY CONSOLIDATED COST OF REWARDS
TREND
$223 $231 $218 $225$181 $201 $202 $207 $189 $197 $192 $193 $196 $195
$182$200
$152$106 $174 $145 $129 $94
$164 $144$120
$301 $287$258
Q12014
Q12015
Q12016
Q12017
Q22014
Q22015
Q22016
Q22017
Q32014
Q32015
Q32016
Q42014
Q42015
Q42016
Aeroplan Cost of Rewards Other Cost of Rewards and Direct Costs
53
(in millions of Canadian dollars)

32.6(1) 58.7 63.9 60.0 52.1 61.8(2) 49.1(3) 75.9(3) 50.6(4) 56.2(4) 62.8(4) 67.9(4) 60.1(5) 67.1(6)
5.3%(1)
9.1%
10.1%
8.7% 8.8%
10.2%(2)
8.5%(3)
11.0%(3)
8.8%(4)
10.0%(4)
11.2%(4)
10.5%(4)
11.4%(5)
12.9%(6)
0.0%
2.0%
4.0%
6.0%
8.0%
10.0%
12.0%
14.0%
-10
10
30
50
70
90
110
130
150
Q12014
Q22014
Q32014
Q42014
Q12015
Q22015
Q32015
Q42015
Q12016
Q22016
Q32016
Q42016
Q12017
Q22017
INCREASING ADJUSTED EBITDA MARGIN*EXCLUDING SEVERANCE COSTS
54
(1) Excludes the $100.0 TD payment received in the first quarter of 2014.
(2) Excludes the $45.7 million reduction in the Card Migration Provision in the second quarter of 2015.
(3) Excludes severance expense of $12.7 million in the fourth quarter of 2015 and $3.0 million of severance expense in the third quarter of 2015 related to the organizational changes announced on August 14, 2015. The full year 2015 severance expense
was $15.7 million related to organizational changes.
(4) Excluding severance costs in relation to organizational changes announced on August 14, 2015 of $1.9 million in Q1 2016, $1.6 million in Q2 2016, and $2.3 million in Q3 2016, and $3.2 million in Q4 2016. The full year 2016 severance expense was
$9.0 million related to the organizational changes announced on August 14, 2015.
(5) Excluding severance costs in relation to organizational changes announced on August 14, 2015 of $1.3 million in Q1 2017.
(6) Excluding severance costs in relation to organizational changes announced on August 14, 2015 of $5.1 million and unfavourable impact of an onerous contract provision of $20.3 million related to an IT outsourcing arrangement in the US in Q2 2017.
FY 2014: 8.1%(1)
FY 2015: 9.5%(2)(3)
FY 2016: 10.4%(4)
*THIS SLIDE CONTAINS NON-GAAP FINANCIAL MEASURES. PLEASE REFER TO SLIDE 4 FOR A DETAILED DESCRIPTION OF SUCH NON-GAAP FINANCIAL
MEASURES AND SLIDE 5 FOR A RECONCILIATION TABLE TO THE MOST DIRECTLY COMPARABLE GAAP MEASURE, IF ANY.
(in millions of Canadian dollars,
except percentages)
YTD 2017: 12.2%(6)
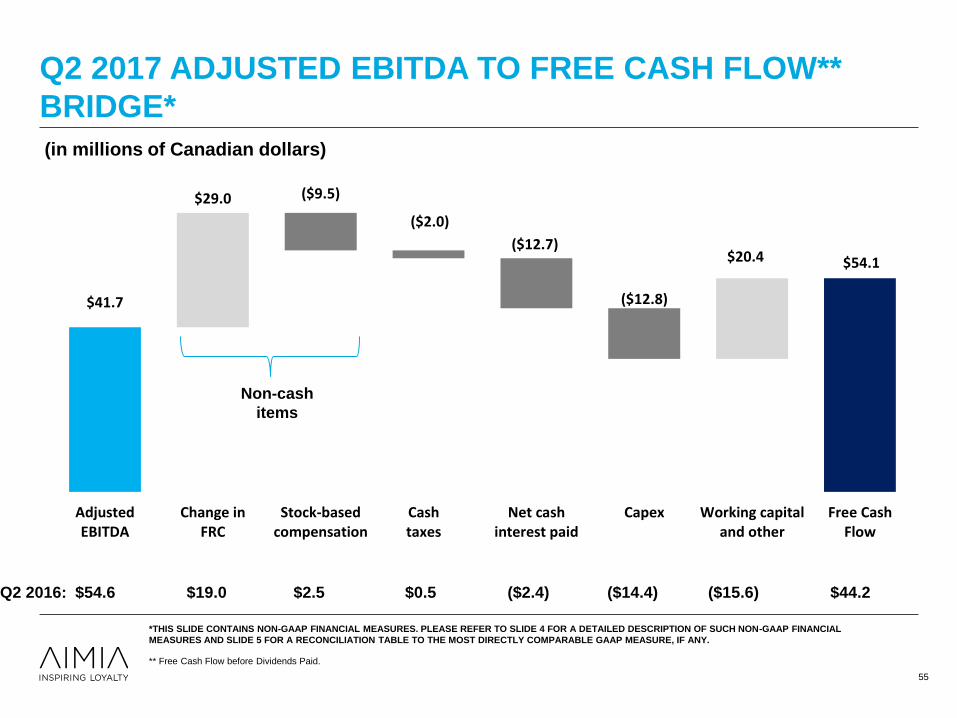
$54.1
($9.5)
($2.0)
($12.7)
($12.8)
$29.0
$20.4
$41.7
$0.0
$10.0
$20.0
$30.0
$40.0
$50.0
$60.0
$70.0
$80.0
AdjustedEBITDA
Change inFRC
Stock-basedcompensation
Cashtaxes
Net cashinterest paid
Capex Working capitaland other
Free CashFlow
Q2 2017 ADJUSTED EBITDA TO FREE CASH FLOW**
BRIDGE*
Q2 2016: $54.6 $19.0 $2.5 $0.5 ($2.4) ($14.4) ($15.6) $44.2
(in millions of Canadian dollars)
** Free Cash Flow before Dividends Paid.
Non-cash
items
*THIS SLIDE CONTAINS NON-GAAP FINANCIAL MEASURES. PLEASE REFER TO SLIDE 4 FOR A DETAILED DESCRIPTION OF SUCH NON-GAAP FINANCIAL
MEASURES AND SLIDE 5 FOR A RECONCILIATION TABLE TO THE MOST DIRECTLY COMPARABLE GAAP MEASURE, IF ANY.
55

H1 2017 ADJUSTED EBITDA TO FREE CASH FLOW**
BRIDGE*
H1 2016: $103.2 $15.4 $4.6 ($2.7) ($12.7) ($33.9) ($48.6) $25.3
(in millions of Canadian dollars)
** Free Cash Flow before Dividends Paid.
Non-cash
items
*THIS SLIDE CONTAINS NON-GAAP FINANCIAL MEASURES. PLEASE REFER TO SLIDE 4 FOR A DETAILED DESCRIPTION OF SUCH NON-GAAP FINANCIAL
MEASURES AND SLIDE 5 FOR A RECONCILIATION TABLE TO THE MOST DIRECTLY COMPARABLE GAAP MEASURE, IF ANY.
56
$30.3
($5.3)($5.4)
($16.8)
($24.9)
($38.4)
$20.6
$100.5
AdjustedEBITDA
Change inFRC
Stock-basedcompensation
Cashtaxes
Net cashinterest paid
Capex Working capitaland other
Free CashFlow
Q2 & H1 2017 GROSS BILLINGS TO FREE CASH FLOW
WALK*
5757
n.m. means not meaningful.
(1) Severance costs paid in relation to organizational changes announced on August 14, 2015 of $4.3 and $4.9 in Q2 2017 and 2016 and $8.0 and $11.8 million in H1 2017 and
2016.
*THIS SLIDE CONTAINS NON-GAAP FINANCIAL MEASURES. PLEASE REFER TO SLIDE 4 FOR A DETAILED DESCRIPTION OF SUCH NON-GAAP FINANCIAL
MEASURES AND SLIDE 5 FOR A RECONCILIATION TABLE TO THE MOST DIRECTLY COMPARABLE GAAP MEASURE, IF ANY.
(in millions of Canadian dollars) Q2 2017 Q2 2016 H1 2017 H1 2016
Gross Billings 520.3 560.7 1,045.5 1,133.7
Less: Cost of rewards and direct costs (300.7) (331.3) (632.1) (700.8)
Less: Operating expenses (excluding share-based
compensation and impairment charges)(165.9) (161.0) (312.4) (322.7)
Add: Distributions from equity-accounted
investments7.5 7.7 14.8 13.0
Less: Income taxes (paid)/received, net (2.0) 0.5 (5.4) (2.7)
Less: Net cash interest paid (12.7) (2.4) (16.8) (12.7)
Less: Capital expenditures (12.8) (14.4) (24.9) (33.9)
Less: Changes in operating assets and liabilities
and other20.4 (15.6) (38.4) (48.6)
Free Cash Flow before Dividends Paid
(reported)54.1 44.2 30.3 25.3
Excluding non-recurring items 4.3(1) 4.9(1) 8.0(1) 11.8(1)
Free Cash Flow before Dividends Paid
(normalized)58.4 49.1 38.3 37.1

DRIVERS IMPACTING GROSS BILLINGS AND
REDEMPTIONS
Canadian FX
expected to
continue at
current pace
through 2017
58
Canadian Household Consumption Expenditure Final (HCE)*
*Source: RBC Economics Research, March 2017
-Quarter-over-quarter annualized % change unless otherwise indicated
Consumer debt
continues to rise
and impact
spend through
the year 1.7%
2.0%2.1%2.2%
2.6%2.7%
2.3%
0.0%
0.5%
1.0%
1.5%
2.0%
2.5%
3.0%
Q4-17 (F)Q3-17 (F)Q2-17 (F)Q1-17 (F)Q4-16 (A)Q3-16 (A)Q2-16 (A)
2.1%
Q1-16 (A)
*THIS SLIDE CONTAINS NON-GAAP FINANCIAL MEASURES. PLEASE REFER TO SLIDE 4 FOR A DETAILED DESCRIPTION OF SUCH NON-GAAP FINANCIAL
MEASURES AND SLIDE 5 FOR A RECONCILIATION TABLE TO THE MOST DIRECTLY COMPARABLE GAAP MEASURE, IF ANY.

Q2 AND H1 2017 FINANCIAL HIGHLIGHTS – AMERICAS
COALITIONS*
59(1) Before depreciation and amortization.
*THIS SLIDE CONTAINS NON-GAAP FINANCIAL MEASURES. PLEASE REFER TO SLIDE 4 FOR A DETAILED DESCRIPTION OF SUCH NON-GAAP FINANCIAL
MEASURES AND SLIDE 5 FOR A RECONCILIATION TABLE TO THE MOST DIRECTLY COMPARABLE GAAP MEASURE, IF ANY.
Periods Ended June 30,
Three Months Ended Six Months Ended
(in millions of Canadian dollars) 2017 2016 2017 2016
Reported Reported Reported Reported
Gross Billings
Aeroplan 330.7 321.0 639.6 615.1
Loyalty Services & Other 15.0 32.9 34.8 70.6
Intercompany eliminations (7.2) (19.3) (16.3) (41.7)
Total revenue
Aeroplan 304.4 295.6 629.1 605.1
Loyalty Services & Other 15.1 32.7 34.7 70.5
Intercompany eliminations (7.2) (19.3) (16.3) (41.7)
Gross margin(1)
Aeroplan 97.1 93.7 196.7 185.1
Loyalty Services & Other 7.9 7.2 16.6 15.7
Intercompany eliminations (0.1) - (0.1) (0.1)
Adjusted EBITDA
Adjusted EBITDA margin 19.0% 18.0% 19.3% 17.0%
Aeroplan 61.4 58.9 119.6 107.7
Loyalty Services & Other 3.0 1.4 7.7 2.0
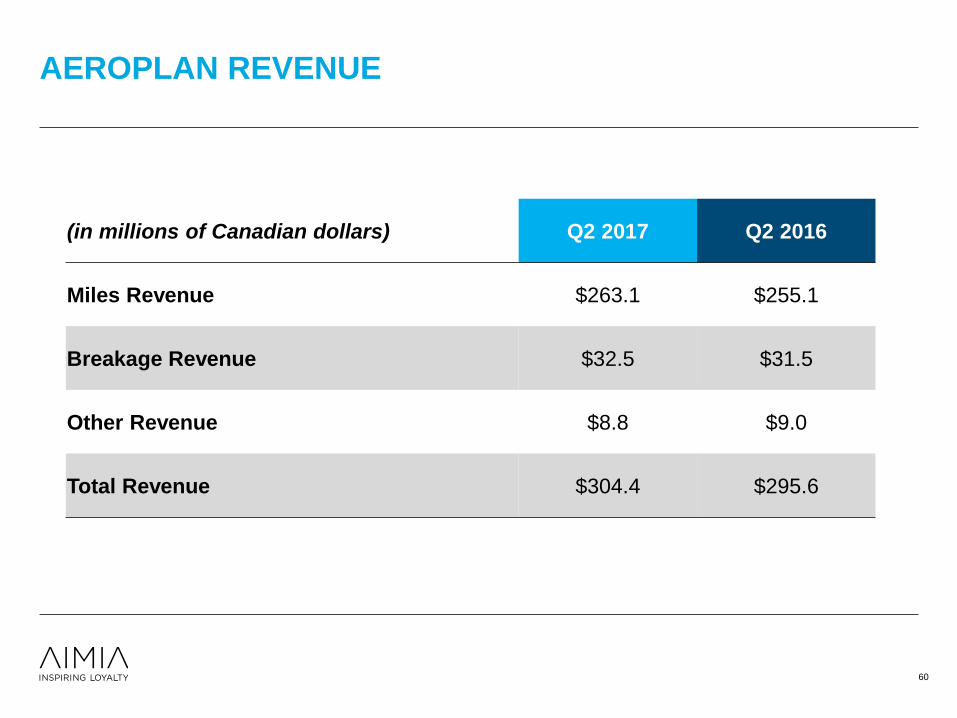
AEROPLAN REVENUE
60
(in millions of Canadian dollars) Q2 2017 Q2 2016
Miles Revenue $263.1 $255.1
Breakage Revenue $32.5 $31.5
Other Revenue $8.8 $9.0
Total Revenue $304.4 $295.6
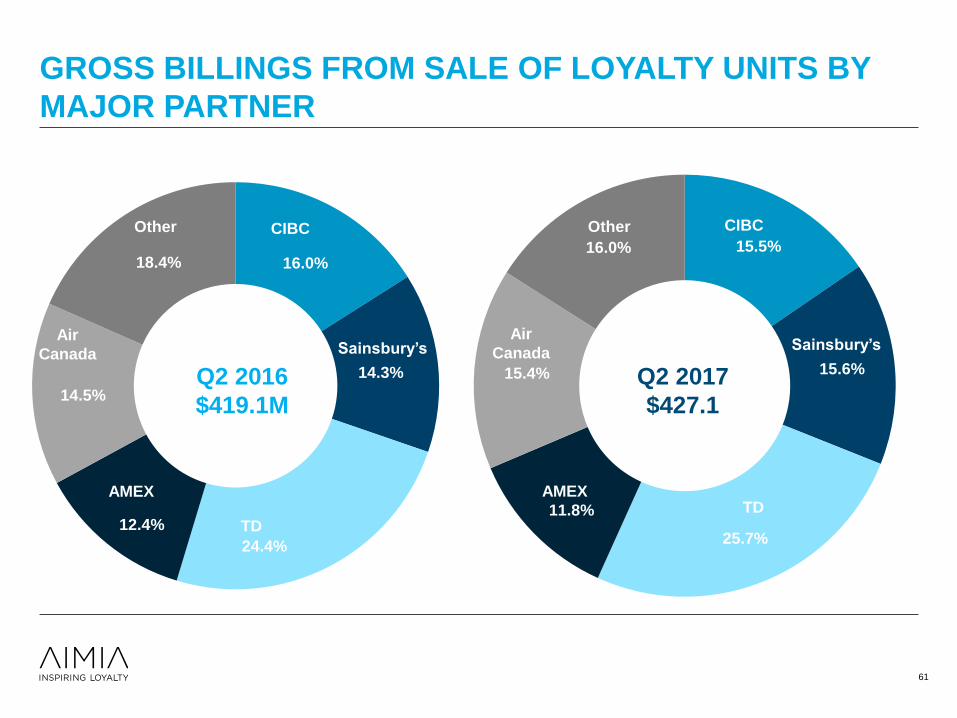
GROSS BILLINGS FROM SALE OF LOYALTY UNITS BY
MAJOR PARTNER
61
15.5%
15.6%
25.7%
11.8%
15.4%
16.0%
AMEX
CIBC
TD
Air
Canada
Other
CIBC
Sainsbury’s
Air Canada
Other
Q2 2017
$427.1
Sainsbury’s
AMEX
TD
16.0%
14.3%
24.4%
12.4%
14.5%
18.4%
AMEX
Q2 2016
$419.1M
CIBC
TD
Air
Canada
Other
Sainsbury’s
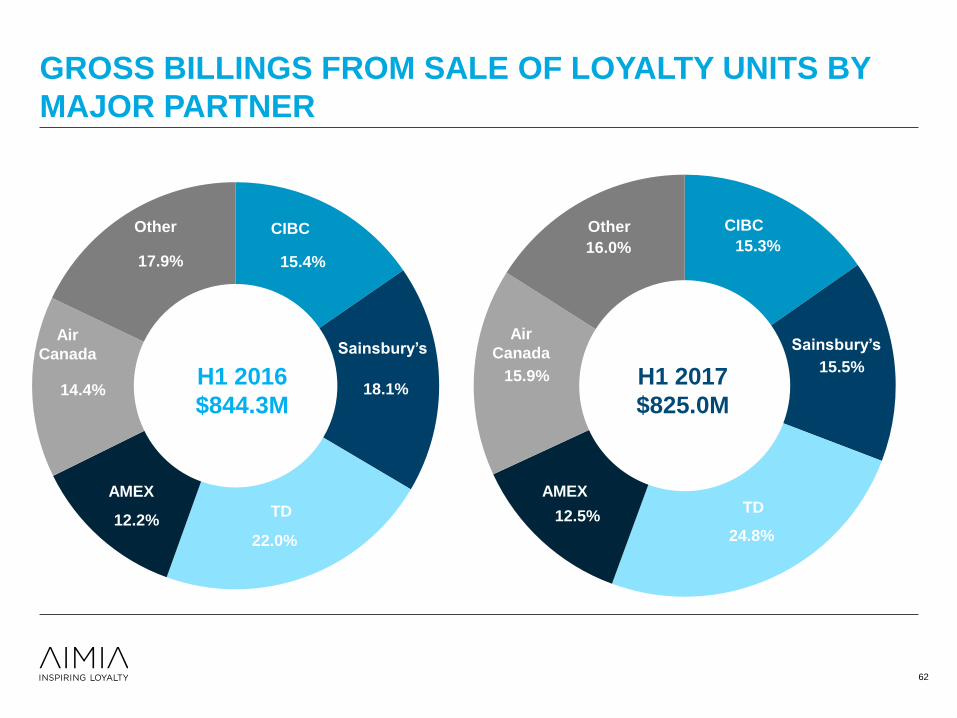
GROSS BILLINGS FROM SALE OF LOYALTY UNITS BY
MAJOR PARTNER
62
15.3%
15.5%
24.8%
12.5%
15.9%
16.0%
AMEX
CIBC
TD
Air
Canada
Other
CIBC
Sainsbury’s
Air Canada
Other
H1 2017
$825.0M
Sainsbury’s
AMEX
TD
15.4%
18.1%
22.0%
12.2%
14.4%
17.9%
AMEX
H1 2016
$844.3M
CIBC
TD
Air
Canada
Other
Sainsbury’s

ACCOUNTING: KEY THINGS TO REMEMBER*
Gross Billings from the sale of Loyalty Units:
▪ Recognize upon issuance of Loyalty Units
▪ Key indicator of top line growth
Liabilities Recognition:
▪ Deferred revenue on the Balance Sheet represents the
accumulated unredeemed Loyalty Units valued at their
weighted average selling price and unrecognized breakage
▪ As part of external disclosure, the total estimated
consolidated future redemption cost liability of unredeemed
Loyalty Units is disclosed in the MD&A under the
Redemption Reserves section and is calculated at the TTM
average cost of rewards per Loyalty Unit redeemed
63
Revenue Recognition:
▪ Recognize upon redemption of Loyalty Units
Breakage Recognition:
▪ Recognize upon redemption of Loyalty Units
Cost of Rewards Recognition:
▪ Recognize upon redemption of Loyalty Units
Adjusted EBITDA:
▪ Key indicator of operating profit performance
Free Cash Flow:
▪ Key indicator of cash generation
63
*THIS SLIDE CONTAINS NON-GAAP FINANCIAL MEASURES. PLEASE REFER TO SLIDE 4 FOR A DETAILED DESCRIPTION OF SUCH NON-GAAP FINANCIAL
MEASURES AND SLIDE 5 FOR A RECONCILIATION TABLE TO THE MOST DIRECTLY COMPARABLE GAAP MEASURE, IF ANY.
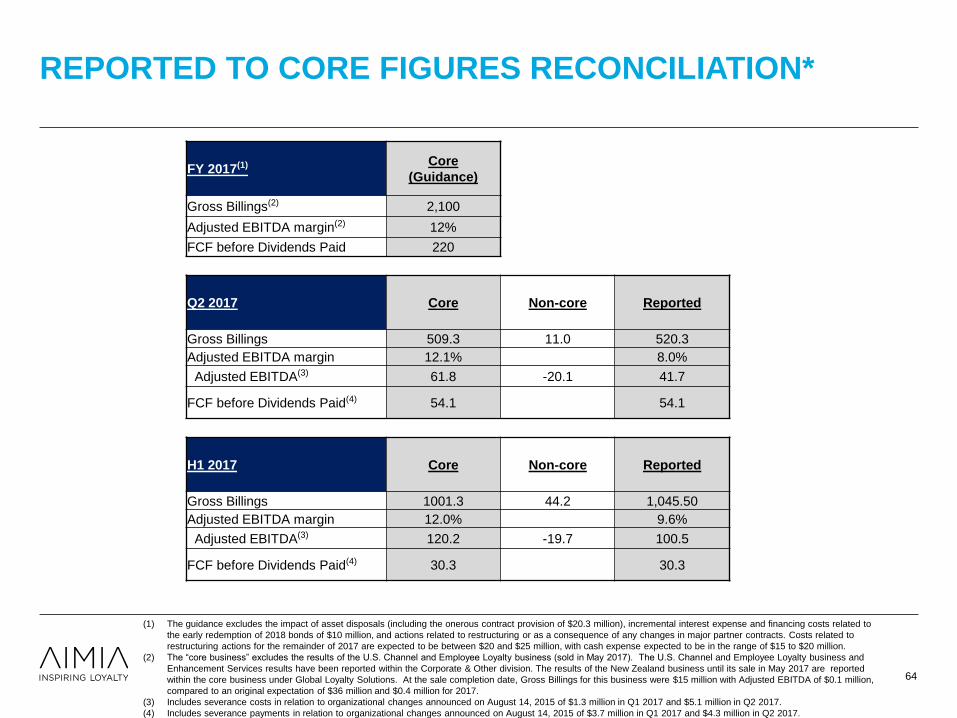
REPORTED TO CORE FIGURES RECONCILIATION*
64
(1) The guidance excludes the impact of asset disposals (including the onerous contract provision of $20.3 million), incremental interest expense and financing costs related to
the early redemption of 2018 bonds of $10 million, and actions related to restructuring or as a consequence of any changes in major partner contracts. Costs related to
restructuring actions for the remainder of 2017 are expected to be between $20 and $25 million, with cash expense expected to be in the range of $15 to $20 million.
(2) The “core business” excludes the results of the U.S. Channel and Employee Loyalty business (sold in May 2017). The U.S. Channel and Employee Loyalty business and
Enhancement Services results have been reported within the Corporate & Other division. The results of the New Zealand business until its sale in May 2017 are reported
within the core business under Global Loyalty Solutions. At the sale completion date, Gross Billings for this business were $15 million with Adjusted EBITDA of $0.1 million,
compared to an original expectation of $36 million and $0.4 million for 2017.
(3) Includes severance costs in relation to organizational changes announced on August 14, 2015 of $1.3 million in Q1 2017 and $5.1 million in Q2 2017.
(4) Includes severance payments in relation to organizational changes announced on August 14, 2015 of $3.7 million in Q1 2017 and $4.3 million in Q2 2017.
FY 2017(1) Core
(Guidance)
Gross Billings(2) 2,100
Adjusted EBITDA margin(2) 12%
FCF before Dividends Paid 220
Q2 2017 Core Non-core Reported
Gross Billings 509.3 11.0 520.3
Adjusted EBITDA margin 12.1% 8.0%
Adjusted EBITDA(3) 61.8 -20.1 41.7
FCF before Dividends Paid(4) 54.1 54.1
H1 2017 Core Non-core Reported
Gross Billings 1001.3 44.2 1,045.50
Adjusted EBITDA margin 12.0% 9.6%
Adjusted EBITDA(3) 120.2 -19.7 100.5
FCF before Dividends Paid(4) 30.3 30.3