Embed Size (px)
Citation preview

INL/EXT-13-29256Revision 0
Q-value (MeV/fission) Determination for the Advanced Test Reactor
J. W. Sterbentz
October 2013

DISCLAIMER This information was prepared as an account of work sponsored by an
agency of the U.S. Government. Neither the U.S. Government nor any agency thereof, nor any of their employees, makes any warranty, expressed or implied, or assumes any legal liability or responsibility for the accuracy, completeness, or usefulness, of any information, apparatus, product, or process disclosed, or represents that its use would not infringe privately owned rights. References herein to any specific commercial product, process, or service by trade name, trade mark, manufacturer, or otherwise, does not necessarily constitute or imply its endorsement, recommendation, or favoring by the U.S. Government or any agency thereof. The views and opinions of authors expressed herein do not necessarily state or reflect those of the U.S. Government or any agency thereof.

INL/EXT-13-29256Revision 0
Q-value (MeV/fission) Determination for the Advanced Test Reactor
J. W. Sterbentz
October 2013
Idaho National Laboratory VHTR Program
Idaho Falls, Idaho 83415
http://www.inl.gov
Prepared for the U.S. Department of Energy Office of Nuclear Energy
Under DOE Idaho Operations Office Contract DE-AC07-05ID14517


vi
CONTENTS
ACRONYMS ............................................................................................................................................. viii
1. INTRODUCTION .............................................................................................................................. 11.1 Basis: Fission Energy Components .......................................................................................... 21.2 Description of the Advanced Test Reactor .............................................................................. 4
2. METHODOLOGY ............................................................................................................................. 82.1 MCNP Computer Code ............................................................................................................ 82.2 MCNP ATR Model .................................................................................................................. 92.3 MCNP Tally Normalization ................................................................................................... 102.4 Analysis Procedure ................................................................................................................ 10
3. UNCERTAINTY .............................................................................................................................. 23
4. CONCLUSIONS .............................................................................................................................. 24
5. REFERENCES ................................................................................................................................. 24
FIGURES Figure 1. Cross sectional view of the Advanced Test Reactor (ATR) core. ................................................. 6
Figure 2. ATR driver fuel element. ............................................................................................................... 7
Figure 3. Cross sectional view of the MCNP 1/8-core ATR model. .......................................................... 10
TABLES Table 1. Emitted and recoverable energies for U-235 fission. ...................................................................... 3
Table 2. List of isotopes and natural elements in the MCNP model. ......................................................... 11
Table 3. ATR isotopes, mass excesses, and binding energies resulting from neutron radiative capture. ....................................................................................................................................... 13
Table 4. Unstable short-lived compound nuclei that undergo beta decay and release energy. .................. 16
Table 5. Percentage of total radiative capture gamma energy released by material. ................................. 16
Table 6. Percentage of total radiative capture gamma energy produced by element/isotope. ................... 17
Table 7. Fission components and energies for the uranium isotopes in the ATR driver fuel elements. ..................................................................................................................................... 20

vii

viii
ACRONYMS ATR Advanced Test Reactor
ENDF evaluated nuclear data file
EINC Incident neutron energy
INL Idaho National Laboratory
PIE post-irradiation examination
BOL beginning-of-life
LIPT large in-pile tube
ITV Irradiation Test Vehicle
OSCC outer shim control cylinders
PNF power normalization factor
SIPT standard in-pile tube

ix

1
Q-value (MeV/fission) Determination for the Advanced Test Reactor
1. INTRODUCTION This report documents a step-by-step procedure that can be used to calculate a Q-value for the
Advanced Test Reactor (ATR) at Idaho National Laboratory (INL). The Q-value calculation here is an estimate of the total energy released per fission event in the ATR driver fuel in units of MeV/fission and is recognized as a reactor-specific Q-value for the ATR. Such a Q-value is needed INL ATR reactor physicists to normalize calculated fluxes and reaction rates to measured ATR total core and lobe powers. The calculated ATR Q-value and the procedure used to calculate this value are presented in a detailed manner so as to establish a credible basis, such that this single Q-value can be used consistently among all ATR reactor physicists.
A Q-value is essentially the summation of all the kinetic energy from all radiation components released from a single fission event that ends up as heat in the reactor coolant. Estimation of a Q-value for a given reactor can theoretically be very complex because it is dependent on several variables, which include (1) the materials in the reactor core, (2) the neutron energy spectrum, and (3) the mix of actinide isotopes that are being simultaneously fissioned. Since these three variables can potentially change over time or with reactor burnup, this potentially makes the Q-value a time-dependent quantity. However, for ATR, we will invoke some simplifying assumptions, based on the unique features of the ATR core and supported by neutronic calculations, which will reduce the complexity of the problem and lead to a single time-independent Q-value. Of the three variables, the materials in the core have the greatest impact on the ATR Q-value. Since the materials in the core are most important, an array of components (materials) have been carefully selected to compose a typical ATR core configuration.
It should be noted that the step-by-step procedure here for calculating a reactor-specific Q-value can be applied to any nuclear reactor. In a more general procedure, if one needed to include time-dependent spectral and actinide composition changes as a function of burnup for a specific reactor, this procedure can still be used, but at discrete time steps throughout the burnup. The result will be a set of discrete Q-values as a function of burnup. However, here we will apply the procedure to the ATR, as an example, and obtain a single Q-value that is valid for the ATR reactor as a function of burnup.
In the evaluated nuclear data file (ENDF), Q-values for specific actinides are known for a reasonably high degree of accuracy, especially the major uranium and plutonium isotopes. The isotopic Q-values are composed of the kinetic energy of the fission fragments and the energies of the various radiation components emitted from the fission event. One complication is the fact that some of these energy components are dependent on the incident neutron energy (EINC) that induces the fission event (neutron energy spectrum dependence). For ATR, we will estimate an average neutron energy based on the neutron energy flux weighted by the fission cross sections and use this average neutron energy value in the ENDF formulas. This neutron energy dependence is one of two dependencies that make the final ATR Q-value a reactor-specific value. The second dependency, and the most important variable for ATR, involves the materials in the core and the de-excitation radiations produced from neutron radiative capture radiation; radiation energy that becomes heat in the reactor coolant. This important dependency is discussed in detail below. The third dependency, or the mix of fissioning actinides as a function of ATR burnup, is ignored because the bulk of the fissions over a cycle are always due to U-235 in the high-enriched ATR core.

2
In a fission event, the fission energy is partitioned between the fission fragments and the radiation components that include neutrons, gamma rays, and beta particles. The main variable that makes the calculated Q-value reactor-specific is the amount of radiative capture energy produced in the core due to prompt and delayed neutron capture in the reactor core materials and the subsequent release of nuclear binding energy in the form of de-excitation gamma radiation energy in the reactor core. This energy component, neutron radiative capture energy, is not in the ENDF, because it depends on the reactor and its core materials. The radiative capture gamma energy release can be significant, or approximately 3–12 MeV/fission depending on the materials in the reactor core (fuel materials, cladding, structural components, coolant, targets, reflector, etc.). For the ATR, the energy released from radiative capture gamma radiation is calculated to be near the middle of the 3–12 MeV range. This makes the radiative capture radiation component an important and significant contribution to the total ATR Q-value.
The ATR has unique reactor features that will allow us to simplify the complex procedure for determining an ATR reactor-specific Q-value. For example, the ATR is a thermal reactor and contains high-enriched fuel (93.15 wt% U-235). Consequently, the bulk of the fissions in the ATR core from beginning-of-cycle (BOC) to end-of-cycle are from U-235. Even though U-238 makes up approximately 7% of the uranium atoms in the fuel, the number of fissions relative to U-235 is insignificant, since U-238 is fertile and ATR is a thermal reactor. The same is true for U-234 and U-236 (both fertile). The ATR’s high-enriched uranium fuel also inhibits the buildup of large quantities of plutonium isotopes. So, even though there is some buildup of U-236, Np-237, and Pu-239 in the ATR driver fuel, the impact or contribution of these isotopes fissions on the ATR Q-value is minor compared to U-235. Nonetheless, we will include fission contributions from all the major uranium isotopes (U-234, U-235, U-236, and U-238) in the determination of an average isotopic Q-value that is used in the ATR Q-value determination. Although the ATR Q-value calculated here is based on BOC conditions (fresh fuel with no higher order actinide buildup), it is believed that the ATR Q-value is relatively constant with burnup or during any given ATR power cycle (14–60 days). The reason is that the vast majority of the core driver fuel fissions are always from U-235 during the cycle. Also, since we effectively assume instantaneous energy release for the fission product gammas and beta particles and delayed neutrons from a fission event, this corresponds to equilibrium conditions for all fission product concentrations in the ATR driver fuel too.
The goal of this effort was to determine a specific numerical and core-average Q-value for the recoverable energy released by a single fission event (MeV/fission) for the ATR. This calculated value has the potential to help standardize and add credibility to not only the Monte Carlo tally normalization process used by many ATR core physics analysts, but also to the normalization process for all reactor physics calculation methods involving ATR analyses. Currently, the ATR core physics analysts use slightly different Q-values. Some values are known to be conservative for specific applications. However, sometimes a more accurate Q-value is needed for the calculation in which ATR test specimens require non-conservative and as-accurate-as-possible Q-values to estimate burnups, heat rates, neutron fluxes, nuclear reaction rates, etc., where corresponding measured post-irradiation examination data provides the ultimate validation for the calculated results.
A detailed Q-value procedure was developed and is outlined in this document along with numerical values calculated specifically for the determination of the ATR Q-value. This report attempts to document in some detail the calculation methodology, nuclear data, computer code, computer model, code calculated results, hand calculations, assumptions, and logic that went into the determination of the ATR Q-value.
1.1 Basis: Fission Energy Components To further illustrate the basis for the reactor-dependence of the average ATR Q-value; let us first look
at the major fission components that comprise the Q-value (MeV/fission). Table 1 below lists the fission components (nuclear particle), associated emission energy, and energy recoverable in a reactor for the

3
single actinide isotope. Table 1 contains only approximate fission partition data [1] for U-235 fission and is presented here solely for the purpose of discussion. Numerically, more precise values follow in the analysis below.
In Table 1, Column 3, the energy data are from the major energy components (less radiation leakage from the reactor core) that can be converted to heat in the reactor core and carried away by the coolant as recoverable fission energy. Note the total recoverable energy ranges from 198 to 207 MeV/fission. The range is the result of the variability of the neutron radiative capture and subsequent emission of gamma-ray energy; gamma-ray energy is dependent on the materials in the reactor core. The production of radiative capture gamma-rays is directly dependent on the reactor core materials (fuel, clad, coolant, reflector, structural, target, etc.). This dependence corresponds directly to the specific elemental constituents in these core materials, the neutron radiative capture cross sections of the elemental isotopes, de-excitation gammas and their energies, and the neutron energy spectrum of the reactor core. Other reactor-dependent properties affecting the Q-value include burnup, control surface movement, and redistribution of materials in the core. These latter variables are not specifically addressed in this report.
Table 1. Emitted and recoverable energies for U-235 fission.
Component Emitted Energy(MeV)
Recoverable Energy (MeV)
Fission Fragments (kinetic energy) 168 168 Fission Product Decay:
(i) Beta-rays 8 8 (ii) Gamma-rays 7 7
Neutrinos 12 — Prompt Gamma-rays 7 7 Prompt Neutrons (kinetic energy) 5 5 Radiative Capture Gamma-rays — 3–12 TOTAL 207 198–207
The original impetus for this effort arose out of a debate over calculated versus measured burnups. There was some disagreement between the burnups, and the discussion focused on certain variable values used in the calculations; the primary one being the ATR Q-value (or MeV/fission).
The calculated burnups using Monte Carlo Neutral Particle (MCNP) [2] are based initially on cell fluxes that have not been normalized and reaction rates that need to be normalized to the ATR reactor power through a power normalization factor (PNF). Calculation of the PNF requires several input variables: (1) ATR core or lobe power (MWth), (2) average number of prompt neutrons released per fission ( ), (3) reactor core k-effective, (4) recoverable core energy per fission (MeV/fission), and (5) some basic unit conversion constants. The only variable with significant uncertainty is the recoverable core energy per fission (MeV/fission) or Q-value. In typical INL ATR burnup calculations, a Q-value of 200 MeV/fission is often used with very reasonable results when compared to post-irradiation examination data. The value also appears to be reasonable since it is in the range of recoverable energy (Table 1). However, without an analytical basis to substantiate the 200 MeV Q-value, use of the 200 MeV Q-value is somewhat speculative. This report should provide the needed basis or reference for an ATR Q-value for ATR reactor physics.

4
If we take a closer look at the fission energy components emitted in a single fission event, we find that we can divide the components into the following eight components:
1. Kinetic energy of fission fragments
2. Kinetic energy of prompt neutrons
3. Kinetic energy of delayed neutrons
4. Kinetic energy of prompt gamma-rays
5. Kinetic energy of fission product gamma-rays
6. Kinetic energy of fission product beta-rays
7. Neutrinos
8. Kinetic energy of radiative capture gamma-rays.
Of the eight components, 1–7 have associated partition energies for all the major actinides and most of the minor actinides as a function of energy in the ENDFs. Only the eighth component (radiative capture gamma-rays) is dependent on the reactor materials, and hence requires a special effort to calculate this component for a given reactor.
1.2 Description of the Advanced Test Reactor The Advanced Test Reactor (ATR) is a 250 MWth rated light-water cooled reactor designed
specifically to study the effects of intense radiation on reactor fuels and materials. The core contains nine individual test irradiation flux traps in a 3×3 array within a four-leaf clover or serpentine driver core configuration as shown in Figure 1. The serpentine driver core is composed of 40 high-enriched plate-type fuel elements; each fuel element has a 48-inch active length of U-Alx fuel meat. The driver core elements are light water-cooled and beryllium reflected. Beginning-of-cycle (BOC) driver fuel element loadings, plus rotatable outer shim control cylinders with hafnium absorber plates located in the beryllium reflector and removable hafnium neck shim rods in the aluminum shim housing allow the ATR operators to control and adjust the local power levels in each of the five lobes of the serpentine core. The beryllium reflector is contained within an aluminum tank and the entire reactor core is enclosed in a stainless steel reactor pressure vessel.
Each driver fuel element contains 19 curved aluminum-clad fuel plates. Figure 2 shows the geometrical configuration of a typical fuel element along with some nominal dimensions. The fuel meat is an inter-metallic uranium/aluminum compound with each successive plate (longer arc segment) containing proportionally more uranium. In a fresh ATR element, the uranium enrichment is nominally 93.15 wt% U-235.

5
The data below provides some additional numerical values for the dimensions, materials, loadings, densities, enrichment, etc. for an ATR driver fuel element.
ATR Driver Fuel Element Fuel Meat: U-Alx Enriched uranium in Aluminum-1100 Average Density = ~4.00 g/cm3 Clad: Aluminum-6061T Density = 2.70 g/cm3 Loading: 1075.0 g/element U-235 BOL (nominal) 69.93 g/element U-238 BOL (nominal) 13.87 g/element U-234 BOL (nominal) 8.09 g/element U-236 BOL (nominal) 93.15 wt% nominal enrichment U-235 BOL Active Fuel Length: 48.0 inches Fuel Element Length: 66.0 inches (5.5 feet end-to-end of the end boxes)
Structural Materials: 2,797.36 g/element aluminum side plates 1,174.32 g/element aluminum in the fuel meat 3,766.74 g/element aluminum clad 1,200.00 g/element upper/lower aluminum end boxes 8,938.42 g/element total aluminum
Core Coolant Water Temperature and Pressure Inlet: <125 F 355 psi (gauge) Outlet: 160 F (average) 255 psi

6
Figure 1. Cross sectional view of the Advanced Test Reactor (ATR) core.
7
Figure 2. ATR driver fuel element.

8
2. METHODOLOGY The first section describes the MCNP computer code, the second section the MCNP ATR computer
model, and the third section the MCNP tally normalization. The fourth section describes the analysis procedure, a nine step process to calculate the radiative capture component of the ATR Q-value, and ultimately an estimate of the ATR Q-value (MeV/fission).
2.1 MCNP Computer Code The MCNP computer code [2] was used to perform the necessary calculations for the MeV/fission
determination. MCNP is a general purpose, continuous energy, generalized geometry, and coupled neutron-photon-electron Monte Carlo transport code. Neutrons and gamma-rays are typically and routinely transported using the MCNP code for applications related to ATR analyses. A wide variety of nuclide cross sections and nuclear reactions are available from the ENDF. The MCNP code is a product of the Los Alamos National Laboratory.
The MCNP code can handle a variety of nuclear interactions for neutrons with nuclei usually only limited by the data available on ENDF and the MCNP ACE cross section files (ACE is an acronym for A Compact ENDF or processed cross section data specifically for use by MCNP). Typically, all MCNP ACE files include the following neutron reaction cross sections: total, elastic scattering, inelastic scattering, fission, radiative capture, (n,2n), (n,p), (n, , and (n,p). Other cross sections may be provided as well depending on important nuclear interaction characteristics of a particular nucleus. In addition, for neutron inelastic and radiative capture reactions, MCNP will produce de-excitation gamma-rays and track these gamma-rays in the photon portion of the transport calculation. For gamma-ray transport, MCNP can handle the following nuclear interaction processes: Compton scattering, pair production, and the photoelectric effect. The photoelectric effect is regarded as an absorption, Compton scattering is assumed to be off of free electrons, and the pair production process isotropically creates two 0.511 MeV photons emitted in directions 180-degrees apart from one another.
The models used in MCNP represent a system’s physical geometry with a collection of volumetric cells described by defined geometric surfaces (planes, cylinders, spheres, cones, etc.). These code-recognizable defined surfaces are appropriately combined and sensed to allow the analyst wide latitude in describing even very complicated three-dimensional system geometries. A complex reactor system, such as the ATR, is readily transformed into an MCNP cell geometry model (although thousands of cells are typically needed to fully describe the entire ATR core).
The MCNP code also requires the model cells to contain a material. This material is composed of natural or isotopic elements that describe the cell material. An elemental or isotopic number density and associated neutron and/or photon cross section library are required for each element or isotope.
The MCNP cell tally capability allows for the calculation of a variety of reactor physics parameters. For example, one can calculate particle or energy currents and fluxes in any cell, or across any cell surface. Nuclear reaction rates (e.g., fission or radiative capture reaction rates) can be calculated in any cell. Similarly, energy deposition due to neutron scattering or absorption and gamma-ray scattering events (heating rates) can also be calculated. In addition, these tally quantities can be calculated as a function of energy group to determine spectral characteristics of certain reaction and heating rates. Cell tallies are averaged over the cell’s volume and possess an inherent Monte Carlo statistical error.
Because the MCNP computer code is a Monte Carlo code, the MCNP-calculated results are reported by the code with an associated statistical uncertainty or relative error. The relative errors translate into a one-sigma statistical uncertainty by multiplication of the relative error by the calculated result (tally value). Two-sigma and three-sigma confidence intervals are obtained by multiplying the one-sigma values by factors of two and three, respectively. The confidence levels associated with one-, two-, and

9
three-sigma values are 68.3%, 95.4%, and 99.7%, respectively. All statistical error values reported in this study are one-sigma values.
2.2 MCNP ATR Model An MCNP ATR core model was needed to calculate the radiative capture reaction rates for each
isotope and/or natural element in every cell of the MCNP model. In order to reduce the amount of work required to perform this task, a full-core model was appropriately reduced to a much smaller 1/8-core model (lower half of the northeast quadrant) for the analysis herein. Figure 3 shows the MCNP cross sectional plot of the 1/8-core model.
Although the 1/8-core model significantly reduced the number of cells in which flux and reaction rate tallies had to be calculated (relative to a full-core model), an effort was made to retain a variety of materials and core features typical of the full core. Reflective boundary conditions were applied to the two azimuthal planes defining the 1/8-core wedge (octant) in order to simulate a full core model. Although the 1/8-core model greatly reduced the number of total cells, the model still contained 322 cells with 27 different possible materials filling these cells. Most of the materials, with the exception of four, were comprised of multiple elements and/or isotopes. The ATR driver fuel materials each contained 13 elements and/or isotopes in their beginning-of-life (BOL) material descriptions. The 13 elements/isotopes for the ATR driver fuel material descriptions was the largest number of elements/isotopes for all the 27 different ATR material card descriptions.
In order to calculate a nuclear reaction rate tally in each MCNP cell, every cell in the model had to have an associated volume (cm3) in the input file. This required a significant effort to calculate and check every cell volume. The MCNP code will typically only calculate cell volumes for geometrically symmetric cells, and since our MCNP ATR core models contain many non-symmetrical and cookie-cutter type cells, it became the responsibility of the reactor physics analyst to calculate the necessary volumes for these cells and check them.
The 1/8-core MCNP ATR model contained many specific components, materials, and core conditions. The east flux trap contained a stainless steel-348 (SS348) standard in-pile tube (SIPT). The northeast flux trap contained an aluminum-6061 large in-pile tube (LIPT). The center flux trap contained an aluminum-6061 pressure tube and the Irradiation Test Vehicle. The east and northeast flux traps contained only light water in the central irradiation test volume (no targets or test trains). The Irradiation Test Vehicle contained the stainless steel (SS304) dummy inner sleeve and seal ring sleeve inserts. There were low specific activity (LSA) cobalt targets in the H-4 and H-5 test facility holes. The two outer shim control cylinders (OSCC) in our core octant, specifically E1 and E2, were fixed in a typical middle-of-cycle position of 75-degrees. The six hafnium shim rods were fully inserted. The east flux trap also has a safety control rod installed and the lower tip of the rod was parked three inches into the top of the active core. None of the other A, B, or I test facilities contained experiments, only their respective water and beryllium fillers. BOL driver fuel compositions were in the five driver elements, namely, ATR driver elements in positions 6, 7, 8, 9, and 10. Each driver fuel element was divided up into three radial zones and seven axial zones for a total of 21 cells per ATR fuel element.
With the reflective boundary conditions applied to the two azimuthal planes defining the 1/8-core wedge of the ATR core, the equivalent effect of four SS348 SIPTs and four aluminum LIPTs in a full-core ATR model is created. This was done on purpose to achieve a more representative distribution of steel and aluminum mass in the 1/8-core model relative to a nominal ATR core configuration. Normally, the east flux in the ATR core is for isotope production and contains only an aluminum flow tube (no steel). In the actual ATR core, the north, west, southwest, and southeast flux traps usually have an SIPT for a total of four SIPTs in the core.

10
2.3 MCNP Tally Normalization Our MCNP models are used to calculate a variety of ATR core physics parameters. Some of these
parameters include fluxes, reaction rates, and energy deposition or heat rates. The MCNP code outputs a tally value estimate for each of these physics parameters that in turn must be normalized (using the PNF) to the reactor power in order to obtain absolute quantities. The PNF formula used in the normalization process is given in Step No. 3 below, and the Q-value in this formula is the very Q-value we are trying to calculate in this analysis. This initially seems like a calculation dilemma, but it will not affect our Q-value estimate; the Q-values will conveniently cancel out in the course of the calculation.
Figure 3. Cross sectional view of the MCNP 1/8-core ATR model.
2.4 Analysis Procedure The following multi-step procedure was specifically developed to calculate the ATR Q-value
(MeV/fission). It is a 9-step process and each step is outlined below.
Step No. 1
The first step involves the estimation of the radiative capture reaction rate for every isotope or element in every cell of the ATR MCNP 1/8-core model. This required the construction of 7 similar 1/8-core MCNP models in order to accommodate all the required isotopic and elemental radiative capture tallies for each cell material due to a limitation in the number of tallies the code could accommodate in a single model input deck. The 1/8-core model specifically contained:
105 fuel cells representing 5 different ATR driver elements (ATR elements 6-10), each element with 3 radial and 7 axial zones with three different radial zone fuel compositions.
11
110 water cells
30 aluminum cells
9 hafnium cells
5 beryllium cells
8 beryllium + water cells (homogenized)
34 aluminum + water, or steel + water, or aluminum + water + steel cells (homogenized)
6 cobalt cells
1 NITRONIC-60 cell
3 steel cells (SS348).
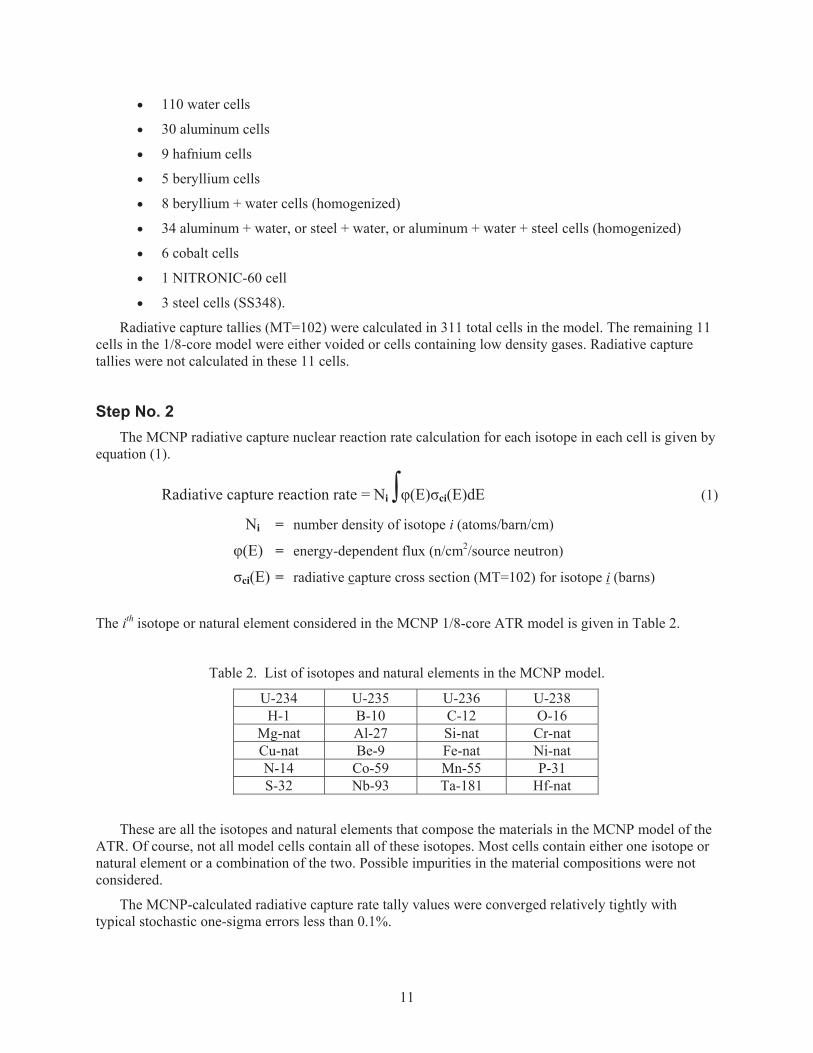
Radiative capture tallies (MT=102) were calculated in 311 total cells in the model. The remaining 11 cells in the 1/8-core model were either voided or cells containing low density gases. Radiative capture tallies were not calculated in these 11 cells.
Step No. 2 The MCNP radiative capture nuclear reaction rate calculation for each isotope in each cell is given by
equation (1).
Radiative capture reaction rate = Ni (E) ci(E)dE (1)
Ni = number density of isotope i (atoms/barn/cm)
(E) = energy-dependent flux (n/cm2/source neutron)
ci(E) = radiative capture cross section (MT=102) for isotope i (barns)
The ith isotope or natural element considered in the MCNP 1/8-core ATR model is given in Table 2.
Table 2. List of isotopes and natural elements in the MCNP model.
U-234 U-235 U-236 U-238 H-1 B-10 C-12 O-16
Mg-nat Al-27 Si-nat Cr-nat Cu-nat Be-9 Fe-nat Ni-nat N-14 Co-59 Mn-55 P-31 S-32 Nb-93 Ta-181 Hf-nat
These are all the isotopes and natural elements that compose the materials in the MCNP model of the
ATR. Of course, not all model cells contain all of these isotopes. Most cells contain either one isotope or natural element or a combination of the two. Possible impurities in the material compositions were not considered.
The MCNP-calculated radiative capture rate tally values were converged relatively tightly with typical stochastic one-sigma errors less than 0.1%.

12
Step No. 3 The third step was to convert the Step No. 2 reaction rate tally values (atoms/cm3/source-neutron) into
atom production rates (atoms/sec). In this case, the atom production rate is the rate of production of the compound nucleus or transmuted nucleus (target nucleus plus neutron).
In order to calculate the production rate, the tally values (atoms/cm3/source neutron) had to be multiplied by their respective cell volumes (cm3) and the PNF. The PNF is in units of neutrons/second. Cell volumes for the asymmetric cells were hand calculated and manually loaded into the MCNP input deck. MCNP will not run unless each tally cell has an associated volume.
The PNF is calculated using the following formula in equation (2).
PNF = [ P· ]/[ keff·Q ] (2)
where, P = 1/8-core power (12.5 MWth for a full core power of 100 MWth)
= average number of fission neutrons per fission event in ATR (2.4342)
keff = multiplication constant of the 1/8-core model
Q = energy released per fission event (MeV/fission)
NOTE: The PNF uses the very value we are trying to calculate, namely, Q (MeV/fission). However, this is not a problem. The radiative capture energy rate (MeV/sec) calculated in Step No. 5 will be divided by the energy rate of the summation of all the other fission components (less radiative capture), which is also normalized with the same PNF. The effect will be a cancellation of the PNF, so it is essentially a constant that cancels out. For the record, the Q-value used here was arbitrarily chosen to be 200 MeV/fission and the PNF value was 9.35950E+17 n/sec with keff = 1.014542.
Step No. 4 A radiative capture (absorption) of a neutron by nuclei in a core material results in the transmutation
of that nucleus into an excited compound nucleus. The excitation of the compound nucleus is due to the release of binding energy plus the kinetic energy of the incident neutron. The compound nucleus then de-excites through the emission of gamma radiation to its ground state. The emitted gamma radiation is then converted into heat energy in the ATR core. The kinetic energy of the incident neutron is already accounted for in the fission energy partition under kinetic energy of the prompt neutrons emitted in fission (or the kinetic energy of the delayed neutrons) and is therefore not included again in this step. Once the compound nucleus de-excites to its ground state, it may be an unstable nucleus which may further decay by beta decay, positron emission, or electron capture (EC). These beta decay modes can add a small amount of additional heat energy to the ATR in the form of electron kinetic energy in the case of beta decay, positron kinetic energy in the case of positron emission, and gamma radiation in the case of electron capture. This additional energy is also estimated and added into the total radiative capture energy release per fission event in ATR but only for those unstable nuclei with very short half-lives. A list of these unstable nuclei is provided along with their half-life, mass excess, and associated energy per decay.
In order to first estimate the amount of binding energy released per radiative capture and hence the amount of radiative capture energy released as recoverable energy in the ATR core, the difference in the mass excesses between the neutron plus target nucleus and the ground state of the compound nucleus is

13
calculated for every isotope in the ATR core. Table 3 lists the ATR isotopes and the corresponding particle and nuclei mass excess and binding energy.
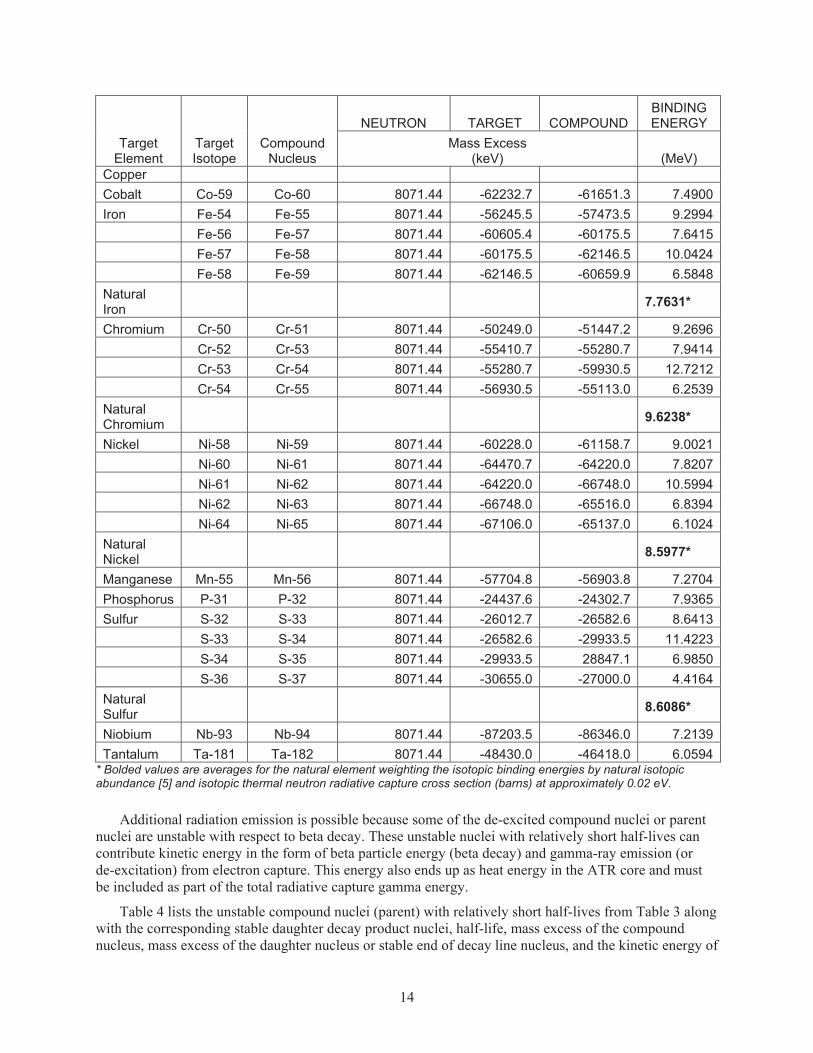
Table 3. ATR isotopes, mass excesses, and binding energies resulting from neutron radiative capture.
Target Element
Target Isotope
Compound Nucleus
NEUTRON TARGET COMPOUND BINDING ENERGY
Mass Excess (keV) (MeV)
Aluminum Al-27 Al-28 8071.44 -17196.1 -16855.4 7.7307Hafnium Hf-174 Hf-175 8071.44 -55550.0 -54390.0 6.9114 Hf-176 Hf-177 8071.44 -54430.0 -52720.0 6.3614 Hf-177 Hf-178 8071.44 -52720.0 -52270.0 7.6214 Hf-178 Hf-179 8071.44 -52270.0 -50270.0 6.0714 Hf-179 Hf-180 8071.44 -50270.0 -49530.0 7.3314 Hf-180 Hf-181 8071.44 -49530.0 -47407.0 5.9484Natural Hafnium
Thermal xs at 0.02 eV
Isotopic and thermal cross section average Hf binding energy.
7.1869*
Water H-1 H-2 8071.44 7288.99 13135.91 2.2245 H-2 H-3 8071.44 13135.91 14949.95 6.2574 O-16 O-17 8071.44 -4736.55 -807.70 4.1426 O-17 O-18 8071.44 -807.70 -782.43 8.0462 O-18 O-19 8071.44 -782.43 3332.70 3.9563Beryllium Be-9 Be-10 8071.44 11350.50 12607.00 6.8149Uranium U-234 U-235 8071.44 38102.0 40908.0 5.2654 U-235 U-236 8071.44 40908.0 42510.0 6.4694 U-236 U-238 8071.44 42510.0 45277.0 5.3044 U-238 U-239 8071.44 47291.0 50579.0 4.7834Boron B-10 B-11 8071.44 12052.2 8667.7 11.4560Carbon C-12 C-13 8071.44 0.0 3124.6 4.9468Nitrogen N-14 N-15 8071.44 2863.7 100.4 10.8348Magnesium Mg-24 Mg-25 8071.44 -13933.3 -13190.7 7.3288 Mg-25 Mg-26 8071.44 -13190.7 -16214.2 11.0949 Mg-26 Mg-27 8071.44 -16214.2 -14582.6 6.4398Natural Magnesium 8.3464*
Silicon Si-28 Si-29 8071.44 -21489.9 -21893.6 8.4751 Si-29 Si-30 8071.44 -21893.6 -24439.4 10.6172 Si-30 Si-31 8071.44 -24439.4 -22962.0 6.5940Natural Silicon 8.5951*
Copper Cu-63 Cu-64 8071.44 -65583.1 -65427.6 7.9159 Cu-65 Cu-66 8071.44 -67266.0 -66255.0 7.0604Natural 7.7641*
14
Target Element
Target Isotope
Compound Nucleus
NEUTRON TARGET COMPOUND BINDING ENERGY
Mass Excess (keV) (MeV)
Copper Cobalt Co-59 Co-60 8071.44 -62232.7 -61651.3 7.4900Iron Fe-54 Fe-55 8071.44 -56245.5 -57473.5 9.2994 Fe-56 Fe-57 8071.44 -60605.4 -60175.5 7.6415 Fe-57 Fe-58 8071.44 -60175.5 -62146.5 10.0424 Fe-58 Fe-59 8071.44 -62146.5 -60659.9 6.5848Natural Iron 7.7631*
Chromium Cr-50 Cr-51 8071.44 -50249.0 -51447.2 9.2696 Cr-52 Cr-53 8071.44 -55410.7 -55280.7 7.9414 Cr-53 Cr-54 8071.44 -55280.7 -59930.5 12.7212 Cr-54 Cr-55 8071.44 -56930.5 -55113.0 6.2539Natural Chromium 9.6238*
Nickel Ni-58 Ni-59 8071.44 -60228.0 -61158.7 9.0021 Ni-60 Ni-61 8071.44 -64470.7 -64220.0 7.8207 Ni-61 Ni-62 8071.44 -64220.0 -66748.0 10.5994 Ni-62 Ni-63 8071.44 -66748.0 -65516.0 6.8394 Ni-64 Ni-65 8071.44 -67106.0 -65137.0 6.1024Natural Nickel
8.5977*
Manganese Mn-55 Mn-56 8071.44 -57704.8 -56903.8 7.2704Phosphorus P-31 P-32 8071.44 -24437.6 -24302.7 7.9365Sulfur S-32 S-33 8071.44 -26012.7 -26582.6 8.6413 S-33 S-34 8071.44 -26582.6 -29933.5 11.4223 S-34 S-35 8071.44 -29933.5 28847.1 6.9850 S-36 S-37 8071.44 -30655.0 -27000.0 4.4164Natural Sulfur 8.6086*
Niobium Nb-93 Nb-94 8071.44 -87203.5 -86346.0 7.2139Tantalum Ta-181 Ta-182 8071.44 -48430.0 -46418.0 6.0594
* Bolded values are averages for the natural element weighting the isotopic binding energies by natural isotopic abundance [5] and isotopic thermal neutron radiative capture cross section (barns) at approximately 0.02 eV.
Additional radiation emission is possible because some of the de-excited compound nuclei or parent nuclei are unstable with respect to beta decay. These unstable nuclei with relatively short half-lives can contribute kinetic energy in the form of beta particle energy (beta decay) and gamma-ray emission (or de-excitation) from electron capture. This energy also ends up as heat energy in the ATR core and must be included as part of the total radiative capture gamma energy.
Table 4 lists the unstable compound nuclei (parent) with relatively short half-lives from Table 3 along with the corresponding stable daughter decay product nuclei, half-life, mass excess of the compound nucleus, mass excess of the daughter nucleus or stable end of decay line nucleus, and the kinetic energy of
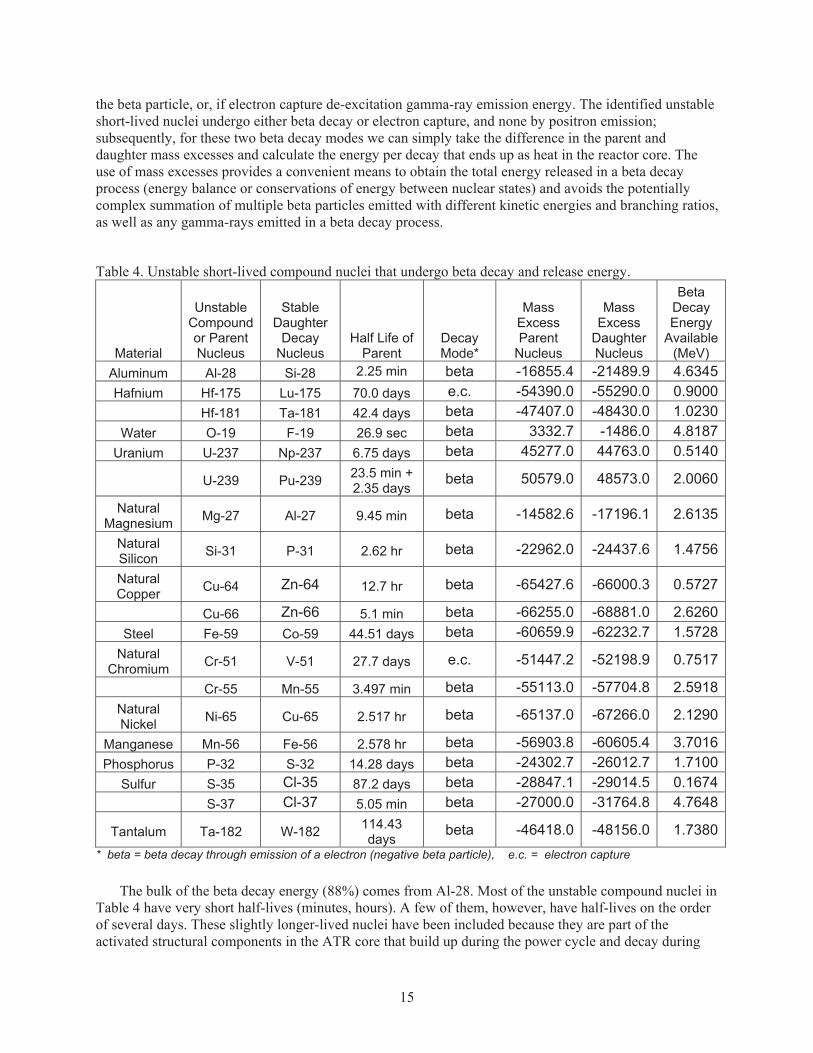
15
the beta particle, or, if electron capture de-excitation gamma-ray emission energy. The identified unstable short-lived nuclei undergo either beta decay or electron capture, and none by positron emission; subsequently, for these two beta decay modes we can simply take the difference in the parent and daughter mass excesses and calculate the energy per decay that ends up as heat in the reactor core. The use of mass excesses provides a convenient means to obtain the total energy released in a beta decay process (energy balance or conservations of energy between nuclear states) and avoids the potentially complex summation of multiple beta particles emitted with different kinetic energies and branching ratios, as well as any gamma-rays emitted in a beta decay process.
Table 4. Unstable short-lived compound nuclei that undergo beta decay and release energy.
Material
Unstable Compound or Parent Nucleus
Stable Daughter
Decay Nucleus
Half Life of Parent
Decay Mode*
Mass Excess Parent
Nucleus
Mass Excess
Daughter Nucleus
Beta Decay Energy
Available (MeV)
Aluminum Al-28 Si-28 2.25 min beta -16855.4 -21489.9 4.6345Hafnium Hf-175 Lu-175 70.0 days e.c. -54390.0 -55290.0 0.9000
Hf-181 Ta-181 42.4 days beta -47407.0 -48430.0 1.0230Water O-19 F-19 26.9 sec beta 3332.7 -1486.0 4.8187
Uranium U-237 Np-237 6.75 days beta 45277.0 44763.0 0.5140
U-239 Pu-239 23.5 min + 2.35 days
beta 50579.0 48573.0 2.0060
Natural Magnesium Mg-27 Al-27 9.45 min beta -14582.6 -17196.1 2.6135
Natural Silicon Si-31 P-31 2.62 hr beta -22962.0 -24437.6 1.4756
Natural Copper Cu-64 Zn-64 12.7 hr beta -65427.6 -66000.3 0.5727
Cu-66 Zn-66 5.1 min beta -66255.0 -68881.0 2.6260Steel Fe-59 Co-59 44.51 days beta -60659.9 -62232.7 1.5728
Natural Chromium Cr-51 V-51 27.7 days e.c. -51447.2 -52198.9 0.7517
Cr-55 Mn-55 3.497 min beta -55113.0 -57704.8 2.5918Natural Nickel Ni-65 Cu-65 2.517 hr beta -65137.0 -67266.0 2.1290
Manganese Mn-56 Fe-56 2.578 hr beta -56903.8 -60605.4 3.7016Phosphorus P-32 S-32 14.28 days beta -24302.7 -26012.7 1.7100
Sulfur S-35 Cl-35 87.2 days beta -28847.1 -29014.5 0.1674 S-37 Cl-37 5.05 min beta -27000.0 -31764.8 4.7648
Tantalum Ta-182 W-182 114.43 days
beta -46418.0 -48156.0 1.7380* beta = beta decay through emission of a electron (negative beta particle), e.c. = electron capture
The bulk of the beta decay energy (88%) comes from Al-28. Most of the unstable compound nuclei in
Table 4 have very short half-lives (minutes, hours). A few of them, however, have half-lives on the order of several days. These slightly longer-lived nuclei have been included because they are part of the activated structural components in the ATR core that build up during the power cycle and decay during

16
the shutdown periods. Longer-lived nuclei act like a relatively steady heat source and have been included to account for the contribution from these and even longer-lived activated unstable nuclei. The contribution from the beta decay of compound nuclei amounts to less than 9% of the total radiative capture energy deposition per fission.
Finally, the available beta decay energy (Table 4) is added to the appropriate radiative capture gamma energy (Table 3) to get a total energy emission for a particular isotopic radiative capture event.
Step No. 5 This step involves the compound nucleus production rate (atoms/sec) from Step No. 3 and the binding
energies (Table 3) plus the beta decay energies (Table 4) derived in Step No. 4. The Step No. 3 production rates are multiplied by the appropriate combined energy (binding energy + beta decay) to arrive at the production rate of total radiative capture energy (radiative capture gamma radiation energy + beta decay energy) that will be released into the reactor core by MCNP model cell and isotope. The total radiative capture energy production rate represents the extra energy, or reactor-dependent energy, deposited in the ATR core as a consequence of neutron absorption due to radiative capture and subsequent nuclear energy releases.
Table 5 gives the percent contribution of radiative capture gamma radiation produced by material. Table 6 gives the percent contribution by individual isotope or natural element.
Table 5. Percentage of total radiative capture gamma energy released by material.
Material Percentage
(%) Total Cell Volume
(cm3) Hafnium (Hf) 34.88 3,549.9
ATR Driver Fuel Elements (5)
22.45 24,097.7
Aluminum (Al) 13.26 79,427.7 Stainless Steel (SS348) 10.33 1,949.8
Water 8.62 624,974.5 Al + H2O 6.29 132,637.1 Be+H2O 1.93 86,010.6
Cobalt (Co) 1.71 57.9 Beryllium Reflector (Be-9) 0.31 35,429.3
NITRONIC-60 0.22 47.9 TOTAL 100.00% 988,182.5

17
Table 6. Percentage of radiative capture gamma energy produced by element/isotope.
Isotope/Element Percentage
(%)
Binding Energy Released (MeV/sec)
Hf-nat 34.88 1.09918E+18 Al-27 18.49 5.82784E+17 U-235 17.19 5.41776E+17
H-1 11.27 3.55251E+17 Fe-nat 5.83 1.83433E+17 Cr-nat 3.27 1.02940E+17 Ni-nat 2.93 9.24067E+16 Co-59 1.71 5.39869E+16 Be-9 1.70 5.36203E+16
Mn-55 1.21 3.81541E+16 U-238 0.81 2.55960E+16 U-234 0.21 6.57335E+15 Cu-nat 0.24 7.45596E+15 Ta-181 0.08 2.46186E+15 Si-nat 0.06 1.83321E+15 U-236 0.04 1.39040E+15 Nb-93 0.04 1.17472E+15 Mg-nat 0.04 1.17106E+15 O-16 0.01 1.89581E+14 B-10 0.00 7.87129E+13 S-32 0.00 3.03453E+13 P-31 0.00 1.65105E+13 C-12 0.00 1.18539E+12 N-14 0.00 8.93082E+11 Total 100.00 3.15151E+18
The total core energy production rate due to the radiative capture energy release is estimated to be
3.15151E+18 MeV/sec under steady-state conditions in the ATR 1/8-core model at a power of 12.5 MWth at BOC conditions.
Step No. 6 The energy partition by fission components given in Table 1 are relatively crude approximations. In
order to obtain more accurate energy partitions for the components, the ENDF [4] were utilized. The following paragraph and definitions are excerpted directly from [4] under section “Components of Energy Release Due to Fission (MT=458).”
The energy released in fission is carried by fission fragments, neutrons, gammas, betas (+ and -), and neutrinos and anti-neutrinos. The term “fragments” includes all charged particles that are emitted

18
promptly, since for energy-deposition calculations, all such particles have short ranges and are usually considered to lose their energy locally. Neutrons and gammas transport their energy elsewhere and need to be considered separately. In addition, some gammas and neutrons are delayed, and in a shut-down assembly one needs to know the amount of energy tied up in these particles and the rate at which it is released from the metastable nuclides or precursors. The neutrino energy is assumed to be completely lost in reactor applications and is not included in the Q-value, although the energy carried off by the neutrinos is part of the total energy released in a fission event. As far as the betas are concerned, prompt betas, being charged, deposit their energy locally with the fragments.
ET Sum of all the partial energies which follow. This sum is the total energy release per fission and equals the Q-value.
EFR Kinetic energy of the fragments.
ENP Kinetic energy of the prompt fission neutrons.
END Kinetic energy of the delayed fission neutrons.
EGP Total energy released by the emission of prompt gamma-rays
EGD Total energy released by the emission of delayed gamma-rays.
EB Total energy released by delayed beta-rays.
ENU Energy carried away by the neutrinos.
ER ET-ENU (the total energy less the energy of the neutrinos). This ER is equal to the pseudo-Q in File 3 for MT=18.
All of these energies are given for an incident neutron energy (EINC) of zero per equation (3):
Ei (0) = Ei (EINC) + Ei (3)
where,
Ei is any of the energy release components.
Ei (0) is the value at EINC=0
Ei (EINC) is the value at incident energy EINC (MeV)
EINC = 0 is fictitious and represents an artifice by which it is possible to recover the values at any EINC.

19
The Ei’s are given by the following:
ET = – (1.057*EINC – 8.07 * ( (EINC) – (0)))
EB = 0.075*EINC
EGD = 0.075*EINC
ENU = 0.100*EINC
EFR = 0
ENP = – (1.307*EINC – 8.07 * ( (EINC) – (0)))
EGP = 0
From these above definitions and formulas, it is possible to accurately calculate the energy released in a single fission event and how it is distributed among the various fission components. One additional variable had to first be calculated in order to use the above formulas, namely, the average incident neutron energy (EINC) in the ATR that induces fission. This is the EINC variable.
In order to estimate EINC, the 1/8-core ATR model was again used to calculate a fission reaction rate as a function of energy group using a 95-group energy structure with equal lethargy widths. The fission rates were calculated in radial zone 2 (largest cell volume) of ATR driver fuel elements 6, 7, 8, 9, and 10 using the formula:
Fission reaction rate (group g, isotope i) = (PNF)*V*N* g(E) fgi(E)dE (4)
g = gth neutron energy group (1 g 95)
PNF = power normalization factor
V = MCNP cell volume
N = isotope number density
g(E) = group neutron energy flux
fgi(E) = microscopic fission cross section for group g and isotope i
In order to find EINC based on the calculated fission reaction rate spectrum per equation (4), the midpoint energy of the integrated fission reaction rate spectrum had to be determined. This was accomplished by breaking the spectrum into two pieces and integrating the area under the curves. In the case of the discrete energy groups used here, this was done by group summations as follows.
First, the un-normalized total fission rate was calculated based on the summation using equation (5):
Total fission reaction rate = (5)
Then half of the total fission rate was equated to a summation for groups 1 to “X” per equation (6):
* Total fission reaction rate = * = (6)

20
Here, the neutron energy group 1 is the first thermal energy group, and group 95 is the highest neutron energy group (14 MeV), which is typically just the reverse of standard neutron slowing-down nomenclature. The goal is to determine the average neutron energy in the ATR, or the mean neutron energy group X, to satisfy the equation (6) above. The fission rate summation for groups 1–18 is a value slightly less than one half the total fission rate, and the summation for groups 1–19 results in a value slightly more than one half the total fission rate. Therefore, 18 < X < 19, and interpolation gives an average neutron energy value of 0.061538 eV for EINC.
This EINC value is the average neutron energy in ATR that induces a fission in the driver fuel, and it should be noted that EINC = 0.061538 eV is a relatively thermal neutron energy, as expected.
Step No. 7
From the ENDF data and the derived EINC value in Step No. 6, the fission components and corresponding energies can now be accurately calculated. The components and energies are given in Table 7 for U-234, U-235, U-236, and U-238.
Table 7. Fission components and energies for the uranium isotopes in the ATR driver fuel elements.
ENDF Fission Components
U234 Ei(0)
(MeV)
U234 Ei(EINC)
(MeV/fiss)
U235 Ei(0)
(MeV)
U235 Ei(EINC)
(MeV/fiss)
U236 Ei(0)
(MeV)
U236 Ei(EINC)
(MeV/fiss) No. of Prompt Fission Neutrons per Fission nu(0) 2.3391 2.3520 2.4153 2.4320 2.2938 2.3170
K.E. Fission Fragments FR 167.1000 167.1000 169.1200 169.1200 167.5000 167.5000 K.E. Neutrons NP 4.8500 4.7459 4.7900 4.6552 4.7000 4.51270 Delayed Neutrons ND 0.0050 0.0050 0.0074 0.0074 0.0100 0.0100 K.E. Prompt Gammas GP 7.5000 7.5000 6.9700 6.9700 7.3000 7.3000 F.P. gamma-rays GD 6.1300 6.1300 6.3300 6.3300 7.4200 7.4200 F.P. beta-rays B 6.2500 6.2500 6.5000 6.5000 7.5600 7.5600 Neutrinos NU 8.3800 8.3800 8.7500 8.7500 10.1500 10.1500 Total minus Neutrinos R 191.8350 191.7309 193.7174 193.5826 194.4900 194.3027 Total T 200.2150 200.1109 202.4674 202.3326 204.6400 204.4527 Radiative capture gammas GRC 0 0 0 0 0 0
TOTAL 191.7309 193.5826 194.3027

21
Table 7. Fission components and energies for the uranium isotopes in the ATR driver fuel elements. (continued…)
ENDF Fission Components
U238 Ei(0)
(MeV)
U238 Ei(EINC)
(MeV/fiss)
AVERAGE U234/U235/U236/U238
(MeV/fiss) No. of Prompt Fission Neutrons per Fission nu(0) 2.448088 2.49208 ----
K.E. Fission Fragments FR 169.5700 169.5700 169.1199 K.E. Neutrons NP 5.2100 4.8550 4.6552 Delayed Neutrons ND 0.0180 0.0180 0.0074 K.E. Prompt Gammas GP 6.5300 6.5300 6.9700 F.P. gamma-rays GD 8.2500 8.2500 6.3303 F.P. beta-rays B 8.4800 8.4800 6.5003 Neutrinos NU 11.3900 11.3900 8.7504 Total minus Neutrinos R 198.0580 197.7030 193.5832 Total T 209.4480 209.0930 202.3338 Radiative capture gammas GRC 0 0 0
TOTAL 197.7030 193.5832
The average energy released per fission event for the 4 uranium isotopes is 193.5832 MeV/fission with just the following 6 components:
(1) kinetic energy of the fission fragments, (2) kinetic energy of the prompt neutrons, (3) kinetic energy of the delayed neutrons, (4) kinetic energy of the prompt fission gammas, (5) kinetic energy of the fission product gammas, and (6) kinetic energy of the fission product beta-rays.
This value is dominated by the U-235 isotope, since 99.9737% of ATR BOL fission events are due to U-235. Note: the nu(EINC) value in Table 7 is calculated by MCNP for U-234, U-235, U-236, and U-238. The last column is Table 7 is a weighted average based on the specific uranium isotopic fission contributions: 99.9737% U-235, 0.0076% U-234, 0.0023% U-236, and 0.0165% U-238.
The MCNP Q-value for U-235 thermal fission is 180.88 MeV/fission and corresponds to the summation of just the four components: (1) kinetic energy of the fission fragments, (2) kinetic energy of the prompt neutrons, (3) kinetic energy of the delayed neutrons, and (4) kinetic energy of the prompt fission gammas, or 180.69 MeV/fission. Although the comparison values here have some slight numerical differences, we can be relatively certain which specific components are included in the respective Q-values.
The 193.5832 MeV/fission average value is converted to an energy release rate (MeV/sec) by multiplication of the fission rate by the PNF divided by (average number of fission neutron released per

22
fission event). Therefore, the fission energy release rate due to these six components in the ATR 1/8-core model (steady-state full-core BOL power of 100 MWth) is 7.44327E+19 MeV/sec.
Step No. 8 The radiative capture gamma radiation component in the fission event can now be calculated by
multiplying the ratio of the radiative capture energy rate (3.15151E+18 MeV/sec) calculated in Step No. 5 and the 6-component fission energy release rate (7.44327E+19 MeV/sec) times the 6-component 193.5832 MeV/fission value. The result is the energy per fission event due to the binding energy release rate or radiative capture gamma energy release rate:
Radiative Capture Energy per Fission = (193.5832 MeV/fission) * (3.15151E+18 MeV/sec) / (7.44327E+19 MeV/sec)
= 8.1964 MeV/fission
Therefore, the total recoverable energy release per fission event in the ATR is given by:
Total Recoverable Energy Release per = 193.5832 MeV/fission + 8.1964 MeV/fission Fission Event = 201.78 MeV/fission
Step No. 9
One final consideration that might affect the derived 201.78 MeV/fission value is the possibility of ex-core neutron and gamma radiation leakage, or energy deposition outside the core that would be considered non-recoverable. In this case, the neutron and gamma radiation would have to escape the ATR pressure vessel in order to be considered non-recoverable energy. Unfortunately, in order to calculate the small amount of escaping energy, the current ATR MCNP computer model would have to be modified to include these annular regions of the core that are not modeled. Current models only extend radially out to the water shield surrounding the aluminum core-containment tank.
In the actual ATR, there is an inlet flow baffle, a thermal shield, and the pressure vessel beyond the water shield. All three components are stainless steel (SS304). The inlet flow baffle is approximately 1.25-inches thick, the thermal shield 2.5-inches thick, and the pressure vessel 2.0-inches thick. The total SS304 thickness is approximately 5.75-inches thick. In addition, separating the flow baffle and the thermal shield is 3.5-inches of primary coolant water, and separating the thermal shield and the pressure vessel is another 3.5-inches thick annulus of primary coolant water. Outside the pressure vessel is the concrete biological shield. Energy deposition in the concrete would be considered non-recoverable.
Virtually all the neutron radiation leakage from the core would be stopped in this slightly-greater-than-one-foot-thick water shield. Any gamma-ray leakage from the core or radiative capture gammas produced in the water shield would be absorbed in the primary coolant water shield, scattered back into the core, and absorbed (or absorbed by the stainless steel inlet flow baffle, the stainless steel thermal shield, or the stainless steel pressure vessel). Hence, very little neutron or gamma radiation would actually exit the ATR pressure vessel and deposit energy into the concrete biological shield surrounding the pressure vessel.

23
It should be noted that the water shield surrounding the core-containment tank is actually primary coolant and is flowing upward toward the top of the core before entering the top of the active core region and flowing downward through the core. This is the same primary coolant flowing between the flow baffle, thermal shield, and the pressure vessel. Therefore, any neutron or gamma radiation deposition in the primary coolant in these regions would still be considered recoverable energy.
It is only the neutron and gamma radiation beyond the pressure vessel that would have to be considered non-recoverable. Unfortunately, the models do not extend to these limits and we cannot readily calculate these radiation components without significant additional modeling and computer runtime to get statistically meaningful values in these expectedly low radiation zones.
However, an effort was made to estimate the amount of neutron and gamma radiation energy deposition in the water shield surrounding the core-containment tank in order to show the (hopefully) small magnitude. From this calculation, one would then be able to confidently deduce that the two stainless steel thermal shields, the pressure vessel, and the cooling water in between would stop virtually all of the rest of the neutron and gamma radiation. Any radiation passing through the pressure vessel and into the concrete would be at least an order of magnitude smaller than the energy deposited in the water shield and deemed inconsequential.
In order to calculate the energy deposition in the water shield, the 1/8-core ATR MCNP model was modified to calculate (f6:n,p tally) the energy deposition in every cell in the model including all in-core cells and the water shield. The results of the MCNP neutron and gamma energy deposition calculation showed that only 0.2% of the total energy deposition in the model occurs in the water shield. Since the flow baffle, thermal shield, and pressure vessel comprise a 5.75-inch thickness of stainless steel, an insignificant amount of gamma radiation would be expected to actually escape the pressure vessel. With virtually no neutron energy escaping the water shield, modifying the 201.78 MeV/fission value is deemed not necessary in order to account for leakage or non-recoverable energy.
3. UNCERTAINTY A detailed uncertainty analysis has not been performed for the derived Q-value above. We expect
however that the overall uncertainty is relatively small; this is based in part on what we perceive to be reasonable assumptions used in the analysis, application of best estimate values for numerical input, and tight convergence of the calculated values.
Some easily identifiable and quantifiable uncertainties are known to be relatively small and arguably may even cancel one another to some degree. These uncertainties include those associated with the MCNP transport model (input volumes, material compositions, and stochastic errors) and uncertainties associated with our analysis assumptions (inclusion of only unstable compound nuclei with half-lives less than 70 days and neglecting heat loss and radiation exiting the ATR pressure vessel). These uncertainties will have only a minor impact on the estimated Q-value.
We also know there are potential sources of bias and uncertainties associated with the ENDF nuclear fission energy partition data and the neutron cross section data used to calculate the radiative capture rates. A sensitivity or perturbation analysis would need to be performed in order to assess the impact of these uncertainties. A keff uncertainty analysis for the ATRC [6] indicates potential uncertainties in the nuclear data due to U-235, H-1, and Be-9 nuclear data, and the average number of neutrons per fission (nu-bar) in U-235. The effect however of these uncertainties on the ATR Q-value is believed to be relatively small.
Finally, we have assumed an assortment of elemental materials in the MCNP model flux traps and test facilities that may be representative of typical conditions, but not necessarily the exact material conditions for any given ATR power cycle core loading.
24
4. CONCLUSIONS
For the MCNP ATR core calculations requiring normalization to ATR core power, a Q-value of 201.78 MeV/fission is recommended. This Q-value has been derived using the methodology, nuclear data, and assumptions outlined in this report.
Note this Q-value could depend slightly on burnup and specific materials used in the flux traps and other test positions. However, the impact or variation of the Q-value due both burnup is expected to be small since the ATR uses high-enriched uranium fuel and does not produce large amounts of higher order actinides. Plus, the impact of using different targets in the test positions is believed to be small as well due to the much larger mass, volume, and radiative capture gamma emission characteristics of the ATR fuel, cladding, reflector, hafnium, and other structural materials. In this analysis, an assortment of materials was used in the flux traps and test positions which are representative of typical ATR in-core materials, structural components, and irradiation target materials with typical masses and volumes.
5. REFERENCES
1. J.R. Lamarsh, “Introduction to Nuclear Engineering,” Addison-Wesley Publishing Company, 1975.
2. LA-UR-03-1987, “MCNP: Monte Carlo N-Particle Transport Code System, Version 5,” contributed by Los Alamos National Laboratory, Los Alamos, New Mexico, 2003, distributed as package CCC-660 by Oak Ridge National Laboratory (with sample problems).
3. B.G. Harvey, “Introduction to Nuclear Physics and Chemistry,” 2nd edition, Prentice-Hall, Inc., 1969.
4. ENDF-102 “Data Formats and Procedures for the Evaluated Nuclear Data File: ENDF-6,” July 1990, revised November 1995, BNL-NCS-44945, Rev. 11/95, informal report, written by the members of the Cross Section Evaluation Working Group and edited by V. McLane, C.L. Dunford, P.F. Rose, National Nuclear Data Center, Brookhaven National Laboratory.
5. J.R. Parrington, H.D. Knox, S.L. Breneman, E.M. Baum, and F. Feiner, “Chart of the Nuclides: Nuclides and Isotopes,” fifteenth edition, General Electric Co. GE Nuclear Energy, 1996.
6. D.W. Nigg, et. al., “Advanced Test Reactor Core Modeling Update Project,” Annual Report for Fiscal Year 2010, INL/EXT-10-19940, September 2010.