Embed Size (px)
Citation preview

201004-75021
201001-16261
Pyramis Global AdvisorsSelect International
Abhijeet Singh, CFAAssoc. Institutional Portfolio Manager
Art GreenwoodRelationship [email protected]
For Institutional Use Only© 2010 FMR LLC. All rights reserved.548503.1.0
Fresno City Retirement SystemsApril 30, 2010

201004-75022For Institutional Use Only
Table of Contents
I. Global Investment Resources
II. Pyramis Select International
III. Investment Performance
IV. Portfolio Positioning
V. AppendixA. Important InformationB. Biographies
See "Important Information" for a discussion of performance data, some of the principal risks related to any of the investment strategies referred to in this presentation and other information related to this presentation.
Global Investment Resources
201004-75023For Institutional Use Only

201004-75024For Institutional Use Only
Fundamental Research Resources
Equity Research Professionals* International Equity Research Professionals**Since 1989
America
Europe
Pacific Ex-Japan
Japan
– Access to one of the world’s largest buy-side research teams
– Proprietary global research, independent from Wall Street
– Local market coverage– Analysts manage industry funds
* Source: FMR LLC, Pyramis Global Advisors, FIL as of 12/31/09** These figures reflect the combined resources of Pyramis, Fidelity Investments, and FIL.
Europe 96
Japan 36
Pacific Ex-Japan 48
Total International 180
America 215
Total Worldwide 395
020406080
100120140160180200
89 90 91 92 93 94 95 96 97 98 99 00 01 02 03 04 05 06 07 08 09YTD
542932.1.0

Pyramis Select International
201004-75025For Institutional Use Only

201004-75026For Institutional Use Only
Objective:
Select International—Overview
Investment Discipline:
Pure play on Fidelity’s research
Combines active stock selection with quantitative risk controls
Adds value while minimizing relative volatility and risk
It does not:
Hedge currencies
Take top-down allocation positions
– Consistent core exposure
– Consistent value-added
– Low relative volatility

201004-75027For Institutional Use Only
Select International—Investment Process
500+ Stocks3,500+ Stocks
Consider only attractive stocks:
Highly rated by Fidelity analysts
Held in analyst-run industry funds
Select International Portfolio:
Actively selected and risk controlled
Allstocks
followed by Fidelity’s
equityanalysts
≈ 250—300 Stocks
Apply risk controlto match the
characteristics ofthe benchmark atthe regional level
Country exposuresSector/Industry exposuresStyle factorsLiquidity measures
For illustrative purposes only. Research resources depicted include the combined resources of Pyramis, Fidelity Investments and FIL as of March 31, 2010.
201004-75028For Institutional Use Only
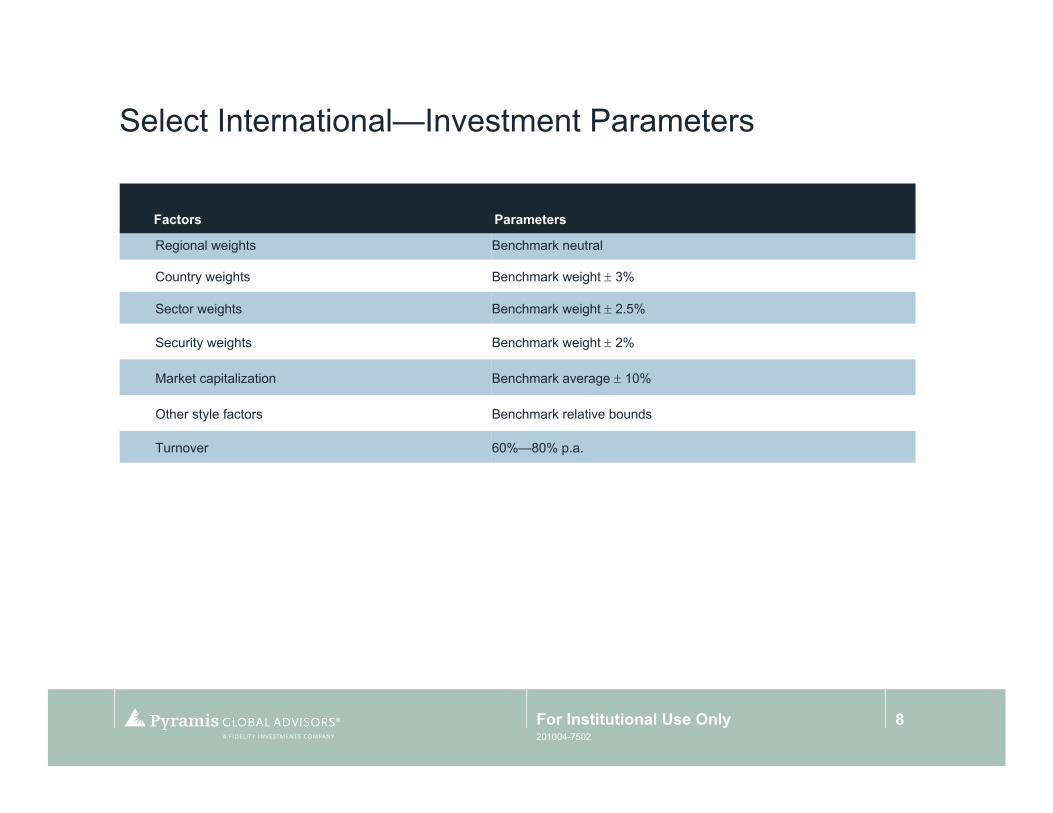
Select International—Investment Parameters
Regional weights Benchmark neutral
Country weights Benchmark weight ± 3%
Sector weights Benchmark weight ± 2.5%
Security weights Benchmark weight ± 2%
Market capitalization Benchmark average ± 10%
Other style factors Benchmark relative bounds
Turnover 60%—80% p.a.
Factors Parameters

Investment Performance
201004-75029For Institutional Use Only

201004-750210For Institutional Use Only
Select International—PerformanceAs of March 31, 2010
Returns are in US Dollars. Performance data is shown gross of any fees and expenses, including advisory fees, which when deducted will reduce returns.Past performance is no guarantee of future results.
Q110 1-Year 2-YearSince
InceptionInception
DateTNA
($Mil)Fresno City Retirement Systems—Select International 0.52 49.07 (7.06) (0.78) 06/30/2006 121.5
MSCI EAFE (Net) 0.87 54.44 (7.02) (1.10)
Active Return (0.35) (5.37) (0.04) 0.32
Cumulative Annualized

201004-750211For Institutional Use Only
Select International—2009 Performance
Key underperformance months: March, April, July
Strong market rally from March led by lower quality stocks
Best markets for Select International typically reward companies with strong fundamentals
2009 rally analogous to 2003 but larger in magnitude
541066.1.0
City of Fresno Retirement Systems (Gross) vs. MSCI EAFE (N)
0.330.59
(1.15)
(1.72)
(0.31)(0.51)
(1.18)
0.25 0.15
(0.12)
0.22
(0.25)
(2.00)
(1.50)
(1.00)
(0.50)
0.00
0.50
1.00
Jan-2009 Feb-2009 Mar-2009 Apr-2009 May-2009 Jun-2009 Jul-2009 Aug-2009 Sep-2009 Oct-2009 Nov-2009 Dec-2009
Excess Return
Returns for pool are shown excluding the impact of fair value. Performance data is shown gross of any fees and expenses, including advisory fees, which when deducted will reduce returns. Past performance is no guarantee of future results.

201004-750212For Institutional Use Only
Characteristics of Early 2009 Rally
Lowest P/B stocks: unprecedented rally off lows vs. higher P/B stocks
Highest Debt to Equity stocks: strongly outperformed in a dramatic reversal of 2008 environment.
Total Debt to Total Equity: MSCI World Median Returns (Highest Quintile Minus Lowest)
-30-20-10
010203040
2003 2004 2005 2006 2007 2008 3/6/09-7/31/09
Perc
ent
Price to Book: MSCI World Median Returns (Lowest Quintile Minus Highest)
-20-10
0102030405060
2003 2004 2005 2006 2007 2008 3/6/09-7/31/09
Perc
ent
541066.1.0
Charts divide the MSCI World Index into quintiles based on the specified metric and depict the difference between the median return within the highest and lowest quintiles. Past performance is no guarantee of future results.

201004-750213For Institutional Use Only
Select International—Attribution by Region One Year Ended March 31, 2010
Past performance is no guarantee of future results. Benchmark is MSCI EAFE (N) Index.
Total PortfolioEurope ex UK Japan
United Kingdom
Pacific ex Japan Cash
Portfolio Return 49.1% 50.0% 36.8% 55.1% 80.6% 0.0%
Index Return 54.4 55.7 38.1 59.2 82.4 0.0
Active Return (5.4) (5.7) (1.3) (4.1) (1.8) 0.0
Value Added fromRegional Policy: (1.2) (0.3) (0.1) (0.2) (0.2) (0.5)
Value Added from Stock Selection: (4.2) (5.4) (1.1) (3.9) (1.7) -
Country Policy (1.1) (2.2) - - (1.2) -
Sector Policy (0.9) (0.9) (0.5) (1.5) (0.6) -
Stock Specific (2.2) (2.3) (0.7) (2.4) 0.2 -
Portfolio Turnover 79%

201004-750214For Institutional Use Only
Past performance is no guarantee of future results. Benchmark is MSCI EAFE (N) Index.
Total PortfolioEurope ex UK Japan United Kingdom
Pacific ex Japan
Consumer Discretionary (0.6)% (0.2)% (0.2)% (0.1)% 0.0%
Consumer Staples (0.5) (0.3) (0.2) (0.2) 0.1
Energy (0.2) 0.2 0.0 (0.3) (0.1)
Financials (1.5) (0.8) (0.2) (0.3) (0.2)
Health Care (0.1) (0.4) 0.0 0.2 0.1
Industrials (0.3) (0.4) (0.1) 0.0 0.1
Information Technology (0.6) (0.3) (0.1) (0.1) (0.1)
Materials (0.5) (0.3) 0.0 (0.1) (0.2)
Telecommunication Services (0.5) (0.2) 0.0 (0.3) 0.0
Other (0.1) (0.1) - - -
Utilities 0.0 0.0 0.1 0.1 (0.1)
All Sectors (4.9) (2.7) (0.7) (1.1) (0.4)
Cash & Other assets (0.5)
Total Active Return (5.4)%
Select International—Contribution By SectorOne Year Ended March 31, 2010

201004-750215For Institutional Use Only
Select International—Contributors and DetractorsOne Year Ended March 31, 2010
SecurityAverage
Portfolio WeightAverage
Benchmark WeightAverage
Active WeightUS$ Total
ReturnContribution to Active Return
DNB Nor Asa 0.6% 0.1% 0.5% 168.9% 0.4%
BNP Paribas 1.2 0.7 0.5 95.5 0.2
GlaxoSmithKline 0.7 1.1 (0.4) 29.7 0.2
Uni Storebrand 0.3 0.0 0.3 155.8 0.2
Macquarie Airports 0.4 0.0 0.4 146.6 0.2
Security Average
Portfolio WeightAverage
Benchmark WeightAverage
Active WeightUS$ Total
ReturnContribution to Active Return
BSCH 0.5% 1.2% (0.7)% 107.2% (0.3)%
Nokia 0.4 0.6 (0.2) 37.2 (0.2)
BG Group 1.3 0.6 0.6 15.7 (0.2)
UBS 0.7 0.5 0.1 73.1 (0.2)
Xstrata 0.0 0.3 (0.3) 183.1 (0.2)
Top Contributors
Top Detractors
Past performance is no guarantee of future results. Not a recommendation or offer to buy or sell securities. Benchmark is MSCI EAFE (N) Index.

Portfolio Positioning
201004-750216For Institutional Use Only

201004-750217For Institutional Use Only
01020304050
Portfolio Benchmark
Select International—Portfolio CharacteristicsAs of March 31, 2010
05
1015202530
Financia
ls Ind
ustria
ls Mate
rials
Consu
mer Stap
les
Consu
mer Disc
retion
ary
Energy
Hea
lth C
are
Inform
ation
Techn
ology
Utilit
ies
Teleco
m Serv
ices
Portfolio Benchmark
0
25
50
75
100
1.5b
n 2b
n 3b
n 4b
n 5b
n 7.
5bn
10bn
15
bn
20bn
25
bn
30bn
40bn
50
bn
75bn
10
0bn
150b
n 20
0bn
Portfolio Benchmark
Regional WeightsRegional positions in line with client objectives
Sector WeightsNo major sector positions
Country WeightsSmall country positions taken
Market Cap DistributionNeutral across all market caps
Per
cent
(%)
Per
cent
(%)
Per
cent
(%)
Per
cent
(%)
05
10152025
Japa
n
Unite
d Ki
ngdo
m
Fran
ce
G
erm
any
Au
stra
lia
Switz
erla
nd
Sp
ain
Ita
ly
Hong
Kon
g
Neth
erla
nds
Be
lgiu
m
Denm
ark
Si
ngap
ore
Sw
eden
Gre
ece
No
rway
Portu
gal
Finl
and
Ire
land
Au
stria
New
Zeala
nd
Cash
& O
ther
Portfolio Benchmark
Benchmark is MSCI EAFE (N) Index.
Europeex UK
Japan United Kingdom
Pacificex Japan
Cash & Other

201004-750218For Institutional Use Only
Select International—Portfolio CharacteristicsAs of March 31, 2010
Beta 1.0 1.0
Dividend Yield 2.8% 3.1%
Avg. Market Cap (US $ billion) 46.3 50.5
P/E Ratio (trailing) 24.8X 23.4X
P/E Ratio (forward)* 15.7X 15.3X
P/BV Ratio 1.6X 1.6X
P/CE Ratio 9.4X 9.4X
Return on Equity 6.5% 6.8%
Number of Issues 272 952
Weight in Benchmark Names 94% 100%
Predicted Active Risk** 1.4% -
Characteristics Portfolio MSCI EAFE (N) Index
* IBES forecast** Predicted active risk, also known as ex ante tracking error is predicted tracking error of the portfolio using MSCI Barra modeling.Although Pyramis believes it has a reasonable basis for any of these expectations, there can be no assurance that actual results will be comparable. Actual results will depend on market conditions and any developments that may effect these investments .

201004-750219For Institutional Use Only
0
20
40
60
80
Rating 1 Rating 2 Rating 3 Rating 4 Rating 5
Perc
ent (
%)
Portfolio Benchmark
Select International—Portfolio Weights by Fidelity Investment RatingAs of March 31, 2010
Benchmark is MSCI EAFE (N) Index. The chart above shows the allocation of the portfolio and benchmark according the stock rating assigned by Fidelity analysts.
Analyst ranking: 1 = strong buy 2 = buy 3 = hold 4 = sell 5 = avoid

201004-750220For Institutional Use Only
Select International—Top Active Holdings by RegionAs of March 31, 2010
Europe ex UK Portfolio Weight (%) Benchmark Weight (%) Active Weight (%) SectorLinde 0.8% 0.2% 0.6% Materials Saipem 0.7 0.1 0.6 Energy Novo-Nordisk 0.9 0.3 0.5 Health Care Philips NV 0.8 0.3 0.5 Industrials Intesa Sanpaolo SpA 0.8 0.3 0.5 Financials
Japan East Japan Railway 0.7% 0.2% 0.4% Industrials Tokyo Gas 0.5 0.1 0.4 Utilities Honda Motor 0.9 0.6 0.4 Consumer Discretionary Tokyo El Power 0.7 0.3 0.3 Utilities Orix Corp 0.4 0.1 0.3 Financials
United Kingdom Reckitt Benckiser 1.0% 0.3% 0.6% Consumer Staples BG Group Plc 1.2 0.6 0.6 Energy Royal Dutch Shell 1.6 1.0 0.6 Energy HSBC 2.2 1.7 0.5 Financials Tesco 1.0 0.5 0.5 Consumer Staples
Pacific ex Japan Wesfarmers 0.8% 0.3% 0.6% Consumer Staples Map Group Stapled 0.6 0.0 0.5 Industrials Rio Tinto 0.8 0.3 0.5 Materials Australia New Zealand Bank 1.0 0.6 0.5 Financials China Overseas Land 0.3 0.0 0.3 Financials Total 17.5% 7.8% 9.7%
Benchmark is MSCI EAFE (N) Index. Not a recommendation or offer to buy or sell securities.

Appendix
201004-750221For Institutional Use Only

201003-741822For Institutional Use Only
48.82
-7.04
4.41 12.312.44 6.87
54.44
-7.02
3.75 11.771.29 4.87
1-Year 3-Year 5-Year 7-Year 10-Year 15-Year
Portfolio Benchmark
Select International—Composite PerformanceAs of March 31, 2010
Annualized Performance (Gross)
1995 12.85 11.21 1.64 1996 8.93 6.05 2.88 1997 6.27 1.78 4.49 1998 19.03 20.00 (0.97)1999 36.82 26.96 9.86 2000 (12.47) (14.17) 1.70 2001 (19.54) (21.55) 2.01 2002 (13.21) (15.64) 2.43 2003 40.19 38.59 1.60 2004 21.47 20.25 1.22 2005 14.88 13.54 1.34 2006 27.69 26.34 1.35 2007 16.52 11.17 5.35 2008 (42.66) (43.38) 0.722009 25.49 31.78 (6.29)Q110* 0.48 0.87 (0.39)
Year Composite* Benchmark Active Return
*Returns of less than one year are not annualized. Performance shown is gross of any fees and expenses, including advisory fees, which when deducted will reduce returns. See the GIPS Composite Performance Data for annual performance figures that are net of the maximum investment advisory fee charged any client employing this strategy. Past performance is no guarantee of future results. Benchmark is MSCI EAFE (N) Index.
201004-750223For Institutional Use Only
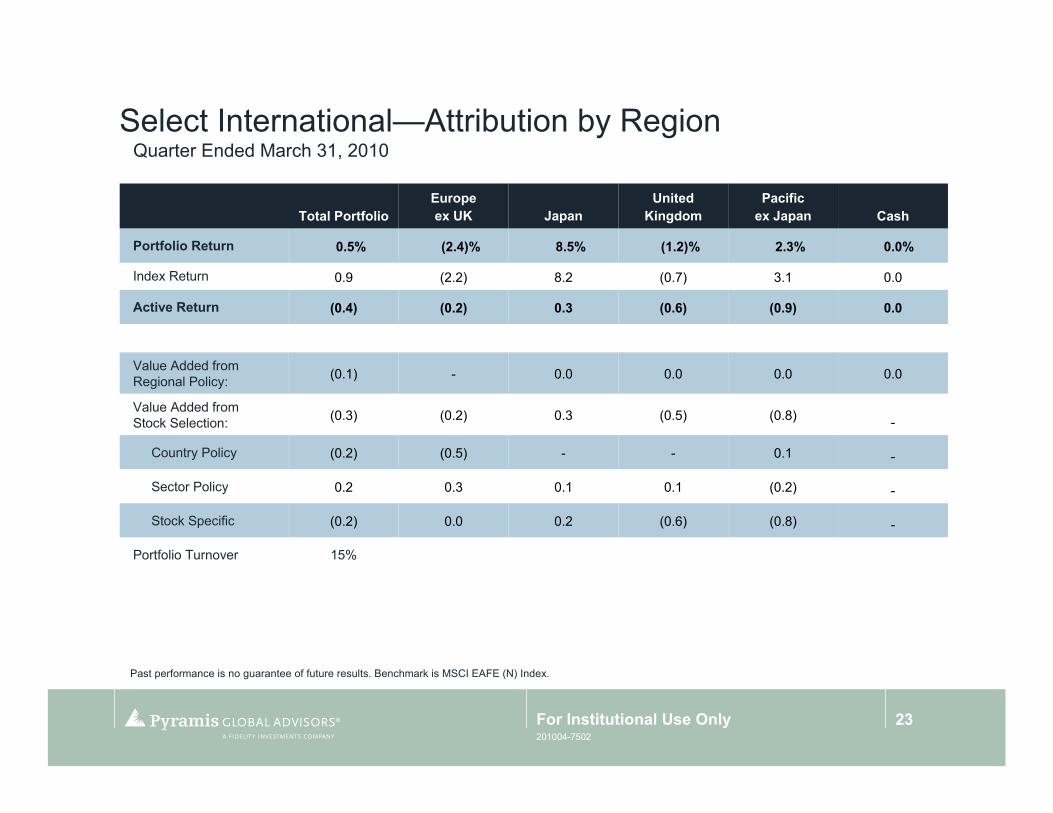
Select International—Attribution by RegionQuarter Ended March 31, 2010
Past performance is no guarantee of future results. Benchmark is MSCI EAFE (N) Index.
Total PortfolioEurope ex UK Japan
United Kingdom
Pacific ex Japan Cash
Portfolio Return 0.5% (2.4)% 8.5% (1.2)% 2.3% 0.0%
Index Return 0.9 (2.2) 8.2 (0.7) 3.1 0.0
Active Return (0.4) (0.2) 0.3 (0.6) (0.9) 0.0
Value Added fromRegional Policy: (0.1) - 0.0 0.0 0.0 0.0
Value Added from Stock Selection: (0.3) (0.2) 0.3 (0.5) (0.8) -
Country Policy (0.2) (0.5) - - 0.1 -
Sector Policy 0.2 0.3 0.1 0.1 (0.2) -
Stock Specific (0.2) 0.0 0.2 (0.6) (0.8) -
Portfolio Turnover 15%

201004-750224For Institutional Use Only
Past performance is no guarantee of future results. Benchmark is MSCI EAFE (N) Index.
Select International—Contribution By SectorQuarter Ended March 31, 2010
Total PortfolioEurope ex UK Japan United Kingdom
Pacific ex Japan
Consumer Discretionary 0.1% 0.1% 0.0% 0.0% (0.1)%
Consumer Staples (0.1) 0.0 (0.1) (0.1) 0.0
Energy 0.0 0.1 0.0 0.0 0.0
Financials (0.2) (0.1) 0.1 (0.1) (0.1)
Health Care 0.2 0.1 0.0 0.0 0.0
Industrials 0.0 (0.2) 0.1 0.0 0.0
Information Technology (0.1) 0.0 (0.2) 0.0 0.0
Materials 0.0 0.0 0.0 0.0 0.0
Telecommunication Services (0.1) (0.1) 0.0 0.0 -
Utilities 0.0 0.0 0.0 0.0 0.0
All Sectors (0.3) (0.1) 0.0 (0.2) (0.1)
Cash & Other assets 0.0
Total Active Return (0.4)%

201004-750225For Institutional Use Only
Select International—Contributors and DetractorsQuarter Ended March 31, 2010
SecurityAverage
Portfolio WeightAverage
Benchmark WeightAverage
Active WeightUS$ Total
ReturnContribution to Active Return
BSCH 0.7% 1.2% (0.5)% (18.6)% 0.1%
Novo-Nordisk 0.7 0.3 0.4 23.6 0.1
Orix Corp 0.4 0.1 0.3 32.8 0.1
Barclays Bank 0.8 0.5 0.3 23.2 0.1
Infineon Technologies 0.3 0.1 0.3 24.9 0.1
Security Average
Portfolio WeightAverage
Benchmark WeightAverage
Active WeightUS$ Total
ReturnContribution to Active Return
Nintendo 0.0% 0.3% (0.3)% 44.6% (0.1)%
Intesa Sanpaolo SpA 0.8 0.3 0.5 (17.4) (0.1)
Nokia 0.0 0.5 (0.5) 21.9 (0.1)
Westpac Banking 0.0 0.7 (0.7) 12.3 (0.1)
Renewable Energy Corp 0.2 0.0 0.1 (39.5) (0.1)
Top Contributors
Top Detractors
Past performance is no guarantee of future results. Not a recommendation or offer to buy or sell securities. Benchmark is MSCI EAFE (N) Index.
201004-750226For Institutional Use Only
Important InformationRead this important information carefully before making any investment. Speak with your relationship manager if you have any questions.
Risks
Past performance is no guarantee of future results. An investment may be risky and may not be suitable for an investor's goals, objectives and risk tolerance. Investors should be aware that an investment's value may be volatile and any investment involves the risk that you may lose money.
Performance results for individual accounts will differ from performance results for composites and representative accounts due to factors including but not limited to portfolio size, especially if currently only funded with affiliated fee paying seed capital, timing of investments, market conditions, account objectives and restrictions, and factors specific to a particular investment structure.
The value of a strategy's investments will vary day to day in response to many factors, including in response to adverse issuer, political, regulatory, market or economic developments. The value of an individual security or a particular type of security can be more volatile than the market as a whole and can perform differently from the value of the market as a whole.
Derivatives may be volatile and involve significant risk, such as, credit risk, currency risk, leverage risk, counterparty risk and liquidity risk. Using derivatives can disproportionately increase losses and reduce opportunities for gains in certain circumstances. Investments in derivatives may have limited liquidity and may be harder to value, especially in declining markets.
The performance of international strategies depends upon currency values, political and regulatory environments, and overall economic factors in the countries in which they invest. Foreign markets, particularly emerging markets, can be more volatile than the U.S. market due to increased risks of adverse issuer, political, regulatory, market, or economic developments and can perform differently from the U.S. market. The risks are particularly significant for strategies that focus on a single country or region.
These materials contain statements that are “forward-looking statements,” which are based on certain assumptions of future events. Forward-looking statements are based on information available on the date hereof, and Pyramis does not assume any duty to update any forward looking statement. Actual events may differ from those assumed. There can be no assurance that forward-looking statements, including any projected returns, will materialize or that actual market conditions and/or performance results will not be materially different or worse than those presented.

201004-750227For Institutional Use Only
Important InformationPerformance Data
Unless otherwise indicated performance data shown is client data. Performance data is generally presented gross of any fees and expenses, including advisory fees, which when deducted will reduce returns. All results reflect realized and unrealized appreciation and the reinvestment of dividends and investment income, if applicable. Taxes have not been deducted. In conducting its investment advisory activities, Pyramis utilizes certain assets, resources and investment personnel of FMR Co., which does not claim compliance with the Global Investment Performance Standards (GIPS®).
If representative account information is shown, it is based on an account in the subject strategy’s composite that generally reflects that strategy’s management and is not based on performance.
Index or benchmark performance shown does not reflect the deduction of advisory fees, transaction charges and other expenses, which if charged would reduce performance. Investing directly in an index is not possible.
* * * *
The business unit of Pyramis Global Advisors (Pyramis) consists of: Pyramis Global Advisors Holdings Corp. , a Delaware corporation; Pyramis Global Advisors Trust Company, a non depository limited purpose trust company (PGATC); Pyramis Global Advisors, LLC, a U.S. registered investment adviser (PGA LLC); Pyramis Canada ULC, an Ontario registered investment adviser; Pyramis Global Advisors (UK) Limited, a U.K. registered investment manager (Pyramis-UK); Pyramis Global Advisors (Hong Kong) Limited, a Hong Kong registered investment adviser (Pyramis-HK); Pyramis Distributors Corporation LLC, a U.S. registered broker-dealer; and Fidelity Investments Canada ULC, an Alberta corporation (FIC). Investment services are provided by PGATC, PGA LLC, Pyramis Canada ULC, Pyramis-UK and/or Pyramis-HK.
"Fidelity Investments" refers collectively to FMR LLC, a U.S. company, and its subsidiaries, including but not limited to Fidelity Management & Research Company (FMR Co.), Fidelity Management & Research Company, Inc. (FMR Co. Inc.) and Pyramis. “FIL” refers collectively to FIL Limited, a non-U.S. company, and its subsidiaries. “Fidelity” refers collectively to Pyramis, Fidelity Investments and/or FIL.
Certain data and other information in this presentation have been supplied by outside sources and are believed to be reliable as of the date of this document. Data and information from third-party databases, such as those sponsored by eVestment Alliance and Callan, are self-reported by investment management firms that generally pay a subscription fee to use such databases, and the database sponsors do not guarantee or audit the accuracy, timeliness or completeness of the data and information provided including any rankings. Rankings or similar data reflect information at the time rankings were retrieved from a third-party database, and such rankings may vary significantly as additional data from managers are reported. Pyramis has not verified and cannot verify the accuracy of information from outside sources, and potential investors should be aware that such information is subject to change without notice. Information is current as of the date noted.
Pyramis has prepared this presentation for, and only intends to provide it to, institutional, sophisticated and/or qualified investors in one-on-one or comparable presentations. Do not distribute or reproduce this report.
All trademarks and service marks included herein belong to FMR LLC or an affiliate, except third-party trademarks and service marks, which belong to their respective owners. Pyramis does not provide legal or tax advice and we encourage you to consult your own lawyer, accountant or other advisor before making an investment.
Offered by Pyramis Distributors Corporation LLC.
Not FDIC Insured • No Bank Guarantee • May Lose Value

16 4%N/AN/AN/A6,433-0.390.870.280.482010 YTD4%1.3223.5728.216,33616-6.2931.7824.5025.492009 Annual
-14.17-21.55-15.6438.5920.2513.5426.3411.17
-43.38
Benchmark Return (%)
3%0.67-44.07-42.354,335120.72-43.14-42.662008 Annual
1%N/A-12.46-12.461,389less than 51.70-13.17-12.472000 Annual
1%N/A-13.22-12.861,249less than 52.43-13.91-13.212002 Annual1%N/A39.6540.532,049less than 51.6039.1040.192003 Annual2%0.1820.9421.553,03451.2220.5221.472004 Annual2%0.3514.1015.044,14371.3413.9814.882005 Annual
1%N/A-19.57-19.571,400less than 52.01-20.19-19.542001 Annual
1111
Number of Portfolios
7,3206,444
Total Composite Assets End of
Period ($ million)
28.3217.12
High Annual Return (%)
27.7716.23
Low Annual Return (%)
0.130.32
Asset Weighted Standard Deviation (%)
27.6916.52
Composite Return (Gross%)
26.6915.60
Composite Return (Net%)
3%1.352006 Annual3%5.352007 Annual
Percent of Firm’s Assets
Value Added (%)*Period
GIPS Composite Performance DataSelect International (NCF) Composite (USD) Versus MSCI EAFE Linked Index (Net Luxembourg tax)As of March 31, 2010
Notes:1. Basis of PresentationThe Firm has prepared and presented this report in accordance with the Global Investment Performance Standards (GIPS®). Compliance with these standards has been independently verified for the period from January 1, 1990 to December 31, 2008. A complete list and description of all the Firm’s composites is available upon request. Additional information regarding policies for calculating and reporting returns is available upon request.2. Definition of the “Firm”The “Firm” is defined as “Pyramis Global Advisors,” which consists of Pyramis Global Advisors Trust Company (“PGATC”), Pyramis Global Advisors, LLC (“PGALLC”), Pyramis Global Advisors (Hong Kong) Limited (“PGAHK”), Pyramis Global Advisors (U.K.) Limited (“PGAUK”), Pyramis Canada ULC (“PC”), and the Fidelity Real Estate High Income Fund, an institutional mutual fund managed by our affiliate Fidelity Management & Research Company (“FMR Co.”).3. Changes to Definition of the “Firm”Effective January 1, 2006, the definition of the Firm was revised to include PGATC and PGALLC, both newly formed institutional investment management divisions of FMR LLC (commonly known as Fidelity Investments). Effective January 1, 2009, the definition of the Firm was revised to: (1) exclude PGATC’s management of funds that invest in real estate; (2) exclude Fidelity Management Trust Company, the institutional business of FIL Limited, Fidelity Investments Canada ULC, and Fidelity Management & Research Company because none are held out to the public as a part of Pyramis Global Advisors; and (3) include the newly created entities of PGAHK, PC, and PGAUK.4. ReturnsGross composite returns do not include investment advisory fees or any administrative or custodial fees, but do include trading expenses. Net composite returns are calculated by deducting the maximum investment advisory fee charged to any client employing this strategy during the time period shown from the gross returns. Actual investment advisory fees paid by a client may vary depending upon a variety of factors, including portfolio size and the use of a performance fee arrangement (if applicable), and returns could be higher or lower than those shown. Actual returns will be reduced by the investment advisory fee, a performance fee arrangement (if applicable), and any other fees and expenses including any administrative, custodial, or other expenses incurred in the management of a client’s portfolio. A client’s fees are generally calculated based on the average month-end assets at market value during the quarter as calculated by the Firm, and are billed quarterly in arrears. More information regarding fees is available upon request.These investment performance statistics were calculated without a provision for United States income taxes.5. Investment ObjectiveThe investment objective of this sub-composite is to provide consistent excess return over the EAFE Linked Index (Net Luxembourg) through active stock selection while closely matching geographic region weights of the index. The sub-composite is composed of all fee-paying discretionary accounts that are managed by the Firm in this style.This sub-composite, along with one or more other sub-composites, combine to create an aggregate composite.6. Benchmark DefinitionMorgan Stanley Capital International EAFE Linked Index (Net Luxembourg)From August 1, 1989, until June 30, 2001, the benchmark was the Morgan Stanley Capital International Europe, Australasia, and Far East (MSCI EAFE) Index net of withholding taxes. From July 1, 2001, until May 31, 2002, the benchmark was represented by the MSCI EAFE Provisional Index net of withholding taxes. As of June 1, 2002, the Provisional Index became the Morgan Stanley Capital International Europe, Australasia, and Far East (MSCI EAFE) Index net of withholding taxes.
7. Composite Creation DateThis composite was created in 2007.
8. Pool Portfolio/Fair Valuation of SecuritiesThe composite contains a pool portfolio that is presented net of custody and audit fees. Investment security transactions for the pool portfolio are accounted for on trade date-plus-one. Pools are subject to Pyramis’ market timing policy, which for days with material market movement between the local market close and 4:00 pm Eastern Standard time, requires the pool’s net asset value to be determined using securities valuations at 4:00 pm EST. Separate accounts are not subject to this policy and use securities valuations provided at the close of that international security’s particular market. As a result, the performance of the pool may be different (higher or lower) from the performance of other accounts in this composite and may have a material impact on the performance of the overall composite.
9. Withholding TaxesComposite returns are net of foreign withholding taxes and after foreign tax reclaims where such recoveries are reasonably assured. The withholding tax rates applied to the underlying composite portfolios are from the perspective of a US-based investor. The international benchmark returns assume dividends are reinvested daily, and are presented net of withholding taxes assuming the most conservative tax perspective, that of a Luxembourg holding company. Luxembourg has few tax treaties, and Luxembourg-based investors pay the maximum dividend taxes.
10. Fee ScheduleThe maximum scheduled investment advisory fee for this strategy is 80 basis points, which may be subject to certain decreases as assets under management increase. The investment advisory fee applicable to a portfolio depends on a variety of factors, including but not limited to portfolio size, the level of committed assets, service levels, and other factors.
11. Derivative ExposureTypically, portfolios may make limited use of derivative instruments to manage and invest cash inflows of underlying accounts within the composite. They are not used for hedging purposes. Derivative instruments are only used when and as client guidelines permit.
12. Known Inconsistencies in Exchange RatesThe composite base currency is US Dollars (USD). One or more of the current or historic constituent portfolios have a base currency that differs from the composite and uses a valuation point that differs from other constituent portfolios.13. OtherFor the periods prior to January 1, 1996, the Firm does not have records that support the basis of the performance of certain portfolios and composites that are part of the Firm’s claim of GIPS compliance as a result, in part, of computer file deletions, record retention system changes, and the Firm’s record retention or related practices. The Firm has performed an exhaustive review to locate such records. The Firm is relying on the “Act of God” record exclusion to enable the Firm to claim GIPS compliance for these periods.
Past performance is no guarantee of future results.
521330.4.0
* Value Added calculated using the gross composite return.
201003-741828For Institutional Use Only

201004-750229For Institutional Use Only
Biographies
César E. Hernández, CFAPortfolio ManagerCésar Hernández is a portfolio manager at Pyramis Global Advisors, a unit of Fidelity Investments. He developed the Select International discipline at Fidelity and has been responsible for managing Select International and Select Global portfolios on behalf of institutional investors around the worldsince the discipline’s inception in 1989.
Prior to joining Fidelity, César was portfolio manager for international investments at State Street Bank & Trust Company. He began working in the investment industry in 1986.
César earned a Bachelor of Science degree from the Universidad Simón Bolívar and a Master’s degree in Business Administration from Babson College. He is a Chartered Financial Analyst charterholder and a member of the Boston Security Analysts Society.
Ravi Mantha, CFAPortfolio Manager
Ravi Mantha is a portfolio manager at Pyramis Global Advisors, a unit of Fidelity Investments. In this role, he is a member of the Select International portfolio management team. Ravi is the back-up portfolio manager for the Pyramis Select Global portfolios, and is the lead portfolio manager on the firm’s Select Emerging Markets Equity portfolios.
Prior to joining Fidelity, he was a portfolio manager and member of the investment strategy committee at PyrfordInternational Plc, a London-based international value equity investment manager, where he focused on Asia and Pacific developed markets. Before joining Pyrford in 1999, Ravi spent five years as a research analyst at Frank Russell Company in the global equity management research group, initially located in the U.S. and then in London.
Ravi earned a Bachelor of Arts degree in International Business from the University of Puget Sound. He is a Chartered Financial Analyst charterholder.

201004-750230For Institutional Use Only
Biographies
Lance McInerney, CFAInstitutional Portfolio ManagerLance McInerney is an institutional portfolio manager at Pyramis Global Advisors, a unit of Fidelity Investments. In thisrole, he is a member of the Select International portfolio management team.
Lance joined Pyramis in 2005. Prior to joining Pyramis, he was a senior product specialist for the global & US equity teams at Fortis Investments. Lance also served at Credit Suisse Asset Management as a product specialist/strategist. In addition, he was a senior consultant, investor relations at Thomson Financial. He began his career as an investor relations consultant at The Carson Group.
Lance earned a Bachelor of Science degree from the University of Maryland and a Master’s degree in Business Administration from Vanderbilt University. He is a Chartered Financial Analyst charterholder and a member of the Boston Security Analysts Society.
Myra Wonisch Tucker, CFAPortfolio Manager Myra Wonisch Tucker is a portfolio manager at Pyramis Global Advisors, a unit of Fidelity Investments. In this role Myra manages portfolios of equity investments from institutional investors.
Prior to assuming her current role, Myra was an assistant portfolio manager and portfolio manager from 1994 through 2007 managing US Select portfolios, a risk-controlled discipline based upon fundamental research. Prior to joining Fidelity in 1994, she was an analyst at Independence Investments.
Myra earned a Bachelor of Science in Engineering from Virginia Tech University and a Master’s degree in Business Administration from The Amos Tuck School at Dartmouth College. She is a Chartered Financial Analyst charterholderand a member of the Boston Security Analysts Society.

201004-750231For Institutional Use Only
Biographies
Abhijeet Singh, CFAAssociate Institutional Portfolio ManagerAbhijeet Singh is an associate institutional portfolio manager at Pyramis Global Advisors, a unit of Fidelity Investments. In this role, he is a member of the Select International portfolio management team.
Abhijeet joined Pyramis in 2006 covering Select International and other international/global equity strategies as an investment director. Prior to joining Pyramis, he was with Fidelity’s New Business Development group working as a corporate strategy advisor to the firm’s senior management. Prior to joining Fidelity, he was a strategy consultant with Braxton Associates, a division of Deloitte.
Abhijeet earned a Bachelor of Technology degree from the Indian Institute of Technology and a Master’s degree in Business Administration from Carnegie Mellon University. He is a Chartered Financial Analyst (CFA) charterholder and a member of the Boston Security Analysts Society.
Arthur J. GreenwoodSenior Vice President, Relationship ManagerArt Greenwood is a Senior Vice President and Relationship Manager at Pyramis Global Advisors, a unit of Fidelity Investments. In this role, Art is responsible for overallmanagement of institutional client relationships including many large public and corporate pension funds.
Prior to assuming his current role, he was a Vice President at Fidelity Investments Institutional Services Company, focused on developing institutional relationships with state and local government investors. Art joined Fidelity in 1986. He has over 20 years experience in the financial services industry.
Art earned a Bachelor of Science degree in Finance and Accounting from Lehigh University. He holds the Financial Industry Regulatory Authority (formerly NASD) Series 6, 7, 24, and 63 licenses and is a member of the Association of Investment Management Sales Executives (AIMSE).