Embed Size (px)
Citation preview

© Western Asset Management Company 2013. This publication is the property of Western Asset Management Company and is intended for the sole use of its clients, consultants, and other intended recipients. It should not be forwarded to any other person. Contents herein should be treated as confidential and proprietary information. This material may not be reproduced or used in any form or medium without express written permission.
Michael BazdarichProduct Manager/economist
Persistence of Tracking error Part 2:corporate Bonds as ldi hedges
i. introductionOnce a defined-benefit (DB) pension plan has achieved asset duration equal to that of its liabilities, the next step in the LDI, derisking process typically is to address curve risks or spread risks or combinations of these. Matching the duration of assets and liabilities hedges the plan against broad shifts in the level of interest rates, but does not address movements in specific segments of the yield curve or the spread curve.
Such curve and spread curve risks might be addressed by matching key-rate durations (KRDs) of assets and liabilities. Specific cash flows within the plan’s liability valuation are sensitive to movements in yields in cor-responding segments of the yield curve.1 The valuation of 20-year-out cash flows will be sensitive to 20-year yields, 10-year cash flows to 10-year yields, and so on. By choosing exposure to assets sensitive to various segments of the yield curve, that is, by matching KRDs, a plan can attempt to reduce the tracking error of its funded balance below the levels that could be achieved by merely matching overall duration.
The question is: how effective are such tactics? In a previous paper, we analyzed the effectiveness of hedging KRDs via Treasury STRIPS and found targeted STRIPS allocations to be ineffective in reducing tracking error below levels provided by simple allocations to long duration indices, such as Long Government/Credit or Long Credit.2 It could be argued that KRD-matched STRIPS fail to reduce tracking error because they leave spread (and spread curve) risks unaddressed.
This paper takes the process one step forward, analyzing the effectiveness of targeted corporate bond port-folios in addressing KRD risks. The issue is not whether corporate bonds belong in an LDI portfolio. Rather, our concern is whether indices of corporate bonds with targeted maturity ranges can effectively hedge the curve risks of DB plans’ liabilities.
We construct indices of corporate bonds that match both the KRD sensitivities and the quality levels (thus spread durations) of DB liabilities, and we examine whether KRD-matched combinations of these indices do a better job of tracking DB liabilities than mere duration-matched corporate or government/corporate portfolios. Our findings are that they don’t. Invariably, we find that allocations containing only the longest-duration corporate index provide better results than allocations combining various corporate bond indices so as to target KRDs. This is the case even though our targeted-maturity corporate bond indices exactly match the features of the corporate yield curves used to produce our liability returns.
There are conceptual reasons why this should be the case. The fact is that given currently available asset instruments, full KRD-matching of liabilities is impossible for a DB plan unless it is willing to significantly over-fund its liabilities. This is so partly because corporate zero-coupon bonds do not exist in any meaningful quantity and partly because the available maturity of long-duration assets is generally much shorter than those of the cash flows of DB liabilities.
If a plan that is “merely” fully funded cannot KRD-hedge all its cash flow obligations, the question becomes: which obligations should it try to hedge? Our research unequivocally indicates that it should focus on the
executive Summarycorporate bonds would be �expected to provide the best attainable hedge of defined-benefit pension liabilities, since hedging the key-rate durations of liabilities via cor-porate bonds addresses curve risks and spread risks, as well as interest rate risks.
To test the efficacy of corpo- �rate bonds as hedges of dB curve and spread risks, we con-structed indices of corporate bonds with targeted maturity ranges, using the same bonds and same maturity ranges as were used to construct the spot yield curves generating liability returns.
When hedging analyses were �performed via these indices, we found that in all cases, the best results were achieved simply by allocating all assets to the longest-duration index available, with no attempt to address curve risks.
There are conceptual reasons �why this would be the case, reasons concerning the limited maturity range of available cor-porate bonds and the general unavailability of zero-coupon corporate bonds.
We conclude that simple ldi �allocations to long duration provide just as effective a hedge of dB liabilities as more complex allocations that at-tempt to match not just total duration, but also the key-rate durations underlying dB liabilities.

Western asset November 2013
Persistence of Tracking error Part 2: corporate Bonds as ldi hedges
2
long end of the curve, allocating all assets to the longest-duration corporate bond index available and essentially forgetting about the shorter-maturity cash flows. These results echo a “simple is better” theme that emerges continually from empirical LDI research. Complex LDI allocations targeting KRDs or matching cash flows look great on paper, but in practice, they do not deliver materially better hedges of DB liabilities than simple allocations.
Section II describes our construction of target-maturity corporate bond indices to mimic the yield curve structure generating DB liability valuations. Section III discusses the conceptual problems with KRD-hedging. Section IV examines the use of the target-maturity corporate bond indices in attempting to hedge KRDs of DB liabilities. Section V discusses the implications of these findings and concludes.
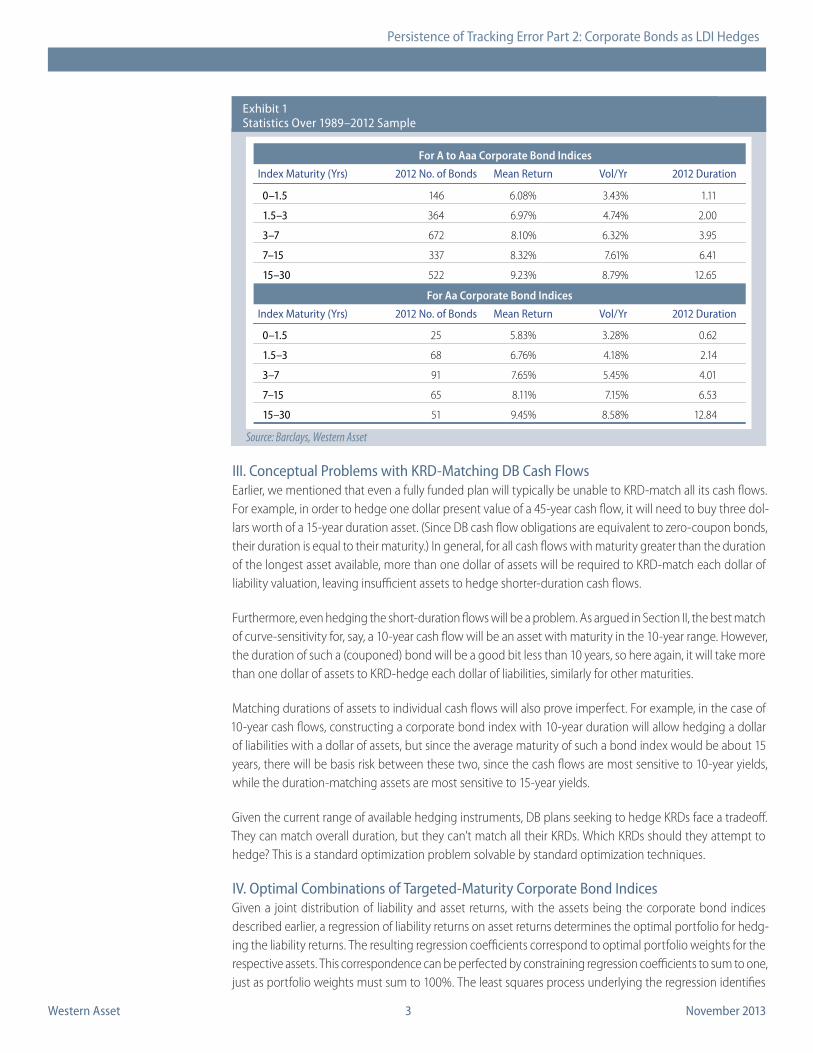
ii. constructing Target-Maturity corporate Bond indicesIn previous work, we described DB liability return series generated following Treasury’s methodology for yield curve construction under the Pension Protection Act (PPA).3 Treasury’s method starts by partitioning a suitable set of corporate bonds into five maturity segments: 0 to 1.5 years, 1.5 to 3 years, 3 to 7 years, 7 to 15 years, and 15 to 30 years. It then fits a spot yield curve to these bonds, utilizing a cubic spline method defined over these maturity ranges. Treasury uses bonds ranging in quality from A to Aaa.
We applied Treasury’s methodology to the universe of bonds within the Barclays Point database to produce a comparable series of A to Aaa yield curves extending back to 1988. We then used these curves to discount standard sets of DB cash flow obligations to present valuations, producing a series of liability returns.4 These liability returns provide an indication of how funding targets would have behaved across 1989–2012 experi-ence for a corporate plan with similar cash flow obligations. Now, an A to Aaa curve would not be usable for GAAP-compliant liability valuations, so we also applied Treasury’s methodology to a universe of Aa bonds only within Barclays Point to produce a corresponding set of spot yield curves and liability valuations relevant for an accounting target analysis.
If a plan wanted to hedge KRDs of liability returns generated in this manner, it would be logical to construct corporate bond indices drawn from this same bond universe and to group them in the same maturity parti-tions as were used for estimating spot yield curves. This is exactly what we did. We took the Barclays Point bond universes described above and grouped them into indices with maturity ranges of 0 to 1.5 years, 1.5 to 3 years, 3 to 7 years, 7 to 15 years, and 15 to 30 years, one set of indices each for A to Aaa bonds and for Aa bonds only.
For each such index, we calculated annual holding period returns on a market-value weighted basis. Sum-mary statistics for these indices are shown in Exhibit 1. These indices could be expected to provide the best chance of successfully hedging KRDs in corresponding liability returns, since the hedging instruments used mimic the liability valuation process as closely as possible.
Western asset November 2013
Persistence of Tracking error Part 2: corporate Bonds as ldi hedges
3
iii. conceptual Problems with Krd-Matching dB cash FlowsEarlier, we mentioned that even a fully funded plan will typically be unable to KRD-match all its cash flows. For example, in order to hedge one dollar present value of a 45-year cash flow, it will need to buy three dol-lars worth of a 15-year duration asset. (Since DB cash flow obligations are equivalent to zero-coupon bonds, their duration is equal to their maturity.) In general, for all cash flows with maturity greater than the duration of the longest asset available, more than one dollar of assets will be required to KRD-match each dollar of liability valuation, leaving insufficient assets to hedge shorter-duration cash flows.
Furthermore, even hedging the short-duration flows will be a problem. As argued in Section II, the best match of curve-sensitivity for, say, a 10-year cash flow will be an asset with maturity in the 10-year range. However, the duration of such a (couponed) bond will be a good bit less than 10 years, so here again, it will take more than one dollar of assets to KRD-hedge each dollar of liabilities, similarly for other maturities.
Matching durations of assets to individual cash flows will also prove imperfect. For example, in the case of 10-year cash flows, constructing a corporate bond index with 10-year duration will allow hedging a dollar of liabilities with a dollar of assets, but since the average maturity of such a bond index would be about 15 years, there will be basis risk between these two, since the cash flows are most sensitive to 10-year yields, while the duration-matching assets are most sensitive to 15-year yields.
Given the current range of available hedging instruments, DB plans seeking to hedge KRDs face a tradeoff. They can match overall duration, but they can’t match all their KRDs. Which KRDs should they attempt to hedge? This is a standard optimization problem solvable by standard optimization techniques.
iV. Optimal combinations of Targeted-Maturity corporate Bond indicesGiven a joint distribution of liability and asset returns, with the assets being the corporate bond indices described earlier, a regression of liability returns on asset returns determines the optimal portfolio for hedg-ing the liability returns. The resulting regression coefficients correspond to optimal portfolio weights for the respective assets. This correspondence can be perfected by constraining regression coefficients to sum to one, just as portfolio weights must sum to 100%. The least squares process underlying the regression identifies
Source: Barclays, Western Asset
Exhibit 1Statistics Over 1989–2012 Sample
0–1.5
1.5–3
3–7
7–15
15–30
146
364
672
337
522
6.08%
6.97%
8.10%
8.32%
9.23%
3.43%
4.74%
6.32%
7.61%
8.79%
1.11
2.00
3.95
6.41
12.65
Index Maturity (Yrs) 2012 No. of Bonds Mean Return Vol/Yr 2012 Duration
0–1.5
1.5–3
3–7
7–15
15–30
25
68
91
65
51
5.83%
6.76%
7.65%
8.11%
9.45%
3.28%
4.18%
5.45%
7.15%
8.58%
0.62
2.14
4.01
6.53
12.84
For A to Aaa Corporate Bond Indices
For Aa Corporate Bond Indices
Index Maturity (Yrs) 2012 No. of Bonds Mean Return Vol/Yr 2012 Duration

Western asset November 2013
Persistence of Tracking error Part 2: corporate Bonds as ldi hedges
4
the portfolio with minimum tracking error against the liability returns, so the specified portfolio is optimal in this sense across the sample period.5
Regressions can easily be constrained to ensure that coefficients sum to one. It is not so easy to constrain those coefficients to be nonnegative.6 A negative coefficient amounts to shorting the corresponding asset. It would be essentially impossible in practice to short the corporate bond indices we have constructed, and most plans would choose not to do so even if it were possible. After all, if the coefficient for a particular index turned out to be negative, the implication is that there is no benefit to hedging the corresponding KRDs, so why make any allocation to that index?
So, when the regression results deliver a negative coefficient for a specific asset, it is best simply to drop that index from the mix and re-run the regression. This is the process we followed in our analysis of KRD-hedging via our target-maturity corporate bond indices. For each of the liability return series and corresponding corporate bond index sets described in Section 2, we first regressed liability returns on all five correspond-ing corporate bond indices. We then dropped the index with the most negative coefficient and reran the regression, continuing this process until no negative coefficients remained.
The results of this process are reported in Exhibit 2. As seen there, when our A to Aaa liability return set was regressed on all five A to Aaa corporate bond indices, we found negative weights for the 0- to 1.5-year and 3- to 7-year indices. Dropping the 3- to 7-year index and rerunning left a negative weight for the 0- to
Exhibit 2results for hedging exercises involving corporate Bond indices
Source: Barclays, Western Asset
First RunSecond RunThird RunFourth RunFifth Run
Value-WeightsDuration-WeightsKRD-Match Longest Buckets
First RunSecond RunThird RunFourth RunFifth Run
Value-Weighted AllocationsDuration-Weighted AllocationsKRD-Match of 7–15 & 15–30 Buckets
Results with Hedges Optimized via Regression Analysis
Force Allocations to Shorter-Maturity Indices (shown are avg. coeffs. across sample)
Results for A-Aaa Liabilities, 1989–2012 Sample Period
Portfolio Weights forA-Aaa Corporate Bond Indices
Force Allocations to Shorter-Maturity Indices (shown are avg. coeffs. across sample)
Results for Aa Liabilities, 1989–2012 Sample Period
Portfolio Weights forAa Corporate Bond Indices
Index Maturity (Yrs)
Index Maturity (Yrs)
Summary statistics not applicable due to shorted indices and fewer
degrees of freedom.
Summary Statistics not applicable due to shorted indices and fewer
degrees of freedom.
Results with Hedges Optimized via Regression Analysis
0–1.5 1.5–3 3–7 7–15 15–30
-49.7%-30.2%
12.9%0.6%
-18.8%-31.2%
-7.8%-19.2%
12.6%0.6%
87.1%22.6%
-23.4%
11.7%2.8%
-20.0%58.2%-14.2%
11.6%2.7%
-78.2%
20.4%10.4%
79.2%-62.7%
20.2%10.2%
42.9%6.7%
31.1%-16.3%
28.8%30.1%44.1%
28.7%29.4%42.3%
97.9%100.9%
92.3%116.3%100.0%
26.1%56.2%55.9%
161.8%135.7%122.0%119.2%100.0%
27.0%57.1%57.7%
1.59%
4.95%2.75%2.39%
3.83%
6.89%4.97%4.69%
-0.66%
-2.39%-1.38%-1.23%
-1.03%
-2.76%-1.79%-1.65%
1.43%
4.24%2.34%2.02%
3.67%
6.20%4.58%4.35%
RMSEAvg.Miss
TrackingError
0–1.5 1.5–3 3–7 7–15 15–30 RMSEAvg.Miss
TrackingError
-102.2%

Western asset November 2013
Persistence of Tracking error Part 2: corporate Bonds as ldi hedges
5
1.5-year index. When it was dropped, the weight turned negative for the 1.5- to 3-year index, and when that was dropped, the weight for the 7- to 15-year index went negative. The only run that produced nonnegative weights (no shorting) for all indices was when 100% of assets were allocated to the 15- to 30-year index. Thus, besides the 15- to 30-year index, no other index was found to provide ANY hedging benefit, let alone a statistically significant one.
The same final result occurred when the Aa-only liability returns were regressed on the Aa indices. Here again, only the longest-maturity, the 15- to 30-year index, was found to have any benefit as an LDI hedge. The results very clearly suggest that the best way to KRD-hedge DB liabilities is to not try to do so. Pick the longest maturity bond index that is available, and allocate all assets to that index.
Now, proponents of KRD-hedging will likely resist this conclusion, so we also tested other allocations where investment to all the indices was forced. For one allocation, we chose portfolio weights for the bond indices to match the shares of the corresponding cash flows in total liability valuations. In a second allocation, we chose portfolio weights to match the shares of the corresponding cash flows in total liability durations. In a third allocation, we chose just enough allocation to the longest-maturity index to KRD-hedge the correspond-ing cash flows, then allocated similarly to the next longest maturity range, and so on until all assets were exhausted. For both A to Aaa and Aa liabilities, this resulted in all assets being exhausted once allocations were made to the 7- to 15-year and 15- to 30-year indices.
The results for these “forced” allocations are shown at the bottom of each portion of Exhibit 2. As can be seen there, these allocations uniformly resulted in much higher tracking error and much more negative average misses than was the case when all assets were merely allocated to the 15- to 30-year index.
This should not be surprising. Since the regression analyses identified optimal allocations, any other al-location is sub-optimal, thus resulting in higher tracking error.7 Still, it is instructive to explicitly show how much results worsen when forced allocations are made to address KRDs across the maturity range, rather than merely those of the longest maturity. The 15- to 30-year indices clearly do the best job of hedging the longest-maturity cash flows. They also appear to hedge the shorter-maturity cash flows better than do shorter-maturity bond indices.
The runs described here can be said to provide the most hospitable test possible of the efficacy of KRD-hedging of such liability series. Again, our corporate bond indices were constructed to correspond as closely as possible to the liability valuations process. Furthermore, the regression process utilized exactly mimics the optimization processes underlying efficient frontiers for funded balance optimization.
There are no biases within the sample period that would taint our regression results. The maturity structure of the DB liabilities is constant across our sample. The durations (and KRDs) of liabilities change across the sample only due to changes in the levels of yields. In the same way, the maturity structures of our corporate bond indices are also constant across the sample, and the durations of those indices change only due to changes in the levels of yields.8
Even so, the results clearly indicate that KRD-hedging is of questionable benefit at best. In all cases, a simple strategy of putting all assets in the longest duration corporate bond index available produced lower tracking error—and smaller average misses—than allocations attempting to hedge KRDs.
Finally, while the results for the 15- to 30-year indices look attractive, they should be interpreted with caution. As seen in Exhibit 1, for the A to Aaa liabilities, the 15- to 30-year index contains only 522 bonds, many of

Western asset November 2013
Persistence of Tracking error Part 2: corporate Bonds as ldi hedges
6
them seasoned and closely held. So it is questionable whether this index would provide a viable, investable index for a real-world plan, and it is similarly questionable whether the associated 143 basis points (bps) per year tracking error would be attainable for a real-world plan. As for the Aa 15- to 30-year index, the number of bonds is a scant 51, and the corresponding tracking error of 367 bps per year is barely below the 400 bps tracking error we find for the Long G/C index, with 1800 issues within its count.9 The runs here are intended to provide a fair measure of the benefits of KRD-hedging operations. They may not provide a fair measure of attainable tracking error levels for real-world plans.
V. conclusionsConceptually, KRD-matching seems like a no-brainer. If a duration-matched allocation does not deliver so low a level of tracking error as a plan desires, then more intensive hedging operations should bring tracking error lower. The problem is that sufficiently effective hedges do not appear to be available.
With maturities of cash flows longer than those of available assets and with zero-coupon corporates not available in meaningful quantity or range, a fully funded plan will not have sufficient assets to exactly hedge all KRDs of its liabilities. In addition, there will likely be some basis risk—reflecting curve risk mismatch—between assets and the cash flows within a plan’s liability valuation. Finally, there is the issue of credit risk mismatch (survivorship bias) between DB liabilities and available corporate bonds.10
Our empirical analysis indicates that these shortcomings are significant enough to negate any potential ad-vantages of KRD-hedging. Once again, our analysis found that allocations to a single, long-duration corporate index always outperformed allocations spreading investment across different maturity indices.
We conclude that simple LDI allocations provide results just as favorable as those of more complex alloca-tions. Simple allocations do not eradicate funded balance tracking error. We estimate a floor for tracking error of 300 bps to 500 bps. However, there is no indication that complex hedging operations can reduce tracking error below this threshold.
Finally, the more complex the hedge, the more difficult is active management. We have argued previously that active management is crucial for DB plans in working to make sure that asset returns will indeed keep up with returns on liabilities.11 On this count too, then, a simple allocation could be seen to be preferable to complex allocations that attempt to match KRD or cash flows, even when using corporate bonds.

Western asset November 2013
Persistence of Tracking error Part 2: corporate Bonds as ldi hedges
7
Past results are not indicative of future investment results. Investments are not guaranteed and you may lose money. This publication is for informational purposes only and reflects the current opinions of Western Asset Management. Information contained herein is believed to be accurate, but cannot be guaranteed. Opinions represented are not intended as an offer or solicitation with respect to the purchase or sale of any security and are subject to change without notice. Statements in this material should not be considered investment advice. Employees and/or clients of Western Asset Management may have a position in the securities mentioned. This publication has been prepared without taking into account your objectives, financial situation or needs. Before acting on this information, you should consider its appropriateness having regard to your objectives, financial situation or needs. It is your responsibility to be aware of and observe the applicable laws and regulations of your country of residence. Potential investors in emerging markets should be aware that investment in these markets can involve a higher degree of risk. Any forecast, projection or target is there to provide you with an indication only and is not guaranteed in any way.Western Asset Management Company Distribuidora de Títulos e Valores Limitada is authorised and regulated by Comissão de Valores Mobiliários and Banco Central do Brasil. Western Asset Man-agement Company Pty Ltd ABN 41 117 767 923 is the holder of the Australian Financial Services Licence 303160. Western Asset Management Company Pte. Ltd. Co. Reg. No. 200007692R is a holder of a Capital Markets Services Licence for fund management and regulated by the Monetary Authority of Singapore. Western Asset Management Company Ltd is a registered financial instruments dealer whose business is investment advisory or agency business, investment management, and Type II Financial Instruments Dealing business with the registration number KLFB (FID) No. 427, and members of JIAA (membership number 011-01319) and JITA. Western Asset Management Company Limited (“WAMCL”) is authorised and regulated by the Financial Conduct Authority (“FCA”). In the UK this communication is a financial promotion solely intended for professional clients as defined in the FCA Handbook and has been approved by WAMCL.
endnotes1 This assumes a plan uses a yield curve to discount liabilities rather than a single discount rate. Note that if the plan uses a single discount
rate, then there are no KRDs, since all cash flows depend on the same yield, so that KRD-hedging is pointless. We analyze liability returns generated from curve-based liability valuations in order to provide a framework where KRD-hedging has the best chance of proving effective.
2 See “LDI and the Persistence of Tracking Error,” January 2013, available on our website.
3 Ibid., especially the Appendix accompanying that paper. See also “Keeping Up With Your Liabilities,” August 2013, available on our website.
4 We performed these analyses with respect to two different sets of DB cash flows, both supplied by clients. At present yield levels, one set of cash flows displays a total duration of 11 years, the other 12.2 years. The shorter cash flow set shows peak flows 12 years out, with obligations declining by half from that peak 30 years out and hitting an essentially zero level in 56 years. The longer cash flow set achieves peak levels 15 years out, with obligations declining by 50% from that peak 36 years out and effectively hitting zero 59 years out. Statistics cited in Exhibit 2 are with respect to the longer cash flow set, but again, qualitative results were identical across the sets.
5 The least squares process actually minimizes the sum of (squared) tracking error and the square of average misses. In these regressions, we suppress the constant term, since there is no asset to replicate this feature. With no constant term, there is no presumption that the average residual of the regression will be zero. Therefore, the resulting sum of squared residuals can be decomposed into the square of the average miss between assets and liabilities (average residual) and the square of volatility of misses (residuals) around that average. The latter component is just “tracking error” as commonly defined. The former, the importance of missing liability returns on average, is usually ignored. However, it can be quite important for real-world plans.
For example, if assets constantly underperform liabilities by 1% per year, tracking error per se would be zero, but real-world plan admin-istrators would see the constant underperformance as a problem, and they would likely refer to it as “tracking error” and understandably so. The regression analyses here can be seen to minimize root mean squared error (RMSE) which concept includes not only volatility of asset-liability misses, but also the average magnitude of those misses. RMSE is reported alongside average miss and tracking error in Exhibit 2.
Finally, real-world clients would typically regard constant +1% misses as “good tracking error” and constant -1% misses as “bad tracking error.” It is a deficiency of the RMSE concept that it does not distinguish between such good and bad tracking errors. As a practical mat-ter, though, real-world assets will almost invariably underperform liability returns on average, resulting in “bad” tracking error on average. This point is discussed in detail in the “Keeping Up…” white paper, and Exhibit 2 results are replete with such negative average misses.
6 Stepwise methods have been devised to deal with such constraints, including “forward stepwise regressions” and “least angle regres-sions,” (Lasso solutions: cf. http://www-stat.stanford.edu/~tibs/lasso/simple.html). In the present context, these processes amount to sequentially adding bond indices to the regression analysis. In contrast, the approach chosen in this paper can be termed “backward stepwise regressions,” as we start with all five indices and sequentially remove those with negative portfolio weights. Both the forward stepwise and Lasso solutions were attempted here, in addition to the method described in the text, all of these processes yielding the same results as are reported in the text.
7 Then again, for the regression analyses, portfolio weights are constant across the sample period, whereas for the value- and duration-weighted allocations, weights are calculated for each year to match the relative valuations in place at the start of that year. That the tracking errors for these yearly-weighted allocations are so much higher than for the regressions indicates that there is no obvious benefit to rebalancing portfolio allocations year-to-year merely to match changes in valuation or duration due to interest rate variation.
8 In contrast, in the papers cited earlier, there were possible sample biases in those previous exercises. In the “Persistence…” white paper, when we used regressed liability returns on a suite of STRIPS, the durations of the STRIPS were constant across the sample, but the duration of the liabilities rose as yield levels declined, thus possibly biasing regressions that held portfolio weights constant. Similarly, in the “Keeping Up…” white paper, when liability returns were regressed on combinations of Treasury/high-yield and on long credit, there was possible bias because the maturity structures of Treasuries, long credit and high yield changed across the sample, while that of the liabilities didn’t. Again, such possible bias is essentially absent in the present analysis thanks to the constant maturity structure of both liabilities and assets.
9 Cf. “Keeping Up…” white paper.
10 Ibid.
11 Notice the negative average misses on all allocations listed in Exhibit 2. None of these allocations keep up with liabilities on average.