Embed Size (px)
Citation preview
PVTsim Nova 4.0RELEASE HIGHLIGHTS
HOUSTON | COPENHAGEN | DUBAI | KUALA LUMPUR
INTRODUCING NOVA APPS
HOUSTON | COPENHAGEN | DUBAI | KUALA LUMPUR
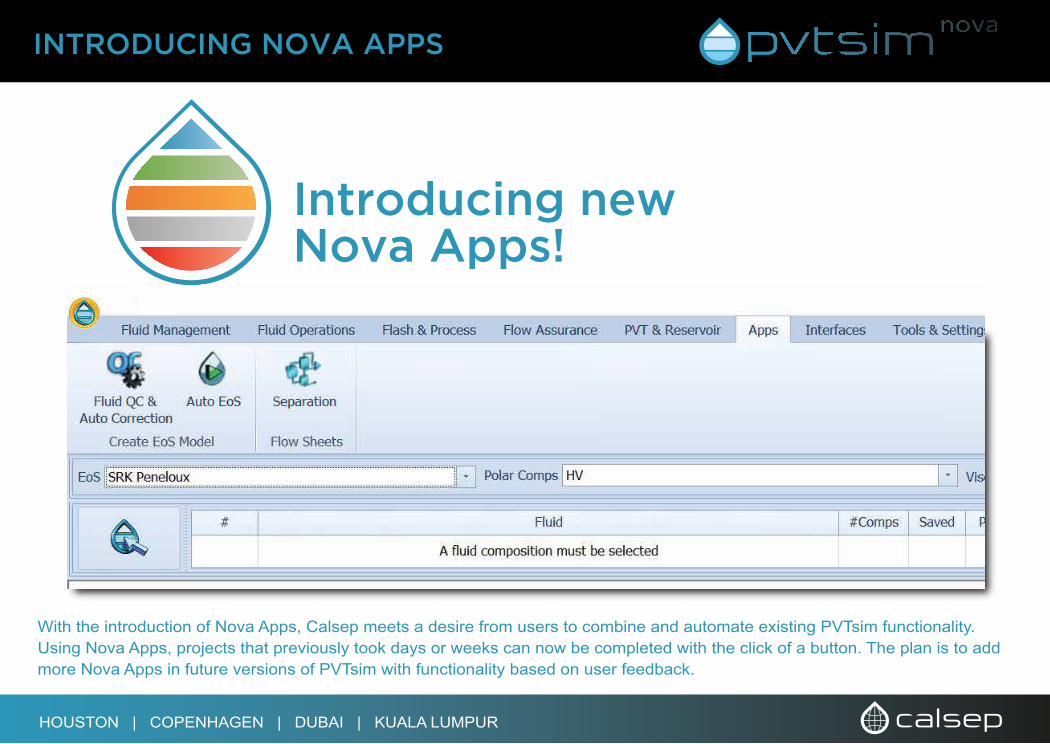
With the introduction of Nova Apps, Calsep meets a desire from users to combine and automate existing PVTsim functionality. Using Nova Apps, projects that previously took days or weeks can now be completed with the click of a button. The plan is to add more Nova Apps in future versions of PVTsim with functionality based on user feedback.
Introducing new Nova Apps!
HOUSTON | COPENHAGEN | DUBAI | KUALA LUMPUR
FLUID QC & AUTO CORRECTION
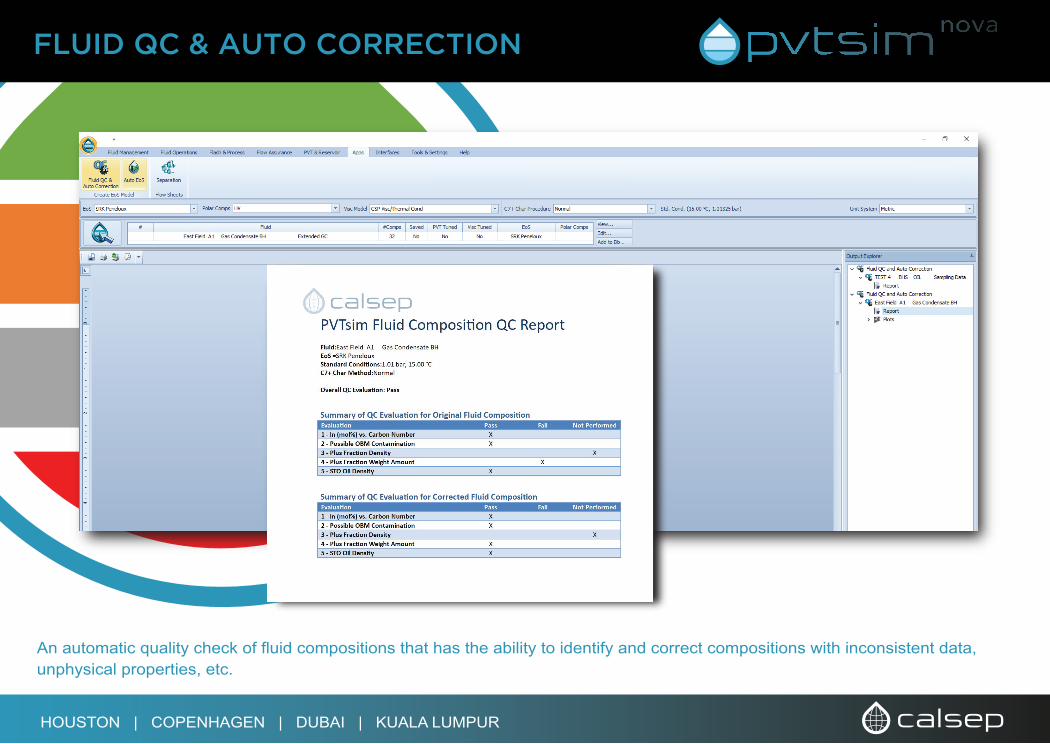
An automatic quality check of fluid compositions that has the ability to identify and correct compositions with inconsistent data, unphysical properties, etc.
HOUSTON | COPENHAGEN | DUBAI | KUALA LUMPUR
AUTO EOS IN NOVA APPS
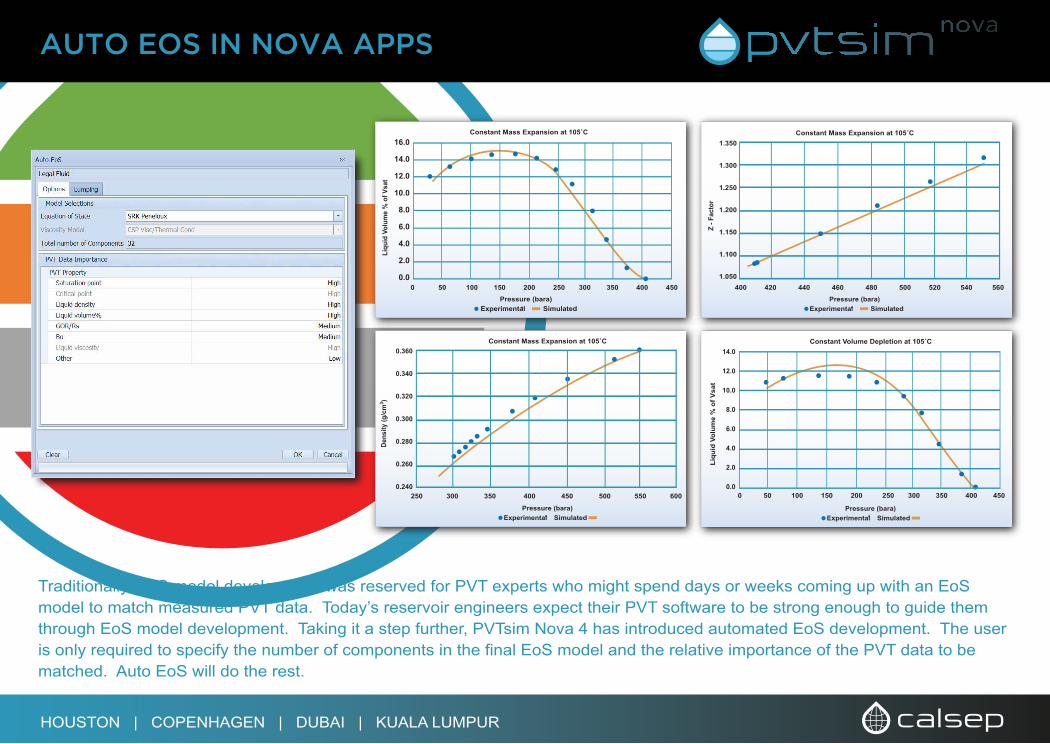
Traditionally, EoS model development was reserved for PVT experts who might spend days or weeks coming up with an EoS model to match measured PVT data. Today’s reservoir engineers expect their PVT software to be strong enough to guide them through EoS model development. Taking it a step further, PVTsim Nova 4 has introduced automated EoS development. The user is only required to specify the number of components in the final EoS model and the relative importance of the PVT data to be matched. Auto EoS will do the rest.
0 50 100 150 200 250 300 350 400 450
Liqu
id V
olum
e %
of V
sat
Constant Mass Expansion at 105˚C
Pressure (bara)SimulatedExperimental
16.0
14.0
12.0
10.0
8.0
6.0
4.0
2.0
0.0400 420 440 460 480 500 520 540 560
Pressure (bara)
Constant Mass Expansion at 105˚C
SimulatedExperimental
Z -
Fact
or
1.350
1.300
1.250
1.200
1.150
1.100
1.050
Dens
ity (g
/cm
3 )
Pressure (bara)
Constant Mass Expansion at 105˚C
SimulatedExperimental
250 300 350 400 450 500 550 600
0.360
0.340
0.320
0.300
0.280
0.260
0.2400 50 100 150 200 250 300 350 400 450
Pressure (bara)
Constant Volume Depletion at 105˚C
SimulatedExperimental
Liqu
id V
olum
e %
of V
sat
14.0
12.0
10.0
8.0
6.0
4.0
2.0
0.0
HOUSTON | COPENHAGEN | DUBAI | KUALA LUMPUR
SEPARATION IN NOVA APPS
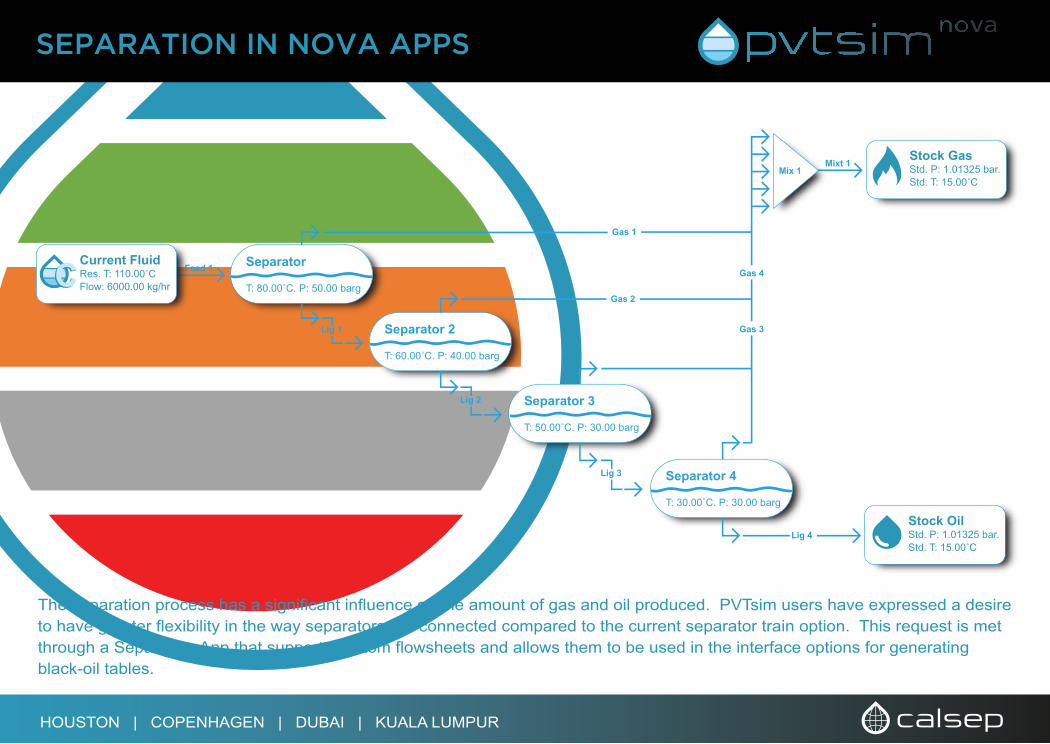
The separation process has a significant influence on the amount of gas and oil produced. PVTsim users have expressed a desire to have greater flexibility in the way separators are connected compared to the current separator train option. This request is met through a Separation App that supports custom flowsheets and allows them to be used in the interface options for generating black-oil tables.
Separator
T: 80.00˚C. P: 50.00 barg
Feed 1
Gas 1
Separator 2
T: 60.00˚C. P: 40.00 barg
Separator 3
T: 50.00˚C. P: 30.00 barg
Separator 4
T: 30.00˚C. P: 30.00 barg
Current FluidRes. T: 110.00˚CFlow: 6000.00 kg/hr
Lig 1
Lig 2
Lig 3
Lig 4
Gas 2
Gas 3
Gas 4
Stock OilStd. P: 1.01325 bar.Std. T: 15.00˚C
Stock GasStd. P: 1.01325 bar.Std. T: 15.00˚C
Mix 1Mixt 1
HOUSTON | COPENHAGEN | DUBAI | KUALA LUMPUR
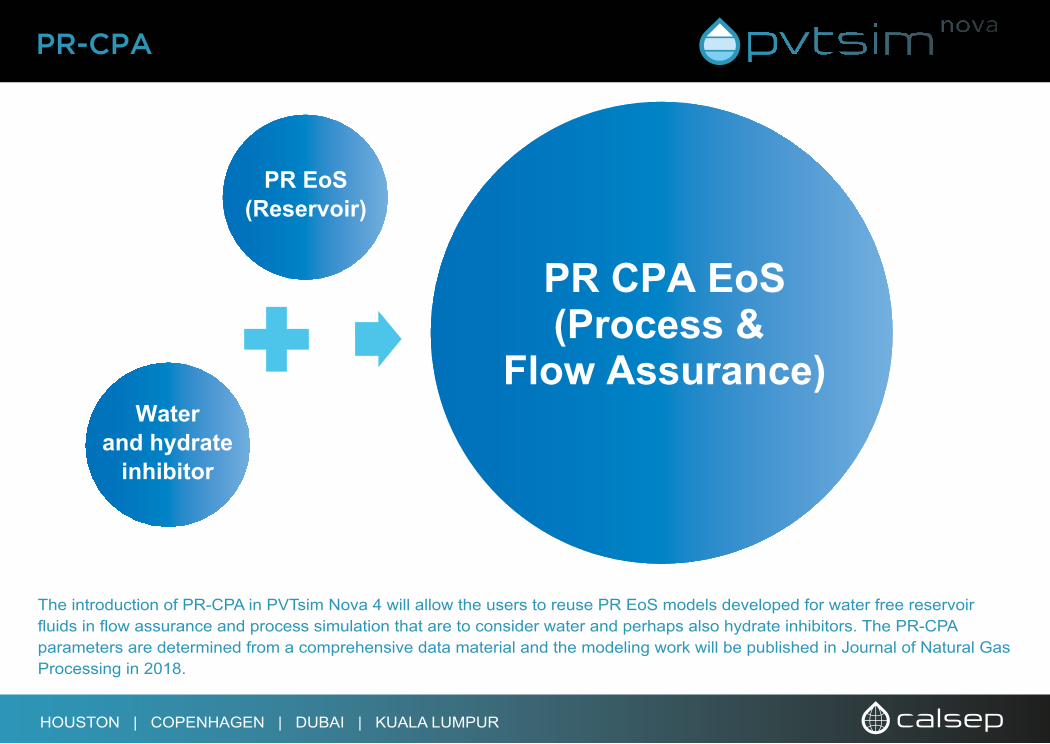
PR-CPA
The introduction of PR-CPA in PVTsim Nova 4 will allow the users to reuse PR EoS models developed for water free reservoir fluids in flow assurance and process simulation that are to consider water and perhaps also hydrate inhibitors. The PR-CPA parameters are determined from a comprehensive data material and the modeling work will be published in Journal of Natural Gas Processing in 2018.
PR EoS(Reservoir)
Waterand hydrate
inhibitor
PR CPA EoS(Process &
Flow Assurance)
HOUSTON | COPENHAGEN | DUBAI | KUALA LUMPUR
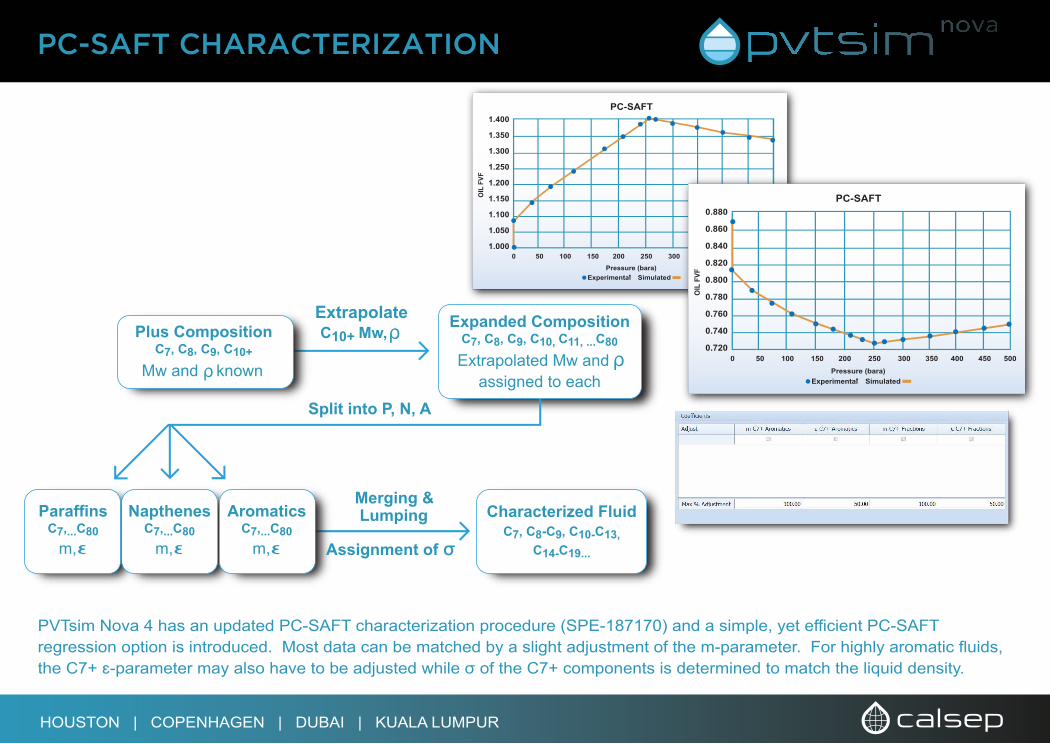
PC-SAFT CHARACTERIZATION
PVTsim Nova 4 has an updated PC-SAFT characterization procedure (SPE-187170) and a simple, yet efficient PC-SAFT regression option is introduced. Most data can be matched by a slight adjustment of the m-parameter. For highly aromatic fluids, the C7+ ԑ-parameter may also have to be adjusted while σ of the C7+ components is determined to match the liquid density.
0 50 100 150 200 250 300 350 400 450 500
1.400
1.350
1.300
1.250
1.200
1.150
1.100
1.050
1.000
OIL
FVF
Pressure (bara)
PC-SAFT
SimulatedExperimental
0 50 100 150 200 250 300 350 400 450 500
0.880
0.860
0.840
0.820
0.800
0.780
0.760
0.740
0.720
OIL
FVF
Pressure (bara)
PC-SAFT
SimulatedExperimental
-100 0 100 200 300 400 500 600 700 800 900
350
300
250
200
150
100
50
0
Pre
ssur
e (B
ara)
Temperature (˚C)
Heavy Oil
HOUSTON | COPENHAGEN | DUBAI | KUALA LUMPUR
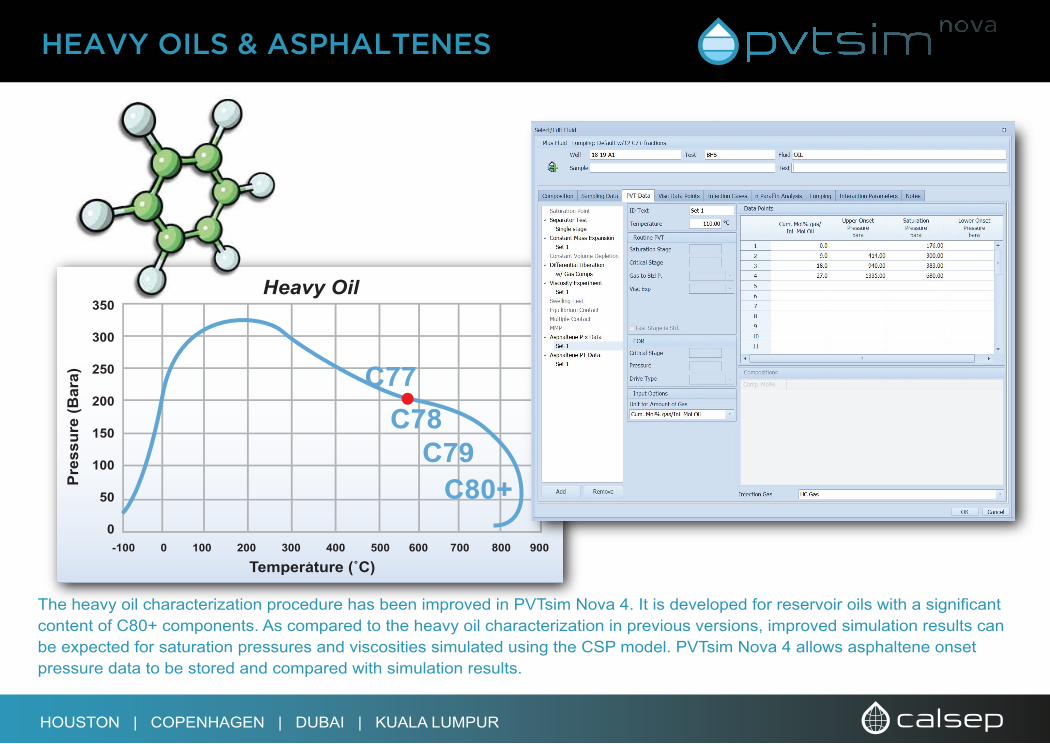
HEAVY OILS & ASPHALTENES
The heavy oil characterization procedure has been improved in PVTsim Nova 4. It is developed for reservoir oils with a significant content of C80+ components. As compared to the heavy oil characterization in previous versions, improved simulation results can be expected for saturation pressures and viscosities simulated using the CSP model. PVTsim Nova 4 allows asphaltene onset pressure data to be stored and compared with simulation results.
HOUSTON | COPENHAGEN | DUBAI | KUALA LUMPUR
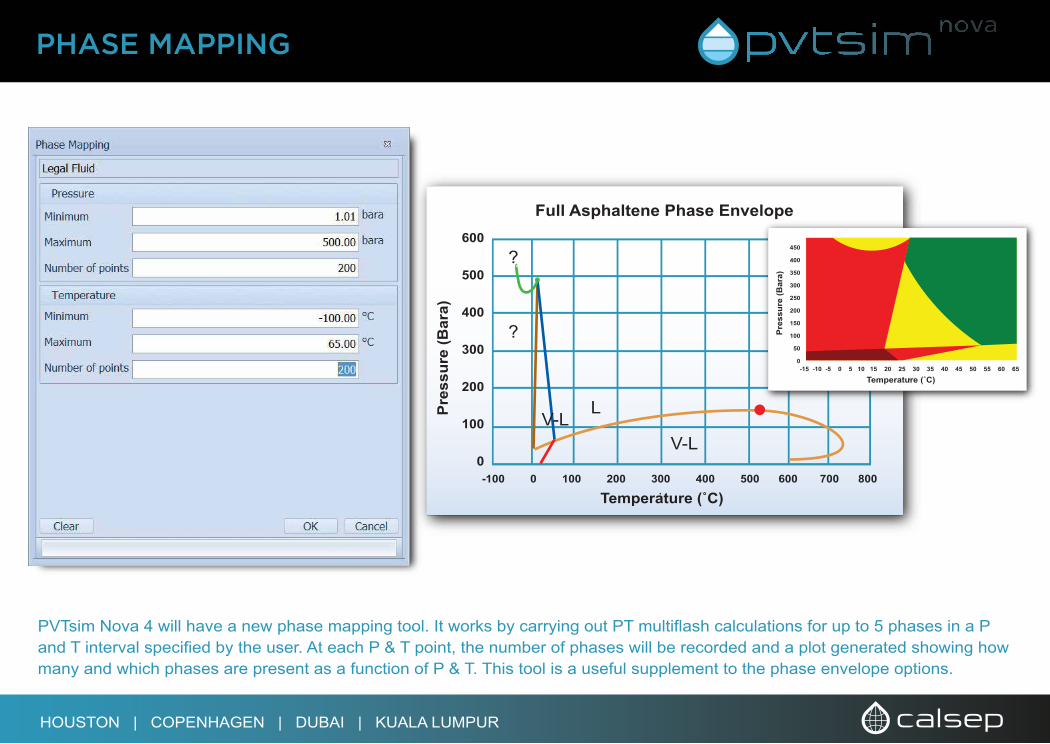
PHASE MAPPING
PVTsim Nova 4 will have a new phase mapping tool. It works by carrying out PT multiflash calculations for up to 5 phases in a P and T interval specified by the user. At each P & T point, the number of phases will be recorded and a plot generated showing how many and which phases are present as a function of P & T. This tool is a useful supplement to the phase envelope options.
HOUSTON | COPENHAGEN | DUBAI | KUALA LUMPUR
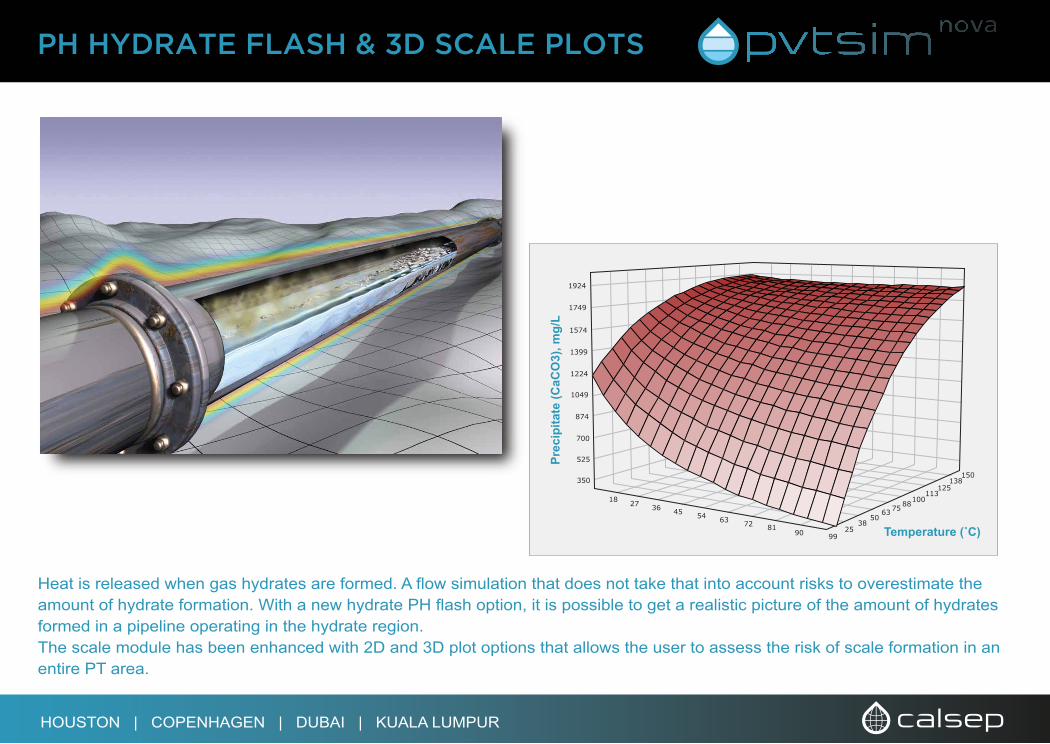
PH HYDRATE FLASH & 3D SCALE PLOTS
Heat is released when gas hydrates are formed. A flow simulation that does not take that into account risks to overestimate the amount of hydrate formation. With a new hydrate PH flash option, it is possible to get a realistic picture of the amount of hydrates formed in a pipeline operating in the hydrate region. The scale module has been enhanced with 2D and 3D plot options that allows the user to assess the risk of scale formation in an entire PT area.
1924
1749
1574
1399
1224
1049
874
700
525
350
908172635445362718
138150
125113
10088756350
3825
99
Prec
ipita
te (C
aCO
3), m
g/L
Temperature (˚C)
HOUSTON | COPENHAGEN | DUBAI | KUALA LUMPUR
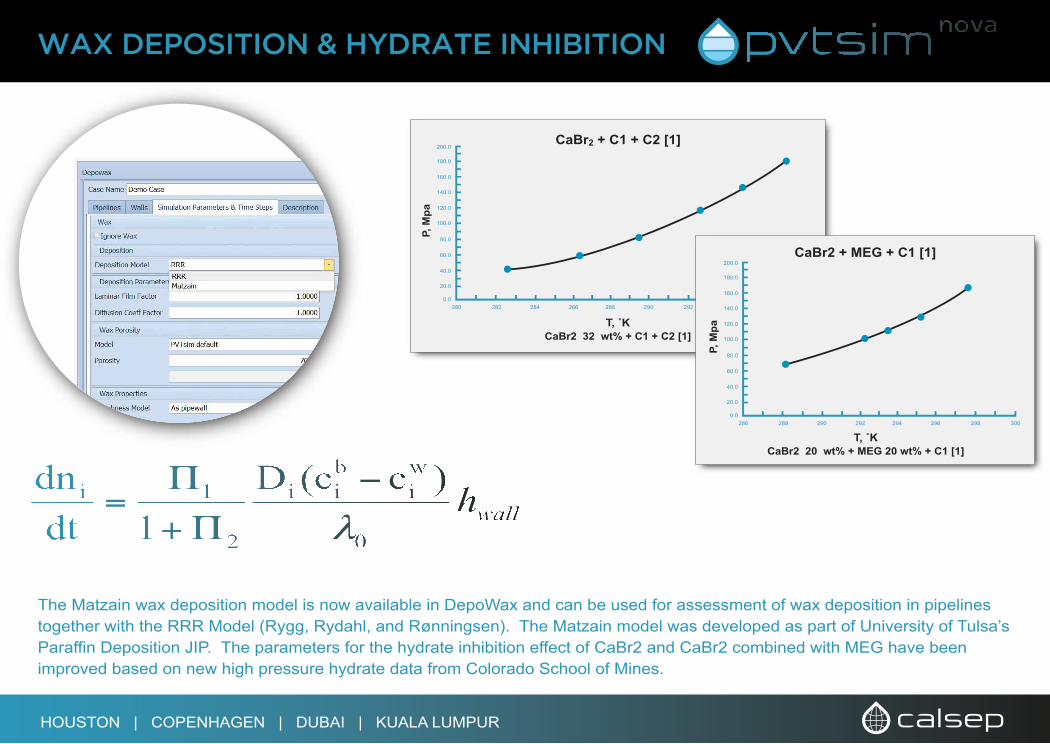
WAX DEPOSITION & HYDRATE INHIBITION
The Matzain wax deposition model is now available in DepoWax and can be used for assessment of wax deposition in pipelines together with the RRR Model (Rygg, Rydahl, and Rønningsen). The Matzain model was developed as part of University of Tulsa’s Paraffin Deposition JIP. The parameters for the hydrate inhibition effect of CaBr2 and CaBr2 combined with MEG have been improved based on new high pressure hydrate data from Colorado School of Mines.
T, ˚KCaBr2 32 wt% + C1 + C2 [1]
CaBr2 + C1 + C2 [1]
P, M
pa
CaBr2 + MEG + C1 [1]
T, ˚KCaBr2 20 wt% + MEG 20 wt% + C1 [1]
P, M
pa
HOUSTON | COPENHAGEN | DUBAI | KUALA LUMPUR
Copenhagen · DenmarkCalsep A/SParallelvej 12DK-2800 Kgs. Lyngby, DenmarkPhone: +45 45 87 66 46Fax: +45 45 87 62 72Email: [email protected]
Houston · USACalsep Inc.10370 Richmond Avenue, Suite 1375Houston, Tx 77042, USAPhone: +1 281 759 0844Fax: +1 281 759 0845E-mail: [email protected]
Dubai · UAECalsep FZ-LLCP.O. Box 500 534, Dubai Internet CityDubai, United Arab EmiratesPhone: +971 4 391 3667Fax: +971 4 390 8208E-mail: [email protected]
Kuala Lumpur · MalaysiaCalsep Asia Pacific Sdn BhdSuite 19-05, G-Tower, 199 Jalan Tun Razak50400 Kuala Lumpur, MalaysiaPhone: +6(03) 2168 4252Fax: +6(03) 2168 4618E-mail: [email protected]