Embed Size (px)
Citation preview
Punching Shear Retrofit Method Using
Shear Bolts for Reinforced Concrete Slabs
under Seismic Loading
by
Wensheng Bu
A thesis
presented to the University of Waterloo
in fulfillment of the
thesis requirement for the degree of
Doctor of Philosophy
in
Civil Engineering
Waterloo, Ontario, Canada, 2008
©Wensheng Bu 2008

ii
AUTHOR'S DECLARATION
I hereby declare that I am the sole author of this thesis. This is a true copy of the thesis, including any
required final revisions, as accepted by my examiners.
I understand that my thesis may be made electronically available to the public.
iii
Abstract
Reinforced concrete slab-column structures are widely used because of their practicality. However,
this type of structures can be subject to punching-shear failure in the slab-column connections.
Without shear reinforcement, the slab-column connection can undergo brittle punching failure,
especially when the structure is subject to lateral loading in seismic zones.
The shear bolts are a new type of transverse reinforcement developed for retrofit of existing structures
against punching. This research focuses on how the shear bolts can improve the punching-shear
capacity and ductility of the existing slab-column connections under vertical service and lateral
seismic loads.
A set of nine full-scale reinforced concrete slab-column connection specimens were tested under
vertical service and cyclic loads. The vertical (gravity) load for each specimen was kept at a constant
value throughout the testing. The cyclic lateral drift with increasing intensity was applied to the
columns. The specimens were different in number of bolts, concrete strength, number of openings,
and level of gravity punching load. Strains in flexural rebars in the slabs, crack widths, lateral loads,
and displacements were obtained.
The peak lateral load (moment) and its corresponding drift ratio, connection stiffness, crack width,
and ductility were compared among different specimens. The testing results show that shear bolts can
increase lateral peak load resisting capacity, lateral drift capacity at peak load, and ductility of the
slab-column connections. Shear bolts also change the failure mode of the slab-column connections
and increase the energy dissipation capacity.
The thesis includes also research on the development of guidelines for shear bolt design for concrete
slab retrofitting, including the punching shear design method of concrete slab (with shear bolts),
dimensions of bolts, spacing, and influence of bolt layout patterns. Suggestions are given for
construction of retrofitting method using shear bolts. Recommendations are also presented for future
research.

iv
Acknowledgements
This research was undertaken under the supervision of Professor Maria Anna Polak. Without
Professor Polak’s direction, help, and encouragement, this thesis could hardly be accomplished so
well as presented. Thus, I would like to express my greatest gratitude to her.
The presented research was funded by a grant from the Natural Sciences and Engineering Council
(NSERC) of Canada. The shear bolts were manufactured and donated by Decon Inc. The ready mixed
concrete was donated by Hogg Fuel and Supply Ltd. in Kitchener, Ontario. Ric Sherping and Sika
Canada graciously donated Sikadur 30 for repairing drilling holes on concrete slabs.
This research involved experimental work in the Structural Laboratory of Civil and Environmental
Engineering, University of Waterloo. I would like to thank Professor Timothy H. Topper for his help
and instructions. I also appreciate the great help from Richard Morrison, Doug Hirst, Ken Bowman,
Dick Powers, Terry Ridgway, Mark Sobon, Bruce Stickney, and the staff in the Machine Shop;
without their help, my experiments could not be done.
For helping me in the laboratory, I need to thank Nick Lawler, José Andrés Alvarado, Mike Kuebler ,
Jeff West, Hongtao Liu, Yanjun Yang, Xianxun Yuan, Qinghua Huang, Jinyu Zhu, Hongli Huang,
Xiaohong Huang, Xiaoguang Chen, Yuxin Liu, Ying An, Dan Mao and Tianjin Chen.
Professor Mahesh Pandey and Professor Wei-Chau Xie offered me help during my research and study;
I also benefited from the discussion and teaching of Professor Donald E. Grierson and Gregory
Glinka.
Finally, I would like to express special thanks to my wife and daughter. I appreciate their
understanding, support and patience.

v
To My Parents
vi
Table of Contents
Author’s Declaration ........................................................................................................................ ii
Abstract........................................................................................................................................... iii
Acknowledgements ..........................................................................................................................iv
Dedication.........................................................................................................................................v
Table of Contents .............................................................................................................................vi
List of Figures..................................................................................................................................ix
List of Tables ..................................................................................................................................xv
Chapter 1 Introduction.......................................................................................................................1
1.1 Reinforced Concrete Flat Slab Column Structures and Punching Shear Failure.........................1
1.2 Reinforced Concrete Flat Slab Column Structures under Earthquakes ......................................4
1.3 Objective of This Research ......................................................................................................5
1.4 Contribution of This Research..................................................................................................8
1.5 Organization of the Thesis .......................................................................................................9
Chapter 2 Literature Review............................................................................................................10
2.1 Introduction ...........................................................................................................................10
2.2 Punching Shear Behaviour in Reinforced Concrete Slabs under Vertical Load or Vertical Load
Combined with Static Moments ...................................................................................................10
2.2.1 Parameters Influencing Punching Shear Strength of Slab-Column Connections ...............11
2.3 Previous Research on Seismic Behaviour of Reinforced Concrete Slabs.................................17
2.3.1 Flat Slab Column Structures in Seismic Zones.................................................................17
2.3.2 Behaviour of Slab-Column Connections under Cyclic Loading........................................18
2.4 Analytical Models for Punching Shear ...................................................................................24
2.5 Punching Shear Design ..........................................................................................................39
2.5.1 Punching Shear Design Requirements in CSA A23.3-04 .................................................39
2.5.2 Punching Shear Design Requirements in ACI 318-05 (in SI units)...................................41
2.5.3 Eurocode 2 (2004)...........................................................................................................43
2.6 Seismic Requirements for Design of Flat Slab-Column Structures..........................................46
2.6.1 National Building Code of Canada (NBCC 2005)............................................................46
2.6.2 Seismic Requirements of CSA 23.3-04............................................................................46
2.6.3 ACI 318-05 Seismic Requirements for Slab-column Structures .......................................47
2.6.4 FEMA 356 Requirements................................................................................................47
vii
2.7 Previous Research Work on Punching Shear at Waterloo....................................................... 48
Chapter 3 Experiment Program ....................................................................................................... 53
3.1 Specimens Design ................................................................................................................. 53
3.1.1 Flexural Reinforcement................................................................................................... 56
3.1.2 Estimation of the Capacities of the Specimens before Testing.......................................... 58
3.2 Properties of Materials used for Specimens............................................................................ 61
3.2.1 Concrete Compression and Tension Strength................................................................... 63
3.2.2 Properties of Steel Reinforcing Bars................................................................................ 69
3.2.3 Properties of Steel Shear Bolts ........................................................................................ 74
3.2.4 Fabrication of the Reinforced Concrete Specimens.......................................................... 78
3.2.5 Shear Reinforcement....................................................................................................... 80
3.2.6 Installation of Shear Bolts ............................................................................................... 82
3.3 Experimental Setup ............................................................................................................... 83
3.3.1 Components of the Experiment Setup.............................................................................. 83
3.3.2 Steel Lifting Frame for Installation of Concrete Slab-Column Specimens........................ 92
3.3.3 Member Strength and Stiffness of the Steel Experimental Setup...................................... 94
3.4 Instrumentation...................................................................................................................... 96
3.4.1 Displacements................................................................................................................. 96
3.4.2 Crack width .................................................................................................................... 96
3.4.3 Strains ............................................................................................................................ 96
3.4.4 Load control ................................................................................................................... 97
3.5 Testing Procedure.................................................................................................................. 99
Chapter 4 Experimental Results and Discussion ............................................................................ 101
4.1 Introduction......................................................................................................................... 101
4.2 Results of Series I................................................................................................................ 101
4.2.1 Lateral Load versus Drift Ratio ..................................................................................... 101
4.2.2 Moment versus Lateral Drift Ratio ................................................................................ 106
4.2.3 Connection Stiffness ..................................................................................................... 109
4.2.4 Drift Ductility ............................................................................................................... 111
4.2.5 Strains in Shear Bolts.................................................................................................... 113
4.2.6 Flexural Reinforcement Strains ..................................................................................... 115
4.2.7 Vertical Crack Width .................................................................................................... 122
viii
4.2.8 Cracking and Failure Modes of the Specimens ..............................................................126
4.3 Results of Series II...............................................................................................................128
4.3.1 Connection Moment versus Lateral Drift Ratio..............................................................129
4.3.2 Drift Ductility ...............................................................................................................133
4.3.3 Effect of Openings on Connection Moment Capacity and Ductility ...............................134
4.3.4 Effect of Shear Bolt layout Pattern on Connection Moment Capacity and Ductility........140
4.3.5 Connection Stiffness .....................................................................................................140
4.3.6 Strains in Shear Bolts ....................................................................................................143
4.3.7 Strains in Flexural Reinforcements................................................................................146
4.3.8 Estimation of Vertical Crack Width...............................................................................151
4.3.9 Cracking and Failure Mode of the Specimens................................................................154
4.4 Comparison of Testing Results with the Building Codes of ACI318-05, CSA A23.3-04 and
Eurocode 2 (2004) .....................................................................................................................156
Chapter 5 Design of Steel Shear Bolts and Concrete Slab with Shear Bolts ....................................163
5.1 Design of Steel Shear Bolts..................................................................................................163
5.1.1 Thickness of the Bolt Head............................................................................................163
5.1.1.1 Determination of Bolt Head Thickness using Elastic Thin Plate Theory......................163
5.1.1.2 Determination of Bolt Head Thickness using Finite Element Method..........................170
5.1.2 Determination of Bolt Head Area ..................................................................................174
5.1.3 Stresses in a Concrete Slab Caused by a Shear Bolt .......................................................177
5.2 Design of Steel Shear Bolts for Concrete Flat Slab Strengthening.........................................183
5.2.1 Strength of the Retrofitted Slab .....................................................................................183
5.2.2 Shear Bolt Layout in the Flat Concrete Slab ..................................................................184
5.3 Construction Requirements ..................................................................................................199
Chapter 6 Conclusions and Recommendations...............................................................................201
6.1 Experimental Series I...........................................................................................................201
6.2 Experimental Series II..........................................................................................................202
6.3 Shear Bolt Design and Analysis ...........................................................................................204
6.4 Recommendations for Future Research ................................................................................205
Appendix A Abbreviations and Notations………………………………………...…………….. 206
References ………………………………………………………………………………………..211
ix
List of Figures
Figure 1.1 Flat slab (plate) floor and beam-slab floor (adapted from MacGregor and Bartlett,
2000) .................................................................................................................................1
Figure 1.2 Reinforced concrete flat slab building (Cope and Clark, 1984, courtesy of British Lift
Slab Ltd.)...........................................................................................................................2
Figure 1.3 Failure surface of punching shear (adapted from MacGregor, 2000) .........................2
Figure 1.4 Collapse of Skyline Plaza (adapted from Building Science Series 179, 2003, by
Building and Fire Research Laboratory of the National Institute of Standards and
Technology, USA).............................................................................................................3
Figure 1.5 Damage of the slab due to punching shear (Sabol, 1994) ...........................................4
Figure 1.6 Picture of shear bolt ..................................................................................................5
Figure 1.7 Dimensions of boll, washer and nut..........................................................................6
Figure 1.8 Shear bolts installation in the concrete flat slab .........................................................6
Figure 1.9 Layout pattern of shear bolts in the concrete slab ......................................................6
Figure 1.10 Top view of the slab with steel shear bolts...............................................................7
Figure 1.11 bottom view of the slab with shear bolts..................................................................7
Figure 2.1 Interaction between Shearing and Flexural Strength (Moe, 1961) ............................ 13
Figure 2.2 I-shape shear reinforcement (Hawkins and Coley, 1974) ......................................... 15
Figure 2.3 Headed shear studs welded to a bottom steel plate................................................... 15
Figure 2.4 Load-deflection curves of slabs with different punching strengthening methods
(adapted from Magally and Ghali, 2000) .......................................................................... 16
Figure 2.5 Prestressed shear bolts for slab under vertical load (Ghali et al. 1974) .................... 17
Figure 2.6 Specimens including exterior and interior slab –column connection ........................ 19
Figure 2.7 Test set up of biaxial loading................................................................................... 20
Figure 2.8 Experimental envelopes .......................................................................................... 20
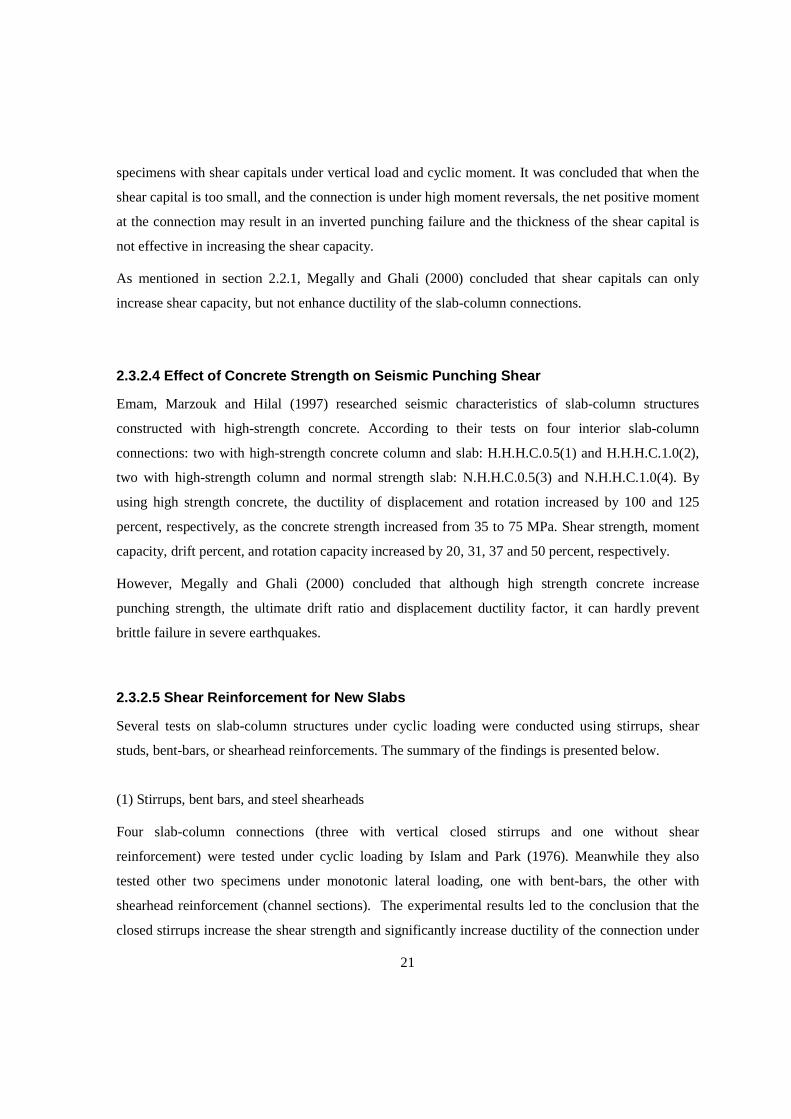
Figure 2.9 Slab strengthened by steel bolts and plates (Ebead and Marzouk, 2002) .................. 23
Figure 2.10 Slab strengthened by CFRP stirrups (Stark et al., 2005)......................................... 23
Figure 2.11 Assumption of conical shell and rigid sectors by Kinnunen and Nylander model .. 24
Figure 2.12 Punching shear model of Kinnunen, 1963 ............................................................. 25
Figure 2.13 Truss model of slab punching shear (Alexander and Simmonds, 1987) ................. 27
Figure 2.14 Curved compression strut (adapted from Alexander et al., 1992) ........................... 28
Figure 2.15 Layout of radial strip (adapted from Alexander et al., 1992) .................................. 29
x
Figure 2.16 Equilibrium of Radial Strip (adapted from Alexander et al., 1992).........................29
Figure 2.17 Axisymmetric punching (Braestrup et al., 1976) ....................................................31
Figure 2.18 Predicted failure surface (Braestrup et al., 1976)....................................................32
Figure 2.19 Free body diagram of slab-column connection for shear friction model (Dilger, 2000,
and Dechka, 2001) ...........................................................................................................35
Figure 2.20 Yield line pattern in the slab (Rankin and Long, 1987) ..........................................36
Figure 2.21 Yield line pattern of interior slab-column connection subjected to shear and
unbalanced moment (Cao, 1993) ......................................................................................37
Figure 2.22 Critical sections defined in Canadian code CSA A23.3-04 (Cement Association of
Canada, 2006)..................................................................................................................41
Figure 2.23 Basic control sections defined in Eurocode 2 (2004)..............................................44
Figure 2.24 Load versus center deflection measured by internal LVDT of the testing frame.
(Adetifa and Polak, 2005).................................................................................................49
Figure 3.1 Plan view of the prototype structure ........................................................................53
Figure 3.2 Elevation view of the prototype structure.................................................................54
Figure 3.3 The five specimens (SW1~SW5) of Series I and shear bolt layout ...........................55
Figure 3.4 The four specimens (SW6~SW9) of Series II and shear bolt layout. ........................55
Figure 3.5 Dimensions of the specimens SW1~SW9 (all dimensions in ‘mm’) .........................56
Figure 3.6 Reinforcement detail and strain gauges in specimen SW1~SW5 and SW9...............57
Figure 3.7 Reinforcement detail and strain gages in Specimen SW6, SW7 and SW8 ................58
Figure 3.8 Reinforcement detail of column and lateral load directions ......................................58
Figure 3.9 Compression test of the concrete cylinder (4”x8”) ...................................................64
Figure 3.10 Concrete cylinder tension test................................................................................65
Figure 3.11 Concrete cylinder (6”x12”) compression test .........................................................66
Figure 3.12 Crushing of the concrete cylinder #6 (6”x12”) of the first batch concrete...............67
Figure 3.13 Compression strength versus strain of cylinders of the concrete .............................68
Figure 3.14 Standard coupon machined from M #10 rebar (a) Dimensions, (b) Picture ............70
Figure 3.15 Testing of rebar coupon.........................................................................................71
Figure 3.16 Testing of original rebar ........................................................................................71
Figure 3.17 Tension stress versus strain in Rebar-2 (first batch rebar).......................................73
Figure 3.18 Tension stress versus strain in Coupon-1 (first batch rebar)....................................74
Figure 3.19 Standard coupon machined from 3/8” steel shear bolt (a) Dimensions, (b) Picture .74
xi
Figure 3.20 Testing of the original bolt .................................................................................... 75
Figure 3.21 Tension stress versus strain of original shear bolts (bolt-org-2).............................. 77
Figure 3.22 Tension stress versus strain of coupon (coupon-bolt-1) shear bolts ........................77
Figure 3.23 Rebar cages........................................................................................................... 78
Figure 3.24 Strain gauges attached on rebars............................................................................ 78
Figure 3.25 Rebar cages and formworks before casting of the specimens .................................79
Figure 3.26 Specimens just after casting .................................................................................. 79
Figure 3.27 Specimens stored in the laboratory ........................................................................ 80
Figure 3.28 Shear bolt spacing in specimen SW2, SW3, SW4 and numbering of strain gauges on
bolts................................................................................................................................. 81
Figure 3.29 Shear bolt spacing in specimen SW7, SW8, SW9 and numbering of strain gauges on
bolts................................................................................................................................. 81
Figure 3.30 Shear bolts with strain gauges ............................................................................... 82
Figure 3.31 Drilling holes in the slab ....................................................................................... 83
Figure 3.32 Picture of experimental setup ................................................................................ 85
Figure 3.33 Elevation A of the testing setup............................................................................. 86
Figure 3.34 Elevation B of the testing setup............................................................................. 87
Figure 3.35 Plan view of the main frame near ground level, ground anchor bolts, base panel, and
the base reaction beams.................................................................................................... 88
Figure 3.36 Plan view of the main frame at the crosshead level ................................................ 88
Figure 3.37 Plan view of the square ring beam, bracing beams, and adjustable stoppers ........... 89
Figure 3.38 Neoprene pads between the concrete slab and the square ring beam or the top
reaction beam (L is the support length: L=1550 mm on each side).................................... 89
Figure 3.39 Adjustable stopper ............................................................................................... 91
Figure 3.40 Roller on top of the upper concrete column ........................................................... 92
Figure 3.41 Steel collar system connected to horizontal hydraulic actuators ............................. 92
Figure 3.42 Steel frame for specimens lifting and installation................................................... 93
Figure 3.43 Lifting of the concrete specimen ........................................................................... 94
Figure 3.44 Estimated maximum load on the specimen in testing............................................. 95
Figure 3.45 Displacement transducers on slab and string pots connected to the specimen ......... 97
Figure 3.46 Plan view of the independent rack for transducers ................................................. 98
Figure 3.47 Displacement transducers layout on slab............................................................... 98
xii
Figure 3.48 Loading path .......................................................................................................100
Figure 4.1 Horizontal load versus horizontal drift ratio at top column end ..............................104
Figure 4.2 Horizontal load versus horizontal drift ratio at top column end ..............................105
Figure 4.3 Backbone curves of horizontal load versus horizontal drift ratio at top column end.
......................................................................................................................................106
Figure 4.4 Moment versus lateral drift ratio at top column end ...............................................107
Figure 4.5 Moment versus horizontal drift ratio at top column end .........................................108
Figure 4.6 Backbone curves of moment versus lateral drift ratio at top column end ................108
Figure 4.7 Peak-to-peak moment stiffness vs. drift ratio of SW1, SW2 and SW3 (Group I) ....109
Figure 4.8 Peak-to-peak moment stiffness vs. drift ratio of SW4 and SW5 (Group II).............110
Figure 4.9 Stiffness degradation at small cycles of the five specimens SW1~SW5..................110
Figure 4.10 Definition of ductility.........................................................................................112
Figure 4.11 Lateral drift ratio versus strain in bolt #1 for specimen SW2................................113
Figure 4.12 Lateral drift ratio versus strain in each bolt of the three specimens SW2, SW3, and
SW4...............................................................................................................................114
Figure 4.13 Stain gauge positions on the reinforcement of specimens SW1 ~ SW5 and SW9..116
Figure 4.14 Lateral drift ratio versus strain at location “d” of Rebar #1 in specimen SW1.......116
Figure 4.15 Lateral drift ratio versus strain at location “d” of Rebar #1 in specimen SW2.......117
Figure 4.16 Lateral drift ratio versus strain at location “d” of Rebar #1 in specimen SW3.......117
Figure 4.17 Lateral drift ratio versus strain at location “d” of Rebar #1 in specimen SW4.......118
Figure 4.18 Lateral drift ratio versus steel strain at location “d” of Rebar #1 in each specimen of
SW5...............................................................................................................................118
Figure 4.19 Backbone curves of lateral drift ratio versus steel strain at location “d” of Rebar #1
......................................................................................................................................119
Figure 4.20 Strains in different locations of each numbered rebar in specimen SW1~SW5 at -
1.2% lateral drift ratio ....................................................................................................121
Figure 4.21 Crack width at locations “L1”, “L2”, “L3”, and “L4” in the slab of SW1.............123
Figure 4.22 Crack width at locations “L1”, “L2”, “L3”, and “L4” in the slab of SW2.............124
Figure 4.23 Crack width at locations “L1”, “L2”, “L3”, and “L4” in the slab of SW3.............124
Figure 4.24 Crack width at locations “L1”, “L2”, “L3”, and “L4” in the slab of SW4.............125
Figure 4.25 Crack width at locations “L1”, “L2”, “L3”, and “L4” in the slab of SW5.............125
Figure 4.26 Final crack pattern on top and bottom surface of each specimen ..........................128
xiii
Figure 4.27 Moment versus lateral drift ratio of specimen SW6~SW9.................................... 132
Figure 4.28 Backbone curves of moment versus lateral drift ratio for SW6~SW9................... 133
Figure 4.29 Backbone curves of moment versus lateral drift ratio between specimen SW5 and
SW6 .............................................................................................................................. 137
Figure 4.30 Backbone curves of moment versus lateral drift ratio between specimen SW4 and
SW7 .............................................................................................................................. 137
Figure 4.31 Comparison of backbone curves of moment versus lateral drift ratio between
specimen........................................................................................................................ 138
Figure 4.32 Backbone curves of moment versus lateral drift ratio for SW4 and SW9.............. 138
Figure 4.33 Moment peak-to-peak stiffness versus drift ratio of specimen SW6, SW7, SW8 .. 142
Figure 4.34 Moment peak-to-peak stiffness versus drift ratio of specimen SW5 and SW9 ...... 142
Figure 4.35 Peak-to-peak stiffness of small drift cycles of SW5 ~ SW9.................................. 143
Figure 4.36 Figure 15–Horizontal load versus strain in bolt #1a of SW7. ...............................144
Figure 4.37 Backbone curves of lateral drift ratio versus strain in each bolt of specimens SW7
...................................................................................................................................... 144
Figure 4.38 Backbone curves of lateral drift ratio versus strain in each bolt of specimens SW8
...................................................................................................................................... 145
Figure 4.39 Backbone curves of lateral drift ratio versus strain in each bolt of specimens SW9
...................................................................................................................................... 146
Figure 4.40 Strain gauges layout in specimens SW6, SW7, and SW8..................................... 147
Figure 4.41 Lateral drift ratio versus strain at location “d” of Rebar #1 in specimen SW6....... 148
Figure 4.42 Lateral drift ratio versus strain at location “c” of Rebar #1 in specimen SW7....... 148
Figure 4.43 Lateral drift ratio versus strain at location “c” of Rebar #1 in specimen SW8....... 149
Figure 4.44 Lateral drift ratio versus strain at location “c” of Rebar #1 in specimen SW9....... 149
Figure 4.45 Strains in different locations of each numbered rebar in specimen SW5~SW9 at -
1.15% lateral drift ratio .................................................................................................. 151
Figure 4.46 Crack width at locations “L1”, “L2”, “L3”, and “L4” in the slab of SW6............. 152
Figure 4.47 Crack width at locations “L1”, “L2”, “L3”, and “L4” in the slab of SW7............. 153
Figure 4.48 Crack width at locations “L1”, “L2”, “L3”, and “L4” in the slab of SW8............. 153
Figure 4.49 Crack width at locations “L1”, “L2”, “L3”, and “L4” in the slab of SW9............. 154
Figure 4.50 Crack pattern (final) of top and bottom surfaces of specimen SW6~SW9 ............ 156
Figure 5.1 Shear bolt and bolt head........................................................................................ 164
xiv
Figure 5.2 Axisymmetric element and its internal forces ........................................................164
Figure 5.3 Bolt head thickness versus net hole clearance and ratio 0 /r R for 3/8” diameter bolts
......................................................................................................................................168
Figure 5.4 Bolt head thickness versus net hole clearance and ratio 0 /r R for 1/2” diameter bolts
......................................................................................................................................169
Figure 5.5 Head thickness at the bolt stem edge versus hole radius.........................................169
Figure 5.6 Normalized bolt head thickness versus normalized distance from bolt stem (for all
stem diameters) ..............................................................................................................170
Figure 5.7 Mid-thick plate section deformation ....................................................................171
Figure 5.8 Eight-node isoparametric plate element .................................................................172
Figure 5.9 Finite element mesh for a quadrant........................................................................173
Figure 5.10 Gauss point numbering of element 2 and 4 ..........................................................173
Figure 5.11 Ratio of bolt head area over bolt stem section area versus concrete compressive
strength..........................................................................................................................176
Figure 5.12 Pressure on concrete slab surfaces by bolts head and washer................................178
Figure 5.13 Axisymmetric analysis of the concrete slab around the bolts hole ........................178
Figure 5.14 Stress distribution along the top line BC..............................................................180
Figure 5.15 Stress distribution along the top line AD..............................................................182
Figure 5.16 Spacing 0S , 1S and 2S of shear bolts.................................................................185
Figure 5.17 Punching shear cracks in the concrete slab without shear reinforcement...............186
Figure 5.18 Shear rack angles in slab zones with or without shear studs ................................186
Figure 5.19 Distance of punching shear crack tail to the column center ..................................188
Figure 5.20 Shear cracks in the opening edges of the slab (SW6) without shear bolts ............189
Figure 5.21 Shear cracks in the opening edges of the slab (SW8) with shear bolts of radial layout
......................................................................................................................................190
Figure 5.22 Shear cracks in the opening edges of the slab (SW7) with shear bolts of orthogonal
layout.............................................................................................................................190
Figure 5.23 Crack angle 1θ in the slab strengthened with shear bolts......................................191
Figure 5.24 Assumed pressure in the slab concrete by the shear bolt heads.............................195
Figure 5.25 Spacing 1S =0.75d (or 0.5d) for Headed shear studs by CSA A23.3-04................196
Figure 5.26 Symmetric layout of shear bolts...........................................................................199
xv
List of Tables
Table 2.1 Vertical load influence on peak load and drift (from Robertson and Durrani, 1992) .. 19
Table 2.2 Limit on plastic rotation angles for slab-column connection by performance level .... 48
Table 2.3 Edge slab-column connections with or without shear studs (El-Salakaway and Polak
et al, 1998, 1999, 2000, 2003) ......................................................................................... 50
Table 2.4 Four edge slab-column specimens strengthened with shear bolts (El-Salakaway and
Polak et al., 2003) ............................................................................................................ 51
Table 2.5 Six interior slab-column specimens strengthened with/without shear bolts (adapted
from Adetifa and Polak, 2005) ......................................................................................... 52
Table 3.1 Initial design of moment capacity of the nine slab-column connections before testing
........................................................................................................................................ 62
Table 3.2 Details of Specimens of Series I ............................................................................... 63
Table 3.3 Details of Specimens of Series II.............................................................................. 63
Table 3.4 Concrete strength of each specimen (4”x8” cylinders) .............................................. 65
Table 3.5 Compression strength of concrete cylinders (6”x12”) for the three batches ............... 69
Table 3.6 Testing results of the steel shear bolts and the two batches steel rebar....................... 72
Table 3.7 Properties of steel reinforcing bars ........................................................................... 73
Table 3.8 Testing data of original shear bolts and coupons....................................................... 76
Table 3.9 Properties of steel shear bolts ................................................................................... 76
Table 4.1 Peak load and drift ductility (defined by Pan and Moehle, 1989) of specimen
SW1~SW5..................................................................................................................... 103
Table 4.2 Drift ductility (using tested first yield drift ratio) of specimen SW1~SW5.............. 103
Table 4.3 Drift ratios at first yielding of reinforcing bars in the five specimens SW1~SW5 .... 122
Table 4.4 Crack width at 1.5%, 2.0% and 3.0% drift ratio for specimen SW1~SW5 ............... 123
Table 4.5 Peak moment and drift ductility (defined by Pan and Moehle, 1989) of specimen
SW6~SW9..................................................................................................................... 130
Table 4.6 Drift ductility (using tested first yield rebar strain) of specimen SW6~SW9............ 130
Table 4.7 Comparison of peak moment and drift ductility between SW5 and SW6................. 135
Table 4.8 Comparison of drift ductility (using tested first yield drift ratio) between SW5 and
SW6 .............................................................................................................................. 135
Table 4.9 Comparison of peak moment and drift ductility between SW7 and SW8 (effect of
openings and shear bolts layout patterns) ....................................................................... 136
xvi
Table 4.10 Comparison of drift ductility (using tested drift ratio) between SW8 and SW9 ......136
Table 4.11 Comparison of peak moment and drift ductility between SW4 and SW7, SW4 and
SW9 (effect of openings and shear bolts layout patterns) ................................................139
Table 4.12 Comparison of drift ductility (using tested first yield drift ratio) in SW4, SW7, and
SW9...............................................................................................................................139
Table 4.13 Comparison of peak moment and drift ductility between SW7 and SW8 (effect of
openings and shear bolts layout patterns)........................................................................141
Table 4.14 Comparison of drift ductility (using tested drift ratio) in SW7 and SW8................141
Table 4.15 Crack width at 1.5%, 2.0% and 3.0% drift ratio for specimen SW6~SW9 .............152
Table 4.16 Measured peak moments and the predicted nominal moments using codes of
ACI318-05, Eurocode 2(2004) and CSA A23.3-04.........................................................161
Table 5.1 Spacing 1s when 1 40oθ = using crack angle method..............................................192
Table 5.2 Spacing 1s when 1 50oθ = using crack angle method..............................................192
Table 5.3 Coefficients d
S1=ψ for various slab (interior weather) thickness, '0.56f c cv fλφ≤
......................................................................................................................................196
Table 5.4 Coefficients d
S1=ψ for various slab (exterior weather) thickness, '0.56f c cv fλφ≤
......................................................................................................................................197
Table 5.5 Coefficients d
S1=ψ for various slab (interior weather) thickness, '0.56f c cv fλφ>
......................................................................................................................................197
Table 5.6 Coefficients d
S1=ψ for various slab (exterior weather) thickness, '0.56f c cv fλφ>
......................................................................................................................................198
1
Chapter 1
Introduction
1.1 Reinforced Concrete Flat Slab Column Structures and Punching Shear
Failure
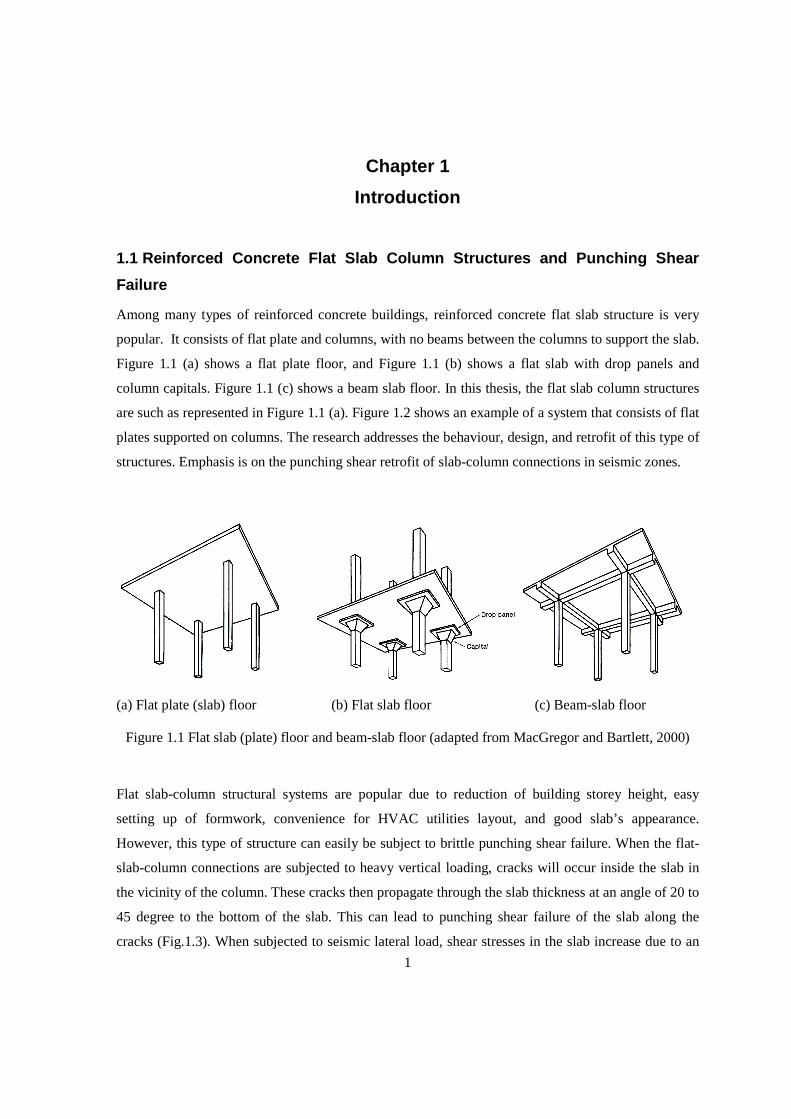
Among many types of reinforced concrete buildings, reinforced concrete flat slab structure is very
popular. It consists of flat plate and columns, with no beams between the columns to support the slab.
Figure 1.1 (a) shows a flat plate floor, and Figure 1.1 (b) shows a flat slab with drop panels and
column capitals. Figure 1.1 (c) shows a beam slab floor. In this thesis, the flat slab column structures
are such as represented in Figure 1.1 (a). Figure 1.2 shows an example of a system that consists of flat
plates supported on columns. The research addresses the behaviour, design, and retrofit of this type of
structures. Emphasis is on the punching shear retrofit of slab-column connections in seismic zones.
(a) Flat plate (slab) floor (b) Flat slab floor (c) Beam-slab floor
Figure 1.1 Flat slab (plate) floor and beam-slab floor (adapted from MacGregor and Bartlett, 2000)
Flat slab-column structural systems are popular due to reduction of building storey height, easy
setting up of formwork, convenience for HVAC utilities layout, and good slab’s appearance.
However, this type of structure can easily be subject to brittle punching shear failure. When the flat-
slab-column connections are subjected to heavy vertical loading, cracks will occur inside the slab in
the vicinity of the column. These cracks then propagate through the slab thickness at an angle of 20 to
45 degree to the bottom of the slab. This can lead to punching shear failure of the slab along the
cracks (Fig.1.3). When subjected to seismic lateral load, shear stresses in the slab increase due to an
2
unbalanced moment (from horizontal loading), and the slab-column connection is more likely to fail
by punching shear.
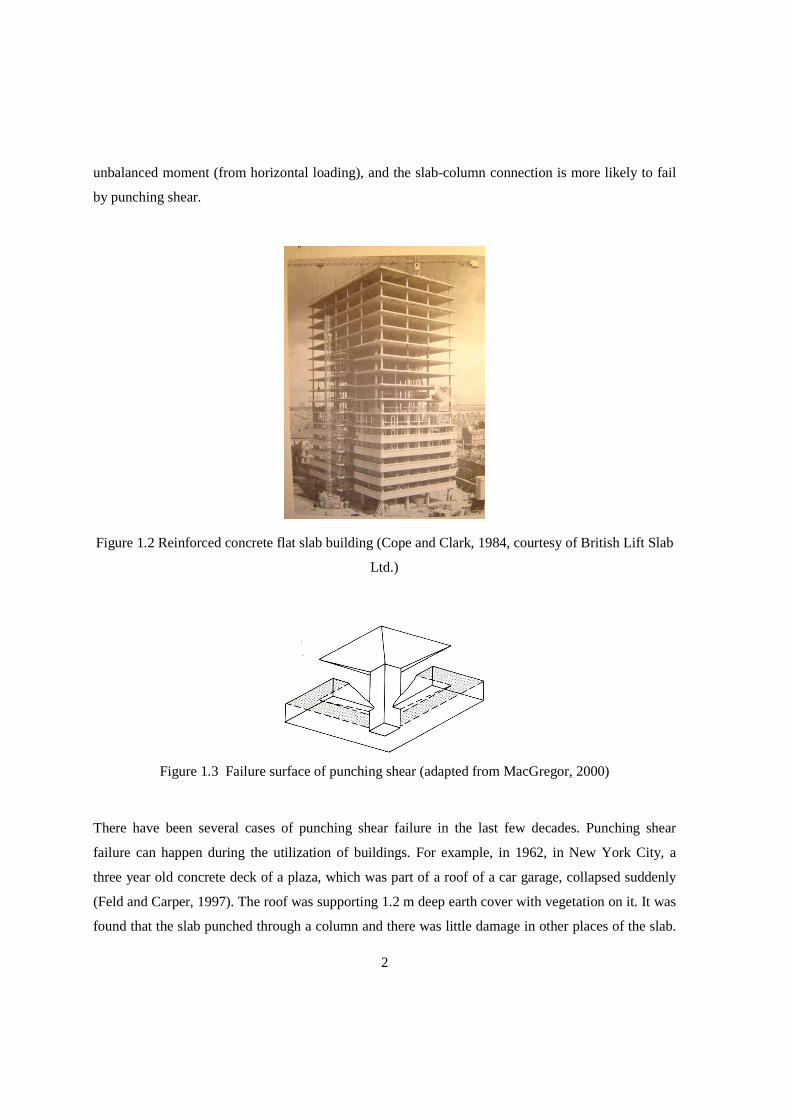
Figure 1.2 Reinforced concrete flat slab building (Cope and Clark, 1984, courtesy of British Lift Slab
Ltd.)
Figure 1.3 Failure surface of punching shear (adapted from MacGregor, 2000)
There have been several cases of punching shear failure in the last few decades. Punching shear
failure can happen during the utilization of buildings. For example, in 1962, in New York City, a
three year old concrete deck of a plaza, which was part of a roof of a car garage, collapsed suddenly
(Feld and Carper, 1997). The roof was supporting 1.2 m deep earth cover with vegetation on it. It was
found that the slab punched through a column and there was little damage in other places of the slab.
3
The reason was that the earth on the slab top was saturated and frozen, which increased the load.
Moreover, the slab was constructed with insufficient punching shear capacity.
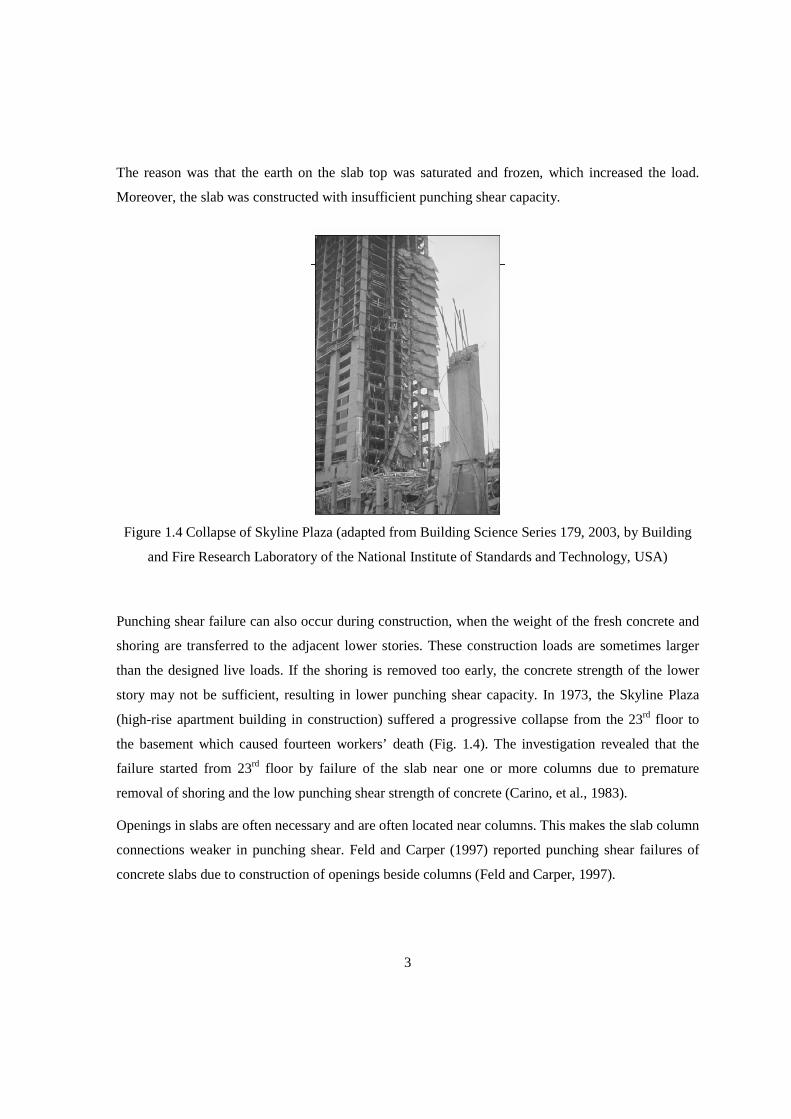
Figure 1.4 Collapse of Skyline Plaza (adapted from Building Science Series 179, 2003, by Building
and Fire Research Laboratory of the National Institute of Standards and Technology, USA)
Punching shear failure can also occur during construction, when the weight of the fresh concrete and
shoring are transferred to the adjacent lower stories. These construction loads are sometimes larger
than the designed live loads. If the shoring is removed too early, the concrete strength of the lower
story may not be sufficient, resulting in lower punching shear capacity. In 1973, the Skyline Plaza
(high-rise apartment building in construction) suffered a progressive collapse from the 23rd floor to
the basement which caused fourteen workers’ death (Fig. 1.4). The investigation revealed that the
failure started from 23rd floor by failure of the slab near one or more columns due to premature
removal of shoring and the low punching shear strength of concrete (Carino, et al., 1983).
Openings in slabs are often necessary and are often located near columns. This makes the slab column
connections weaker in punching shear. Feld and Carper (1997) reported punching shear failures of
concrete slabs due to construction of openings beside columns (Feld and Carper, 1997).
4
1.2 Reinforced Concrete Flat Slab Column Structures under Earthquakes
There are more than 10,000 earthquakes recorded each year and approximately 60 of them are
significant and potentially destructive (Bertero, 1994). Earthquakes occur in Canada mainly in the
east and west coast areas and in the Arctic.
During an earthquake, the horizontal movement of the ground induces large horizontal inertia forces
and lateral drifts in the buildings. The inter-story drift makes the flat slab-column connection rotate
and produce moments in the connection. The moments increase punching shear stress in a concrete
slab around the column area. Therefore, the flat slab structures are easy to be damaged in earthquakes.
In 1985 Mexico City earthquake, 91 waffle slab structures collapsed and 44 were severely damaged
(Rosenblueth et al., 1986). This type of structure was the most vulnerable to collapse in that
earthquake. Waffle slabs have solid slabs at the column connections, thus they have similar behaviour
to flat slab structures. Some of them were damaged by punching shear failure of the slabs. Others
were damaged by column failures.
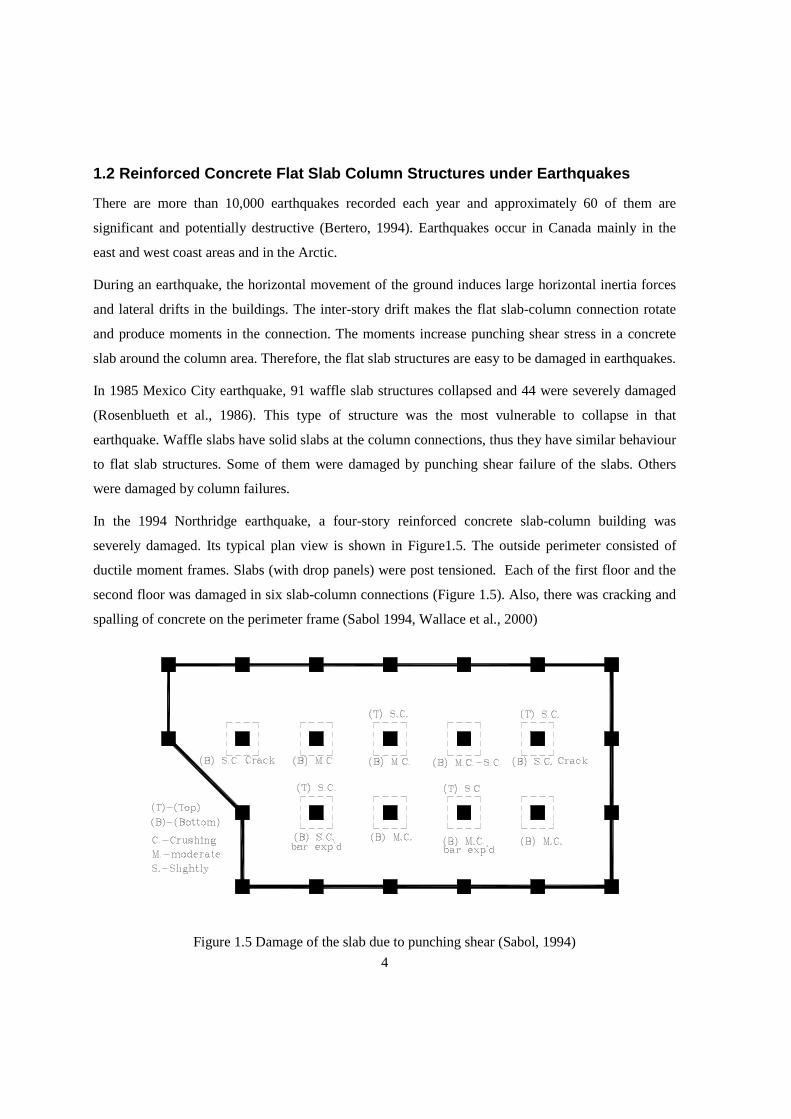
In the 1994 Northridge earthquake, a four-story reinforced concrete slab-column building was
severely damaged. Its typical plan view is shown in Figure1.5. The outside perimeter consisted of
ductile moment frames. Slabs (with drop panels) were post tensioned. Each of the first floor and the
second floor was damaged in six slab-column connections (Figure 1.5). Also, there was cracking and
spalling of concrete on the perimeter frame (Sabol 1994, Wallace et al., 2000)
Figure 1.5 Damage of the slab due to punching shear (Sabol, 1994)
5
1.3 Objective of This Research
Strength and ductility are both important for structures designed for seismic zones. It would not
economical to make all buildings to deform elastically under earthquakes. Most structural members
are allowed to have plastic hinges and deform plastically. An important philosophy is that these
members must be able to sustain load under large deformations to let people be evacuated during an
earthquake. Thus, these structures must possess ductility. A general definition of ductility can be
stated as: the ductility is the ratio of the ultimate displacement (drift, or rotation) over displacement
(drift or rotation) at the onset of yielding.
It was not until in 1976 that the United Building Code specified ductility requirements for structures.
A large number of buildings, including flat slab column structures, constructed before that are
therefore lacking ductility. Recent earthquakes show that buildings designed using newer structural
codes behave much better than the older ones. Therefore, it is desirable to find effective method to
strengthen the existing reinforced concrete flat slab column structures. It is important to increase the
punching shear capacity, ductility, and lateral drift capacity of the slab column connections.
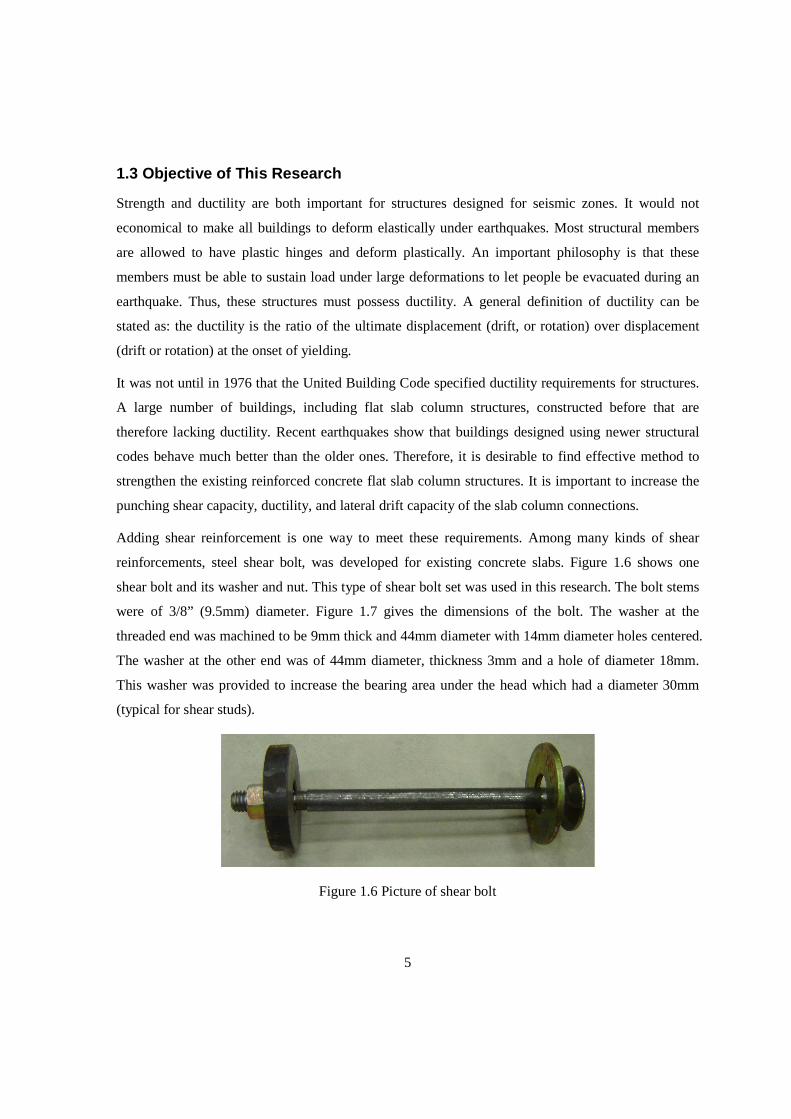
Adding shear reinforcement is one way to meet these requirements. Among many kinds of shear
reinforcements, steel shear bolt, was developed for existing concrete slabs. Figure 1.6 shows one
shear bolt and its washer and nut. This type of shear bolt set was used in this research. The bolt stems
were of 3/8” (9.5mm) diameter. Figure 1.7 gives the dimensions of the bolt. The washer at the
threaded end was machined to be 9mm thick and 44mm diameter with 14mm diameter holes centered.
The washer at the other end was of 44mm diameter, thickness 3mm and a hole of diameter 18mm.
This washer was provided to increase the bearing area under the head which had a diameter 30mm
(typical for shear studs).
Figure 1.6 Picture of shear bolt
6
30.5
44
2
6
(Unit: mm)
3
140
14
44 9.5
9
32
18
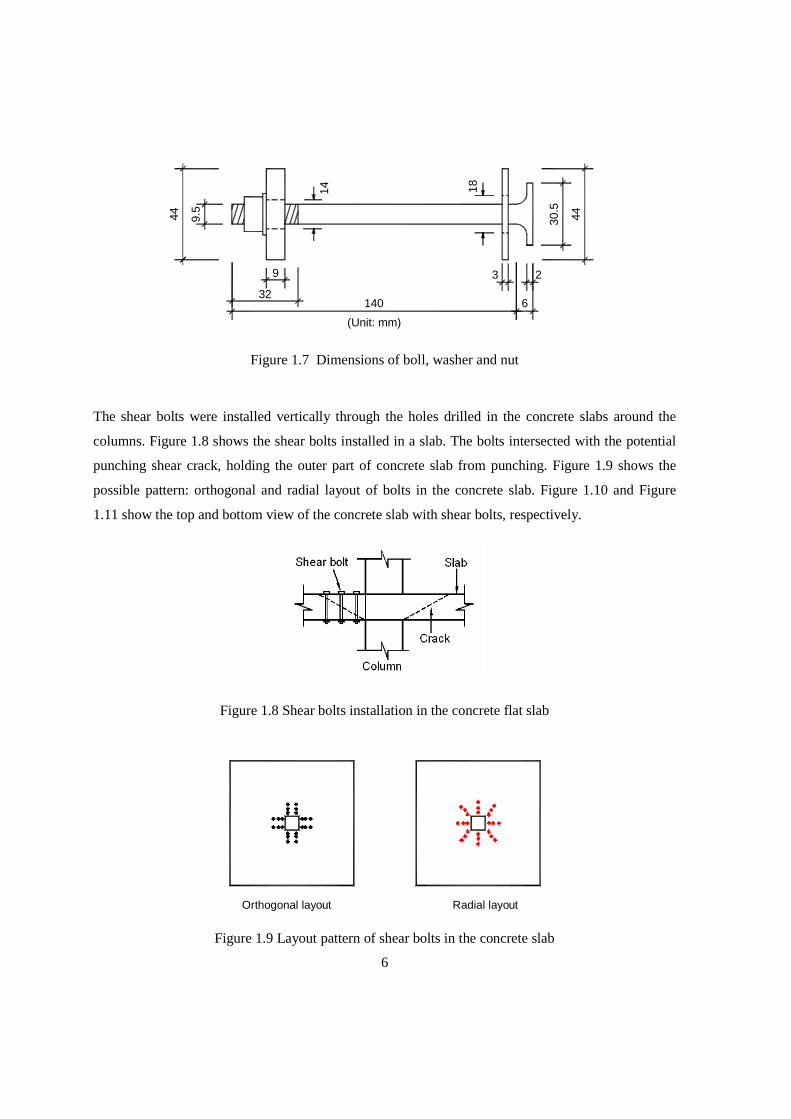
Figure 1.7 Dimensions of boll, washer and nut
The shear bolts were installed vertically through the holes drilled in the concrete slabs around the
columns. Figure 1.8 shows the shear bolts installed in a slab. The bolts intersected with the potential
punching shear crack, holding the outer part of concrete slab from punching. Figure 1.9 shows the
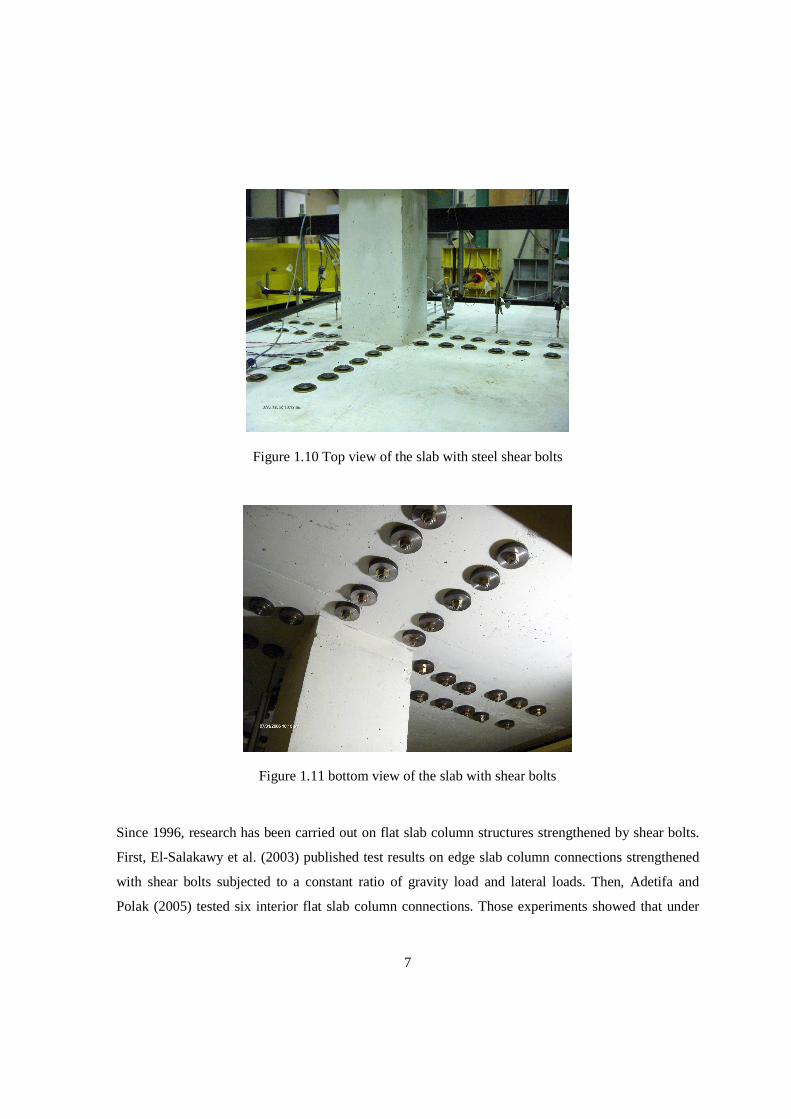
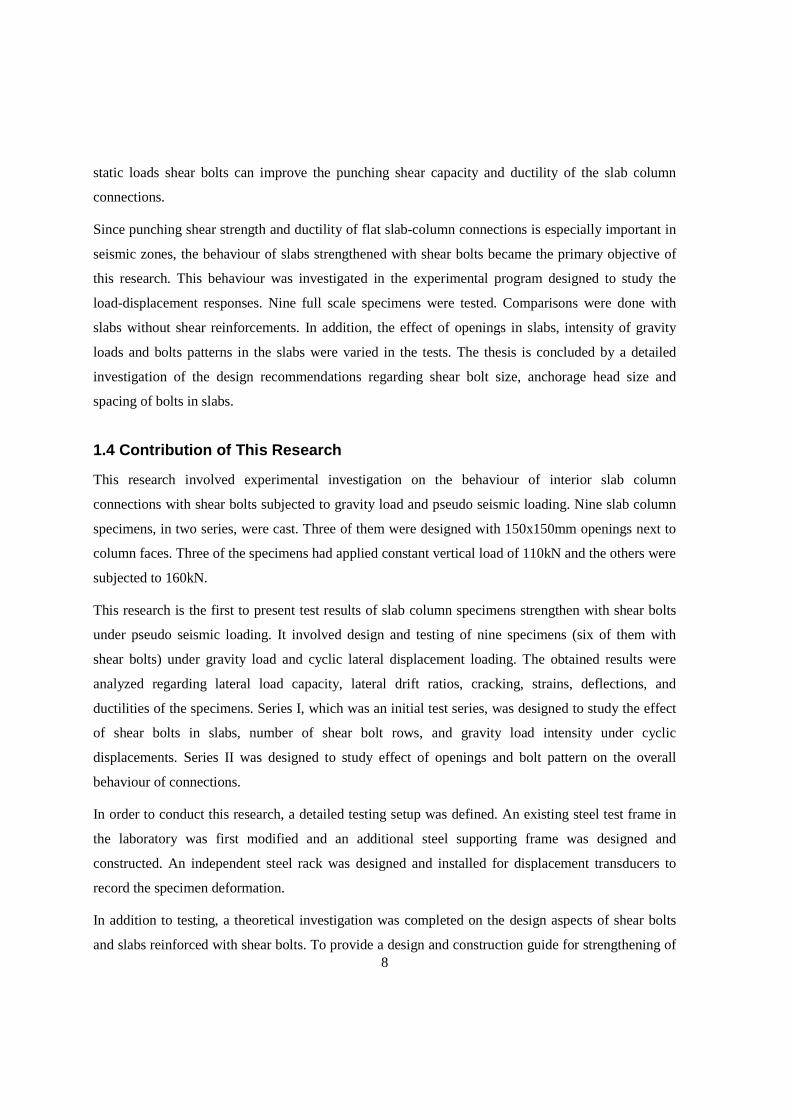
possible pattern: orthogonal and radial layout of bolts in the concrete slab. Figure 1.10 and Figure
1.11 show the top and bottom view of the concrete slab with shear bolts, respectively.
Figure 1.8 Shear bolts installation in the concrete flat slab
Orthogonal layout Radial layout
Figure 1.9 Layout pattern of shear bolts in the concrete slab
7
Figure 1.10 Top view of the slab with steel shear bolts
Figure 1.11 bottom view of the slab with shear bolts
Since 1996, research has been carried out on flat slab column structures strengthened by shear bolts.
First, El-Salakawy et al. (2003) published test results on edge slab column connections strengthened
with shear bolts subjected to a constant ratio of gravity load and lateral loads. Then, Adetifa and
Polak (2005) tested six interior flat slab column connections. Those experiments showed that under
8
static loads shear bolts can improve the punching shear capacity and ductility of the slab column
connections.
Since punching shear strength and ductility of flat slab-column connections is especially important in
seismic zones, the behaviour of slabs strengthened with shear bolts became the primary objective of
this research. This behaviour was investigated in the experimental program designed to study the
load-displacement responses. Nine full scale specimens were tested. Comparisons were done with
slabs without shear reinforcements. In addition, the effect of openings in slabs, intensity of gravity
loads and bolts patterns in the slabs were varied in the tests. The thesis is concluded by a detailed
investigation of the design recommendations regarding shear bolt size, anchorage head size and
spacing of bolts in slabs.
1.4 Contribution of This Research
This research involved experimental investigation on the behaviour of interior slab column
connections with shear bolts subjected to gravity load and pseudo seismic loading. Nine slab column
specimens, in two series, were cast. Three of them were designed with 150x150mm openings next to
column faces. Three of the specimens had applied constant vertical load of 110kN and the others were
subjected to 160kN.
This research is the first to present test results of slab column specimens strengthen with shear bolts
under pseudo seismic loading. It involved design and testing of nine specimens (six of them with
shear bolts) under gravity load and cyclic lateral displacement loading. The obtained results were
analyzed regarding lateral load capacity, lateral drift ratios, cracking, strains, deflections, and
ductilities of the specimens. Series I, which was an initial test series, was designed to study the effect
of shear bolts in slabs, number of shear bolt rows, and gravity load intensity under cyclic
displacements. Series II was designed to study effect of openings and bolt pattern on the overall
behaviour of connections.
In order to conduct this research, a detailed testing setup was defined. An existing steel test frame in
the laboratory was first modified and an additional steel supporting frame was designed and
constructed. An independent steel rack was designed and installed for displacement transducers to
record the specimen deformation.
In addition to testing, a theoretical investigation was completed on the design aspects of shear bolts
and slabs reinforced with shear bolts. To provide a design and construction guide for strengthening of
9
flat slab column structures, bolt heads were analyzed using elastic thin plate theory and finite element
analysis. Equation for head area was derived based on concrete bearing strength. Relation among
head thickness, bolt diameter and diameter of holes was provided.
Bolt spacing in slabs was analyzed and appropriate design procedures were provided. These included
strength requirements for concrete slabs retrofitted with shear bolts and requirements related to
inclined crack propagation. Seismic design requirements regarding to slabs with shear bolts were
given. Finally, some suggestions were provided for the retrofitting construction, fire and corrosion
protection of steel shear bolts, and maintenance.
1.5 Organization of the Thesis
Chapter 1 of this thesis introduces the background, explains the objective of the research, and presents
the contributions.
Chapter 2 describes a literature review on: 1) punching shear research; 2) seismic behaviour and
research on flat slab column structures; 3) previous research work carried out at the University of
Waterloo.
In Chapter 3, the experimental setup is introduced, including the design and setting up of steel test
frame, steel supporting frame, instrumentation, and design and fabrication of the concrete flat slab
column connections.
Chapter 4 presents the experimental results. Comparisons are made which show the advantages of the
steel shear bolts. Analysis of the results is done which shows the performance of slabs with shear
bolts. Loads, drift ratios, strains, and cracks are presented.
In Chapter 5, the design of steel shear bolt is introduced. Also the design of the existing concrete
slabs strengthened with shear bolts is explained in terms of number of bolts, the spacing and layout of
the bolts in the slab. Some suggestions are also given on the operation of retrofitting, protection and
maintenance of the shear bolts.
Chapter 6 presents the conclusions and provides suggestions for future research.
10
Chapter 2
Literature Review
2.1 Introduction
This chapter describes literature on punching shear research work that has been done by previous
researchers. First, in section 2.2, it introduces the research completed on reinforced concrete flat slab
column connections under vertical (gravity) load or a combination of vertical load and static moments
only. Second, in section 2.3, it addresses previous research on punching shear behaviour of flat slab-
column structures subjected to seismic loads and gravity load. Then in section 2.4, some typical
mechanics models for punching shear of slab-column connections are reviewed. In section 2.5, the
code design methods for punching shear of flat slab column structures are introduced. Finally, section
2.6 presents research on shear bolt strengthening method that has been done at the University of
Waterloo, which includes work on edge slab-column connections under gravity loads and static
moments, and behavior of interior flat slab-column connections subjected to monotonically increasing
gravity loading.
2.2 Punching Shear Behaviour in Reinforced Concrete Slabs under Vertical
Load or Vertical Load Combined with Static Moments
When a reinforced concrete flat slab column structure is subjected to heavy gravity (vertical) load,
punching shear cracks occur inside the slab at the column vicinity. They propagate at 20 ~ 50 degree
angles through the slab thickness. A truncated conical or pyramid failure surface around the column
forms. In addition to vertical loads, the slab-column connections may be subjected to unbalanced
moments, which are caused by unequal spans on both sides of the column or by lateral loading such
as wind or earthquakes. The unbalanced moment is resisted by a combination of stresses in slab
flexural reinforcements, shear strength of concrete, and shear reinforcement in the vicinity of column.
Effect of unbalanced moments from earthquakes (reversed cyclic loading) will be discussed in
Section 2.3. Punching shear transfer mechanisms (internal forces equilibrating punching force)
include: aggregate interlock at the crack, compression and tension in concrete, dowel force from
flexural steel, and tension in transverse reinforcements if present.
11
2.2.1 Parameters Influencing Punching Shear Strengt h of Slab-Column Connections
Many factors affect the punching shear capacity of flat slab-column connections under static loads.
Slab thickness, column dimensions, concrete strength, flexural reinforcing ratio and pattern, and shear
reinforcement are all the parameters influencing punching shear capacity. In experiments, the testing
methods and conditions, such as the loading rate and scale of specimens, also influence the results,
and supporting conditions. The discussion below is based on some selected references related to the
above factors.
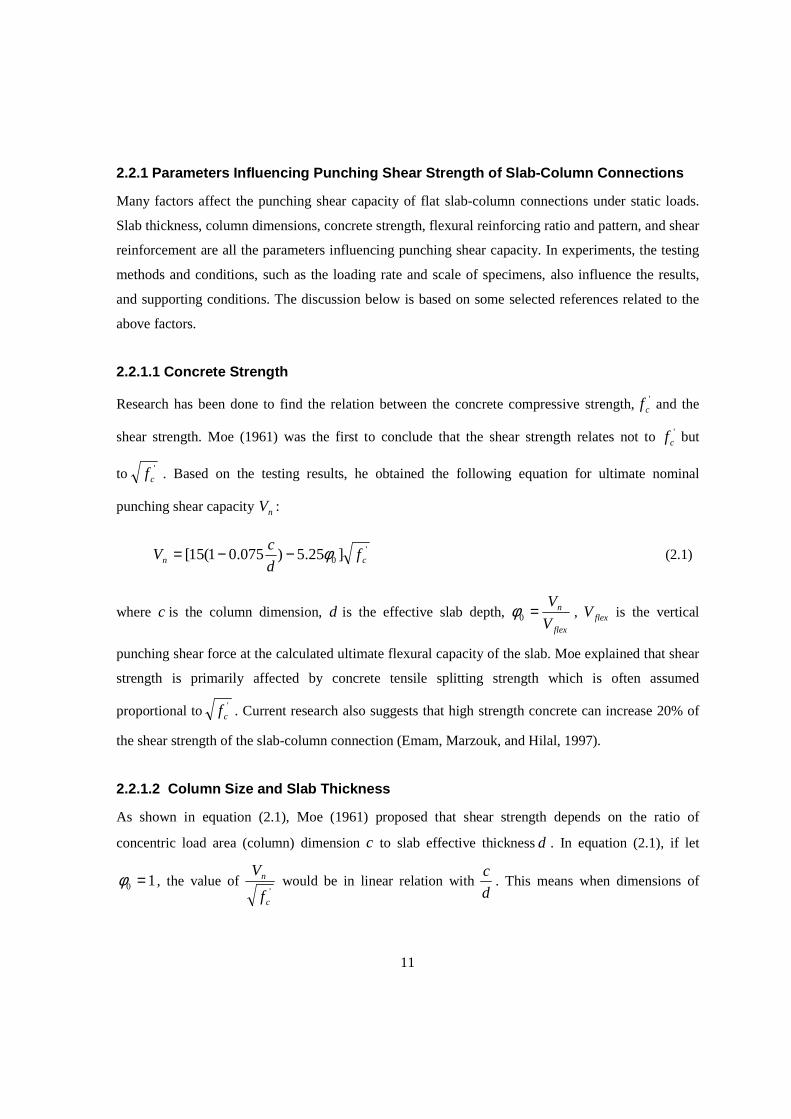
2.2.1.1 Concrete Strength
Research has been done to find the relation between the concrete compressive strength,'cf and the
shear strength. Moe (1961) was the first to conclude that the shear strength relates not to 'cf but
to 'cf . Based on the testing results, he obtained the following equation for ultimate nominal
punching shear capacity nV :
'0 ]25.5)075.01(15[ cn f
d
cV φ−−= (2.1)
where c is the column dimension, d is the effective slab depth, flex
n
V
V=0φ , flexV is the vertical
punching shear force at the calculated ultimate flexural capacity of the slab. Moe explained that shear
strength is primarily affected by concrete tensile splitting strength which is often assumed
proportional to 'cf . Current research also suggests that high strength concrete can increase 20% of
the shear strength of the slab-column connection (Emam, Marzouk, and Hilal, 1997).
2.2.1.2 Column Size and Slab Thickness
As shown in equation (2.1), Moe (1961) proposed that shear strength depends on the ratio of
concentric load area (column) dimension c to slab effective thicknessd . In equation (2.1), if let
10 =φ , the value of '
c
n
f
V would be in linear relation with
d
c. This means when dimensions of
12
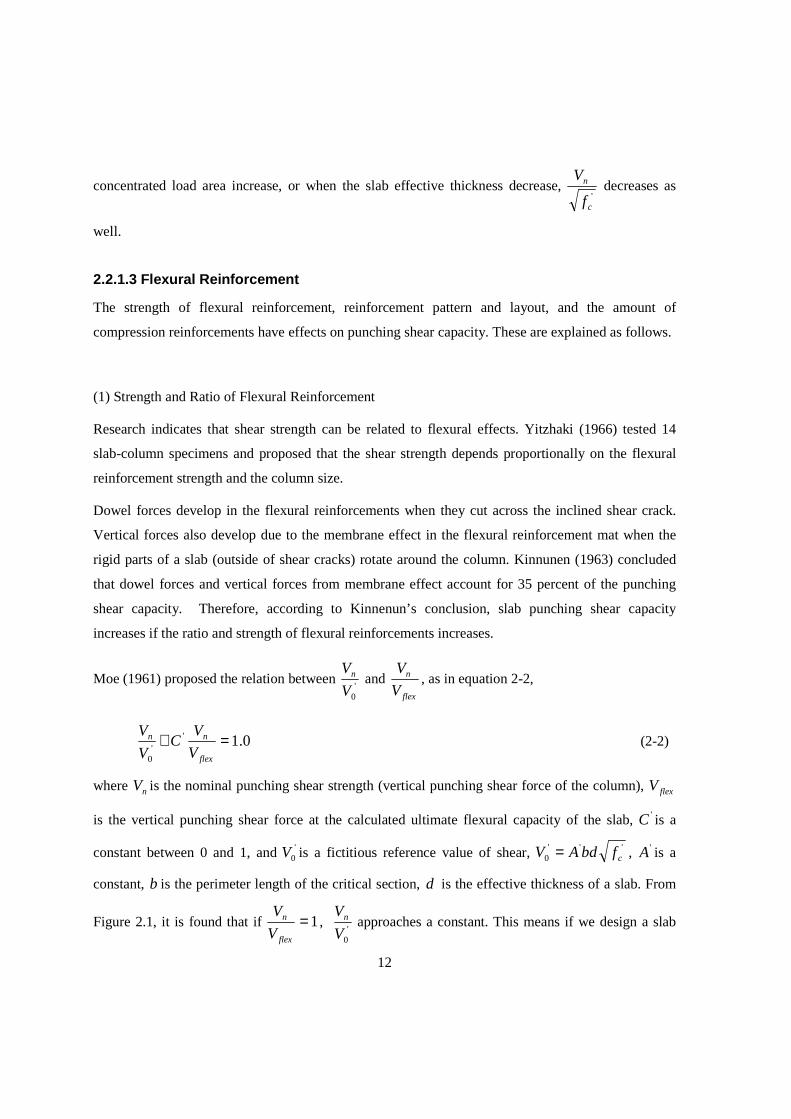
concentrated load area increase, or when the slab effective thickness decrease, '
c
n
f
V decreases as
well.
2.2.1.3 Flexural Reinforcement
The strength of flexural reinforcement, reinforcement pattern and layout, and the amount of
compression reinforcements have effects on punching shear capacity. These are explained as follows.
(1) Strength and Ratio of Flexural Reinforcement
Research indicates that shear strength can be related to flexural effects. Yitzhaki (1966) tested 14
slab-column specimens and proposed that the shear strength depends proportionally on the flexural
reinforcement strength and the column size.
Dowel forces develop in the flexural reinforcements when they cut across the inclined shear crack.
Vertical forces also develop due to the membrane effect in the flexural reinforcement mat when the
rigid parts of a slab (outside of shear cracks) rotate around the column. Kinnunen (1963) concluded
that dowel forces and vertical forces from membrane effect account for 35 percent of the punching
shear capacity. Therefore, according to Kinnenun’s conclusion, slab punching shear capacity
increases if the ratio and strength of flexural reinforcements increases.
Moe (1961) proposed the relation between '
0V
Vn and flex
n
V
V, as in equation 2-2,
0.1''
0
=+flex
nn
V
VC
V
V (2-2)
where nV is the nominal punching shear strength (vertical punching shear force of the column), flexV
is the vertical punching shear force at the calculated ultimate flexural capacity of the slab, 'C is a
constant between 0 and 1, and '0V is a fictitious reference value of shear, '''
0 cfbdAV = , 'A is a
constant, b is the perimeter length of the critical section, d is the effective thickness of a slab. From
Figure 2.1, it is found that if 1=flex
n
V
V,
'0V
Vn approaches a constant. This means if we design a slab
13
governed by flexural failure ( flexn VV = , which is a preferred mode of failure), nV can be calculated
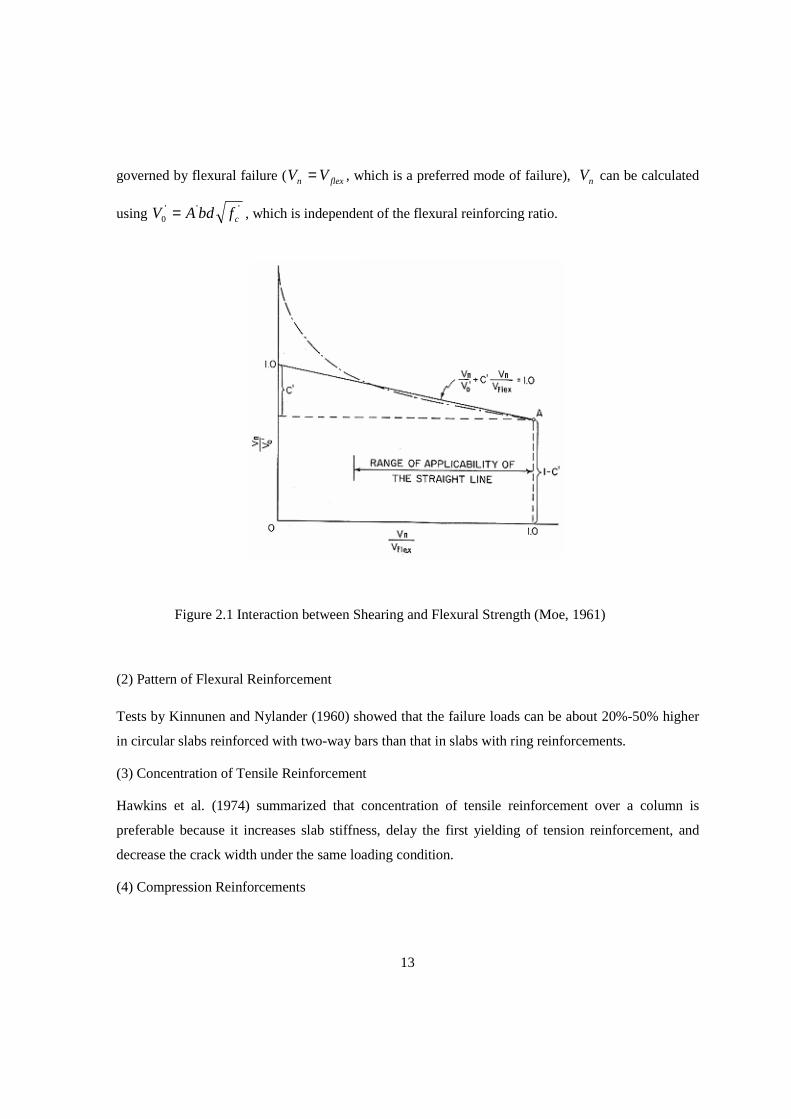
using '''0 cfbdAV = , which is independent of the flexural reinforcing ratio.
Figure 2.1 Interaction between Shearing and Flexural Strength (Moe, 1961)
(2) Pattern of Flexural Reinforcement
Tests by Kinnunen and Nylander (1960) showed that the failure loads can be about 20%-50% higher
in circular slabs reinforced with two-way bars than that in slabs with ring reinforcements.
(3) Concentration of Tensile Reinforcement
Hawkins et al. (1974) summarized that concentration of tensile reinforcement over a column is
preferable because it increases slab stiffness, delay the first yielding of tension reinforcement, and
decrease the crack width under the same loading condition.
(4) Compression Reinforcements
14
Elstner and Hognestad (1956) reported that, for 10 <=flex
n
V
Vφ , there is little effect on shear strength
with the variation of the compression reinforcement, where flexn VV , are defined as in equation (2-1).
However, when 0φ ≥ 1, the shear strength increases if the ratio of the compression reinforcement
increases. Compression reinforcements also increase the dowel force after punching failure, which
can prevent progressive collapse of a structure.
2.2.1.4 Shear Reinforcements
Conical punching shear cracks form if the slab is subjected to a vertical load or a vertical load with an
unbalanced moment. To prevent punching shear crack from propagating, shear reinforcements can be
used. Shear reinforcement is, in general, a bar (or other shape) crossing the inclined cracks to prevent
punching shear failure. The bar should have adequate tension strength, ductility and good anchorage
to develop its strength if punching shear occurs. There are many types of shear reinforcements for
new or existing reinforced concrete slabs.
(1) Shear Reinforcements for New Construction
For new construction, shear reinforcements are embedded with the flexural reinforcements before the
concrete is cast. They can be divided into three groups: 1) Structural steel sections such as I shape
steel, or channels; 2) Bent bars and stirrups; 3) Headed reinforcements including shear studs and
headed bars
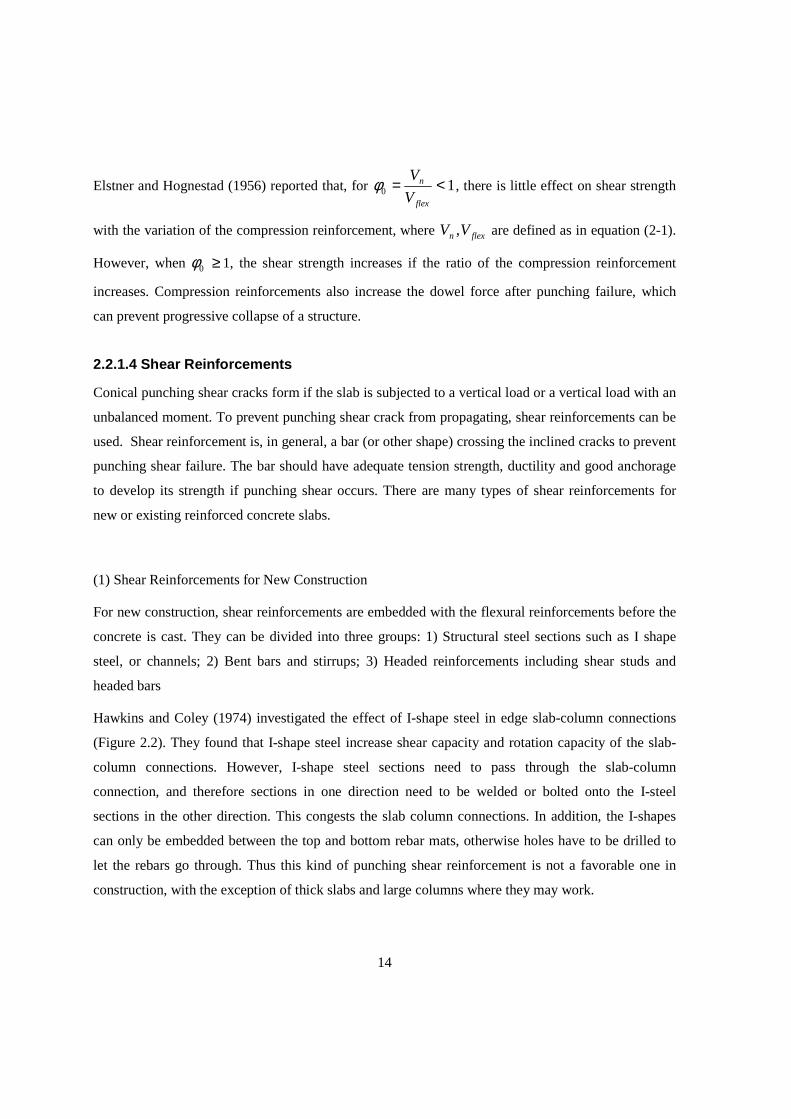
Hawkins and Coley (1974) investigated the effect of I-shape steel in edge slab-column connections
(Figure 2.2). They found that I-shape steel increase shear capacity and rotation capacity of the slab-
column connections. However, I-shape steel sections need to pass through the slab-column
connection, and therefore sections in one direction need to be welded or bolted onto the I-steel
sections in the other direction. This congests the slab column connections. In addition, the I-shapes
can only be embedded between the top and bottom rebar mats, otherwise holes have to be drilled to
let the rebars go through. Thus this kind of punching shear reinforcement is not a favorable one in
construction, with the exception of thick slabs and large columns where they may work.
15
Figure 2.2 I-shape shear reinforcement (Hawkins and Coley, 1974)
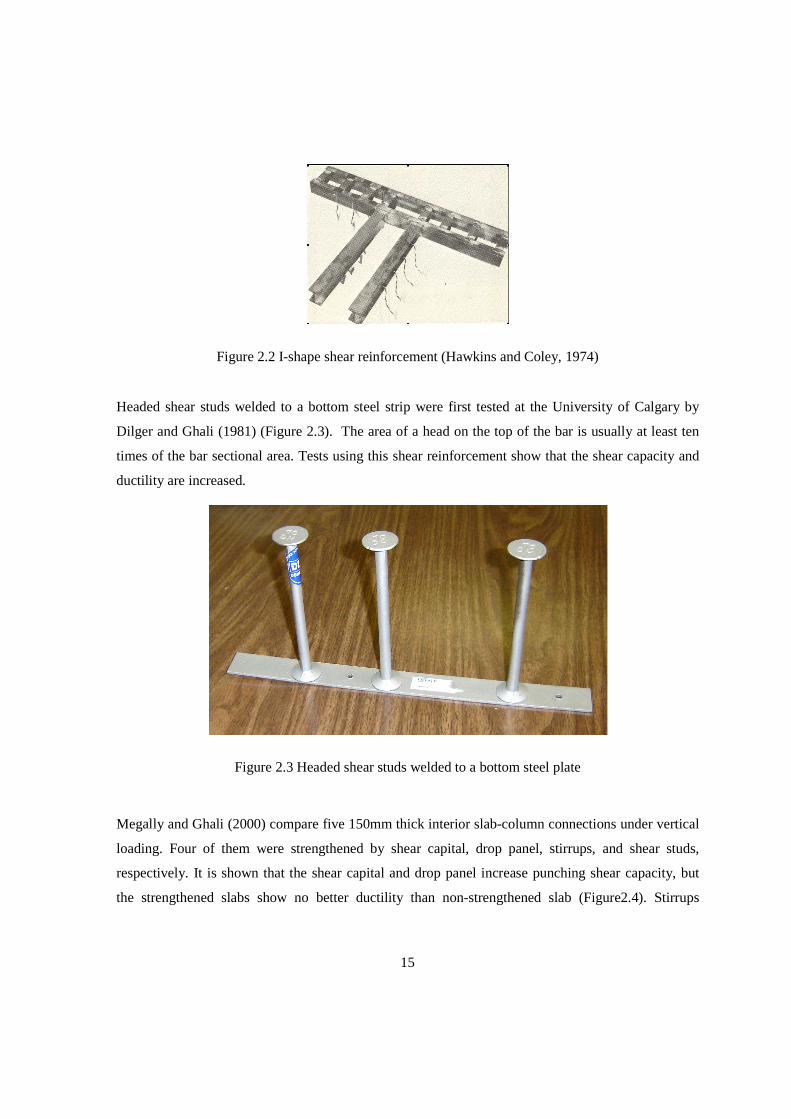
Headed shear studs welded to a bottom steel strip were first tested at the University of Calgary by
Dilger and Ghali (1981) (Figure 2.3). The area of a head on the top of the bar is usually at least ten
times of the bar sectional area. Tests using this shear reinforcement show that the shear capacity and
ductility are increased.
Figure 2.3 Headed shear studs welded to a bottom steel plate
Megally and Ghali (2000) compare five 150mm thick interior slab-column connections under vertical
loading. Four of them were strengthened by shear capital, drop panel, stirrups, and shear studs,
respectively. It is shown that the shear capital and drop panel increase punching shear capacity, but
the strengthened slabs show no better ductility than non-strengthened slab (Figure2.4). Stirrups
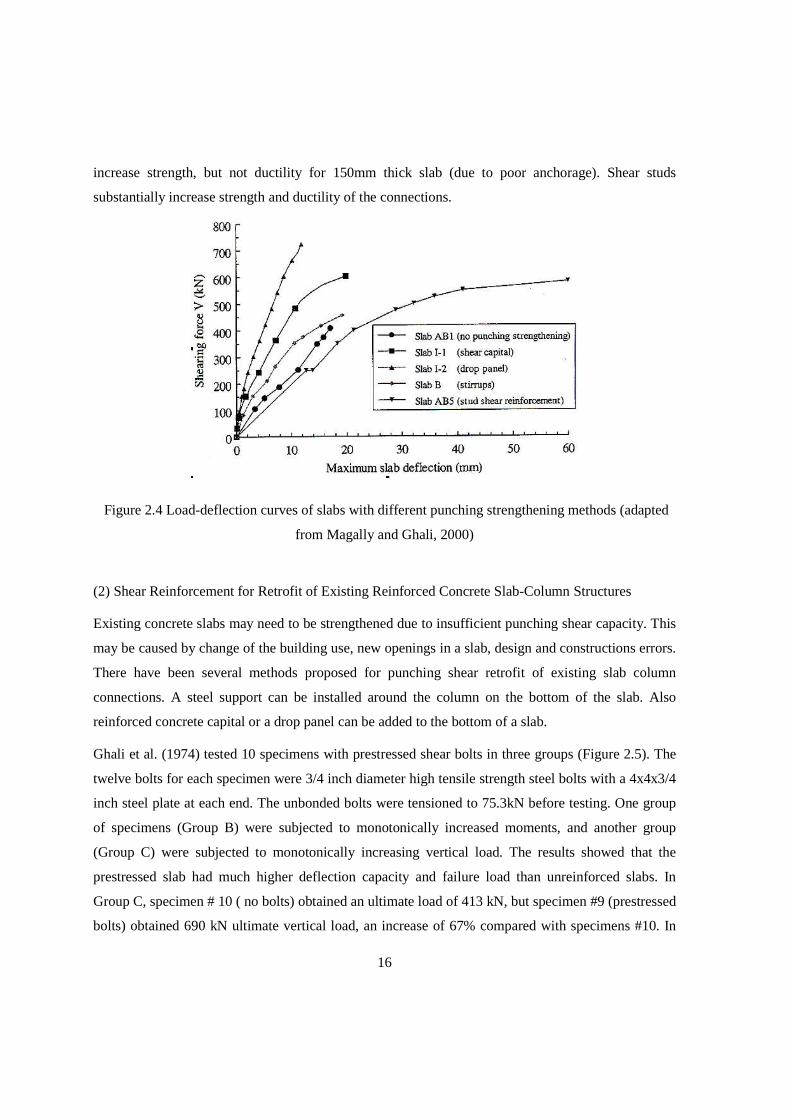
16
increase strength, but not ductility for 150mm thick slab (due to poor anchorage). Shear studs
substantially increase strength and ductility of the connections.
Figure 2.4 Load-deflection curves of slabs with different punching strengthening methods (adapted
from Magally and Ghali, 2000)
(2) Shear Reinforcement for Retrofit of Existing Reinforced Concrete Slab-Column Structures
Existing concrete slabs may need to be strengthened due to insufficient punching shear capacity. This
may be caused by change of the building use, new openings in a slab, design and constructions errors.
There have been several methods proposed for punching shear retrofit of existing slab column
connections. A steel support can be installed around the column on the bottom of the slab. Also
reinforced concrete capital or a drop panel can be added to the bottom of a slab.
Ghali et al. (1974) tested 10 specimens with prestressed shear bolts in three groups (Figure 2.5). The
twelve bolts for each specimen were 3/4 inch diameter high tensile strength steel bolts with a 4x4x3/4
inch steel plate at each end. The unbonded bolts were tensioned to 75.3kN before testing. One group
of specimens (Group B) were subjected to monotonically increased moments, and another group
(Group C) were subjected to monotonically increasing vertical load. The results showed that the
prestressed slab had much higher deflection capacity and failure load than unreinforced slabs. In
Group C, specimen # 10 ( no bolts) obtained an ultimate load of 413 kN, but specimen #9 (prestressed
bolts) obtained 690 kN ultimate vertical load, an increase of 67% compared with specimens #10. In
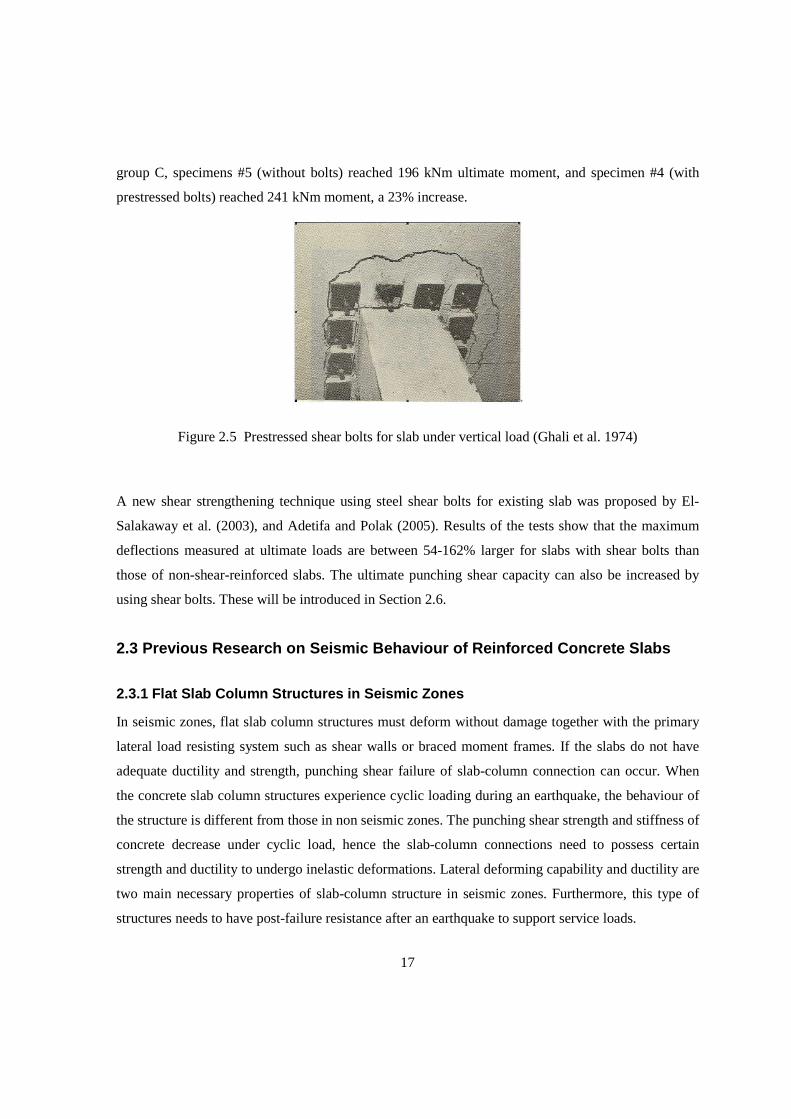
17
group C, specimens #5 (without bolts) reached 196 kNm ultimate moment, and specimen #4 (with
prestressed bolts) reached 241 kNm moment, a 23% increase.
Figure 2.5 Prestressed shear bolts for slab under vertical load (Ghali et al. 1974)
A new shear strengthening technique using steel shear bolts for existing slab was proposed by El-
Salakaway et al. (2003), and Adetifa and Polak (2005). Results of the tests show that the maximum
deflections measured at ultimate loads are between 54-162% larger for slabs with shear bolts than
those of non-shear-reinforced slabs. The ultimate punching shear capacity can also be increased by
using shear bolts. These will be introduced in Section 2.6.
2.3 Previous Research on Seismic Behaviour of Reinf orced Concrete Slabs
2.3.1 Flat Slab Column Structures in Seismic Zones
In seismic zones, flat slab column structures must deform without damage together with the primary
lateral load resisting system such as shear walls or braced moment frames. If the slabs do not have
adequate ductility and strength, punching shear failure of slab-column connection can occur. When
the concrete slab column structures experience cyclic loading during an earthquake, the behaviour of
the structure is different from those in non seismic zones. The punching shear strength and stiffness of
concrete decrease under cyclic load, hence the slab-column connections need to possess certain
strength and ductility to undergo inelastic deformations. Lateral deforming capability and ductility are
two main necessary properties of slab-column structure in seismic zones. Furthermore, this type of
structures needs to have post-failure resistance after an earthquake to support service loads.
18
Substantial research work has been done on punching shear behaviour of slab-column structures in
seismic zones. Most of the previous experiments were done using interior or edge connection
subassemblies isolated from prototype structures consisting of a slab with columns extending from
the top and bottom of the slab. These subassemblies are subjected to vertical loading from either the
top of columns or slab surface, and cyclic loading on the column ends or slab edges. This method is
easy to carry out and the test results have been utilized in design codes. There is also some research
was done using continuous slab column specimens. Other experimental methods include testing
model structures on shaking tables.
Many factors influence seismic punching shear capacity and ductility of slab-column connection in
seismic zones. In addition to the ones described in section 2.2, the following are also important in
seismic zones: biaxial loading or uniaxial loading and the magnitude of the gravity load shear.
2.3.2 Behaviour of Slab-Column Connections under Cy clic Loading
2.3.2.1 Effect of Gravity Load
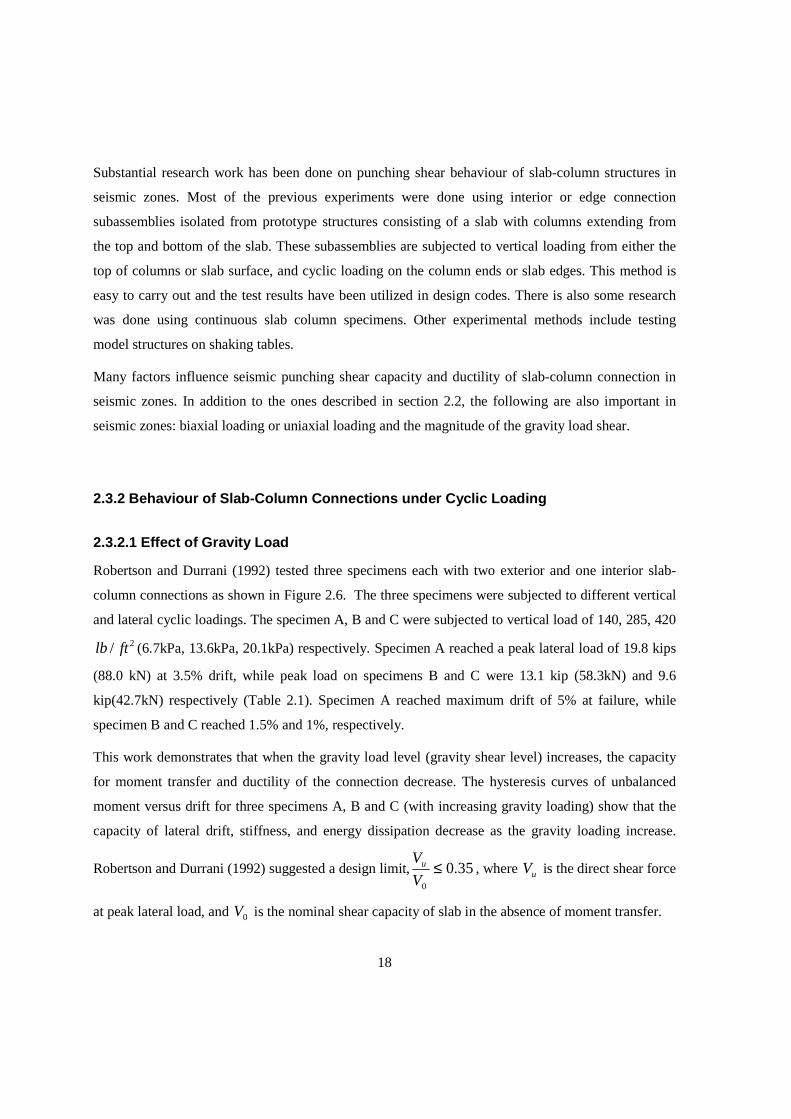
Robertson and Durrani (1992) tested three specimens each with two exterior and one interior slab-
column connections as shown in Figure 2.6. The three specimens were subjected to different vertical
and lateral cyclic loadings. The specimen A, B and C were subjected to vertical load of 140, 285, 420
2/lb ft (6.7kPa, 13.6kPa, 20.1kPa) respectively. Specimen A reached a peak lateral load of 19.8 kips
(88.0 kN) at 3.5% drift, while peak load on specimens B and C were 13.1 kip (58.3kN) and 9.6
kip(42.7kN) respectively (Table 2.1). Specimen A reached maximum drift of 5% at failure, while
specimen B and C reached 1.5% and 1%, respectively.
This work demonstrates that when the gravity load level (gravity shear level) increases, the capacity
for moment transfer and ductility of the connection decrease. The hysteresis curves of unbalanced
moment versus drift for three specimens A, B and C (with increasing gravity loading) show that the
capacity of lateral drift, stiffness, and energy dissipation decrease as the gravity loading increase.
Robertson and Durrani (1992) suggested a design limit, 35.00
≤V
Vu , where uV is the direct shear force
at peak lateral load, and 0V is the nominal shear capacity of slab in the absence of moment transfer.
19
Figure 2.6 Specimens including exterior and interior slab –column connection
Table 2.1 Vertical load influence on peak load and drift (from Robertson and Durrani, 1992)
Specimen Superimpose
slab load (lb/ft2)
Peak load and
corresponding drift
Drift of first failure
A 140 19.8 kip at 3.5% drift 5% at one exterior connection
B 285 13.1 kip at 1.5% 1.5 % at interior connection
C 420 9.6 kip at 1% 1% at interior connection
1kip=4.448kN, lb/ft 2 =47.88Pa
2.3.2.2 Effect of Biaxial Lateral Cyclic Loading
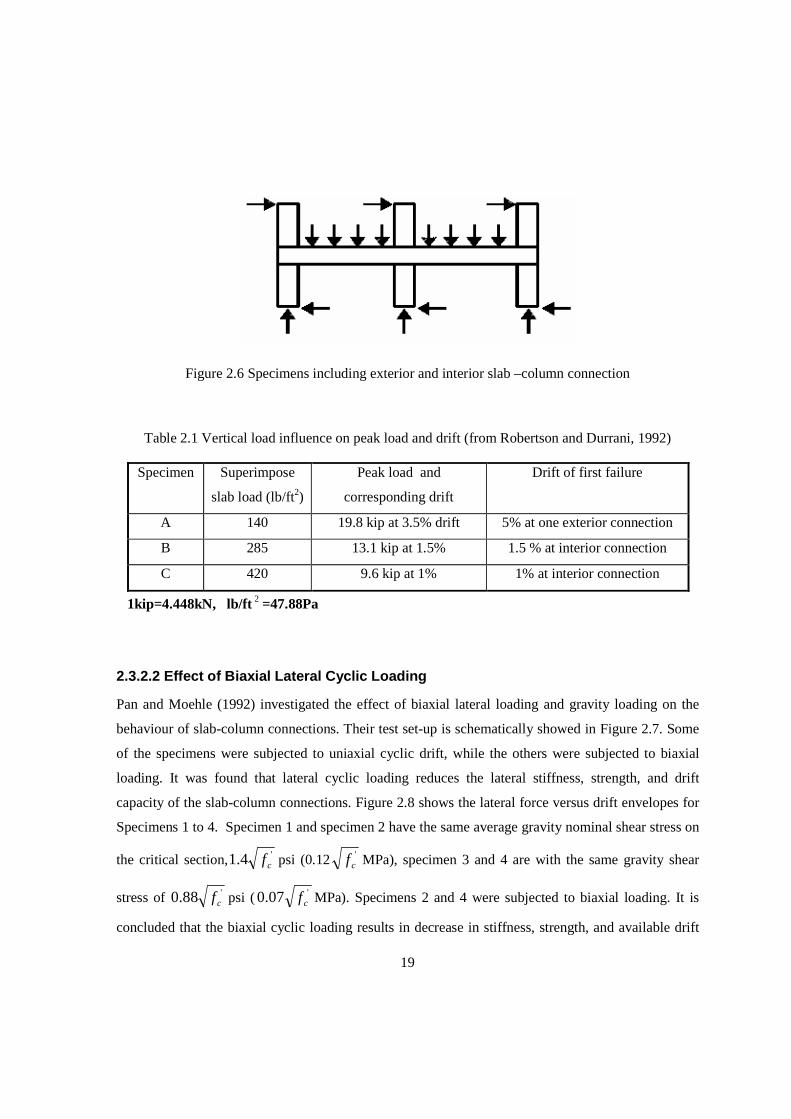
Pan and Moehle (1992) investigated the effect of biaxial lateral loading and gravity loading on the
behaviour of slab-column connections. Their test set-up is schematically showed in Figure 2.7. Some
of the specimens were subjected to uniaxial cyclic drift, while the others were subjected to biaxial
loading. It was found that lateral cyclic loading reduces the lateral stiffness, strength, and drift
capacity of the slab-column connections. Figure 2.8 shows the lateral force versus drift envelopes for
Specimens 1 to 4. Specimen 1 and specimen 2 have the same average gravity nominal shear stress on
the critical section, '4.1 cf psi (0.12 'cf MPa), specimen 3 and 4 are with the same gravity shear
stress of '88.0 cf psi ( '07.0 cf MPa). Specimens 2 and 4 were subjected to biaxial loading. It is
concluded that the biaxial cyclic loading results in decrease in stiffness, strength, and available drift
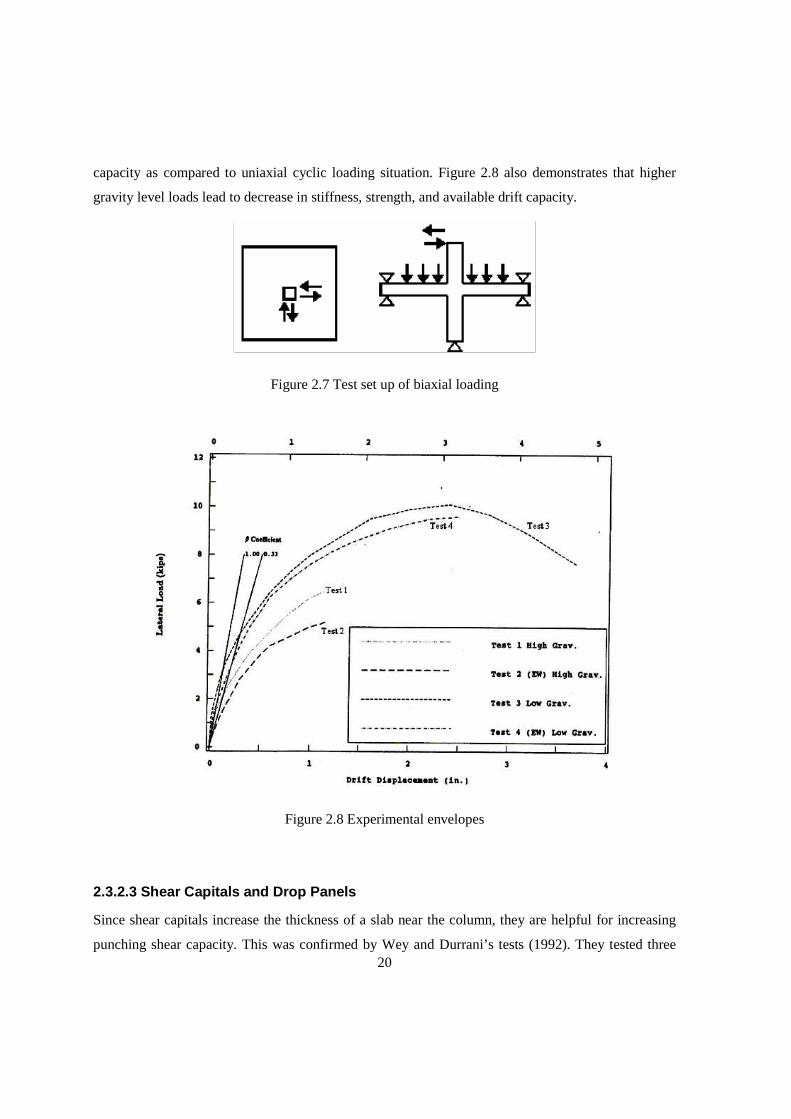
20
capacity as compared to uniaxial cyclic loading situation. Figure 2.8 also demonstrates that higher
gravity level loads lead to decrease in stiffness, strength, and available drift capacity.
Figure 2.7 Test set up of biaxial loading
Figure 2.8 Experimental envelopes
2.3.2.3 Shear Capitals and Drop Panels
Since shear capitals increase the thickness of a slab near the column, they are helpful for increasing
punching shear capacity. This was confirmed by Wey and Durrani’s tests (1992). They tested three
21
specimens with shear capitals under vertical load and cyclic moment. It was concluded that when the
shear capital is too small, and the connection is under high moment reversals, the net positive moment
at the connection may result in an inverted punching failure and the thickness of the shear capital is
not effective in increasing the shear capacity.
As mentioned in section 2.2.1, Megally and Ghali (2000) concluded that shear capitals can only
increase shear capacity, but not enhance ductility of the slab-column connections.
2.3.2.4 Effect of Concrete Strength on Seismic Punc hing Shear
Emam, Marzouk and Hilal (1997) researched seismic characteristics of slab-column structures
constructed with high-strength concrete. According to their tests on four interior slab-column
connections: two with high-strength concrete column and slab: H.H.H.C.0.5(1) and H.H.H.C.1.0(2),
two with high-strength column and normal strength slab: N.H.H.C.0.5(3) and N.H.H.C.1.0(4). By
using high strength concrete, the ductility of displacement and rotation increased by 100 and 125
percent, respectively, as the concrete strength increased from 35 to 75 MPa. Shear strength, moment
capacity, drift percent, and rotation capacity increased by 20, 31, 37 and 50 percent, respectively.
However, Megally and Ghali (2000) concluded that although high strength concrete increase
punching strength, the ultimate drift ratio and displacement ductility factor, it can hardly prevent
brittle failure in severe earthquakes.
2.3.2.5 Shear Reinforcement for New Slabs
Several tests on slab-column structures under cyclic loading were conducted using stirrups, shear
studs, bent-bars, or shearhead reinforcements. The summary of the findings is presented below.
(1) Stirrups, bent bars, and steel shearheads
Four slab-column connections (three with vertical closed stirrups and one without shear
reinforcement) were tested under cyclic loading by Islam and Park (1976). Meanwhile they also
tested other two specimens under monotonic lateral loading, one with bent-bars, the other with
shearhead reinforcement (channel sections). The experimental results led to the conclusion that the
closed stirrups increase the shear strength and significantly increase ductility of the connection under
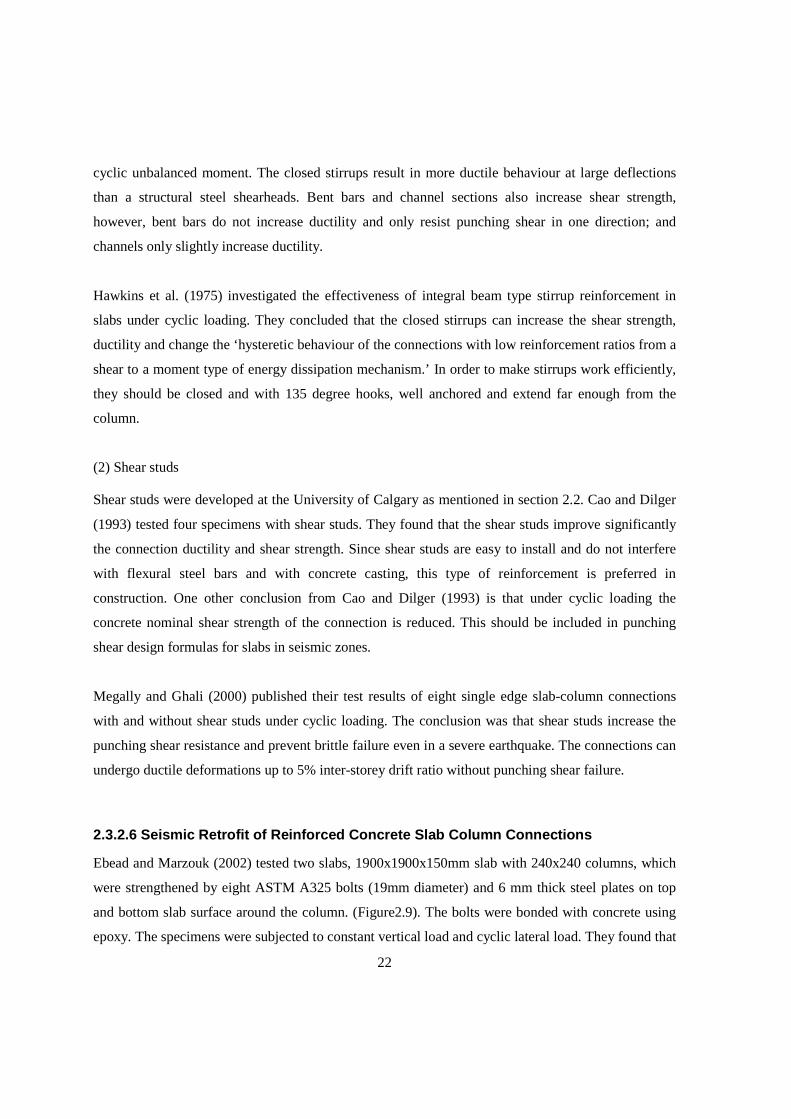
22
cyclic unbalanced moment. The closed stirrups result in more ductile behaviour at large deflections
than a structural steel shearheads. Bent bars and channel sections also increase shear strength,
however, bent bars do not increase ductility and only resist punching shear in one direction; and
channels only slightly increase ductility.
Hawkins et al. (1975) investigated the effectiveness of integral beam type stirrup reinforcement in
slabs under cyclic loading. They concluded that the closed stirrups can increase the shear strength,
ductility and change the ‘hysteretic behaviour of the connections with low reinforcement ratios from a
shear to a moment type of energy dissipation mechanism.’ In order to make stirrups work efficiently,
they should be closed and with 135 degree hooks, well anchored and extend far enough from the
column.
(2) Shear studs
Shear studs were developed at the University of Calgary as mentioned in section 2.2. Cao and Dilger
(1993) tested four specimens with shear studs. They found that the shear studs improve significantly
the connection ductility and shear strength. Since shear studs are easy to install and do not interfere
with flexural steel bars and with concrete casting, this type of reinforcement is preferred in
construction. One other conclusion from Cao and Dilger (1993) is that under cyclic loading the
concrete nominal shear strength of the connection is reduced. This should be included in punching
shear design formulas for slabs in seismic zones.
Megally and Ghali (2000) published their test results of eight single edge slab-column connections
with and without shear studs under cyclic loading. The conclusion was that shear studs increase the
punching shear resistance and prevent brittle failure even in a severe earthquake. The connections can
undergo ductile deformations up to 5% inter-storey drift ratio without punching shear failure.
2.3.2.6 Seismic Retrofit of Reinforced Concrete Sla b Column Connections
Ebead and Marzouk (2002) tested two slabs, 1900x1900x150mm slab with 240x240 columns, which
were strengthened by eight ASTM A325 bolts (19mm diameter) and 6 mm thick steel plates on top
and bottom slab surface around the column. (Figure2.9). The bolts were bonded with concrete using
epoxy. The specimens were subjected to constant vertical load and cyclic lateral load. They found that
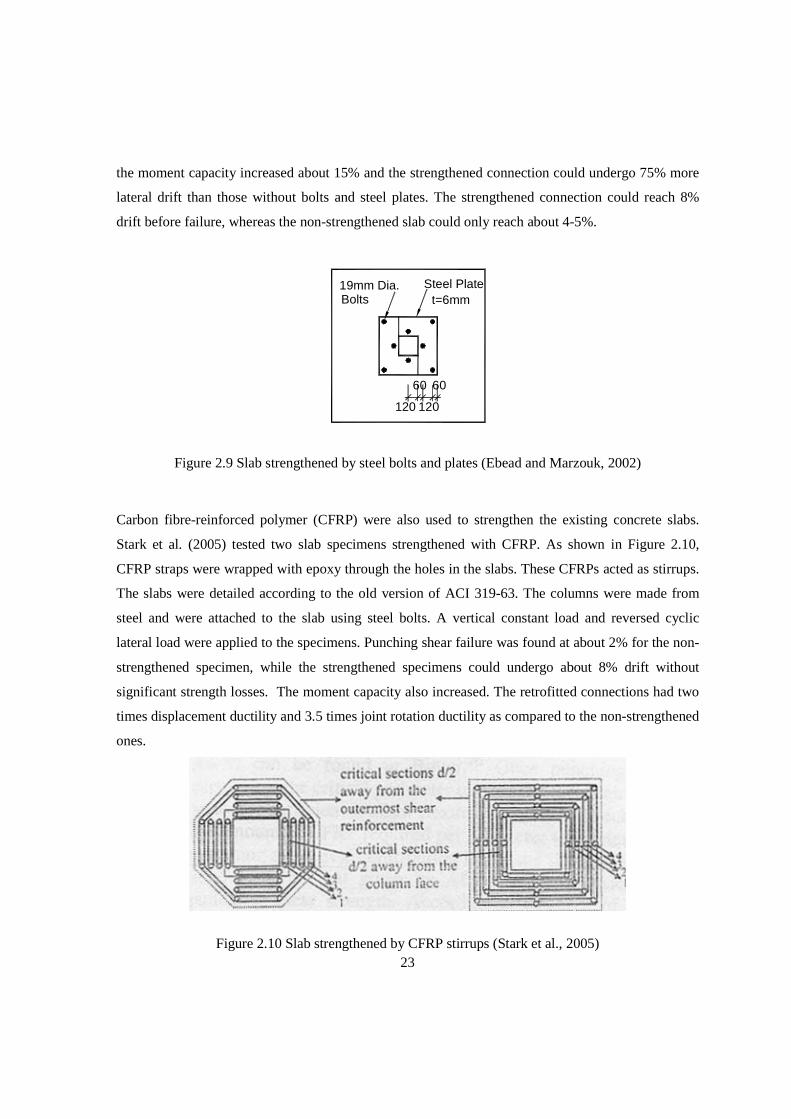
23
the moment capacity increased about 15% and the strengthened connection could undergo 75% more
lateral drift than those without bolts and steel plates. The strengthened connection could reach 8%
drift before failure, whereas the non-strengthened slab could only reach about 4-5%.
120
60 60
120
Steel Platet=6mmBolts
19mm Dia.
Figure 2.9 Slab strengthened by steel bolts and plates (Ebead and Marzouk, 2002)
Carbon fibre-reinforced polymer (CFRP) were also used to strengthen the existing concrete slabs.
Stark et al. (2005) tested two slab specimens strengthened with CFRP. As shown in Figure 2.10,
CFRP straps were wrapped with epoxy through the holes in the slabs. These CFRPs acted as stirrups.
The slabs were detailed according to the old version of ACI 319-63. The columns were made from
steel and were attached to the slab using steel bolts. A vertical constant load and reversed cyclic
lateral load were applied to the specimens. Punching shear failure was found at about 2% for the non-
strengthened specimen, while the strengthened specimens could undergo about 8% drift without
significant strength losses. The moment capacity also increased. The retrofitted connections had two
times displacement ductility and 3.5 times joint rotation ductility as compared to the non-strengthened
ones.
Figure 2.10 Slab strengthened by CFRP stirrups (Stark et al., 2005)
24
2.4 Analytical Models for Punching Shear
In the last few decades, intensive research work was done related to punching shear. Based on the
experiments and analysis of the slab behaviour, several analytical models have been proposed. Some
of them formed the basis of the design formulae employed in various structural codes and
specifications. This section examines the background of the important models for punching shear.
(1) Punching Shear Model by Kinnunen and Nylander
Kinnunen and Nylander (1960) proposed a punching shear model based on static gravity-type test
results of circular slab-column connections, with circular column and circular and radial
reinforcements. Kinnunen (1963) developed the model suitable for circular slabs with two way
orthogonal reinforcement mats on the tension side and considered dowel forces of the reinforcement.
As shown in Figure 2.11, the part outside the inclined crack is divided into sectors bounded by the
inclined crack, radial cracks and the perimeter of the slab specimen. The sectors as shown in Figure
2.12b, which are assumed to be rigid and supported by the imaginary conical concrete shell, rotate
around the root of the inclined cracks. The conical shell, which supports all the sectors, is shown in
Figure 2.12 and the shaded area in Figure 2.12 c.
Figure 2.11 Assumption of conical shell and rigid sectors by Kinnunen and Nylander model
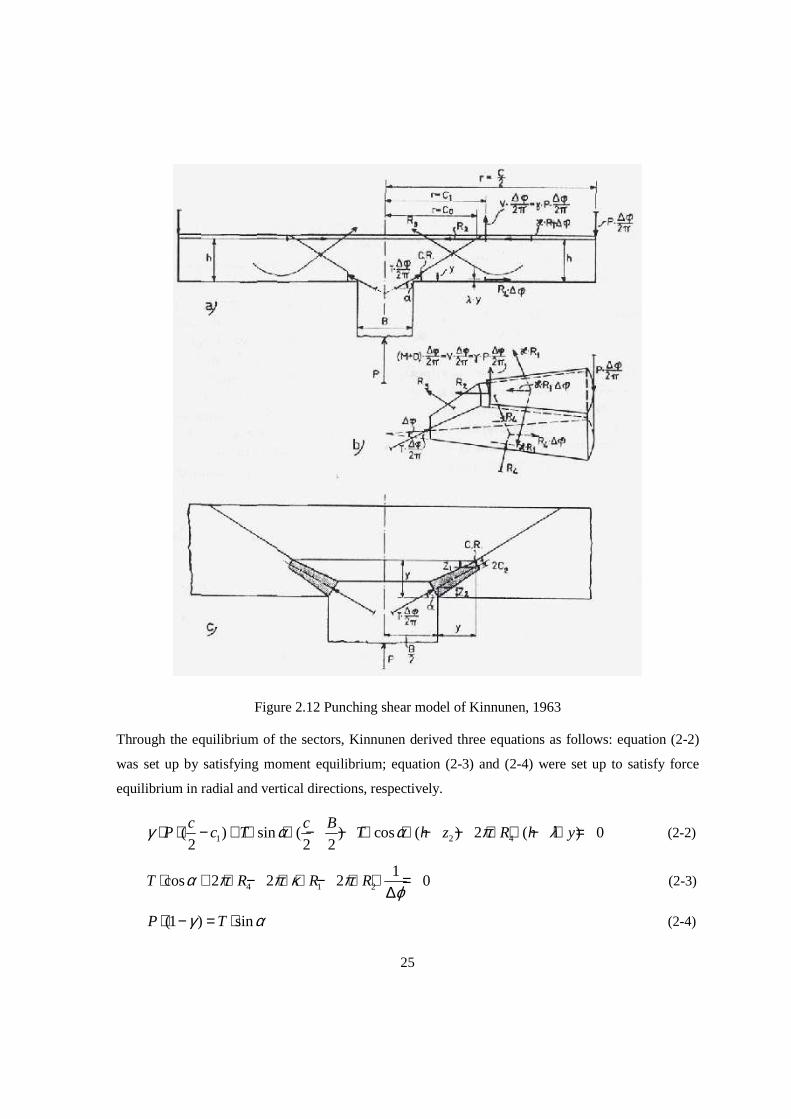
25
Figure 2.12 Punching shear model of Kinnunen, 1963
Through the equilibrium of the sectors, Kinnunen derived three equations as follows: equation (2-2)
was set up by satisfying moment equilibrium; equation (2-3) and (2-4) were set up to satisfy force
equilibrium in radial and vertical directions, respectively.
1 2 4( ) sin ( ) cos ( ) 2 ( ) 02 2 2
c c BP c T T h z R h yγ α α π λ⋅ ⋅ − + ⋅ ⋅ − − ⋅ ⋅ − − ⋅ ⋅ − ⋅ = (2-2)
4 1 2
1cos 2 2 2 0T R R Rα π π κ π
ϕ⋅ + ⋅ − ⋅ ⋅ − ⋅ ⋅ =
∆ (2-3)
(1 ) sinP Tγ α⋅ − = ⋅ (2-4)
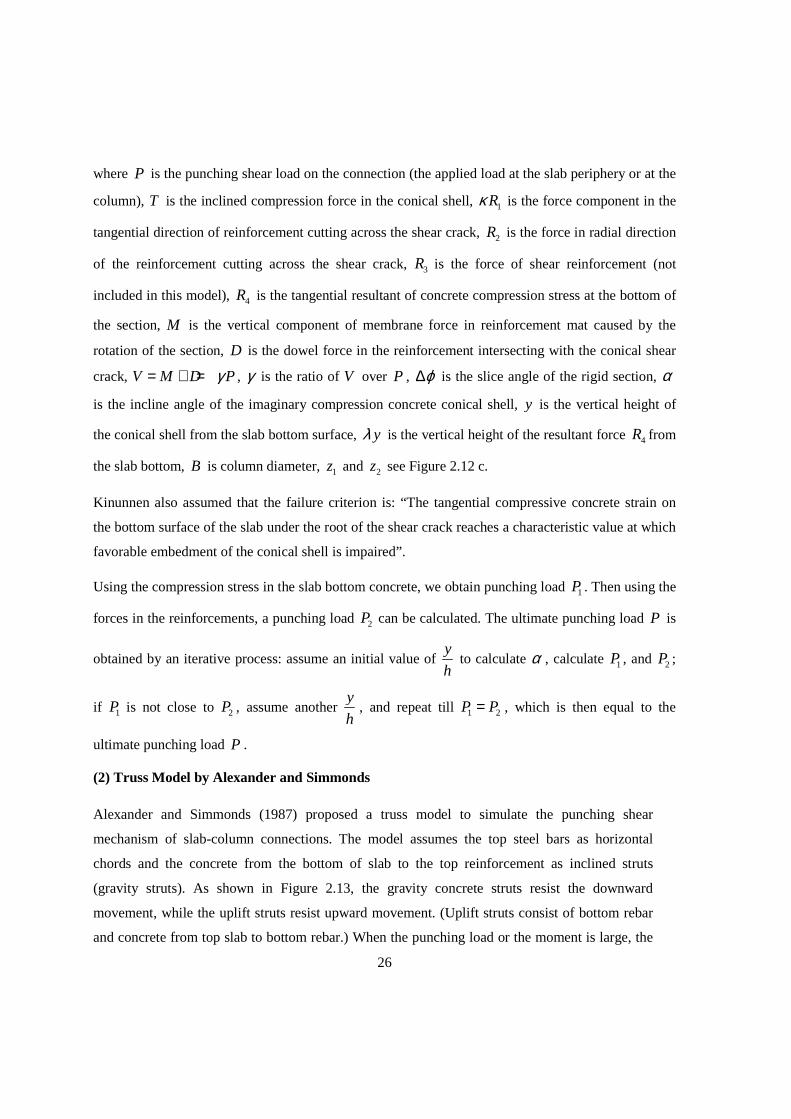
26
where P is the punching shear load on the connection (the applied load at the slab periphery or at the
column), T is the inclined compression force in the conical shell, 1Rκ is the force component in the
tangential direction of reinforcement cutting across the shear crack, 2R is the force in radial direction
of the reinforcement cutting across the shear crack, 3R is the force of shear reinforcement (not
included in this model), 4R is the tangential resultant of concrete compression stress at the bottom of
the section, M is the vertical component of membrane force in reinforcement mat caused by the
rotation of the section, D is the dowel force in the reinforcement intersecting with the conical shear
crack, V M D Pγ= + = , γ is the ratio of V over P , ϕ∆ is the slice angle of the rigid section, α
is the incline angle of the imaginary compression concrete conical shell, y is the vertical height of
the conical shell from the slab bottom surface, yλ is the vertical height of the resultant force 4R from
the slab bottom, B is column diameter, 1z and 2z see Figure 2.12 c.
Kinunnen also assumed that the failure criterion is: “The tangential compressive concrete strain on
the bottom surface of the slab under the root of the shear crack reaches a characteristic value at which
favorable embedment of the conical shell is impaired”.
Using the compression stress in the slab bottom concrete, we obtain punching load 1P . Then using the
forces in the reinforcements, a punching load 2P can be calculated. The ultimate punching load P is
obtained by an iterative process: assume an initial value of y
h to calculate α , calculate 1P , and 2P ;
if 1P is not close to 2P , assume another y
h, and repeat till 1 2P P= , which is then equal to the
ultimate punching load P .
(2) Truss Model by Alexander and Simmonds
Alexander and Simmonds (1987) proposed a truss model to simulate the punching shear
mechanism of slab-column connections. The model assumes the top steel bars as horizontal
chords and the concrete from the bottom of slab to the top reinforcement as inclined struts
(gravity struts). As shown in Figure 2.13, the gravity concrete struts resist the downward
movement, while the uplift struts resist upward movement. (Uplift struts consist of bottom rebar
and concrete from top slab to bottom rebar.) When the punching load or the moment is large, the
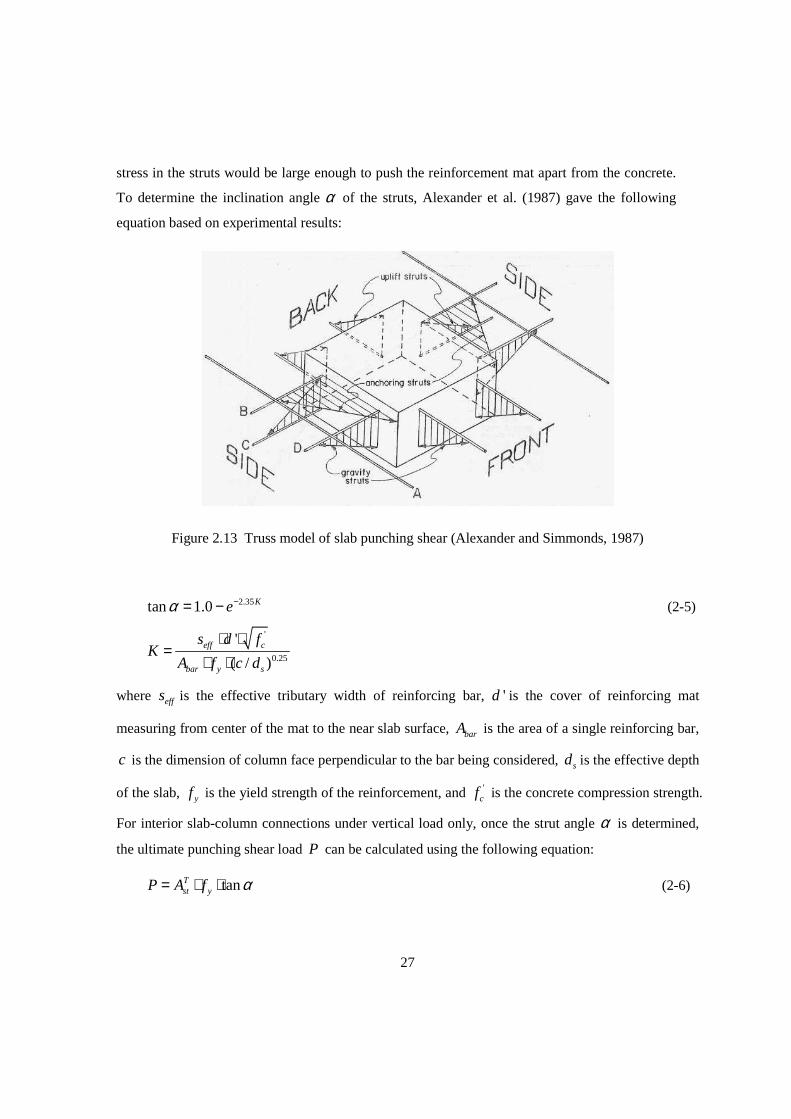
27
stress in the struts would be large enough to push the reinforcement mat apart from the concrete.
To determine the inclination angle α of the struts, Alexander et al. (1987) gave the following
equation based on experimental results:
Figure 2.13 Truss model of slab punching shear (Alexander and Simmonds, 1987)
2.35tan 1.0 Keα −= − (2-5)
'
0.25
'
( / )eff c
bar y s
s d fK
A f c d
⋅ ⋅=
⋅ ⋅
where effs is the effective tributary width of reinforcing bar, 'd is the cover of reinforcing mat
measuring from center of the mat to the near slab surface, barA is the area of a single reinforcing bar,
c is the dimension of column face perpendicular to the bar being considered, sd is the effective depth
of the slab, yf is the yield strength of the reinforcement, and 'cf is the concrete compression strength.
For interior slab-column connections under vertical load only, once the strut angle α is determined,
the ultimate punching shear load P can be calculated using the following equation:
tanTst yP A f α= ⋅ ⋅ (2-6)
28
where TstA is the section area of flexural reinforcements that are close enough to the column to
participate as a shear strut.
(3) Bond model by Alexander and Simmonds
On the basis of their truss model, Alexander and Simmonds (1992) proposed a bond model for
concentric punching shear. In the truss model, the shear is resisted by vertical component of the force
of the straight-line compression struts. However, tests show that a curved arch is more consistent with
strain measurements than the straight-line strut (Figure 2.14). The shear is transferred to the column
by the curved, radial compression arch. Let T be the tension force in the reinforcing bar as shown in
Figure 2.14. The shear force V can be expressed as
( ) ( ) ( )d T jd d T d jdV jd T
dx dx dx
⋅= = +
where jd is the moment arm, ( )d T
jddx
is the beam action part in which tension force in the rebar
varies with location x (stress gradient in the rebar), whereas ( )d jd
Tdx
is the arching action part in
which the arm jd changes with x.
Figure 2.14 Curved compression strut (adapted from Alexander et al., 1992)
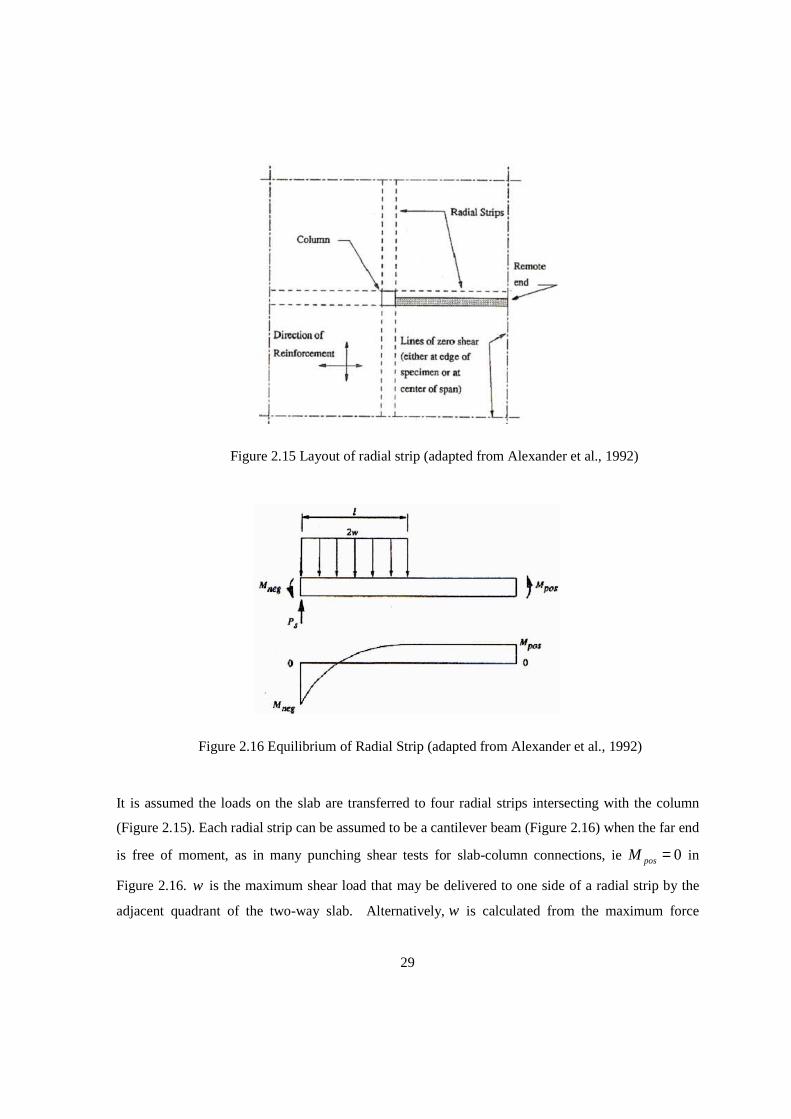
29
Figure 2.15 Layout of radial strip (adapted from Alexander et al., 1992)
Figure 2.16 Equilibrium of Radial Strip (adapted from Alexander et al., 1992)
It is assumed the loads on the slab are transferred to four radial strips intersecting with the column
(Figure 2.15). Each radial strip can be assumed to be a cantilever beam (Figure 2.16) when the far end
is free of moment, as in many punching shear tests for slab-column connections, ie 0posM = in
Figure 2.16. w is the maximum shear load that may be delivered to one side of a radial strip by the
adjacent quadrant of the two-way slab. Alternatively, w is calculated from the maximum force
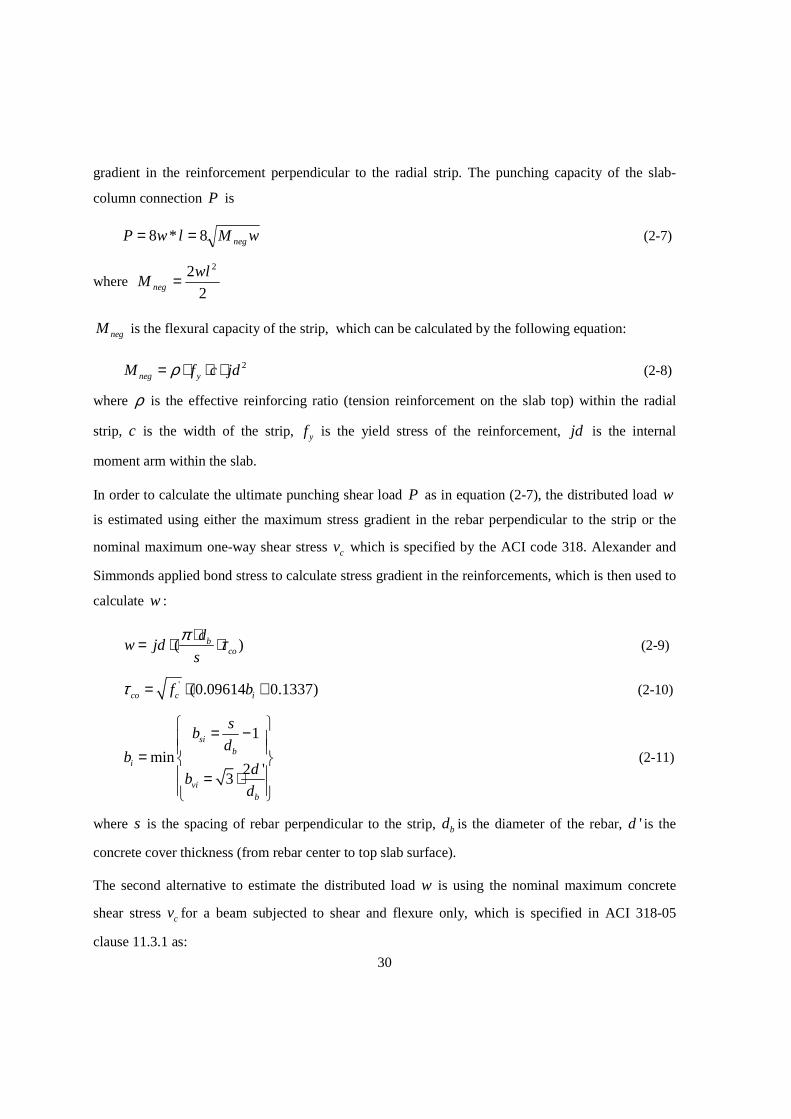
30
gradient in the reinforcement perpendicular to the radial strip. The punching capacity of the slab-
column connection P is
wMlwP neg8*8 == (2-7)
where 2
2 2wlM neg =
negM is the flexural capacity of the strip, which can be calculated by the following equation:
2neg yM f c jdρ= ⋅ ⋅ ⋅ (2-8)
where ρ is the effective reinforcing ratio (tension reinforcement on the slab top) within the radial
strip, c is the width of the strip, yf is the yield stress of the reinforcement, jd is the internal
moment arm within the slab.
In order to calculate the ultimate punching shear load P as in equation (2-7), the distributed load w
is estimated using either the maximum stress gradient in the rebar perpendicular to the strip or the
nominal maximum one-way shear stress cv which is specified by the ACI code 318. Alexander and
Simmonds applied bond stress to calculate stress gradient in the reinforcements, which is then used to
calculate w :
( )bco
dw jd
s
π τ⋅= ⋅ ⋅ (2-9)
' (0.09614 0.1337)co c if bτ = ⋅ + (2-10)
1
min2 '
3
sib
i
vib
sb
db
db
d
= − = = ⋅
(2-11)
where s is the spacing of rebar perpendicular to the strip, bd is the diameter of the rebar, 'd is the
concrete cover thickness (from rebar center to top slab surface).
The second alternative to estimate the distributed load w is using the nominal maximum concrete
shear stress cv for a beam subjected to shear and flexure only, which is specified in ACI 318-05
clause 11.3.1 as:
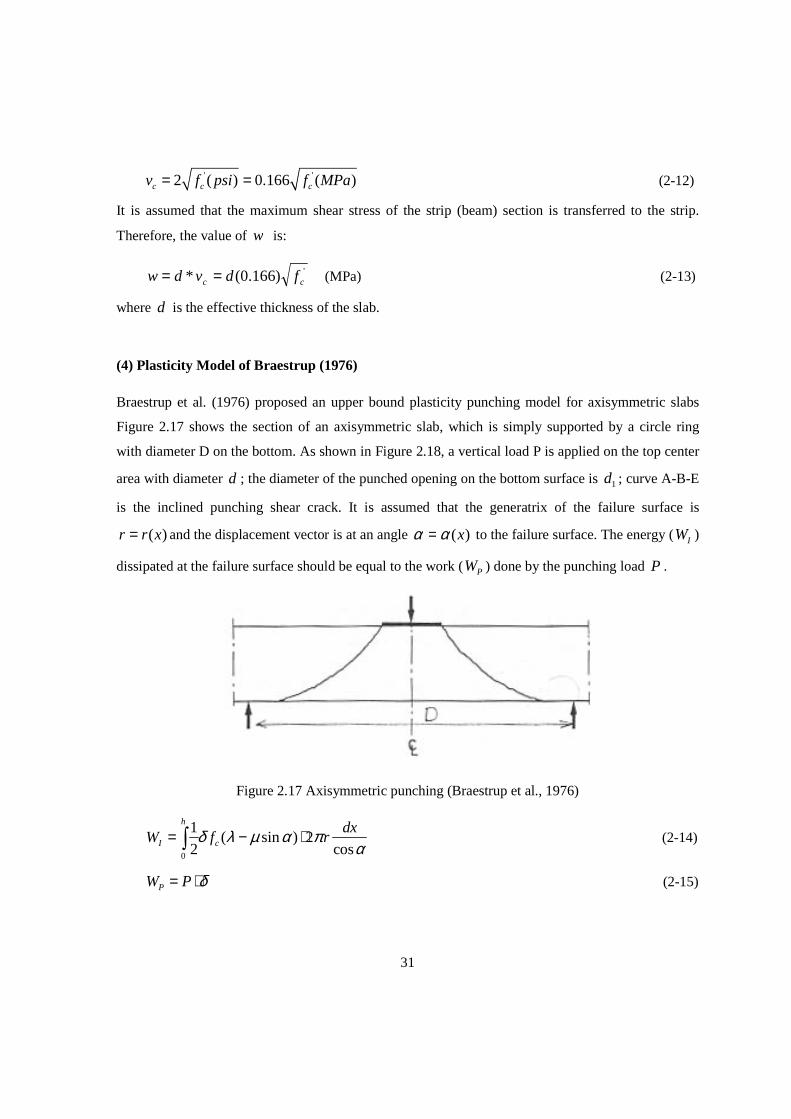
31
' '2 ( ) 0.166 ( )c c cv f psi f MPa= = (2-12)
It is assumed that the maximum shear stress of the strip (beam) section is transferred to the strip.
Therefore, the value of w is:
')166.0(* cc fdvdw == (MPa) (2-13)
where d is the effective thickness of the slab.
(4) Plasticity Model of Braestrup (1976)
Braestrup et al. (1976) proposed an upper bound plasticity punching model for axisymmetric slabs
Figure 2.17 shows the section of an axisymmetric slab, which is simply supported by a circle ring
with diameter D on the bottom. As shown in Figure 2.18, a vertical load P is applied on the top center
area with diameter d ; the diameter of the punched opening on the bottom surface is 1d ; curve A-B-E
is the inclined punching shear crack. It is assumed that the generatrix of the failure surface is
( )r r x= and the displacement vector is at an angle )(xαα = to the failure surface. The energy (IW )
dissipated at the failure surface should be equal to the work ( PW ) done by the punching load P .
Figure 2.17 Axisymmetric punching (Braestrup et al., 1976)
0
1( sin ) 2
2 cos
h
I c
dxW f rδ λ µ α π
α= − ⋅∫ (2-14)
PW P δ= ⋅ (2-15)
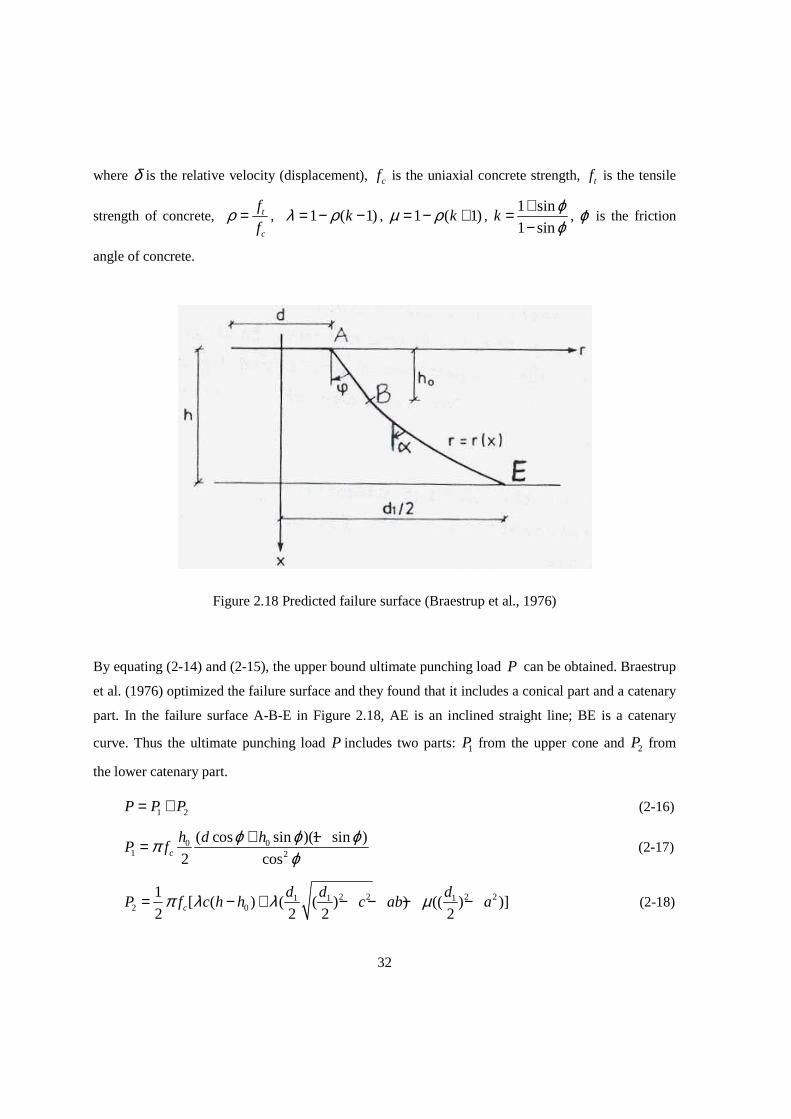
32
where δ is the relative velocity (displacement), cf is the uniaxial concrete strength, tf is the tensile
strength of concrete, t
c
f
fρ = , 1 ( 1)kλ ρ= − − , 1 ( 1)kµ ρ= − + ,
1 sin
1 sink
ϕϕ
+=−
, ϕ is the friction
angle of concrete.
Figure 2.18 Predicted failure surface (Braestrup et al., 1976)
By equating (2-14) and (2-15), the upper bound ultimate punching load P can be obtained. Braestrup
et al. (1976) optimized the failure surface and they found that it includes a conical part and a catenary
part. In the failure surface A-B-E in Figure 2.18, AE is an inclined straight line; BE is a catenary
curve. Thus the ultimate punching load P includes two parts: 1P from the upper cone and 2P from
the lower catenary part.
1 2P P P= + (2-16)
0 01 2
( cos sin )(1 sin )
2 cosc
h d hP f
ϕ ϕ ϕπϕ
+ −= (2-17)
2 2 2 21 1 12 0
1[ ( ) ( ( ) ) (( ) )]
2 2 2 2c
d d dP f c h h c ab aπ λ λ µ= − + − − − − (2-18)
33
where h is the slab depth and 0h is the height of the top cone part of the failure crack,
0 tan2
da h ϕ= + , tanb c ϕ= , 2 2c a b= − .
This model assumes the concrete as a perfectly plastic material. It gives good qualitative explanation
to punching shear failure. The variation of the calculated ultimate punching loads was about 16% as
mentioned in their conclusion.
(5) Shear Friction Model by Dilger (2000) and Dechka (2001)
Based on the shear-friction criterion (Loov, 1978) for beam shear, Dilger (2000) and Dechka (2001)
developed the shear-friction model for punching shear of reinforced concrete slabs with or without
shear reinforcements, under concentric load. According to shear-friction criterion, the shear stress
v on a concrete failure surface is related to the normal stress σ on that surface and the compressive
strength 'cf , which can be expressed as equation (2-19):
'cv k fσ= ⋅ (2-19)
where v is the average shear stress on the shear failure plane, σ is the normal stress on that plane,
'cf is the 28-day compressive cylinder strength, k is the correlation coefficient determined from
experiment data. In order to obtain reasonable results, they modified equation (2-19) by adding the
concrete tension strength tf to σ :
'( )t cv k f fσ= + ⋅ (2-20)
Two forms of the shear-friction model were developed: general model and the simplified model. The
general model is suitable for computer programming while the simplified model can be used for hand
calculation. Figure 2.19 shows the free body diagram of the slab-column connection for general
model. The failure surface includes eight facets. The ultimate punching shear capacity ,sf genV , as in
equation (2-21), is the summation of the shear capacity of each facet which is obtained by
incorporating equilibrium equations of the facet into equation (2-20).
2 2, 2
1 cot 4 cot cot cot2
tsf gen v
rK TV T T
K kθ θ θ θ
= + + + − − + ∑ (2-21)
34
2 '0.5 ( )c bot topK k f b b h= +
1 't
c
fr
f=
T = tension force in the flexural reinforcements
vT =tension force in each shear stud
θ = angle of the failure facet
h = slab thickness
botb = bottom edge length of the facet
topb = top edge length of the facet
botx =the distance between column face and the bottom of the failure facet
By assuming a suitable range of botx and angle θ , a series of ,sf genV can be obtained using computer
program. The minimum ,sf genV and its corresponding θ are the ultimate punching shear capacity.
The simple form of shear-friction model, as in equation (2-22), was derived from the general model:
( )2
,, 2
4
4s effc t
sf simple o vs yv
x hk f h rhV l x A f
x k s hπ′ = + + +
(2-22)
0 02( ) 4 2( ( 1) )x yl c c s n s= + + + − ,
,2
2o
vs yv s efft
c
hlkx
A f hr
f h sπ
=+
′
where Vsf,simple is the nominal shear force resisted by the connection as given by shear friction,
,s effh = average effective length of the stud, ,x yc c are column dimensions, 0,s s are spacing of bolts,
n is the number of shear studs, vsA is the section area of the stud stem, yvf is the yield strength of
the shear studs.
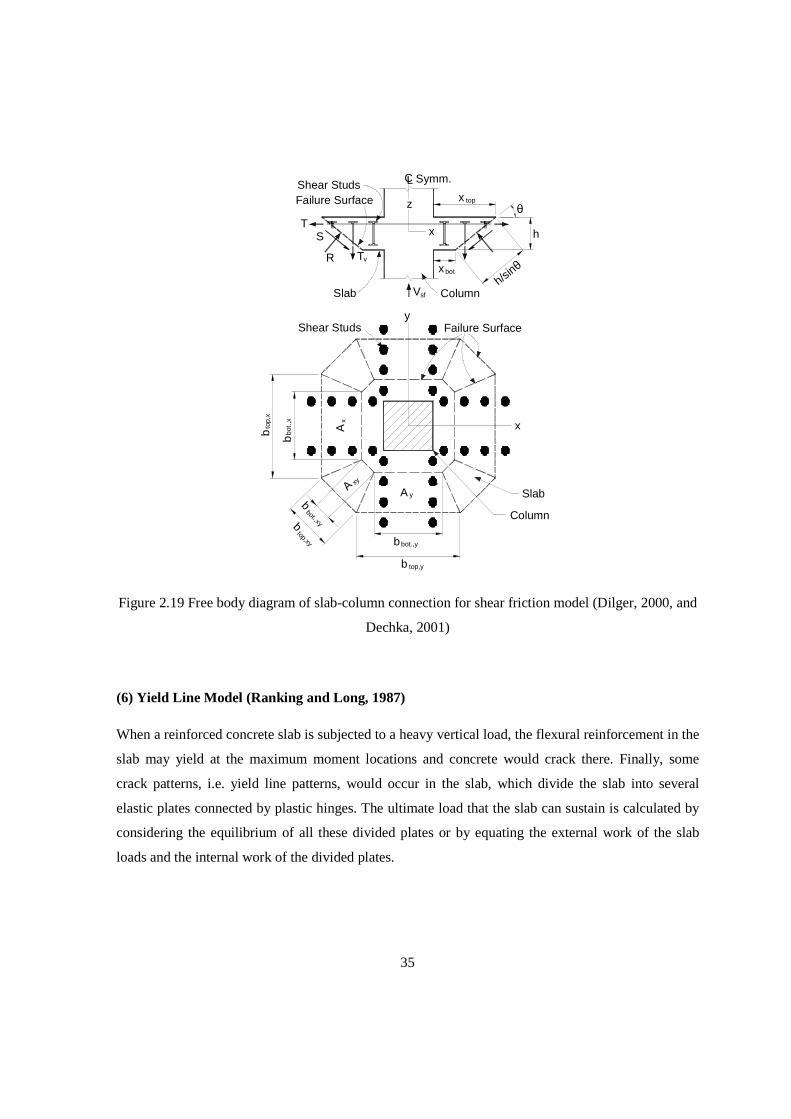
35
θtop
Column
Slab
x
Symm.LCShear Studs
x
z
bot
sfV
x
ST
v
Slab
R T
Failure Surface
Shear Studsx
yAxy
bbot.,xy
A
Atop,
x
bot.
,x
b
b
y
x
Column
Failure Surface
h
h/sinθ
top,y
top,xy bot.,y
b
b
b
Figure 2.19 Free body diagram of slab-column connection for shear friction model (Dilger, 2000, and
Dechka, 2001)
(6) Yield Line Model (Ranking and Long, 1987)
When a reinforced concrete slab is subjected to a heavy vertical load, the flexural reinforcement in the
slab may yield at the maximum moment locations and concrete would crack there. Finally, some
crack patterns, i.e. yield line patterns, would occur in the slab, which divide the slab into several
elastic plates connected by plastic hinges. The ultimate load that the slab can sustain is calculated by
considering the equilibrium of all these divided plates or by equating the external work of the slab
loads and the internal work of the divided plates.
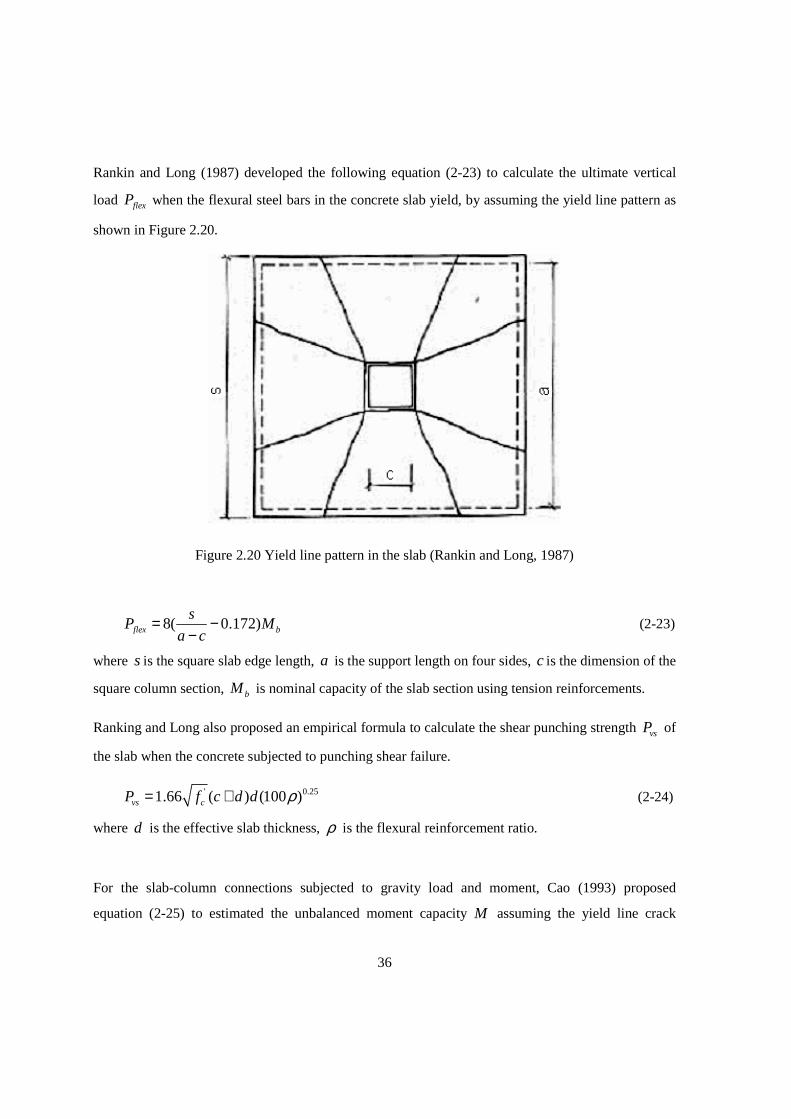
36
Rankin and Long (1987) developed the following equation (2-23) to calculate the ultimate vertical
load flexP when the flexural steel bars in the concrete slab yield, by assuming the yield line pattern as
shown in Figure 2.20.
Figure 2.20 Yield line pattern in the slab (Rankin and Long, 1987)
8( 0.172)flex b
sP M
a c= −
− (2-23)
where s is the square slab edge length, a is the support length on four sides, c is the dimension of the
square column section, bM is nominal capacity of the slab section using tension reinforcements.
Ranking and Long also proposed an empirical formula to calculate the shear punching strength vsP of
the slab when the concrete subjected to punching shear failure.
' 0.251.66 ( ) (100 )vs cP f c d d ρ= + (2-24)
where d is the effective slab thickness, ρ is the flexural reinforcement ratio.
For the slab-column connections subjected to gravity load and moment, Cao (1993) proposed
equation (2-25) to estimated the unbalanced moment capacity M assuming the yield line crack
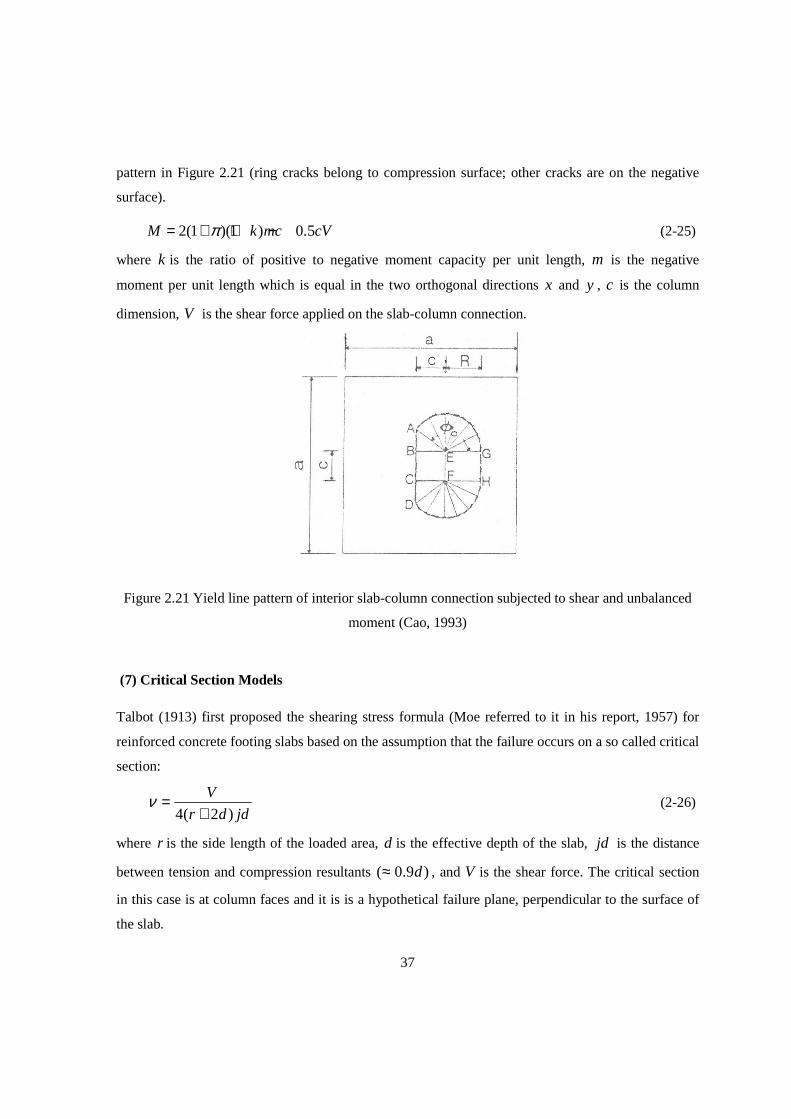
37
pattern in Figure 2.21 (ring cracks belong to compression surface; other cracks are on the negative
surface).
2(1 )(1 ) 0.5M k mc cVπ= + + − (2-25)
where k is the ratio of positive to negative moment capacity per unit length, m is the negative
moment per unit length which is equal in the two orthogonal directions x and y , c is the column
dimension, V is the shear force applied on the slab-column connection.
Figure 2.21 Yield line pattern of interior slab-column connection subjected to shear and unbalanced
moment (Cao, 1993)
(7) Critical Section Models
Talbot (1913) first proposed the shearing stress formula (Moe referred to it in his report, 1957) for
reinforced concrete footing slabs based on the assumption that the failure occurs on a so called critical
section:
jddr
V
)2(4 +=ν (2-26)
where r is the side length of the loaded area, d is the effective depth of the slab, jd is the distance
between tension and compression resultants )9.0( d≈ , and V is the shear force. The critical section
in this case is at column faces and it is is a hypothetical failure plane, perpendicular to the surface of
the slab.
38
Forsell and Holmberg assumed (1946) that the shearing stresses are parabolically distributed across
the depth of slab. They proposed the shear stress formula:
bh
V5.1=ν (2-27)
where b is the perimeter length of the critical section which is at 2/h from the column faces, h is
the slab thickness.
Moe (1961) suggested that the critical section should be at a column face. Based on his testing results
of 42 slab-column specimens and others’ testing results, Moe proposed the ultimate shear strength
uv (psi) as
flexc
cu
uVfbd
fd
r
bd
Vv
/25.51
)075.01(15
'
'
+
−== (2-28)
where uV is ultimate shear force (lb), flexV is a shear force at ultimate flexural (yield line) capacity of
the slab (lb) , r is the column size (in.), b is the column perimeter length (in.), and d is the effective
slab thickness (in.).
Based mainly on Moe’s work, the ACI-ASCE Committee 326 (1962) specified the critical section at
2/d from the column face to simplify the equation (2-28). They proposed the following equation to
calculate the ultimate punching shear strength of the concrete slab, which forms the basis of the
current ACI code provision on punching shear design:
'
0
0.4 cu
u fdb
Vv ==
where 0b is perimeter length of the critical section at 2/d from the column face, other variables are
same as those in equation (2-20).
39
2.5 Punching Shear Design
This section examines the punching shear design procedures of some important structural codes of
practice. All codes adopt an approach involving a critical section, which is at a certain distance from
the column perimeter. The basic rule is that the factored shear stress on the critical section should be
less than the nominal shear capacity. Canadian code CSA A23.3-04 and the American Code (ACI
318-05) have similar provisions for punching shear. In both codes, the critical section is 0.5d from the
column faces. In other codes such as Eurocode 2 (2004) and CEB-FIB Model Code 90, the positions
of the critical section are different. In all codes, shear capacity has contributions from concrete and
the shear reinforcement. Both ACI318-05 and CSA A23.3-04 do not account for the effect of flexural
reinforcement in calculation of the shear resistance, while the European codes consider the effect.
2.5.1 Punching Shear Design Requirements in CSA A23 .3-04
According to the CSA A23.3-04 code, for two way slab-column connections, the factored shear stress
fv on the critical section (the perimeter at a distance 2
d from column faces, Figure 2.22) should be
no more than the factored shear resistancerv .
scrf vvvv +=≤ (2-29)
where cv is the factored shear resistance from concrete, sv is the factored shear resistance form shear
reinforcements. Factored shear resistance of the critical section without shear reinforcement is:
+=+
+=+
=
=
)19.0(65.0)19.0(
)2
1(124.0)2
1(19.0
247.038.0
min
0
'
0
'
''
''
b
df
b
df
ff
ff
v
sc
scc
cc
ccc
ccc
c
ααλφ
ββλφ
λφ
(MPa) (2-30)
Where 1λ = for regular concrete, cφ =0.65 is the reduction factor for concrete strength, cβ is the ratio
of the long side over short side of the column, ob is the perimeter length of the critical section. sα =4,
3, 2 for interior, edge, and corner column, respectively. Equations in (2-30) are equivalent to those in
ACI 318-05.
40
If cv from equations in (2-30) is less than fv , shear reinforcements are required. For slabs with shear
reinforcements, the shear resistance is also as scr vvv += , but cv is calculated as in equation (2-32).
For slabs with shear reinforcement, factored shear resistance from shear reinforcement is :
sb
fAv yvvss
s0
φ= (2-31)
where 85.0=sφ is reduction factor of steel bar. vsA is the section area of the shear reinforcement,
yvf is the strength of the shear reinforcement, s is the radial spacing of the shear reinforcement.
For concrete with headed shear reinforcement (shear studs), shear resistance from concrete in the
shear reinforced zone is
'28.0 ccc fv λφ= (2-32a)
Maximum shear resistance of section with headed shear reinforcement should satisfy the following
equation:
'max 75.0 ccr fv λφ≤ (2-33a)
For concrete with stirrup shear reinforcement, shear resistance from concrete in the shear reinforced
zone is
'19.0 ccc fv λφ= (2-32b)
Maximum shear resistance of section with stirrup shear reinforcement should satisfy the following
equation:
'max 55.0 ccr fv λφ≤ (2-33b)
To calculate the factored shear stressfv by gravity load and unbalanced moment in the perimeter of
the critical section, the following equation is applied:
y
fv
x
fvff J
eM
J
eM
db
Vv
+
+=
γγ
0
(2-34)
where fV is the vertical shear force. fM is the unbalanced moment in yx, direction, which is
transferred by slab shear and flexural stresses. vγ is the fraction of the moment transferred by shear,
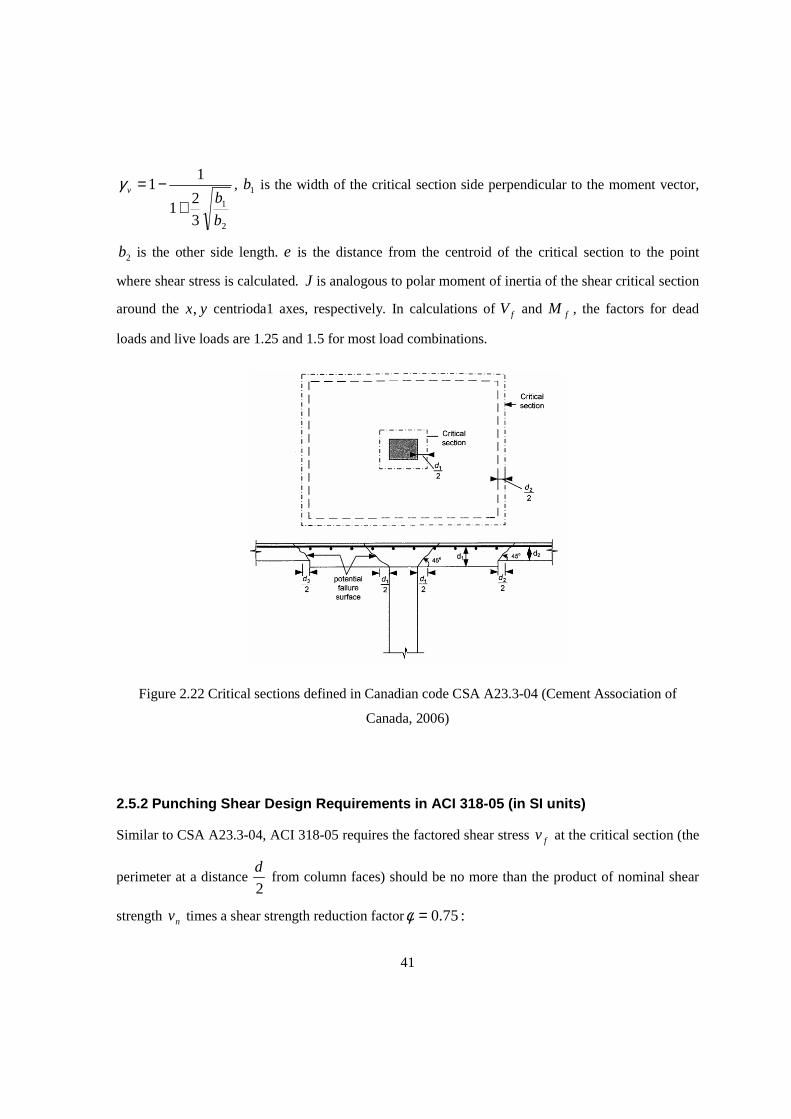
41
2
1
3
21
11
b
bv
+−=γ , 1b is the width of the critical section side perpendicular to the moment vector,
2b is the other side length. e is the distance from the centroid of the critical section to the point
where shear stress is calculated. J is analogous to polar moment of inertia of the shear critical section
around the yx, centrioda1 axes, respectively. In calculations of fV and fM , the factors for dead
loads and live loads are 1.25 and 1.5 for most load combinations.
Figure 2.22 Critical sections defined in Canadian code CSA A23.3-04 (Cement Association of
Canada, 2006)
2.5.2 Punching Shear Design Requirements in ACI 318 -05 (in SI units)
Similar to CSA A23.3-04, ACI 318-05 requires the factored shear stress fv at the critical section (the
perimeter at a distance 2
d from column faces) should be no more than the product of nominal shear
strength nv times a shear strength reduction factor :75.0=φ
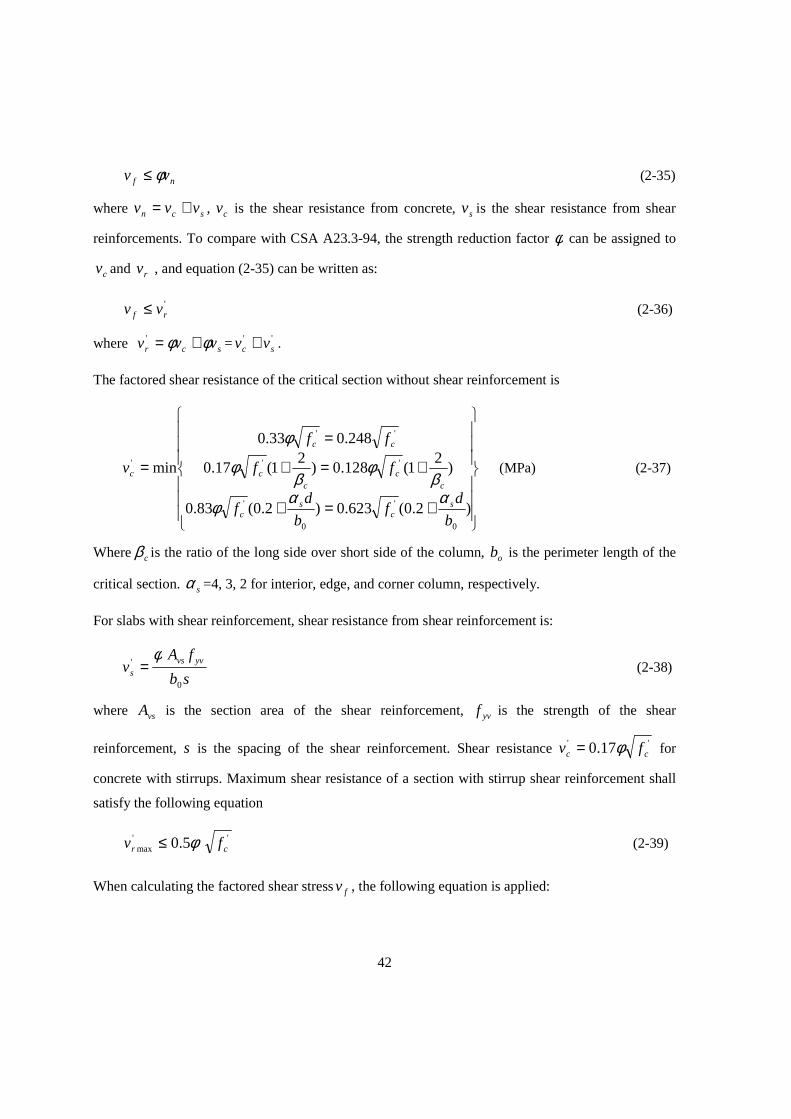
42
nf vv φ≤ (2-35)
where scn vvv += , cv is the shear resistance from concrete, sv is the shear resistance from shear
reinforcements. To compare with CSA A23.3-94, the strength reduction factor φ can be assigned to
cv and rv , and equation (2-35) can be written as:
'rf vv ≤ (2-36)
where scr vvv φφ +=' = ''sc vv + .
The factored shear resistance of the critical section without shear reinforcement is
+=+
+=+
=
=
)2.0(623.0)2.0(83.0
)2
1(128.0)2
1(17.0
248.033.0
min
0
'
0
'
''
''
'
b
df
b
df
ff
ff
v
sc
sc
cc
cc
cc
c
ααφ
βφ
βφ
φ
(MPa) (2-37)
Where cβ is the ratio of the long side over short side of the column, ob is the perimeter length of the
critical section. sα =4, 3, 2 for interior, edge, and corner column, respectively.
For slabs with shear reinforcement, shear resistance from shear reinforcement is:
sb
fAv yvvs
s0
'φ
= (2-38)
where vsA is the section area of the shear reinforcement, yvf is the strength of the shear
reinforcement, s is the spacing of the shear reinforcement. Shear resistance '' 17.0 cc fv φ= for
concrete with stirrups. Maximum shear resistance of a section with stirrup shear reinforcement shall
satisfy the following equation
''max 5.0 cr fv φ≤ (2-39)
When calculating the factored shear stressfv , the following equation is applied:
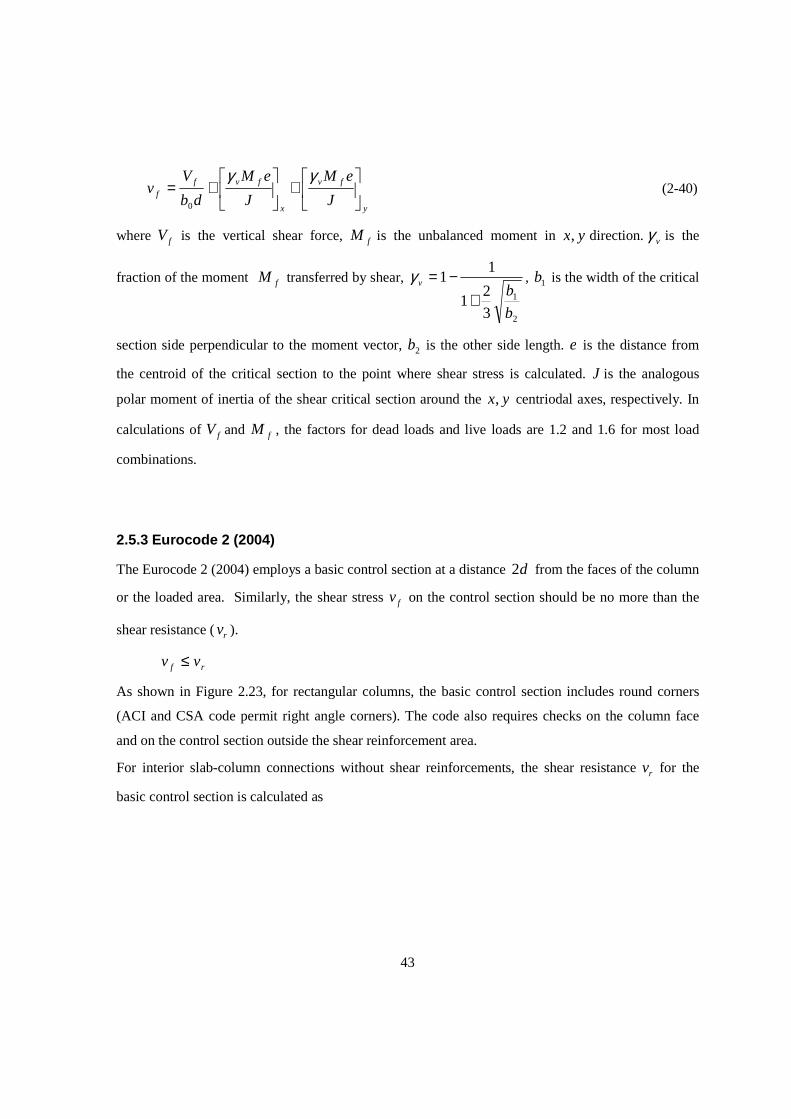
43
y
fv
x
fvff J
eM
J
eM
db
Vv
+
+=
γγ
0
(2-40)
where fV is the vertical shear force, fM is the unbalanced moment in yx, direction. vγ is the
fraction of the moment fM transferred by shear,
2
1
3
21
11
b
bv
+−=γ , 1b is the width of the critical
section side perpendicular to the moment vector, 2b is the other side length. e is the distance from
the centroid of the critical section to the point where shear stress is calculated. J is the analogous
polar moment of inertia of the shear critical section around the yx, centriodal axes, respectively. In
calculations of fV and fM , the factors for dead loads and live loads are 1.2 and 1.6 for most load
combinations.
2.5.3 Eurocode 2 (2004)
The Eurocode 2 (2004) employs a basic control section at a distance 2d from the faces of the column
or the loaded area. Similarly, the shear stress fv on the control section should be no more than the
shear resistance (rv ).
rf vv ≤
As shown in Figure 2.23, for rectangular columns, the basic control section includes round corners
(ACI and CSA code permit right angle corners). The code also requires checks on the column face
and on the control section outside the shear reinforcement area.
For interior slab-column connections without shear reinforcements, the shear resistance rv for the
basic control section is calculated as
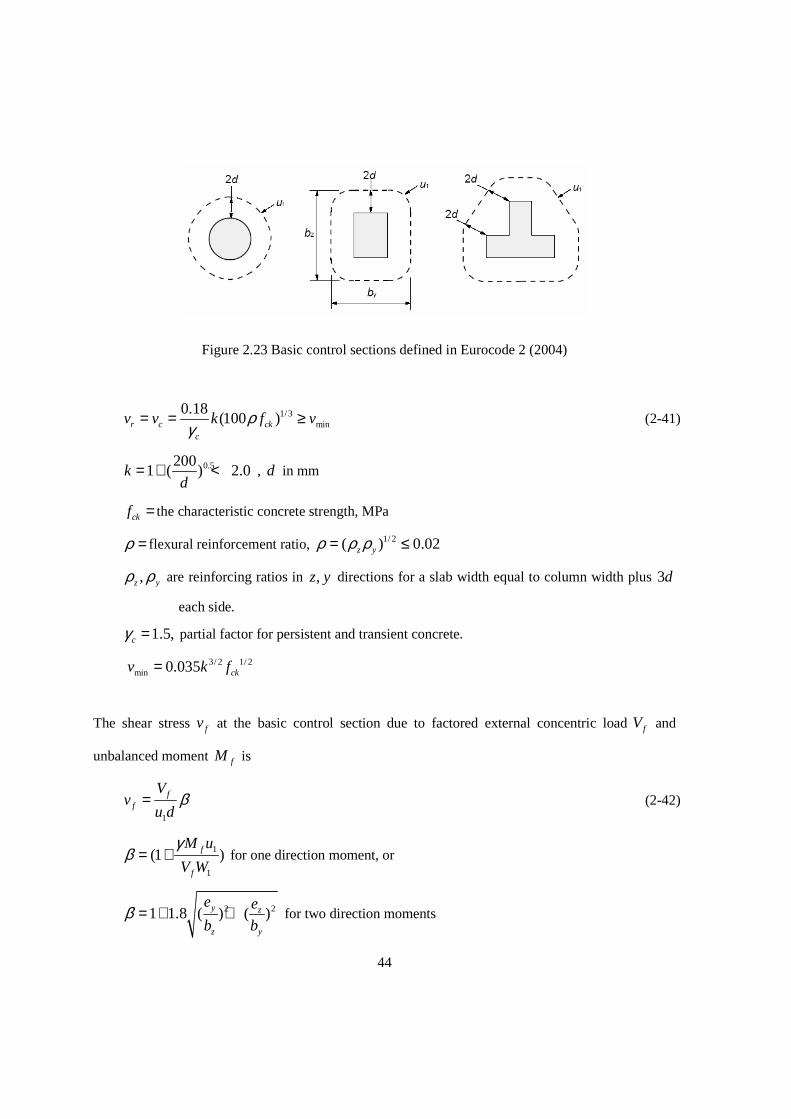
44
Figure 2.23 Basic control sections defined in Eurocode 2 (2004)
1/3min
0.18(100 )r c ck
c
v v k f vργ
= = ≥ (2-41)
0.52001 ( ) 2.0k
d= + < , d in mm
ckf = the characteristic concrete strength, MPa
ρ = flexural reinforcement ratio, 1/ 2( ) 0.02z yρ ρ ρ= ≤
,z yρ ρ are reinforcing ratios in ,z y directions for a slab width equal to column width plus 3d
each side.
1.5,cγ = partial factor for persistent and transient concrete.
3/ 2 1/ 2min 0.035 ckv k f=
The shear stress fv at the basic control section due to factored external concentric load fV and
unbalanced moment fM is
1
ff
Vv
u dβ= (2-42)
1
1
(1 )f
f
M u
V W
γβ = + for one direction moment, or
2 21 1.8 ( ) ( )y z
z y
e e
b bβ = + + for two direction moments
45
1
1 0
uW edl= ∫
where 1u is the length of the basic control section length, γ is the fraction factor of fM , ( 0.6γ =
for rectangular column), ,y zb b are the dimensions of the basic control perimeter (Figure 2.23), ,y ze e
are the eccentricities f
f
M
V along y and z axes respectively , (ye results from a moment from z axis).
e is the distance of dl from the moment axis.
If f cv v> , shear reinforcement is required. The shear resistance strength rv can be calculated as
following:
,1
10.75 1.5( ) ( )sinr c sw ywd ef
r
dv v A f
s u dα= + (2-43)
where cv is calculated as in equation (2-41), rs is the radial spacing of shear reinforcement, d is the
effective depth of the slab, swA is the section area of all shear reinforcements in one perimeter,
, 250 0.25ywd ef ywdf d f= + ≤ , ywdf is the design yield strength of the shear reinforcements, 1u is the
length of the basic control section length, α is the angle between the shear reinforcement and the
slab plane.
At the column face, the shear stress fv due to fV and fM shall be no more than the maximum
punching shear resistance maxrv as following.
max 0.5r cdv fν= (2-44)
0.6(1 )250
ckfν = − (2-45)
/cd ck cf f γ=
where ckf is the characteristic compressive cylinder strength of concrete at 28 days, 1.5cγ = . For
interior columns, the shear stress fv at the column face is
0
ff
Vv
u dβ= (2-46)
46
where 0u is the length of column periphery (for interior column), β is calculated as in equation (2-
42).
2.6 Seismic Requirements for Design of Flat Slab-Co lumn Structures
In addition to the punching shear provisions described in the above Section 2.5, some codes provide
special provisions for seismic punching shear requirements.
2.6.1 National Building Code of Canada (NBCC 2005)
NBCC 2005 requires that the primary lateral load resistant system should not be a flat slab-column
structure when the building is more than three stories. NBCC (2005) also requires that lateral inter-
storey drift ratio should not exceed 1.0% for post-disaster structures, 2.0% for high importance
buildings, and 2.5% for other buildings.
2.6.2 Seismic Requirements of CSA 23.3-04
Clause 21.12.3 in the Canadian structural code CSA 23.3-04 requires: for slab column connections
subjected to seismic loading, if the shear stress produced by gravity load only is greater than E cR v ,
shear reinforcement should be provided. cv is the shear resistance from concrete (Eq. 2-30) and ER is
calculated using the following formula:
0.850.005( ) 1.0E
i
Rδ
= ≤ (2-47)
where iδ is the inter-story drift ratio, 0.025iδ ≤ .
When shear reinforcements are required, it is required that the following relation should be satisfied.
Er
VR
V≤ (2-48)
where V is the concentric external shear force, rV is the factored shear force resistance. rV includes
concrete resistance cV calculated using 0.5cv and the shear resistance by shear reinforcements.
The code also states that the shear reinforcements shall extend a minimum of 4d beyond the face of
the column.
47
2.6.3 ACI 318-05 Seismic Requirements for Slab-colu mn Structures
The American Concrete Institute Code, ACI 318-05 uses the gravity shear ratio VR in Clause 21.11.5
dbv
VVR
nc
uf
0φ= (2-51)
where
ncv is the nominal shear strength provided by the concrete (stress unit)
ufV the factored shear force due to gravity loading ( )2.00.12.1 SLDU ++=
The maximum story drift ratio, DR, when there is no shear reinforcement, is
VRDR *05.0035.0 −= )6.0( <VR
005.0=DR )6.0( ≥VR
If DR can not be satisfied, the slab needs shear reinforcement or larger thickness. Minimum shear
reinforcement should be
'
0 12
5.3c
yvvs f
sb
fAv ≥= (MPa) (2-53)
2.6.4 FEMA 356 Requirements
FEMA 356 Prestandard and Commentary for the Seismic Rehabilitation of Buildings (2000) requires
that the structure shall satisfy both global level and member level criteria according to the
performance level of the structure. There are three structural performance levels: Immediate
Occupancy (IO), Life Safety (LS), and Collapse Prevention (CP). Global level criteria for RC frames
are:
IO: allows 1% maximum interstory drift
LS: allows 2% maximum interstory drift
CP: allows 4% maximum interstory drift
Member level criteria are based on plastic rotations for each member. For slab-column connection,
limits on plastic rotation angles (radian) by performance level are shown in Table 2.2
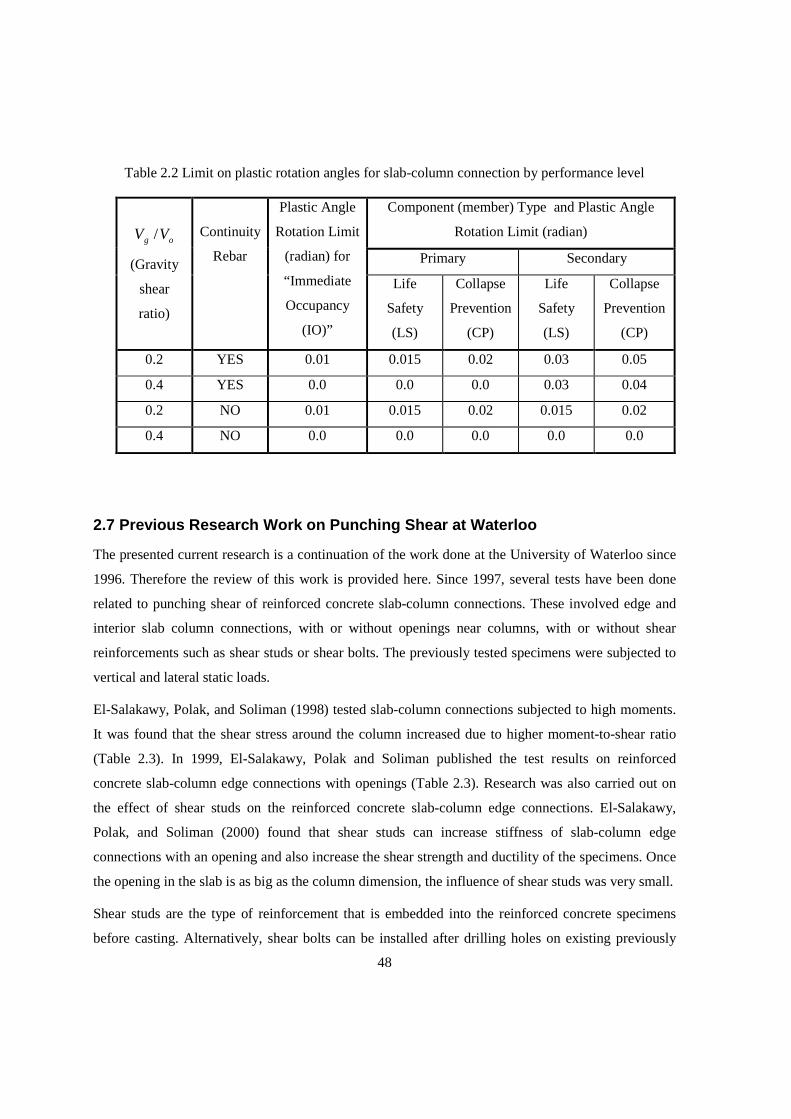
48
Table 2.2 Limit on plastic rotation angles for slab-column connection by performance level
Component (member) Type and Plastic Angle
Rotation Limit (radian)
Primary Secondary
og VV /
(Gravity
shear
ratio)
Continuity
Rebar
Plastic Angle
Rotation Limit
(radian) for
“Immediate
Occupancy
(IO)”
Life
Safety
(LS)
Collapse
Prevention
(CP)
Life
Safety
(LS)
Collapse
Prevention
(CP)
0.2 YES 0.01 0.015 0.02 0.03 0.05
0.4 YES 0.0 0.0 0.0 0.03 0.04
0.2 NO 0.01 0.015 0.02 0.015 0.02
0.4 NO 0.0 0.0 0.0 0.0 0.0
2.7 Previous Research Work on Punching Shear at Wat erloo
The presented current research is a continuation of the work done at the University of Waterloo since
1996. Therefore the review of this work is provided here. Since 1997, several tests have been done
related to punching shear of reinforced concrete slab-column connections. These involved edge and
interior slab column connections, with or without openings near columns, with or without shear
reinforcements such as shear studs or shear bolts. The previously tested specimens were subjected to
vertical and lateral static loads.
El-Salakawy, Polak, and Soliman (1998) tested slab-column connections subjected to high moments.
It was found that the shear stress around the column increased due to higher moment-to-shear ratio
(Table 2.3). In 1999, El-Salakawy, Polak and Soliman published the test results on reinforced
concrete slab-column edge connections with openings (Table 2.3). Research was also carried out on
the effect of shear studs on the reinforced concrete slab-column edge connections. El-Salakawy,
Polak, and Soliman (2000) found that shear studs can increase stiffness of slab-column edge
connections with an opening and also increase the shear strength and ductility of the specimens. Once
the opening in the slab is as big as the column dimension, the influence of shear studs was very small.
Shear studs are the type of reinforcement that is embedded into the reinforced concrete specimens
before casting. Alternatively, shear bolts can be installed after drilling holes on existing previously
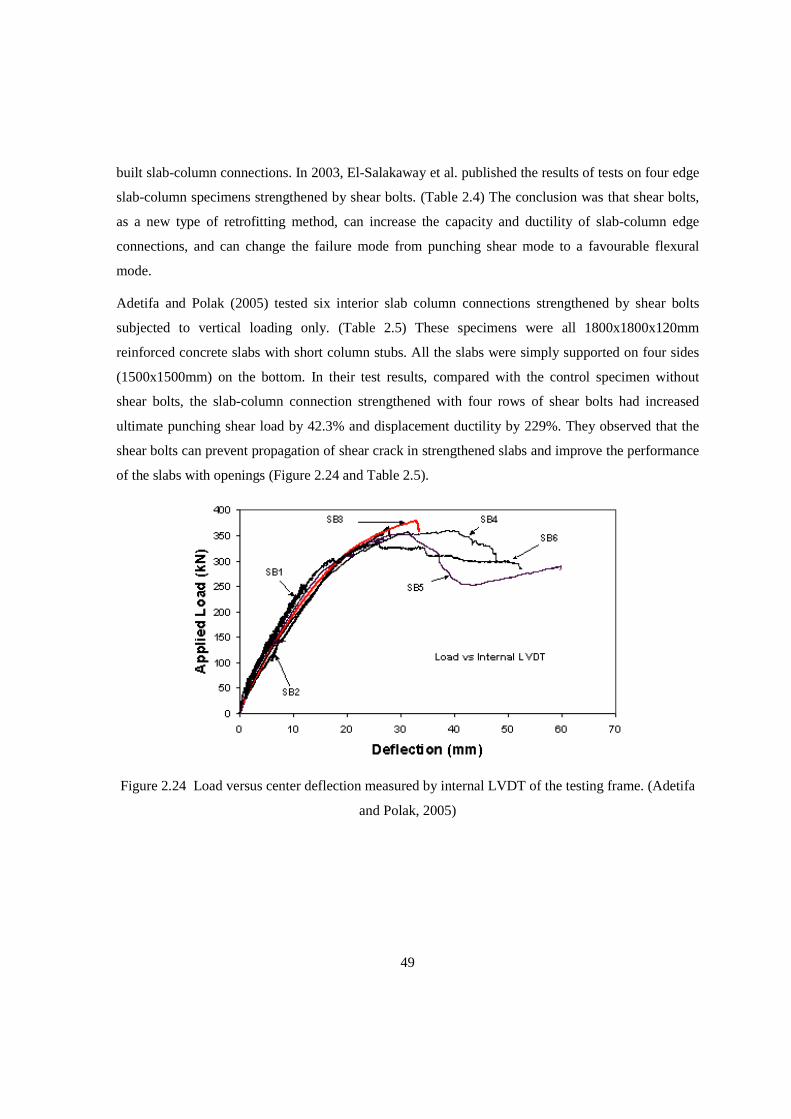
49
built slab-column connections. In 2003, El-Salakaway et al. published the results of tests on four edge
slab-column specimens strengthened by shear bolts. (Table 2.4) The conclusion was that shear bolts,
as a new type of retrofitting method, can increase the capacity and ductility of slab-column edge
connections, and can change the failure mode from punching shear mode to a favourable flexural
mode.
Adetifa and Polak (2005) tested six interior slab column connections strengthened by shear bolts
subjected to vertical loading only. (Table 2.5) These specimens were all 1800x1800x120mm
reinforced concrete slabs with short column stubs. All the slabs were simply supported on four sides
(1500x1500mm) on the bottom. In their test results, compared with the control specimen without
shear bolts, the slab-column connection strengthened with four rows of shear bolts had increased
ultimate punching shear load by 42.3% and displacement ductility by 229%. They observed that the
shear bolts can prevent propagation of shear crack in strengthened slabs and improve the performance
of the slabs with openings (Figure 2.24 and Table 2.5).
Figure 2.24 Load versus center deflection measured by internal LVDT of the testing frame. (Adetifa
and Polak, 2005)
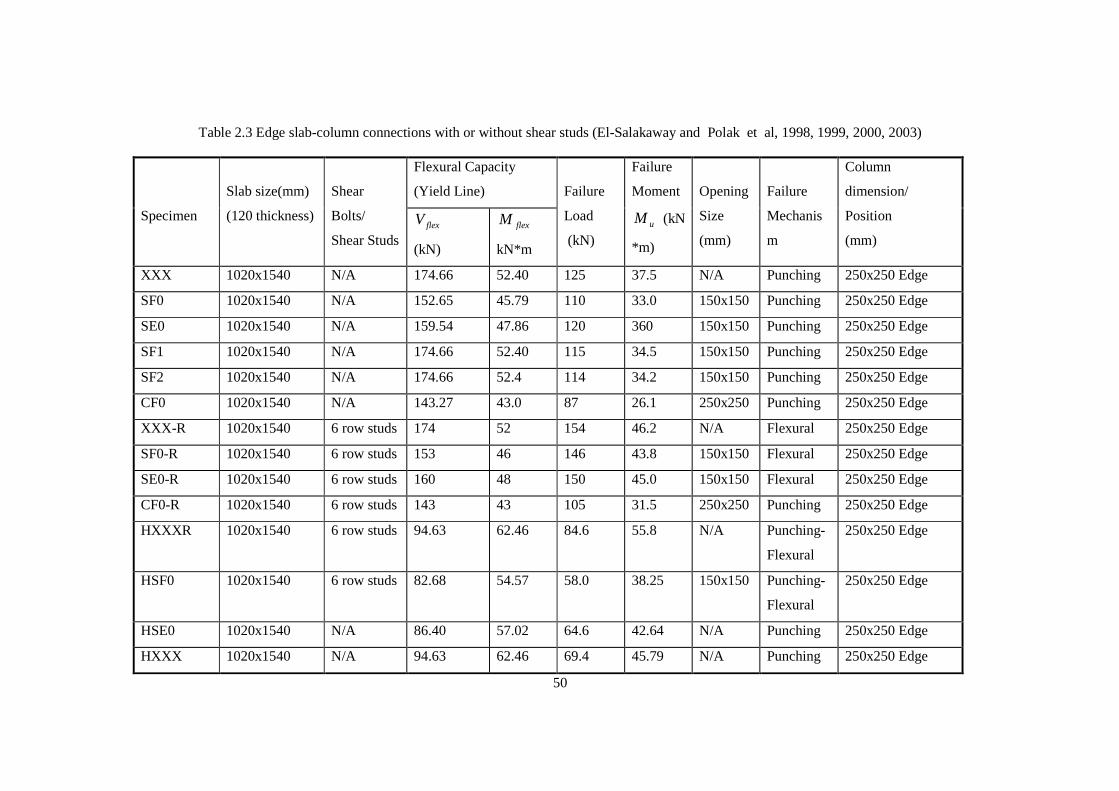
50
Table 2.3 Edge slab-column connections with or without shear studs (El-Salakaway and Polak et al, 1998, 1999, 2000, 2003)
Flexural Capacity
(Yield Line)
Specimen
Slab size(mm)
(120 thickness)
Shear
Bolts/
Shear Studs flexV
(kN)
flexM
kN*m
Failure
Load
(kN)
Failure
Moment
uM (kN
*m)
Opening
Size
(mm)
Failure
Mechanis
m
Column
dimension/
Position
(mm)
XXX 1020x1540 N/A 174.66 52.40 125 37.5 N/A Punching 250x250 Edge
SF0 1020x1540 N/A 152.65 45.79 110 33.0 150x150 Punching 250x250 Edge
SE0 1020x1540 N/A 159.54 47.86 120 360 150x150 Punching 250x250 Edge
SF1 1020x1540 N/A 174.66 52.40 115 34.5 150x150 Punching 250x250 Edge
SF2 1020x1540 N/A 174.66 52.4 114 34.2 150x150 Punching 250x250 Edge
CF0 1020x1540 N/A 143.27 43.0 87 26.1 250x250 Punching 250x250 Edge
XXX-R 1020x1540 6 row studs 174 52 154 46.2 N/A Flexural 250x250 Edge
SF0-R 1020x1540 6 row studs 153 46 146 43.8 150x150 Flexural 250x250 Edge
SE0-R 1020x1540 6 row studs 160 48 150 45.0 150x150 Flexural 250x250 Edge
CF0-R 1020x1540 6 row studs 143 43 105 31.5 250x250 Punching 250x250 Edge
HXXXR 1020x1540 6 row studs 94.63 62.46 84.6 55.8 N/A Punching-
Flexural
250x250 Edge
HSF0 1020x1540 6 row studs 82.68 54.57 58.0 38.25 150x150 Punching-
Flexural
250x250 Edge
HSE0 1020x1540 N/A 86.40 57.02 64.6 42.64 N/A Punching 250x250 Edge
HXXX 1020x1540 N/A 94.63 62.46 69.4 45.79 N/A Punching 250x250 Edge
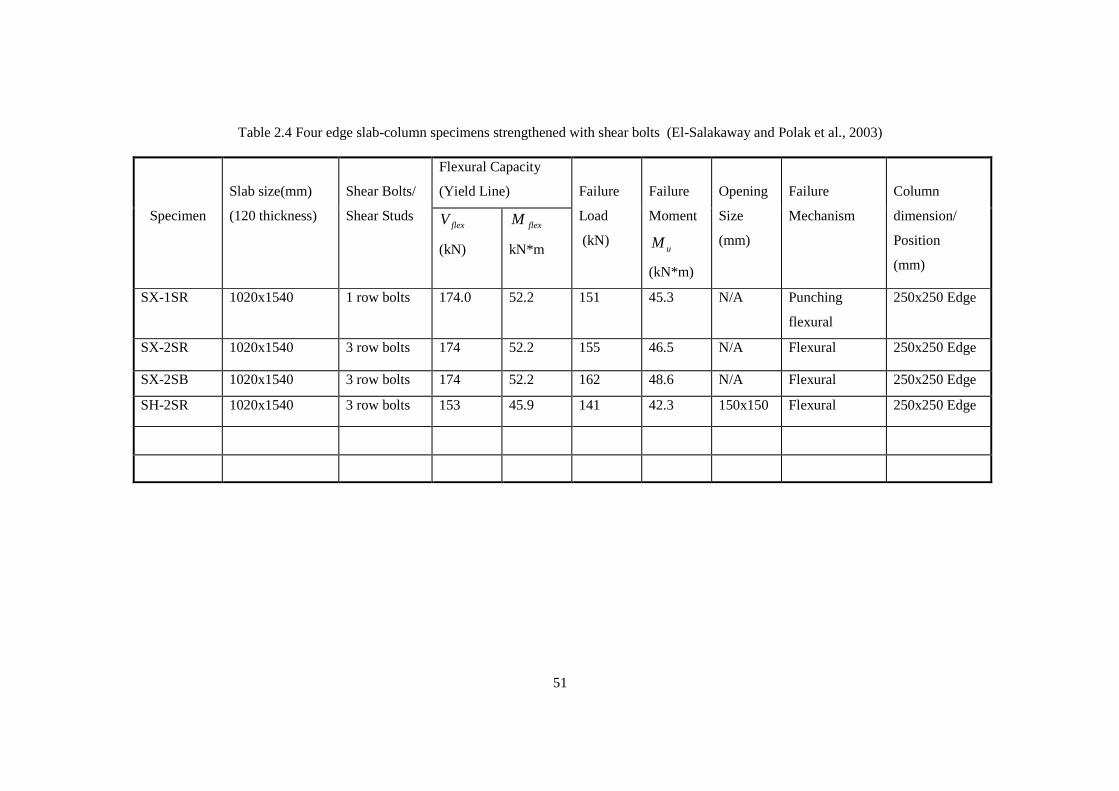
51
Table 2.4 Four edge slab-column specimens strengthened with shear bolts (El-Salakaway and Polak et al., 2003)
Flexural Capacity
(Yield Line)
Specimen
Slab size(mm)
(120 thickness)
Shear Bolts/
Shear Studs
flexV
(kN)
flexM
kN*m
Failure
Load
(kN)
Failure
Moment
uM
(kN*m)
Opening
Size
(mm)
Failure
Mechanism
Column
dimension/
Position
(mm)
SX-1SR 1020x1540 1 row bolts 174.0 52.2 151 45.3 N/A Punching
flexural
250x250 Edge
SX-2SR 1020x1540 3 row bolts 174 52.2 155 46.5 N/A Flexural 250x250 Edge
SX-2SB 1020x1540 3 row bolts 174 52.2 162 48.6 N/A Flexural 250x250 Edge
SH-2SR 1020x1540 3 row bolts 153 45.9 141 42.3 150x150 Flexural 250x250 Edge
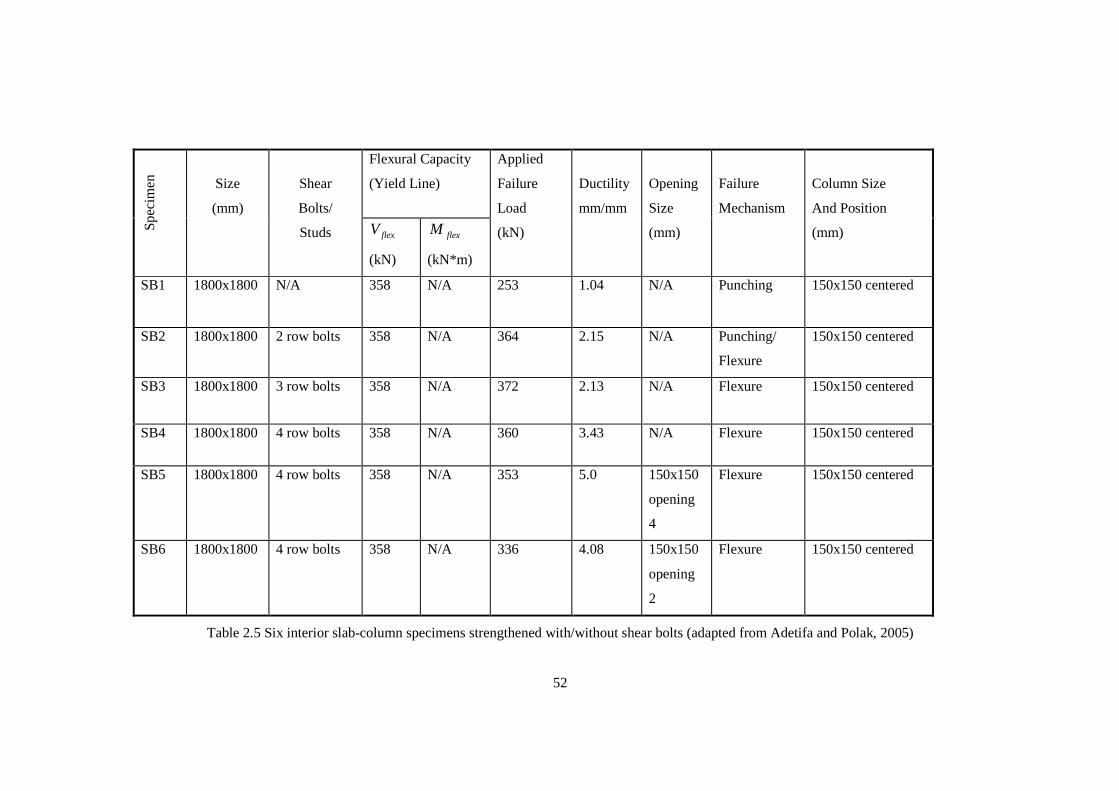
52
Flexural Capacity
(Yield Line)
S
pe
cim
en
Size
(mm)
Shear
Bolts/
Studs
flexV
(kN)
flexM
(kN*m)
Applied
Failure
Load
(kN)
Ductility
mm/mm
Opening
Size
(mm)
Failure
Mechanism
Column Size
And Position
(mm)
SB1 1800x1800 N/A 358 N/A 253 1.04 N/A Punching 150x150 centered
SB2 1800x1800 2 row bolts 358 N/A 364 2.15 N/A Punching/
Flexure
150x150 centered
SB3 1800x1800 3 row bolts 358 N/A 372 2.13 N/A Flexure 150x150 centered
SB4 1800x1800 4 row bolts 358 N/A 360 3.43 N/A Flexure 150x150 centered
SB5 1800x1800 4 row bolts 358 N/A 353 5.0 150x150
opening
4
Flexure 150x150 centered
SB6 1800x1800 4 row bolts 358 N/A 336 4.08 150x150
opening
2
Flexure 150x150 centered
Table 2.5 Six interior slab-column specimens strengthened with/without shear bolts (adapted from Adetifa and Polak, 2005)
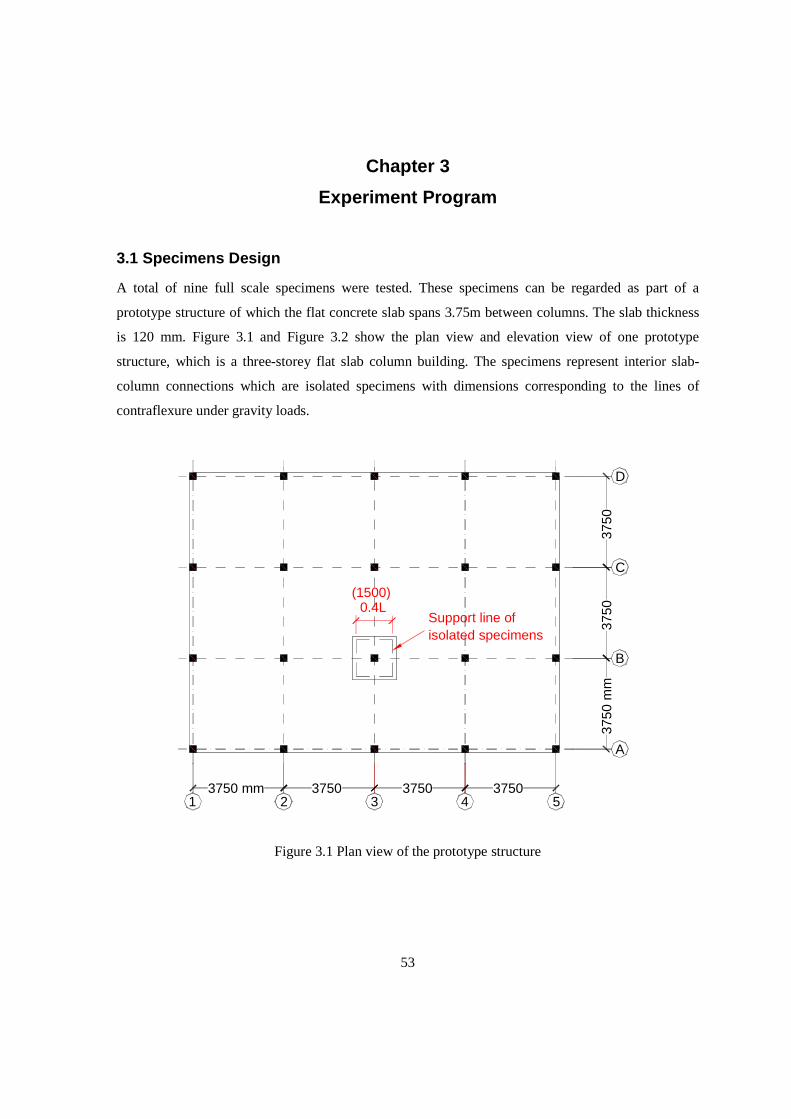
53
Chapter 3
Experiment Program
3.1 Specimens Design
A total of nine full scale specimens were tested. These specimens can be regarded as part of a
prototype structure of which the flat concrete slab spans 3.75m between columns. The slab thickness
is 120 mm. Figure 3.1 and Figure 3.2 show the plan view and elevation view of one prototype
structure, which is a three-storey flat slab column building. The specimens represent interior slab-
column connections which are isolated specimens with dimensions corresponding to the lines of
contraflexure under gravity loads.
37503750 mm1
37502 3
(1500)0.4L
Support line of
43750
5
3750
mm
A
B
3750
3750
C
D
isolated specimens
Figure 3.1 Plan view of the prototype structure
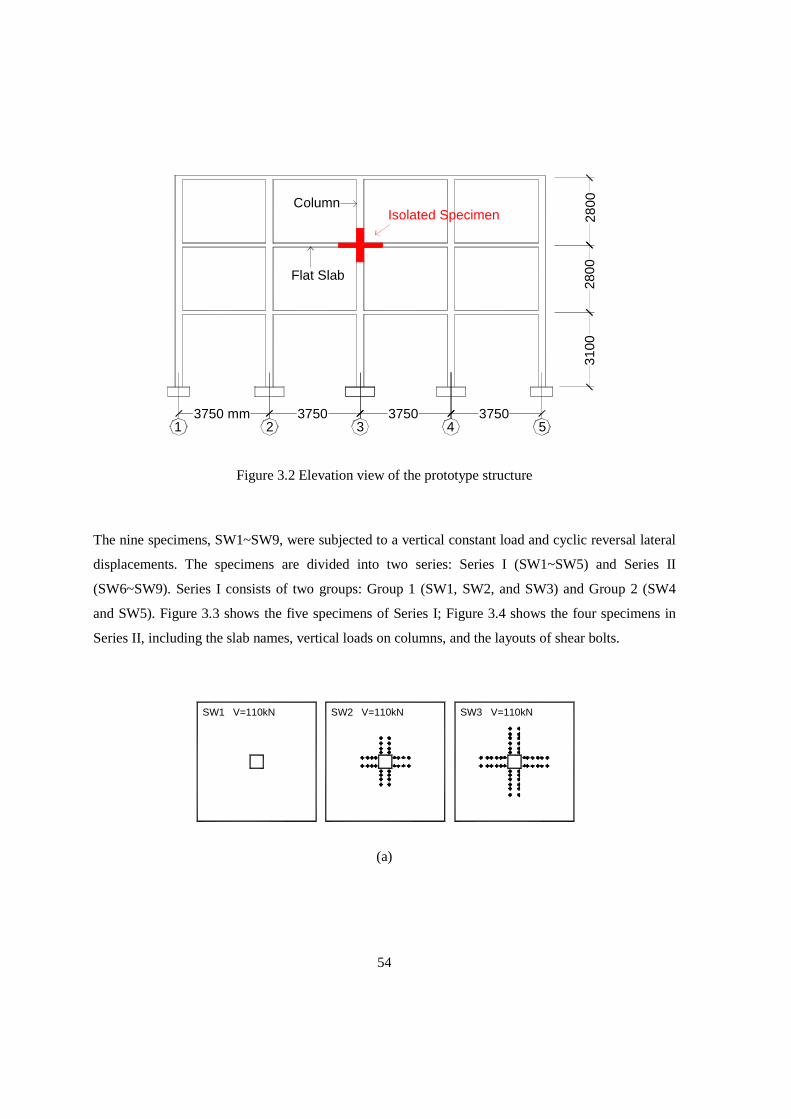
54
3750 mm 3750 3750 375021 3 4 5
3100
2800
2800
Isolated SpecimenColumn
Flat Slab
Figure 3.2 Elevation view of the prototype structure
The nine specimens, SW1~SW9, were subjected to a vertical constant load and cyclic reversal lateral
displacements. The specimens are divided into two series: Series I (SW1~SW5) and Series II
(SW6~SW9). Series I consists of two groups: Group 1 (SW1, SW2, and SW3) and Group 2 (SW4
and SW5). Figure 3.3 shows the five specimens of Series I; Figure 3.4 shows the four specimens in
Series II, including the slab names, vertical loads on columns, and the layouts of shear bolts.
SW1 V=110kN SW2 V=110kN SW3 V=110kN
(a)
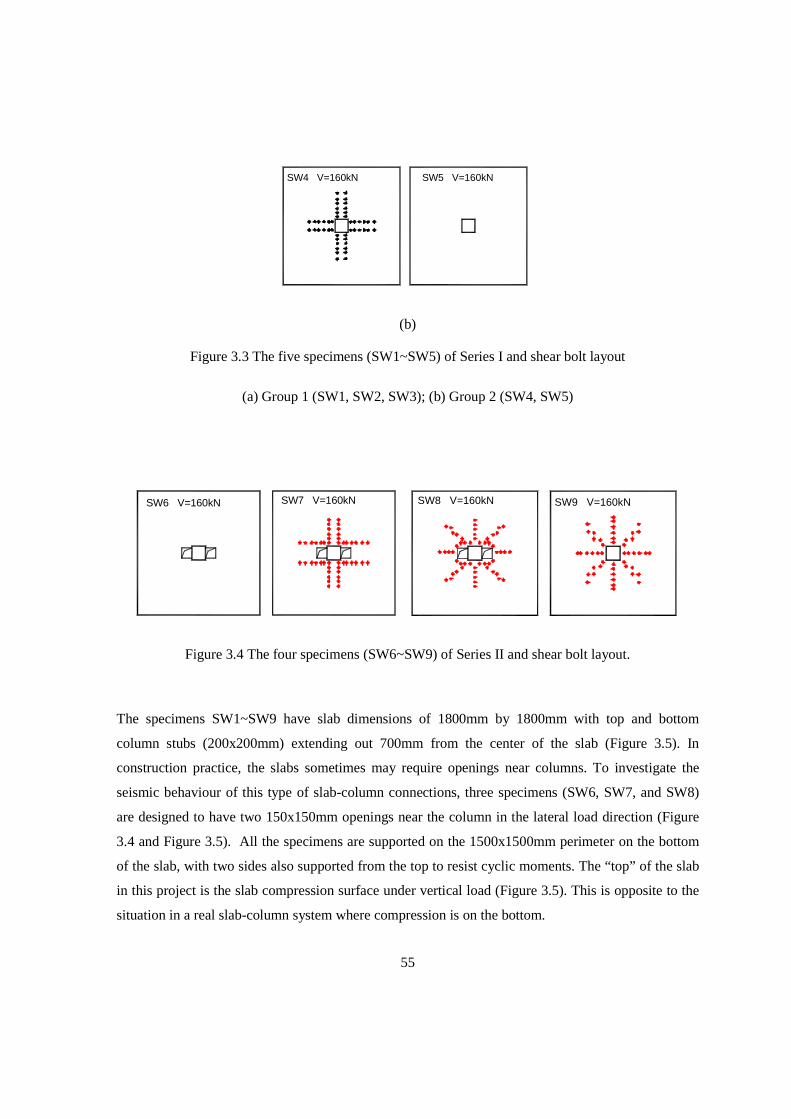
55
SW4 V=160kN SW5 V=160kN
(b)
Figure 3.3 The five specimens (SW1~SW5) of Series I and shear bolt layout
(a) Group 1 (SW1, SW2, SW3); (b) Group 2 (SW4, SW5)
SW6 V=160kN SW7 V=160kN
SW8 V=160kN SW9 V=160kN
Figure 3.4 The four specimens (SW6~SW9) of Series II and shear bolt layout.
The specimens SW1~SW9 have slab dimensions of 1800mm by 1800mm with top and bottom
column stubs (200x200mm) extending out 700mm from the center of the slab (Figure 3.5). In
construction practice, the slabs sometimes may require openings near columns. To investigate the
seismic behaviour of this type of slab-column connections, three specimens (SW6, SW7, and SW8)
are designed to have two 150x150mm openings near the column in the lateral load direction (Figure
3.4 and Figure 3.5). All the specimens are supported on the 1500x1500mm perimeter on the bottom
of the slab, with two sides also supported from the top to resist cyclic moments. The “top” of the slab
in this project is the slab compression surface under vertical load (Figure 3.5). This is opposite to the
situation in a real slab-column system where compression is on the bottom.
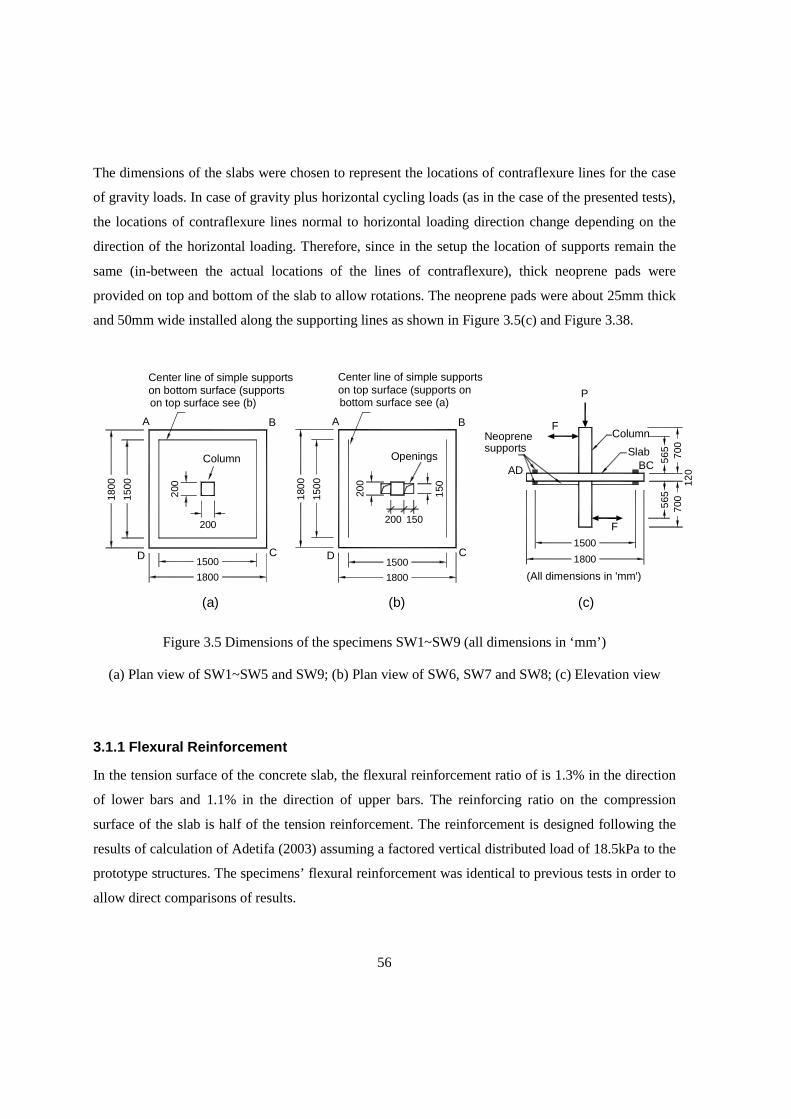
56
The dimensions of the slabs were chosen to represent the locations of contraflexure lines for the case
of gravity loads. In case of gravity plus horizontal cycling loads (as in the case of the presented tests),
the locations of contraflexure lines normal to horizontal loading direction change depending on the
direction of the horizontal loading. Therefore, since in the setup the location of supports remain the
same (in-between the actual locations of the lines of contraflexure), thick neoprene pads were
provided on top and bottom of the slab to allow rotations. The neoprene pads were about 25mm thick
and 50mm wide installed along the supporting lines as shown in Figure 3.5(c) and Figure 3.38.
F
Center line of simple supportson bottom surface (supports
200
1500
1800
D
A
1500 18001500
18001800
Openings
200
1800
200
C
Column
B
200
1500
D
ANeoprenesupports
150
150
C
B
1500
F
AD
P
120
565
700
565
BCSlab
Column
700
(a) (b) (c)
on top surface see (b) bottom surface see (a)on top surface (supports onCenter line of simple supports
(All dimensions in 'mm')
Figure 3.5 Dimensions of the specimens SW1~SW9 (all dimensions in ‘mm’)
(a) Plan view of SW1~SW5 and SW9; (b) Plan view of SW6, SW7 and SW8; (c) Elevation view
3.1.1 Flexural Reinforcement
In the tension surface of the concrete slab, the flexural reinforcement ratio of is 1.3% in the direction
of lower bars and 1.1% in the direction of upper bars. The reinforcing ratio on the compression
surface of the slab is half of the tension reinforcement. The reinforcement is designed following the
results of calculation of Adetifa (2003) assuming a factored vertical distributed load of 18.5kPa to the
prototype structures. The specimens’ flexural reinforcement was identical to previous tests in order to
allow direct comparisons of results.
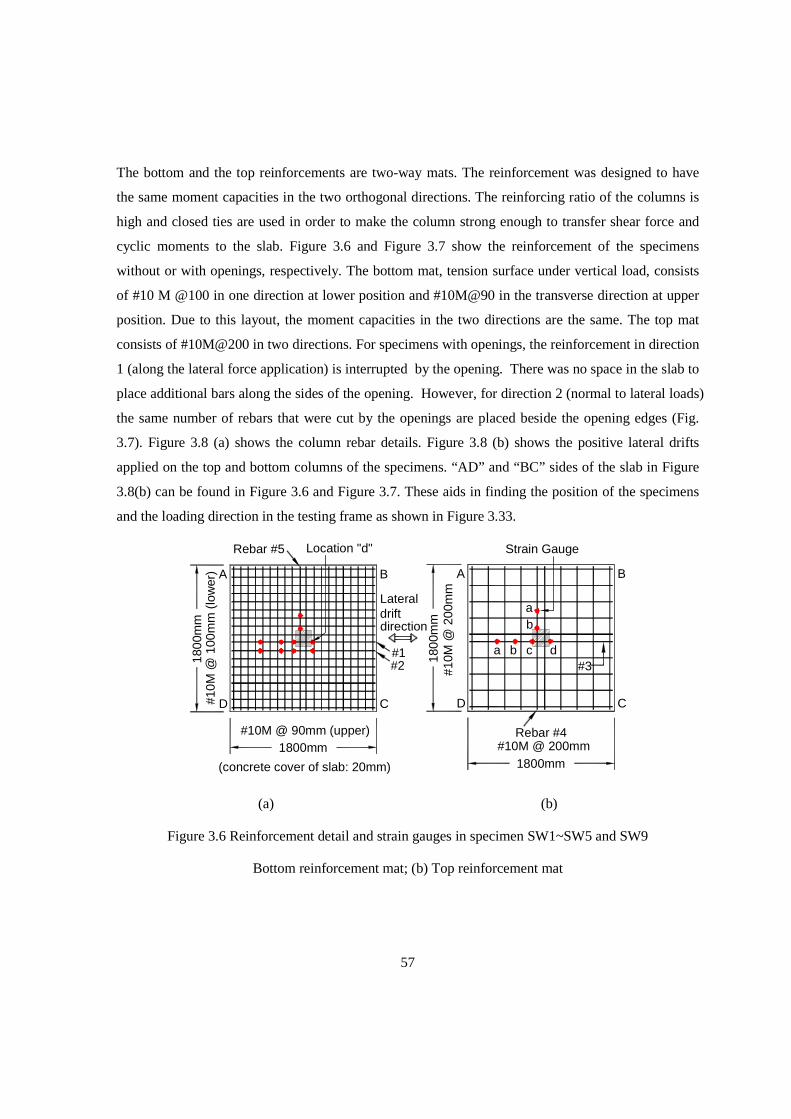
57
The bottom and the top reinforcements are two-way mats. The reinforcement was designed to have
the same moment capacities in the two orthogonal directions. The reinforcing ratio of the columns is
high and closed ties are used in order to make the column strong enough to transfer shear force and
cyclic moments to the slab. Figure 3.6 and Figure 3.7 show the reinforcement of the specimens
without or with openings, respectively. The bottom mat, tension surface under vertical load, consists
of #10 M @100 in one direction at lower position and #10M@90 in the transverse direction at upper
position. Due to this layout, the moment capacities in the two directions are the same. The top mat
consists of #10M@200 in two directions. For specimens with openings, the reinforcement in direction
1 (along the lateral force application) is interrupted by the opening. There was no space in the slab to
place additional bars along the sides of the opening. However, for direction 2 (normal to lateral loads)
the same number of rebars that were cut by the openings are placed beside the opening edges (Fig.
3.7). Figure 3.8 (a) shows the column rebar details. Figure 3.8 (b) shows the positive lateral drifts
applied on the top and bottom columns of the specimens. “AD” and “BC” sides of the slab in Figure
3.8(b) can be found in Figure 3.6 and Figure 3.7. These aids in finding the position of the specimens
and the loading direction in the testing frame as shown in Figure 3.33.
#10M
@ 1
00m
m (
low
er)
#10M @ 90mm (upper)
(concrete cover of slab: 20mm)
1800mm
D C
Rebar #4
1800mm#10M @ 200mm
D C
#2#1
driftdirection
Lateral
1800
mm
A B
Rebar #5 Location "d"
1800
mm b
#10M
@ 2
00m
m
ca b#3
d
a
A B
Strain Gauge
(a) (b)
Figure 3.6 Reinforcement detail and strain gauges in specimen SW1~SW5 and SW9
Bottom reinforcement mat; (b) Top reinforcement mat
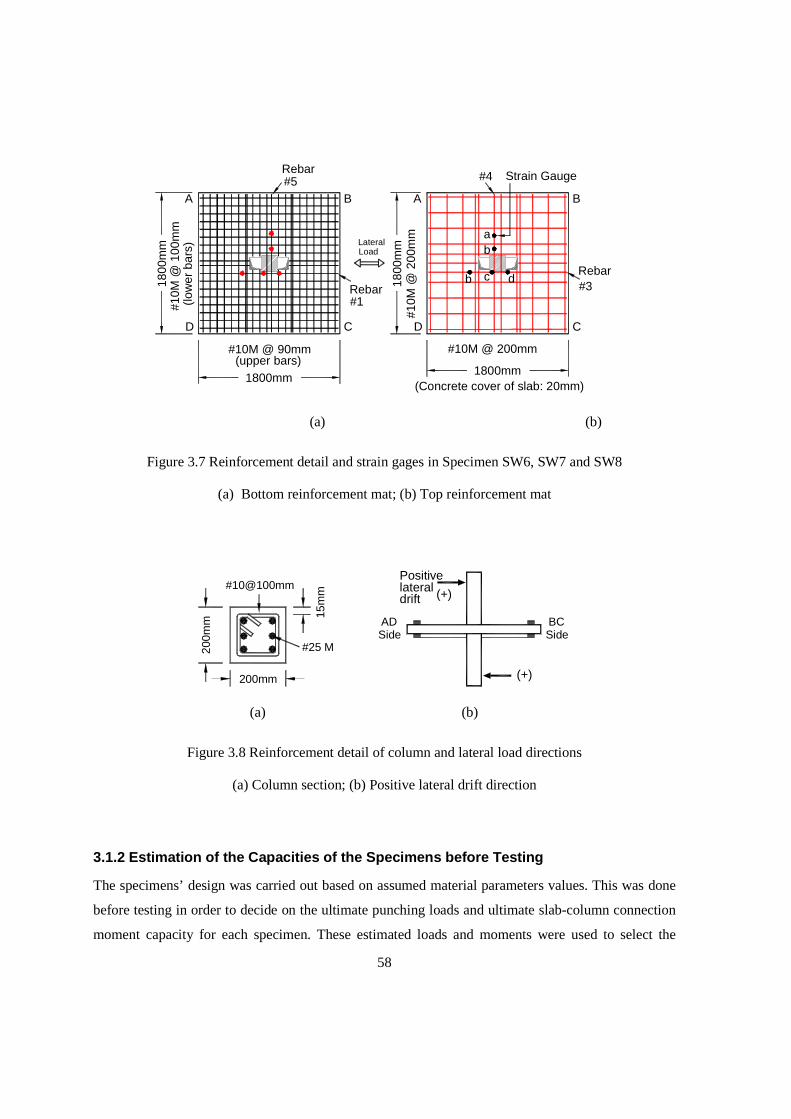
58
#10M @ 90mm(upper bars)
1800mm
(low
er b
ars)
#10M
@ 1
00m
m18
00m
m
#10M @ 200mm
1800mm
#10M
@ 2
00m
m18
00m
m
b c d
ab
Rebar#1
#5Rebar
#4
#3Rebar
Load Lateral
A B
CD D
A B
C
Strain Gauge
(Concrete cover of slab: 20mm)
(a) (b)
Figure 3.7 Reinforcement detail and strain gages in Specimen SW6, SW7 and SW8
(a) Bottom reinforcement mat; (b) Top reinforcement mat
200mm
#10@100mm
200m
m
15m
m drift
#25 M
ADSide
Positive
(+)lateral
(+)
BCSide
(a) (b)
Figure 3.8 Reinforcement detail of column and lateral load directions
(a) Column section; (b) Positive lateral drift direction
3.1.2 Estimation of the Capacities of the Specimens before Testing
The specimens’ design was carried out based on assumed material parameters values. This was done
before testing in order to decide on the ultimate punching loads and ultimate slab-column connection
moment capacity for each specimen. These estimated loads and moments were used to select the
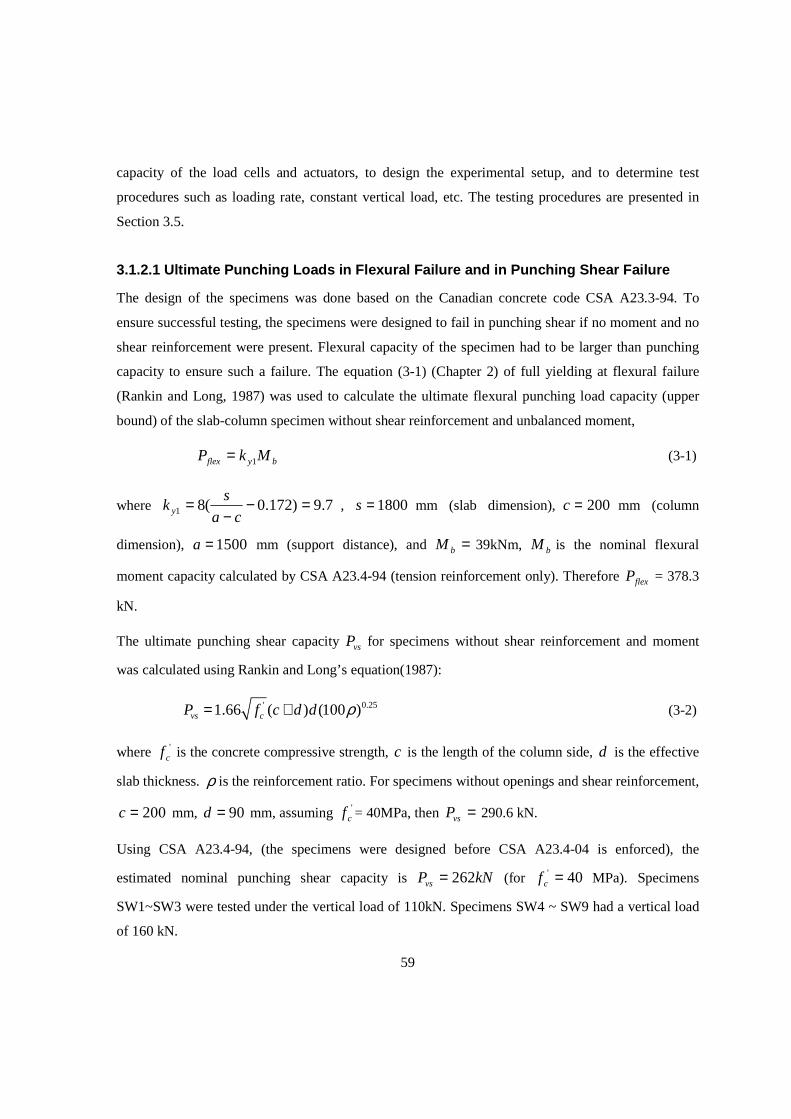
59
capacity of the load cells and actuators, to design the experimental setup, and to determine test
procedures such as loading rate, constant vertical load, etc. The testing procedures are presented in
Section 3.5.
3.1.2.1 Ultimate Punching Loads in Flexural Failure and in Punching Shear Failure
The design of the specimens was done based on the Canadian concrete code CSA A23.3-94. To
ensure successful testing, the specimens were designed to fail in punching shear if no moment and no
shear reinforcement were present. Flexural capacity of the specimen had to be larger than punching
capacity to ensure such a failure. The equation (3-1) (Chapter 2) of full yielding at flexural failure
(Rankin and Long, 1987) was used to calculate the ultimate flexural punching load capacity (upper
bound) of the slab-column specimen without shear reinforcement and unbalanced moment,
byflex MkP 1= (3-1)
where 7.9)172.0(81 =−−
=ca
sk y , 1800=s mm (slab dimension), 200=c mm (column
dimension), 1500=a mm (support distance), and =bM 39kNm, bM is the nominal flexural
moment capacity calculated by CSA A23.4-94 (tension reinforcement only). Therefore flexP = 378.3
kN.
The ultimate punching shear capacity vsP for specimens without shear reinforcement and moment
was calculated using Rankin and Long’s equation(1987):
' 0.251.66 ( ) (100 )vs cP f c d d ρ= + (3-2)
where 'cf is the concrete compressive strength, c is the length of the column side, d is the effective
slab thickness. ρ is the reinforcement ratio. For specimens without openings and shear reinforcement,
200=c mm, 90=d mm, assuming 'cf = 40MPa, then =vsP 290.6 kN.
Using CSA A23.4-94, (the specimens were designed before CSA A23.4-04 is enforced), the
estimated nominal punching shear capacity is kNPvs 262= (for 40' =cf MPa). Specimens
SW1~SW3 were tested under the vertical load of 110kN. Specimens SW4 ~ SW9 had a vertical load
of 160 kN.
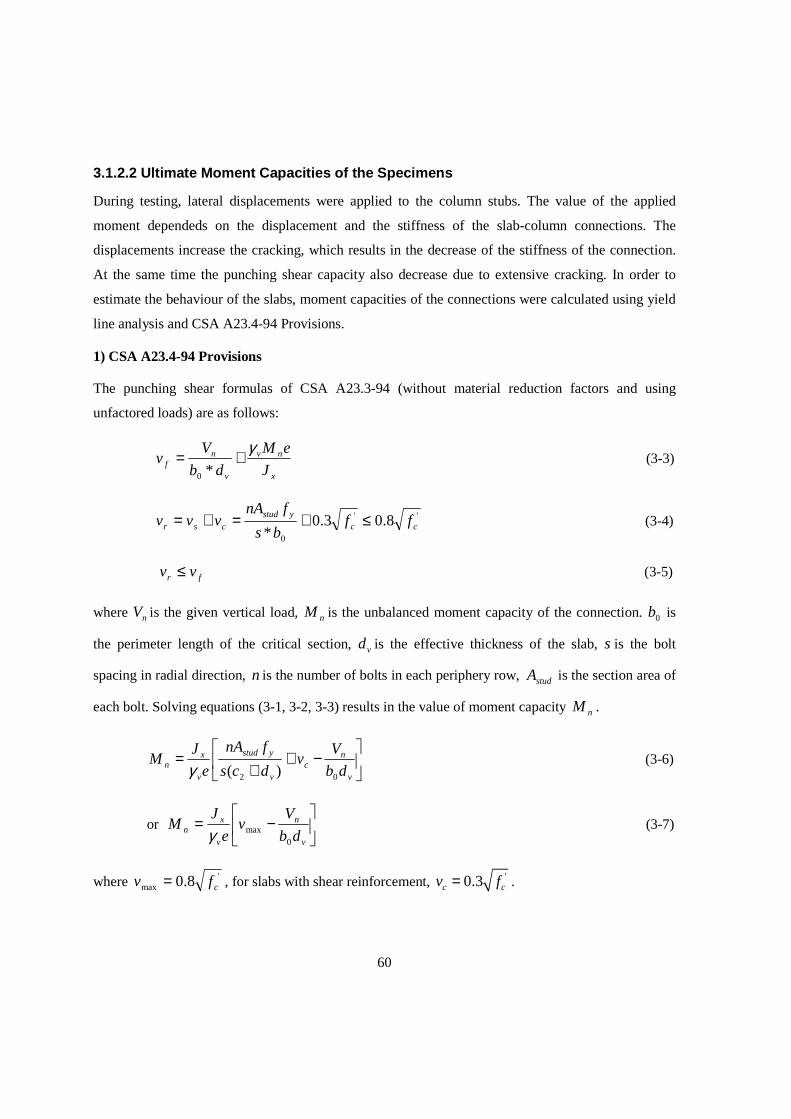
60
3.1.2.2 Ultimate Moment Capacities of the Specimens
During testing, lateral displacements were applied to the column stubs. The value of the applied
moment dependeds on the displacement and the stiffness of the slab-column connections. The
displacements increase the cracking, which results in the decrease of the stiffness of the connection.
At the same time the punching shear capacity also decrease due to extensive cracking. In order to
estimate the behaviour of the slabs, moment capacities of the connections were calculated using yield
line analysis and CSA A23.4-94 Provisions.
1) CSA A23.4-94 Provisions
The punching shear formulas of CSA A23.3-94 (without material reduction factors and using
unfactored loads) are as follows:
x
nv
v
nf J
eM
db
Vv
γ+=
*0
(3-3)
''
0
8.03.0* cc
ystudcsr ff
bs
fnAvvv ≤+=+= (3-4)
fr vv ≤ (3-5)
where nV is the given vertical load, nM is the unbalanced moment capacity of the connection. 0b is
the perimeter length of the critical section, vd is the effective thickness of the slab, s is the bolt
spacing in radial direction, n is the number of bolts in each periphery row, studA is the section area of
each bolt. Solving equations (3-1, 3-2, 3-3) results in the value of moment capacity nM .
−+
+=
v
nc
v
ystud
v
xn db
Vv
dcs
fnA
e
JM
02 )(γ (3-6)
or
−=
v
n
v
xn db
Vv
e
JM
0maxγ
(3-7)
where 'max 8.0 cfv = , for slabs with shear reinforcement, '0.3c cv f= .
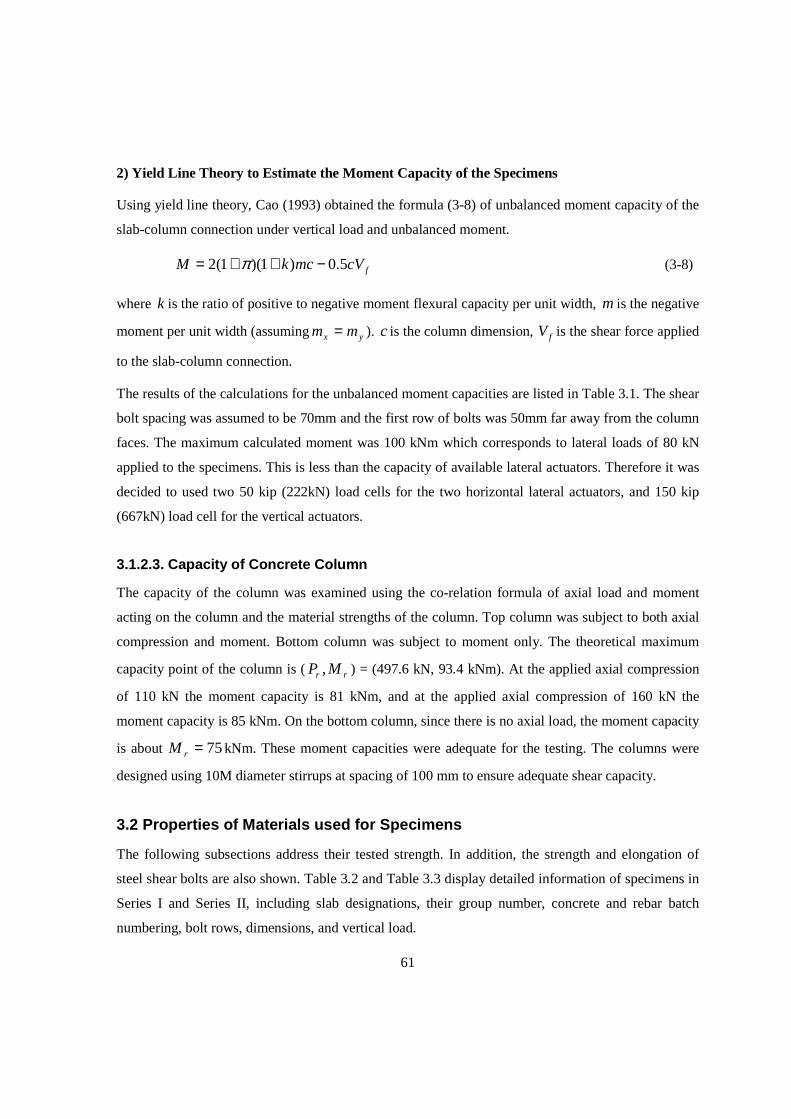
61
2) Yield Line Theory to Estimate the Moment Capacity of the Specimens
Using yield line theory, Cao (1993) obtained the formula (3-8) of unbalanced moment capacity of the
slab-column connection under vertical load and unbalanced moment.
fcVmckM 5.0)1)(1(2 −++= π (3-8)
where k is the ratio of positive to negative moment flexural capacity per unit width, m is the negative
moment per unit width (assuming yx mm = ). c is the column dimension, fV is the shear force applied
to the slab-column connection.
The results of the calculations for the unbalanced moment capacities are listed in Table 3.1. The shear
bolt spacing was assumed to be 70mm and the first row of bolts was 50mm far away from the column
faces. The maximum calculated moment was 100 kNm which corresponds to lateral loads of 80 kN
applied to the specimens. This is less than the capacity of available lateral actuators. Therefore it was
decided to used two 50 kip (222kN) load cells for the two horizontal lateral actuators, and 150 kip
(667kN) load cell for the vertical actuators.
3.1.2.3. Capacity of Concrete Column
The capacity of the column was examined using the co-relation formula of axial load and moment
acting on the column and the material strengths of the column. Top column was subject to both axial
compression and moment. Bottom column was subject to moment only. The theoretical maximum
capacity point of the column is ( rr MP , ) = (497.6 kN, 93.4 kNm). At the applied axial compression
of 110 kN the moment capacity is 81 kNm, and at the applied axial compression of 160 kN the
moment capacity is 85 kNm. On the bottom column, since there is no axial load, the moment capacity
is about 75=rM kNm. These moment capacities were adequate for the testing. The columns were
designed using 10M diameter stirrups at spacing of 100 mm to ensure adequate shear capacity.
3.2 Properties of Materials used for Specimens
The following subsections address their tested strength. In addition, the strength and elongation of
steel shear bolts are also shown. Table 3.2 and Table 3.3 display detailed information of specimens in
Series I and Series II, including slab designations, their group number, concrete and rebar batch
numbering, bolt rows, dimensions, and vertical load.
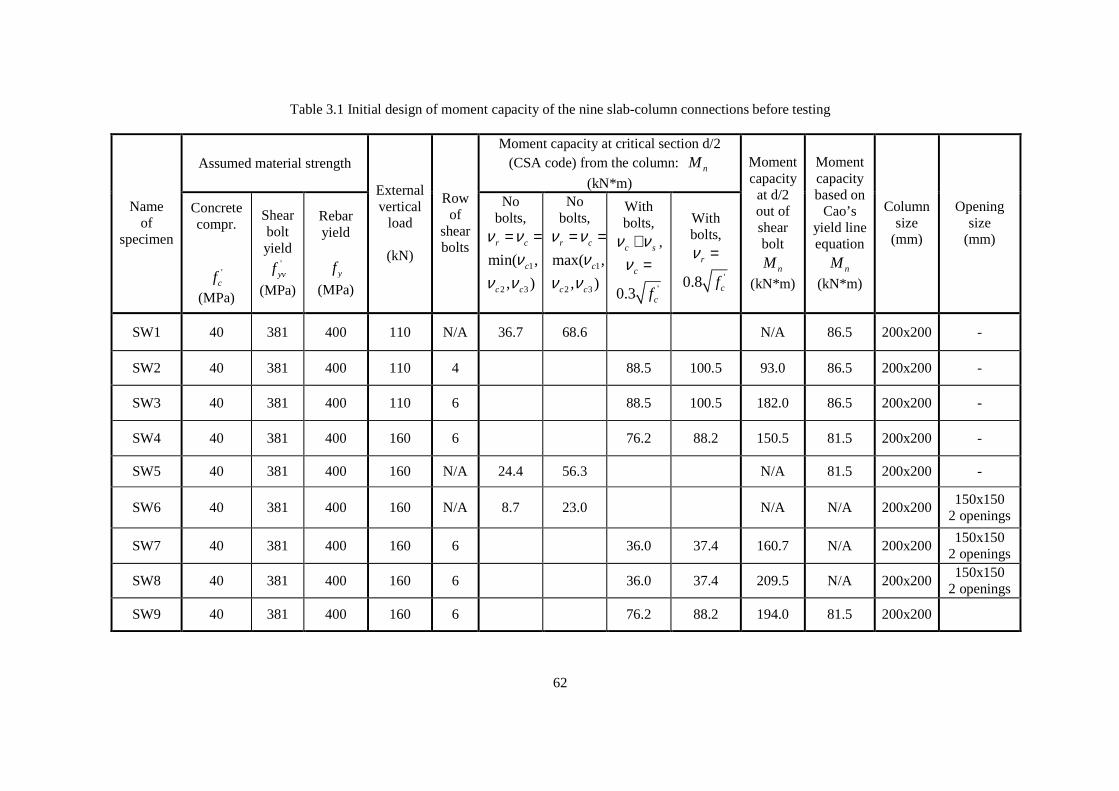
62
Table 3.1 Initial design of moment capacity of the nine slab-column connections before testing
Assumed material strength Moment capacity at critical section d/2
(CSA code) from the column: nM
(kN*m)
Name of
specimen
Concrete compr.
'
cf
(MPa)
Shear bolt yield
'yvf
(MPa)
Rebar yield
yf
(MPa)
External vertical
load
(kN)
Row of
shear bolts
No bolts,
r cν ν= =
1min( ,cν
2 3, )c cν ν
No bolts,
r cν ν= =
1max( ,cν
2 3, )c cν ν
With bolts,
c sν ν+ ,
cν =
'0.3 cf
With bolts,
rν =
'0.8 cf
Moment capacity at d/2 out of shear bolt
nM
(kN*m)
Moment capacity based on
Cao’s yield line equation
nM
(kN*m)
Column size
(mm)
Opening size
(mm)
SW1 40 381 400 110 N/A 36.7 68.6 N/A 86.5 200x200 -
SW2 40 381 400 110 4 88.5 100.5 93.0 86.5 200x200 -
SW3 40 381 400 110 6 88.5 100.5 182.0 86.5 200x200 -
SW4 40 381 400 160 6 76.2 88.2 150.5 81.5 200x200 -
SW5 40 381 400 160 N/A 24.4 56.3 N/A 81.5 200x200 -
SW6 40 381 400 160 N/A 8.7 23.0 N/A N/A 200x200 150x150
2 openings
SW7 40 381 400 160 6 36.0 37.4 160.7 N/A 200x200 150x150
2 openings
SW8 40 381 400 160 6 36.0 37.4 209.5 N/A 200x200 150x150
2 openings
SW9 40 381 400 160 6 76.2 88.2 194.0 81.5 200x200
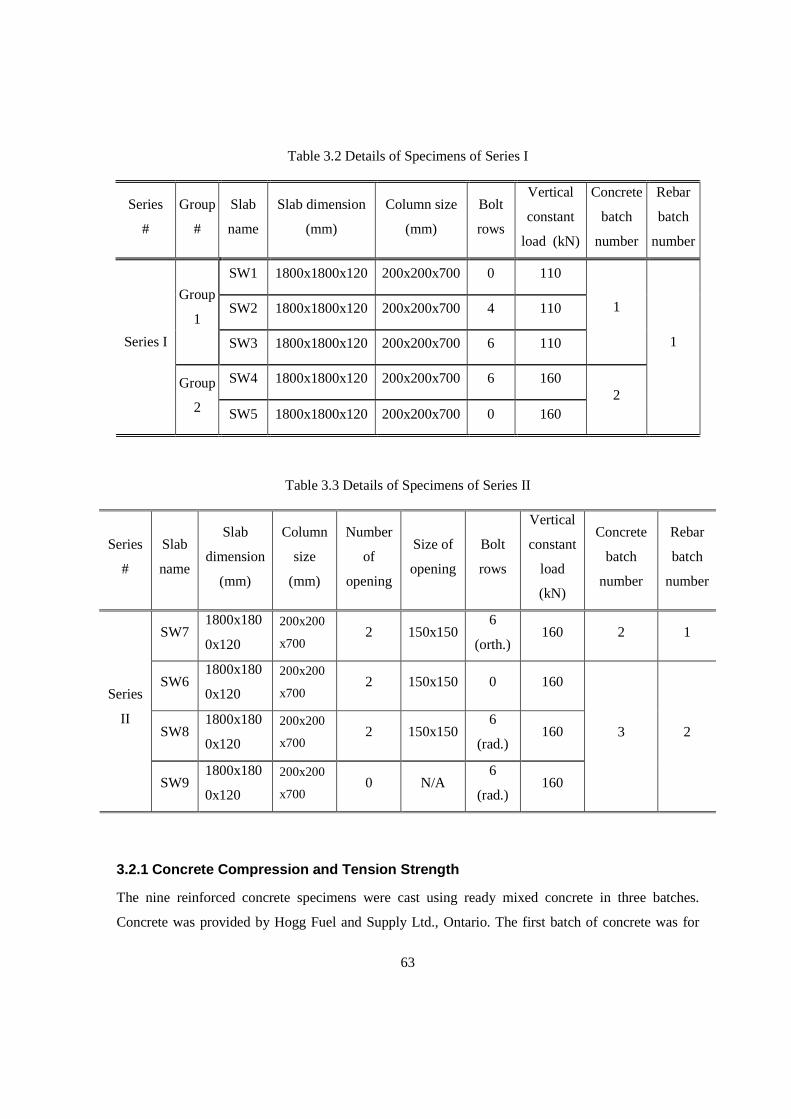
63
Table 3.2 Details of Specimens of Series I
Series
#
Group
#
Slab
name
Slab dimension
(mm)
Column size
(mm)
Bolt
rows
Vertical
constant
load (kN)
Concrete
batch
number
Rebar
batch
number
SW1 1800x1800x120 200x200x700 0 110
SW2 1800x1800x120 200x200x700 4 110 Group
1
SW3 1800x1800x120 200x200x700 6 110
1
SW4 1800x1800x120 200x200x700 6 160
Series I
Group
2 SW5 1800x1800x120 200x200x700 0 160 2
1
Table 3.3 Details of Specimens of Series II
Series
#
Slab
name
Slab
dimension
(mm)
Column
size
(mm)
Number
of
opening
Size of
opening
Bolt
rows
Vertical
constant
load
(kN)
Concrete
batch
number
Rebar
batch
number
SW7 1800x180
0x120
200x200
x700 2 150x150
6
(orth.) 160 2 1
SW6 1800x180
0x120
200x200
x700 2 150x150 0 160
SW8 1800x180
0x120
200x200
x700 2 150x150
6
(rad.) 160
Series
II
SW9 1800x180
0x120
200x200
x700 0 N/A
6
(rad.) 160
3 2
3.2.1 Concrete Compression and Tension Strength
The nine reinforced concrete specimens were cast using ready mixed concrete in three batches.
Concrete was provided by Hogg Fuel and Supply Ltd., Ontario. The first batch of concrete was for
64
specimens SW1, SW2 and SW3; the second batch of concrete went for SW4, SW5, and SW7; SW6,
SW8 and SW9 were cast using the third batch of concrete. All the specimens were cured in normal
interior temperature (about 022 C ). Concrete cylinders (4”diameter x 8”length and 6”diameter x 12
length”) were prepared with each casting batch. Some of the 4”diameter x 8”length cylinders were
placed in the standard humid room and were tested on the 28th day for compression strength; the
others were placed with the slab-column connections in normal interior temperature, and were tested
for compression and tension strength at the same time of the slab-column connections testing.
Figure 3.9 Compression test of the concrete cylinder (4”x8”)
Table 3.4 shows the average compression strength and average tension strength of each slab-column
connection specimen at the testing time; it also shows the 28-day compression strength (cured in
humid room) of the cylinders for each batch of concrete. Specimen SW1, SW2, and SW3, cast from
the first batch of concrete, had the average standard 28-day compression strength 34.5 MPa and
average compression strength from 33.7 to 37.0 MPa at the time of slab testing. In the second cast
batch, specimens SW4, SW5, and SW7 had standard 28-day strength of 37MPa and 45.0 to 46.5 MPa
compression strength at slab testing. The third cast batch of specimens SW6, SW8, and SW9 reached
52MPa in 28-day standard strength and 51.9 MPa in compression strength at slab testing. Figure 3.9
shows the crushing of a cylinder (4”x8”) which was cured in a standard humid room for 28 days.
Figure 3.10 shows the splitting (tension) test of 4”x8” concrete cylinders cured in the normal room
environment. It can be seen that the color in the cracked surface is lighter than the colour of the third
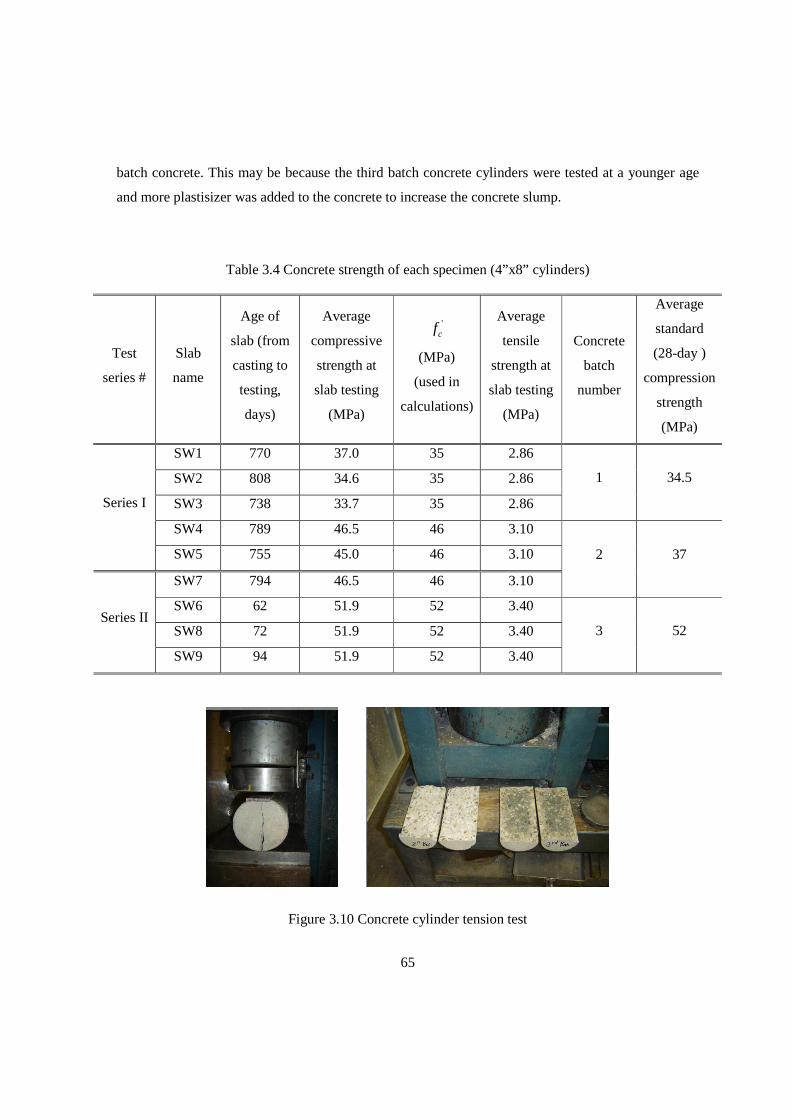
65
batch concrete. This may be because the third batch concrete cylinders were tested at a younger age
and more plastisizer was added to the concrete to increase the concrete slump.
Table 3.4 Concrete strength of each specimen (4”x8” cylinders)
Test
series #
Slab
name
Age of
slab (from
casting to
testing,
days)
Average
compressive
strength at
slab testing
(MPa)
'cf
(MPa)
(used in
calculations)
Average
tensile
strength at
slab testing
(MPa)
Concrete
batch
number
Average
standard
(28-day )
compression
strength
(MPa)
SW1 770 37.0 35 2.86
SW2 808 34.6 35 2.86
SW3 738 33.7 35 2.86
1 34.5
SW4 789 46.5 46 3.10
Series I
SW5 755 45.0 46 3.10
SW7 794 46.5 46 3.10
2 37
SW6 62 51.9 52 3.40
SW8 72 51.9 52 3.40 Series II
SW9 94 51.9 52 3.40
3 52
Figure 3.10 Concrete cylinder tension test
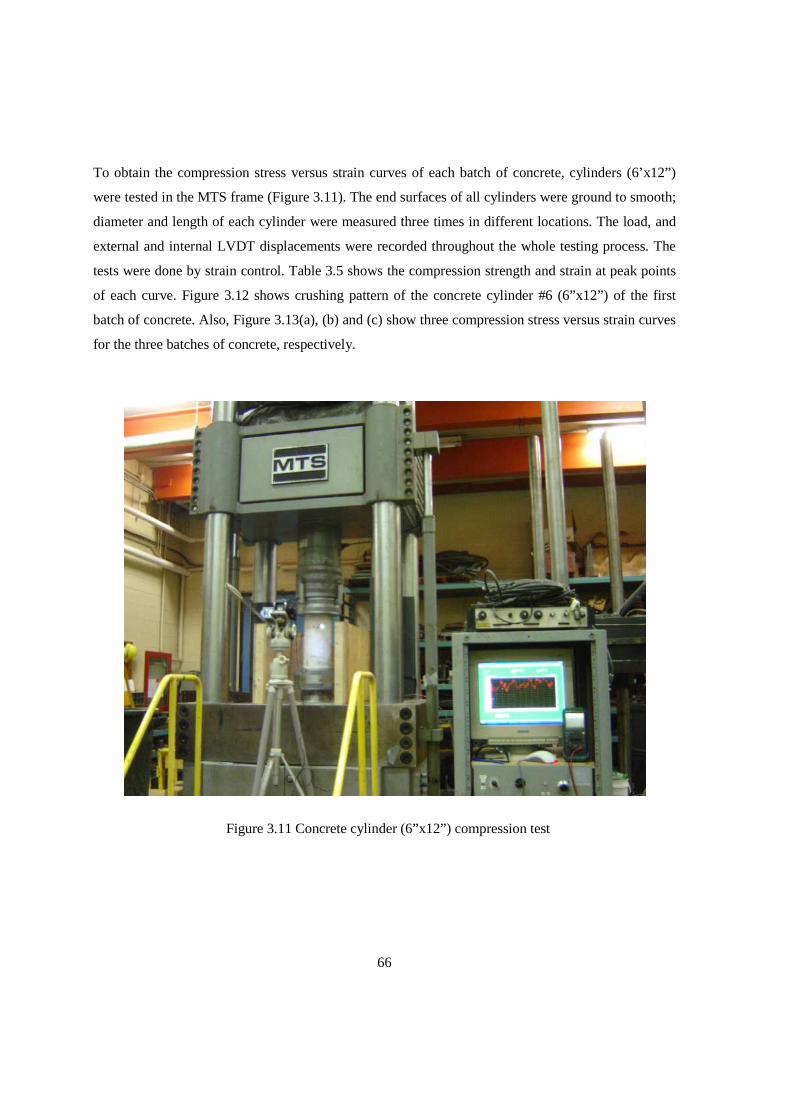
66
To obtain the compression stress versus strain curves of each batch of concrete, cylinders (6’x12”)
were tested in the MTS frame (Figure 3.11). The end surfaces of all cylinders were ground to smooth;
diameter and length of each cylinder were measured three times in different locations. The load, and
external and internal LVDT displacements were recorded throughout the whole testing process. The
tests were done by strain control. Table 3.5 shows the compression strength and strain at peak points
of each curve. Figure 3.12 shows crushing pattern of the concrete cylinder #6 (6”x12”) of the first
batch of concrete. Also, Figure 3.13(a), (b) and (c) show three compression stress versus strain curves
for the three batches of concrete, respectively.
Figure 3.11 Concrete cylinder (6”x12”) compression test
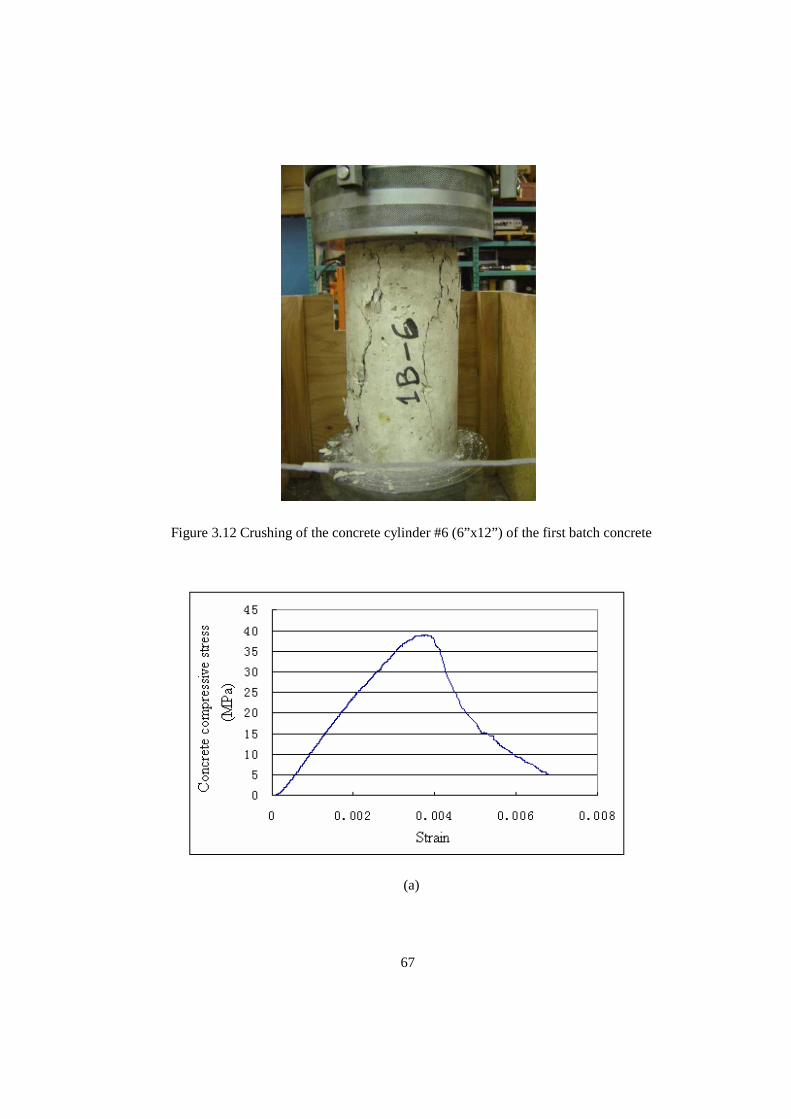
67
Figure 3.12 Crushing of the concrete cylinder #6 (6”x12”) of the first batch concrete
(a)
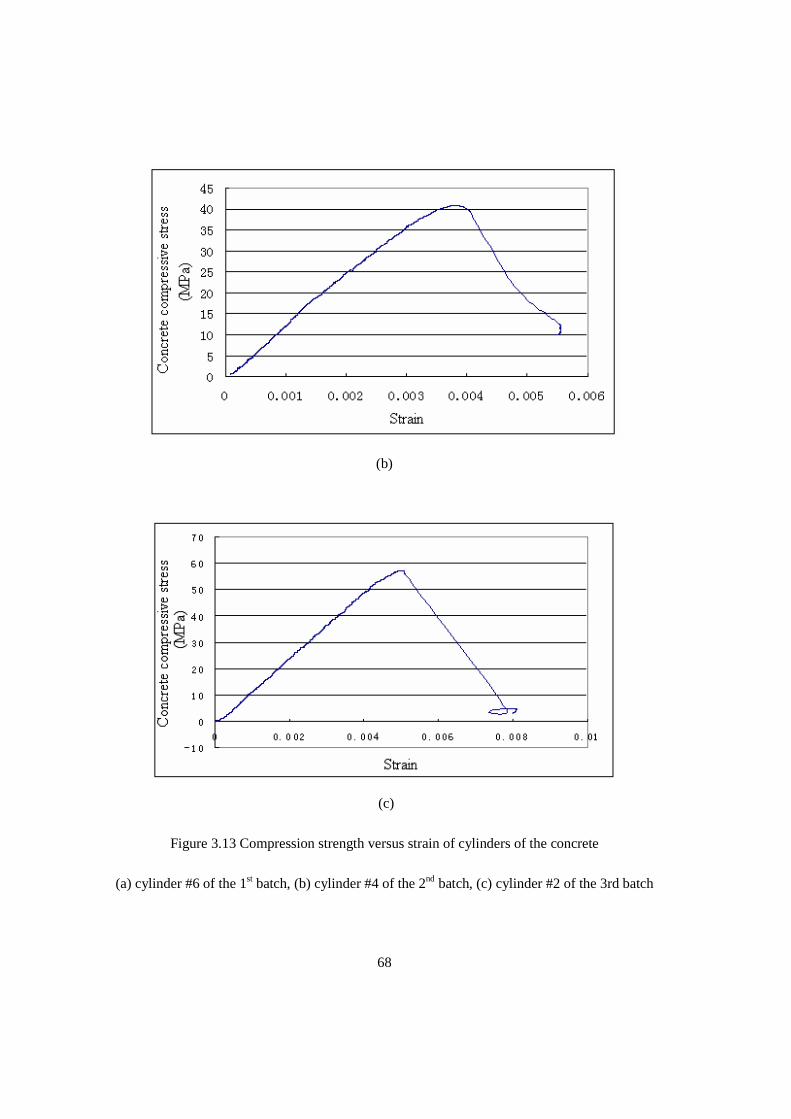
68
(b)
(c)
Figure 3.13 Compression strength versus strain of cylinders of the concrete
(a) cylinder #6 of the 1st batch, (b) cylinder #4 of the 2nd batch, (c) cylinder #2 of the 3rd batch
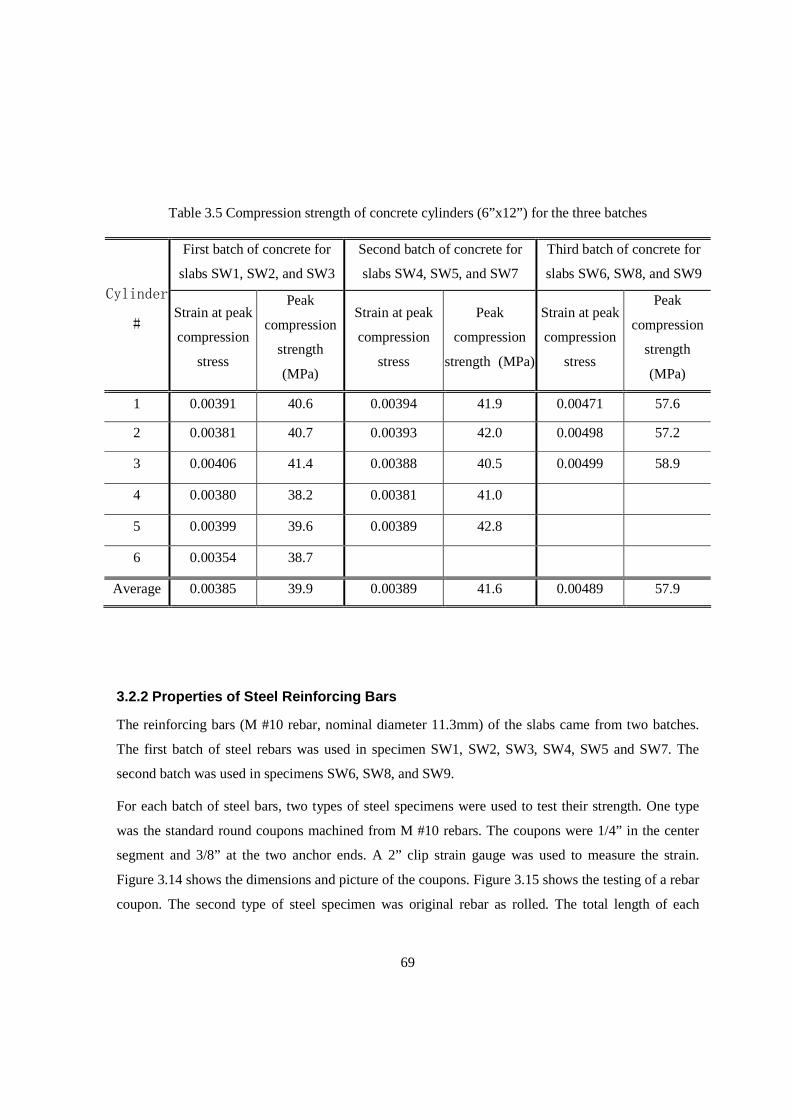
69
Table 3.5 Compression strength of concrete cylinders (6”x12”) for the three batches
3.2.2 Properties of Steel Reinforcing Bars
The reinforcing bars (M #10 rebar, nominal diameter 11.3mm) of the slabs came from two batches.
The first batch of steel rebars was used in specimen SW1, SW2, SW3, SW4, SW5 and SW7. The
second batch was used in specimens SW6, SW8, and SW9.
For each batch of steel bars, two types of steel specimens were used to test their strength. One type
was the standard round coupons machined from M #10 rebars. The coupons were 1/4” in the center
segment and 3/8” at the two anchor ends. A 2” clip strain gauge was used to measure the strain.
Figure 3.14 shows the dimensions and picture of the coupons. Figure 3.15 shows the testing of a rebar
coupon. The second type of steel specimen was original rebar as rolled. The total length of each
First batch of concrete for
slabs SW1, SW2, and SW3
Second batch of concrete for
slabs SW4, SW5, and SW7
Third batch of concrete for
slabs SW6, SW8, and SW9
Cylinder
# Strain at peak
compression
stress
Peak
compression
strength
(MPa)
Strain at peak
compression
stress
Peak
compression
strength (MPa)
Strain at peak
compression
stress
Peak
compression
strength
(MPa)
1 0.00391 40.6 0.00394 41.9 0.00471 57.6
2 0.00381 40.7 0.00393 42.0 0.00498 57.2
3 0.00406 41.4 0.00388 40.5 0.00499 58.9
4 0.00380 38.2 0.00381 41.0
5 0.00399 39.6 0.00389 42.8
6 0.00354 38.7
Average 0.00385 39.9 0.00389 41.6 0.00489 57.9
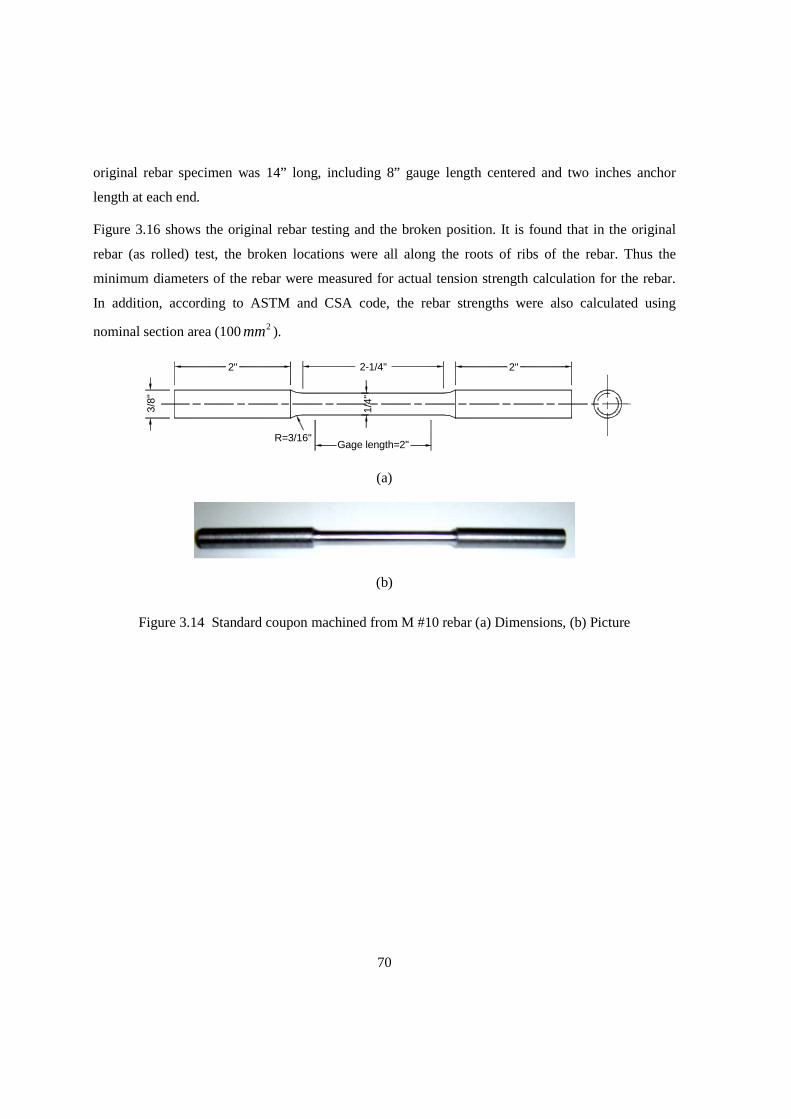
70
original rebar specimen was 14” long, including 8” gauge length centered and two inches anchor
length at each end.
Figure 3.16 shows the original rebar testing and the broken position. It is found that in the original
rebar (as rolled) test, the broken locations were all along the roots of ribs of the rebar. Thus the
minimum diameters of the rebar were measured for actual tension strength calculation for the rebar.
In addition, according to ASTM and CSA code, the rebar strengths were also calculated using
nominal section area (100 2mm ).
R=3/16"
3/8"
2" 2-1/4"1/
4"2"
Gage length=2"
(a)
(b)
Figure 3.14 Standard coupon machined from M #10 rebar (a) Dimensions, (b) Picture
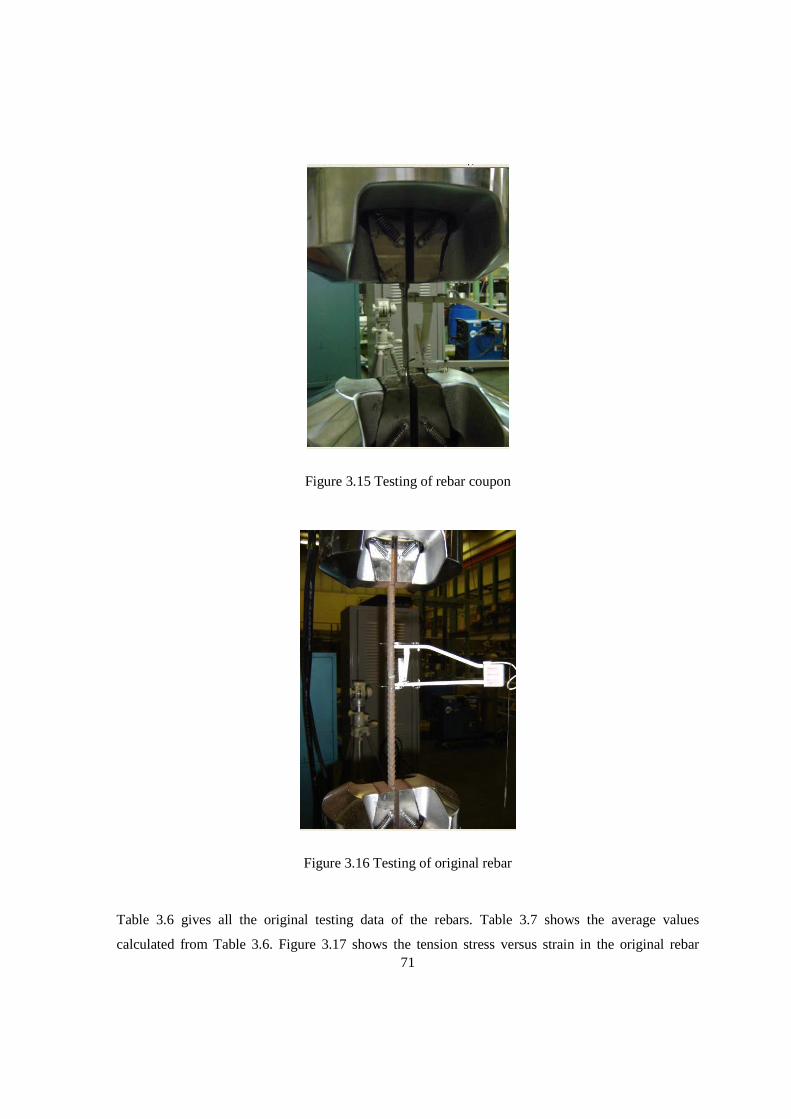
71
Figure 3.15 Testing of rebar coupon
Figure 3.16 Testing of original rebar
Table 3.6 gives all the original testing data of the rebars. Table 3.7 shows the average values
calculated from Table 3.6. Figure 3.17 shows the tension stress versus strain in the original rebar
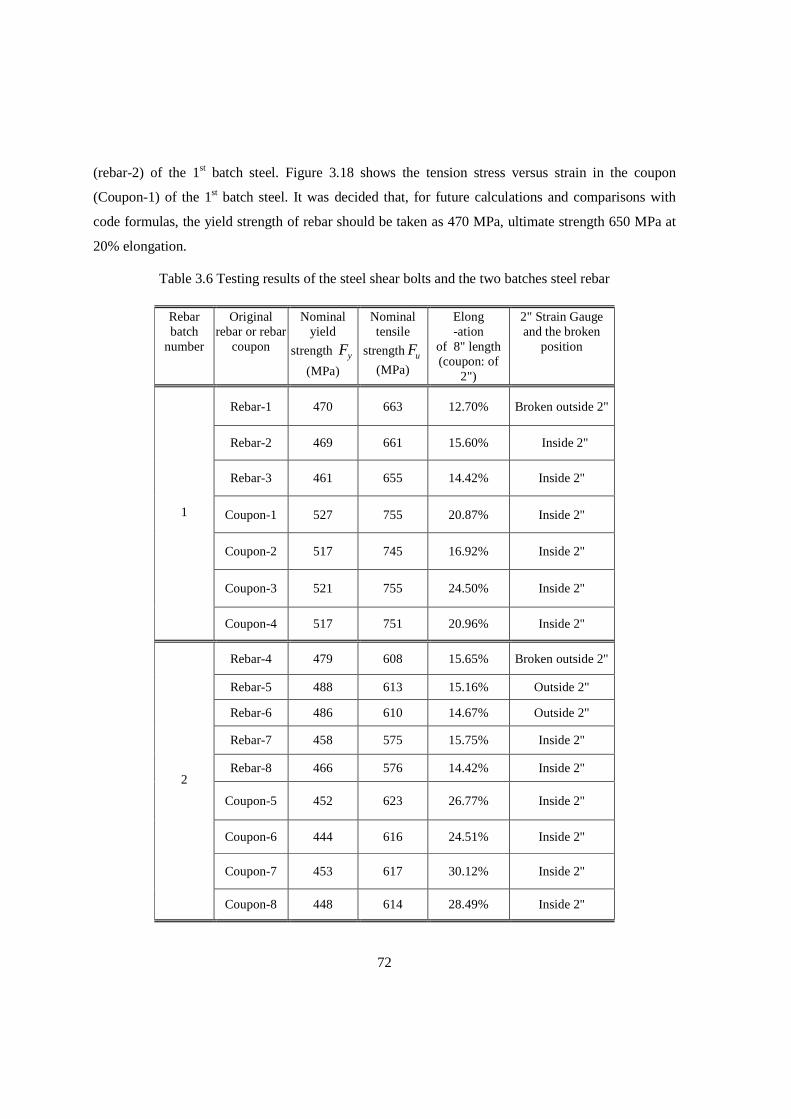
72
(rebar-2) of the 1st batch steel. Figure 3.18 shows the tension stress versus strain in the coupon
(Coupon-1) of the 1st batch steel. It was decided that, for future calculations and comparisons with
code formulas, the yield strength of rebar should be taken as 470 MPa, ultimate strength 650 MPa at
20% elongation.
Table 3.6 Testing results of the steel shear bolts and the two batches steel rebar
Rebar batch
number
Original rebar or rebar
coupon
Nominal yield
strength yF
(MPa)
Nominal tensile
strength uF
(MPa)
Elong -ation
of 8" length (coupon: of
2")
2" Strain Gauge and the broken
position
Rebar-1 470 663 12.70% Broken outside 2"
Rebar-2 469 661 15.60% Inside 2"
Rebar-3 461 655 14.42% Inside 2"
Coupon-1 527 755 20.87% Inside 2"
Coupon-2 517 745 16.92% Inside 2"
Coupon-3 521 755 24.50% Inside 2"
1
Coupon-4 517 751 20.96% Inside 2"
Rebar-4 479 608 15.65% Broken outside 2"
Rebar-5 488 613 15.16% Outside 2"
Rebar-6 486 610 14.67% Outside 2"
Rebar-7 458 575 15.75% Inside 2"
Rebar-8 466 576 14.42% Inside 2"
Coupon-5 452 623 26.77% Inside 2"
Coupon-6 444 616 24.51% Inside 2"
Coupon-7 453 617 30.12% Inside 2"
2
Coupon-8 448 614 28.49% Inside 2"
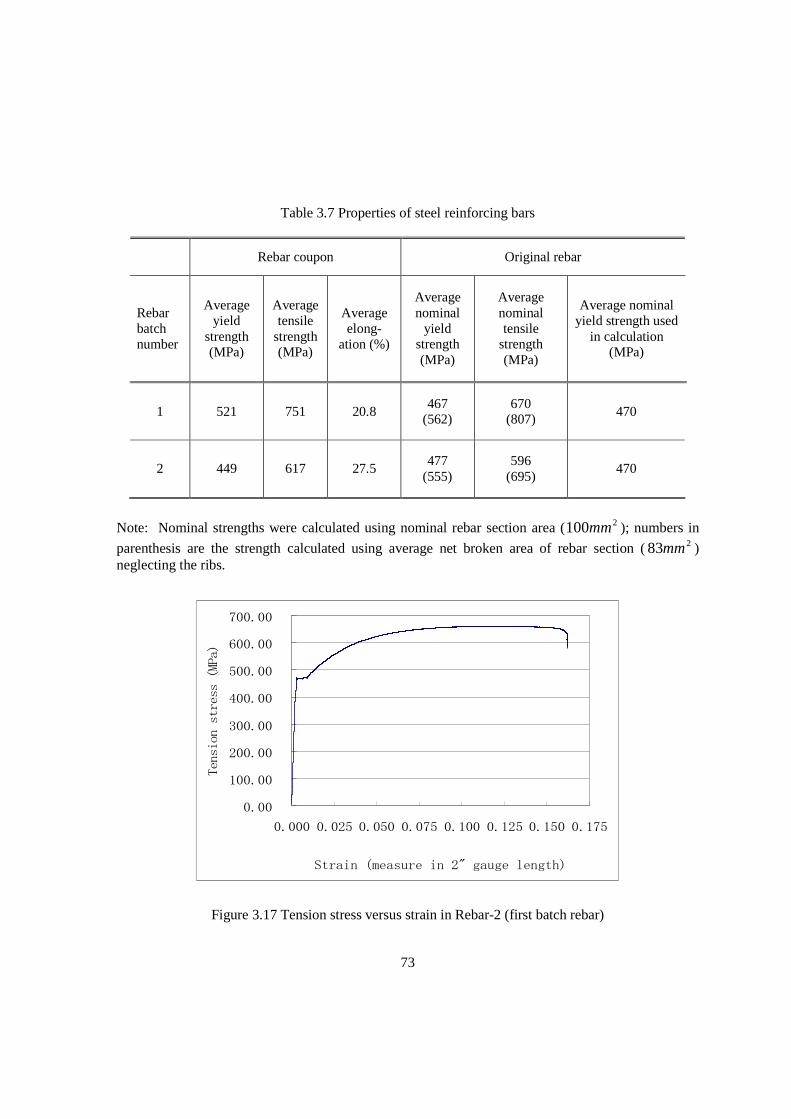
73
Table 3.7 Properties of steel reinforcing bars
Rebar coupon Original rebar
Rebar batch number
Average yield
strength (MPa)
Average tensile
strength (MPa)
Average elong-
ation (%)
Average nominal
yield strength (MPa)
Average nominal tensile
strength (MPa)
Average nominal yield strength used
in calculation (MPa)
1 521 751 20.8 467
(562) 670
(807) 470
2 449 617 27.5 477
(555) 596
(695) 470
Note: Nominal strengths were calculated using nominal rebar section area ( 2100mm ); numbers in
parenthesis are the strength calculated using average net broken area of rebar section ( 283mm ) neglecting the ribs.
0.00
100.00
200.00
300.00
400.00
500.00
600.00
700.00
0.000 0.025 0.050 0.075 0.100 0.125 0.150 0.175
Strain (measure in 2" gauge length)
Tension stress (MPa)
Figure 3.17 Tension stress versus strain in Rebar-2 (first batch rebar)
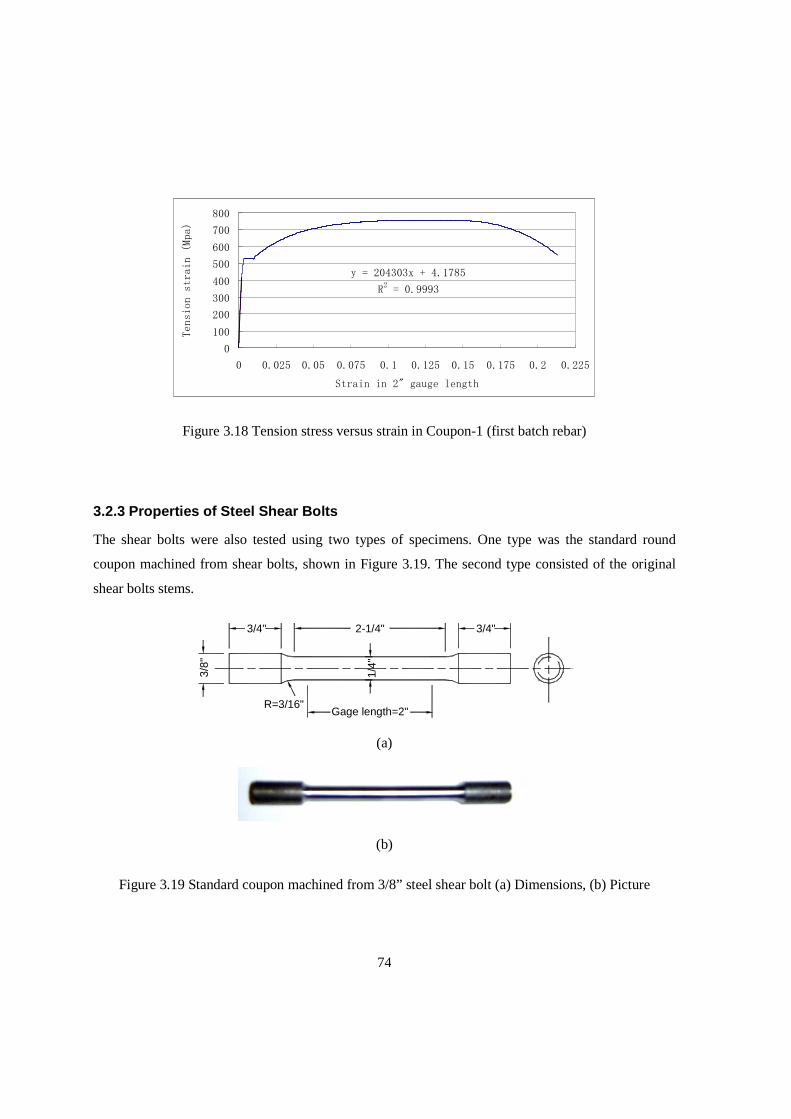
74
y = 204303x + 4.1785
R2 = 0.9993
0
100
200
300
400
500
600
700
800
0 0.025 0.05 0.075 0.1 0.125 0.15 0.175 0.2 0.225
Strain in 2" gauge length
Tension strain (Mpa)
Figure 3.18 Tension stress versus strain in Coupon-1 (first batch rebar)
3.2.3 Properties of Steel Shear Bolts
The shear bolts were also tested using two types of specimens. One type was the standard round
coupon machined from shear bolts, shown in Figure 3.19. The second type consisted of the original
shear bolts stems.
1/4"
2-1/4"
Gage length=2"
3/8"
R=3/16"
3/4" 3/4"
(a)
(b)
Figure 3.19 Standard coupon machined from 3/8” steel shear bolt (a) Dimensions, (b) Picture
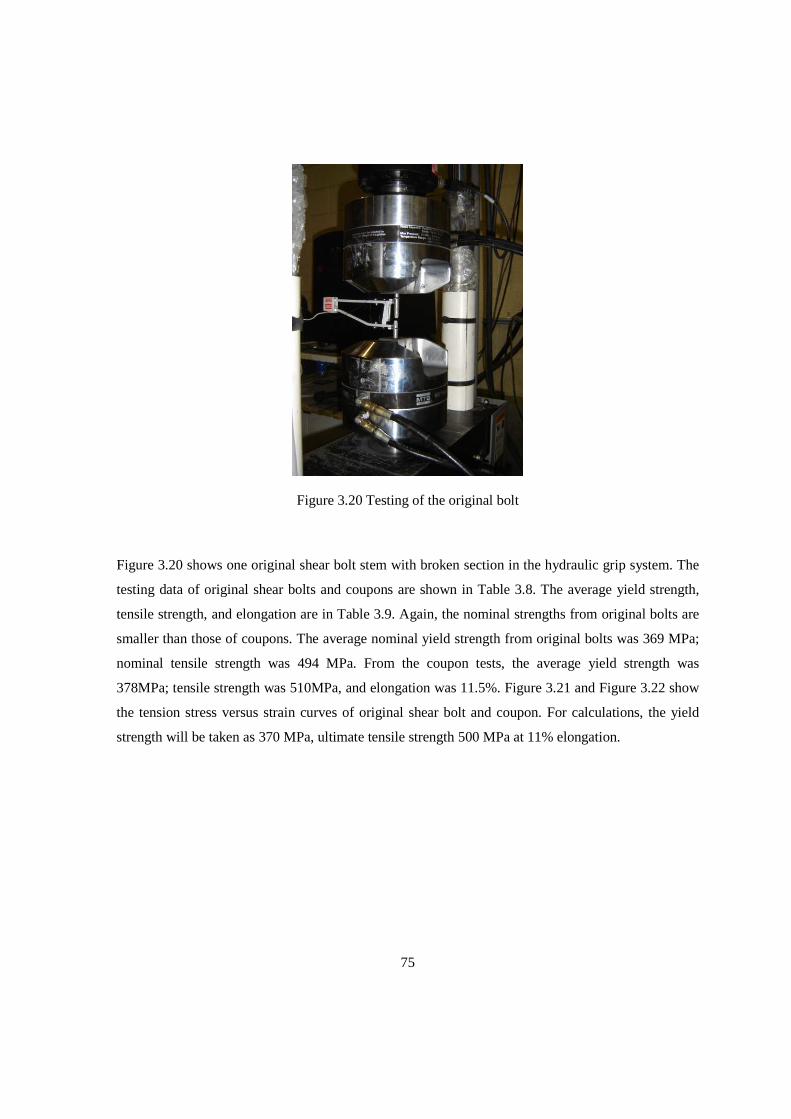
75
Figure 3.20 Testing of the original bolt
Figure 3.20 shows one original shear bolt stem with broken section in the hydraulic grip system. The
testing data of original shear bolts and coupons are shown in Table 3.8. The average yield strength,
tensile strength, and elongation are in Table 3.9. Again, the nominal strengths from original bolts are
smaller than those of coupons. The average nominal yield strength from original bolts was 369 MPa;
nominal tensile strength was 494 MPa. From the coupon tests, the average yield strength was
378MPa; tensile strength was 510MPa, and elongation was 11.5%. Figure 3.21 and Figure 3.22 show
the tension stress versus strain curves of original shear bolt and coupon. For calculations, the yield
strength will be taken as 370 MPa, ultimate tensile strength 500 MPa at 11% elongation.
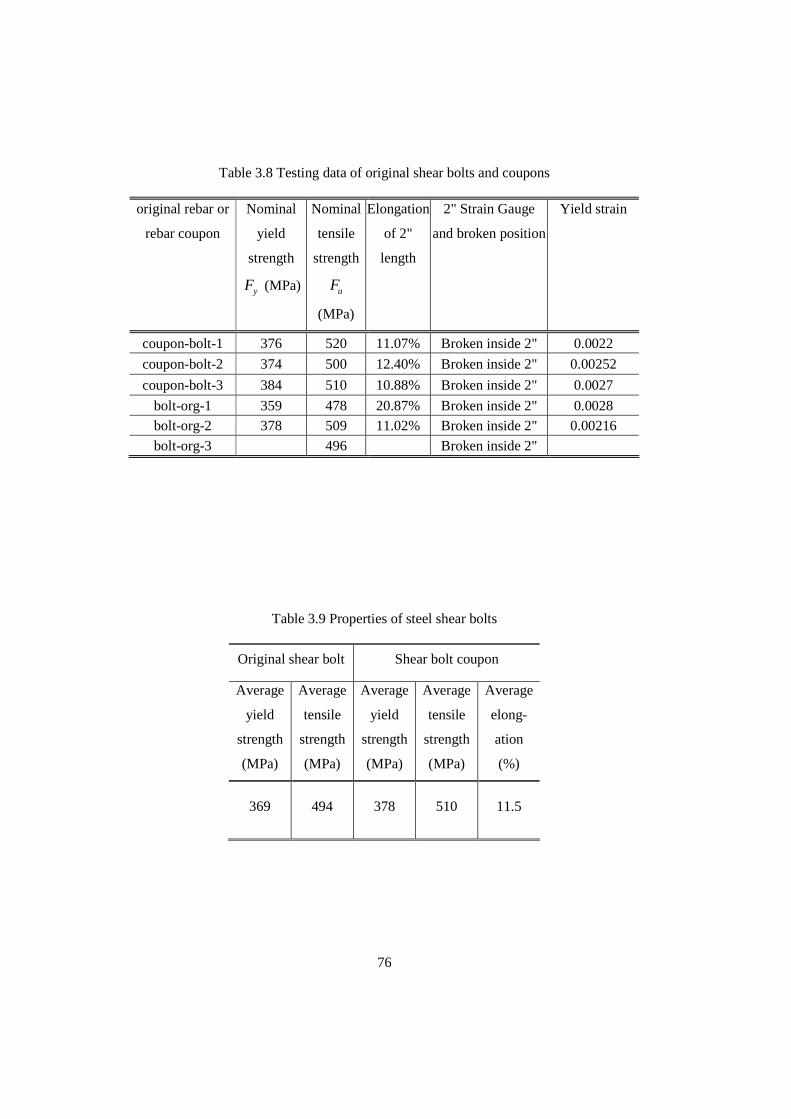
76
Table 3.8 Testing data of original shear bolts and coupons
original rebar or
rebar coupon
Nominal
yield
strength
yF (MPa)
Nominal
tensile
strength
uF
(MPa)
Elongation
of 2"
length
2" Strain Gauge
and broken position
Yield strain
coupon-bolt-1 376 520 11.07% Broken inside 2" 0.0022
coupon-bolt-2 374 500 12.40% Broken inside 2" 0.00252
coupon-bolt-3 384 510 10.88% Broken inside 2" 0.0027
bolt-org-1 359 478 20.87% Broken inside 2" 0.0028
bolt-org-2 378 509 11.02% Broken inside 2" 0.00216
bolt-org-3 496 Broken inside 2"
Table 3.9 Properties of steel shear bolts
Original shear bolt Shear bolt coupon
Average
yield
strength
(MPa)
Average
tensile
strength
(MPa)
Average
yield
strength
(MPa)
Average
tensile
strength
(MPa)
Average
elong-
ation
(%)
369 494 378 510 11.5
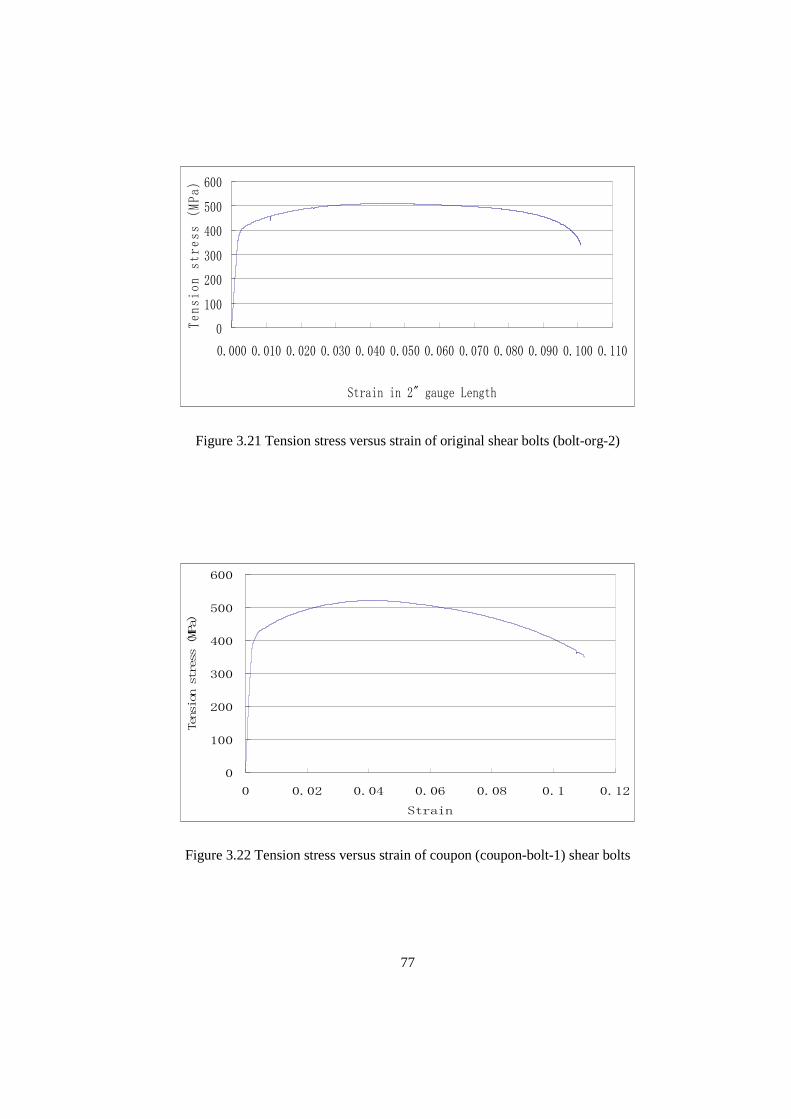
77
0
100
200
300
400
500
600
0.000 0.010 0.020 0.030 0.040 0.050 0.060 0.070 0.080 0.090 0.100 0.110
Strain in 2" gauge Length
Tension stress (MPa)
Figure 3.21 Tension stress versus strain of original shear bolts (bolt-org-2)
0
100
200
300
400
500
600
0 0.02 0.04 0.06 0.08 0.1 0.12
Strain
Tension stress (MPa)
Figure 3.22 Tension stress versus strain of coupon (coupon-bolt-1) shear bolts
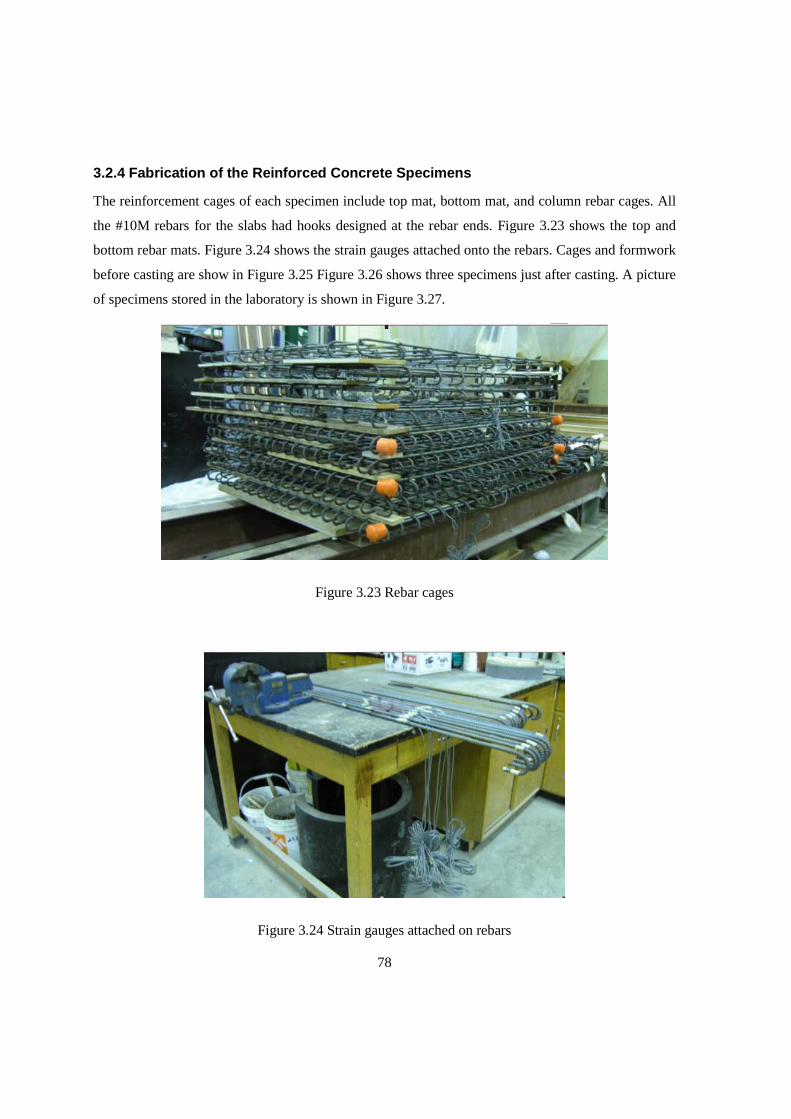
78
3.2.4 Fabrication of the Reinforced Concrete Specim ens
The reinforcement cages of each specimen include top mat, bottom mat, and column rebar cages. All
the #10M rebars for the slabs had hooks designed at the rebar ends. Figure 3.23 shows the top and
bottom rebar mats. Figure 3.24 shows the strain gauges attached onto the rebars. Cages and formwork
before casting are show in Figure 3.25 Figure 3.26 shows three specimens just after casting. A picture
of specimens stored in the laboratory is shown in Figure 3.27.
Figure 3.23 Rebar cages
Figure 3.24 Strain gauges attached on rebars
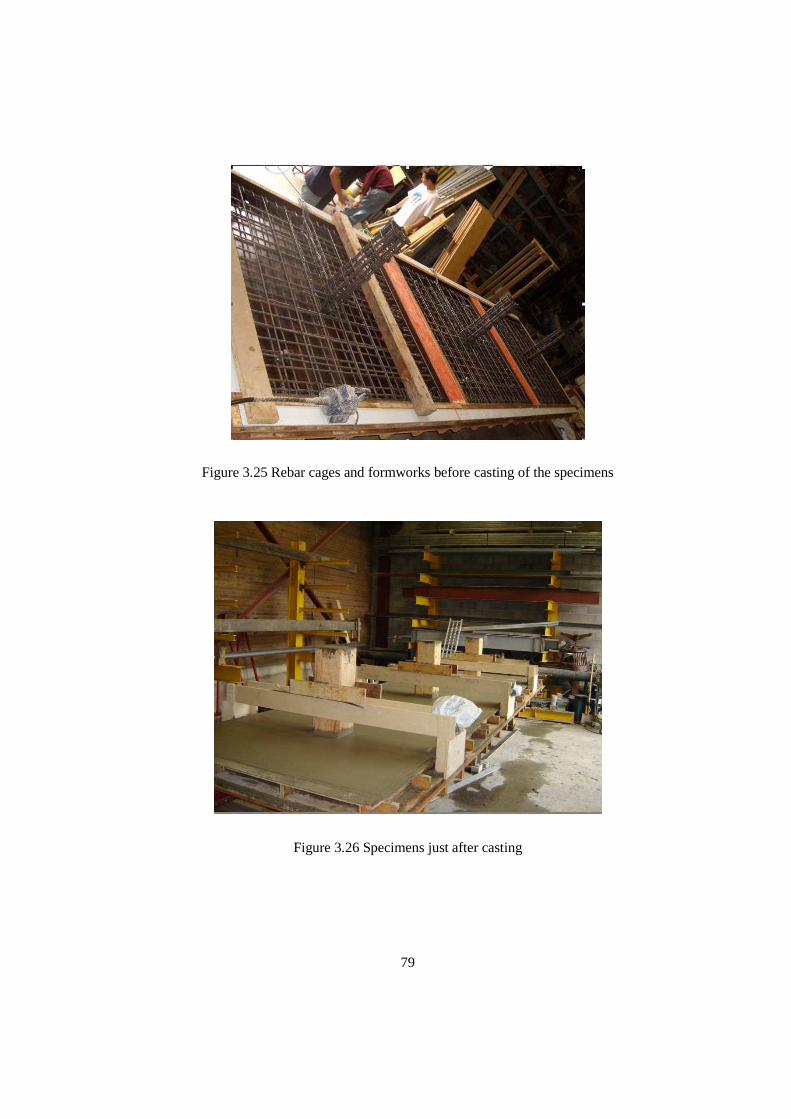
79
Figure 3.25 Rebar cages and formworks before casting of the specimens
Figure 3.26 Specimens just after casting
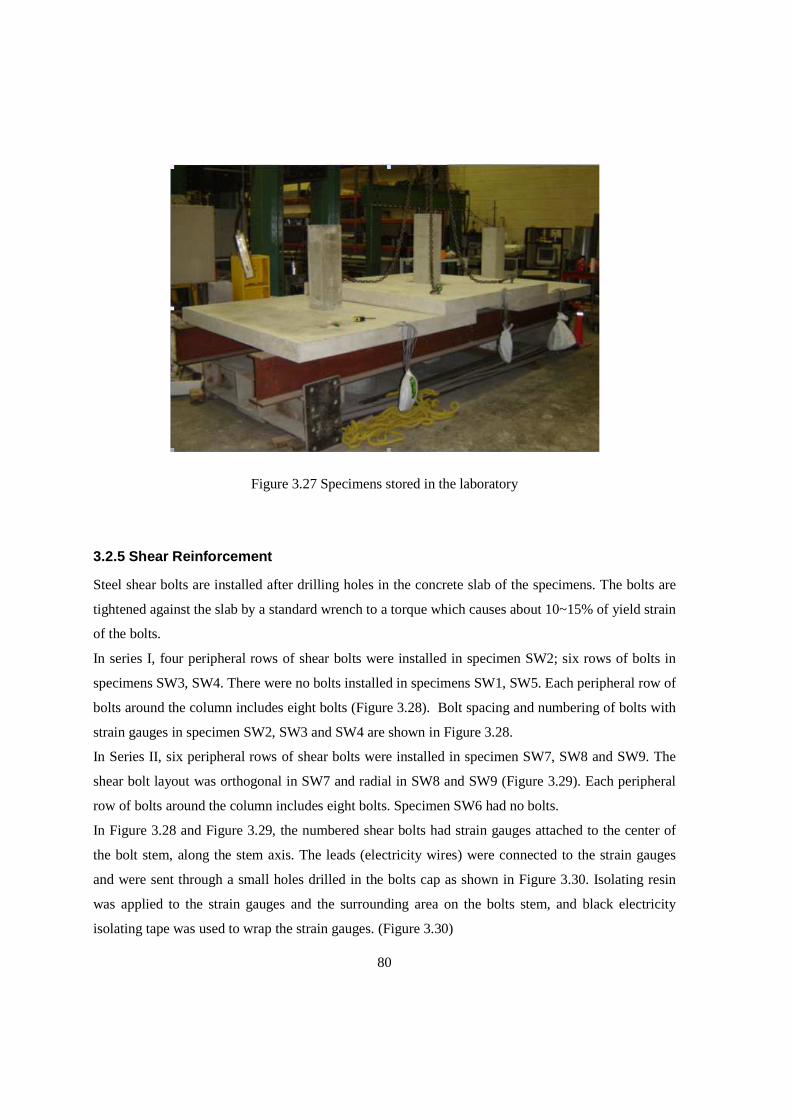
80
Figure 3.27 Specimens stored in the laboratory
3.2.5 Shear Reinforcement
Steel shear bolts are installed after drilling holes in the concrete slab of the specimens. The bolts are
tightened against the slab by a standard wrench to a torque which causes about 10~15% of yield strain
of the bolts.
In series I, four peripheral rows of shear bolts were installed in specimen SW2; six rows of bolts in
specimens SW3, SW4. There were no bolts installed in specimens SW1, SW5. Each peripheral row of
bolts around the column includes eight bolts (Figure 3.28). Bolt spacing and numbering of bolts with
strain gauges in specimen SW2, SW3 and SW4 are shown in Figure 3.28.
In Series II, six peripheral rows of shear bolts were installed in specimen SW7, SW8 and SW9. The
shear bolt layout was orthogonal in SW7 and radial in SW8 and SW9 (Figure 3.29). Each peripheral
row of bolts around the column includes eight bolts. Specimen SW6 had no bolts.
In Figure 3.28 and Figure 3.29, the numbered shear bolts had strain gauges attached to the center of
the bolt stem, along the stem axis. The leads (electricity wires) were connected to the strain gauges
and were sent through a small holes drilled in the bolts cap as shown in Figure 3.30. Isolating resin
was applied to the strain gauges and the surrounding area on the bolts stem, and black electricity
isolating tape was used to wrap the strain gauges. (Figure 3.30)
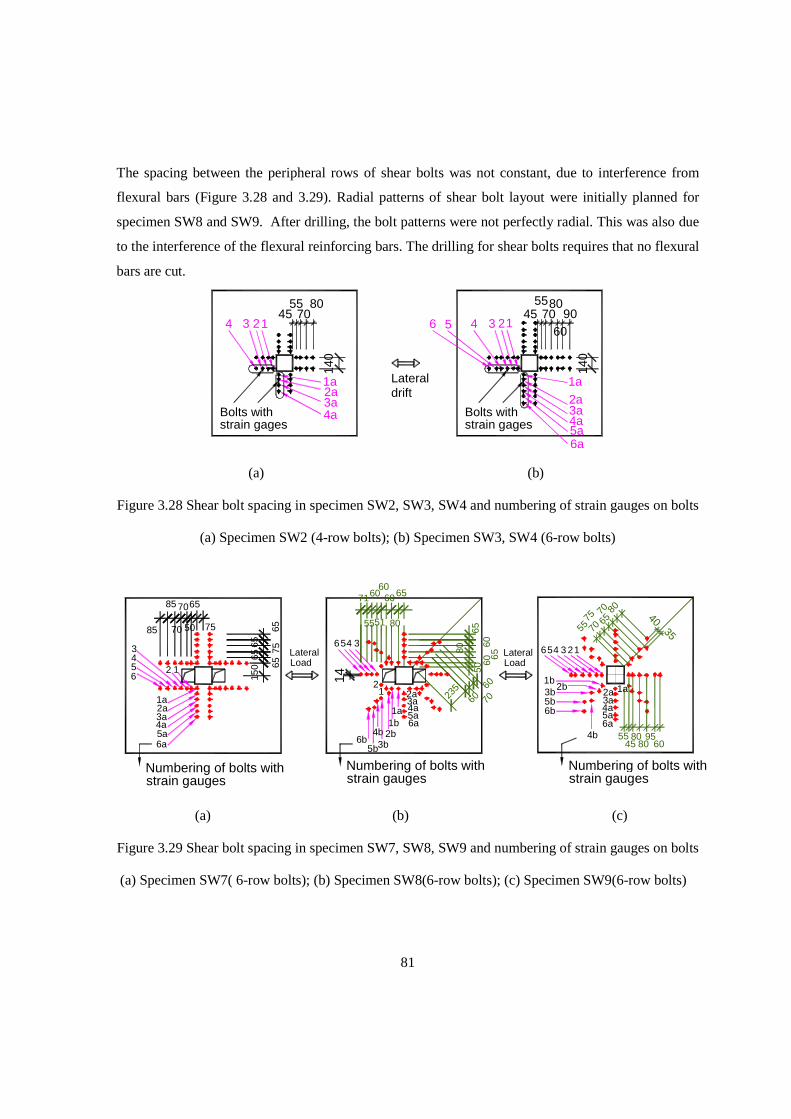
81
The spacing between the peripheral rows of shear bolts was not constant, due to interference from
flexural bars (Figure 3.28 and 3.29). Radial patterns of shear bolt layout were initially planned for
specimen SW8 and SW9. After drilling, the bolt patterns were not perfectly radial. This was also due
to the interference of the flexural reinforcing bars. The drilling for shear bolts requires that no flexural
bars are cut.
Lateraldrift
6 5 134 2
5a
3a4a
1a2a
6a
234 1
4a3a2a1a
4560
8070
5590
5545
8070
Bolts withstrain gages
Bolts withstrain gages
140
140
(a) (b)
Figure 3.28 Shear bolt spacing in specimen SW2, SW3, SW4 and numbering of strain gauges on bolts
(a) Specimen SW2 (4-row bolts); (b) Specimen SW3, SW4 (6-row bolts)
14
5575
80
35
40
65
5545
8080
9560
3456 12
2a 1a3a4a5a6a
1b2b
3b
4b
5b6b
strain gaugesNumbering of bolts with Numbering of bolts with
strain gauges
Load Lateral
12
70
3
654
85
85
70
75
65
2a
4a3a
5a6a
1a
150 65
75
65
50
65
65
Numbering of bolts with
3b5b
4b6b
strain gauges
60
51
LateralLoad
21
3654
55
6071
4a1a1b
2b6a5a
3a2a
65
80
60
80
60235
7060
5060
6560
70
7065
(a) (b) (c)
Figure 3.29 Shear bolt spacing in specimen SW7, SW8, SW9 and numbering of strain gauges on bolts
(a) Specimen SW7( 6-row bolts); (b) Specimen SW8(6-row bolts); (c) Specimen SW9(6-row bolts)
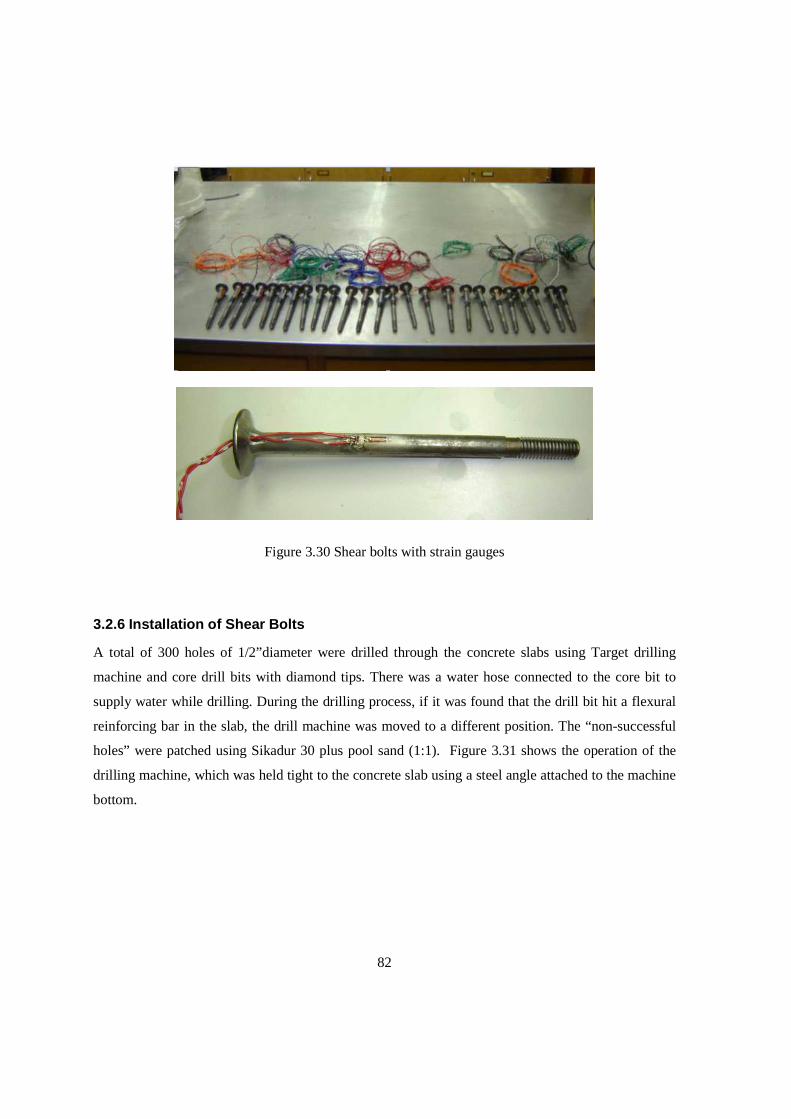
82
Figure 3.30 Shear bolts with strain gauges
3.2.6 Installation of Shear Bolts
A total of 300 holes of 1/2”diameter were drilled through the concrete slabs using Target drilling
machine and core drill bits with diamond tips. There was a water hose connected to the core bit to
supply water while drilling. During the drilling process, if it was found that the drill bit hit a flexural
reinforcing bar in the slab, the drill machine was moved to a different position. The “non-successful
holes” were patched using Sikadur 30 plus pool sand (1:1). Figure 3.31 shows the operation of the
drilling machine, which was held tight to the concrete slab using a steel angle attached to the machine
bottom.
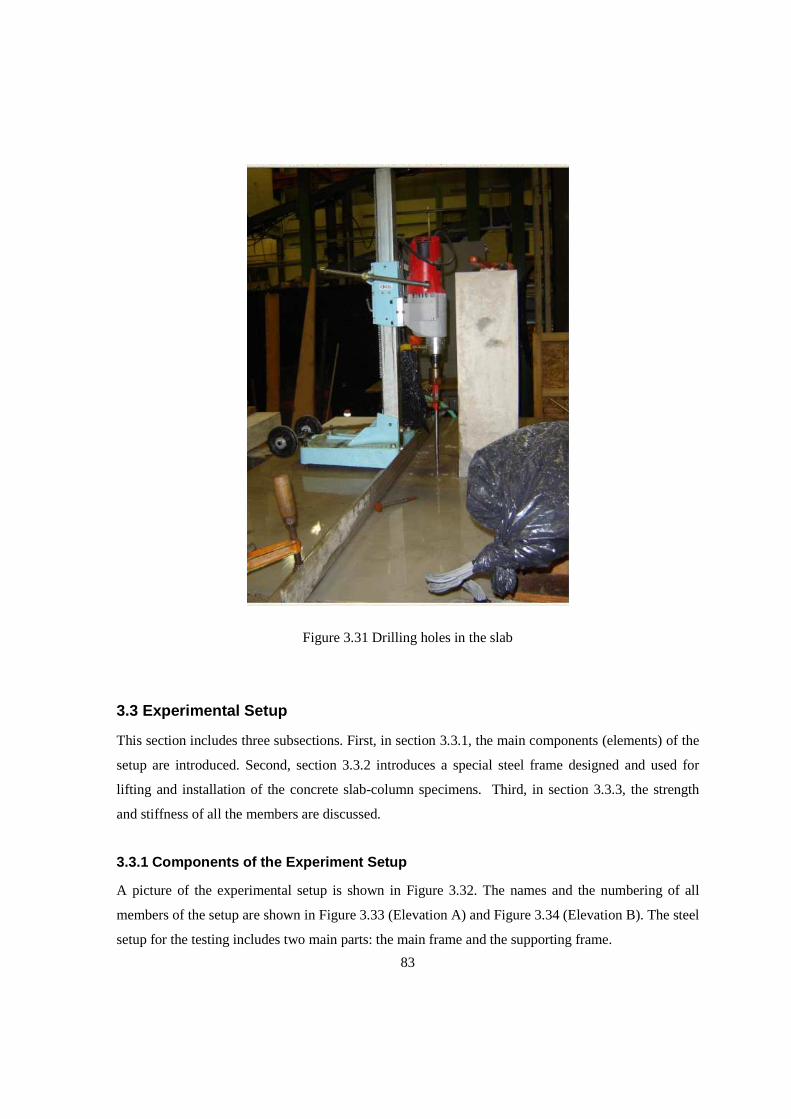
83
Figure 3.31 Drilling holes in the slab
3.3 Experimental Setup
This section includes three subsections. First, in section 3.3.1, the main components (elements) of the
setup are introduced. Second, section 3.3.2 introduces a special steel frame designed and used for
lifting and installation of the concrete slab-column specimens. Third, in section 3.3.3, the strength
and stiffness of all the members are discussed.
3.3.1 Components of the Experiment Setup
A picture of the experimental setup is shown in Figure 3.32. The names and the numbering of all
members of the setup are shown in Figure 3.33 (Elevation A) and Figure 3.34 (Elevation B). The steel
setup for the testing includes two main parts: the main frame and the supporting frame.
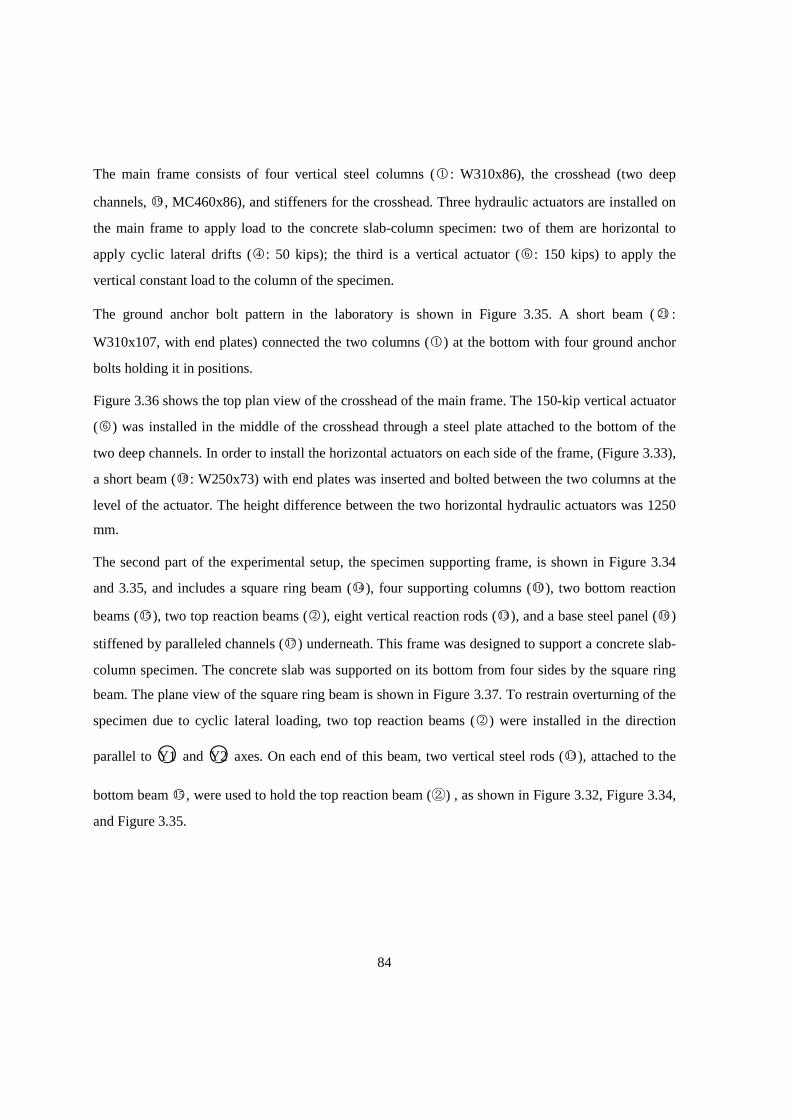
84
The main frame consists of four vertical steel columns (○1 : W310x86), the crosshead (two deep
channels, ○19, MC460x86), and stiffeners for the crosshead. Three hydraulic actuators are installed on
the main frame to apply load to the concrete slab-column specimen: two of them are horizontal to
apply cyclic lateral drifts (○4 : 50 kips); the third is a vertical actuator (○6 : 150 kips) to apply the
vertical constant load to the column of the specimen.
The ground anchor bolt pattern in the laboratory is shown in Figure 3.35. A short beam (○21 :
W310x107, with end plates) connected the two columns (○1 ) at the bottom with four ground anchor
bolts holding it in positions.
Figure 3.36 shows the top plan view of the crosshead of the main frame. The 150-kip vertical actuator
(○6 ) was installed in the middle of the crosshead through a steel plate attached to the bottom of the
two deep channels. In order to install the horizontal actuators on each side of the frame, (Figure 3.33),
a short beam (○18: W250x73) with end plates was inserted and bolted between the two columns at the
level of the actuator. The height difference between the two horizontal hydraulic actuators was 1250
mm.
The second part of the experimental setup, the specimen supporting frame, is shown in Figure 3.34
and 3.35, and includes a square ring beam (○14), four supporting columns (○10), two bottom reaction
beams (○15), two top reaction beams (○2 ), eight vertical reaction rods (○13), and a base steel panel (○16)
stiffened by paralleled channels (○17) underneath. This frame was designed to support a concrete slab-
column specimen. The concrete slab was supported on its bottom from four sides by the square ring
beam. The plane view of the square ring beam is shown in Figure 3.37. To restrain overturning of the
specimen due to cyclic lateral loading, two top reaction beams (○2 ) were installed in the direction
parallel to ○Y1 and ○Y2 axes. On each end of this beam, two vertical steel rods (○13), attached to the
bottom beam ○15 , were used to hold the top reaction beam (②) , as shown in Figure 3.32, Figure 3.34,
and Figure 3.35.

85
Figure 3.32 Picture of experimental setup
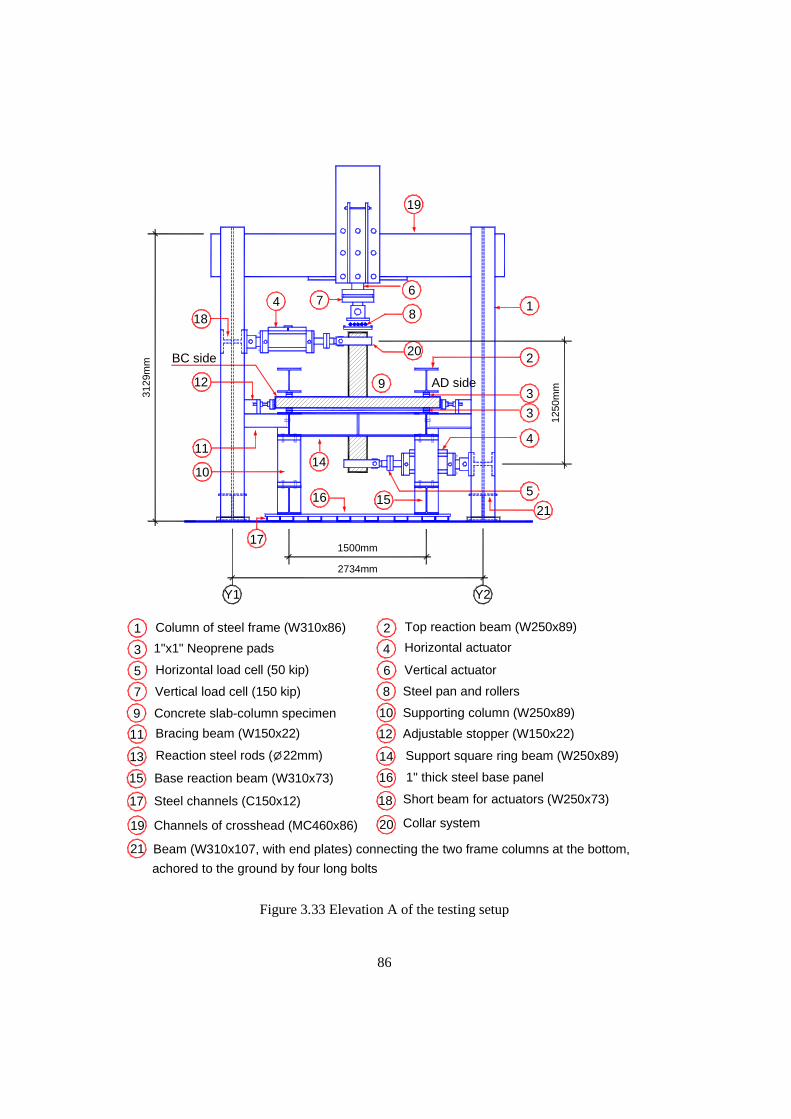
86
Horizontal actuator
Steel pan and rollers
Adjustable stopper (W150x22)
10
Horizontal load cell (50 kip)
1"x1" Neoprene pads
Column of steel frame (W310x86)
Concrete slab-column specimen
Vertical load cell (150 kip)
Bracing beam (W150x22)
BC side
4
5
3
1
7
9
11
12
11
4
2
10
8
6
12
9
7
Support square ring beam (W250x89)
AD side
6
8
Vertical actuator
1
5
4
3
3
2
Beam (W310x107, with end plates) connecting the two frame columns at the bottom,
achored to the ground by four long bolts
21
21
Short beam for actuators (W250x73)18
18
Base reaction beam (W310x73)15
15
Steel channels (C150x12)
1" thick steel base panel
17
16
16
17
Reaction steel rods ( 22mm)13
Top reaction beam (W250x89)
Supporting column (W250x89)
20
Collar system20
19
19 Channels of crosshead (MC460x86)
14
14
Y1
2734mm
Y2
1500mm12
50m
m
3129
mm
Figure 3.33 Elevation A of the testing setup
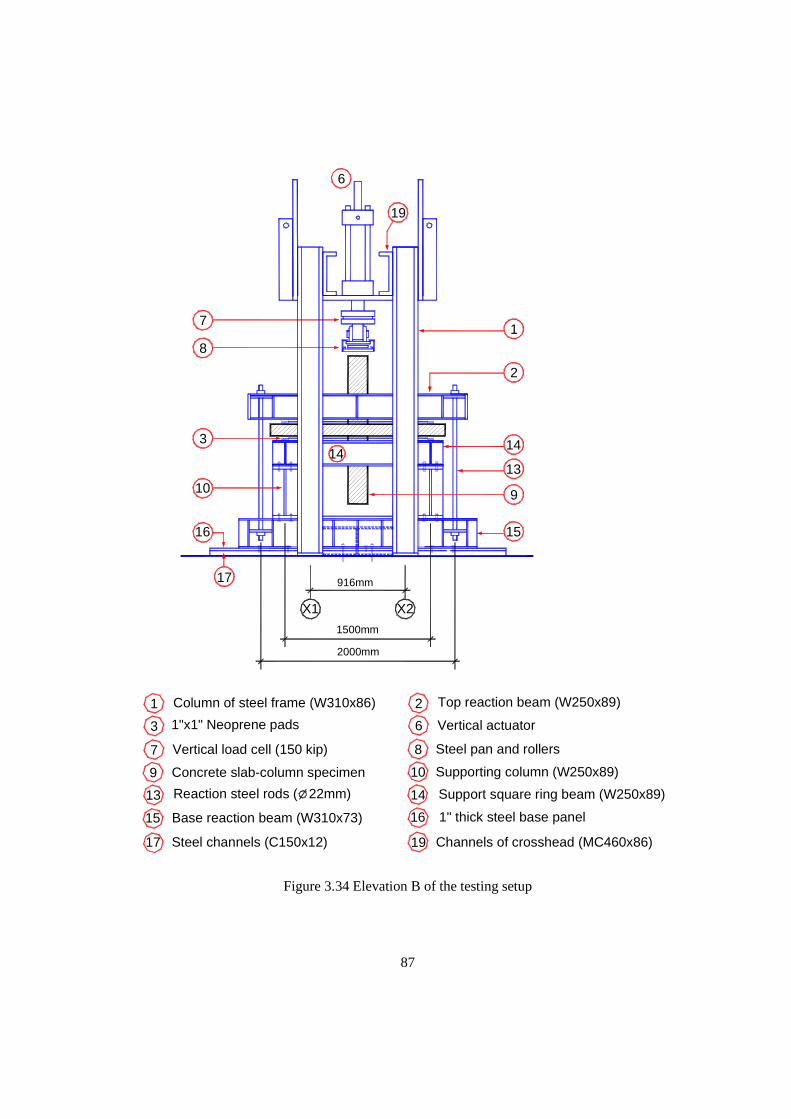
87
8
7
6
13
1
2
15
1414
10
16
17
19
3
916mm
X2X1
1500mm
2000mm
Top reaction beam (W250x89)
Supporting column (W250x89)
Support square ring beam (W250x89)
1" thick steel base panel
Vertical load cell (150 kip)
1"x1" Neoprene pads
Column of steel frame (W310x86)
Concrete slab-column specimen
Channels of crosshead (MC460x86)Steel channels (C150x12)
Base reaction beam (W310x73)
Reaction steel rods ( 22mm)
3
1
7
9
1917
15
13
2
6
8
16
14
10
Vertical actuator
Steel pan and rollers
9
Figure 3.34 Elevation B of the testing setup
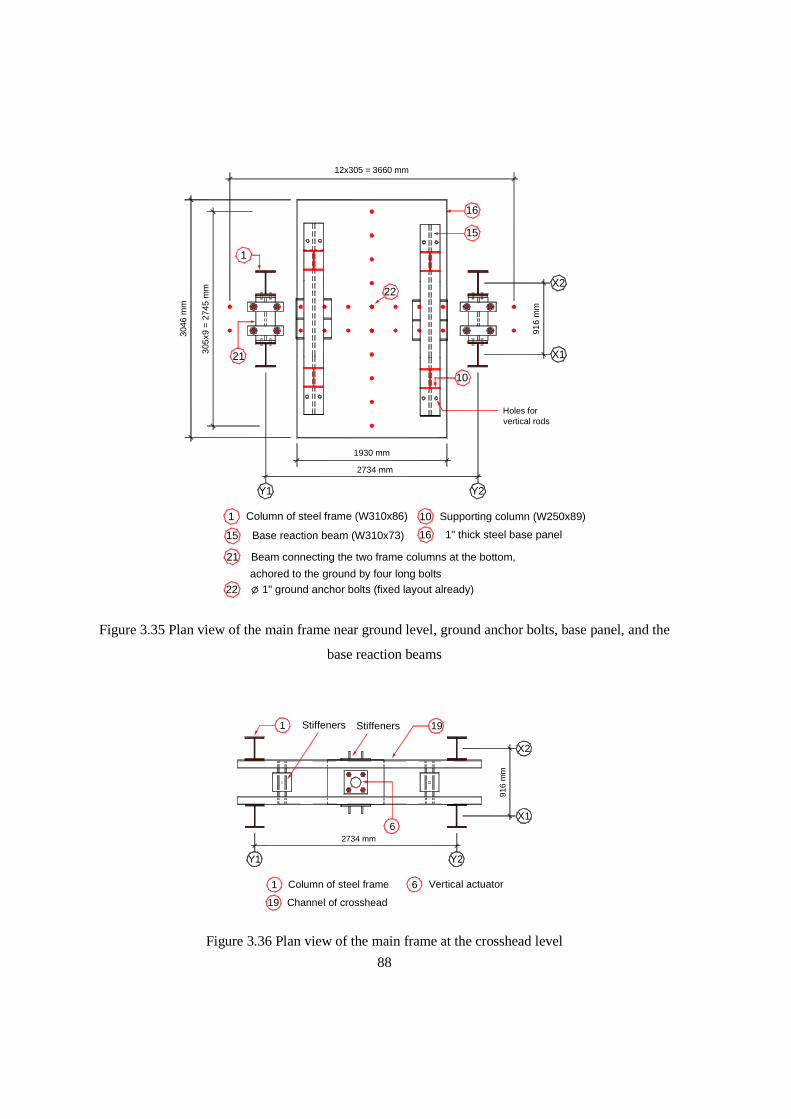
88
16
15
10
Holes forvertical rods
Base reaction beam (W310x73) 1" thick steel base panel1615
Supporting column (W250x89)10Column of steel frame (W310x86)1
22
1
2734 mm
achored to the ground by four long bolts
Beam connecting the two frame columns at the bottom,
1" ground anchor bolts (fixed layout already)
Y1
21
22
21305x
9 =
274
5 m
m X2
Y2
X1
916
mm
12x305 = 3660 mm30
46 m
m
1930 mm
Figure 3.35 Plan view of the main frame near ground level, ground anchor bolts, base panel, and the
base reaction beams
6 Vertical actuator1 Column of steel frame
2734 mm
Y1 Y2
X2
6X1
916
mm
1 19
19 Channel of crosshead
StiffenersStiffeners
Figure 3.36 Plan view of the main frame at the crosshead level
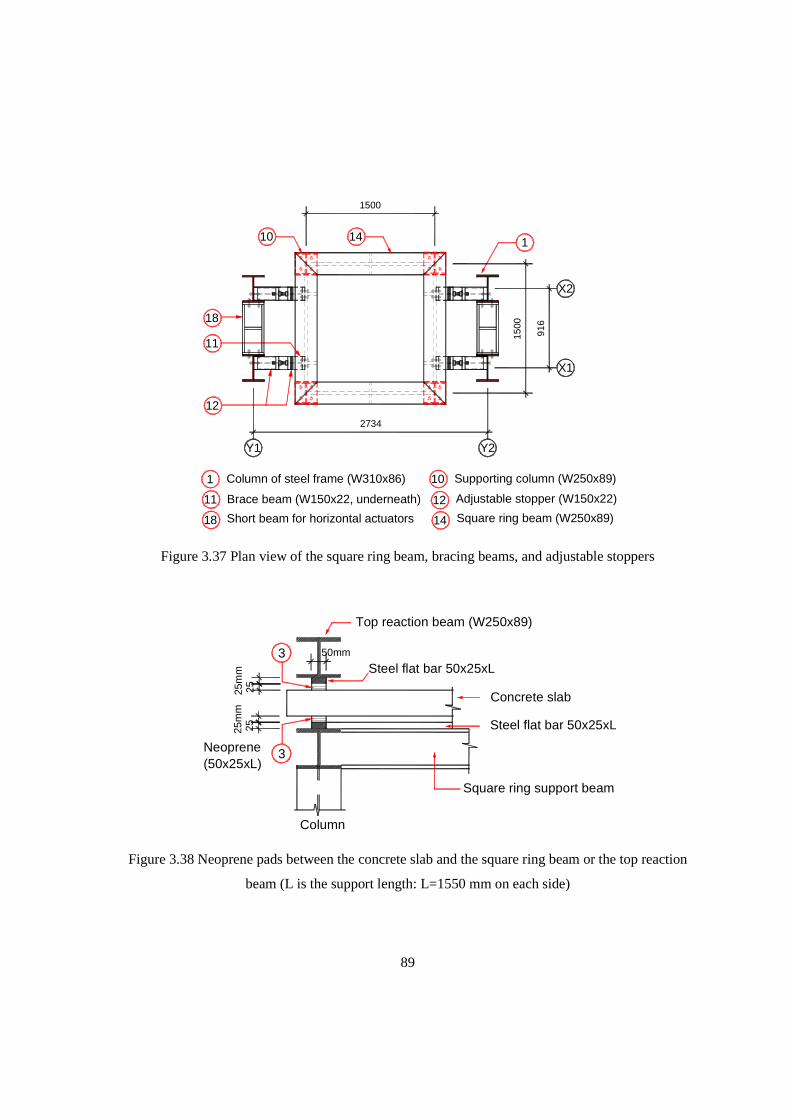
89
10
12
11
Adjustable stopper (W150x22)11 Brace beam (W150x22, underneath)
Supporting column (W250x89)10
1
Column of steel frame (W310x86)1
12
14
14 Square ring beam (W250x89)
18
Short beam for horizontal actuators18
Y1 Y2
X1
X2
2734
916
1500
1500
Figure 3.37 Plan view of the square ring beam, bracing beams, and adjustable stoppers
Concrete slab
Top reaction beam (W250x89)
Square ring support beam
3
3
Column
Steel flat bar 50x25xL
Steel flat bar 50x25xL
Neoprene
25m
m25
25m
m25
50mm
(50x25xL)
Figure 3.38 Neoprene pads between the concrete slab and the square ring beam or the top reaction
beam (L is the support length: L=1550 mm on each side)
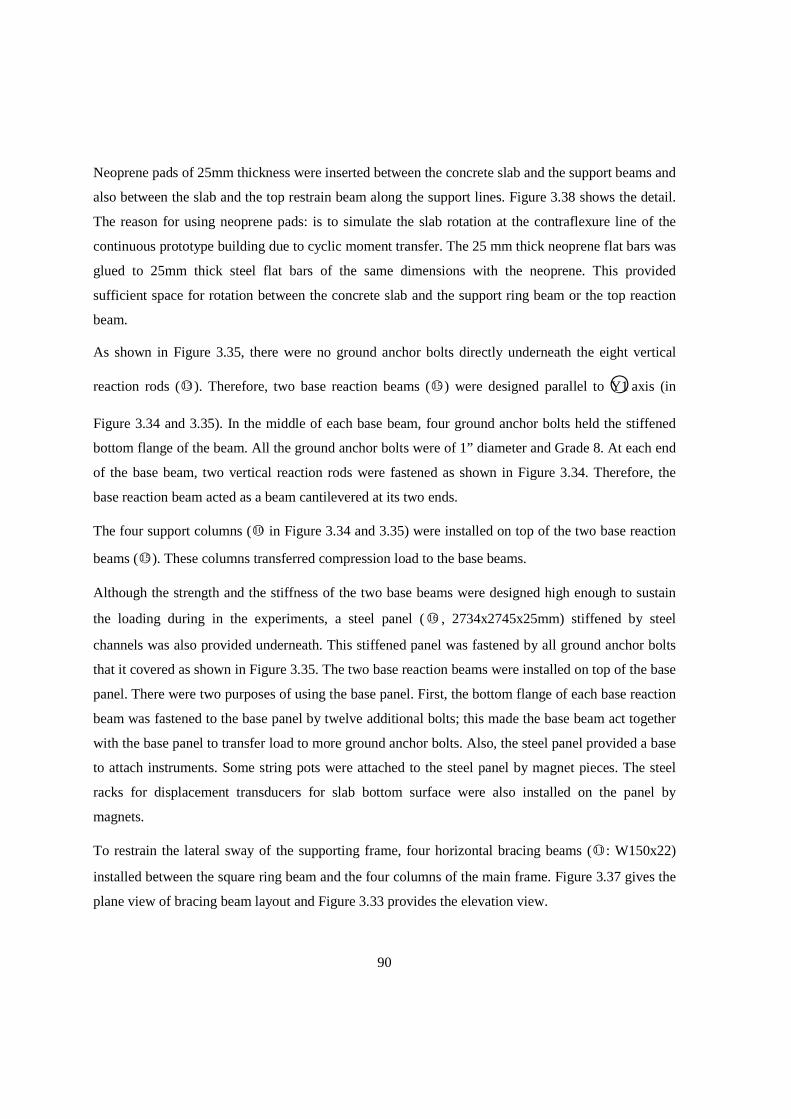
90
Neoprene pads of 25mm thickness were inserted between the concrete slab and the support beams and
also between the slab and the top restrain beam along the support lines. Figure 3.38 shows the detail.
The reason for using neoprene pads: is to simulate the slab rotation at the contraflexure line of the
continuous prototype building due to cyclic moment transfer. The 25 mm thick neoprene flat bars was
glued to 25mm thick steel flat bars of the same dimensions with the neoprene. This provided
sufficient space for rotation between the concrete slab and the support ring beam or the top reaction
beam.
As shown in Figure 3.35, there were no ground anchor bolts directly underneath the eight vertical
reaction rods (○13). Therefore, two base reaction beams (○15) were designed parallel to ○Y1 axis (in
Figure 3.34 and 3.35). In the middle of each base beam, four ground anchor bolts held the stiffened
bottom flange of the beam. All the ground anchor bolts were of 1” diameter and Grade 8. At each end
of the base beam, two vertical reaction rods were fastened as shown in Figure 3.34. Therefore, the
base reaction beam acted as a beam cantilevered at its two ends.
The four support columns (○10 in Figure 3.34 and 3.35) were installed on top of the two base reaction
beams (○15). These columns transferred compression load to the base beams.
Although the strength and the stiffness of the two base beams were designed high enough to sustain
the loading during in the experiments, a steel panel (○16 , 2734x2745x25mm) stiffened by steel
channels was also provided underneath. This stiffened panel was fastened by all ground anchor bolts
that it covered as shown in Figure 3.35. The two base reaction beams were installed on top of the base
panel. There were two purposes of using the base panel. First, the bottom flange of each base reaction
beam was fastened to the base panel by twelve additional bolts; this made the base beam act together
with the base panel to transfer load to more ground anchor bolts. Also, the steel panel provided a base
to attach instruments. Some string pots were attached to the steel panel by magnet pieces. The steel
racks for displacement transducers for slab bottom surface were also installed on the panel by
magnets.
To restrain the lateral sway of the supporting frame, four horizontal bracing beams (○11 : W150x22)
installed between the square ring beam and the four columns of the main frame. Figure 3.37 gives the
plane view of bracing beam layout and Figure 3.33 provides the elevation view.
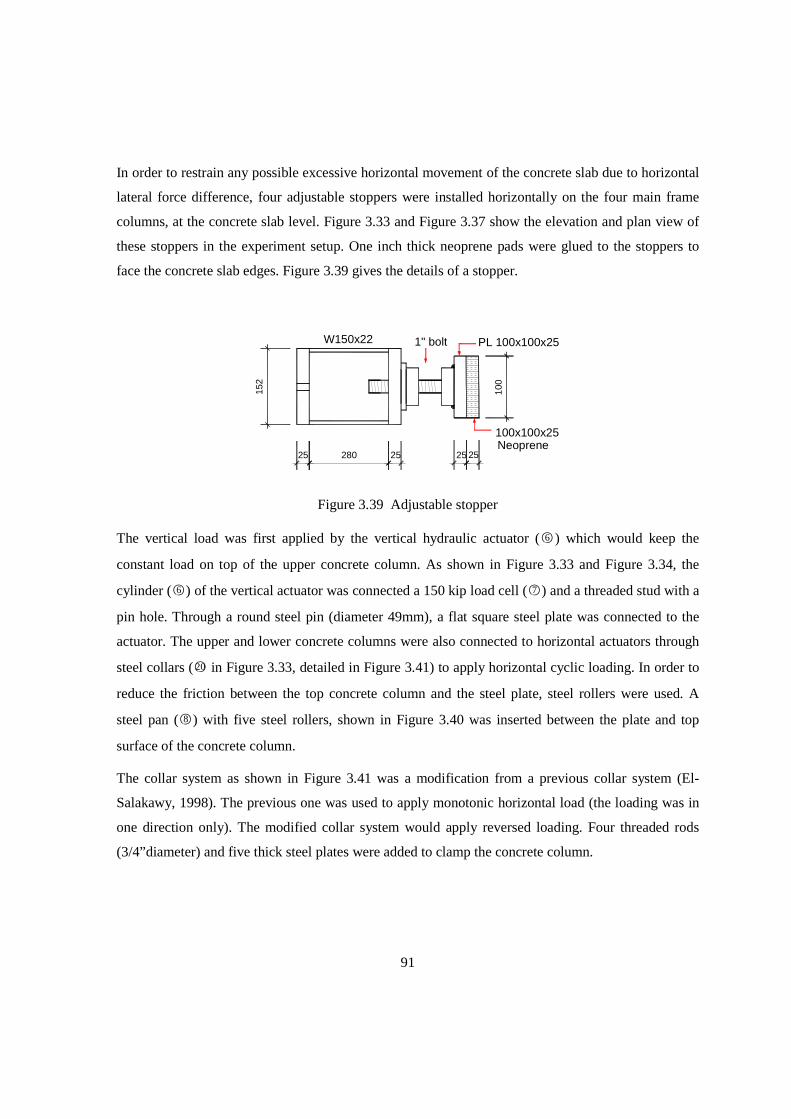
91
In order to restrain any possible excessive horizontal movement of the concrete slab due to horizontal
lateral force difference, four adjustable stoppers were installed horizontally on the four main frame
columns, at the concrete slab level. Figure 3.33 and Figure 3.37 show the elevation and plan view of
these stoppers in the experiment setup. One inch thick neoprene pads were glued to the stoppers to
face the concrete slab edges. Figure 3.39 gives the details of a stopper.
1" boltW150x22 PL 100x100x25
100x100x25 Neoprene
25 25 2528025
152
100
Figure 3.39 Adjustable stopper
The vertical load was first applied by the vertical hydraulic actuator (○6 ) which would keep the
constant load on top of the upper concrete column. As shown in Figure 3.33 and Figure 3.34, the
cylinder (○6 ) of the vertical actuator was connected a 150 kip load cell (○7 ) and a threaded stud with a
pin hole. Through a round steel pin (diameter 49mm), a flat square steel plate was connected to the
actuator. The upper and lower concrete columns were also connected to horizontal actuators through
steel collars (○20 in Figure 3.33, detailed in Figure 3.41) to apply horizontal cyclic loading. In order to
reduce the friction between the top concrete column and the steel plate, steel rollers were used. A
steel pan (○8 ) with five steel rollers, shown in Figure 3.40 was inserted between the plate and top
surface of the concrete column.
The collar system as shown in Figure 3.41 was a modification from a previous collar system (El-
Salakawy, 1998). The previous one was used to apply monotonic horizontal load (the loading was in
one direction only). The modified collar system would apply reversed loading. Four threaded rods
(3/4”diameter) and five thick steel plates were added to clamp the concrete column.
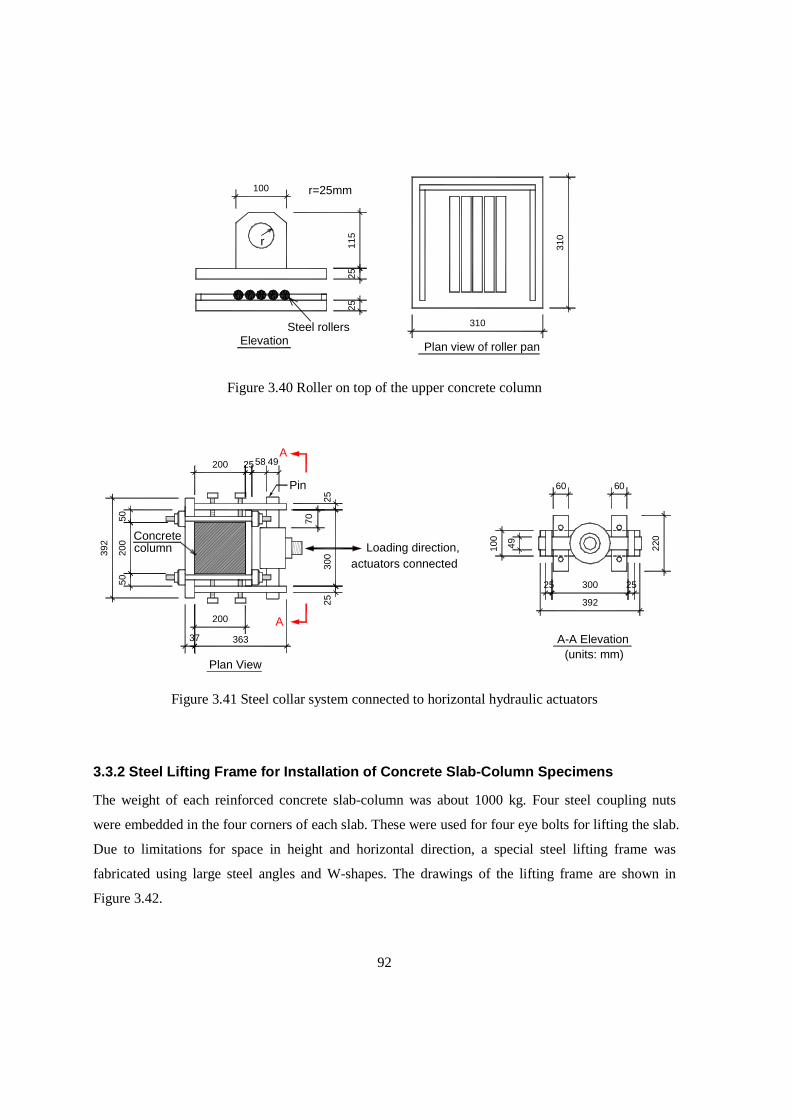
92
r=25mm
r
100
115
2525
310
310Steel rollersElevation Plan view of roller pan
Figure 3.40 Roller on top of the upper concrete column
A-A Elevation
column
Plan View
A
A
50
392
200
50
200 2558
70
300
2525
36337
60
392
60
220
2530025
100
49
49
Concrete
200
Pin
(units: mm)
Loading direction, actuators connected
Figure 3.41 Steel collar system connected to horizontal hydraulic actuators
3.3.2 Steel Lifting Frame for Installation of Concr ete Slab-Column Specimens
The weight of each reinforced concrete slab-column was about 1000 kg. Four steel coupling nuts
were embedded in the four corners of each slab. These were used for four eye bolts for lifting the slab.
Due to limitations for space in height and horizontal direction, a special steel lifting frame was
fabricated using large steel angles and W-shapes. The drawings of the lifting frame are shown in
Figure 3.42.
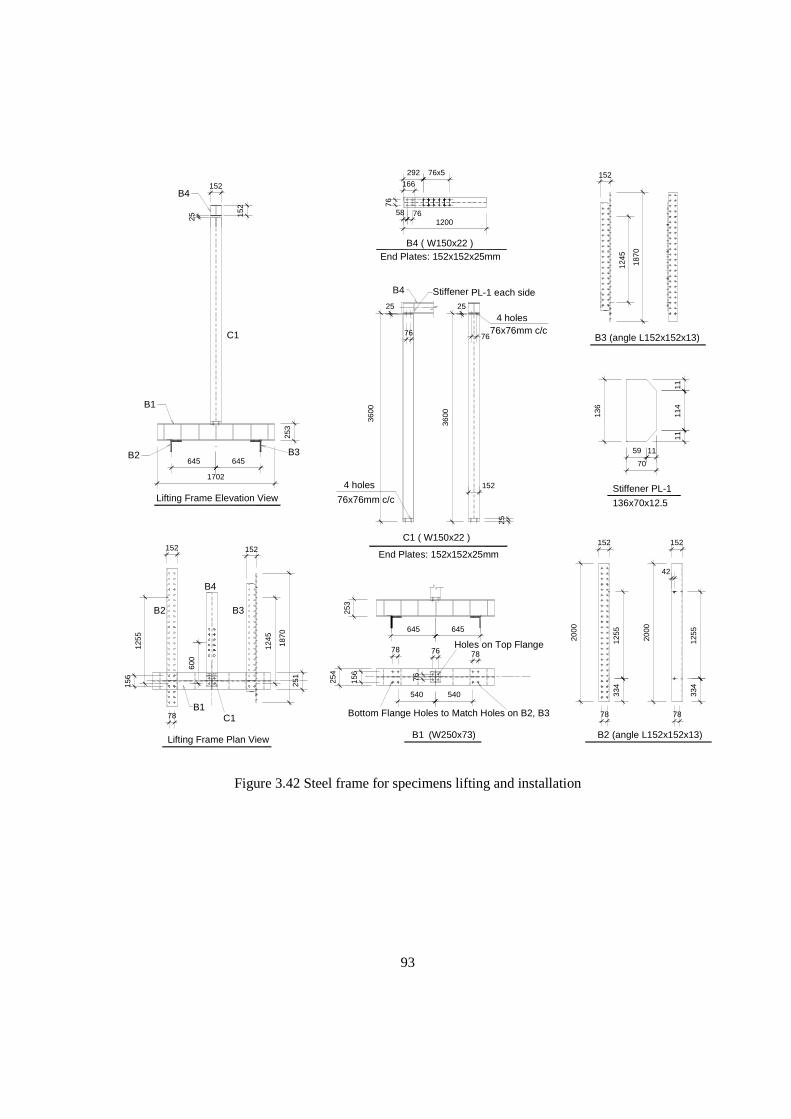
93
1245
1870
1200
1870
78 C1B1
645 645
1702
152
B4
156
600
1255
B2 B3
B2
Lifting Frame Elevation View
152
1245
B3
C1
B1
253
Bottom Flange Holes to Match Holes on B2, B3 7878
B1 B2 (angle L152x152x13)
11
11
136
59
70
3600
3600
Holes on Top Flange
25
152
End Plates: 152x152x25mm
253
156
254
7878 76
540
76
540
645645
76x76mm c/c
4 holes
C1 ( W150x22 )
2000
2000
1255
334
334
152
Stiffener PL-1
136x70x12.5
152
42
Stiffener
End Plates: 152x152x25mm
76
25
76
25
B4 ( W150x22 )
B3 (angle L152x152x13)
114
11
76x76mm c/c4 holes
PL-1 each side
25B4
152
152
292 76x5
166
7658
76
152
(W250x73)
1255
B4
Lifting Frame Plan View
251
Figure 3.42 Steel frame for specimens lifting and installation
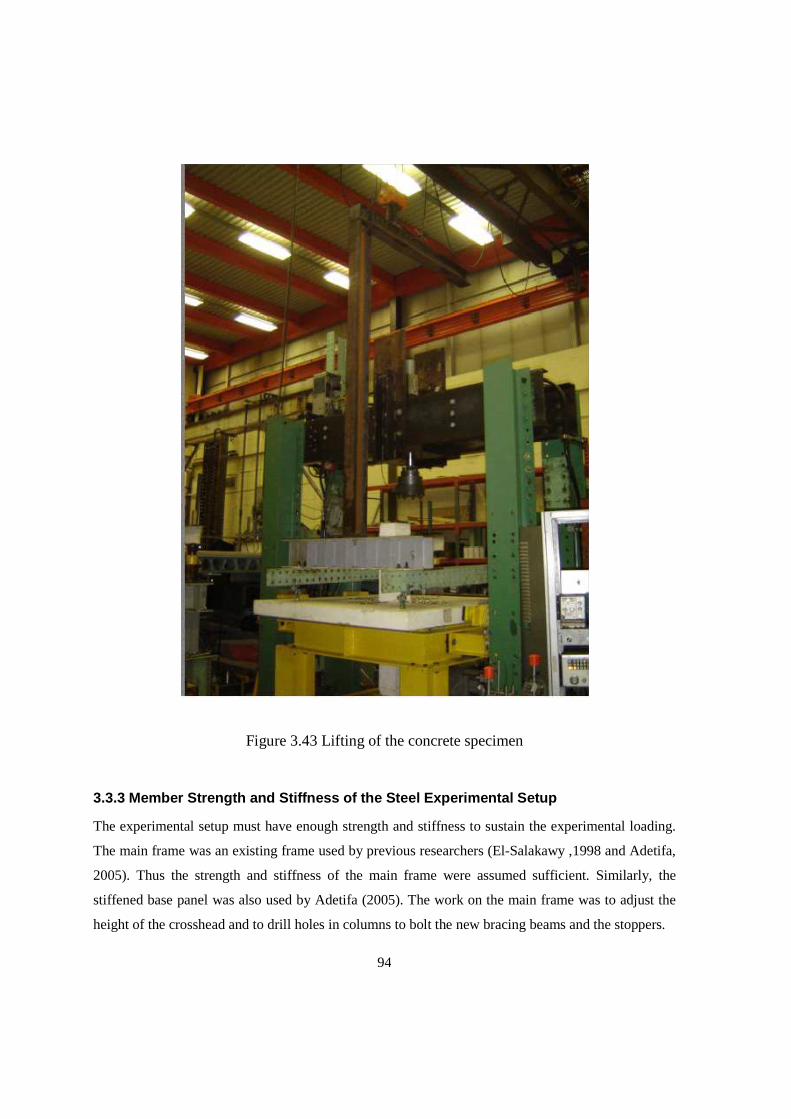
94
Figure 3.43 Lifting of the concrete specimen
3.3.3 Member Strength and Stiffness of the Steel Ex perimental Setup
The experimental setup must have enough strength and stiffness to sustain the experimental loading.
The main frame was an existing frame used by previous researchers (El-Salakawy ,1998 and Adetifa,
2005). Thus the strength and stiffness of the main frame were assumed sufficient. Similarly, the
stiffened base panel was also used by Adetifa (2005). The work on the main frame was to adjust the
height of the crosshead and to drill holes in columns to bolt the new bracing beams and the stoppers.
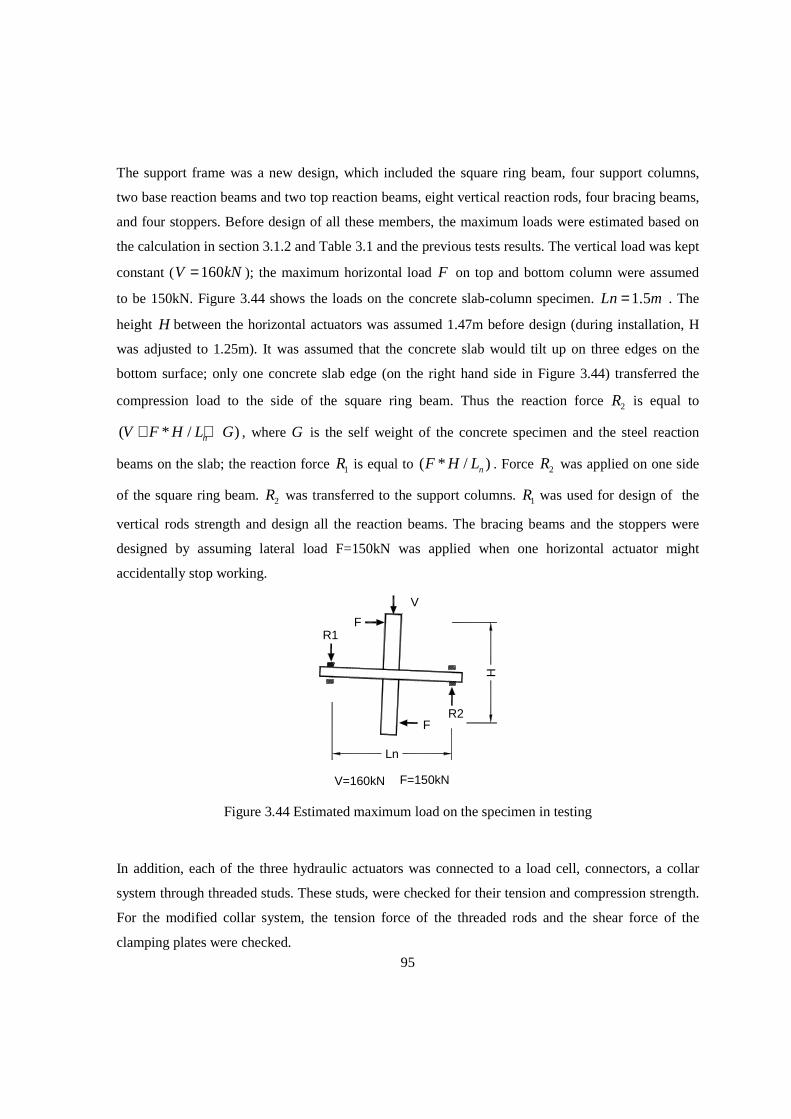
95
The support frame was a new design, which included the square ring beam, four support columns,
two base reaction beams and two top reaction beams, eight vertical reaction rods, four bracing beams,
and four stoppers. Before design of all these members, the maximum loads were estimated based on
the calculation in section 3.1.2 and Table 3.1 and the previous tests results. The vertical load was kept
constant ( 160V kN= ); the maximum horizontal load F on top and bottom column were assumed
to be 150kN. Figure 3.44 shows the loads on the concrete slab-column specimen. 1.5Ln m= . The
height H between the horizontal actuators was assumed 1.47m before design (during installation, H
was adjusted to 1.25m). It was assumed that the concrete slab would tilt up on three edges on the
bottom surface; only one concrete slab edge (on the right hand side in Figure 3.44) transferred the
compression load to the side of the square ring beam. Thus the reaction force 2R is equal to
( * / )nV F H L G+ + , where G is the self weight of the concrete specimen and the steel reaction
beams on the slab; the reaction force 1R is equal to ( * / )nF H L . Force 2R was applied on one side
of the square ring beam. 2R was transferred to the support columns. 1R was used for design of the
vertical rods strength and design all the reaction beams. The bracing beams and the stoppers were
designed by assuming lateral load F=150kN was applied when one horizontal actuator might
accidentally stop working.
V
F
R1
R2
F
V=160kN F=150kN
Ln
H
Figure 3.44 Estimated maximum load on the specimen in testing
In addition, each of the three hydraulic actuators was connected to a load cell, connectors, a collar
system through threaded studs. These studs, were checked for their tension and compression strength.
For the modified collar system, the tension force of the threaded rods and the shear force of the
clamping plates were checked.
96
3.4 Instrumentation
The data acquisition system includes the following: a) three load cells connected to the vertical and
the two horizontal hydraulic actuators; b) displacement transducers; c) strain gauges in shear bolts
and flexural reinforcements in the concrete slab. The data acquisition system included two data
acquisition modules for all the strains, displacements and load cells.
3.4.1 Displacements
The three actuators have their own internal LVDTs to record the cylinder displacements. In addition,
external displacement transducers were used. To eliminate the deformation effect of the testing frame,
all external displacement transducers were fastened onto a rigid steel rack that was installed
independently on the ground. Figure 3.45 shows the elevation including the transducer rack. Figure
3.46 gives the plan view.
On the top and the bottom concrete column ends, string pots (S1 and S2 in Figure 3.45) were attached
horizontally to measure the column lateral drifts. On the bottom column ends of the specimen, a
string pot (S5) was installed in vertical direction to record the displacement, which is the resultant of
vertical and horizontal displacements of that column end. On each side of the concrete slab,
perpendicular to the loading direction, a horizontal string pot (S3 or S4) was attached to the center of
the slab edge to test the slab movement in the horizontal loading direction.
3.4.2 Crack width
Displacement transducers including LVDTS and DCDTs were installed on both top and bottom slab
surfaces in aligned vertical pairs (Figure 3.47). The displacement difference between these pairs gives
an estimation of the crack vertical widths inside the slab.
3.4.3 Strains
Strain gauges (5mm-length) were attached at locations “a”, “b”, “c”, and “d” of rebar #1 ~ Rebar #5
in two directions as shown in Figure 3.6 and Figure 3.7.
Shear bolts, at typical locations, had also attached strain gauges in the middle of their bolt stems in
longitudinal direction. In specimen SW7, strain gauges were placed on shear bolts in orthogonal lines;
in specimens SW8 and SW9, shear bolts in both orthogonal diagonal directions had attached strain
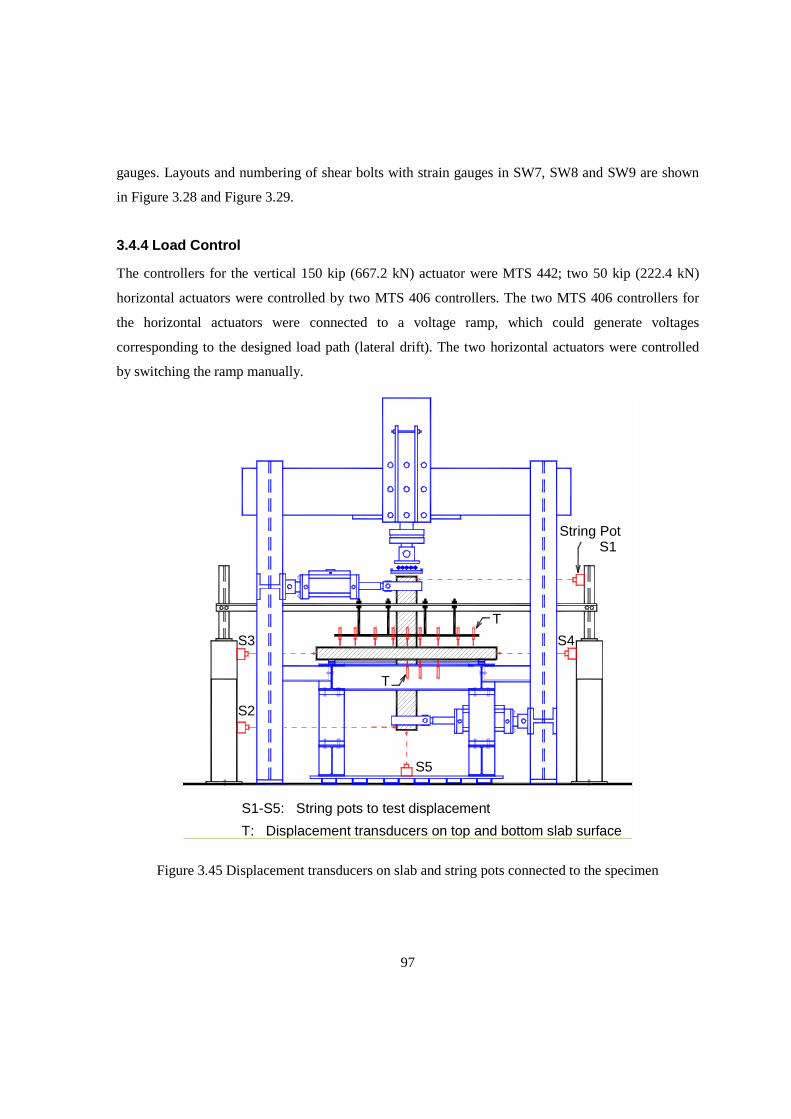
97
gauges. Layouts and numbering of shear bolts with strain gauges in SW7, SW8 and SW9 are shown
in Figure 3.28 and Figure 3.29.
3.4.4 Load Control
The controllers for the vertical 150 kip (667.2 kN) actuator were MTS 442; two 50 kip (222.4 kN)
horizontal actuators were controlled by two MTS 406 controllers. The two MTS 406 controllers for
the horizontal actuators were connected to a voltage ramp, which could generate voltages
corresponding to the designed load path (lateral drift). The two horizontal actuators were controlled
by switching the ramp manually.
String PotS1
S2
S3 S4
S5
S1-S5: String pots to test displacement
T
T
T: Displacement transducers on top and bottom slab surface
Figure 3.45 Displacement transducers on slab and string pots connected to the specimen
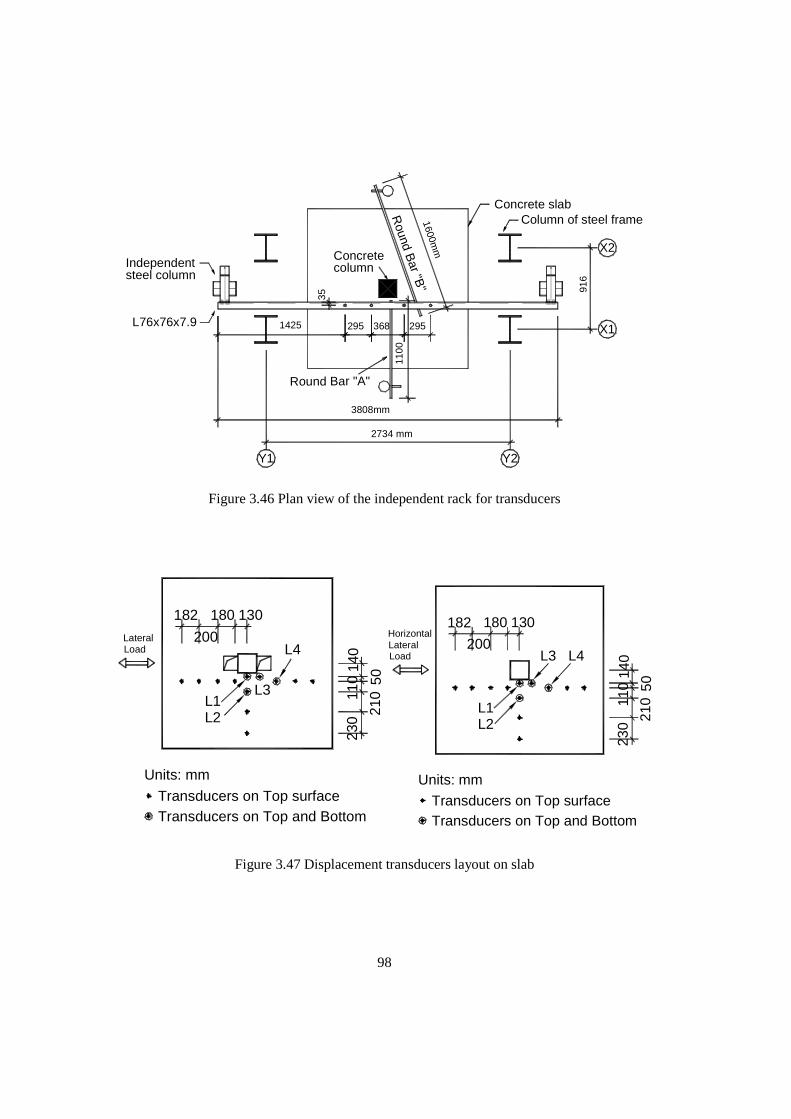
98
Round B
ar "B"
L76x76x7.9
Round Bar "A"1600m
m
1100
295368295142535
3808mm
Column of steel frame
Y1 Y2
2734 mm
X2
X1
916
Concrete slab
columnConcrete
steel columnIndependent
Figure 3.46 Plan view of the independent rack for transducers
110
210
50
200
180
Load Lateral
182 130
L1L2
L4
L3
Units: mm
Transducers on Top surfaceTransducers on Top and Bottom
140
230
Units: mm
Transducers on Top and BottomTransducers on Top surface
HorizontalLateralLoad
140
L2L1
230
5021
0110
200
182 180 130
L3 L4
Figure 3.47 Displacement transducers layout on slab
99
3.5 Testing Procedure
Each specimen was subjected to gravity load from the top vertical actuator, using load control mode,
at a loading rate of about 20 kN / minute until the desired load level was attained. The vertical load
was then kept constant throughout the test. Specimen SW1, SW2, and SW3 were subjected to 110kN
vertical load while SW4~SW9 to 160 kN.
After application of the vertical load, the two horizontal actuators were activated to apply horizontal
loading. During this process, the two actuators were controlled in displacement mode. They pushed
and pulled the specimen columns simultaneously at the same rate according to a pre-planned cyclic
loading path as shown in Figure 3.48. The horizontal loading rate was about 0.6 volt / minute (4.6
mm / minute) before 3% drift ratio and 1.45 volt / minute (11.1 mm / minute) for larger drifts.
The lateral loading cycles were applied from lower to higher drift levels by controlling the horizontal
actuators’ displacement. At each level, the same drift cycle was repeated three times. After 0.75%
drift level, one 0.5% drift cycle was inserted between three-repeated-cycle groups. This small cycle of
lower drift is used to evaluate the connection behaviour after larger seismic loading.
The reason for applying three repetitions of each cycle was to show the connection stiffness
degradation at each drift level. After 3.0% lateral drift, long and deep cracks formed in the concrete
slabs and the intermediate 0.5% drift cycles showed no much change in the behaviour as compared to
previous small cycles; therefore the small cycles were stopped after 3.0% drift. The increasing lateral
drift cycles were then applied without repetitions to reduce testing time.
The intermediate small drift cycles (0.5%) were applied to show the deformation behaviour, stiffness,
and strength of the specimen after higher lateral drifts. It also provides information for possible repair
of the structure after large lateral drifts.
Due to unexpected slab movements, and small deformation of the frame during testing, the drifts
recorded by external string pots were slightly different from the drifts recorded by internal LVDTs of
the actuators. The displacements and drifts reported in this thesis are based on the readings from the
external string pots which recorded real displacement of the specimen.
The design of the horizontal loading path followed the main idea of the ACI publication: “Acceptance
Criteria for Moment Frames Based on Structural Testing (ACI T1.1-01) and Commentary (T1.1 R-
01).” (2001) Although slow, pseudo-dynamic cyclic loading is not fully equivalent to dynamic
loading and the loading path cannot represent earthquake loading completely, the result are
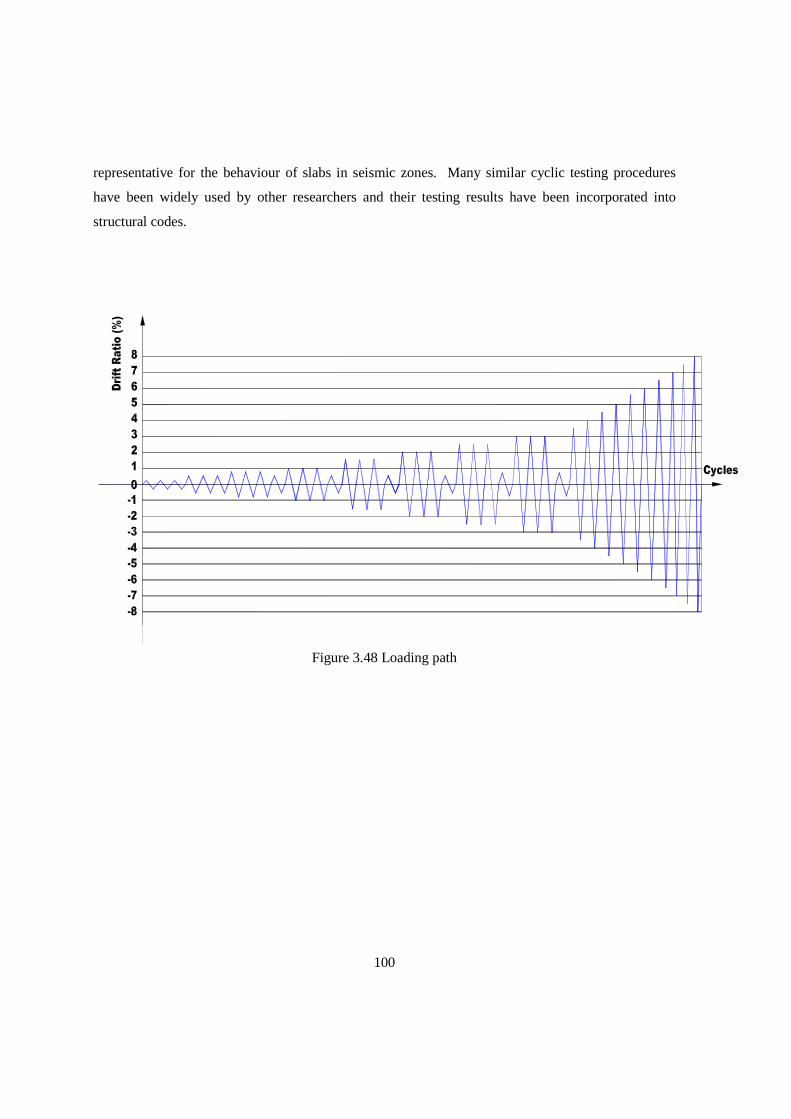
100
representative for the behaviour of slabs in seismic zones. Many similar cyclic testing procedures
have been widely used by other researchers and their testing results have been incorporated into
structural codes.
Figure 3.48 Loading path
101
Chapter 4
Experimental Results and Discussion
4.1 Introduction
This chapter gives the experimental results for Series I and Series II tests. For each series, lateral load
versus drift ratio, moment versus lateral drift ratio, backbone curves of horizontal load versus
horizontal drift ratio at top column end, peak-to-peak stiffness versus drift ratio, stiffness of small
cycles, strains in reinforcements, and crack width are presented.
4.2 Results of Series I
This section introduces the test results of Series I which includes specimens SW1 ~ SW5. Among
them, specimens SW1, SW2, and SW3 form Group I; the specimens SW4 and SW5 form Group II.
4.2.1 Lateral Load versus Drift Ratio
For clarity of explanations, it is necessary to specify the positive and negative force directions of the
two horizontal hydraulic actuators. It is assumed that when actuators in Figure 3.33 push the concrete
column of the specimen the forces are negative; otherwise, the forces are positive. The two horizontal
actuators were installed in the experiment setup as shown in Figure 3.33. In the test, side “BC” was
on side of ○Y1 axis, and side “AD” was on side of ○Y2 axis. The horizontal load direction is
perpendicular to sides BC and AD. When the top horizontal actuator pushes the top concrete column
end from BC side to the AD side, the horizontal load and the drift on the top concrete column are
negative. At the same time, for the bottom concrete column, bottom horizontal actuator pushes the
bottom concrete column from side AD to the side BC, the horizontal load and the drift on the bottom
concrete column are also negative. The sides of “AD” and “BC” of the concrete slab column
connections are also specified in Figure 3.6 ~ Figure 3.8, Figure 4.13, and Figure 4.40.
Horizontal lateral load on top column end versus its horizontal lateral drift ratio for specimens SW1,
SW2 and SW3 (Group 1) are shown in Figure 4.1, and for SW4, SW5 (Group 2) in Figure 4.2.
Specimens SW1, SW2 and SW3 (concrete strength: 35MPa) were subjected to vertical load of 110kN
on the top column end; SW4 and SW5 (concrete strength: 46MPa) to vertical load of 160kN. As
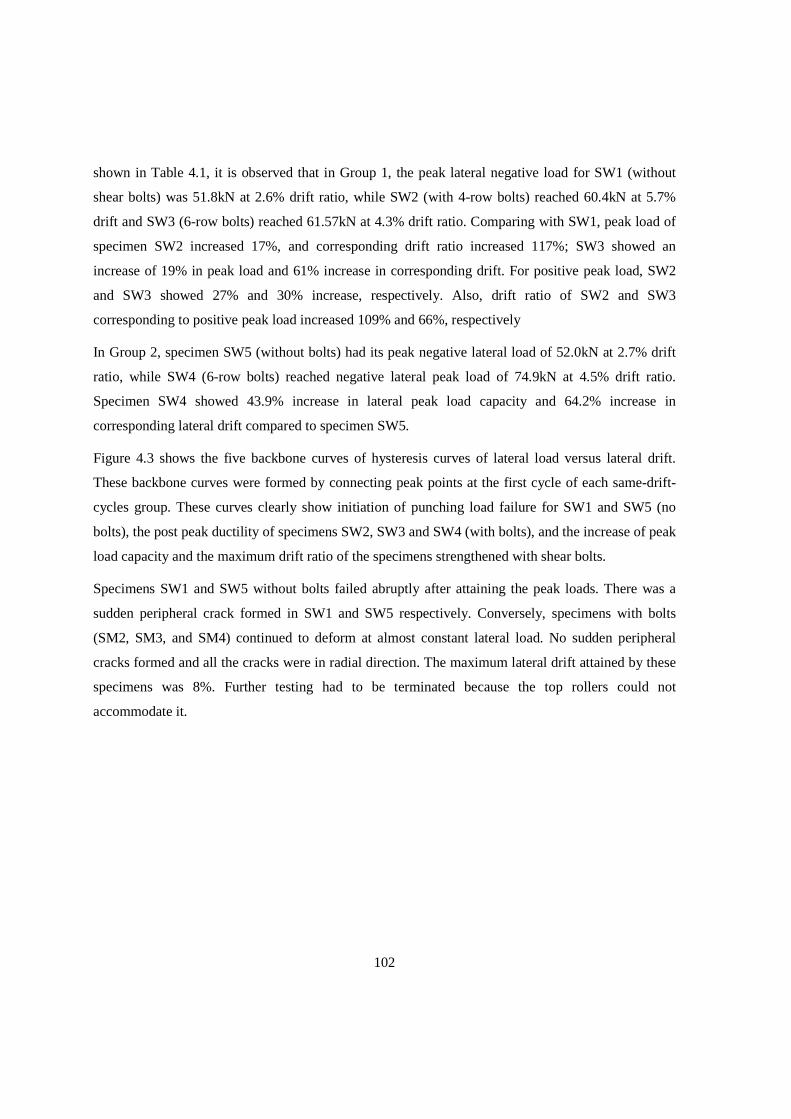
102
shown in Table 4.1, it is observed that in Group 1, the peak lateral negative load for SW1 (without
shear bolts) was 51.8kN at 2.6% drift ratio, while SW2 (with 4-row bolts) reached 60.4kN at 5.7%
drift and SW3 (6-row bolts) reached 61.57kN at 4.3% drift ratio. Comparing with SW1, peak load of
specimen SW2 increased 17%, and corresponding drift ratio increased 117%; SW3 showed an
increase of 19% in peak load and 61% increase in corresponding drift. For positive peak load, SW2
and SW3 showed 27% and 30% increase, respectively. Also, drift ratio of SW2 and SW3
corresponding to positive peak load increased 109% and 66%, respectively
In Group 2, specimen SW5 (without bolts) had its peak negative lateral load of 52.0kN at 2.7% drift
ratio, while SW4 (6-row bolts) reached negative lateral peak load of 74.9kN at 4.5% drift ratio.
Specimen SW4 showed 43.9% increase in lateral peak load capacity and 64.2% increase in
corresponding lateral drift compared to specimen SW5.
Figure 4.3 shows the five backbone curves of hysteresis curves of lateral load versus lateral drift.
These backbone curves were formed by connecting peak points at the first cycle of each same-drift-
cycles group. These curves clearly show initiation of punching load failure for SW1 and SW5 (no
bolts), the post peak ductility of specimens SW2, SW3 and SW4 (with bolts), and the increase of peak
load capacity and the maximum drift ratio of the specimens strengthened with shear bolts.
Specimens SW1 and SW5 without bolts failed abruptly after attaining the peak loads. There was a
sudden peripheral crack formed in SW1 and SW5 respectively. Conversely, specimens with bolts
(SM2, SM3, and SM4) continued to deform at almost constant lateral load. No sudden peripheral
cracks formed and all the cracks were in radial direction. The maximum lateral drift attained by these
specimens was 8%. Further testing had to be terminated because the top rollers could not
accommodate it.
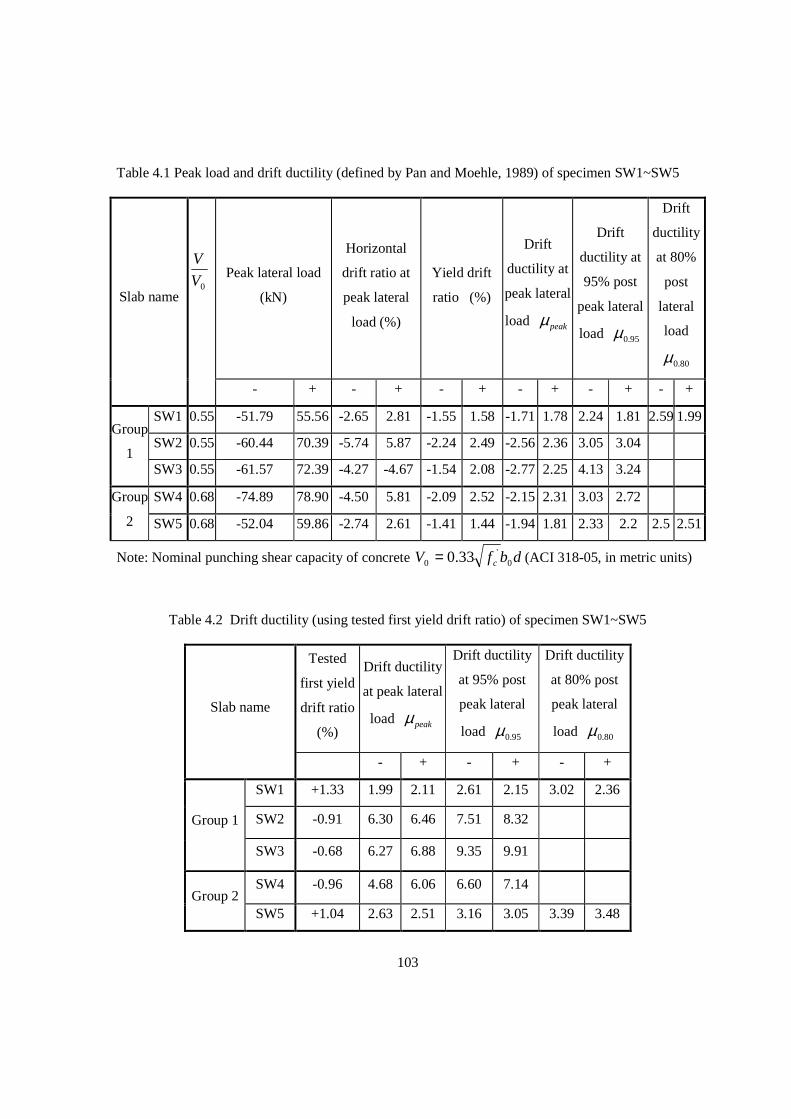
103
Table 4.1 Peak load and drift ductility (defined by Pan and Moehle, 1989) of specimen SW1~SW5
Peak lateral load
(kN)
Horizontal
drift ratio at
peak lateral
load (%)
Yield drift
ratio (%)
Drift
ductility at
peak lateral
load peakµ
Drift
ductility at
95% post
peak lateral
load 95.0µ
Drift
ductility
at 80%
post
lateral
load
80.0µ
Slab name
0V
V
- + - + - + - + - + - +
SW1 0.55 -51.79 55.56 -2.65 2.81 -1.55 1.58 -1.71 1.78 2.24 1.81 2.59 1.99
SW2 0.55 -60.44 70.39 -5.74 5.87 -2.24 2.49 -2.56 2.36 3.05 3.04 Group
1 SW3 0.55 -61.57 72.39 -4.27 -4.67 -1.54 2.08 -2.77 2.25 4.13 3.24
SW4 0.68 -74.89 78.90 -4.50 5.81 -2.09 2.52 -2.15 2.31 3.03 2.72 Group
2 SW5 0.68 -52.04 59.86 -2.74 2.61 -1.41 1.44 -1.94 1.81 2.33 2.2 2.5 2.51
Note: Nominal punching shear capacity of concrete dbfV c 0'
0 33.0= (ACI 318-05, in metric units)
Table 4.2 Drift ductility (using tested first yield drift ratio) of specimen SW1~SW5
Tested
first yield
drift ratio
(%)
Drift ductility
at peak lateral
load peakµ
Drift ductility
at 95% post
peak lateral
load 95.0µ
Drift ductility
at 80% post
peak lateral
load 80.0µ
Slab name
- + - + - +
SW1 +1.33 1.99 2.11 2.61 2.15 3.02 2.36
SW2 -0.91 6.30 6.46 7.51 8.32 Group 1
SW3 -0.68 6.27 6.88 9.35 9.91
SW4 -0.96 4.68 6.06 6.60 7.14 Group 2
SW5 +1.04 2.63 2.51 3.16 3.05 3.39 3.48
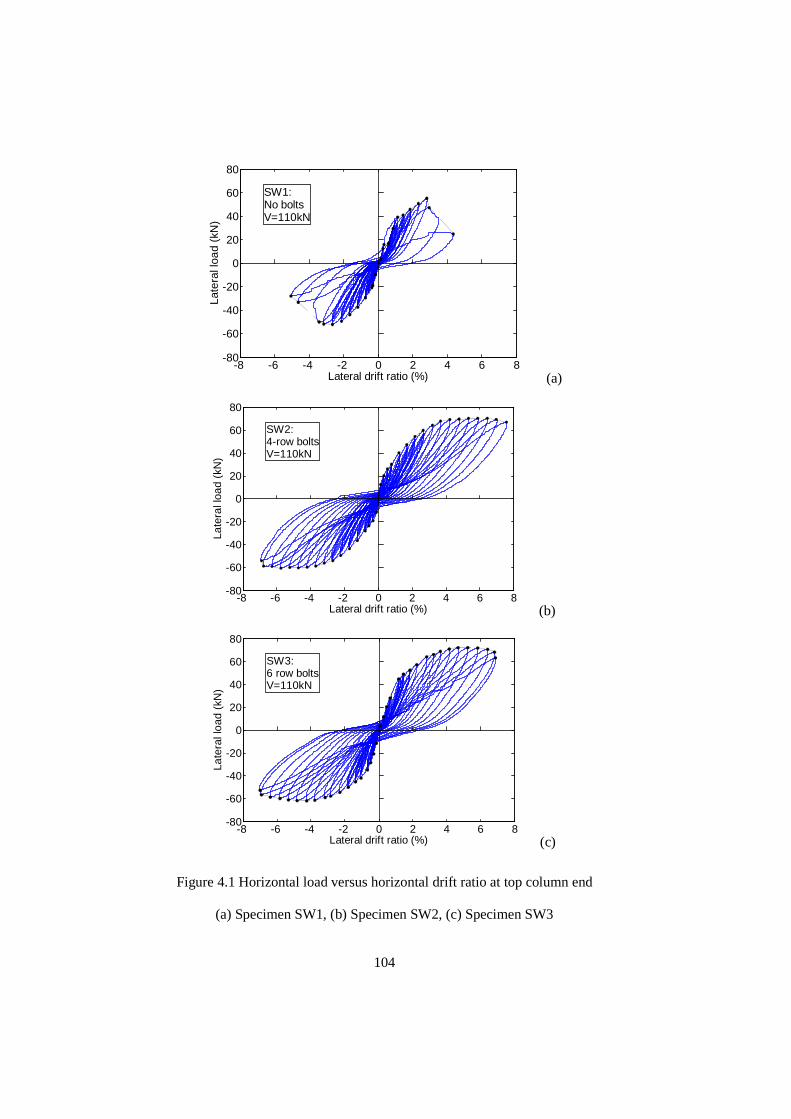
104
-8 -6 -4 -2 0 2 4 6 8-80
-60
-40
-20
0
20
40
60
80
Lateral drift ratio (%)
Late
ral l
oad
(kN
)
SW1:No boltsV=110kN
(a)
-8 -6 -4 -2 0 2 4 6 8-80
-60
-40
-20
0
20
40
60
80
Lateral drift ratio (%)
Late
ral l
oad
(kN
)
SW2:4-row boltsV=110kN
(b)
-8 -6 -4 -2 0 2 4 6 8-80
-60
-40
-20
0
20
40
60
80
Lateral drift ratio (%)
Late
ral l
oad
(kN
)
SW3:6 row boltsV=110kN
(c)
Figure 4.1 Horizontal load versus horizontal drift ratio at top column end
(a) Specimen SW1, (b) Specimen SW2, (c) Specimen SW3
105
-8 -6 -4 -2 0 2 4 6 8-80
-60
-40
-20
0
20
40
60
80
Lateral drift ratio (%)
Late
ral l
oad
(kN
)
SW4:6-row boltsV=160kN
(a)
-8 -6 -4 -2 0 2 4 6 8-80
-60
-40
-20
0
20
40
60
80
Lateral drift ratio (%)
Late
ral l
oad
(kN
)
SW5:No boltsV=160kN
(b)
Figure 4.2 Horizontal load versus horizontal drift ratio at top column end
(a) Specimen SW4, (b) Specimen SW5
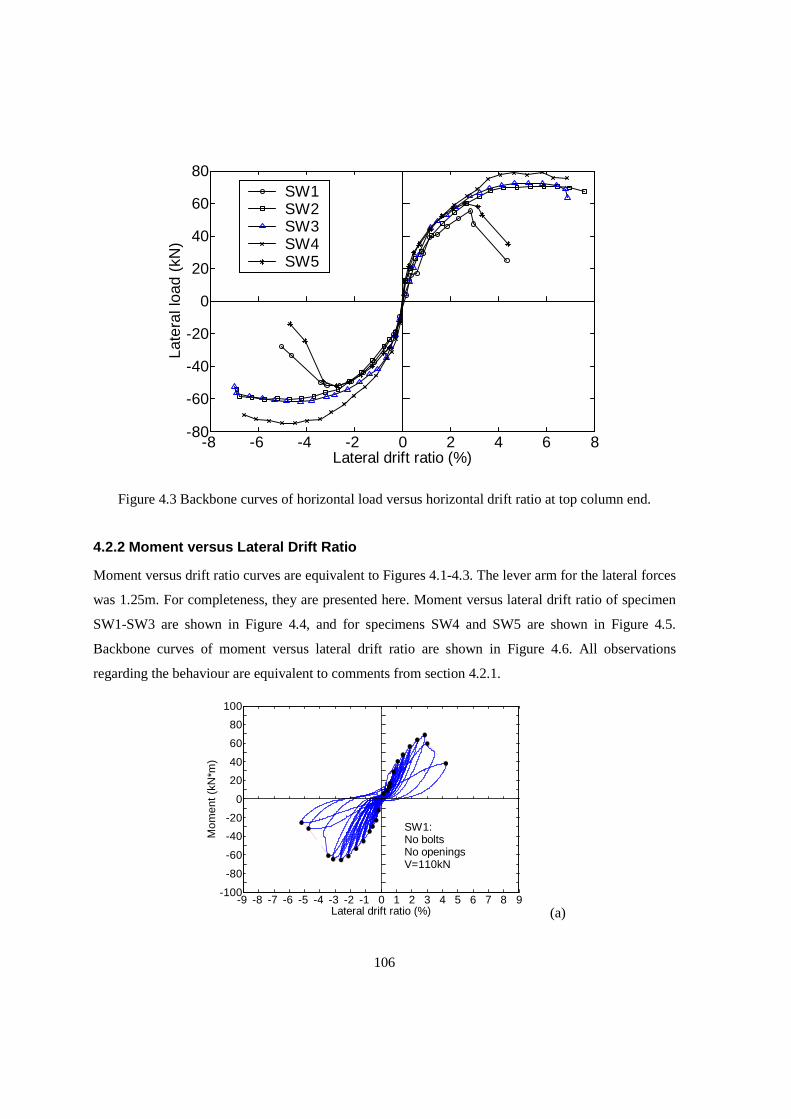
106
-8 -6 -4 -2 0 2 4 6 8-80
-60
-40
-20
0
20
40
60
80
Lateral drift ratio (%)
Late
ral l
oad
(kN
)SW1SW2SW3SW4SW5
Figure 4.3 Backbone curves of horizontal load versus horizontal drift ratio at top column end.
4.2.2 Moment versus Lateral Drift Ratio
Moment versus drift ratio curves are equivalent to Figures 4.1-4.3. The lever arm for the lateral forces
was 1.25m. For completeness, they are presented here. Moment versus lateral drift ratio of specimen
SW1-SW3 are shown in Figure 4.4, and for specimens SW4 and SW5 are shown in Figure 4.5.
Backbone curves of moment versus lateral drift ratio are shown in Figure 4.6. All observations
regarding the behaviour are equivalent to comments from section 4.2.1.
-9 -8 -7 -6 -5 -4 -3 -2 -1 0 1 2 3 4 5 6 7 8 9-100
-80
-60
-40
-20
0
20
40
60
80
100
Lateral drift ratio (%)
Mom
ent (
kN*m
)
SW1:No boltsNo openingsV=110kN
(a)
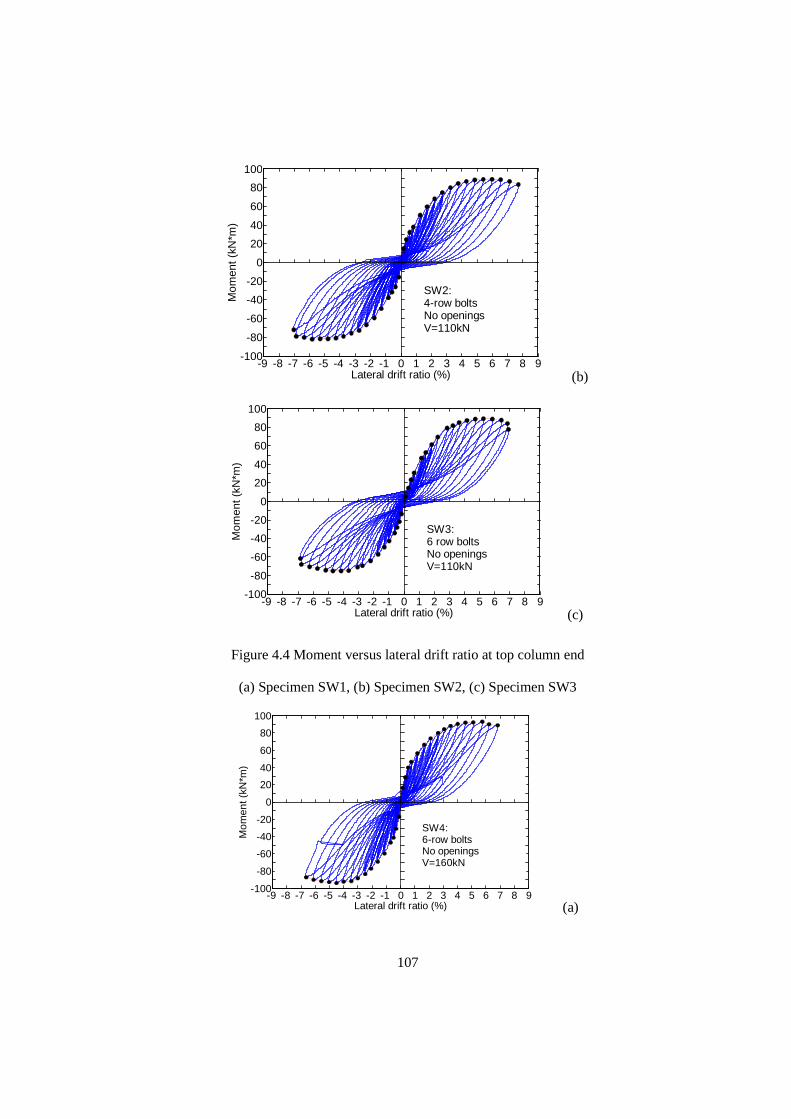
107
-9 -8 -7 -6 -5 -4 -3 -2 -1 0 1 2 3 4 5 6 7 8 9-100
-80
-60
-40
-20
0
20
40
60
80
100
Lateral drift ratio (%)
Mom
ent (
kN*m
)
SW2:4-row boltsNo openingsV=110kN
(b)
-9 -8 -7 -6 -5 -4 -3 -2 -1 0 1 2 3 4 5 6 7 8 9-100
-80
-60
-40
-20
0
20
40
60
80
100
Lateral drift ratio (%)
Mom
ent (
kN*m
)
SW3:6 row boltsNo openingsV=110kN
(c)
Figure 4.4 Moment versus lateral drift ratio at top column end
(a) Specimen SW1, (b) Specimen SW2, (c) Specimen SW3
-9 -8 -7 -6 -5 -4 -3 -2 -1 0 1 2 3 4 5 6 7 8 9-100
-80
-60
-40
-20
0
20
40
60
80
100
Lateral drift ratio (%)
Mom
ent (
kN*m
)
SW4:6-row boltsNo openingsV=160kN
(a)
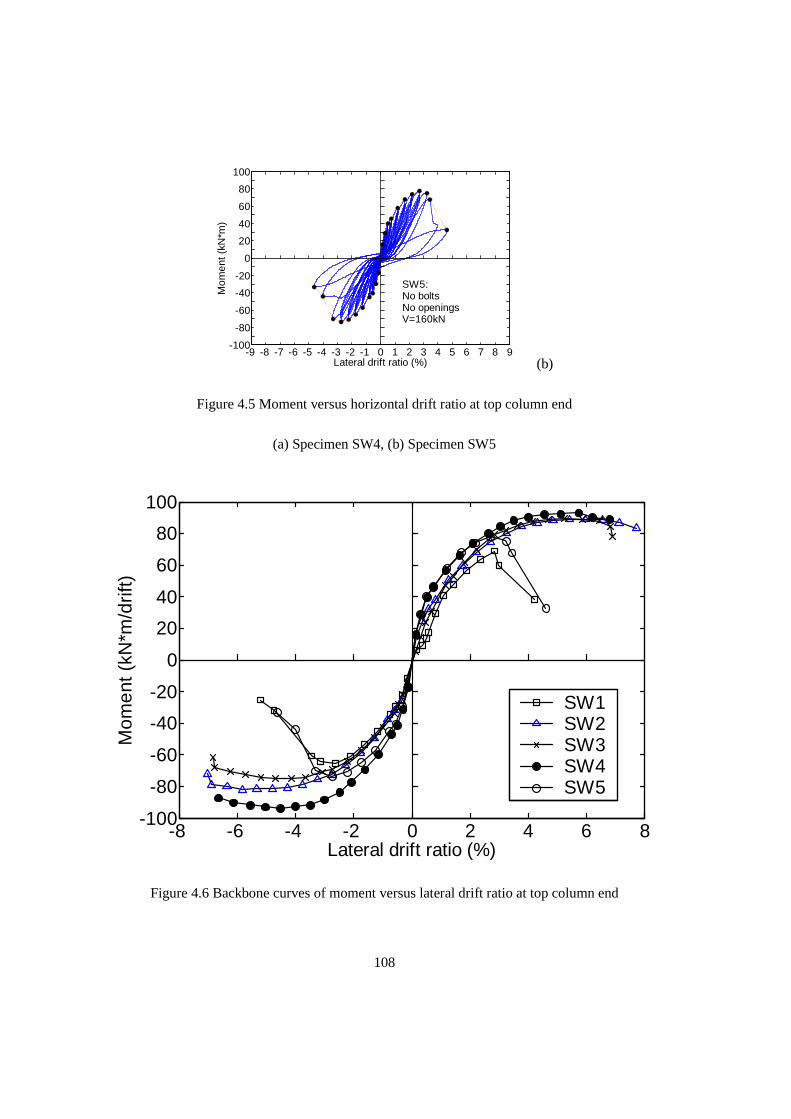
108
-9 -8 -7 -6 -5 -4 -3 -2 -1 0 1 2 3 4 5 6 7 8 9-100
-80
-60
-40
-20
0
20
40
60
80
100
Lateral drift ratio (%)
Mom
ent (
kN*m
)
SW5:No boltsNo openingsV=160kN
(b)
Figure 4.5 Moment versus horizontal drift ratio at top column end
(a) Specimen SW4, (b) Specimen SW5
-8 -6 -4 -2 0 2 4 6 8-100
-80
-60
-40
-20
0
20
40
60
80
100
Lateral drift ratio (%)
Mom
ent (
kN*m
/drif
t)
SW1SW2SW3SW4SW5
Figure 4.6 Backbone curves of moment versus lateral drift ratio at top column end
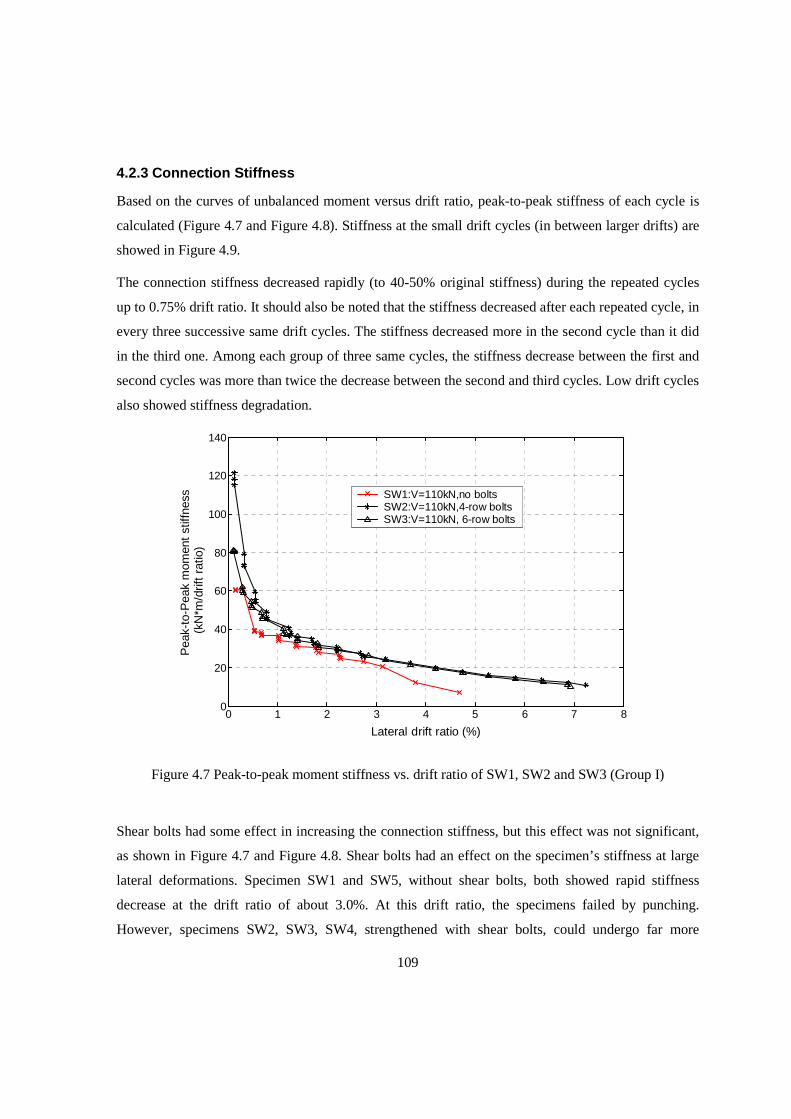
109
4.2.3 Connection Stiffness
Based on the curves of unbalanced moment versus drift ratio, peak-to-peak stiffness of each cycle is
calculated (Figure 4.7 and Figure 4.8). Stiffness at the small drift cycles (in between larger drifts) are
showed in Figure 4.9.
The connection stiffness decreased rapidly (to 40-50% original stiffness) during the repeated cycles
up to 0.75% drift ratio. It should also be noted that the stiffness decreased after each repeated cycle, in
every three successive same drift cycles. The stiffness decreased more in the second cycle than it did
in the third one. Among each group of three same cycles, the stiffness decrease between the first and
second cycles was more than twice the decrease between the second and third cycles. Low drift cycles
also showed stiffness degradation.
0 1 2 3 4 5 6 7 80
20
40
60
80
100
120
140
Lateral drift ratio (%)
Pea
k-to
-Pea
k m
omen
t st
iffne
ss(k
N*m
/drif
t ra
tio)
SW1:V=110kN,no boltsSW2:V=110kN,4-row boltsSW3:V=110kN, 6-row bolts
Figure 4.7 Peak-to-peak moment stiffness vs. drift ratio of SW1, SW2 and SW3 (Group I)
Shear bolts had some effect in increasing the connection stiffness, but this effect was not significant,
as shown in Figure 4.7 and Figure 4.8. Shear bolts had an effect on the specimen’s stiffness at large
lateral deformations. Specimen SW1 and SW5, without shear bolts, both showed rapid stiffness
decrease at the drift ratio of about 3.0%. At this drift ratio, the specimens failed by punching.
However, specimens SW2, SW3, SW4, strengthened with shear bolts, could undergo far more
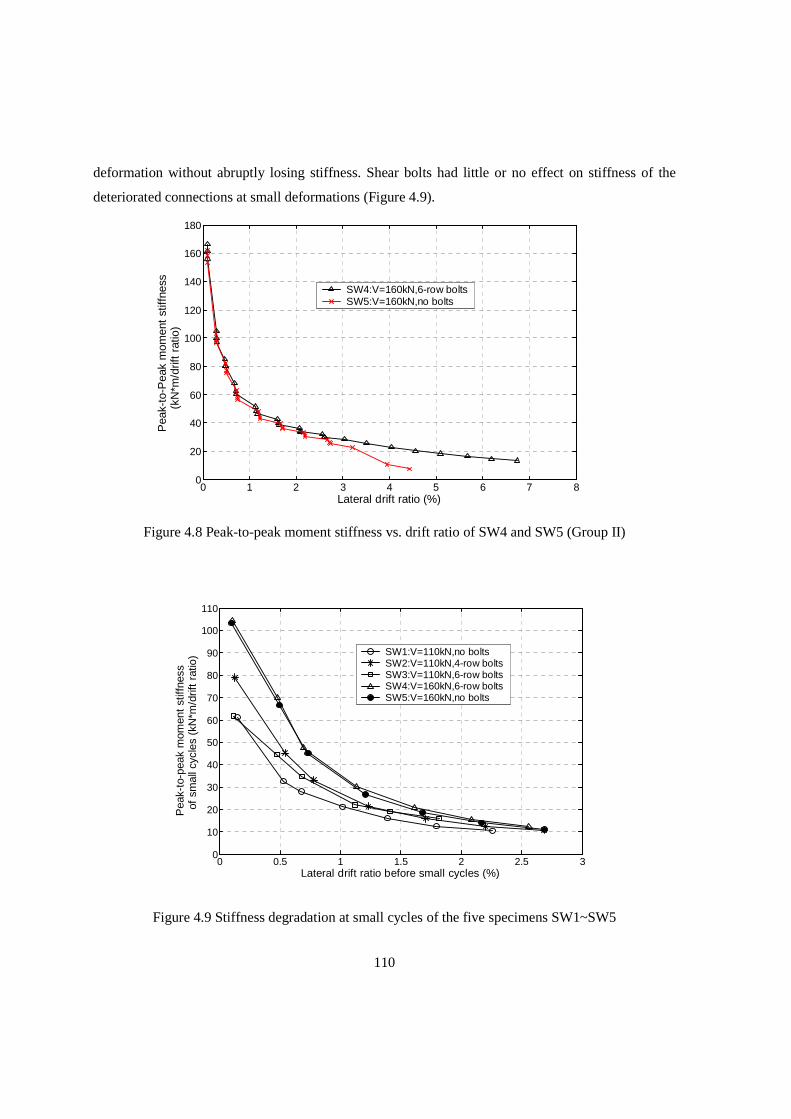
110
deformation without abruptly losing stiffness. Shear bolts had little or no effect on stiffness of the
deteriorated connections at small deformations (Figure 4.9).
Figure 4.8 Peak-to-peak moment stiffness vs. drift ratio of SW4 and SW5 (Group II)
0 0.5 1 1.5 2 2.5 30
10
20
30
40
50
60
70
80
90
100
110
Lateral drift ratio before small cycles (%)
Pea
k-to
-pea
k m
omen
t st
iffne
ss
of s
mal
l cyc
les
(kN
*m/d
rift
ratio
) SW1:V=110kN,no boltsSW2:V=110kN,4-row boltsSW3:V=110kN,6-row boltsSW4:V=160kN,6-row boltsSW5:V=160kN,no bolts
Figure 4.9 Stiffness degradation at small cycles of the five specimens SW1~SW5
0 1 2 3 4 5 6 7 80
20
40
60
80
100
120
140
160
180
Lateral drift ratio (%)
Pea
k-to
-Pea
k m
omen
t st
iffne
ss(k
N*m
/drif
t ra
tio)
SW4:V=160kN,6-row boltsSW5:V=160kN,no bolts
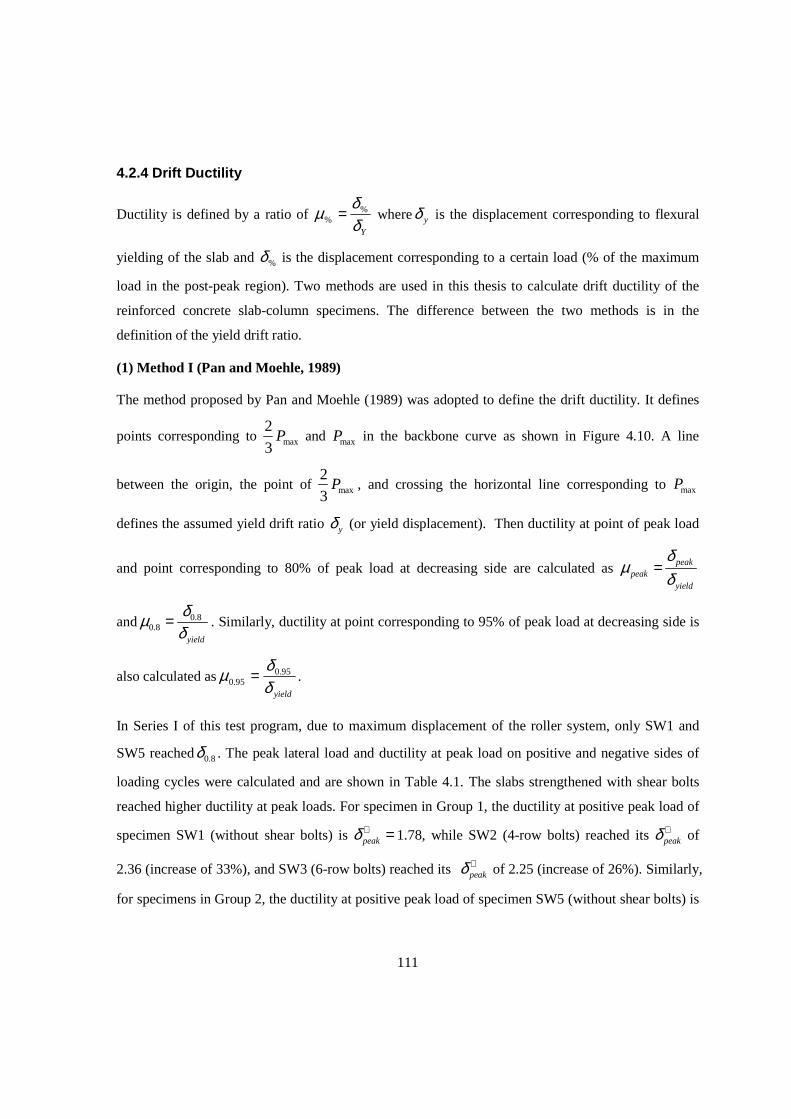
111
4.2.4 Drift Ductility
Ductility is defined by a ratio of Yδ
δµ %% = where yδ is the displacement corresponding to flexural
yielding of the slab and %δ is the displacement corresponding to a certain load (% of the maximum
load in the post-peak region). Two methods are used in this thesis to calculate drift ductility of the
reinforced concrete slab-column specimens. The difference between the two methods is in the
definition of the yield drift ratio.
(1) Method I (Pan and Moehle, 1989)
The method proposed by Pan and Moehle (1989) was adopted to define the drift ductility. It defines
points corresponding to max
2
3P and maxP in the backbone curve as shown in Figure 4.10. A line
between the origin, the point of max
2
3P , and crossing the horizontal line corresponding to maxP
defines the assumed yield drift ratio yδ (or yield displacement). Then ductility at point of peak load
and point corresponding to 80% of peak load at decreasing side are calculated as peakpeak
yield
δµ
δ=
and 0.80.8
yield
δµδ
= . Similarly, ductility at point corresponding to 95% of peak load at decreasing side is
also calculated asyieldδ
δµ 95.095.0 = .
In Series I of this test program, due to maximum displacement of the roller system, only SW1 and
SW5 reached0.8δ . The peak lateral load and ductility at peak load on positive and negative sides of
loading cycles were calculated and are shown in Table 4.1. The slabs strengthened with shear bolts
reached higher ductility at peak loads. For specimen in Group 1, the ductility at positive peak load of
specimen SW1 (without shear bolts) is peakδ + = 1.78, while SW2 (4-row bolts) reached its peakδ + of
2.36 (increase of 33%), and SW3 (6-row bolts) reached its peakδ + of 2.25 (increase of 26%). Similarly,
for specimens in Group 2, the ductility at positive peak load of specimen SW5 (without shear bolts) is
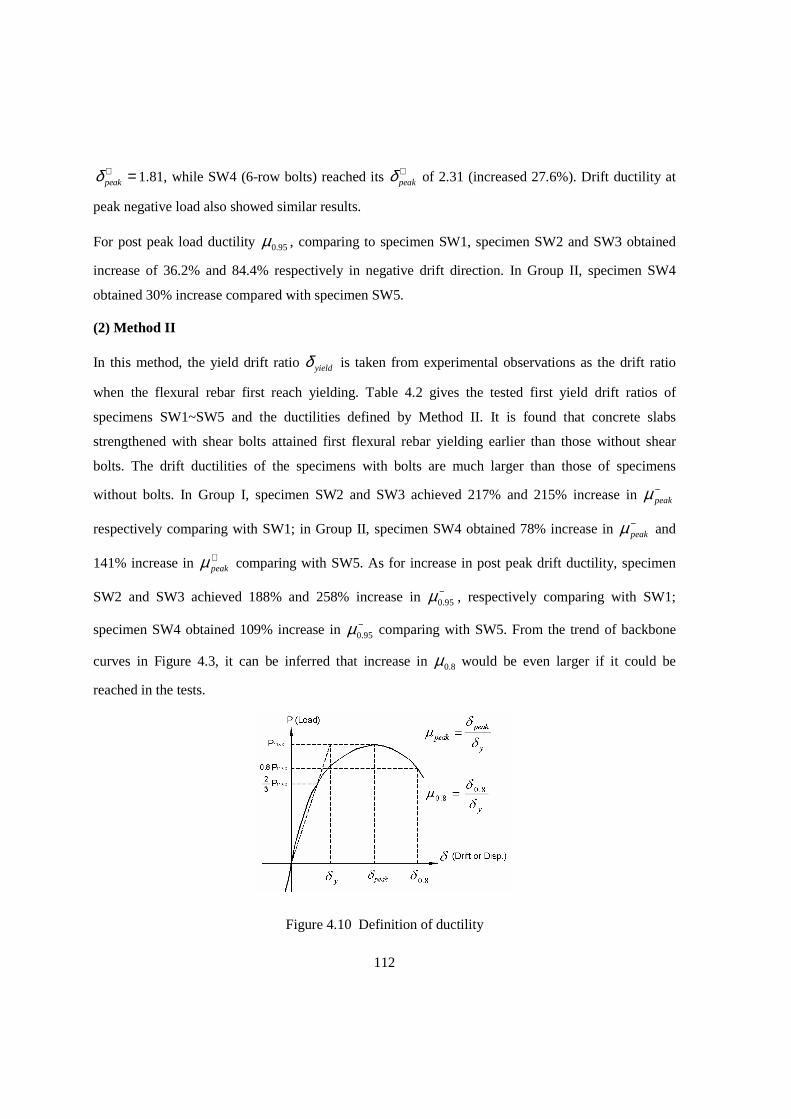
112
peakδ + = 1.81, while SW4 (6-row bolts) reached its peakδ + of 2.31 (increased 27.6%). Drift ductility at
peak negative load also showed similar results.
For post peak load ductility 95.0µ , comparing to specimen SW1, specimen SW2 and SW3 obtained
increase of 36.2% and 84.4% respectively in negative drift direction. In Group II, specimen SW4
obtained 30% increase compared with specimen SW5.
(2) Method II
In this method, the yield drift ratio yieldδ is taken from experimental observations as the drift ratio
when the flexural rebar first reach yielding. Table 4.2 gives the tested first yield drift ratios of
specimens SW1~SW5 and the ductilities defined by Method II. It is found that concrete slabs
strengthened with shear bolts attained first flexural rebar yielding earlier than those without shear
bolts. The drift ductilities of the specimens with bolts are much larger than those of specimens
without bolts. In Group I, specimen SW2 and SW3 achieved 217% and 215% increase in −peakµ
respectively comparing with SW1; in Group II, specimen SW4 obtained 78% increase in −peakµ and
141% increase in +peakµ comparing with SW5. As for increase in post peak drift ductility, specimen
SW2 and SW3 achieved 188% and 258% increase in −95.0µ , respectively comparing with SW1;
specimen SW4 obtained 109% increase in −95.0µ comparing with SW5. From the trend of backbone
curves in Figure 4.3, it can be inferred that increase in 8.0µ would be even larger if it could be
reached in the tests.
Figure 4.10 Definition of ductility
113
4.2.5 Strains in Shear Bolts
Strain data were measured for shear bolts, in both lateral loading direction (direction 1) and in
transverse direction (direction 2). Shear bolts with strain gauges were numbered as shown in Figure
3.28. An example of the lateral drift ratio versus strain in Bolt #1 of SW2 is shown in Figure 4.11.
The backbone (envelope) curves of lateral drift ratio versus bolt strains are shown in Figure 4.12.
Generally, in direction 1, the first two bolts (bolt #1 and bolt #2) close to the column experienced
significant strains. The third one (bolt #3) had small strain and the fourth bolt (bolts #4) remained
non-active throughout the whole loading history. Bolt #1 and Bolt #2 were activated apparently only
after the drift reached at least 1%. This drift corresponds to lateral load of 35~40 kN, which is
50~55% of the maximum lateral load attained by the specimen. In direction 1, only bolt #1 in SW3
yielded.
Bolts in direction 2 experienced larger strains, at the same drift ratios, than their counterparts in
direction 1. Strains in bolt # 1a of SW3 and SW4 reached 32.44 10−× and 31.95 10−× respectively,
exceeding bolt yield strain ( 31.9 10yε −= × ). Strain in bolt # 1a of SW2 reached 31.72 10−× which is
close to yield strain.
0 0.2 0.4 0.6 0.8 1 1.2x 10
-3
-8
-6
-4
-2
0
2
4
6
8
SW24 row boltsV=110kN
Strain in bolt #1
Late
ral d
rift r
atio
(%
)
Figure 4.11 Lateral drift ratio versus strain in bolt #1 for specimen SW2
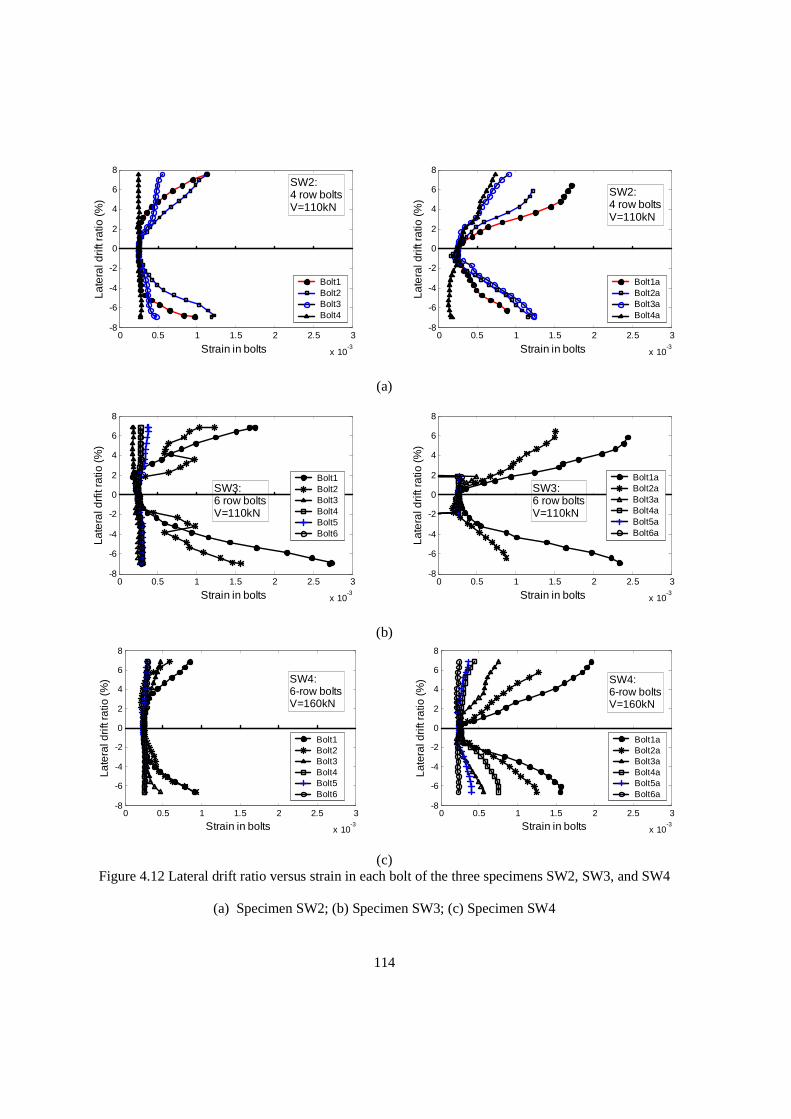
114
0 0.5 1 1.5 2 2.5 3
x 10-3
-8
-6
-4
-2
0
2
4
6
8
Strain in bolts
Late
ral d
rift r
atio
(%)
SW2:4 row boltsV=110kN
Bolt1Bolt2Bolt3Bolt4
0 0.5 1 1.5 2 2.5 3
x 10-3
-8
-6
-4
-2
0
2
4
6
8
Strain in bolts
Late
ral d
rift r
atio
(%)
SW2:4 row boltsV=110kN
Bolt1aBolt2aBolt3aBolt4a
(a)
0 0.5 1 1.5 2 2.5 3
x 10-3
-8
-6
-4
-2
0
2
4
6
8
Strain in bolts
Late
ral d
rfit r
atio
(%)
SW3:6 row boltsV=110kN
Bolt1Bolt2Bolt3Bolt4Bolt5Bolt6
0 0.5 1 1.5 2 2.5 3
x 10-3
-8
-6
-4
-2
0
2
4
6
8
Strain in bolts
Late
ral d
rift r
atio
(%)
SW3:6 row boltsV=110kN
Bolt1aBolt2aBolt3aBolt4aBolt5aBolt6a
(b)
0 0.5 1 1.5 2 2.5 3
x 10-3
-8
-6
-4
-2
0
2
4
6
8
Strain in bolts
Late
ral d
rift r
atio
(%) SW4:
6-row boltsV=160kN
Bolt1Bolt2Bolt3Bolt4Bolt5Bolt6
0 0.5 1 1.5 2 2.5 3
x 10-3
-8
-6
-4
-2
0
2
4
6
8
Strain in bolts
Late
ral d
rift r
atio
(%) SW4:
6-row boltsV=160kN
Bolt1aBolt2aBolt3aBolt4aBolt5aBolt6a
(c) Figure 4.12 Lateral drift ratio versus strain in each bolt of the three specimens SW2, SW3, and SW4
(a) Specimen SW2; (b) Specimen SW3; (c) Specimen SW4
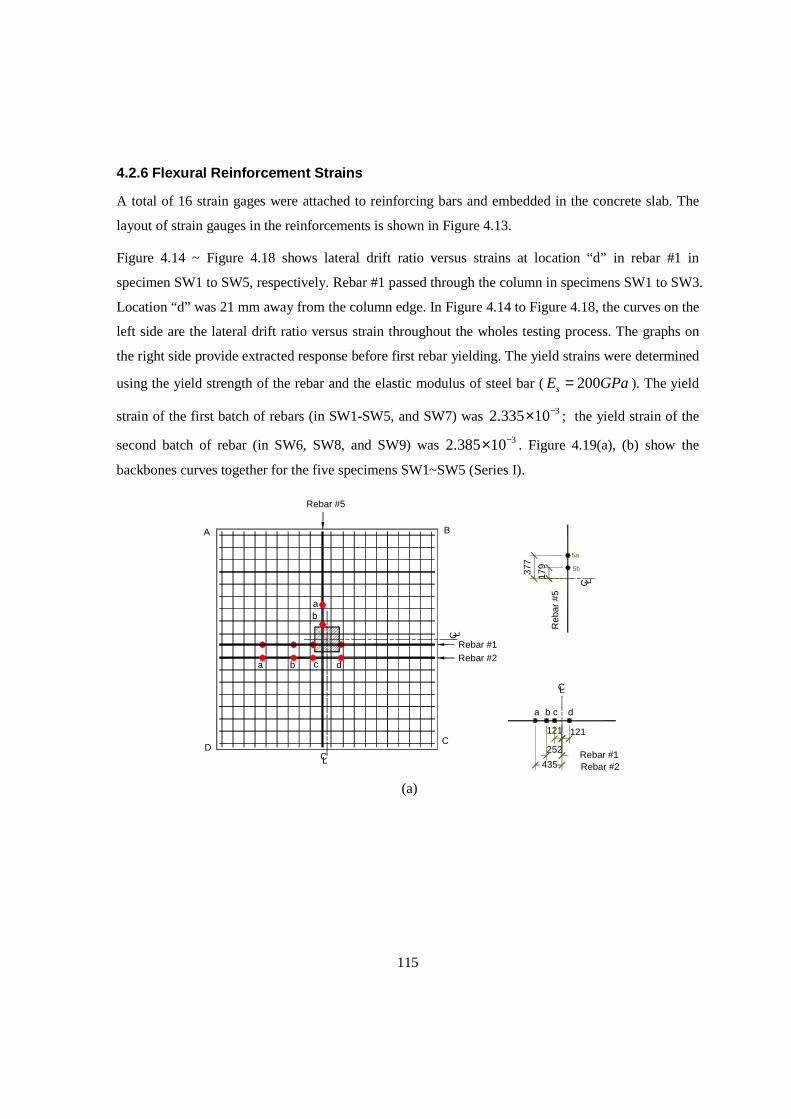
115
4.2.6 Flexural Reinforcement Strains
A total of 16 strain gages were attached to reinforcing bars and embedded in the concrete slab. The
layout of strain gauges in the reinforcements is shown in Figure 4.13.
Figure 4.14 ~ Figure 4.18 shows lateral drift ratio versus strains at location “d” in rebar #1 in
specimen SW1 to SW5, respectively. Rebar #1 passed through the column in specimens SW1 to SW3.
Location “d” was 21 mm away from the column edge. In Figure 4.14 to Figure 4.18, the curves on the
left side are the lateral drift ratio versus strain throughout the wholes testing process. The graphs on
the right side provide extracted response before first rebar yielding. The yield strains were determined
using the yield strength of the rebar and the elastic modulus of steel bar ( 200sE GPa= ). The yield
strain of the first batch of rebars (in SW1-SW5, and SW7) was 32.335 10−× ; the yield strain of the
second batch of rebar (in SW6, SW8, and SW9) was 32.385 10−× . Figure 4.19(a), (b) show the
backbones curves together for the five specimens SW1~SW5 (Series I).
435 Rebar #2L
Rebar #2Rebar #1
BA
DC
C
dcba
ba
C L
Rebar #5
Rebar #1
121121
252
a c db
LC
Reb
ar #
5
377
179
5a
C
5b
L
(a)
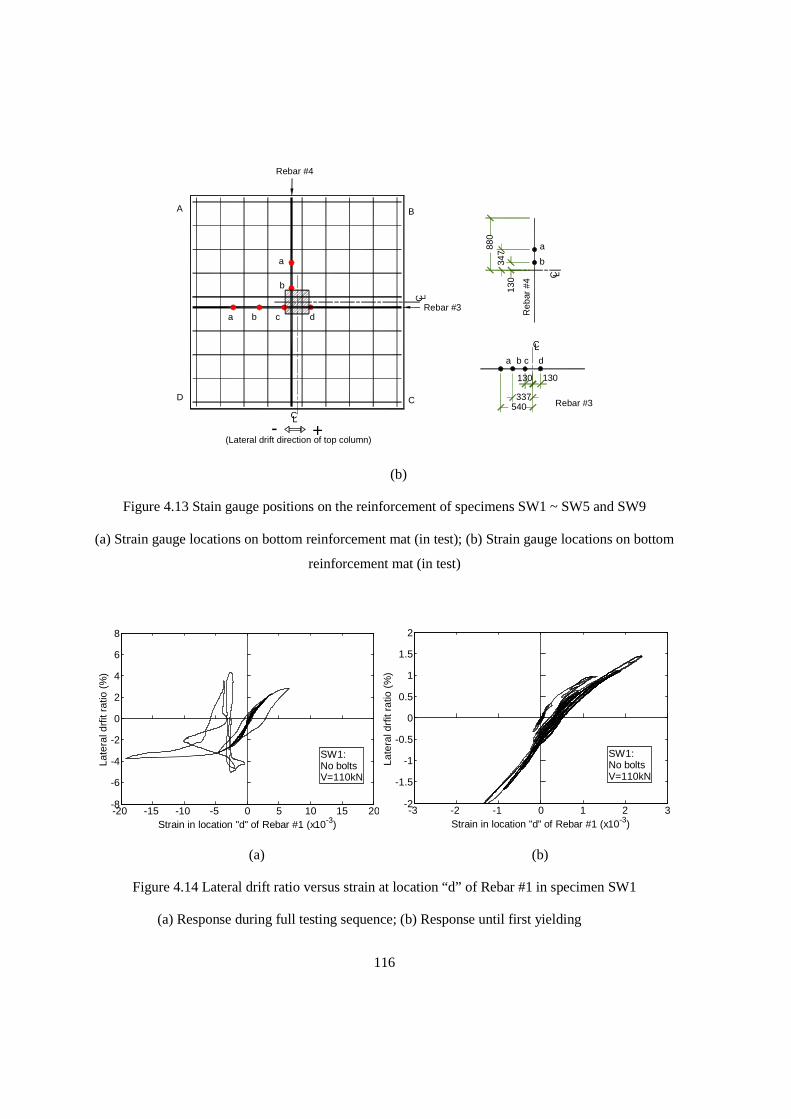
116
D C
(Lateral drift direction of top column)
b
dba c
A
a
B
Rebar #3
Rebar #4
+-
Rebar #3
a
Reb
ar #
4
b c d
CL
b
C L
a
130 130
540337
130
347
880
CLC L
(b)
Figure 4.13 Stain gauge positions on the reinforcement of specimens SW1 ~ SW5 and SW9
(a) Strain gauge locations on bottom reinforcement mat (in test); (b) Strain gauge locations on bottom
reinforcement mat (in test)
-20 -15 -10 -5 0 5 10 15 20-8
-6
-4
-2
0
2
4
6
8
SW1:No boltsV=110kN
Strain in location "d" of Rebar #1 (x10-3)
Late
ral d
rfit
ratio
(%
)
-3 -2 -1 0 1 2 3
-2
-1.5
-1
-0.5
0
0.5
1
1.5
2
SW1:No boltsV=110kN
Strain in location "d" of Rebar #1 (x10-3)
Late
ral d
rfit
ratio
(%
)
(a) (b)
Figure 4.14 Lateral drift ratio versus strain at location “d” of Rebar #1 in specimen SW1
(a) Response during full testing sequence; (b) Response until first yielding
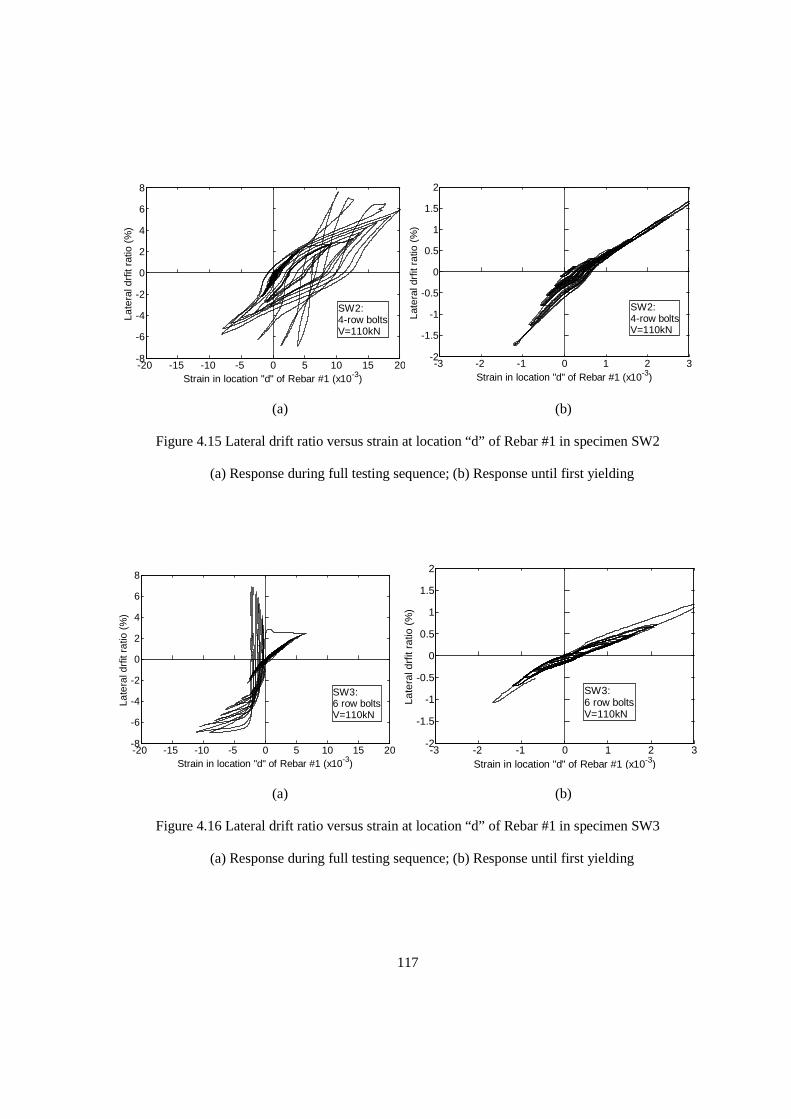
117
-20 -15 -10 -5 0 5 10 15 20-8
-6
-4
-2
0
2
4
6
8
SW2:4-row boltsV=110kN
Strain in location "d" of Rebar #1 (x10-3)
Late
ral d
rfit
ratio
(%
)
-3 -2 -1 0 1 2 3
-2
-1.5
-1
-0.5
0
0.5
1
1.5
2
SW2:4-row boltsV=110kN
Strain in location "d" of Rebar #1 (x10-3)
Late
ral d
rfit
ratio
(%
)
(a) (b)
Figure 4.15 Lateral drift ratio versus strain at location “d” of Rebar #1 in specimen SW2
(a) Response during full testing sequence; (b) Response until first yielding
-20 -15 -10 -5 0 5 10 15 20-8
-6
-4
-2
0
2
4
6
8
SW3:6 row boltsV=110kN
Strain in location "d" of Rebar #1 (x10-3)
Late
ral d
rfit
ratio
(%
)
-3 -2 -1 0 1 2 3
-2
-1.5
-1
-0.5
0
0.5
1
1.5
2
SW3:6 row boltsV=110kN
Strain in location "d" of Rebar #1 (x10-3)
Late
ral d
rfit
ratio
(%
)
(a) (b)
Figure 4.16 Lateral drift ratio versus strain at location “d” of Rebar #1 in specimen SW3
(a) Response during full testing sequence; (b) Response until first yielding
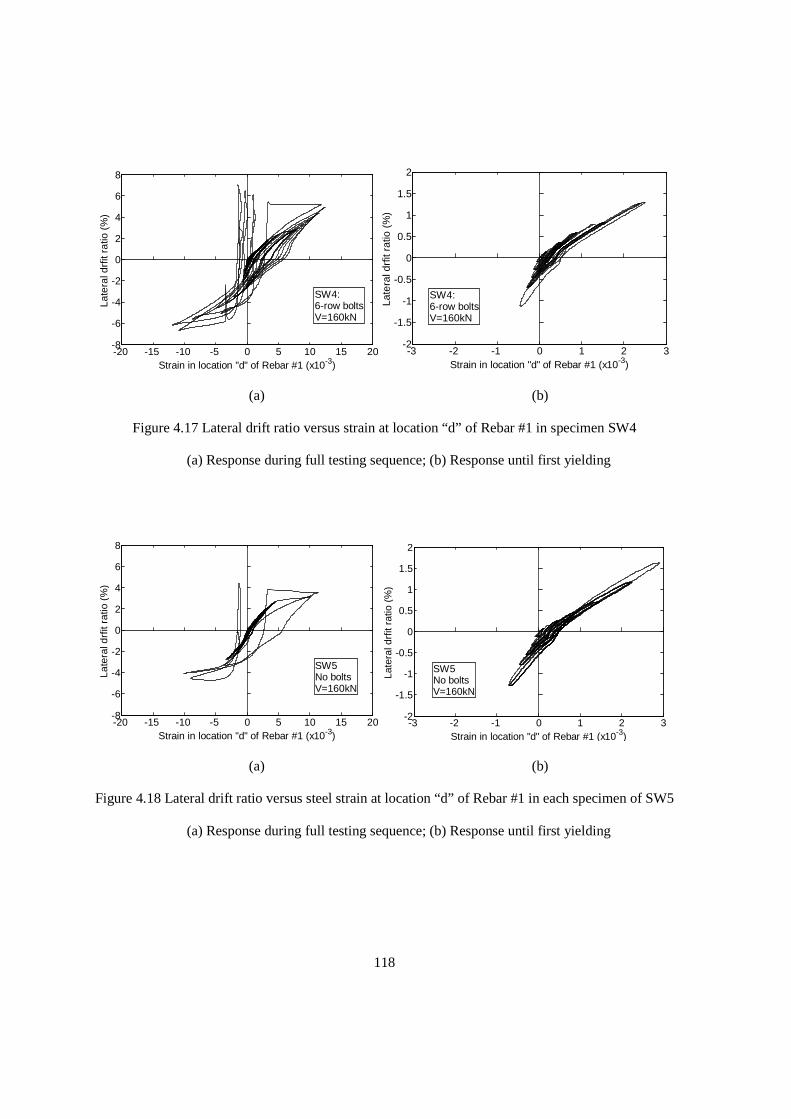
118
-20 -15 -10 -5 0 5 10 15 20-8
-6
-4
-2
0
2
4
6
8
SW4:6-row boltsV=160kN
Strain in location "d" of Rebar #1 (x10-3)
Late
ral d
rfit
ratio
(%
)
-3 -2 -1 0 1 2 3
-2
-1.5
-1
-0.5
0
0.5
1
1.5
2
SW4:6-row boltsV=160kN
Strain in location "d" of Rebar #1 (x10-3)
Late
ral d
rfit
ratio
(%
)
(a) (b)
Figure 4.17 Lateral drift ratio versus strain at location “d” of Rebar #1 in specimen SW4
(a) Response during full testing sequence; (b) Response until first yielding
-20 -15 -10 -5 0 5 10 15 20-8
-6
-4
-2
0
2
4
6
8
SW5No boltsV=160kN
Strain in location "d" of Rebar #1 (x10-3)
Late
ral d
rfit
ratio
(%
)
-3 -2 -1 0 1 2 3
-2
-1.5
-1
-0.5
0
0.5
1
1.5
2
SW5No boltsV=160kN
Strain in location "d" of Rebar #1 (x10-3)
Late
ral d
rfit
ratio
(%
)
(a) (b)
Figure 4.18 Lateral drift ratio versus steel strain at location “d” of Rebar #1 in each specimen of SW5
(a) Response during full testing sequence; (b) Response until first yielding
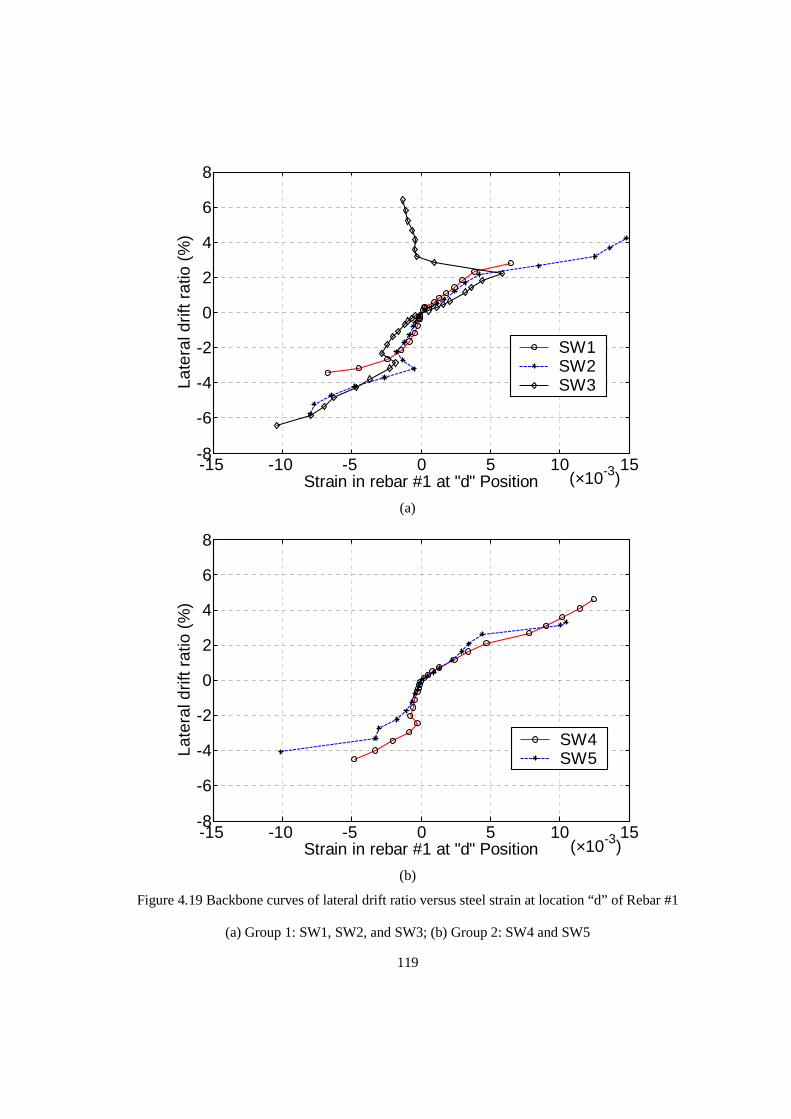
119
-15 -10 -5 0 5 10 15-8
-6
-4
-2
0
2
4
6
8
Strain in rebar #1 at "d" Position
Late
ral d
rift r
atio
(%
)
(×10-3)
SW1SW2SW3
(a)
-15 -10 -5 0 5 10 15-8
-6
-4
-2
0
2
4
6
8
Strain in rebar #1 at "d" Position
Late
ral d
rift r
atio
(%
)
(×10-3)
SW4SW5
(b)
Figure 4.19 Backbone curves of lateral drift ratio versus steel strain at location “d” of Rebar #1
(a) Group 1: SW1, SW2, and SW3; (b) Group 2: SW4 and SW5
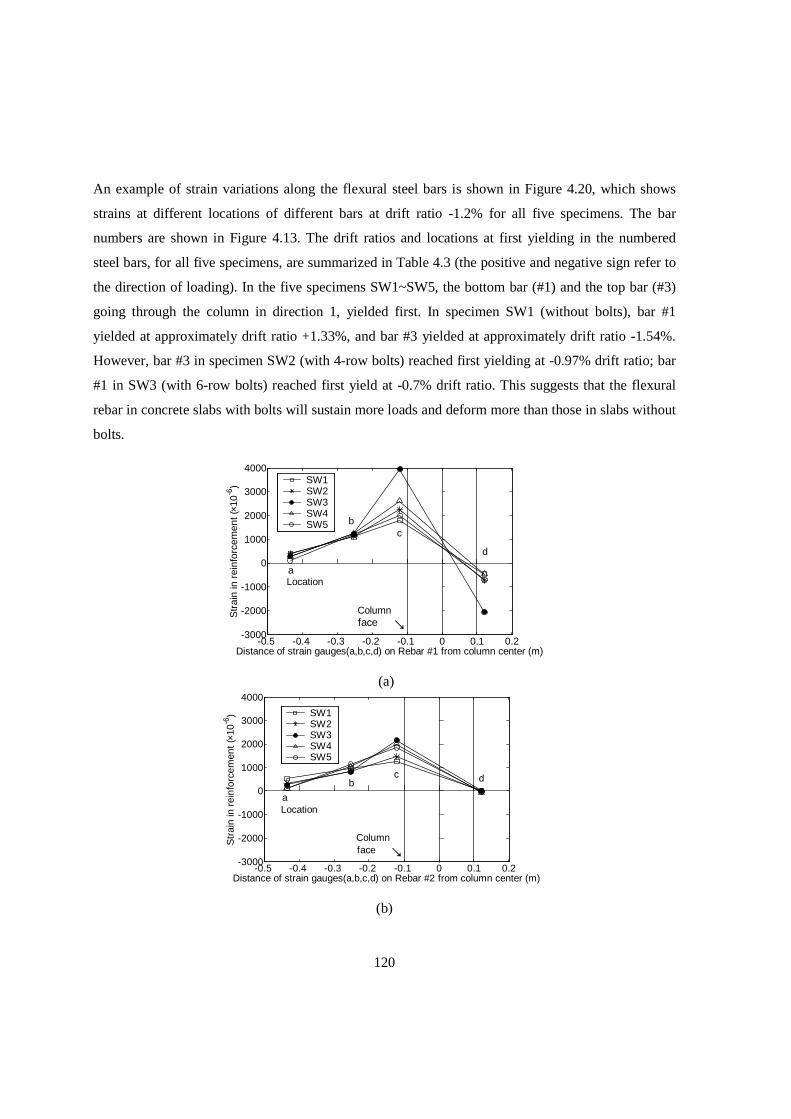
120
An example of strain variations along the flexural steel bars is shown in Figure 4.20, which shows
strains at different locations of different bars at drift ratio -1.2% for all five specimens. The bar
numbers are shown in Figure 4.13. The drift ratios and locations at first yielding in the numbered
steel bars, for all five specimens, are summarized in Table 4.3 (the positive and negative sign refer to
the direction of loading). In the five specimens SW1~SW5, the bottom bar (#1) and the top bar (#3)
going through the column in direction 1, yielded first. In specimen SW1 (without bolts), bar #1
yielded at approximately drift ratio +1.33%, and bar #3 yielded at approximately drift ratio -1.54%.
However, bar #3 in specimen SW2 (with 4-row bolts) reached first yielding at -0.97% drift ratio; bar
#1 in SW3 (with 6-row bolts) reached first yield at -0.7% drift ratio. This suggests that the flexural
rebar in concrete slabs with bolts will sustain more loads and deform more than those in slabs without
bolts.
-0.5 -0.4 -0.3 -0.2 -0.1 0 0.1 0.2-3000
-2000
-1000
0
1000
2000
3000
4000
Distance of strain gauges(a,b,c,d) on Rebar #1 from column center (m)
Str
ain
in r
einf
orce
men
t (×1
0-6)
aLocation
bc
d
Columnface ←
SW1SW2SW3SW4SW5
(a)
-0.5 -0.4 -0.3 -0.2 -0.1 0 0.1 0.2-3000
-2000
-1000
0
1000
2000
3000
4000
Distance of strain gauges(a,b,c,d) on Rebar #2 from column center (m)
Str
ain
in r
einf
orce
men
t (×1
0-6)
aLocation
bc d
Columnface ←
SW1SW2SW3SW4SW5
(b)
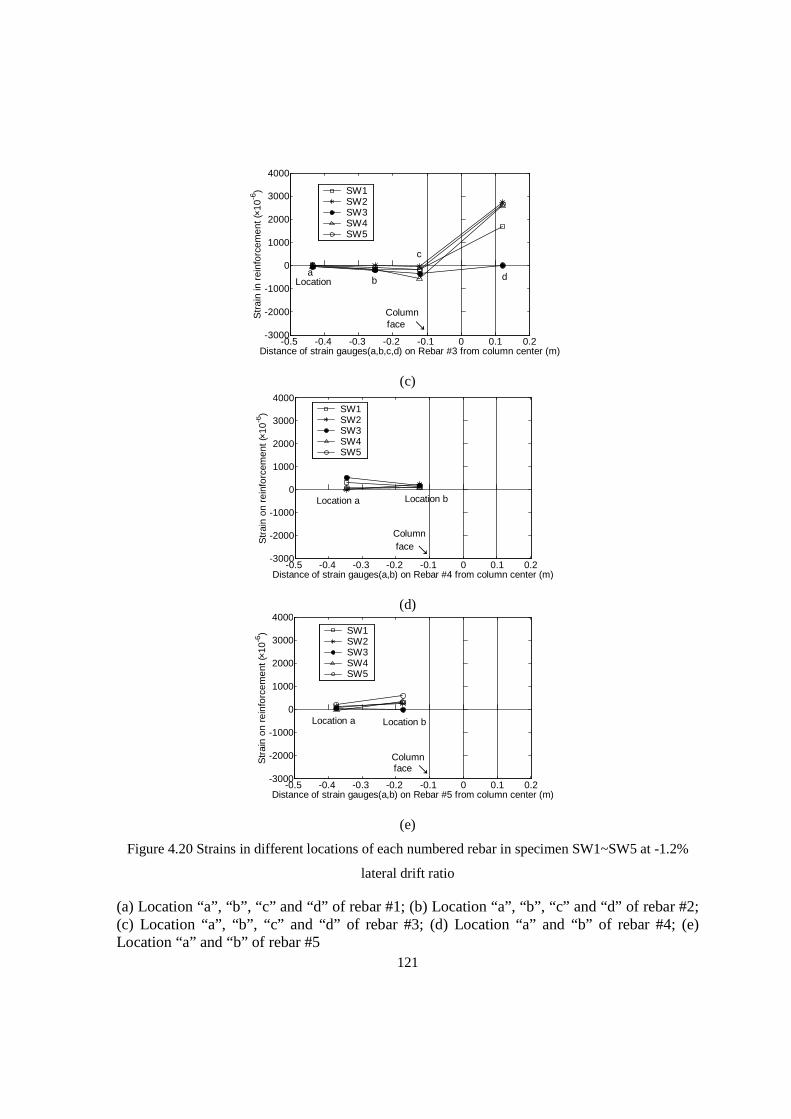
121
-0.5 -0.4 -0.3 -0.2 -0.1 0 0.1 0.2-3000
-2000
-1000
0
1000
2000
3000
4000
Distance of strain gauges(a,b,c,d) on Rebar #3 from column center (m)
Str
ain
in r
einf
orce
men
t (×1
0-6)
aLocation b
c
d
Columnface ←
SW1SW2SW3SW4SW5
(c)
-0.5 -0.4 -0.3 -0.2 -0.1 0 0.1 0.2-3000
-2000
-1000
0
1000
2000
3000
4000
Distance of strain gauges(a,b) on Rebar #4 from column center (m)
Str
ain
on r
einf
orce
men
t (×1
0-6)
Location a Location b
Columnface ←
SW1SW2SW3SW4SW5
(d)
-0.5 -0.4 -0.3 -0.2 -0.1 0 0.1 0.2-3000
-2000
-1000
0
1000
2000
3000
4000
Distance of strain gauges(a,b) on Rebar #5 from column center (m)
Str
ain
on r
einf
orce
men
t (×1
0-6)
Location a Location b
Columnface ←
SW1SW2SW3SW4SW5
(e)
Figure 4.20 Strains in different locations of each numbered rebar in specimen SW1~SW5 at -1.2%
lateral drift ratio
(a) Location “a”, “b”, “c” and “d” of rebar #1; (b) Location “a”, “b”, “c” and “d” of rebar #2; (c) Location “a”, “b”, “c” and “d” of rebar #3; (d) Location “a” and “b” of rebar #4; (e) Location “a” and “b” of rebar #5
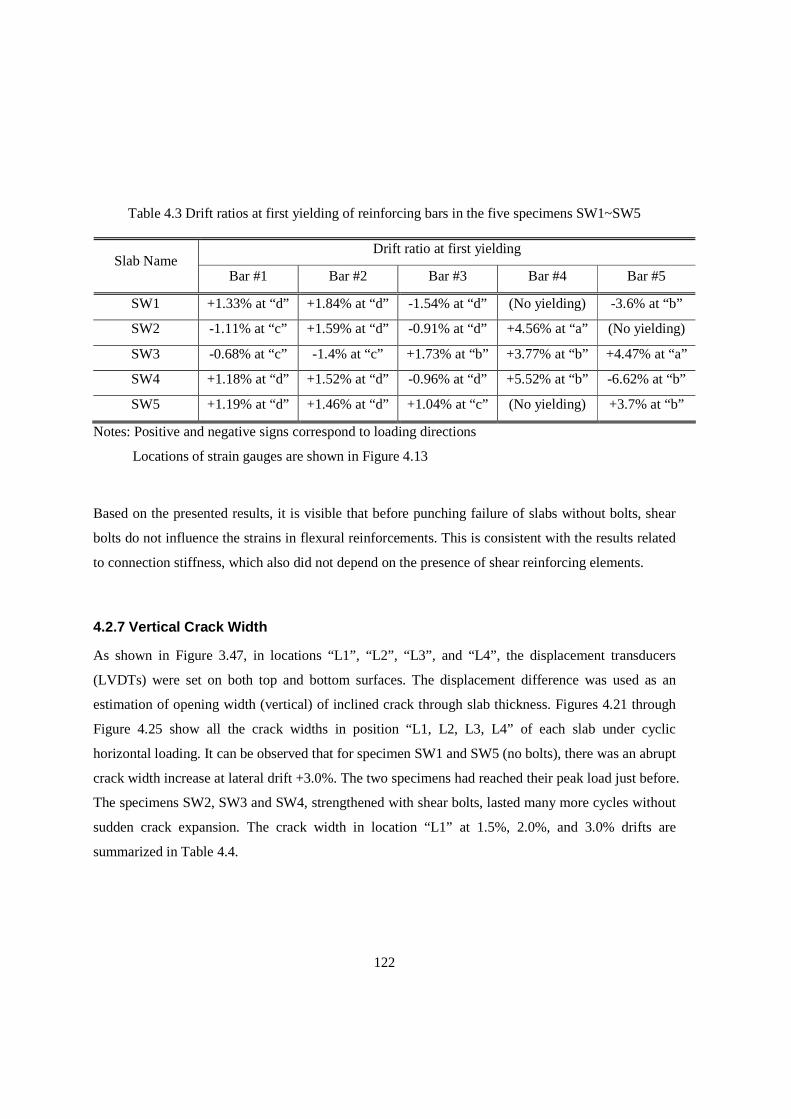
122
Table 4.3 Drift ratios at first yielding of reinforcing bars in the five specimens SW1~SW5
Drift ratio at first yielding Slab Name
Bar #1 Bar #2 Bar #3 Bar #4 Bar #5
SW1 +1.33% at “d” +1.84% at “d” -1.54% at “d” (No yielding) -3.6% at “b”
SW2 -1.11% at “c” +1.59% at “d” -0.91% at “d” +4.56% at “a” (No yielding)
SW3 -0.68% at “c” -1.4% at “c” +1.73% at “b” +3.77% at “b” +4.47% at “a”
SW4 +1.18% at “d” +1.52% at “d” -0.96% at “d” +5.52% at “b” -6.62% at “b”
SW5 +1.19% at “d” +1.46% at “d” +1.04% at “c” (No yielding) +3.7% at “b”
Notes: Positive and negative signs correspond to loading directions
Locations of strain gauges are shown in Figure 4.13
Based on the presented results, it is visible that before punching failure of slabs without bolts, shear
bolts do not influence the strains in flexural reinforcements. This is consistent with the results related
to connection stiffness, which also did not depend on the presence of shear reinforcing elements.
4.2.7 Vertical Crack Width
As shown in Figure 3.47, in locations “L1”, “L2”, “L3”, and “L4”, the displacement transducers
(LVDTs) were set on both top and bottom surfaces. The displacement difference was used as an
estimation of opening width (vertical) of inclined crack through slab thickness. Figures 4.21 through
Figure 4.25 show all the crack widths in position “L1, L2, L3, L4” of each slab under cyclic
horizontal loading. It can be observed that for specimen SW1 and SW5 (no bolts), there was an abrupt
crack width increase at lateral drift +3.0%. The two specimens had reached their peak load just before.
The specimens SW2, SW3 and SW4, strengthened with shear bolts, lasted many more cycles without
sudden crack expansion. The crack width in location “L1” at 1.5%, 2.0%, and 3.0% drifts are
summarized in Table 4.4.
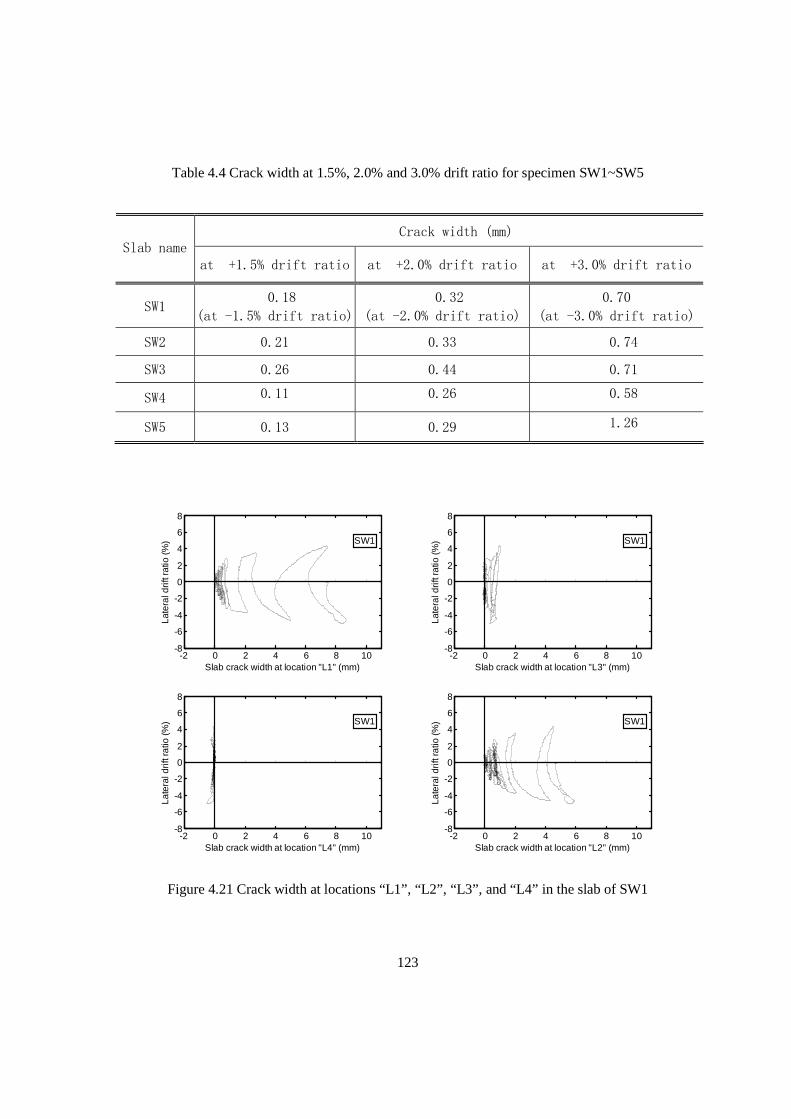
123
Table 4.4 Crack width at 1.5%, 2.0% and 3.0% drift ratio for specimen SW1~SW5
Crack width (mm) Slab name
at +1.5% drift ratio at +2.0% drift ratio at +3.0% drift ratio
SW1 0.18
(at -1.5% drift ratio)
0.32
(at -2.0% drift ratio)
0.70
(at -3.0% drift ratio)
SW2 0.21 0.33 0.74
SW3 0.26 0.44 0.71
SW4 0.11 0.26 0.58
SW5 0.13 0.29 1.26
-2 0 2 4 6 8 10-8
-6
-4
-2
0
2
4
6
8
Slab crack width at location "L1" (mm)
Late
ral d
rift r
atio
(%) SW1
-2 0 2 4 6 8 10-8
-6
-4
-2
0
2
4
6
8
Slab crack width at location "L3" (mm)
Late
ral d
rift r
atio
(%) SW1
-2 0 2 4 6 8 10-8
-6
-4
-2
0
2
4
6
8
Slab crack width at location "L4" (mm)
Late
ral d
rift r
atio
(%) SW1
-2 0 2 4 6 8 10-8
-6
-4
-2
0
2
4
6
8
Slab crack width at location "L2" (mm)
Late
ral d
rift r
atio
(%) SW1
Figure 4.21 Crack width at locations “L1”, “L2”, “L3”, and “L4” in the slab of SW1
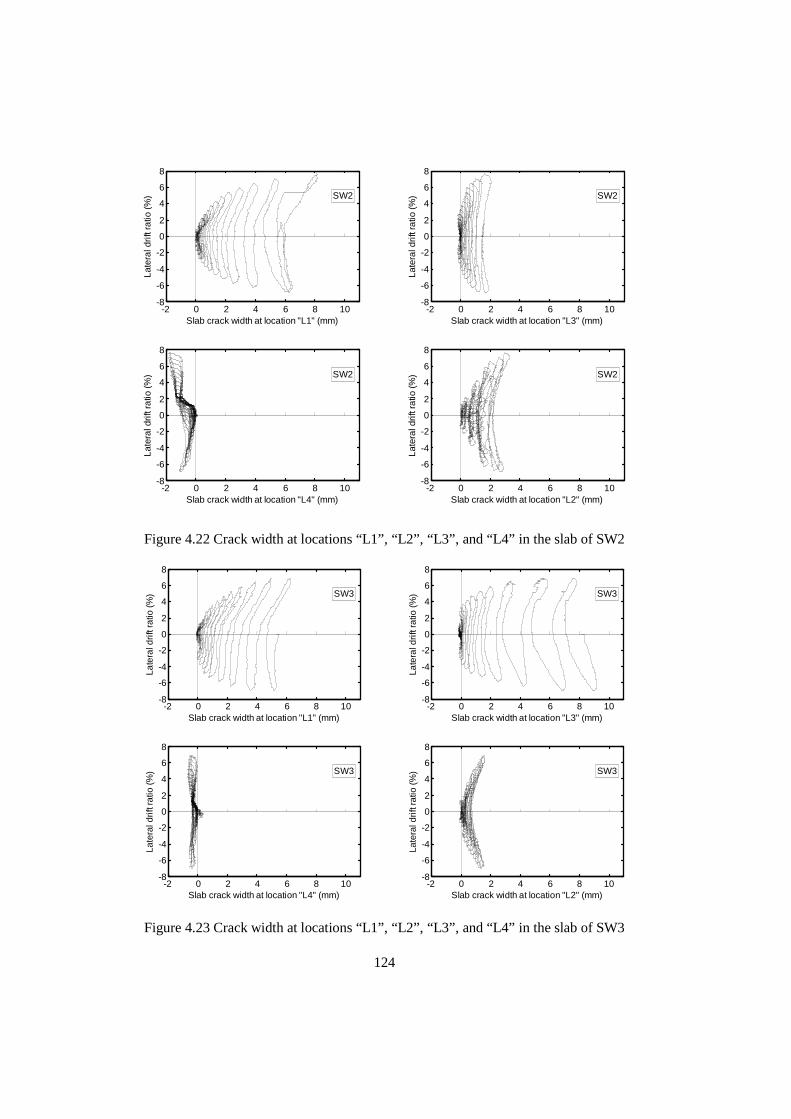
124
-2 0 2 4 6 8 10-8
-6
-4
-2
0
2
4
6
8
Slab crack width at location "L1" (mm)
Late
ral d
rift r
atio
(%) SW2
-2 0 2 4 6 8 10-8
-6
-4
-2
0
2
4
6
8
Slab crack width at location "L3" (mm)
Late
ral d
rift r
atio
(%) SW2
-2 0 2 4 6 8 10-8
-6
-4
-2
0
2
4
6
8
Slab crack width at location "L4" (mm)
Late
ral d
rift r
atio
(%) SW2
-2 0 2 4 6 8 10-8
-6
-4
-2
0
2
4
6
8
Slab crack width at location "L2" (mm)
Late
ral d
rift r
atio
(%) SW2
Figure 4.22 Crack width at locations “L1”, “L2”, “L3”, and “L4” in the slab of SW2
-2 0 2 4 6 8 10-8
-6
-4
-2
0
2
4
6
8
Slab crack width at location "L1" (mm)
Late
ral d
rift r
atio
(%) SW3
-2 0 2 4 6 8 10-8
-6
-4
-2
0
2
4
6
8
Slab crack width at location "L3" (mm)
Late
ral d
rift r
atio
(%) SW3
-2 0 2 4 6 8 10-8
-6
-4
-2
0
2
4
6
8
Slab crack width at location "L4" (mm)
Late
ral d
rift r
atio
(%) SW3
-2 0 2 4 6 8 10-8
-6
-4
-2
0
2
4
6
8
Slab crack width at location "L2" (mm)
Late
ral d
rift r
atio
(%) SW3
Figure 4.23 Crack width at locations “L1”, “L2”, “L3”, and “L4” in the slab of SW3
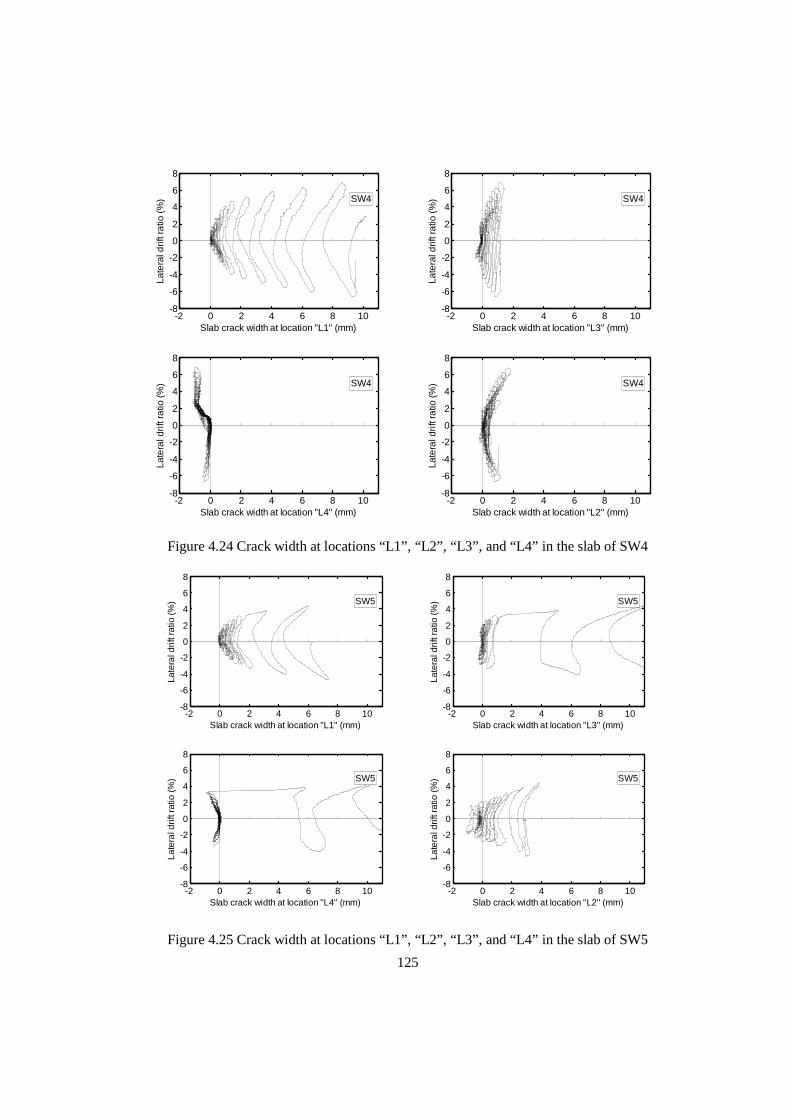
125
-2 0 2 4 6 8 10-8
-6
-4
-2
0
2
4
6
8
Slab crack width at location "L1" (mm)
Late
ral d
rift r
atio
(%) SW4
-2 0 2 4 6 8 10-8
-6
-4
-2
0
2
4
6
8
Slab crack width at location "L3" (mm)
Late
ral d
rift r
atio
(%) SW4
-2 0 2 4 6 8 10-8
-6
-4
-2
0
2
4
6
8
Slab crack width at location "L4" (mm)
Late
ral d
rift r
atio
(%) SW4
-2 0 2 4 6 8 10-8
-6
-4
-2
0
2
4
6
8
Slab crack width at location "L2" (mm)
Late
ral d
rift r
atio
(%) SW4
Figure 4.24 Crack width at locations “L1”, “L2”, “L3”, and “L4” in the slab of SW4
-2 0 2 4 6 8 10-8
-6
-4
-2
0
2
4
6
8
Slab crack width at location "L1" (mm)
Late
ral d
rift r
atio
(%) SW5
-2 0 2 4 6 8 10-8
-6
-4
-2
0
2
4
6
8
Slab crack width at location "L3" (mm)
Late
ral d
rift r
atio
(%) SW5
-2 0 2 4 6 8 10-8
-6
-4
-2
0
2
4
6
8
Slab crack width at location "L4" (mm)
Late
ral d
rift r
atio
(%) SW5
-2 0 2 4 6 8 10-8
-6
-4
-2
0
2
4
6
8
Slab crack width at location "L2" (mm)
Late
ral d
rift r
atio
(%) SW5
Figure 4.25 Crack width at locations “L1”, “L2”, “L3”, and “L4” in the slab of SW5
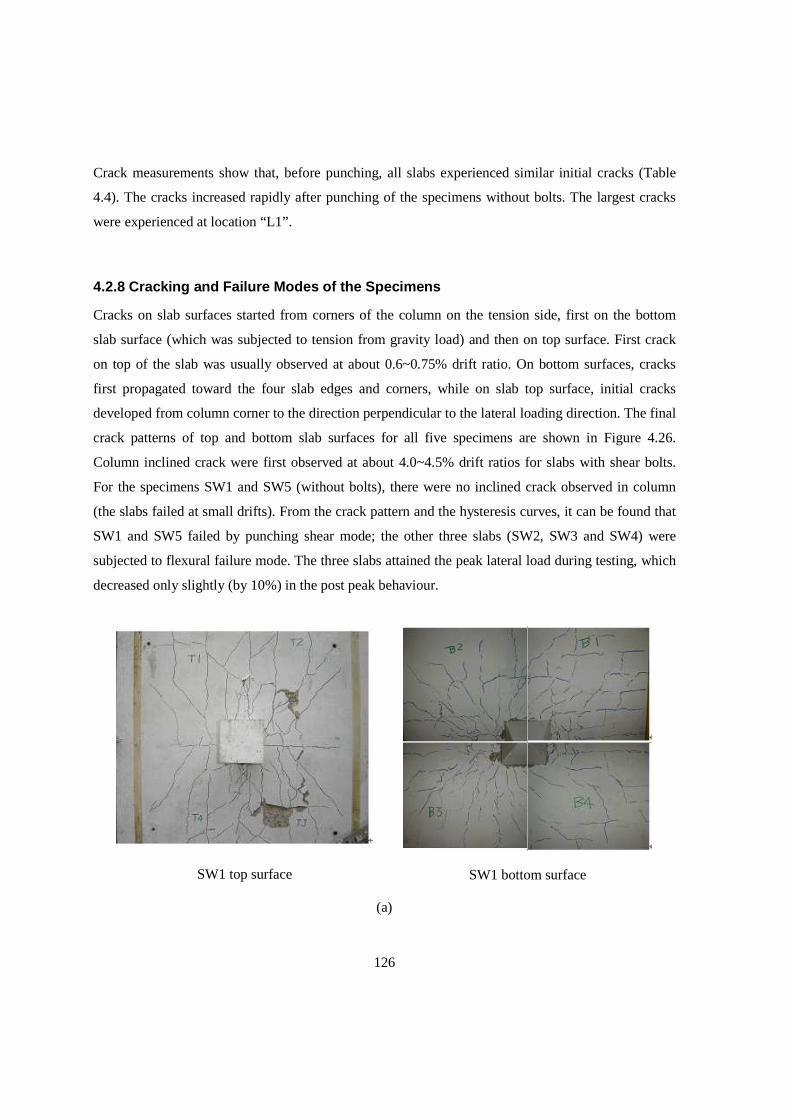
126
Crack measurements show that, before punching, all slabs experienced similar initial cracks (Table
4.4). The cracks increased rapidly after punching of the specimens without bolts. The largest cracks
were experienced at location “L1”.
4.2.8 Cracking and Failure Modes of the Specimens
Cracks on slab surfaces started from corners of the column on the tension side, first on the bottom
slab surface (which was subjected to tension from gravity load) and then on top surface. First crack
on top of the slab was usually observed at about 0.6~0.75% drift ratio. On bottom surfaces, cracks
first propagated toward the four slab edges and corners, while on slab top surface, initial cracks
developed from column corner to the direction perpendicular to the lateral loading direction. The final
crack patterns of top and bottom slab surfaces for all five specimens are shown in Figure 4.26.
Column inclined crack were first observed at about 4.0~4.5% drift ratios for slabs with shear bolts.
For the specimens SW1 and SW5 (without bolts), there were no inclined crack observed in column
(the slabs failed at small drifts). From the crack pattern and the hysteresis curves, it can be found that
SW1 and SW5 failed by punching shear mode; the other three slabs (SW2, SW3 and SW4) were
subjected to flexural failure mode. The three slabs attained the peak lateral load during testing, which
decreased only slightly (by 10%) in the post peak behaviour.
SW1 top surface
SW1 bottom surface
(a)
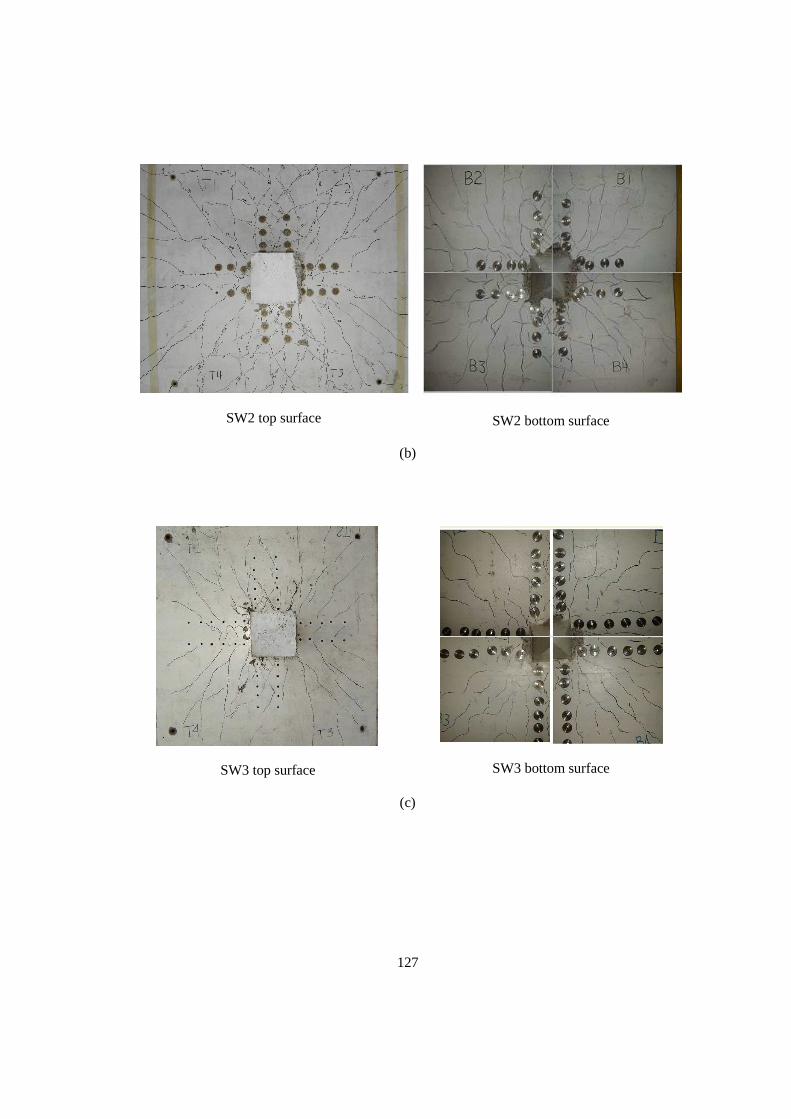
127
SW2 top surface
SW2 bottom surface
(b)
SW3 top surface
SW3 bottom surface
(c)
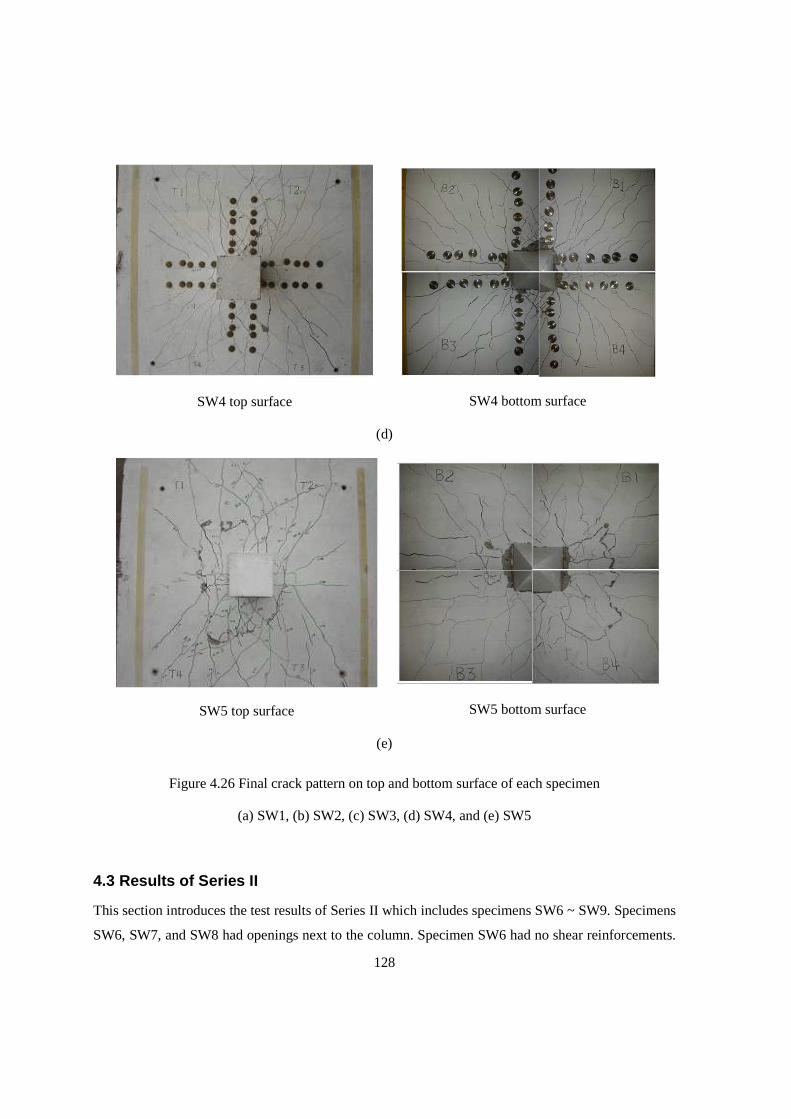
128
SW4 top surface
SW4 bottom surface
(d)
SW5 top surface
SW5 bottom surface
(e)
Figure 4.26 Final crack pattern on top and bottom surface of each specimen
(a) SW1, (b) SW2, (c) SW3, (d) SW4, and (e) SW5
4.3 Results of Series II
This section introduces the test results of Series II which includes specimens SW6 ~ SW9. Specimens
SW6, SW7, and SW8 had openings next to the column. Specimen SW6 had no shear reinforcements.
129
Specimen SW7 had an orthogonal pattern of six peripheral rows of bolts. Specimens SW8 and SW9
had a radial layout of steel shear bolts (6-row). Whenever appropriate, comparisons are made with
specimens from Series I. In Series I, three specimens had orthogonal pattern of shear bolts: specimen
SW2 had 4-row shear bolts; specimen SW3 and SW4 had 6-row shear bolts.
4.3.1 Connection Moment versus Lateral Drift Ratio
Connection moment is calculated from the moments of the top and bottom lateral forces multiplied by
the distance between them. The distance between the two horizontal hydraulic actuators was 1.25m.
The lateral drift ratio was calculated from the lateral displacement measured by the external string pot
divided by the distance between slab-column center and the string pot. Since top and bottom lateral
drift ratios are slightly different, the average drift ratio is used herein. Figures 4.27 (a) to (d) show the
curves of moment versus lateral drift ratio for specimen SW6 to SW9 respectively.
In each curve, the peak points were marked and linked by a dashed line (backbone curve). The four
backbone curves are plotted together in Figure 4.28, from which it is observed that, among the three
specimens with the same openings, SW6 (no bolts) had the minimum moment capacity, 52.28 kNm,
at negative peak point, while SW7 (orthogonal bolt pattern) reached 56.59 kNm (8.2% increase) and
SW8 (radial bolt pattern) reached 63.58 kNm (21.6% increase). Corresponding drifts at the negative
peak points are: -1.31% (SW6), -2.88% (SW7, 120% increase) and -2.77% (SW8, 111.5% increase)
Table 4.5 shows the moments at negative and positive peak points, the yield drift ratio, and drift
ductility at peak points and 80% of peak moment in post peak region. As expected, the specimen
SW9, without openings but strengthened with radial pattern of shear bolts, showed highest moment
capacity and ductility. Compared with specimen SW8 (with two openings and also strengthened with
radial pattern of shear bolts), SW9’s moment capacity was 76-80% larger; its lateral drift ratio at peak
moment was 145-211% larger; drift ductility at 80% peak load (post peak) increased by 44-55%.
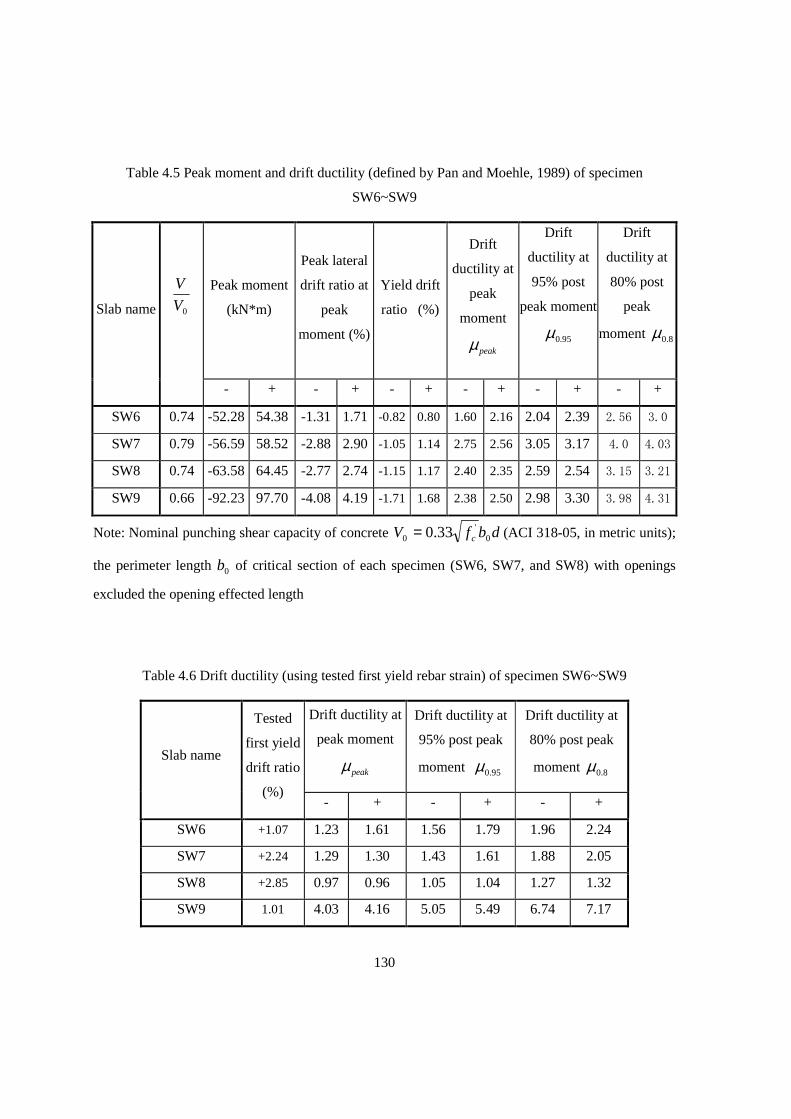
130
Table 4.5 Peak moment and drift ductility (defined by Pan and Moehle, 1989) of specimen
SW6~SW9
Peak moment
(kN*m)
Peak lateral
drift ratio at
peak
moment (%)
Yield drift
ratio (%)
Drift
ductility at
peak
moment
peakµ
Drift
ductility at
95% post
peak moment
95.0µ
Drift
ductility at
80% post
peak
moment 8.0µ
Slab name
0V
V
- + - + - + - + - + - +
SW6 0.74 -52.28 54.38 -1.31 1.71 -0.82 0.80 1.60 2.16 2.04 2.39 2.56 3.0
SW7 0.79 -56.59 58.52 -2.88 2.90 -1.05 1.14 2.75 2.56 3.05 3.17 4.0 4.03
SW8 0.74 -63.58 64.45 -2.77 2.74 -1.15 1.17 2.40 2.35 2.59 2.54 3.15 3.21
SW9 0.66 -92.23 97.70 -4.08 4.19 -1.71 1.68 2.38 2.50 2.98 3.30 3.98 4.31
Note: Nominal punching shear capacity of concrete dbfV c 0'
0 33.0= (ACI 318-05, in metric units);
the perimeter length 0b of critical section of each specimen (SW6, SW7, and SW8) with openings
excluded the opening effected length
Table 4.6 Drift ductility (using tested first yield rebar strain) of specimen SW6~SW9
Drift ductility at
peak moment
peakµ
Drift ductility at
95% post peak
moment 95.0µ
Drift ductility at
80% post peak
moment 8.0µ Slab name
Tested
first yield
drift ratio
(%) - + - + - +
SW6 +1.07 1.23 1.61 1.56 1.79 1.96 2.24
SW7 +2.24 1.29 1.30 1.43 1.61 1.88 2.05
SW8 +2.85 0.97 0.96 1.05 1.04 1.27 1.32
SW9 1.01 4.03 4.16 5.05 5.49 6.74 7.17
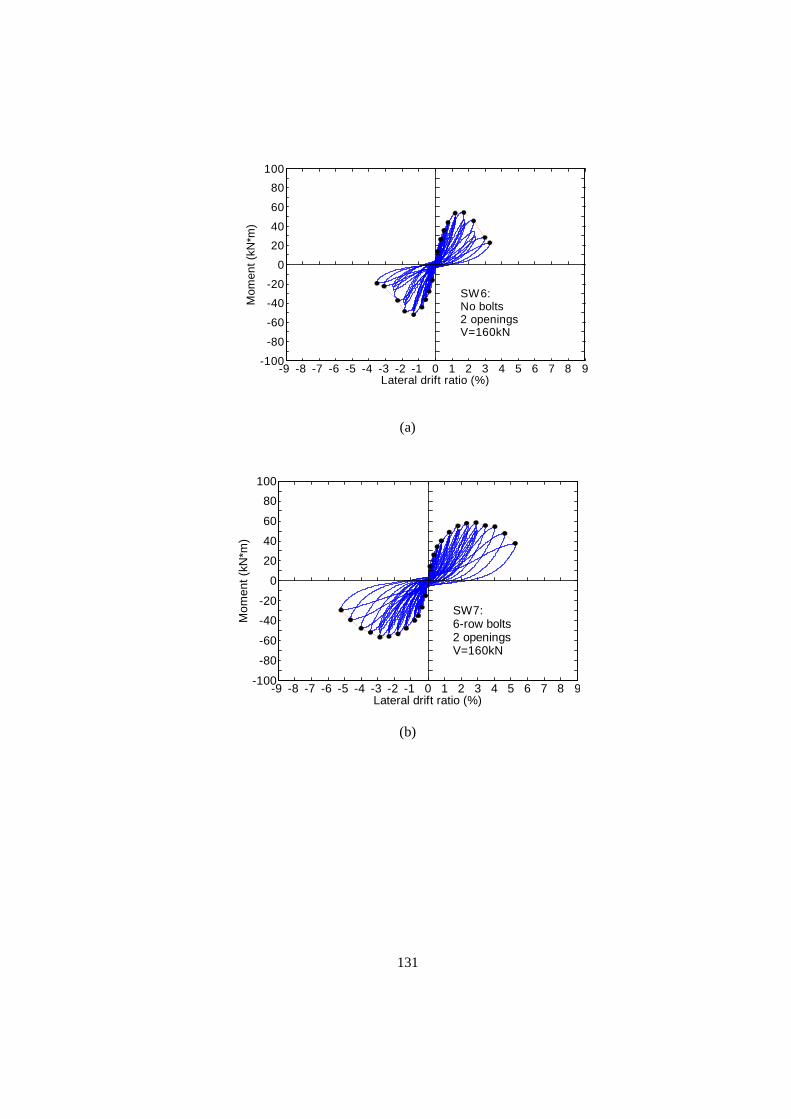
131
(a)
-9 -8 -7 -6 -5 -4 -3 -2 -1 0 1 2 3 4 5 6 7 8 9-100
-80
-60
-40
-20
0
20
40
60
80
100
Lateral drift ratio (%)
Mom
ent (
kN*m
)
SW7:6-row bolts2 openingsV=160kN
(b)
-9 -8 -7 -6 -5 -4 -3 -2 -1 0 1 2 3 4 5 6 7 8 9-100
-80
-60
-40
-20
0
20
40
60
80
100
Lateral drift ratio (%)
Mom
ent (
kN*m
)
SW6:No bolts2 openingsV=160kN
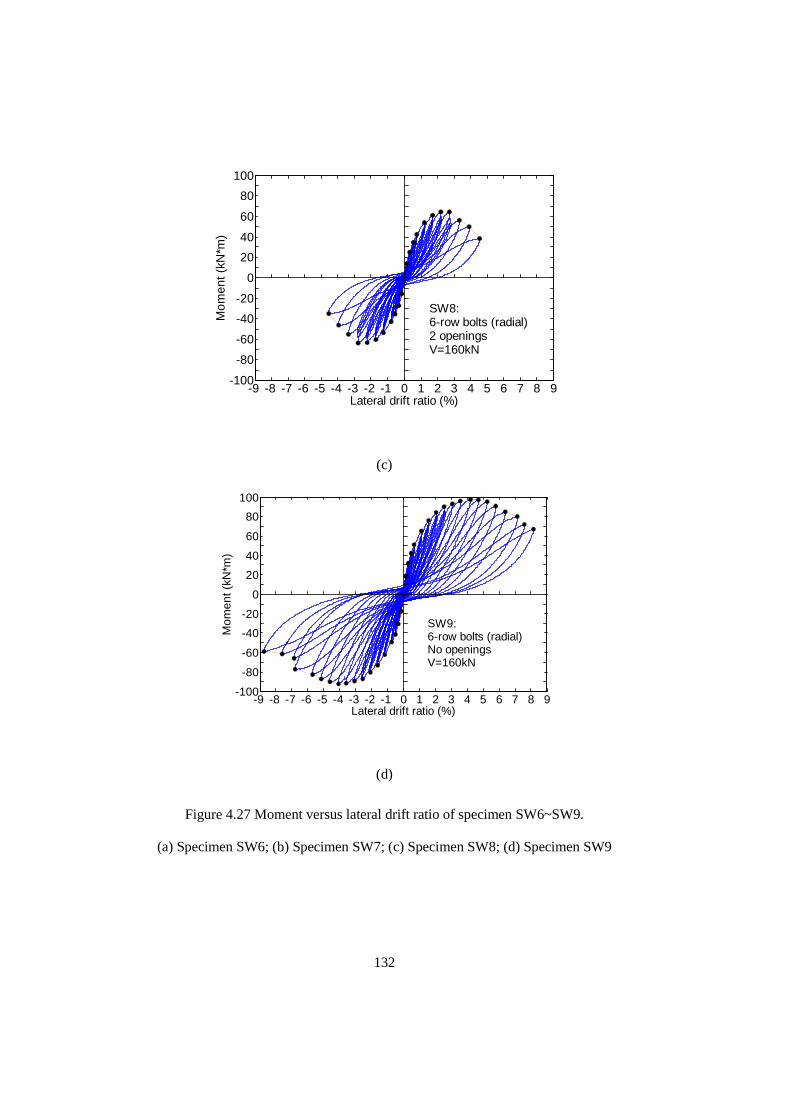
132
-9 -8 -7 -6 -5 -4 -3 -2 -1 0 1 2 3 4 5 6 7 8 9-100
-80
-60
-40
-20
0
20
40
60
80
100
Lateral drift ratio (%)
Mom
ent (
kN*m
)
SW8:6-row bolts (radial)2 openingsV=160kN
(c)
-9 -8 -7 -6 -5 -4 -3 -2 -1 0 1 2 3 4 5 6 7 8 9-100
-80
-60
-40
-20
0
20
40
60
80
100
Lateral drift ratio (%)
Mom
ent (
kN*m
)
SW9:6-row bolts (radial)No openingsV=160kN
(d)
Figure 4.27 Moment versus lateral drift ratio of specimen SW6~SW9.
(a) Specimen SW6; (b) Specimen SW7; (c) Specimen SW8; (d) Specimen SW9
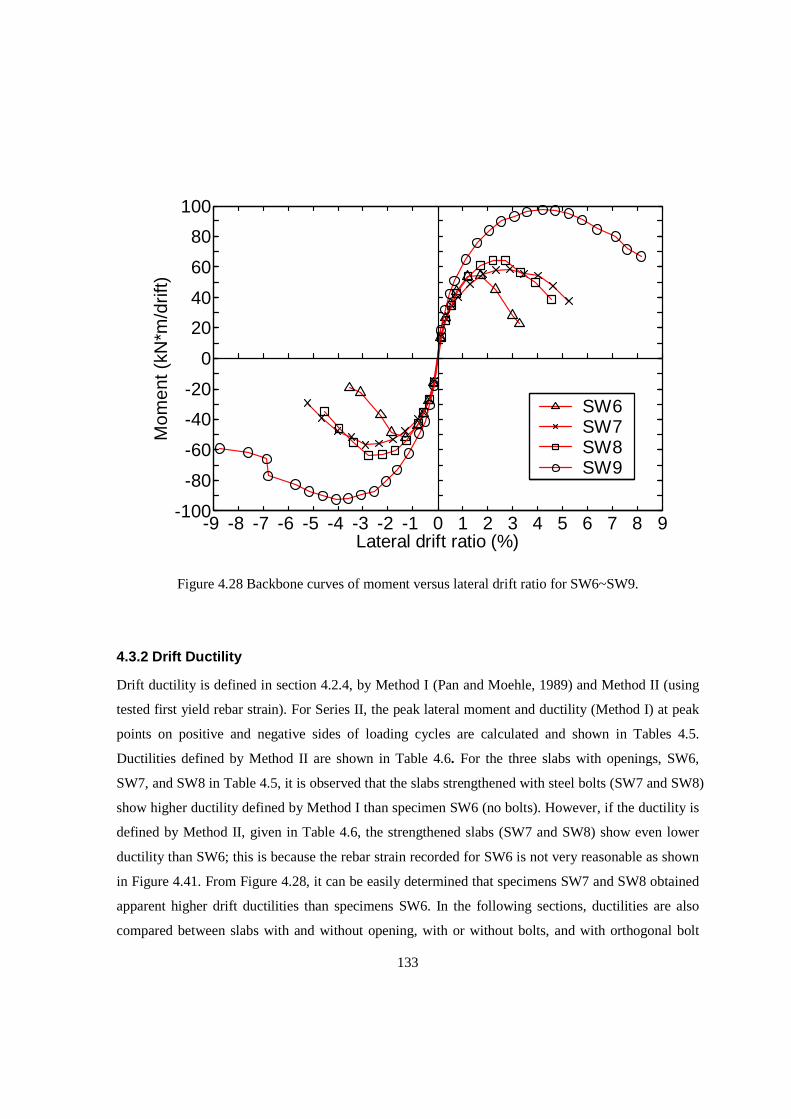
133
-9 -8 -7 -6 -5 -4 -3 -2 -1 0 1 2 3 4 5 6 7 8 9-100
-80
-60
-40
-20
0
20
40
60
80
100
Lateral drift ratio (%)
Mom
ent (
kN*m
/drif
t)
SW6SW7SW8SW9
Figure 4.28 Backbone curves of moment versus lateral drift ratio for SW6~SW9.
4.3.2 Drift Ductility
Drift ductility is defined in section 4.2.4, by Method I (Pan and Moehle, 1989) and Method II (using
tested first yield rebar strain). For Series II, the peak lateral moment and ductility (Method I) at peak
points on positive and negative sides of loading cycles are calculated and shown in Tables 4.5.
Ductilities defined by Method II are shown in Table 4.6. For the three slabs with openings, SW6,
SW7, and SW8 in Table 4.5, it is observed that the slabs strengthened with steel bolts (SW7 and SW8)
show higher ductility defined by Method I than specimen SW6 (no bolts). However, if the ductility is
defined by Method II, given in Table 4.6, the strengthened slabs (SW7 and SW8) show even lower
ductility than SW6; this is because the rebar strain recorded for SW6 is not very reasonable as shown
in Figure 4.41. From Figure 4.28, it can be easily determined that specimens SW7 and SW8 obtained
apparent higher drift ductilities than specimens SW6. In the following sections, ductilities are also
compared between slabs with and without opening, with or without bolts, and with orthogonal bolt
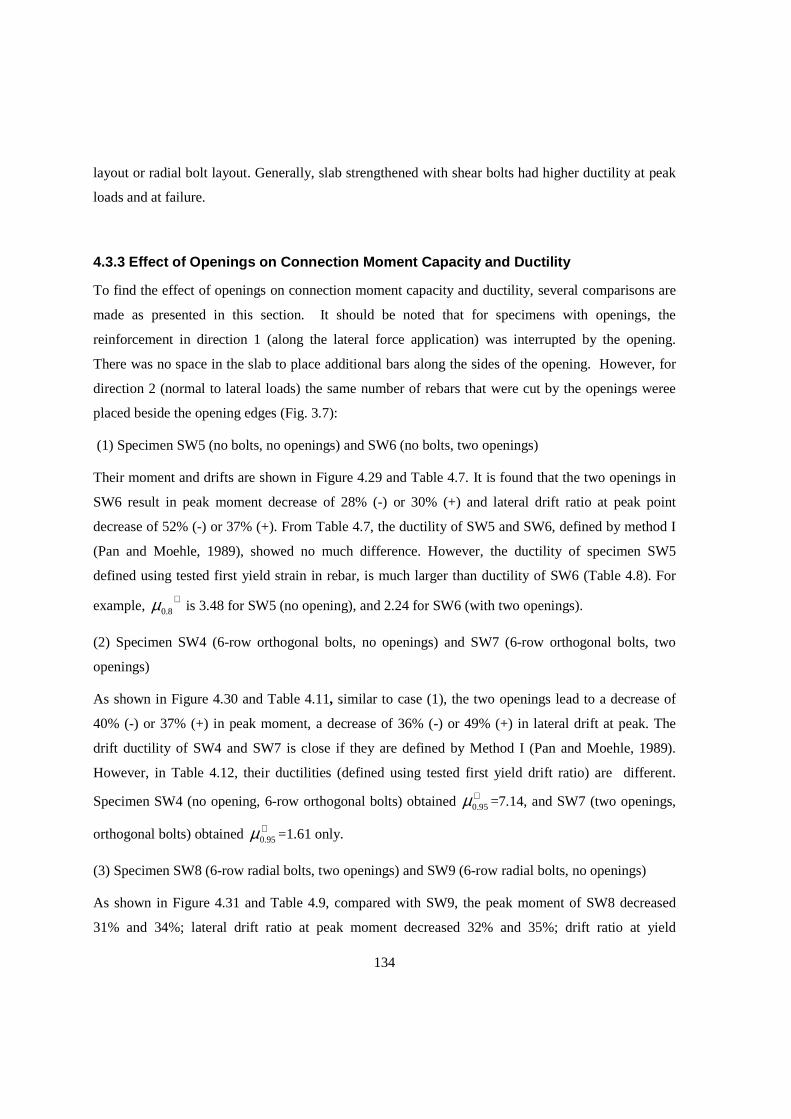
134
layout or radial bolt layout. Generally, slab strengthened with shear bolts had higher ductility at peak
loads and at failure.
4.3.3 Effect of Openings on Connection Moment Capac ity and Ductility
To find the effect of openings on connection moment capacity and ductility, several comparisons are
made as presented in this section. It should be noted that for specimens with openings, the
reinforcement in direction 1 (along the lateral force application) was interrupted by the opening.
There was no space in the slab to place additional bars along the sides of the opening. However, for
direction 2 (normal to lateral loads) the same number of rebars that were cut by the openings weree
placed beside the opening edges (Fig. 3.7):
(1) Specimen SW5 (no bolts, no openings) and SW6 (no bolts, two openings)
Their moment and drifts are shown in Figure 4.29 and Table 4.7. It is found that the two openings in
SW6 result in peak moment decrease of 28% (-) or 30% (+) and lateral drift ratio at peak point
decrease of 52% (-) or 37% (+). From Table 4.7, the ductility of SW5 and SW6, defined by method I
(Pan and Moehle, 1989), showed no much difference. However, the ductility of specimen SW5
defined using tested first yield strain in rebar, is much larger than ductility of SW6 (Table 4.8). For
example, +
8.0µ is 3.48 for SW5 (no opening), and 2.24 for SW6 (with two openings).
(2) Specimen SW4 (6-row orthogonal bolts, no openings) and SW7 (6-row orthogonal bolts, two
openings)
As shown in Figure 4.30 and Table 4.11, similar to case (1), the two openings lead to a decrease of
40% (-) or 37% (+) in peak moment, a decrease of 36% (-) or 49% (+) in lateral drift at peak. The
drift ductility of SW4 and SW7 is close if they are defined by Method I (Pan and Moehle, 1989).
However, in Table 4.12, their ductilities (defined using tested first yield drift ratio) are different.
Specimen SW4 (no opening, 6-row orthogonal bolts) obtained +95.0µ =7.14, and SW7 (two openings,
orthogonal bolts) obtained +95.0µ =1.61 only.
(3) Specimen SW8 (6-row radial bolts, two openings) and SW9 (6-row radial bolts, no openings)
As shown in Figure 4.31 and Table 4.9, compared with SW9, the peak moment of SW8 decreased
31% and 34%; lateral drift ratio at peak moment decreased 32% and 35%; drift ratio at yield
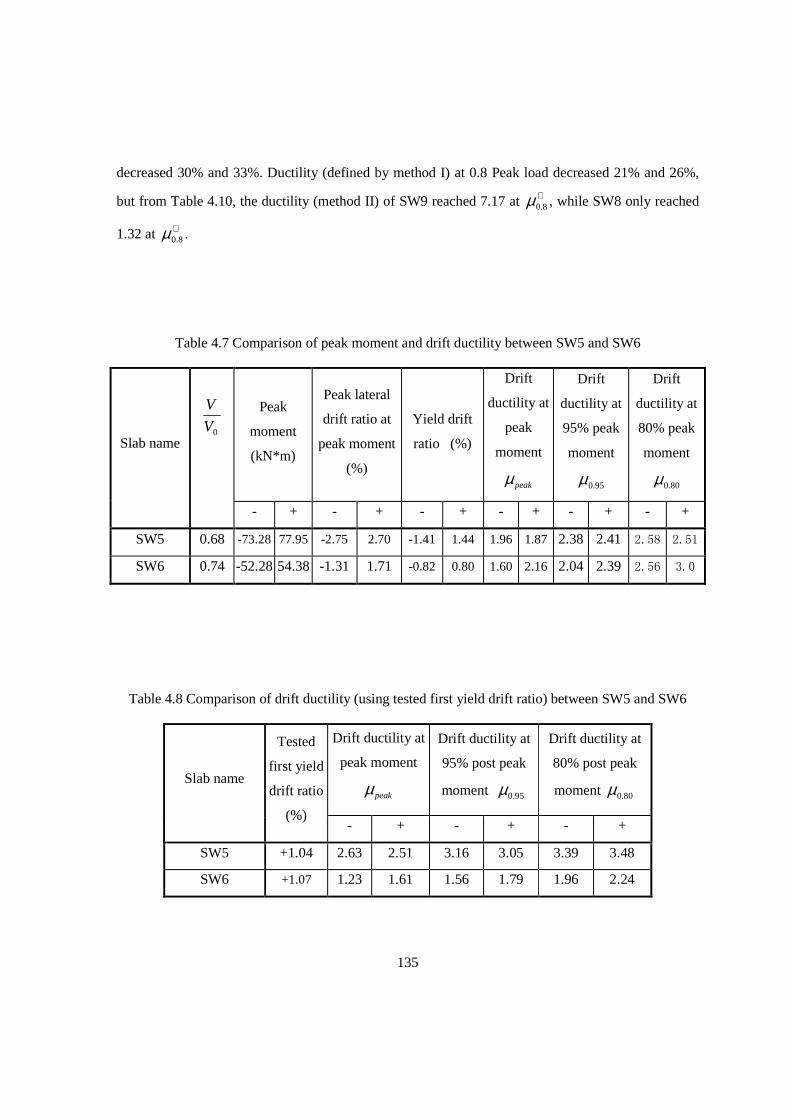
135
decreased 30% and 33%. Ductility (defined by method I) at 0.8 Peak load decreased 21% and 26%,
but from Table 4.10, the ductility (method II) of SW9 reached 7.17 at +8.0µ , while SW8 only reached
1.32 at +8.0µ .
Table 4.7 Comparison of peak moment and drift ductility between SW5 and SW6
Peak
moment
(kN*m)
Peak lateral
drift ratio at
peak moment
(%)
Yield drift
ratio (%)
Drift
ductility at
peak
moment
peakµ
Drift
ductility at
95% peak
moment
95.0µ
Drift
ductility at
80% peak
moment
80.0µ
Slab name
0V
V
- + - + - + - + - + - +
SW5 0.68 -73.28 77.95 -2.75 2.70 -1.41 1.44 1.96 1.87 2.38 2.41 2.58 2.51
SW6 0.74 -52.28 54.38 -1.31 1.71 -0.82 0.80 1.60 2.16 2.04 2.39 2.56 3.0
Table 4.8 Comparison of drift ductility (using tested first yield drift ratio) between SW5 and SW6
Drift ductility at
peak moment
peakµ
Drift ductility at
95% post peak
moment 95.0µ
Drift ductility at
80% post peak
moment 80.0µ Slab name
Tested
first yield
drift ratio
(%) - + - + - +
SW5 +1.04 2.63 2.51 3.16 3.05 3.39 3.48
SW6 +1.07 1.23 1.61 1.56 1.79 1.96 2.24
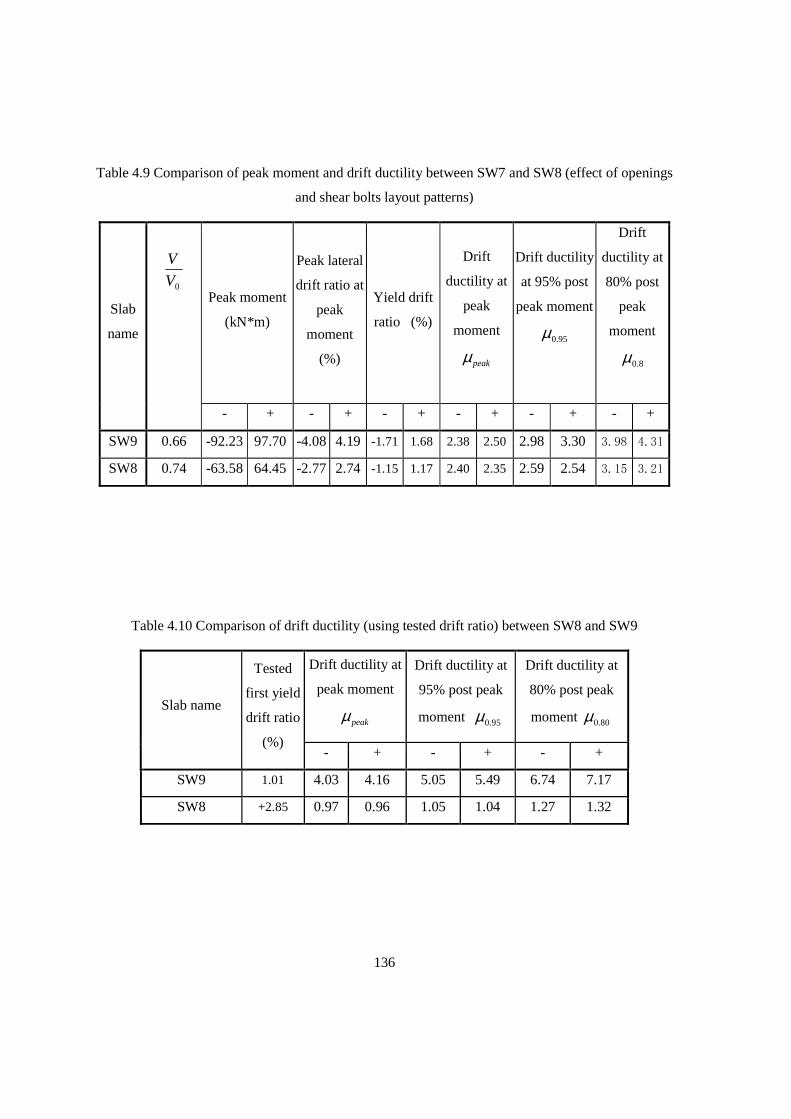
136
Table 4.9 Comparison of peak moment and drift ductility between SW7 and SW8 (effect of openings
and shear bolts layout patterns)
Peak moment
(kN*m)
Peak lateral
drift ratio at
peak
moment
(%)
Yield drift
ratio (%)
Drift
ductility at
peak
moment
peakµ
Drift ductility
at 95% post
peak moment
95.0µ
Drift
ductility at
80% post
peak
moment
8.0µ
Slab
name
0V
V
- + - + - + - + - + - +
SW9 0.66 -92.23 97.70 -4.08 4.19 -1.71 1.68 2.38 2.50 2.98 3.30 3.98 4.31
SW8 0.74 -63.58 64.45 -2.77 2.74 -1.15 1.17 2.40 2.35 2.59 2.54 3.15 3.21
Table 4.10 Comparison of drift ductility (using tested drift ratio) between SW8 and SW9
Drift ductility at
peak moment
peakµ
Drift ductility at
95% post peak
moment 95.0µ
Drift ductility at
80% post peak
moment 80.0µ Slab name
Tested
first yield
drift ratio
(%) - + - + - +
SW9 1.01 4.03 4.16 5.05 5.49 6.74 7.17
SW8 +2.85 0.97 0.96 1.05 1.04 1.27 1.32
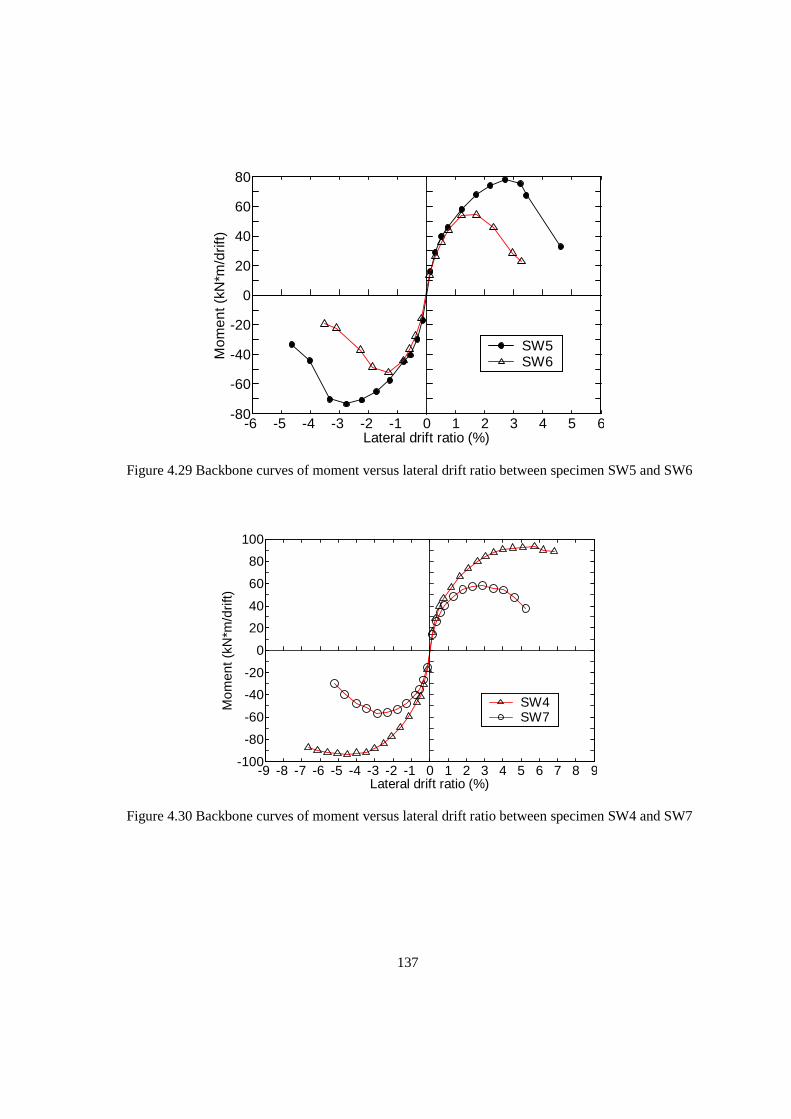
137
-6 -5 -4 -3 -2 -1 0 1 2 3 4 5 6-80
-60
-40
-20
0
20
40
60
80
Lateral drift ratio (%)
Mom
ent (
kN*m
/drif
t)
SW5SW6
Figure 4.29 Backbone curves of moment versus lateral drift ratio between specimen SW5 and SW6
-9 -8 -7 -6 -5 -4 -3 -2 -1 0 1 2 3 4 5 6 7 8 9-100
-80
-60
-40
-20
0
20
40
60
80
100
Lateral drift ratio (%)
Mom
ent (
kN*m
/drif
t)
SW4SW7
Figure 4.30 Backbone curves of moment versus lateral drift ratio between specimen SW4 and SW7
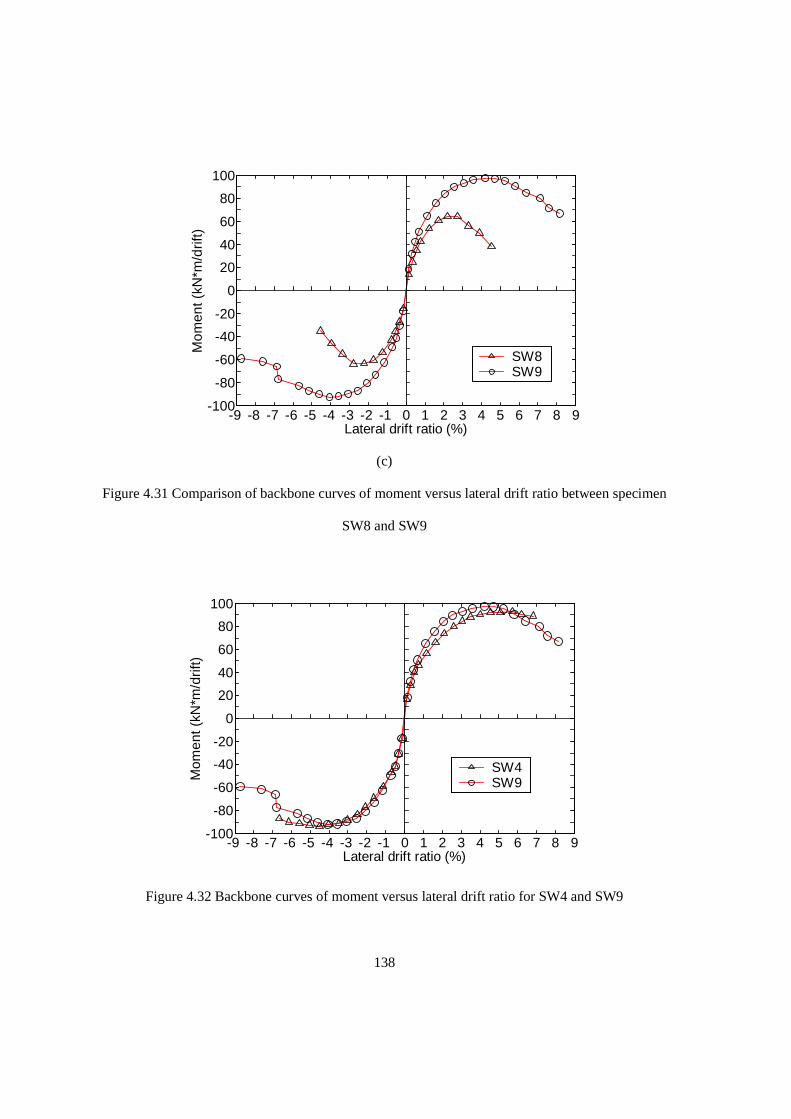
138
-9 -8 -7 -6 -5 -4 -3 -2 -1 0 1 2 3 4 5 6 7 8 9-100
-80
-60
-40
-20
0
20
40
60
80
100
Lateral drift ratio (%)
Mom
ent (
kN*m
/drif
t)
SW8SW9
(c)
Figure 4.31 Comparison of backbone curves of moment versus lateral drift ratio between specimen
SW8 and SW9
-9 -8 -7 -6 -5 -4 -3 -2 -1 0 1 2 3 4 5 6 7 8 9-100
-80
-60
-40
-20
0
20
40
60
80
100
Lateral drift ratio (%)
Mom
ent (
kN*m
/drif
t)
SW4SW9
Figure 4.32 Backbone curves of moment versus lateral drift ratio for SW4 and SW9
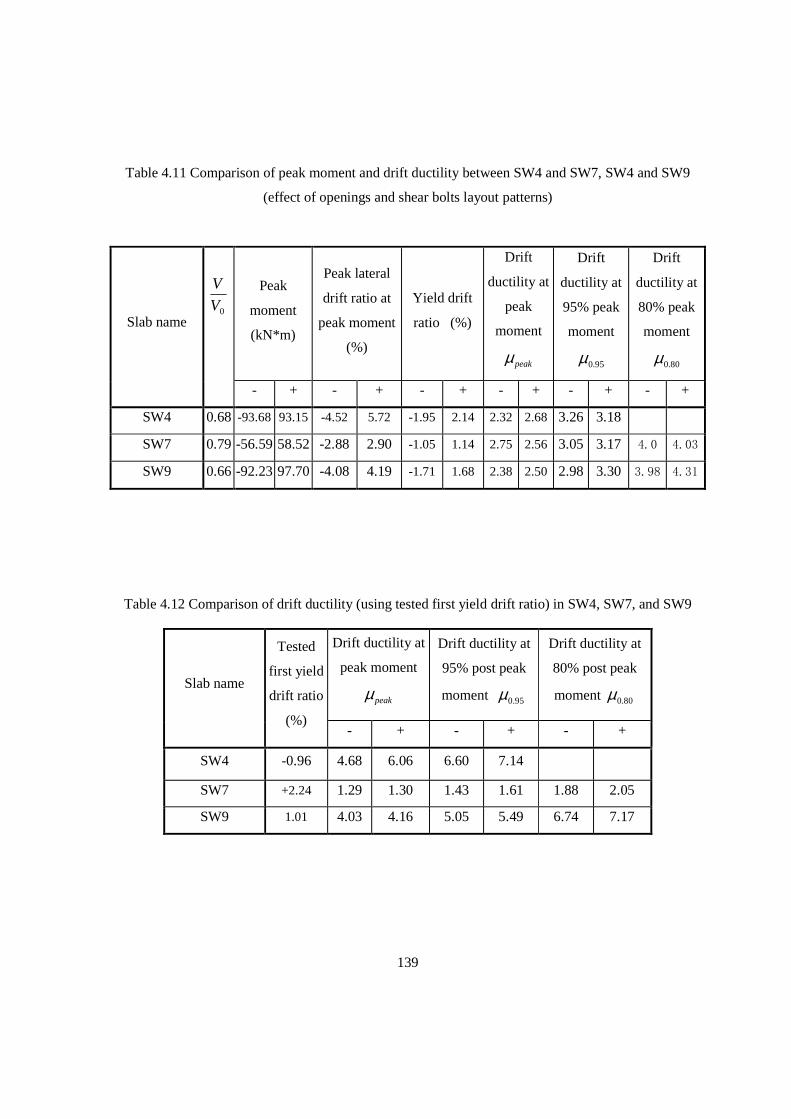
139
Table 4.11 Comparison of peak moment and drift ductility between SW4 and SW7, SW4 and SW9
(effect of openings and shear bolts layout patterns)
Peak
moment
(kN*m)
Peak lateral
drift ratio at
peak moment
(%)
Yield drift
ratio (%)
Drift
ductility at
peak
moment
peakµ
Drift
ductility at
95% peak
moment
95.0µ
Drift
ductility at
80% peak
moment
80.0µ
Slab name
0V
V
- + - + - + - + - + - +
SW4 0.68 -93.68 93.15 -4.52 5.72 -1.95 2.14 2.32 2.68 3.26 3.18
SW7 0.79 -56.59 58.52 -2.88 2.90 -1.05 1.14 2.75 2.56 3.05 3.17 4.0 4.03
SW9 0.66 -92.23 97.70 -4.08 4.19 -1.71 1.68 2.38 2.50 2.98 3.30 3.98 4.31
Table 4.12 Comparison of drift ductility (using tested first yield drift ratio) in SW4, SW7, and SW9
Drift ductility at
peak moment
peakµ
Drift ductility at
95% post peak
moment 95.0µ
Drift ductility at
80% post peak
moment 80.0µ Slab name
Tested
first yield
drift ratio
(%) - + - + - +
SW4 -0.96 4.68 6.06 6.60 7.14
SW7 +2.24 1.29 1.30 1.43 1.61 1.88 2.05
SW9 1.01 4.03 4.16 5.05 5.49 6.74 7.17
140
4.3.4 Effect of Shear Bolt layout Pattern on Connec tion Moment Capacity and Ductility
Shear bolts were installed orthogonally in SW7 and SW4 and in radial pattern in SW8 and SW9.
They are compared as follows:
(1) Specimen SW4 (6-row orthogonal bolts, no openings) and SW9 (6-row radial bolts, no openings)
From Figure 4.32 and Table 4.11, it is found that, compared with SW4, specimen SW9 had a 2%
decrease in negative peak moment and 5% increase in positive peak point, a decrease of 10% and
27% in lateral drifts at peak points, a 3% increase in ductility (Pan and Moehle, 1989) at negative
peak moment and a 6.7% ductility (method I) decrease at positive peak points. The overall behaviour
of both specimens was almost identical. However, comparing ductilities defined by method II (using
tested first yield rebar strain), specimen SW4 (orthogonal bolt pattern) has better ductile behaviour
than specimen SW9 (radial bolt pattern). For example, from Table 4.12, +95.0µ is 7.14 for SW4 and
5.49 for SW9.
(2) Specimen SW7 (6-row orthogonal bolts, two openings) and SW8 (6-row radial bolts, two
openings). From Figure 4.28 and Table 4.13, it is observed that SW8 had an increase of 10% and 12%
in peak moments but 4% and 6% decrease in lateral drifts at peak points, 8% and 13% ductility
(Method I, Pan and Moehle, 1989) decrease at peak points and 20% and 21% ductility (Method I)
decrease at 0.8 peak load (post peak). Comparison of ductilities defined using Method II shows also
specimen SW7 has better ductile behaviour. For example, in Table 4.14, +80.0µ is 2.05 for SW7 but
only 1.32 for SW8 (36% less).
4.3.5 Connection Stiffness
Based on curves of moment versus drift ratio, peak-to-peak stiffness of each cycle was calculated for
every specimen. Figure 4.33 shows the peak-peak stiffness versus lateral drift ratio of SW6, SW7 and
SW8. Figure 4.34 shows the peak-peak stiffness of specimen SW5 and SW9. Stiffness at small drift
cycles (0.5% drift) are displayed in Figure 4.35. In general, the connection stiffness decreased quickly
during the repeated cycles until 0.75% drift ratio. The stiffness decreased after each repeated moment
cycle; in every three successive same drift cycles, the stiffness dropped about 1.5 times more in the
second cycle than it did in the third one. Small cycles also showed a decreasing trend in stiffness.
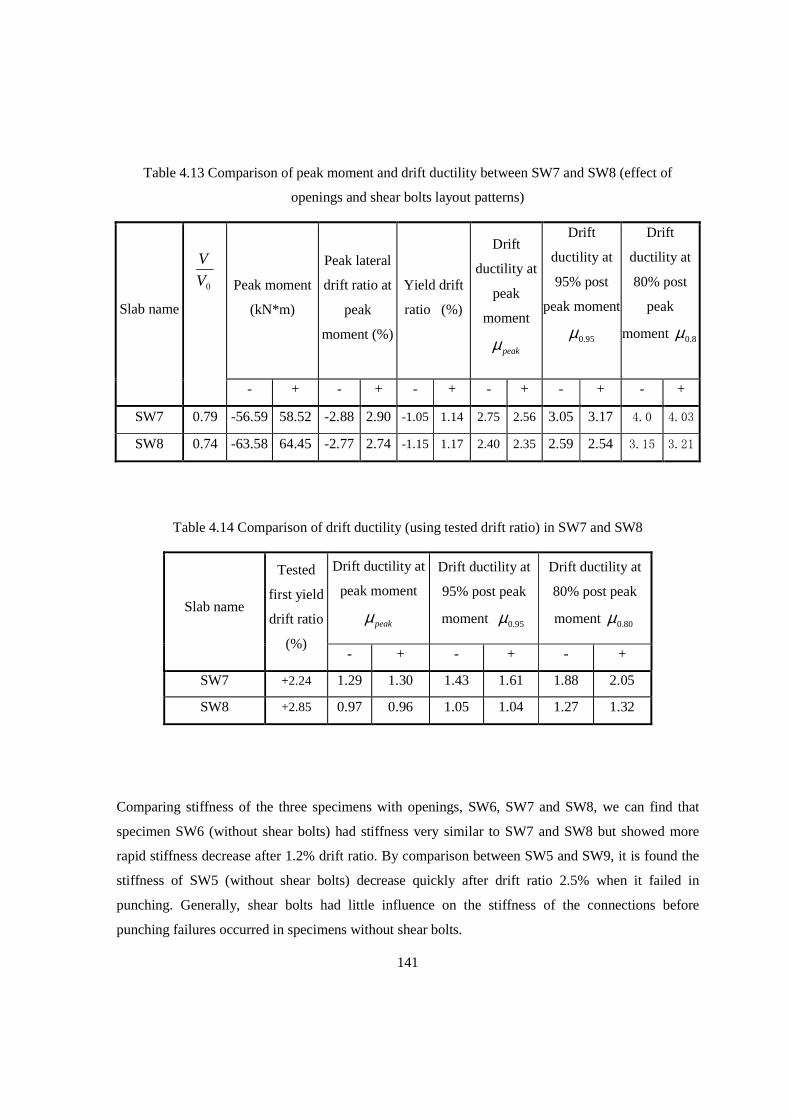
141
Table 4.13 Comparison of peak moment and drift ductility between SW7 and SW8 (effect of
openings and shear bolts layout patterns)
Peak moment
(kN*m)
Peak lateral
drift ratio at
peak
moment (%)
Yield drift
ratio (%)
Drift
ductility at
peak
moment
peakµ
Drift
ductility at
95% post
peak moment
95.0µ
Drift
ductility at
80% post
peak
moment 8.0µ
Slab name
0V
V
- + - + - + - + - + - +
SW7 0.79 -56.59 58.52 -2.88 2.90 -1.05 1.14 2.75 2.56 3.05 3.17 4.0 4.03
SW8 0.74 -63.58 64.45 -2.77 2.74 -1.15 1.17 2.40 2.35 2.59 2.54 3.15 3.21
Table 4.14 Comparison of drift ductility (using tested drift ratio) in SW7 and SW8
Drift ductility at
peak moment
peakµ
Drift ductility at
95% post peak
moment 95.0µ
Drift ductility at
80% post peak
moment 80.0µ Slab name
Tested
first yield
drift ratio
(%) - + - + - +
SW7 +2.24 1.29 1.30 1.43 1.61 1.88 2.05
SW8 +2.85 0.97 0.96 1.05 1.04 1.27 1.32
Comparing stiffness of the three specimens with openings, SW6, SW7 and SW8, we can find that
specimen SW6 (without shear bolts) had stiffness very similar to SW7 and SW8 but showed more
rapid stiffness decrease after 1.2% drift ratio. By comparison between SW5 and SW9, it is found the
stiffness of SW5 (without shear bolts) decrease quickly after drift ratio 2.5% when it failed in
punching. Generally, shear bolts had little influence on the stiffness of the connections before
punching failures occurred in specimens without shear bolts.
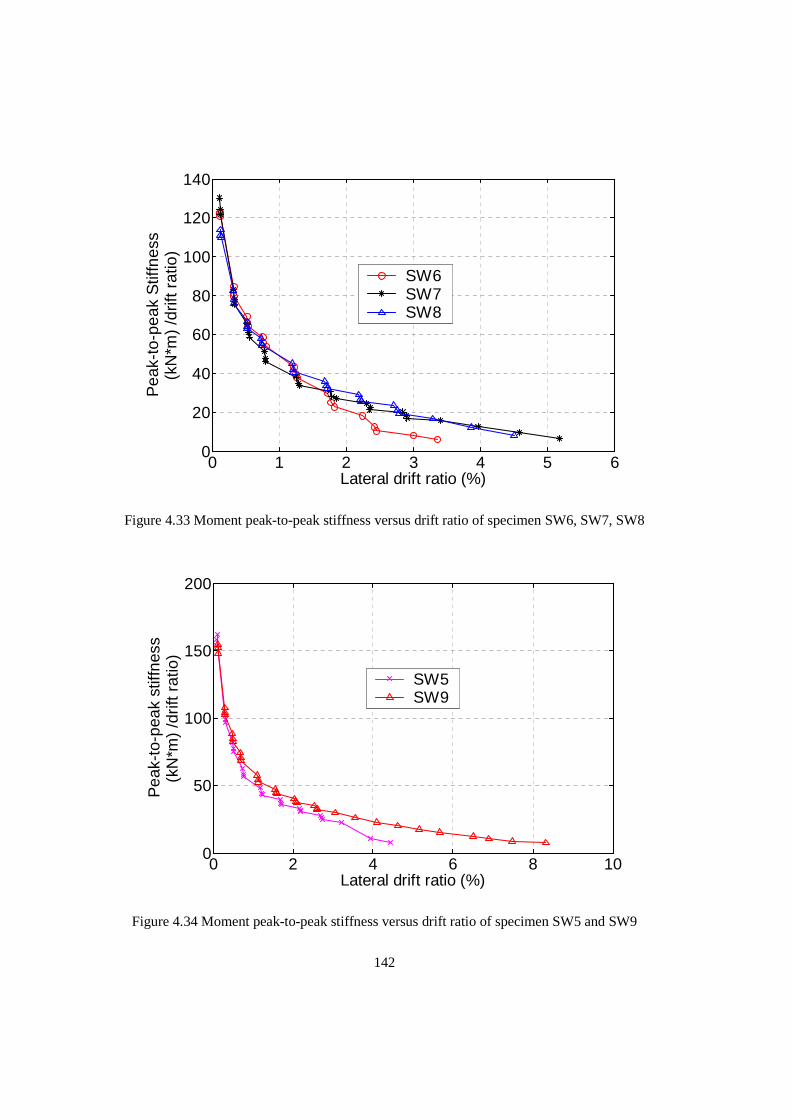
142
0 1 2 3 4 5 60
20
40
60
80
100
120
140
Lateral drift ratio (%)
Pea
k-to
-pea
k S
tiffn
ess
(kN
*m)
/drif
t rat
io)
SW6SW7SW8
Figure 4.33 Moment peak-to-peak stiffness versus drift ratio of specimen SW6, SW7, SW8
0 2 4 6 8 100
50
100
150
200
Lateral drift ratio (%)
Pea
k-to
-pea
k st
iffne
ss(k
N*m
) /d
rift r
atio
)
SW5SW9
Figure 4.34 Moment peak-to-peak stiffness versus drift ratio of specimen SW5 and SW9
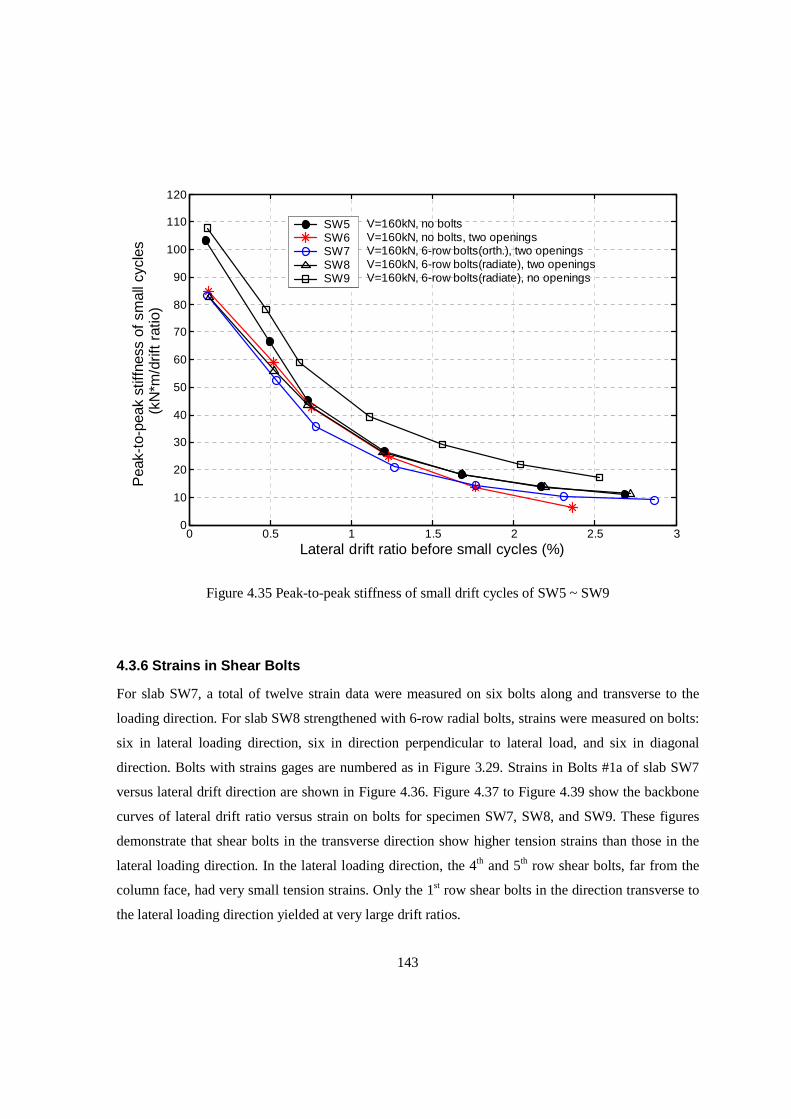
143
0 0.5 1 1.5 2 2.5 30
10
20
30
40
50
60
70
80
90
100
110
120
Lateral drift ratio before small cycles (%)
Pea
k-to
-pea
k st
iffne
ss o
f sm
all c
ycle
s (k
N*m
/drif
t ra
tio)
V=160kN, no boltsV=160kN, no bolts, two openingsV=160kN, 6-row bolts(orth.), two openingsV=160kN, 6-row bolts(radiate), two openingsV=160kN, 6-row bolts(radiate), no openings
SW5SW6SW7SW8SW9
Figure 4.35 Peak-to-peak stiffness of small drift cycles of SW5 ~ SW9
4.3.6 Strains in Shear Bolts
For slab SW7, a total of twelve strain data were measured on six bolts along and transverse to the
loading direction. For slab SW8 strengthened with 6-row radial bolts, strains were measured on bolts:
six in lateral loading direction, six in direction perpendicular to lateral load, and six in diagonal
direction. Bolts with strains gages are numbered as in Figure 3.29. Strains in Bolts #1a of slab SW7
versus lateral drift direction are shown in Figure 4.36. Figure 4.37 to Figure 4.39 show the backbone
curves of lateral drift ratio versus strain on bolts for specimen SW7, SW8, and SW9. These figures
demonstrate that shear bolts in the transverse direction show higher tension strains than those in the
lateral loading direction. In the lateral loading direction, the 4th and 5th row shear bolts, far from the
column face, had very small tension strains. Only the 1st row shear bolts in the direction transverse to
the lateral loading direction yielded at very large drift ratios.
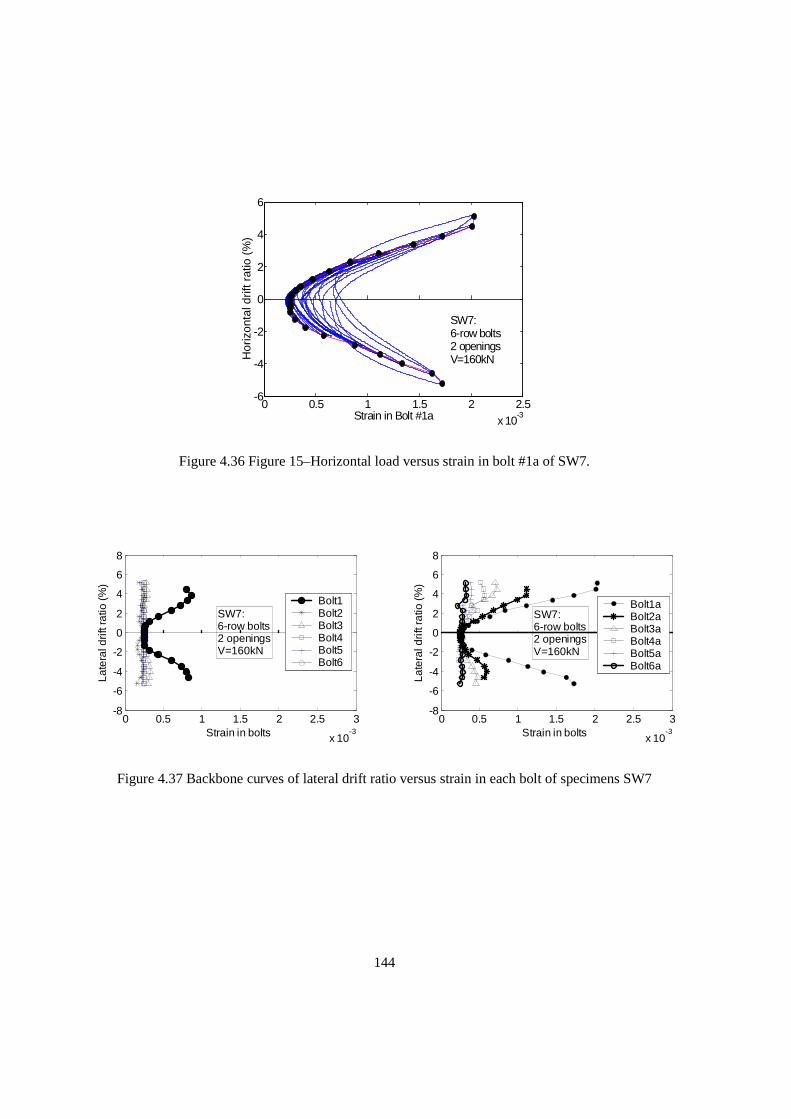
144
0 0.5 1 1.5 2 2.5x 10
-3
-6
-4
-2
0
2
4
6
SW7:6-row bolts2 openingsV=160kN
Strain in Bolt #1a
Hor
izon
tal d
rift r
atio
(%
)
Figure 4.36 Figure 15–Horizontal load versus strain in bolt #1a of SW7.
0 0.5 1 1.5 2 2.5 3
x 10-3
-8
-6
-4
-2
0
2
4
6
8
Strain in bolts
Late
ral d
rift r
atio
(%)
SW7:6-row bolts2 openingsV=160kN
0 0.5 1 1.5 2 2.5 3
x 10-3
-8
-6
-4
-2
0
2
4
6
8
Strain in bolts
Late
ral d
rift r
atio
(%)
SW7:6-row bolts2 openingsV=160kN
Bolt1Bolt2Bolt3Bolt4Bolt5Bolt6
Bolt1aBolt2aBolt3aBolt4aBolt5aBolt6a
Figure 4.37 Backbone curves of lateral drift ratio versus strain in each bolt of specimens SW7
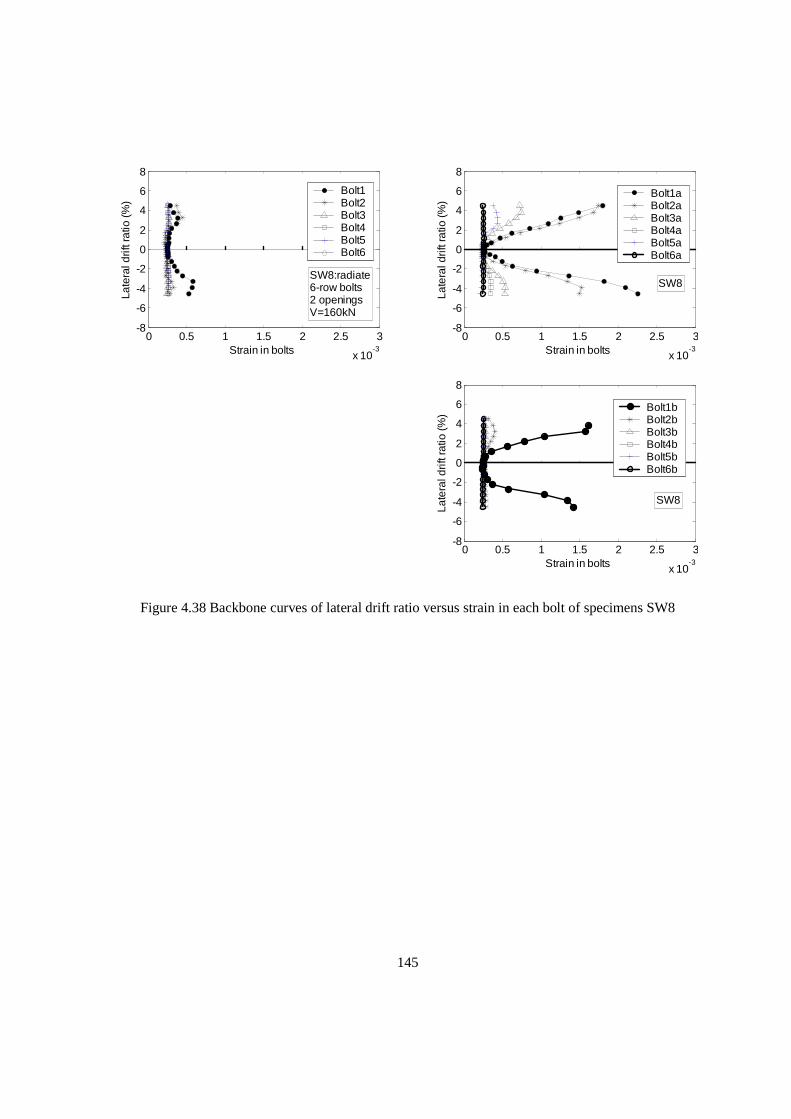
145
0 0.5 1 1.5 2 2.5 3
x 10-3
-8
-6
-4
-2
0
2
4
6
8
Strain in bolts
Late
ral d
rift r
atio
(%)
SW8:radiate6-row bolts2 openingsV=160kN
0 0.5 1 1.5 2 2.5 3
x 10-3
-8
-6
-4
-2
0
2
4
6
8
Strain in bolts
Late
ral d
rift r
atio
(%)
SW8
0 0.5 1 1.5 2 2.5 3
x 10-3
-8
-6
-4
-2
0
2
4
6
8
Strain in bolts
Late
ral d
rift r
atio
(%)
SW8
Bolt1Bolt2Bolt3Bolt4Bolt5Bolt6
Bolt1aBolt2aBolt3aBolt4aBolt5aBolt6a
Bolt1bBolt2bBolt3bBolt4bBolt5bBolt6b
Figure 4.38 Backbone curves of lateral drift ratio versus strain in each bolt of specimens SW8
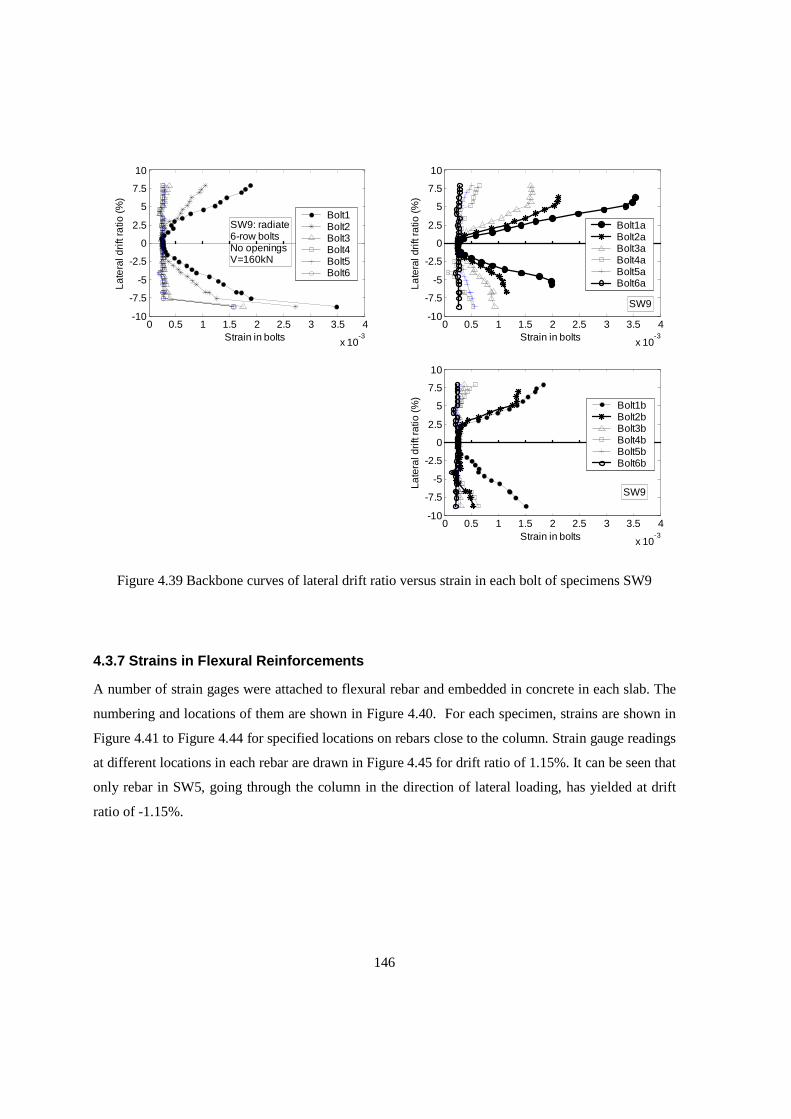
146
0 0.5 1 1.5 2 2.5 3 3.5 4
x 10-3
-10
-7.5
-5
-2.5
0
2.5
5
7.5
10
Strain in bolts
Late
ral d
rift r
atio
(%)
SW9: radiate6-row boltsNo openingsV=160kN
0 0.5 1 1.5 2 2.5 3 3.5 4
x 10-3
-10
-7.5
-5
-2.5
0
2.5
5
7.5
10
Strain in bolts
Late
ral d
rift r
atio
(%)
SW9
0 0.5 1 1.5 2 2.5 3 3.5 4
x 10-3
-10
-7.5
-5
-2.5
0
2.5
5
7.5
10
Strain in bolts
Late
ral d
rift r
atio
(%)
SW9
Bolt1aBolt2aBolt3aBolt4aBolt5aBolt6a
Bolt1Bolt2Bolt3Bolt4Bolt5Bolt6
Bolt1bBolt2bBolt3bBolt4bBolt5bBolt6b
Figure 4.39 Backbone curves of lateral drift ratio versus strain in each bolt of specimens SW9
4.3.7 Strains in Flexural Reinforcements
A number of strain gages were attached to flexural rebar and embedded in concrete in each slab. The
numbering and locations of them are shown in Figure 4.40. For each specimen, strains are shown in
Figure 4.41 to Figure 4.44 for specified locations on rebars close to the column. Strain gauge readings
at different locations in each rebar are drawn in Figure 4.45 for drift ratio of 1.15%. It can be seen that
only rebar in SW5, going through the column in the direction of lateral loading, has yielded at drift
ratio of -1.15%.
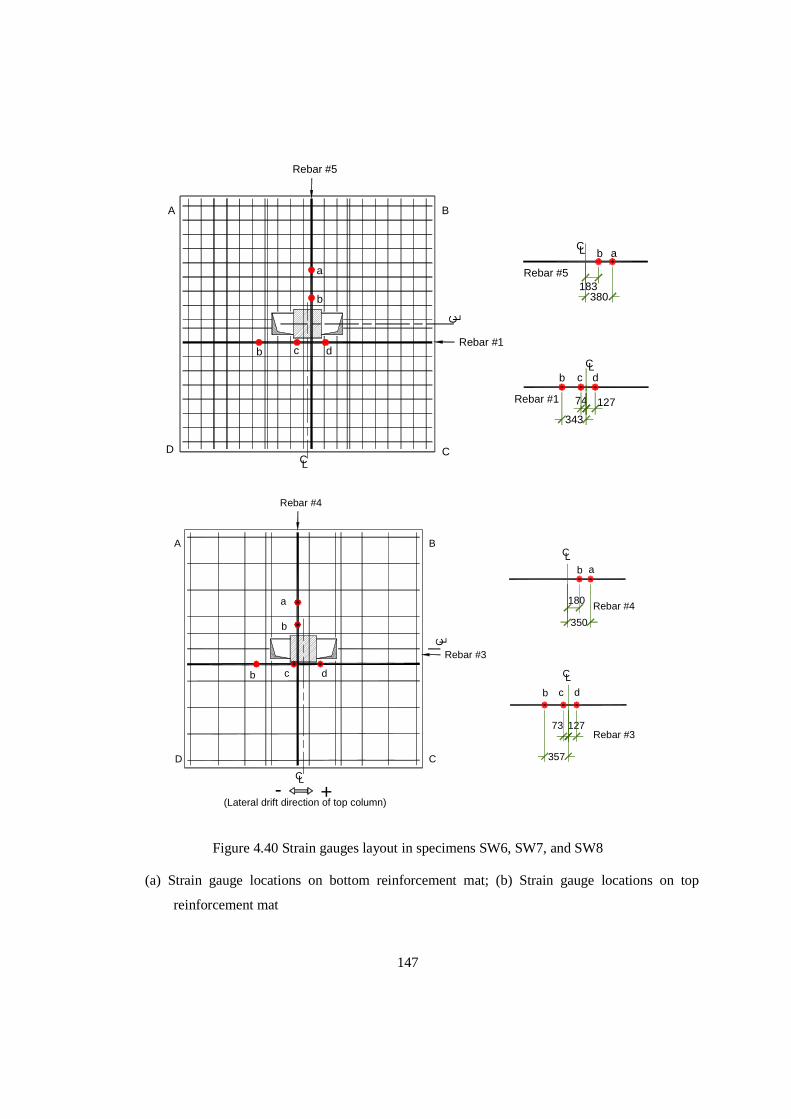
147
A B
CCL
Rebar #1
C L
Rebar #5
D
Rebar #5
Rebar #1
ab
LC
CL
b c d
380183
12774
343
b c d
b
a
b c d
a
b
D
A B
C
LC
Rebar #3
Rebar #4
LC
-(Lateral drift direction of top column)
+
Rebar #3
CL
b c d
Rebar #4
abLC
180
350
12773
357
Figure 4.40 Strain gauges layout in specimens SW6, SW7, and SW8
(a) Strain gauge locations on bottom reinforcement mat; (b) Strain gauge locations on top
reinforcement mat
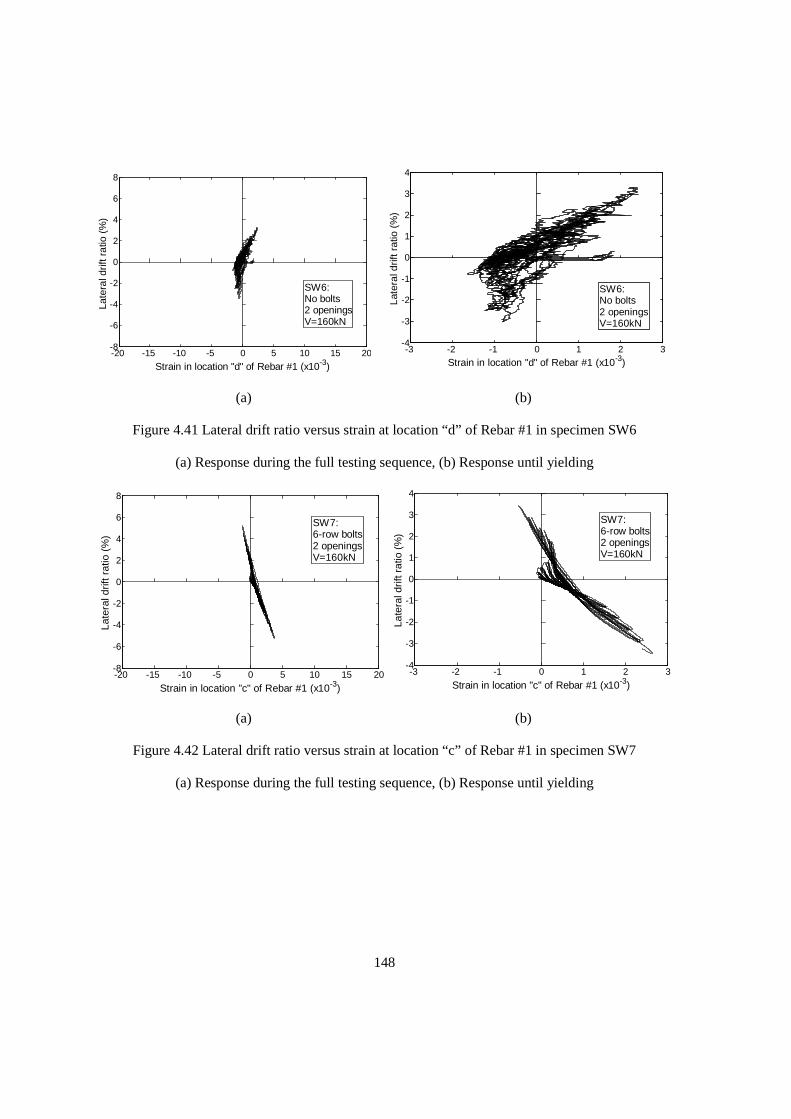
148
-20 -15 -10 -5 0 5 10 15 20-8
-6
-4
-2
0
2
4
6
8
SW6:No bolts2 openingsV=160kN
Strain in location "d" of Rebar #1 (x10-3)
Late
ral d
rift r
atio
(%
)
-3 -2 -1 0 1 2 3-4
-3
-2
-1
0
1
2
3
4
SW6:No bolts2 openingsV=160kN
Strain in location "d" of Rebar #1 (x10-3)
Late
ral d
rift r
atio
(%
)
(a) (b)
Figure 4.41 Lateral drift ratio versus strain at location “d” of Rebar #1 in specimen SW6
(a) Response during the full testing sequence, (b) Response until yielding
-20 -15 -10 -5 0 5 10 15 20-8
-6
-4
-2
0
2
4
6
8
SW7:6-row bolts2 openingsV=160kN
Strain in location "c" of Rebar #1 (x10-3)
Late
ral d
rift r
atio
(%
)
-3 -2 -1 0 1 2 3
-4
-3
-2
-1
0
1
2
3
4
SW7:6-row bolts2 openingsV=160kN
Strain in location "c" of Rebar #1 (x10-3)
Late
ral d
rift r
atio
(%
)
(a) (b)
Figure 4.42 Lateral drift ratio versus strain at location “c” of Rebar #1 in specimen SW7
(a) Response during the full testing sequence, (b) Response until yielding
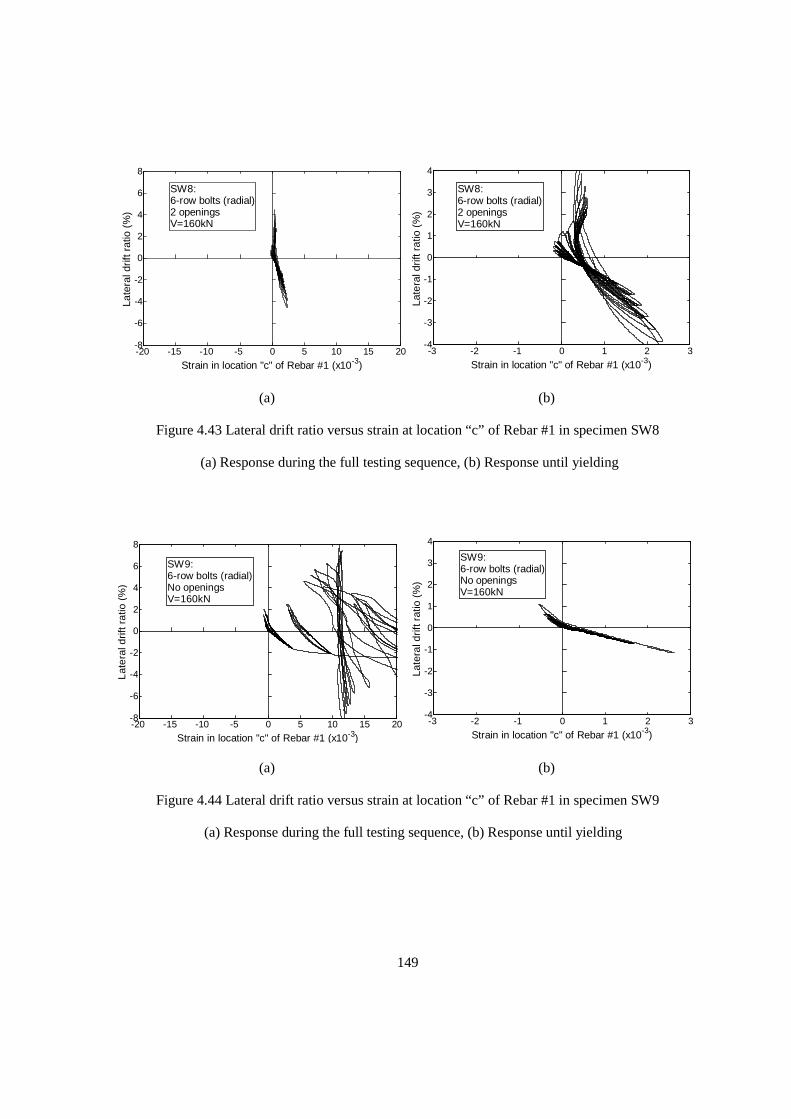
149
-20 -15 -10 -5 0 5 10 15 20-8
-6
-4
-2
0
2
4
6
8
SW8:6-row bolts (radial)2 openingsV=160kN
Strain in location "c" of Rebar #1 (x10-3)
Late
ral d
rift r
atio
(%
)
-3 -2 -1 0 1 2 3-4
-3
-2
-1
0
1
2
3
4
SW8:6-row bolts (radial)2 openingsV=160kN
Strain in location "c" of Rebar #1 (x10-3)
Late
ral d
rift r
atio
(%
)
(a) (b)
Figure 4.43 Lateral drift ratio versus strain at location “c” of Rebar #1 in specimen SW8
(a) Response during the full testing sequence, (b) Response until yielding
-20 -15 -10 -5 0 5 10 15 20-8
-6
-4
-2
0
2
4
6
8
SW9:6-row bolts (radial)No openingsV=160kN
Strain in location "c" of Rebar #1 (x10-3)
Lat
eral
drif
t rat
io (
%)
-3 -2 -1 0 1 2 3-4
-3
-2
-1
0
1
2
3
4
SW9:6-row bolts (radial)No openingsV=160kN
Strain in location "c" of Rebar #1 (x10-3)
Late
ral d
rift r
atio
(%
)
(a) (b)
Figure 4.44 Lateral drift ratio versus strain at location “c” of Rebar #1 in specimen SW9
(a) Response during the full testing sequence, (b) Response until yielding
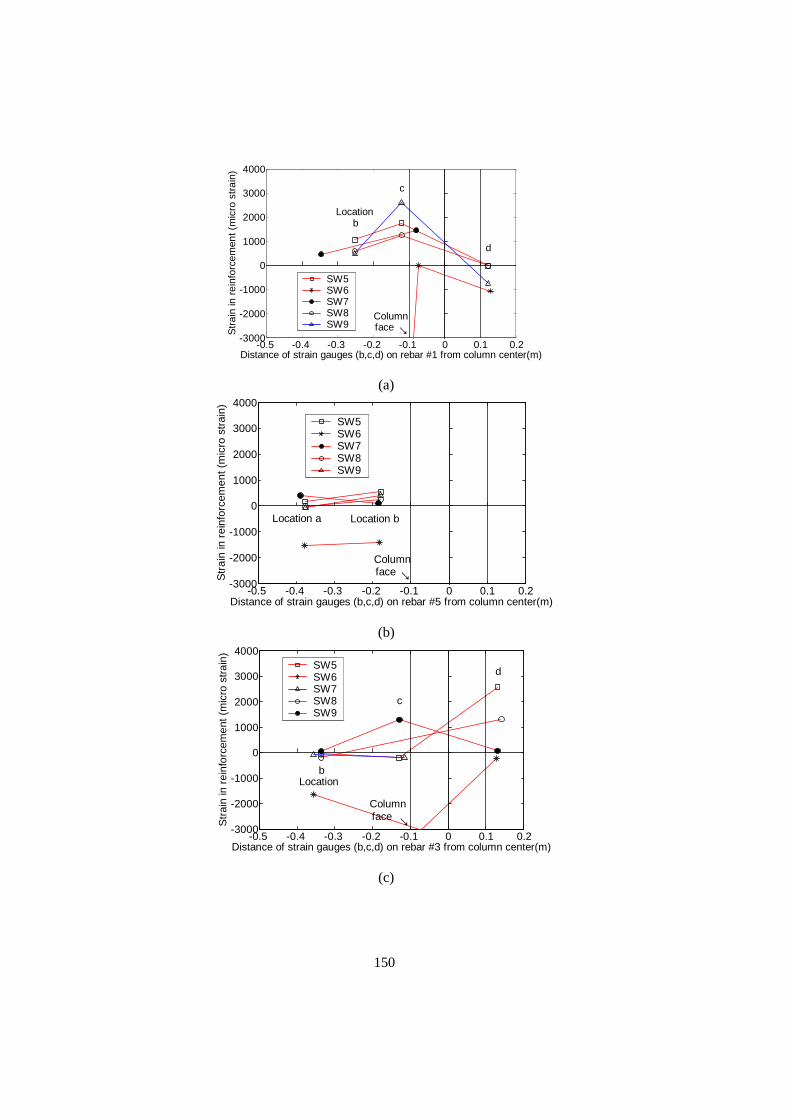
150
-0.5 -0.4 -0.3 -0.2 -0.1 0 0.1 0.2-3000
-2000
-1000
0
1000
2000
3000
4000
Distance of strain gauges (b,c,d) on rebar #1 from column center(m)
Str
ain
in r
einf
orce
men
t (m
icro
str
ain)
Location b
c
d
Columnface ←
SW5SW6SW7SW8SW9
(a)
-0.5 -0.4 -0.3 -0.2 -0.1 0 0.1 0.2-3000
-2000
-1000
0
1000
2000
3000
4000
Distance of strain gauges (b,c,d) on rebar #5 from column center(m)
Str
ain
in r
einf
orce
men
t (m
icro
str
ain)
Location a Location b
Columnface ←
SW5SW6SW7SW8SW9
(b)
-0.5 -0.4 -0.3 -0.2 -0.1 0 0.1 0.2-3000
-2000
-1000
0
1000
2000
3000
4000
Distance of strain gauges (b,c,d) on rebar #3 from column center(m)
Str
ain
in r
einf
orce
men
t (m
icro
str
ain)
Locationb
c
d
Columnface ←
SW5SW6SW7SW8SW9
(c)
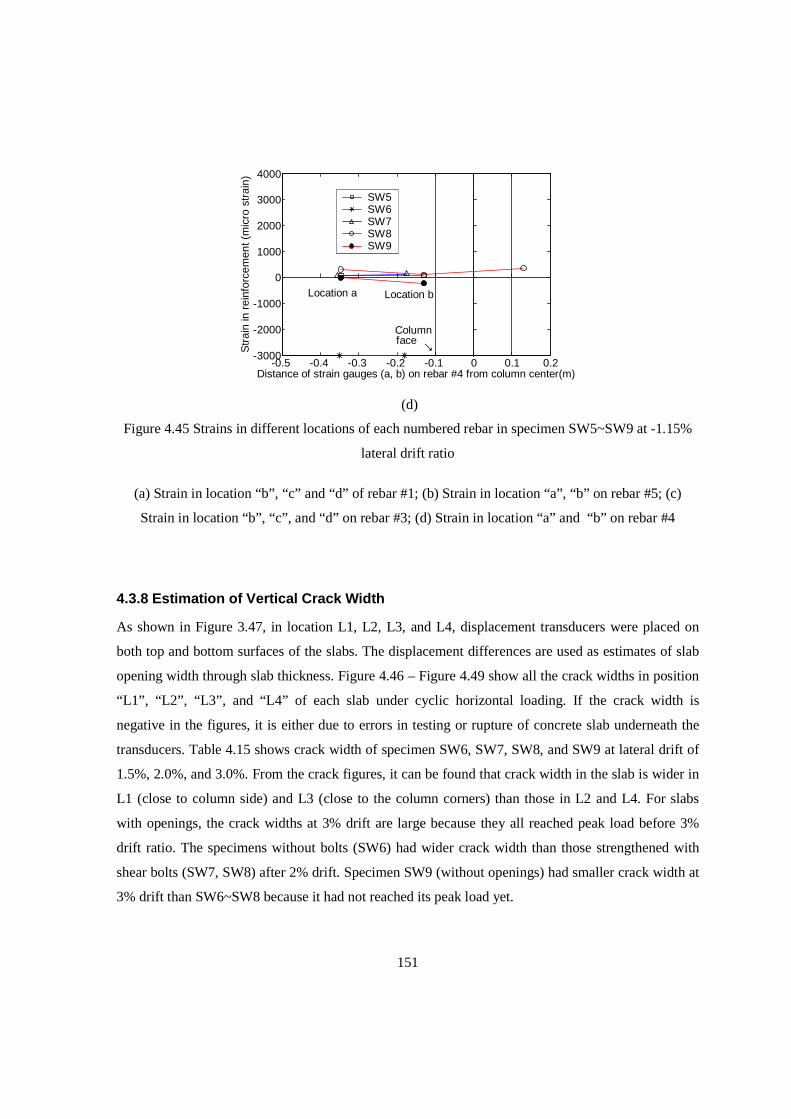
151
-0.5 -0.4 -0.3 -0.2 -0.1 0 0.1 0.2-3000
-2000
-1000
0
1000
2000
3000
4000
Distance of strain gauges (a, b) on rebar #4 from column center(m)
Str
ain
in r
einf
orce
men
t (m
icro
str
ain)
Location a Location b
Columnface ←
SW5SW6SW7SW8SW9
(d)
Figure 4.45 Strains in different locations of each numbered rebar in specimen SW5~SW9 at -1.15%
lateral drift ratio
(a) Strain in location “b”, “c” and “d” of rebar #1; (b) Strain in location “a”, “b” on rebar #5; (c)
Strain in location “b”, “c”, and “d” on rebar #3; (d) Strain in location “a” and “b” on rebar #4
4.3.8 Estimation of Vertical Crack Width
As shown in Figure 3.47, in location L1, L2, L3, and L4, displacement transducers were placed on
both top and bottom surfaces of the slabs. The displacement differences are used as estimates of slab
opening width through slab thickness. Figure 4.46 – Figure 4.49 show all the crack widths in position
“L1”, “L2”, “L3”, and “L4” of each slab under cyclic horizontal loading. If the crack width is
negative in the figures, it is either due to errors in testing or rupture of concrete slab underneath the
transducers. Table 4.15 shows crack width of specimen SW6, SW7, SW8, and SW9 at lateral drift of
1.5%, 2.0%, and 3.0%. From the crack figures, it can be found that crack width in the slab is wider in
L1 (close to column side) and L3 (close to the column corners) than those in L2 and L4. For slabs
with openings, the crack widths at 3% drift are large because they all reached peak load before 3%
drift ratio. The specimens without bolts (SW6) had wider crack width than those strengthened with
shear bolts (SW7, SW8) after 2% drift. Specimen SW9 (without openings) had smaller crack width at
3% drift than SW6~SW8 because it had not reached its peak load yet.
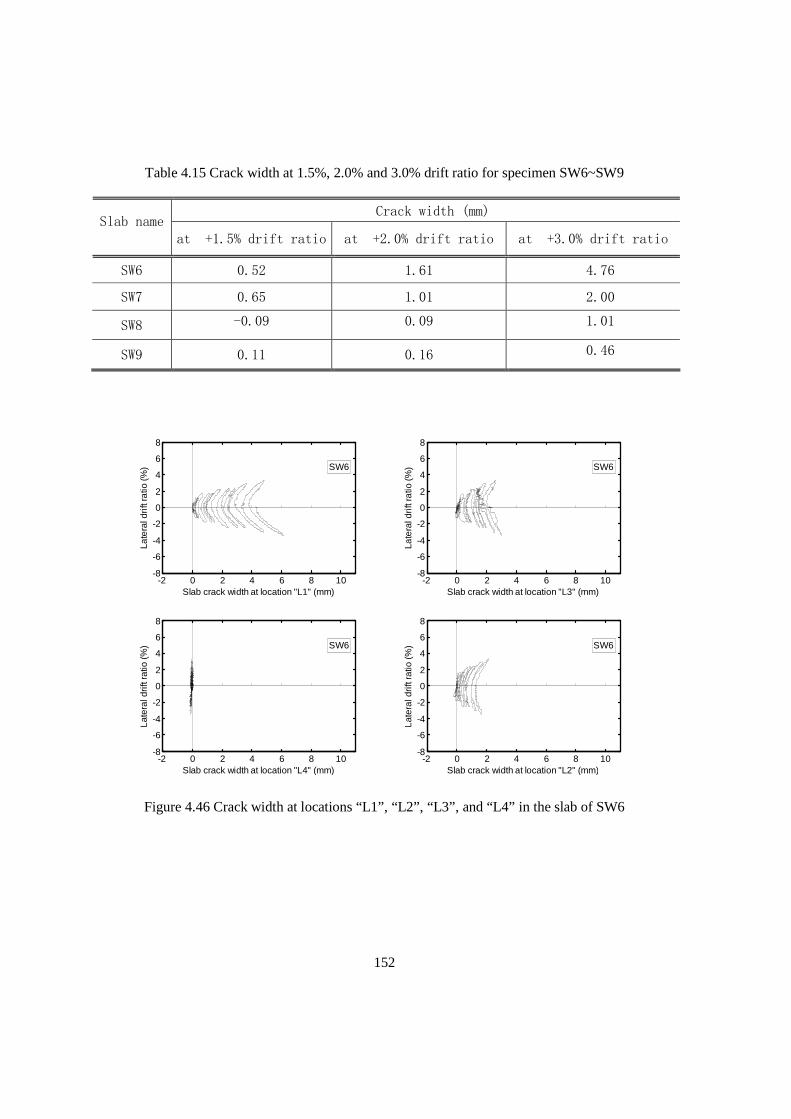
152
Table 4.15 Crack width at 1.5%, 2.0% and 3.0% drift ratio for specimen SW6~SW9
Crack width (mm) Slab name
at +1.5% drift ratio at +2.0% drift ratio at +3.0% drift ratio
SW6 0.52 1.61 4.76
SW7 0.65 1.01 2.00
SW8 -0.09 0.09 1.01
SW9 0.11 0.16 0.46
-2 0 2 4 6 8 10-8
-6
-4
-2
0
2
4
6
8
Slab crack width at location "L1" (mm)
Late
ral d
rift r
atio
(%) SW6
-2 0 2 4 6 8 10-8
-6
-4
-2
0
2
4
6
8
Slab crack width at location "L3" (mm)
Late
ral d
rift r
atio
(%) SW6
-2 0 2 4 6 8 10-8
-6
-4
-2
0
2
4
6
8
Slab crack width at location "L4" (mm)
Late
ral d
rift r
atio
(%) SW6
-2 0 2 4 6 8 10-8
-6
-4
-2
0
2
4
6
8
Slab crack width at location "L2" (mm)
Late
ral d
rift r
atio
(%) SW6
Figure 4.46 Crack width at locations “L1”, “L2”, “L3”, and “L4” in the slab of SW6
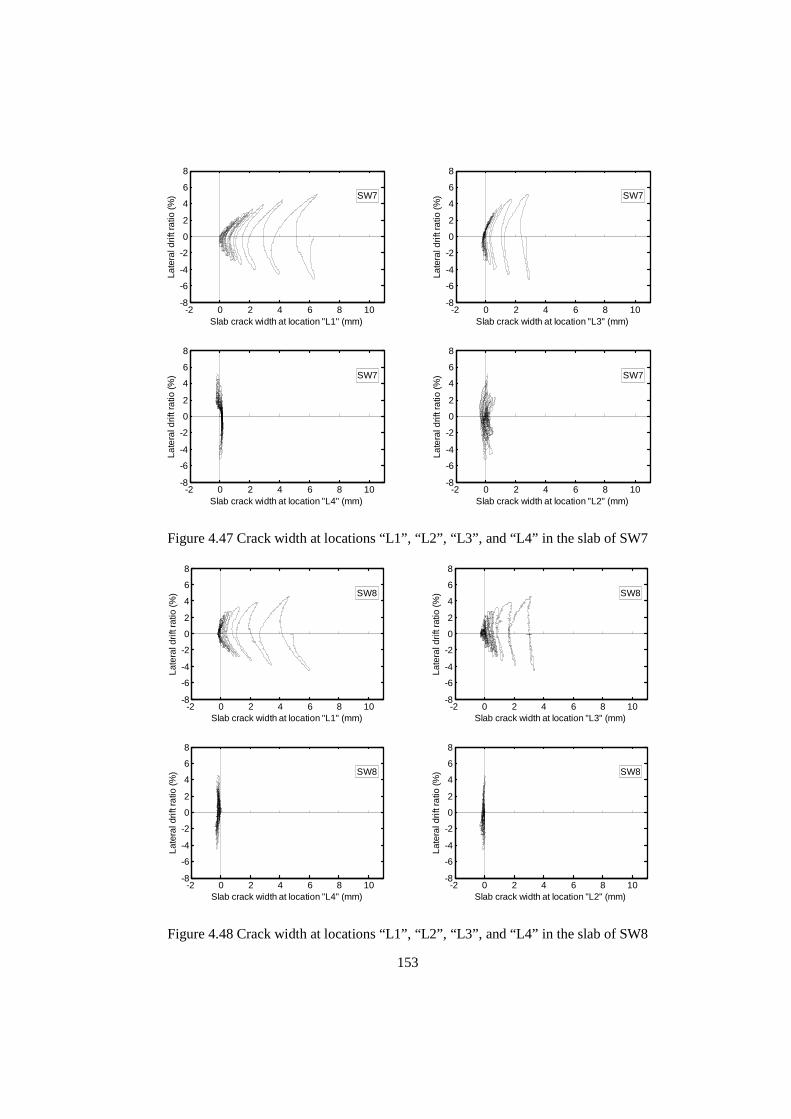
153
-2 0 2 4 6 8 10-8
-6
-4
-2
0
2
4
6
8
Slab crack width at location "L1" (mm)
Late
ral d
rift r
atio
(%) SW7
-2 0 2 4 6 8 10-8
-6
-4
-2
0
2
4
6
8
Slab crack width at location "L3" (mm)
Late
ral d
rift r
atio
(%) SW7
-2 0 2 4 6 8 10-8
-6
-4
-2
0
2
4
6
8
Slab crack width at location "L4" (mm)
Late
ral d
rift r
atio
(%) SW7
-2 0 2 4 6 8 10-8
-6
-4
-2
0
2
4
6
8
Slab crack width at location "L2" (mm)
Late
ral d
rift r
atio
(%) SW7
Figure 4.47 Crack width at locations “L1”, “L2”, “L3”, and “L4” in the slab of SW7
-2 0 2 4 6 8 10-8
-6
-4
-2
0
2
4
6
8
Slab crack width at location "L1" (mm)
Late
ral d
rift r
atio
(%) SW8
-2 0 2 4 6 8 10-8
-6
-4
-2
0
2
4
6
8
Slab crack width at location "L3" (mm)
Late
ral d
rift r
atio
(%) SW8
-2 0 2 4 6 8 10-8
-6
-4
-2
0
2
4
6
8
Slab crack width at location "L4" (mm)
Late
ral d
rift r
atio
(%) SW8
-2 0 2 4 6 8 10-8
-6
-4
-2
0
2
4
6
8
Slab crack width at location "L2" (mm)
Late
ral d
rift r
atio
(%) SW8
Figure 4.48 Crack width at locations “L1”, “L2”, “L3”, and “L4” in the slab of SW8
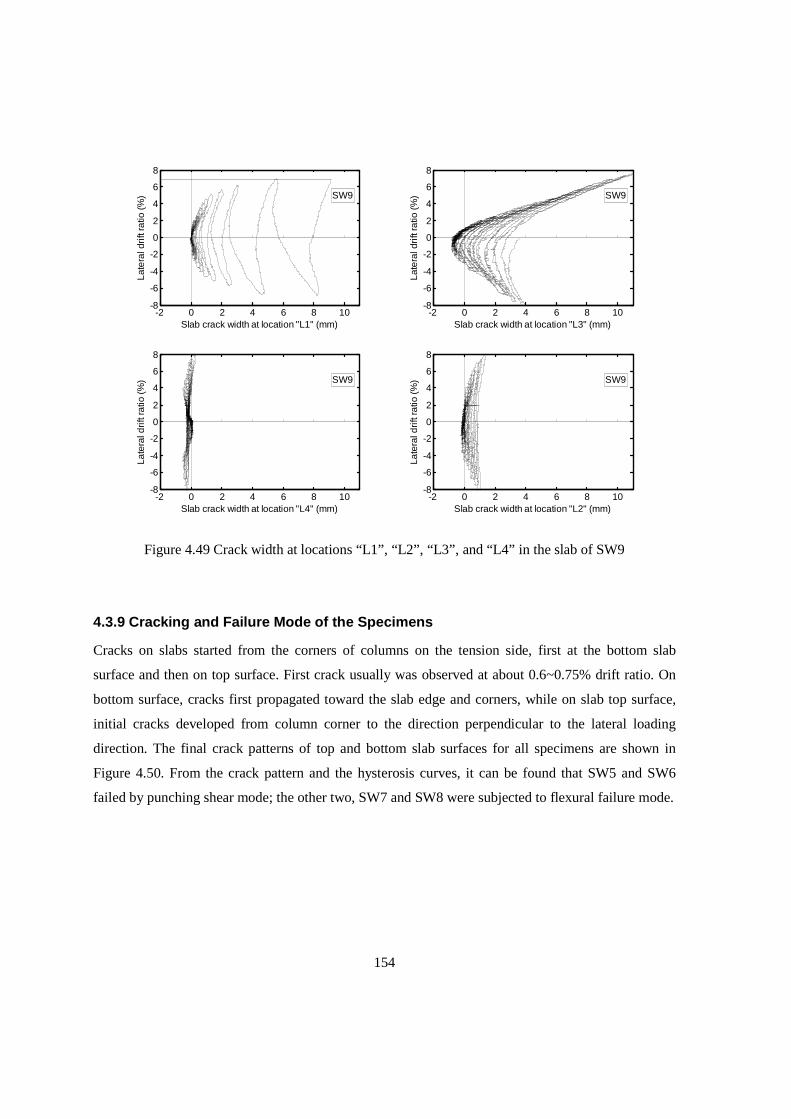
154
-2 0 2 4 6 8 10-8
-6
-4
-2
0
2
4
6
8
Slab crack width at location "L1" (mm)
Late
ral d
rift r
atio
(%) SW9
-2 0 2 4 6 8 10-8
-6
-4
-2
0
2
4
6
8
Slab crack width at location "L3" (mm)
Late
ral d
rift r
atio
(%) SW9
-2 0 2 4 6 8 10-8
-6
-4
-2
0
2
4
6
8
Slab crack width at location "L4" (mm)
Late
ral d
rift r
atio
(%) SW9
-2 0 2 4 6 8 10-8
-6
-4
-2
0
2
4
6
8
Slab crack width at location "L2" (mm)
Late
ral d
rift r
atio
(%) SW9
Figure 4.49 Crack width at locations “L1”, “L2”, “L3”, and “L4” in the slab of SW9
4.3.9 Cracking and Failure Mode of the Specimens
Cracks on slabs started from the corners of columns on the tension side, first at the bottom slab
surface and then on top surface. First crack usually was observed at about 0.6~0.75% drift ratio. On
bottom surface, cracks first propagated toward the slab edge and corners, while on slab top surface,
initial cracks developed from column corner to the direction perpendicular to the lateral loading
direction. The final crack patterns of top and bottom slab surfaces for all specimens are shown in
Figure 4.50. From the crack pattern and the hysterosis curves, it can be found that SW5 and SW6
failed by punching shear mode; the other two, SW7 and SW8 were subjected to flexural failure mode.
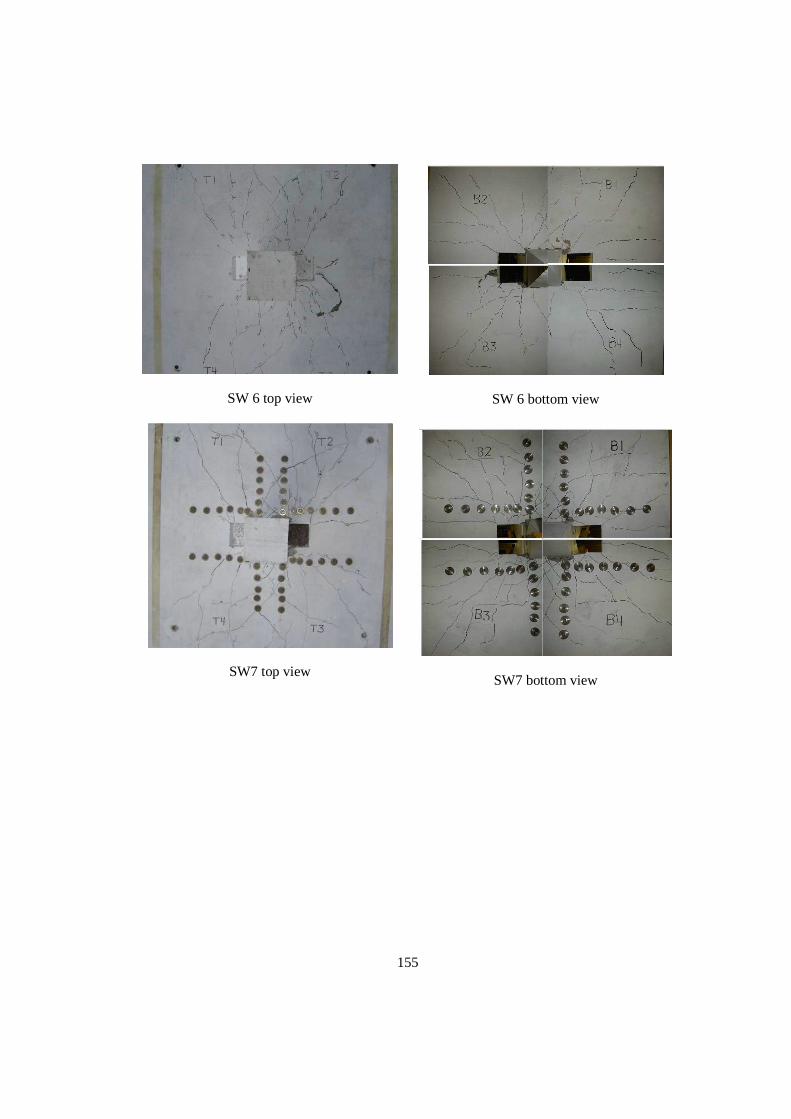
155
SW 6 top view
SW 6 bottom view
SW7 top view
SW7 bottom view
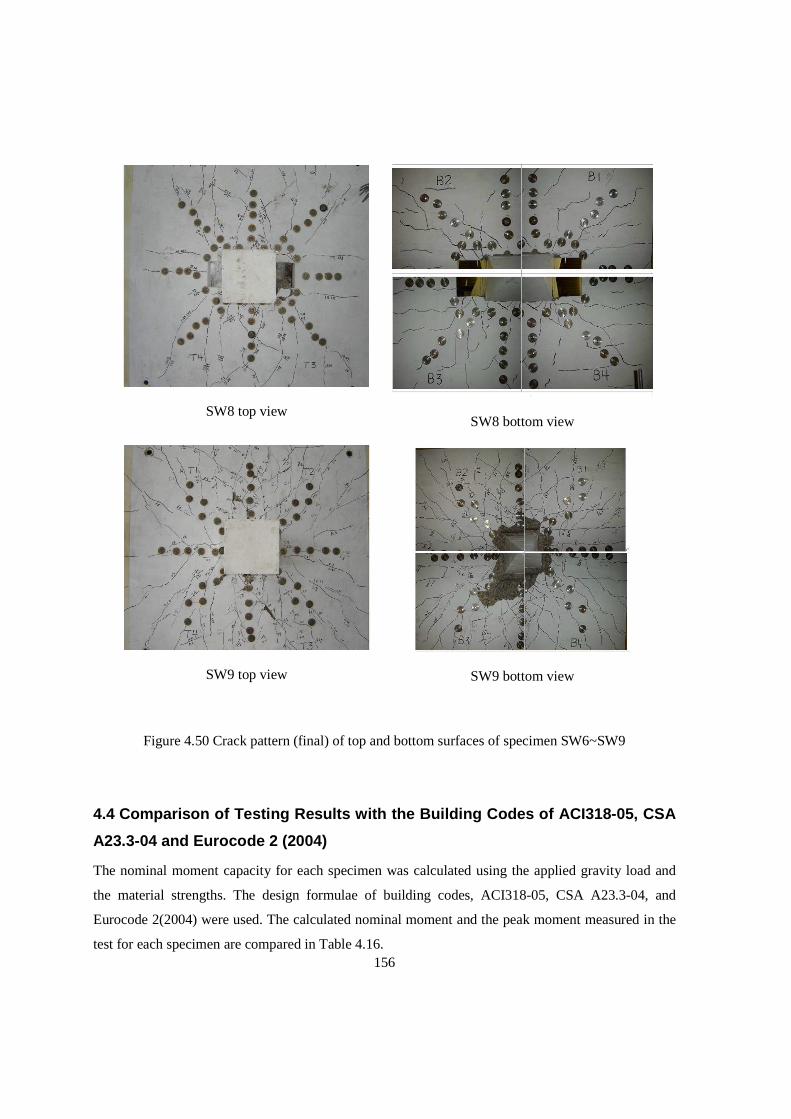
156
SW8 top view
SW8 bottom view
SW9 top view
SW9 bottom view
Figure 4.50 Crack pattern (final) of top and bottom surfaces of specimen SW6~SW9
4.4 Comparison of Testing Results with the Building Codes of ACI318-05, CSA
A23.3-04 and Eurocode 2 (2004)
The nominal moment capacity for each specimen was calculated using the applied gravity load and
the material strengths. The design formulae of building codes, ACI318-05, CSA A23.3-04, and
Eurocode 2(2004) were used. The calculated nominal moment and the peak moment measured in the
test for each specimen are compared in Table 4.16.
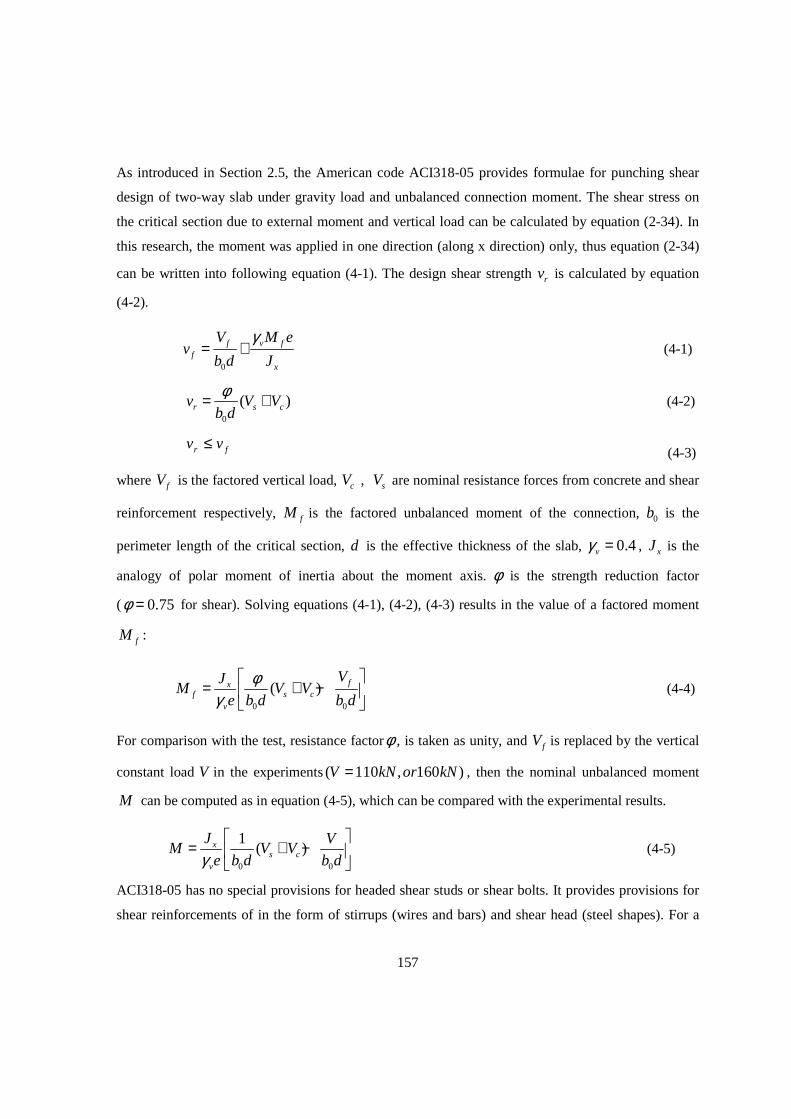
157
As introduced in Section 2.5, the American code ACI318-05 provides formulae for punching shear
design of two-way slab under gravity load and unbalanced connection moment. The shear stress on
the critical section due to external moment and vertical load can be calculated by equation (2-34). In
this research, the moment was applied in one direction (along x direction) only, thus equation (2-34)
can be written into following equation (4-1). The design shear strength rv is calculated by equation
(4-2).
0
f v ff
x
V M ev
b d J
γ= + (4-1)
0
( )r s cv V Vb d
φ= + (4-2)
fr vv ≤ (4-3)
where fV is the factored vertical load, cV , sV are nominal resistance forces from concrete and shear
reinforcement respectively, fM is the factored unbalanced moment of the connection, 0b is the
perimeter length of the critical section, d is the effective thickness of the slab, 0.4vγ = , xJ is the
analogy of polar moment of inertia about the moment axis. φ is the strength reduction factor
( 0.75φ = for shear). Solving equations (4-1), (4-2), (4-3) results in the value of a factored moment
fM :
0 0
( ) fxf s c
v
VJM V V
e b d b d
φγ
= + −
(4-4)
For comparison with the test, resistance factorφ , is taken as unity, and fV is replaced by the vertical
constant load V in the experiments( 110 , 160 )V kN or kN= , then the nominal unbalanced moment
M can be computed as in equation (4-5), which can be compared with the experimental results.
0 0
1( )x
s cv
J VM V V
e b d b dγ
= + −
(4-5)
ACI318-05 has no special provisions for headed shear studs or shear bolts. It provides provisions for
shear reinforcements of in the form of stirrups (wires and bars) and shear head (steel shapes). For a
158
slab with stirrups (wires and bars), the nominal shear resistance force cV from concrete is
'00.17c cV b d f= (metric), and shear resistance sV from the shear reinforcements is vs yv
s
A f dV
s= ,
where vsA is the section area of all shear reinforcements around one peripherial section, yvf is the
yield strength of the shear reinforcement (taken as MPa), s is the radial spacing of shear
reinforcements. The sum of shear force from both concrete and shear reinforcements( )s cV V+ must
be no more than '00.5 cb d f . Since there are openings in SW6, SW7 and SW8, the sectional area of
critical section is reduced due to the openings.
Canadian code CSA A23.3-04 adopts similar equations to those of ACI318-5 for punching shear
design. It has equivalent provisions for slabs with stirrups: nominal shear force cV from concrete is
'00.19c cV b d f= and nominal shear resistance sV from the stirrups is vs yv
s
A f dV
s= ; the total of
these two nominal forces must be no more than '00.55 cb d f . The difference in the factors in ACI
and CSA codes comes from the difference in the safety factors in the two codes.
CSA A23.3-04 provides particular clauses for design of headed shear studs, in which the nominal
shear force cV from concrete is '00.28c cV b d f= , and the sum of the nominal shear forces from
concrete and shear reinforcements shall be no more than '00.75 cb d f . These values are larger than
those for stirrups.
Moreover, according to Clause 21.12.3 in CSA A23.3-04, for slabs with headed shear reinforcements
under seismic loading, the factored gravity shear stress gv shall satisfy the following formula (4-6).
'
0 0
0.5(0.28 )f s vs yvg E c c
V A fv R f
b d b s
φλφ
= ≤ +
(4-6)
For this research, 0
vs yvA f
b s is given for each specimen. Setting the material reducing factors ,c sφ φ to
unity, the nominal allowed maximum gravity load 1aV can be calculated as
159
'1 0
0
0.5(0.28 ) vs yva E c
A fV R f b d
b s
≤ +
(4-7)
where ER is defined in equation (2-47), vsA is the area of shear reinforcements, yvf is the yield
strength of the shear reinforcement, s is the radial spacing, 0b is the critical section length, d is the
effective slab thickness.
Clause 21.12.3 of CSA A23.3-04 also specifies the allowable maximum gravity load for seismic slabs
without shear reinforcements.
0
fg E c
Vv R v
b d= ≤ (4-8)
where cv is defined in equations in (2-30). From equation (4-8), the allowable maximum gravity load
for a seismic slab without shear reinforcement is
'2 0( ) (0.38 )a E cV b d R f= (4-9)
According to Eurocode2 (2004), Clause 6.4.3 (3) and 6.4.5 (1), design moment fM can be calculated
by equating the shear resistance rv of equation (2-43) and the shear stress fv in equation (2-42) due
to external load fV and unbalanced moment fM .
1
1 1
10.75 1.5( ) ( )sin f
f c sw ywdefr
V W ddM v A f
s u d u dα
γ
= + −
(4-10)
1/30.18 200(1 )(100 )c ck x y
c
v fd
ρ ργ
= + (4-11)
250 0.25ywdef ywdf d f= + ≤ (4-12)
where d is the effective depth of slab, rs is the radial spacing of shear reinforcements, swA is the
cross section area of shear reinforcements of each periphery row, 1u is the length of the basic control
160
section, 0.6γ = for square column, 1
1 0
uW edl= ∫ , e is the distance of dl to the moment axis, α is
the angle between the reinforcement and the slab plane, 1.5cγ = for persistent concrete, ckf is the
characteristic cylinder compressive strength (28-day), ,x yρ ρ are the flexural reinforcing ratios of the
slab in two orthogonal directions, ywdf is the design yield strength of the shear reinforcement.
To obtain the nominal moment M from equation (4-10) ~ (4-12), let the partial factor for concrete be
1.0cγ = ; use the following relation between 'cf and ckf proposed by Reineck (1999) (Gardner,
2005); and replace fV by vertical constant load V applied in the tests.
' 1.60ck cf f= − (MPa) (4-13)
Thus, there is following equation (4-14) for the nominal moment, in which all parameters are
specified as for equation (4-10).
1
1 1
10.75 1.5( ) ( )sinc sw ywdef
r
V W ddM v A f
s u d u dα
γ
= + −
(4-14)
1/3
'0.18 200(1 ) 100( 1.6)
1c c x yv fd
ρ ρ = + − (4-15)
All the calculated and measured moments for the specimens were shown in Table 4.9. The maximum
allowable gravity loads are also presented for seismic slabs with or without shear reinforcements. For
slabs strengthened with shear bolts, ACI318-05 provisions give smaller nominal values than the CSA
A23.3-04, since ACI318-05 provisions used above were mainly for stirrups and wires. The Eurocode
2(2004) gives too large nominal results, even larger than the measured peak moments, which is not
reasonable. CSA A23.3-04 is the best to predict the nominal moment capacity, but for slabs with
openings or with shear reinforcements, the predicted values are smaller than the tested peak moments.
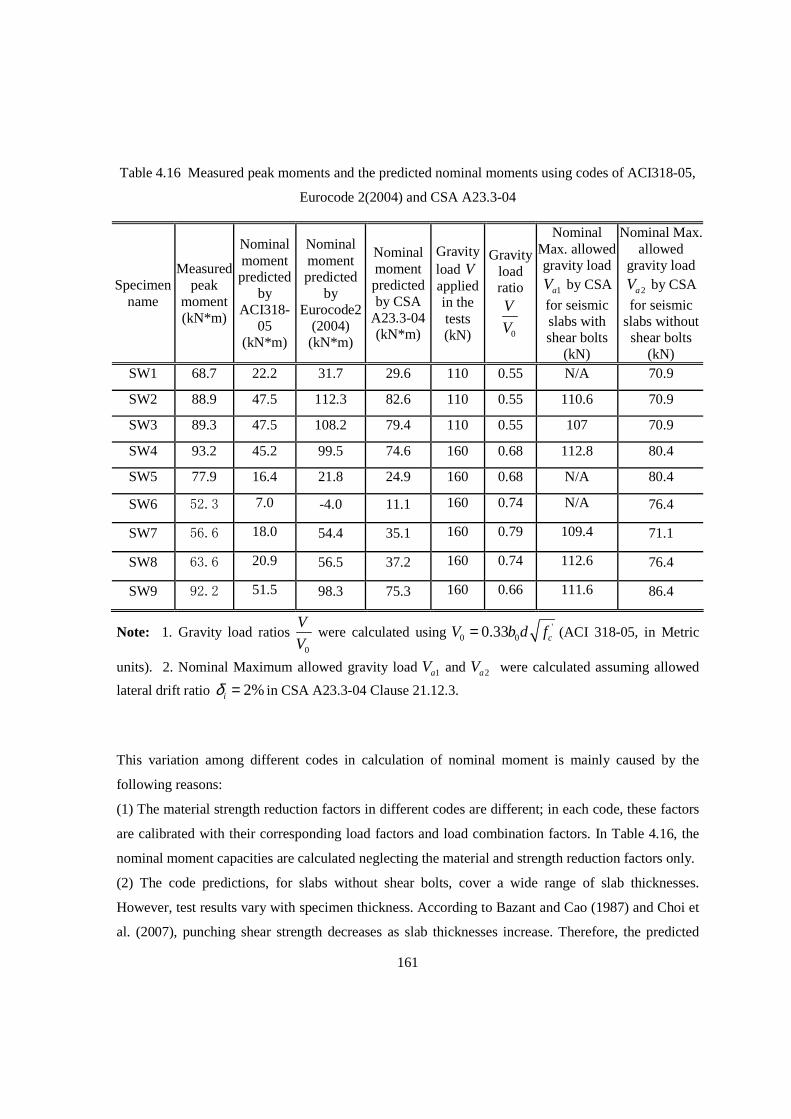
161
Table 4.16 Measured peak moments and the predicted nominal moments using codes of ACI318-05,
Eurocode 2(2004) and CSA A23.3-04
Specimen name
Measured peak
moment (kN*m)
Nominal moment predicted
by ACI318-
05 (kN*m)
Nominal moment predicted
by Eurocode2
(2004) (kN*m)
Nominal moment predicted by CSA
A23.3-04 (kN*m)
Gravity load V applied in the tests (kN)
Gravity load ratio
0
V
V
Nominal Max. allowed gravity load
1aV by CSA
for seismic slabs with shear bolts
(kN)
Nominal Max. allowed
gravity load
2aV by CSA
for seismic slabs without shear bolts
(kN) SW1 68.7 22.2 31.7 29.6 110 0.55 N/A 70.9
SW2 88.9 47.5 112.3 82.6 110 0.55 110.6 70.9
SW3 89.3 47.5 108.2 79.4 110 0.55 107 70.9
SW4 93.2 45.2 99.5 74.6 160 0.68 112.8 80.4
SW5 77.9 16.4 21.8 24.9 160 0.68 N/A 80.4
SW6 52.3 7.0 -4.0 11.1 160 0.74 N/A 76.4
SW7 56.6 18.0 54.4 35.1 160 0.79 109.4 71.1
SW8 63.6 20.9 56.5 37.2 160 0.74 112.6 76.4
SW9 92.2 51.5 98.3 75.3 160 0.66 111.6 86.4
Note: 1. Gravity load ratios 0
V
V were calculated using '
0 00.33 cV b d f= (ACI 318-05, in Metric
units). 2. Nominal Maximum allowed gravity load 1aV and 2aV were calculated assuming allowed
lateral drift ratio 2%iδ = in CSA A23.3-04 Clause 21.12.3.
This variation among different codes in calculation of nominal moment is mainly caused by the
following reasons:
(1) The material strength reduction factors in different codes are different; in each code, these factors
are calibrated with their corresponding load factors and load combination factors. In Table 4.16, the
nominal moment capacities are calculated neglecting the material and strength reduction factors only.
(2) The code predictions, for slabs without shear bolts, cover a wide range of slab thicknesses.
However, test results vary with specimen thickness. According to Bazant and Cao (1987) and Choi et
al. (2007), punching shear strength decreases as slab thicknesses increase. Therefore, the predicted

162
nominal moments using codes, for the specimens SW1, SW5, and SW6 (without shear bolts), are
much lower than maximum moments measured.
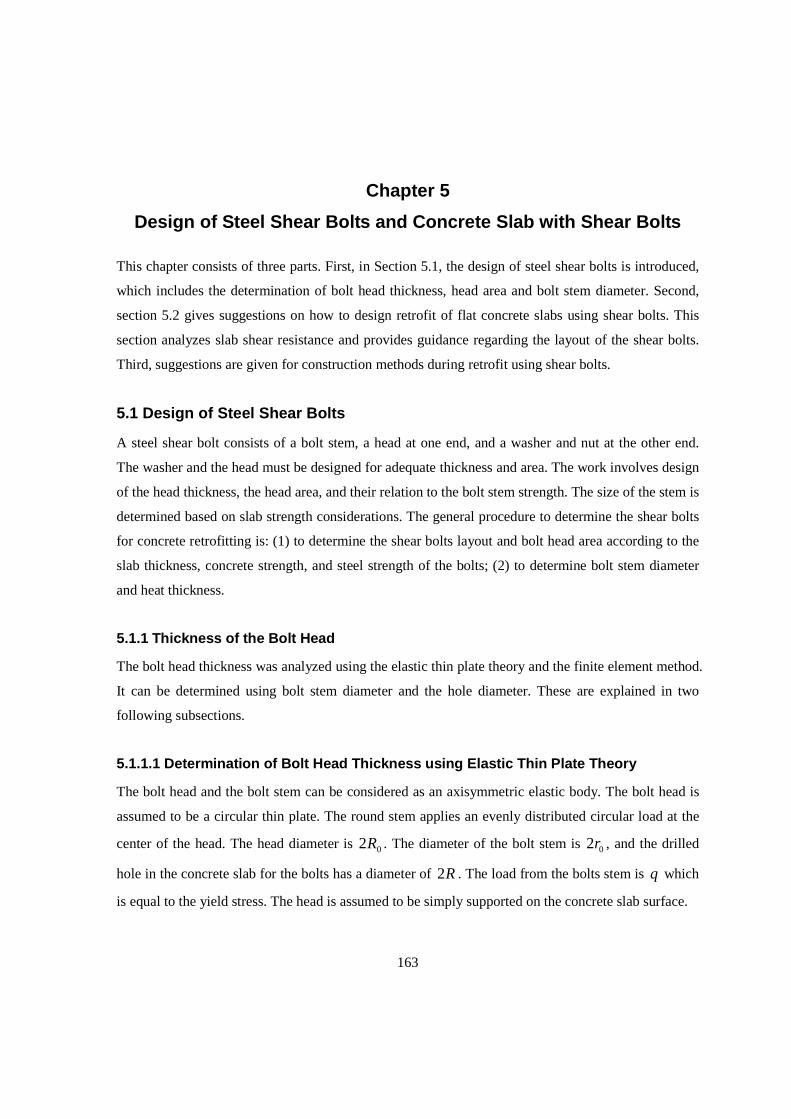
163
Chapter 5
Design of Steel Shear Bolts and Concrete Slab with Shear Bolts
This chapter consists of three parts. First, in Section 5.1, the design of steel shear bolts is introduced,
which includes the determination of bolt head thickness, head area and bolt stem diameter. Second,
section 5.2 gives suggestions on how to design retrofit of flat concrete slabs using shear bolts. This
section analyzes slab shear resistance and provides guidance regarding the layout of the shear bolts.
Third, suggestions are given for construction methods during retrofit using shear bolts.
5.1 Design of Steel Shear Bolts
A steel shear bolt consists of a bolt stem, a head at one end, and a washer and nut at the other end.
The washer and the head must be designed for adequate thickness and area. The work involves design
of the head thickness, the head area, and their relation to the bolt stem strength. The size of the stem is
determined based on slab strength considerations. The general procedure to determine the shear bolts
for concrete retrofitting is: (1) to determine the shear bolts layout and bolt head area according to the
slab thickness, concrete strength, and steel strength of the bolts; (2) to determine bolt stem diameter
and heat thickness.
5.1.1 Thickness of the Bolt Head
The bolt head thickness was analyzed using the elastic thin plate theory and the finite element method.
It can be determined using bolt stem diameter and the hole diameter. These are explained in two
following subsections.
5.1.1.1 Determination of Bolt Head Thickness using Elastic Thin Plate Theory
The bolt head and the bolt stem can be considered as an axisymmetric elastic body. The bolt head is
assumed to be a circular thin plate. The round stem applies an evenly distributed circular load at the
center of the head. The head diameter is 02R . The diameter of the bolt stem is 02r , and the drilled
hole in the concrete slab for the bolts has a diameter of R2 . The load from the bolts stem is q which
is equal to the yield stress. The head is assumed to be simply supported on the concrete slab surface.
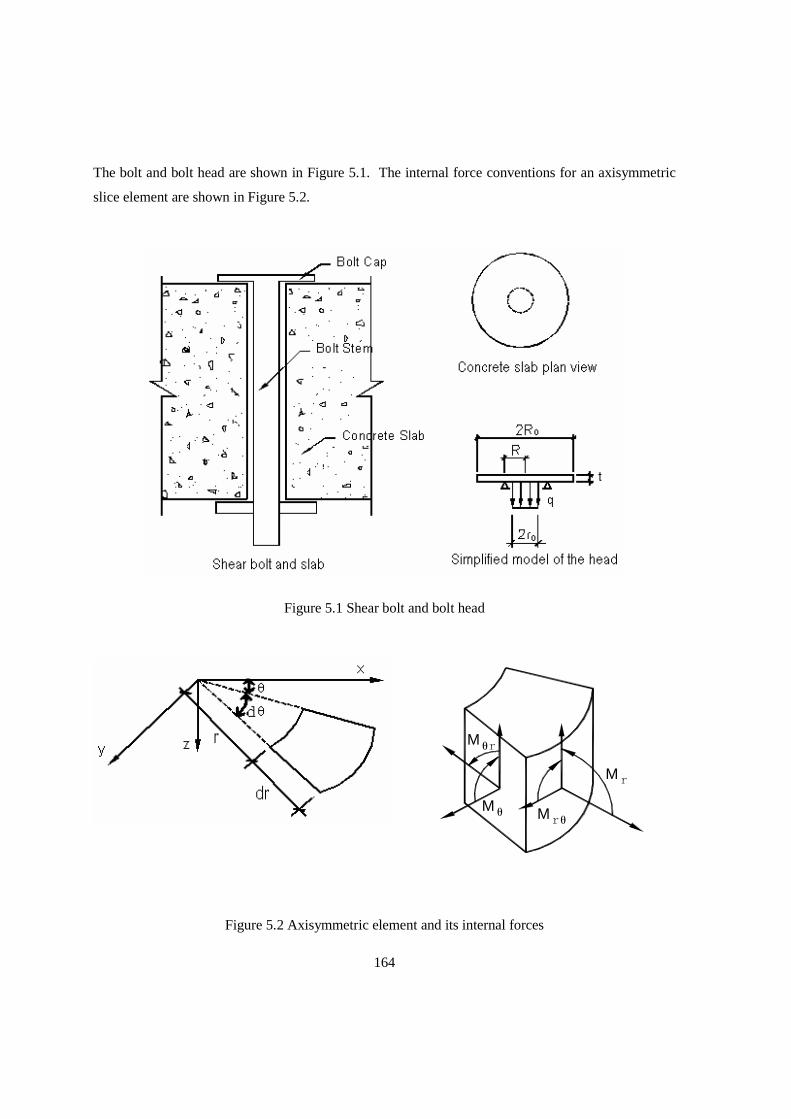
164
The bolt and bolt head are shown in Figure 5.1. The internal force conventions for an axisymmetric
slice element are shown in Figure 5.2.
Figure 5.1 Shear bolt and bolt head
M
rθθM M
rM
θr
Figure 5.2 Axisymmetric element and its internal forces
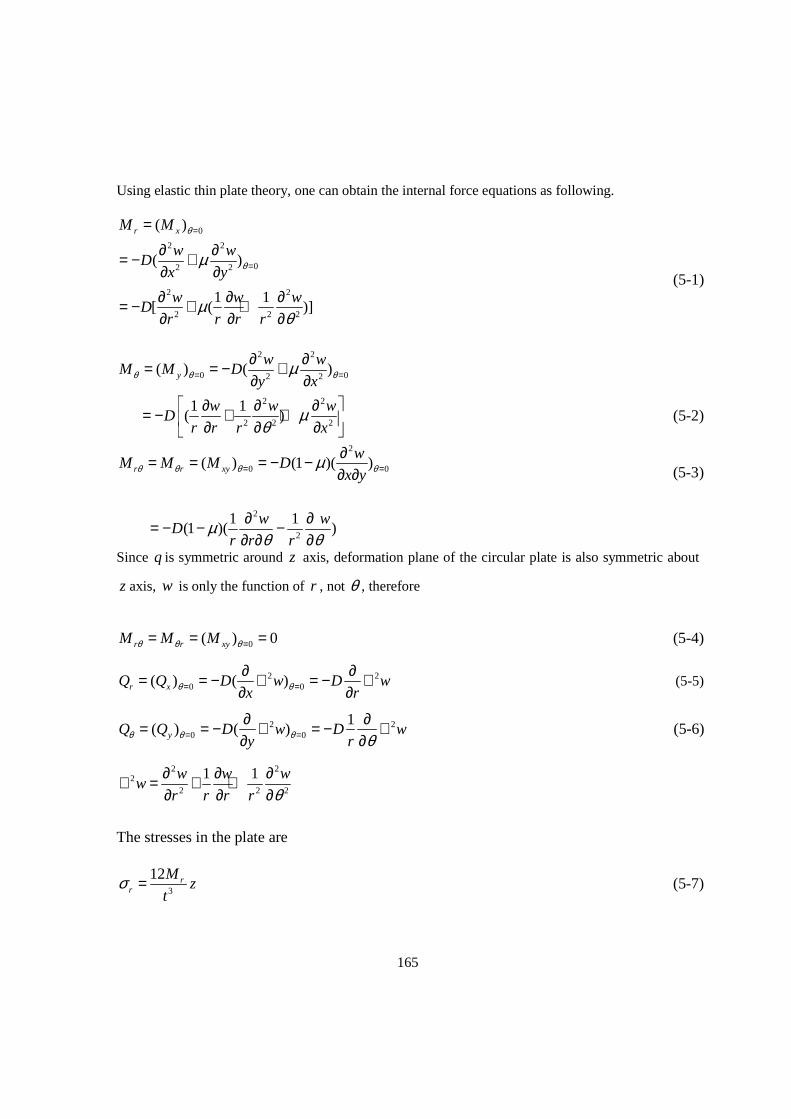
165
Using elastic thin plate theory, one can obtain the internal force equations as following.
0
2 2
02 2
2 2
2 2 2
( )
( )
1 1[ ( )]
r xM M
w wD
x y
w w wD
r r r r
θ
θµ
µθ
=
=
=
∂ ∂= − +∂ ∂∂ ∂ ∂= − + +∂ ∂ ∂
(5-1)
2 2
0 02 2( ) ( )y
w wM M D
y xθ θ θµ= =∂ ∂= = − +∂ ∂
2 2
2 2 2
1 1( )
w w wD
r r r xµ
θ ∂ ∂ ∂= − + + ∂ ∂ ∂
(5-2)
2
0 0( ) (1 )( )r r xy
wM M M D
x yθ θ θ θµ= =∂= = = − −∂ ∂ (5-3)
2
2
1 1(1 )( )
w wD
r r rµ
θ θ∂ ∂= − − −∂ ∂ ∂
Since q is symmetric around z axis, deformation plane of the circular plate is also symmetric about
z axis, w is only the function of r , not θ , therefore
0( ) 0r r xyM M Mθ θ θ == = = (5-4)
2 20 0( ) ( )r xQ Q D w D w
x rθ θ= =∂ ∂= = − ∇ = − ∇∂ ∂
(5-5)
2 20 0
1( ) ( )yQ Q D w D w
y rθ θ θ θ= =∂ ∂= = − ∇ = − ∇∂ ∂
(5-6)
2 22
2 2 2
1 1w w ww
r r r r θ∂ ∂ ∂∇ = + +∂ ∂ ∂
The stresses in the plate are
3
12 rr
Mz
tσ = (5-7)
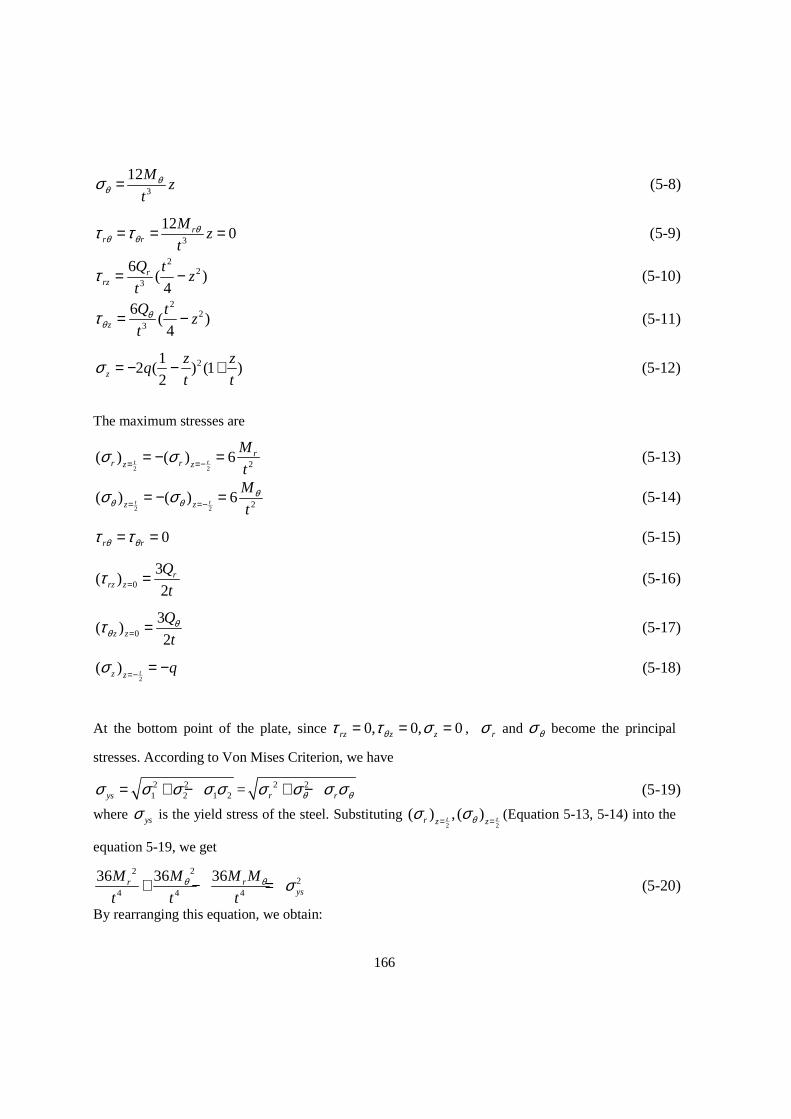
166
3
12Mz
tθ
θσ = (5-8)
3
120r
r r
Mz
tθ
θ θτ τ= = = (5-9)
22
3
6( )4
rrz
Q tz
tτ = − (5-10)
22
3
6( )4z
Q tz
tθ
θτ = − (5-11)
212 ( ) (1 )
2z
z zq
t tσ = − − + (5-12)
The maximum stresses are
2 2 2( ) ( ) 6t t
rr rz z
M
tσ σ= =−= − = (5-13)
2 2 2( ) ( ) 6t tz z
M
tθ
θ θσ σ= =−= − = (5-14)
0r rθ θτ τ= = (5-15)
0
3( )
2r
rz z
Q
tτ = = (5-16)
0
3( )
2z z
Q
tθ
θτ = = (5-17)
2( ) tz z
qσ =− = − (5-18)
At the bottom point of the plate, since 0, 0, 0rz z zθτ τ σ= = = , rσ and θσ become the principal
stresses. According to Von Mises Criterion, we have
2 21 2 1 2ysσ σ σ σ σ= + − = 2 2
r rθ θσ σ σ σ+ − (5-19)
where ysσ is the yield stress of the steel. Substituting 2 2
( ) , ( )t tr z zθσ σ= = (Equation 5-13, 5-14) into the
equation 5-19, we get
222
4 4 4
36 3636 rrys
M M MM
t t tθ θ σ+ − = (5-20)
By rearranging this equation, we obtain:
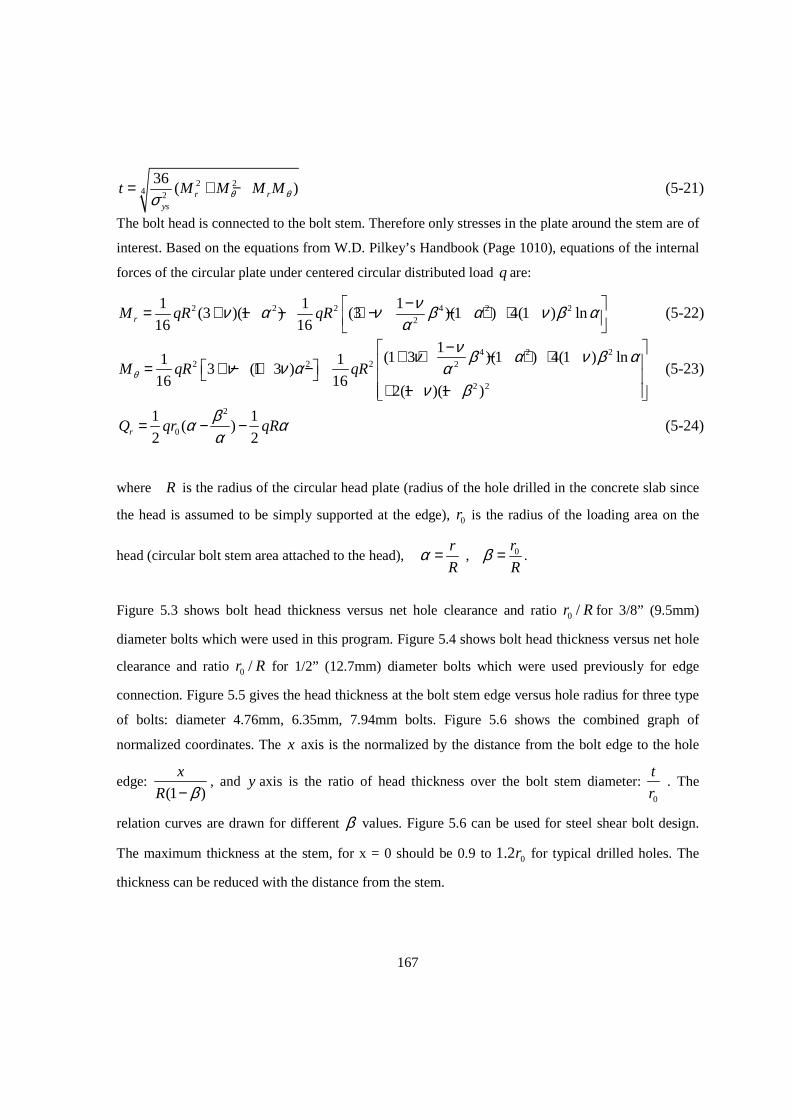
167
2 24 2
36( )r r
ys
t M M M Mθ θσ= + − (5-21)
The bolt head is connected to the bolt stem. Therefore only stresses in the plate around the stem are of
interest. Based on the equations from W.D. Pilkey’s Handbook (Page 1010), equations of the internal
forces of the circular plate under centered circular distributed load q are:
2 2 2 4 2 22
1 1 1(3 )(1 ) (3 )(1 ) 4(1 ) ln
16 16rM qR qRνν α ν β α ν β α
α− = + − − + − − + +
(5-22)
4 2 22 2 2 2
2 2
1(1 3 )(1 ) 4(1 ) ln1 1
3 (1 3 )16 16
2(1 )(1 )
M qR qRθ
νν β α ν β αν ν α α
ν β
− + + − + + = + − + − + − −
(5-23)
2
0
1 1( )
2 2rQ qr qRβα αα
= − − (5-24)
where R is the radius of the circular head plate (radius of the hole drilled in the concrete slab since
the head is assumed to be simply supported at the edge), 0r is the radius of the loading area on the
head (circular bolt stem area attached to the head), r
Rα = , 0r
Rβ = .
Figure 5.3 shows bolt head thickness versus net hole clearance and ratio 0 /r R for 3/8” (9.5mm)
diameter bolts which were used in this program. Figure 5.4 shows bolt head thickness versus net hole
clearance and ratio 0 /r R for 1/2” (12.7mm) diameter bolts which were used previously for edge
connection. Figure 5.5 gives the head thickness at the bolt stem edge versus hole radius for three type
of bolts: diameter 4.76mm, 6.35mm, 7.94mm bolts. Figure 5.6 shows the combined graph of
normalized coordinates. The x axis is the normalized by the distance from the bolt edge to the hole
edge: (1 )
x
R β−, and y axis is the ratio of head thickness over the bolt stem diameter:
0
t
r . The
relation curves are drawn for different β values. Figure 5.6 can be used for steel shear bolt design.
The maximum thickness at the stem, for x = 0 should be 0.9 to 02.1 r for typical drilled holes. The
thickness can be reduced with the distance from the stem.
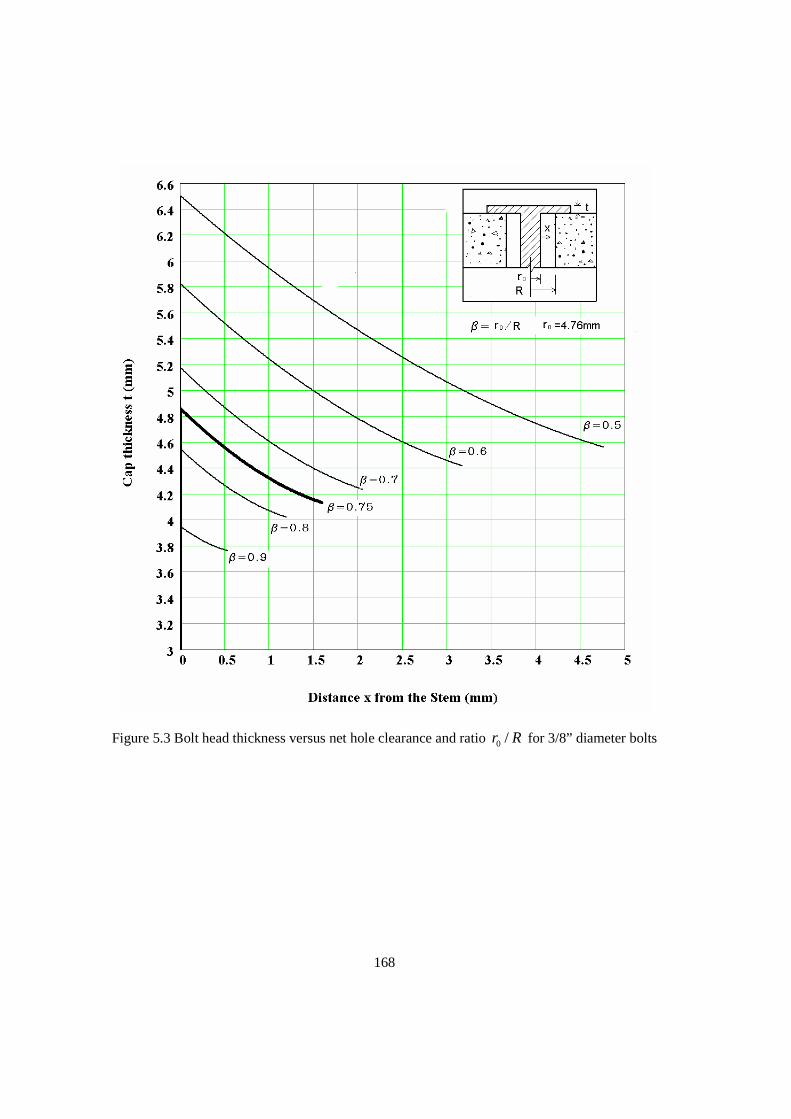
168
Figure 5.3 Bolt head thickness versus net hole clearance and ratio 0 /r R for 3/8” diameter bolts
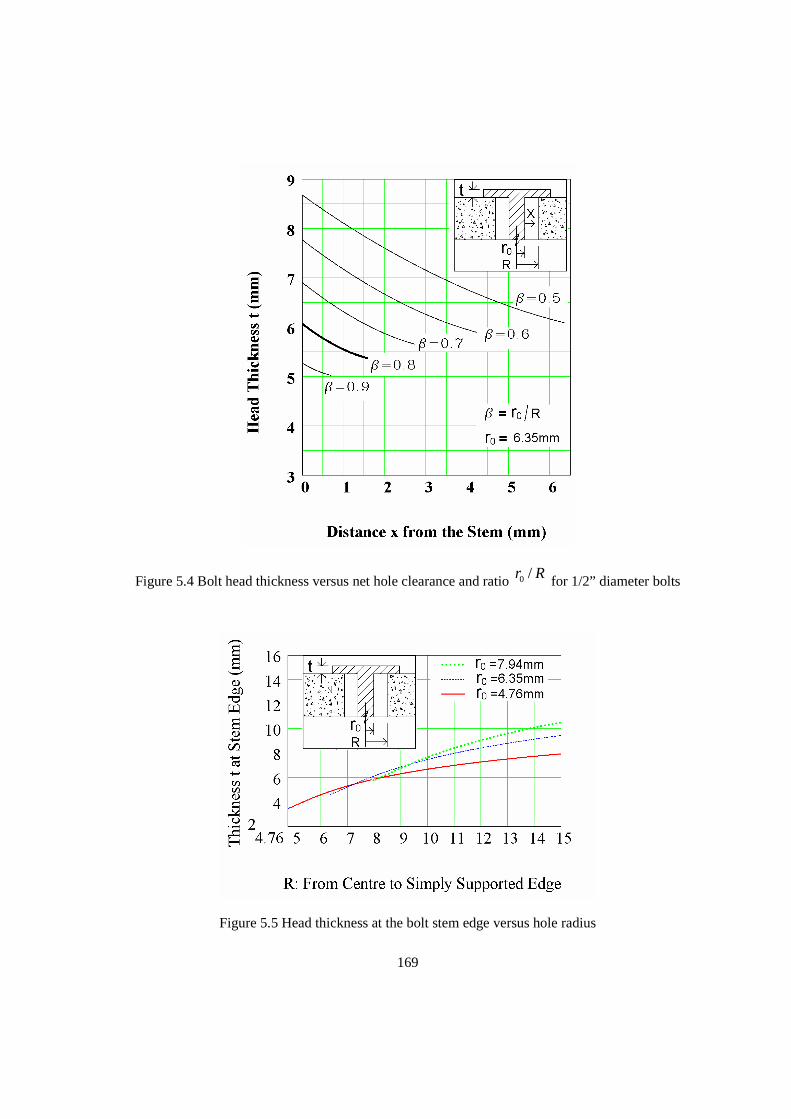
169
Figure 5.4 Bolt head thickness versus net hole clearance and ratio 0 /r R for 1/2” diameter bolts
Figure 5.5 Head thickness at the bolt stem edge versus hole radius
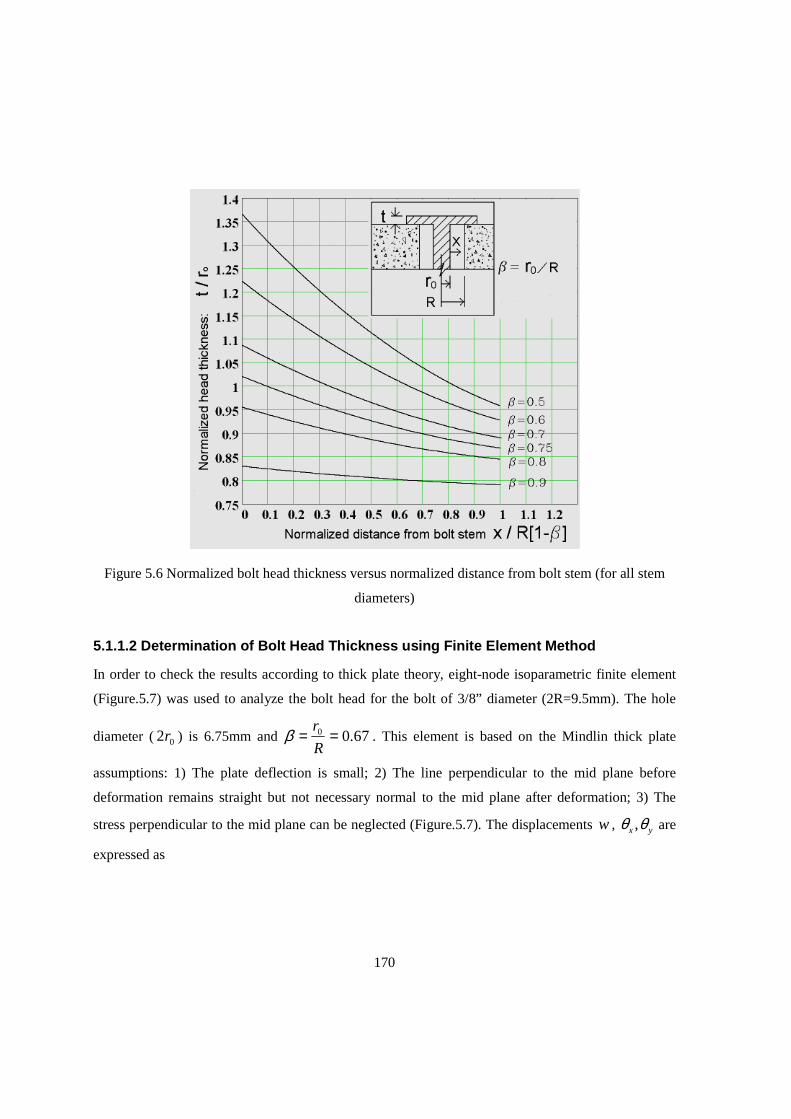
170
Figure 5.6 Normalized bolt head thickness versus normalized distance from bolt stem (for all stem
diameters)
5.1.1.2 Determination of Bolt Head Thickness using Finite Element Method
In order to check the results according to thick plate theory, eight-node isoparametric finite element
(Figure.5.7) was used to analyze the bolt head for the bolt of 3/8” diameter (2R=9.5mm). The hole
diameter ( 02r ) is 6.75mm and 67.00 ==R
rβ . This element is based on the Mindlin thick plate
assumptions: 1) The plate deflection is small; 2) The line perpendicular to the mid plane before
deformation remains straight but not necessary normal to the mid plane after deformation; 3) The
stress perpendicular to the mid plane can be neglected (Figure.5.7). The displacements w , ,x yθ θ are
expressed as
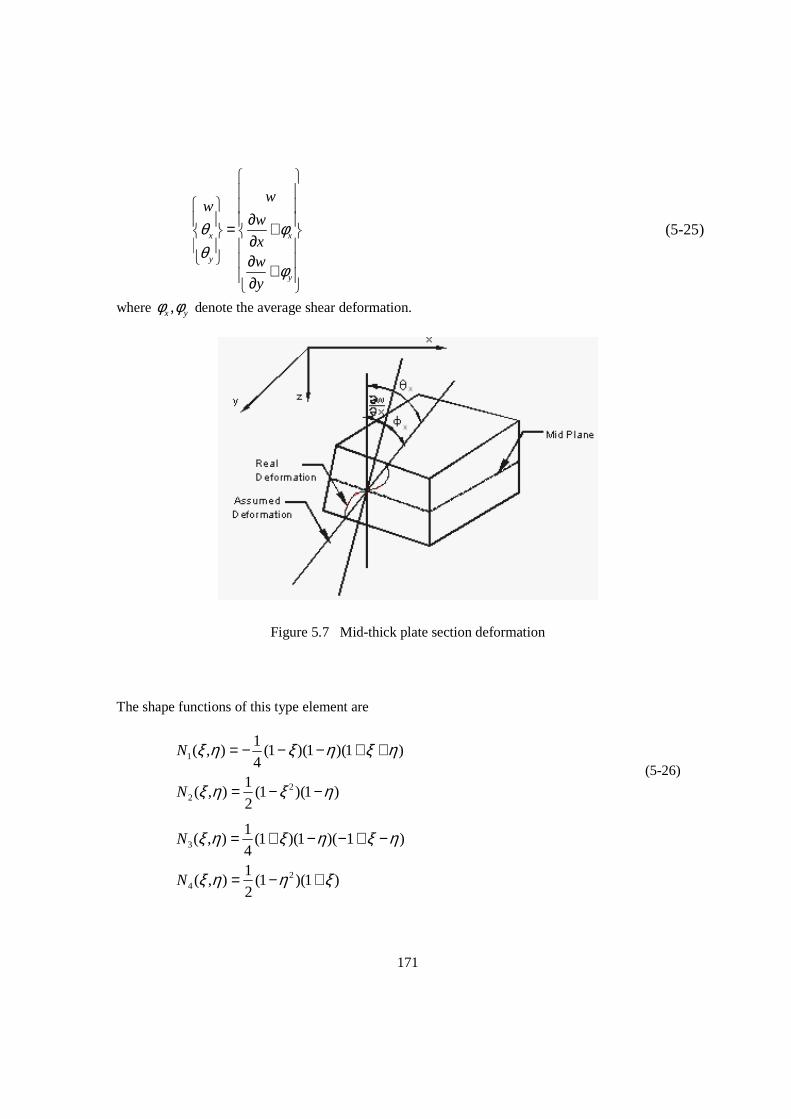
171
x x
y
y
ww
w
xw
y
θ φθ
φ
∂ = + ∂
∂ + ∂
(5-25)
where ,x yφ φ denote the average shear deformation.
Figure 5.7 Mid-thick plate section deformation
The shape functions of this type element are
)1)(1(2
1),(
)1)(1)(1(4
1),(
22
1
ηξηξ
ηξηξηξ
−−=
++−−−=
N
N (5-26)
)1)(1(2
1),(
)1)(1)(1(41
),(
24
3
ξηηξ
ηξηξηξ
+−=
−+−−+=
N
N
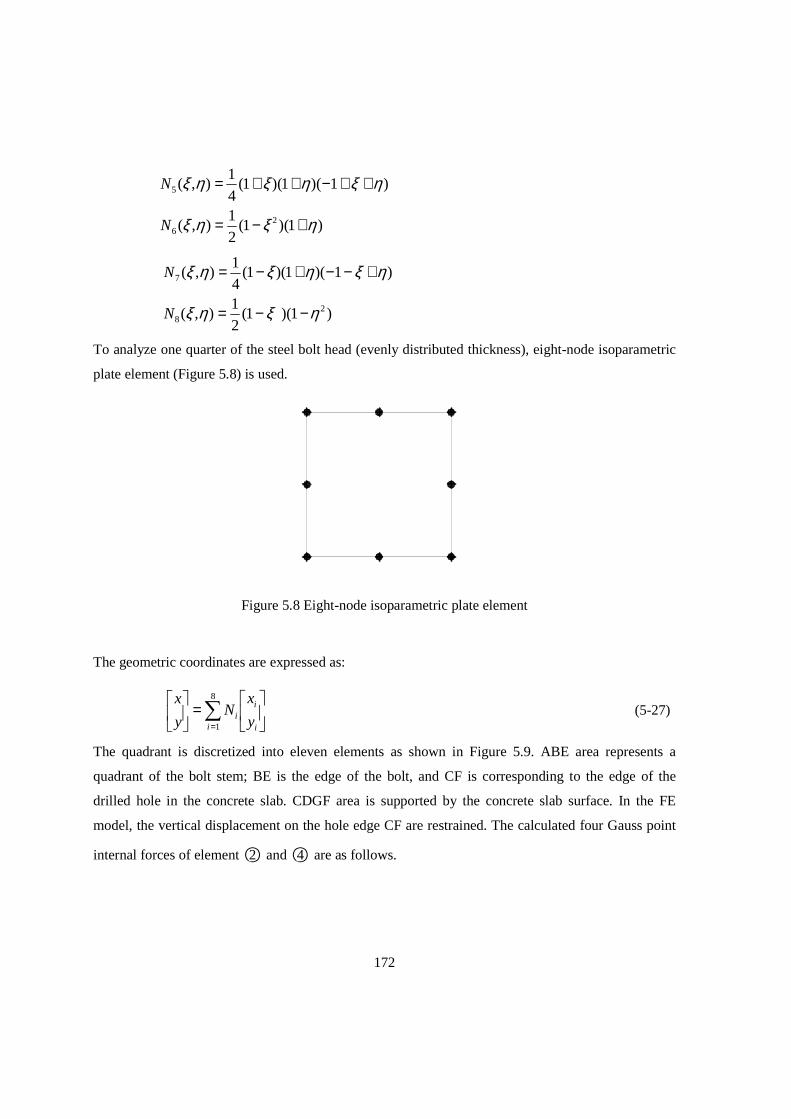
172
)1)(1(2
1),(
)1)(1)(1(4
1),(
26
5
ηξηξ
ηξηξηξ
+−=
++−++=
N
N
)1)(1(2
1),(
)1)(1)(1(41
),(
28
7
ηξηξ
ηξηξηξ
−−=
+−−+−=
N
N
To analyze one quarter of the steel bolt head (evenly distributed thickness), eight-node isoparametric
plate element (Figure 5.8) is used.
Figure 5.8 Eight-node isoparametric plate element
The geometric coordinates are expressed as:
=
∑
= i
i
ii y
xN
y
x 8
1
(5-27)
The quadrant is discretized into eleven elements as shown in Figure 5.9. ABE area represents a
quadrant of the bolt stem; BE is the edge of the bolt, and CF is corresponding to the edge of the
drilled hole in the concrete slab. CDGF area is supported by the concrete slab surface. In the FE
model, the vertical displacement on the hole edge CF are restrained. The calculated four Gauss point
internal forces of element ○2 and ○4 are as follows.
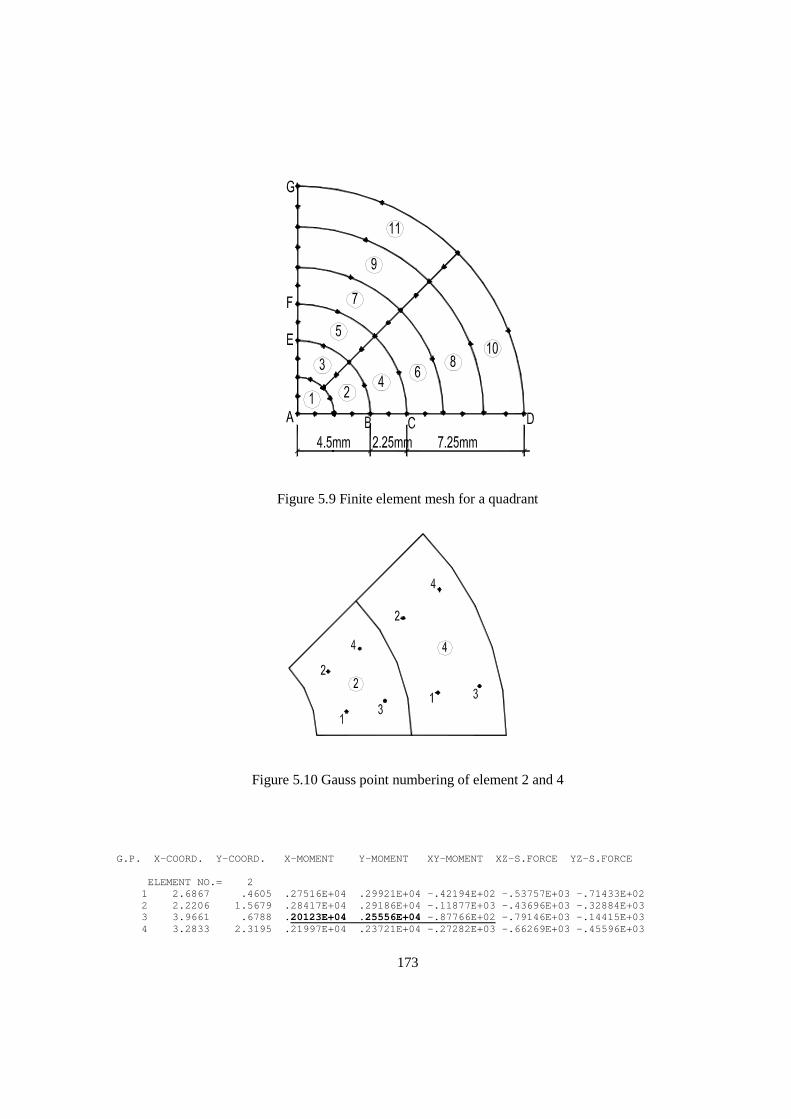
173
Figure 5.9 Finite element mesh for a quadrant
Figure 5.10 Gauss point numbering of element 2 and 4
G.P. X-COORD. Y-COORD. X-MOMENT Y-MOMENT XY-MOMENT XZ-S.FORCE YZ-S.FORCE ELEMENT NO.= 2 1 2.6867 .4605 .27516E+04 .29921E+04 -.42194E+02 -.53757E+03 -.71433E+02 2 2.2206 1.5679 .28417E+04 .29186E+04 -.11877E+03 -.43696E+03 -.32884E+03 3 3.9661 .6788 .20123E+04 .25556E+04 -.87766E+02 -.79146E+03 -.14415E+03 4 3.2833 2.3195 .21997E+04 .23721E+04 -.27282E+03 -.66269E+03 -.45596E+03
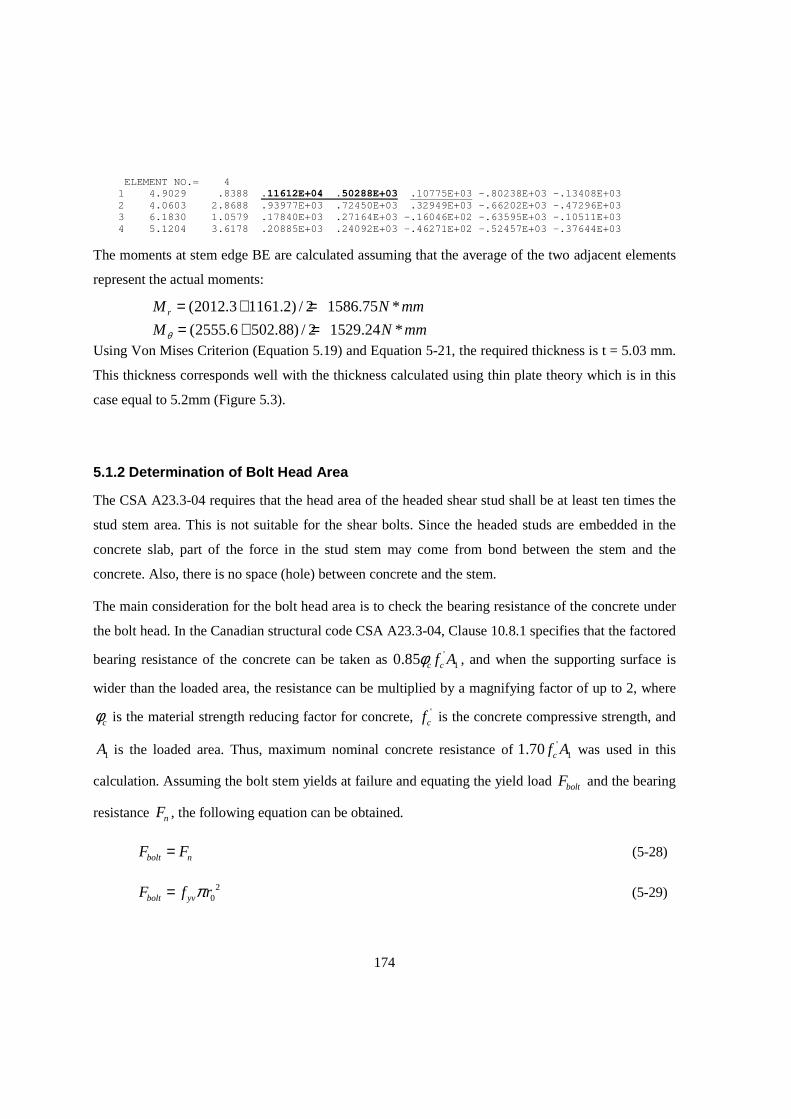
174
ELEMENT NO.= 4 1 4.9029 .8388 .11612E+04 .50288E+03 .10775E+03 -.80238E+03 -.13408E+03 2 4.0603 2.8688 .93977E+03 .72450E+03 .32949E+03 -.66202E+03 -.47296E+03 3 6.1830 1.0579 .17840E+03 .27164E+03 -.16046E+02 -.63595E+03 -.10511E+03 4 5.1204 3.6178 .20885E+03 .24092E+03 -.46271E+02 -.52457E+03 -.37644E+03
The moments at stem edge BE are calculated assuming that the average of the two adjacent elements
represent the actual moments:
(2012.3 1161.2) / 2 1586.75 *rM N mm= + =
(2555.6 502.88) / 2 1529.24 *M N mmθ = + =
Using Von Mises Criterion (Equation 5.19) and Equation 5-21, the required thickness is t = 5.03 mm.
This thickness corresponds well with the thickness calculated using thin plate theory which is in this
case equal to 5.2mm (Figure 5.3).
5.1.2 Determination of Bolt Head Area
The CSA A23.3-04 requires that the head area of the headed shear stud shall be at least ten times the
stud stem area. This is not suitable for the shear bolts. Since the headed studs are embedded in the
concrete slab, part of the force in the stud stem may come from bond between the stem and the
concrete. Also, there is no space (hole) between concrete and the stem.
The main consideration for the bolt head area is to check the bearing resistance of the concrete under
the bolt head. In the Canadian structural code CSA A23.3-04, Clause 10.8.1 specifies that the factored
bearing resistance of the concrete can be taken as '10.85 c cf Aφ , and when the supporting surface is
wider than the loaded area, the resistance can be multiplied by a magnifying factor of up to 2, where
cφ is the material strength reducing factor for concrete, 'cf is the concrete compressive strength, and
1A is the loaded area. Thus, maximum nominal concrete resistance of '11.70 cf A was used in this
calculation. Assuming the bolt stem yields at failure and equating the yield load boltF and the bearing
resistance nF , the following equation can be obtained.
bolt nF F= (5-28)
20bolt yvF f rπ= (5-29)
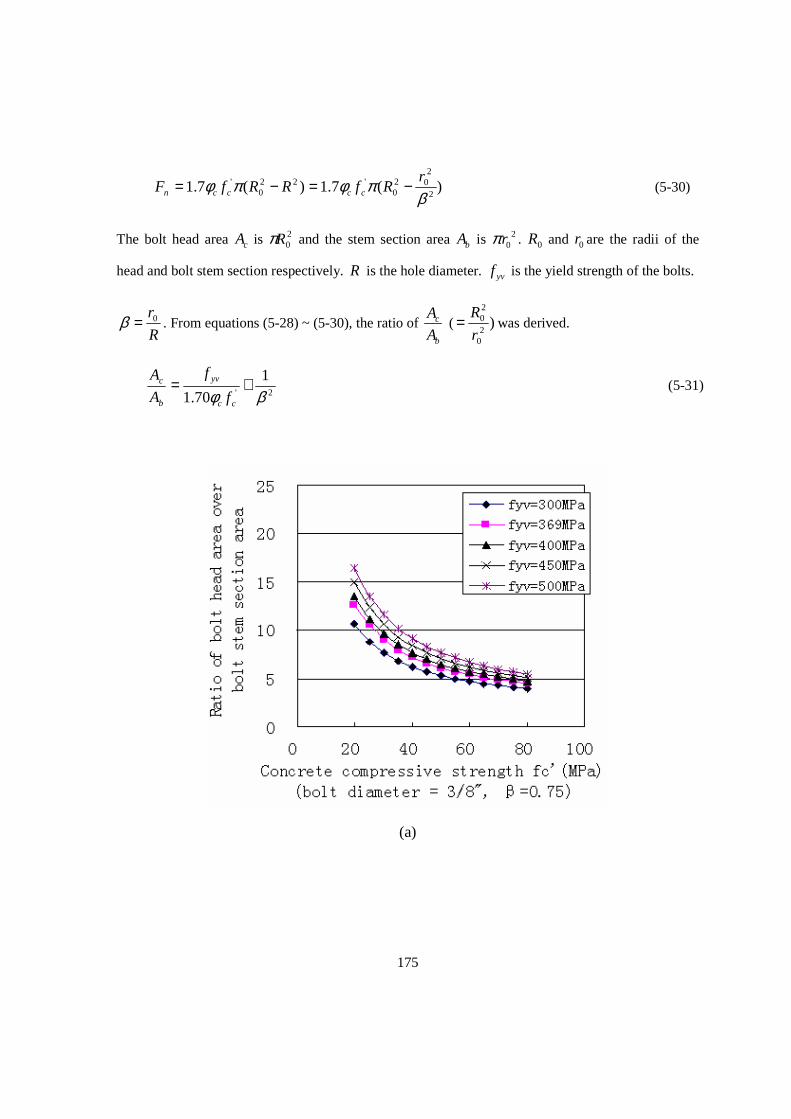
175
)(7.1)(7.12
202
0'22
0'
βπφπφ r
RfRRfF ccccn −=−= (5-30)
The bolt head area cA is 20Rπ and the stem section area bA is 2
0rπ . 0R and 0r are the radii of the
head and bolt stem section respectively. R is the hole diameter. yvf is the yield strength of the bolts.
R
r0=β . From equations (5-28) ~ (5-30), the ratio of c
b
A
A ( )
20
20
r
R= was derived.
2'
1
70.1 βφ+=
cc
yv
b
c
f
f
A
A (5-31)
(a)
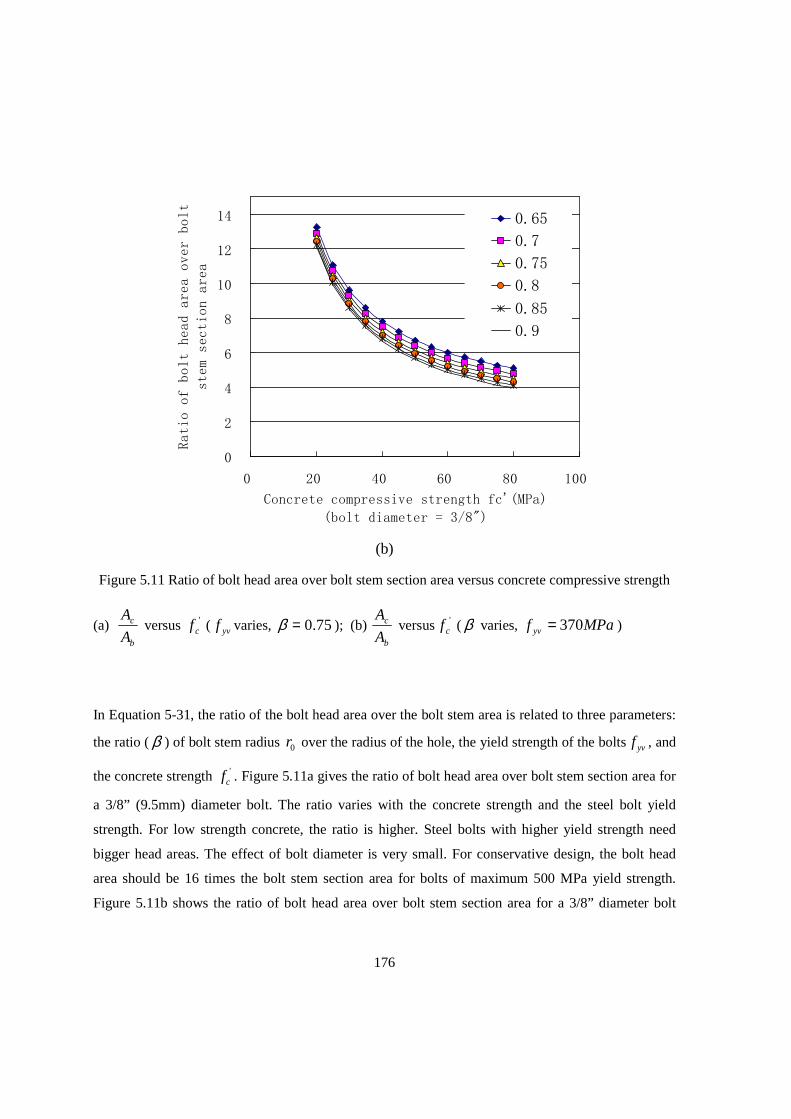
176
0
2
4
6
8
10
12
14
0 20 40 60 80 100
Concrete compressive strength fc'(MPa)
(bolt diameter = 3/8")
Ratio of bolt head area over bolt
stem section area
0.65
0.7
0.75
0.8
0.85
0.9
(b)
Figure 5.11 Ratio of bolt head area over bolt stem section area versus concrete compressive strength
(a) b
c
A
A versus '
cf ( yvf varies, 75.0=β ); (b) b
c
A
A versus '
cf ( β varies, MPaf yv 370= )
In Equation 5-31, the ratio of the bolt head area over the bolt stem area is related to three parameters:
the ratio (β ) of bolt stem radius 0r over the radius of the hole, the yield strength of the bolts yvf , and
the concrete strength 'cf . Figure 5.11a gives the ratio of bolt head area over bolt stem section area for
a 3/8” (9.5mm) diameter bolt. The ratio varies with the concrete strength and the steel bolt yield
strength. For low strength concrete, the ratio is higher. Steel bolts with higher yield strength need
bigger head areas. The effect of bolt diameter is very small. For conservative design, the bolt head
area should be 16 times the bolt stem section area for bolts of maximum 500 MPa yield strength.
Figure 5.11b shows the ratio of bolt head area over bolt stem section area for a 3/8” diameter bolt
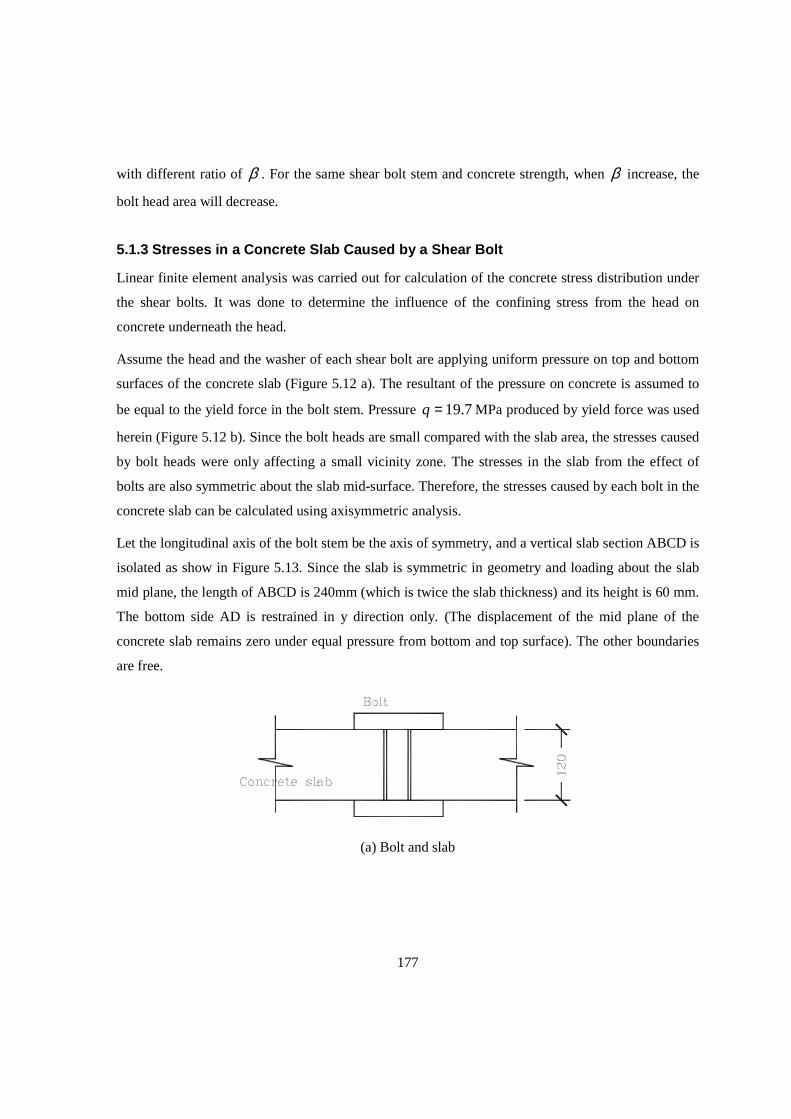
177
with different ratio of β . For the same shear bolt stem and concrete strength, when β increase, the
bolt head area will decrease.
5.1.3 Stresses in a Concrete Slab Caused by a Shear Bolt
Linear finite element analysis was carried out for calculation of the concrete stress distribution under
the shear bolts. It was done to determine the influence of the confining stress from the head on
concrete underneath the head.
Assume the head and the washer of each shear bolt are applying uniform pressure on top and bottom
surfaces of the concrete slab (Figure 5.12 a). The resultant of the pressure on concrete is assumed to
be equal to the yield force in the bolt stem. Pressure 7.19=q MPa produced by yield force was used
herein (Figure 5.12 b). Since the bolt heads are small compared with the slab area, the stresses caused
by bolt heads were only affecting a small vicinity zone. The stresses in the slab from the effect of
bolts are also symmetric about the slab mid-surface. Therefore, the stresses caused by each bolt in the
concrete slab can be calculated using axisymmetric analysis.
Let the longitudinal axis of the bolt stem be the axis of symmetry, and a vertical slab section ABCD is
isolated as show in Figure 5.13. Since the slab is symmetric in geometry and loading about the slab
mid plane, the length of ABCD is 240mm (which is twice the slab thickness) and its height is 60 mm.
The bottom side AD is restrained in y direction only. (The displacement of the mid plane of the
concrete slab remains zero under equal pressure from bottom and top surface). The other boundaries
are free.
(a) Bolt and slab
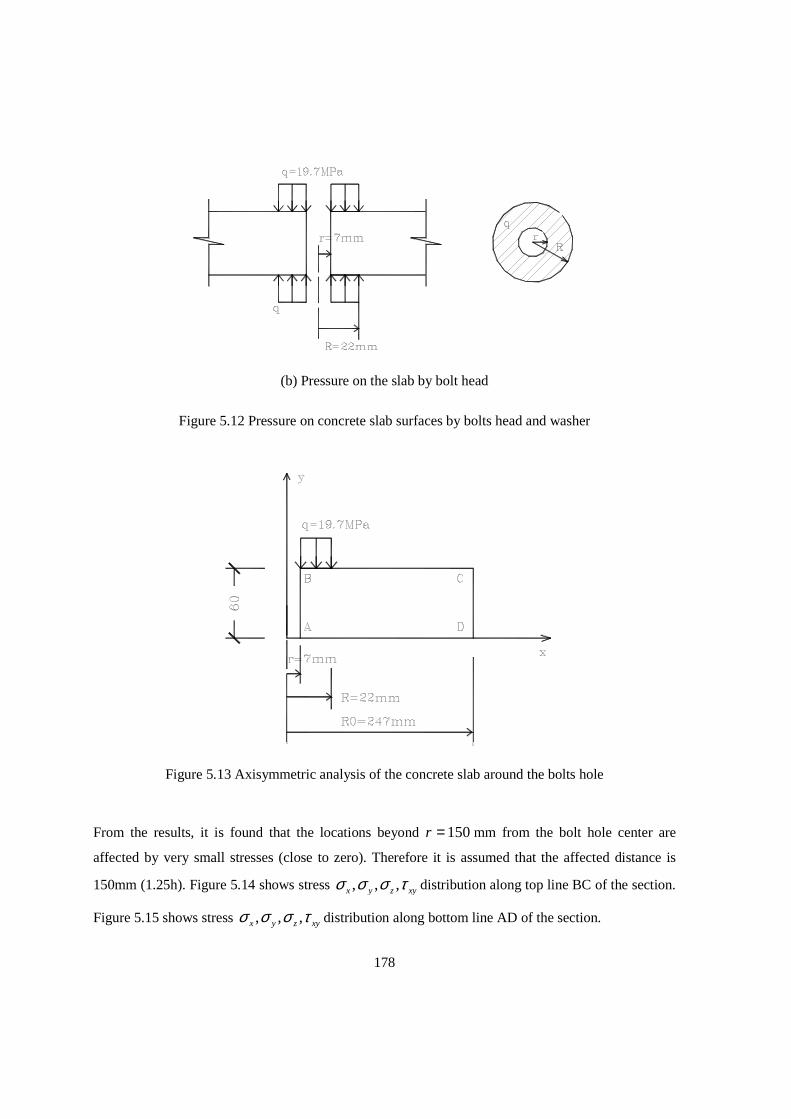
178
(b) Pressure on the slab by bolt head
Figure 5.12 Pressure on concrete slab surfaces by bolts head and washer
Figure 5.13 Axisymmetric analysis of the concrete slab around the bolts hole
From the results, it is found that the locations beyond 150=r mm from the bolt hole center are
affected by very small stresses (close to zero). Therefore it is assumed that the affected distance is
150mm (1.25h). Figure 5.14 shows stress , , ,x y z xyσ σ σ τ distribution along top line BC of the section.
Figure 5.15 shows stress , , ,x y z xyσ σ σ τ distribution along bottom line AD of the section.
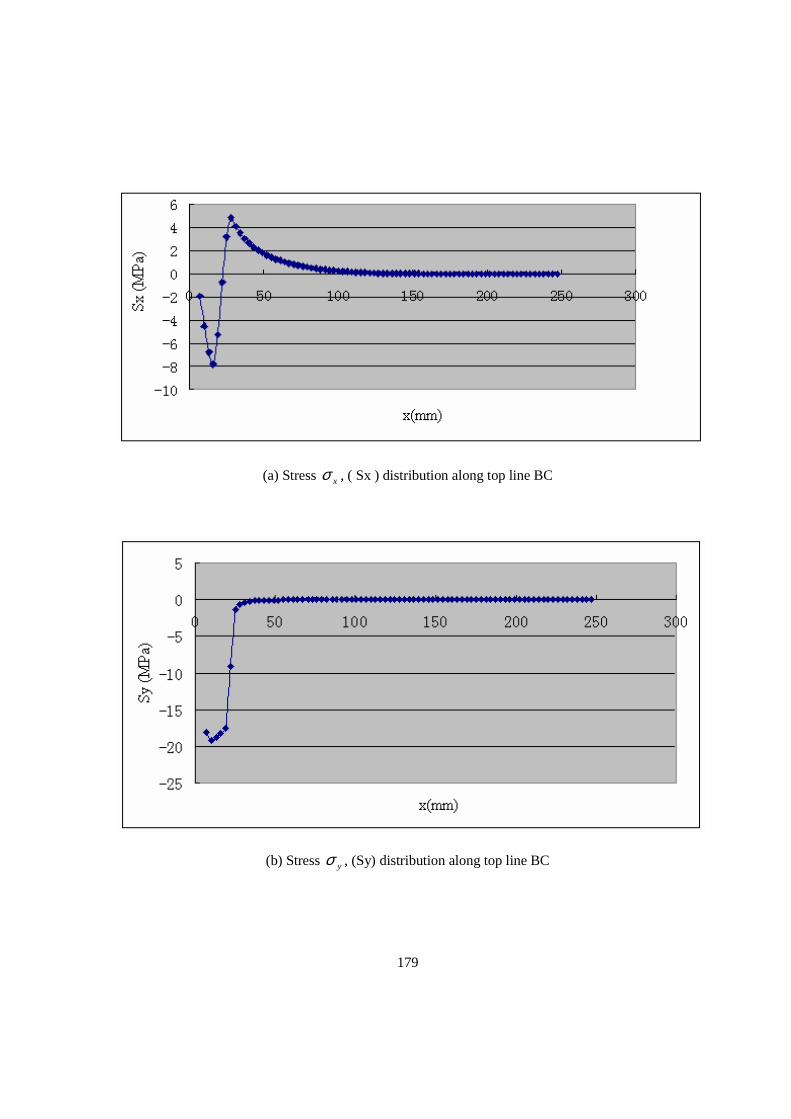
179
(a) Stress xσ , ( Sx ) distribution along top line BC
(b) Stress yσ , (Sy) distribution along top line BC
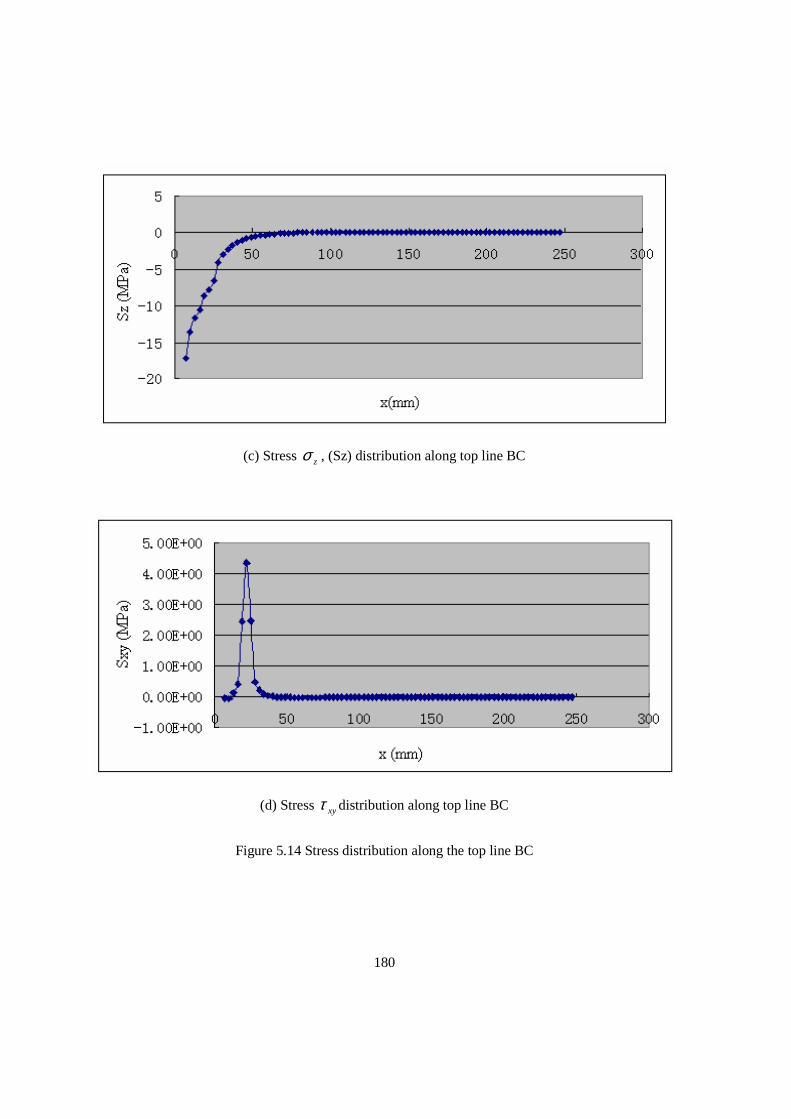
180
(c) Stress zσ , (Sz) distribution along top line BC
(d) Stress xyτ distribution along top line BC
Figure 5.14 Stress distribution along the top line BC
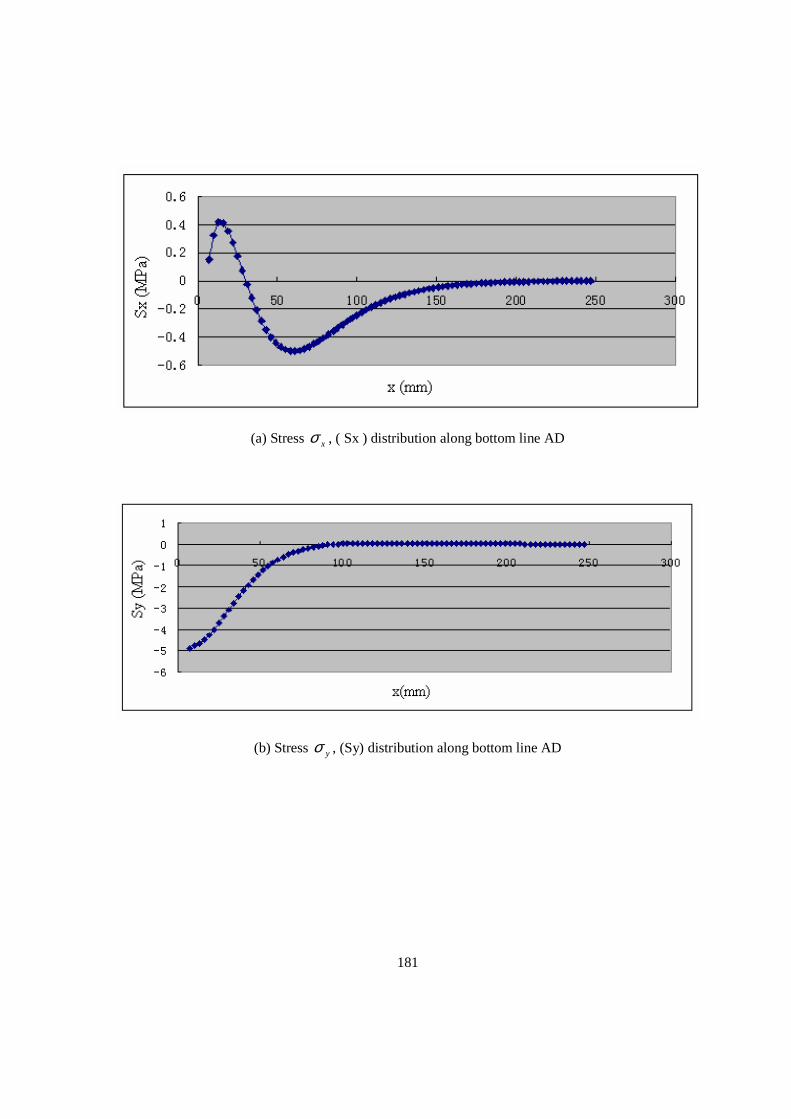
181
(a) Stress xσ , ( Sx ) distribution along bottom line AD
(b) Stress yσ , (Sy) distribution along bottom line AD
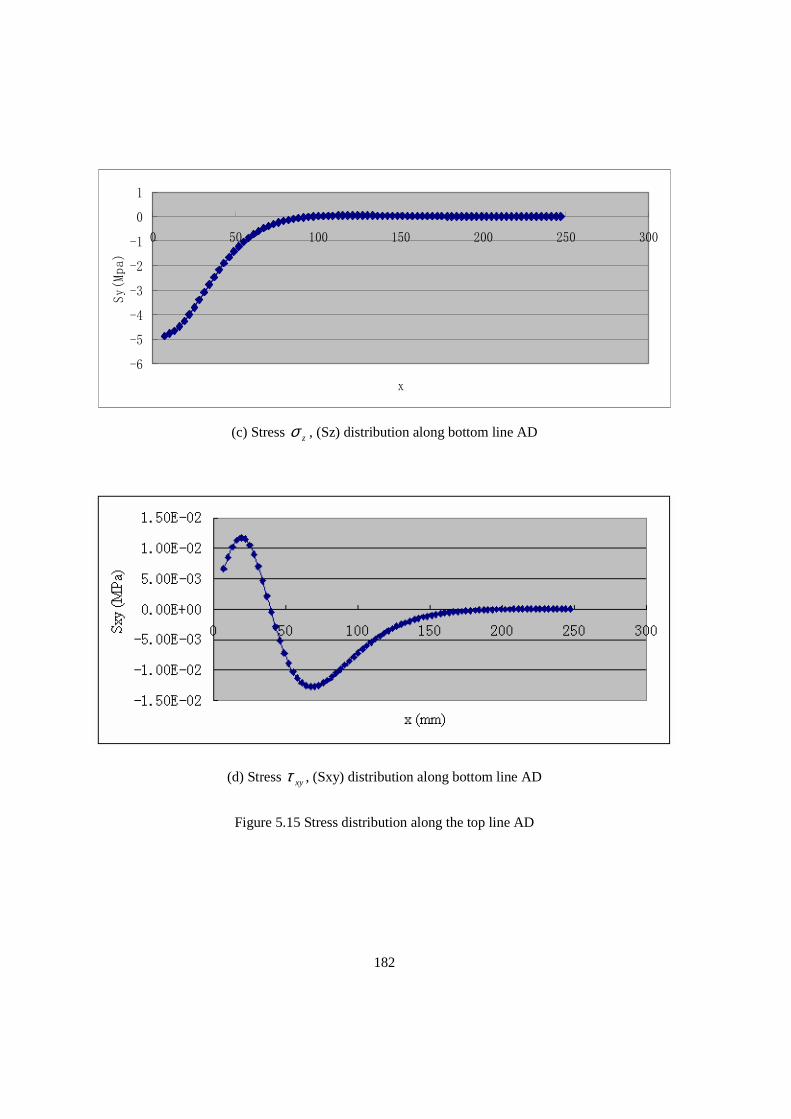
182
-6
-5
-4
-3
-2
-1
0
1
0 50 100 150 200 250 300
x
Sy(Mpa)
(c) Stress zσ , (Sz) distribution along bottom line AD
(d) Stress xyτ , (Sxy) distribution along bottom line AD
Figure 5.15 Stress distribution along the top line AD
183
5.2 Design of Steel Shear Bolts for Concrete Flat S lab Strengthening
This section describes the design of the flat concrete slab strengthened with steel shear bolts,
including the strength of the concrete slab and layout of the shear bolts in the slab.
5.2.1 Strength of the Retrofitted Slab
The punching shear strength of the slab strengthened with shear bolts can be calculated using similar
equations and provisions of CSA A23.3-04 for headed shear studs. However, the critical section area
is reduced due to drilled holes along the perimeter of the critical section. Thus the effective critical
section perimeter length '0b is equal to ( 00 * dnb − ), where 0b is the critical section ( 2/d from
column perimeter) length. n is the number of holes drilled along critical section perimeter. 0d is the
diameter of the drilled holes.
In design, the shear bolt tension capacity (along bolt stem) can be taken as the smaller of the
following three cases:
(1) The yielding force ( tF ) of the bolt stem at the root of thread grooves,
nyvt AfF *= (5-32)
where yvf is the yield (tension) strength of the shear bolts, nA is the section area of the bolt stem
excluding threads.
(2) The yield shear force (1sF ) by threads on the bolt stem.
(3) The yield shear force ( 2sF ) by threads on the nut.
Case (2) and case (3) can be considered together. According to Barrett’s “Fastener Design Manual”
(1990), the pullout load P of the bolt against the nut can be calculated using the following equation:
3vm Lfd
Pπ
= (5-33)
where md is the pitch diameter of the threads, L is the length of thread engagement, vf is the smaller
shear strength (stress) of the two materials of the bolt and nut.
Consequently, the punching shear strength rv (stress) of the retrofitted slab is
184
r c sv v v= + (5-34)
where cv is the factored shear resistance from concrete, sv is the factored shear resistance from shear
reinforcements.
sb
nFv bs
s '0
φ= (5-35)
where 85.0=sφ is reduction factor of steel strength. n is the number of shear bolts in a periphery
row parallel to column perimeter. bF is the smaller result of equation (5-32) and (5-33). s is the
radial spacing of the shear reinforcement. '0b is the effective critical section perimeter length. Shear
resistance from concrete in the shear reinforced zone is:
'28.0 ccc fv λφ=
Maximum shear resistance of section with shear reinforcement should satisfy the following equation:
'max 75.0 ccr fv λφ≤
Seismic requirements of the concrete slabs strengthened with shear bolts can follow CSA 23.3-04
(Clause 21.12.3), i.e. equation (2-47) and (2-51) in Chapter 2, but effective critical section and shear
strength of bolt threads are necessary to be used.
5.2.2 Shear Bolt Layout in the Flat Concrete Slab
Shear bolts layout requires determination of a radial pattern or an orthogonal pattern in the concrete
slab. This section compares the two patterns and discusses the number of bolt rows and spacing
between the bolts in radial and tangential direction. Radial direction is defined as away from the
column ( 10 ,SS in Figure 5.16). Tangential direction is along the perimeters of shear bolts and
parallel to the column sides (2S in Figure 5.16).
5.2.2.1 Comparison of Radial and Orthogonal Layout Patterns of Shear Bolts
As described in section 4.3.2, for slab without openings, the slab (SW9) strengthened with radial bolts
layout pattern showed close capacity and ductility to that of the slab (SW4) with orthogonal bolt
pattern. For slab with openings, the slab (SW8) with radial bolts showed some moment capacity
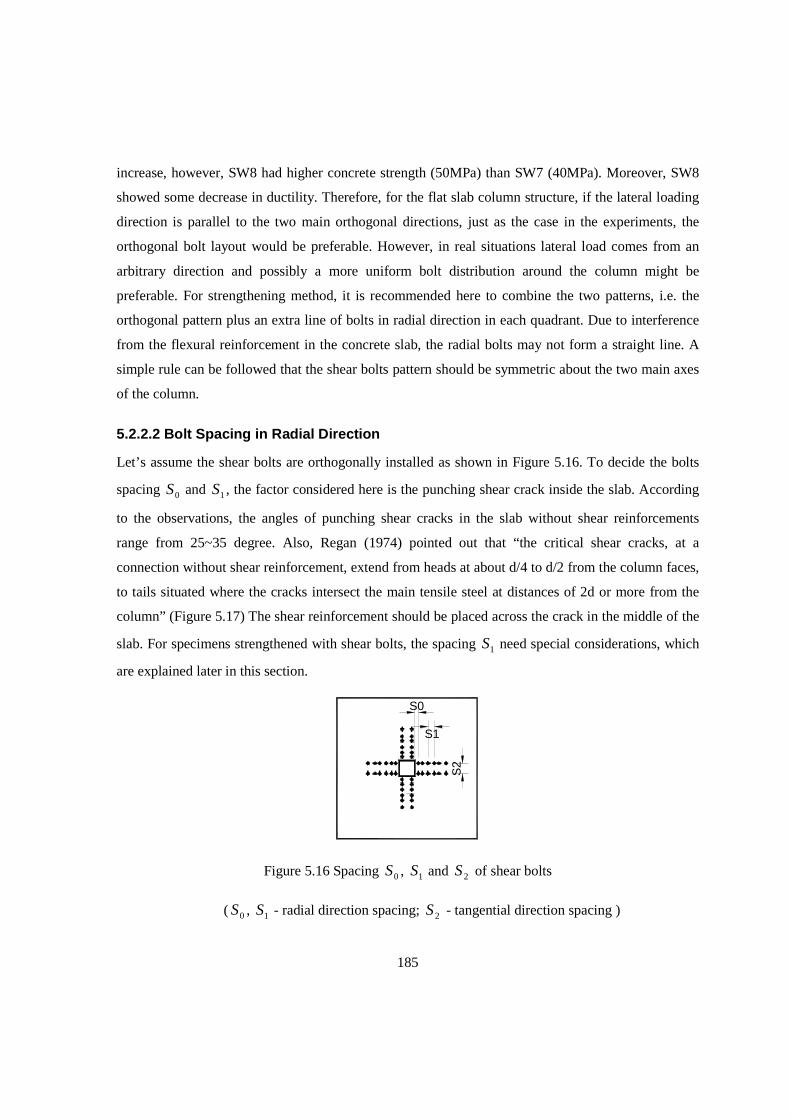
185
increase, however, SW8 had higher concrete strength (50MPa) than SW7 (40MPa). Moreover, SW8
showed some decrease in ductility. Therefore, for the flat slab column structure, if the lateral loading
direction is parallel to the two main orthogonal directions, just as the case in the experiments, the
orthogonal bolt layout would be preferable. However, in real situations lateral load comes from an
arbitrary direction and possibly a more uniform bolt distribution around the column might be
preferable. For strengthening method, it is recommended here to combine the two patterns, i.e. the
orthogonal pattern plus an extra line of bolts in radial direction in each quadrant. Due to interference
from the flexural reinforcement in the concrete slab, the radial bolts may not form a straight line. A
simple rule can be followed that the shear bolts pattern should be symmetric about the two main axes
of the column.
5.2.2.2 Bolt Spacing in Radial Direction
Let’s assume the shear bolts are orthogonally installed as shown in Figure 5.16. To decide the bolts
spacing 0S and 1S , the factor considered here is the punching shear crack inside the slab. According
to the observations, the angles of punching shear cracks in the slab without shear reinforcements
range from 25~35 degree. Also, Regan (1974) pointed out that “the critical shear cracks, at a
connection without shear reinforcement, extend from heads at about d/4 to d/2 from the column faces,
to tails situated where the cracks intersect the main tensile steel at distances of 2d or more from the
column” (Figure 5.17) The shear reinforcement should be placed across the crack in the middle of the
slab. For specimens strengthened with shear bolts, the spacing 1S need special considerations, which
are explained later in this section.
S0
S1
S2
Figure 5.16 Spacing 0S , 1S and 2S of shear bolts
( 0S , 1S - radial direction spacing; 2S - tangential direction spacing )
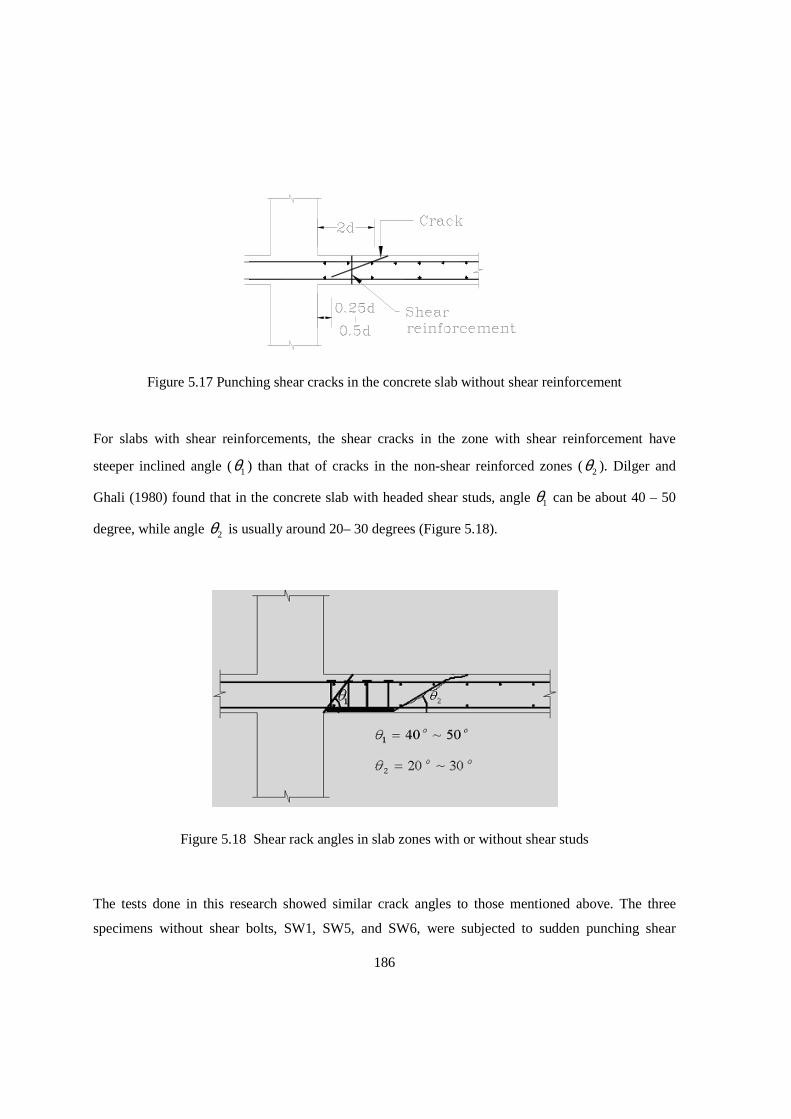
186
Figure 5.17 Punching shear cracks in the concrete slab without shear reinforcement
For slabs with shear reinforcements, the shear cracks in the zone with shear reinforcement have
steeper inclined angle (1θ ) than that of cracks in the non-shear reinforced zones ( 2θ ). Dilger and
Ghali (1980) found that in the concrete slab with headed shear studs, angle 1θ can be about 40 – 50
degree, while angle 2θ is usually around 20– 30 degrees (Figure 5.18).
Figure 5.18 Shear rack angles in slab zones with or without shear studs
The tests done in this research showed similar crack angles to those mentioned above. The three
specimens without shear bolts, SW1, SW5, and SW6, were subjected to sudden punching shear
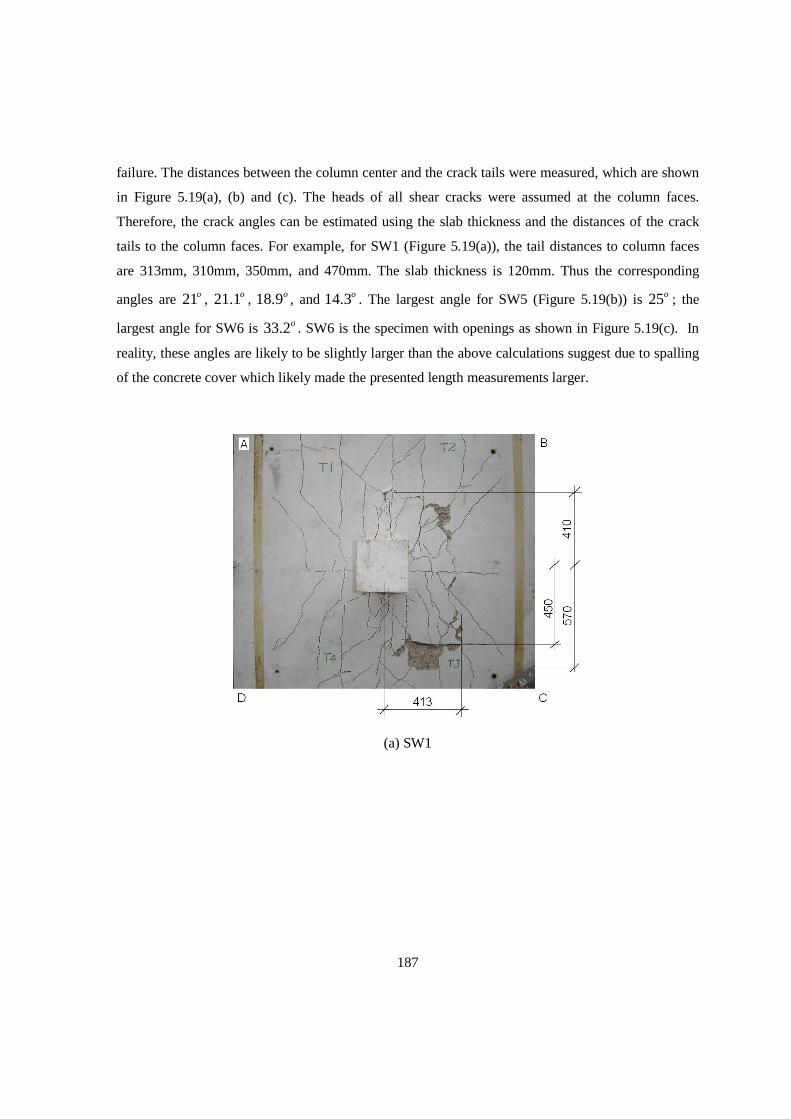
187
failure. The distances between the column center and the crack tails were measured, which are shown
in Figure 5.19(a), (b) and (c). The heads of all shear cracks were assumed at the column faces.
Therefore, the crack angles can be estimated using the slab thickness and the distances of the crack
tails to the column faces. For example, for SW1 (Figure 5.19(a)), the tail distances to column faces
are 313mm, 310mm, 350mm, and 470mm. The slab thickness is 120mm. Thus the corresponding
angles are 21o , 21.1o , 18.9o , and 14.3o . The largest angle for SW5 (Figure 5.19(b)) is 25o ; the
largest angle for SW6 is 33.2o . SW6 is the specimen with openings as shown in Figure 5.19(c). In
reality, these angles are likely to be slightly larger than the above calculations suggest due to spalling
of the concrete cover which likely made the presented length measurements larger.
(a) SW1
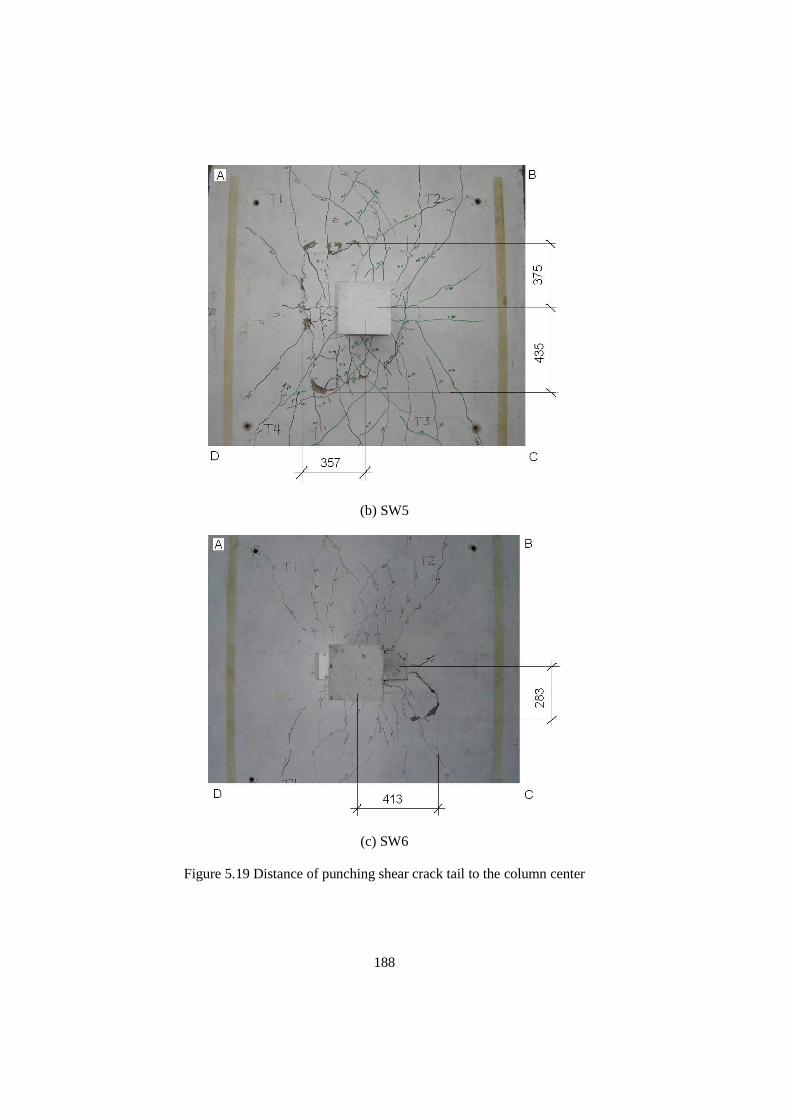
188
(b) SW5
(c) SW6
Figure 5.19 Distance of punching shear crack tail to the column center
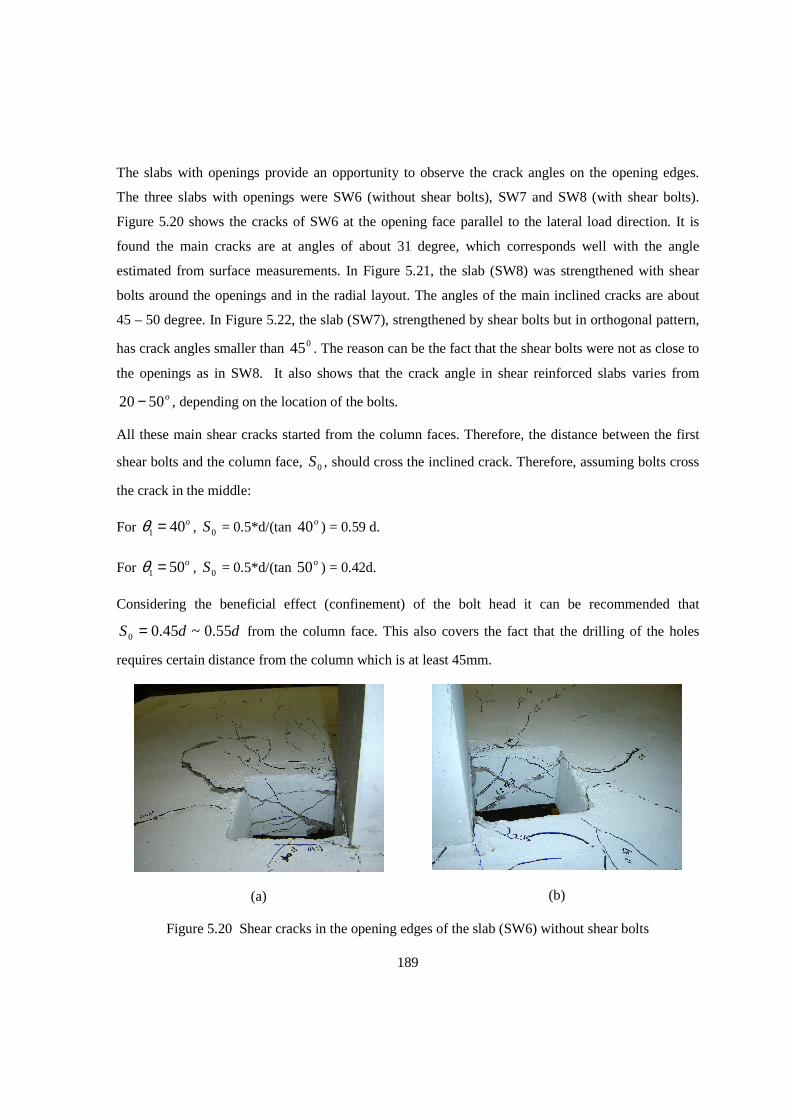
189
The slabs with openings provide an opportunity to observe the crack angles on the opening edges.
The three slabs with openings were SW6 (without shear bolts), SW7 and SW8 (with shear bolts).
Figure 5.20 shows the cracks of SW6 at the opening face parallel to the lateral load direction. It is
found the main cracks are at angles of about 31 degree, which corresponds well with the angle
estimated from surface measurements. In Figure 5.21, the slab (SW8) was strengthened with shear
bolts around the openings and in the radial layout. The angles of the main inclined cracks are about
45 – 50 degree. In Figure 5.22, the slab (SW7), strengthened by shear bolts but in orthogonal pattern,
has crack angles smaller than 045 . The reason can be the fact that the shear bolts were not as close to
the openings as in SW8. It also shows that the crack angle in shear reinforced slabs varies from
o5020− , depending on the location of the bolts.
All these main shear cracks started from the column faces. Therefore, the distance between the first
shear bolts and the column face, 0S , should cross the inclined crack. Therefore, assuming bolts cross
the crack in the middle:
For 1 40oθ = , 0S = 0.5*d/(tan o40 ) = 0.59 d.
For 1 50oθ = , 0S = 0.5*d/(tan o50 ) = 0.42d.
Considering the beneficial effect (confinement) of the bolt head it can be recommended that
ddS 55.0~45.00 = from the column face. This also covers the fact that the drilling of the holes
requires certain distance from the column which is at least 45mm.
(a)
(b)
Figure 5.20 Shear cracks in the opening edges of the slab (SW6) without shear bolts
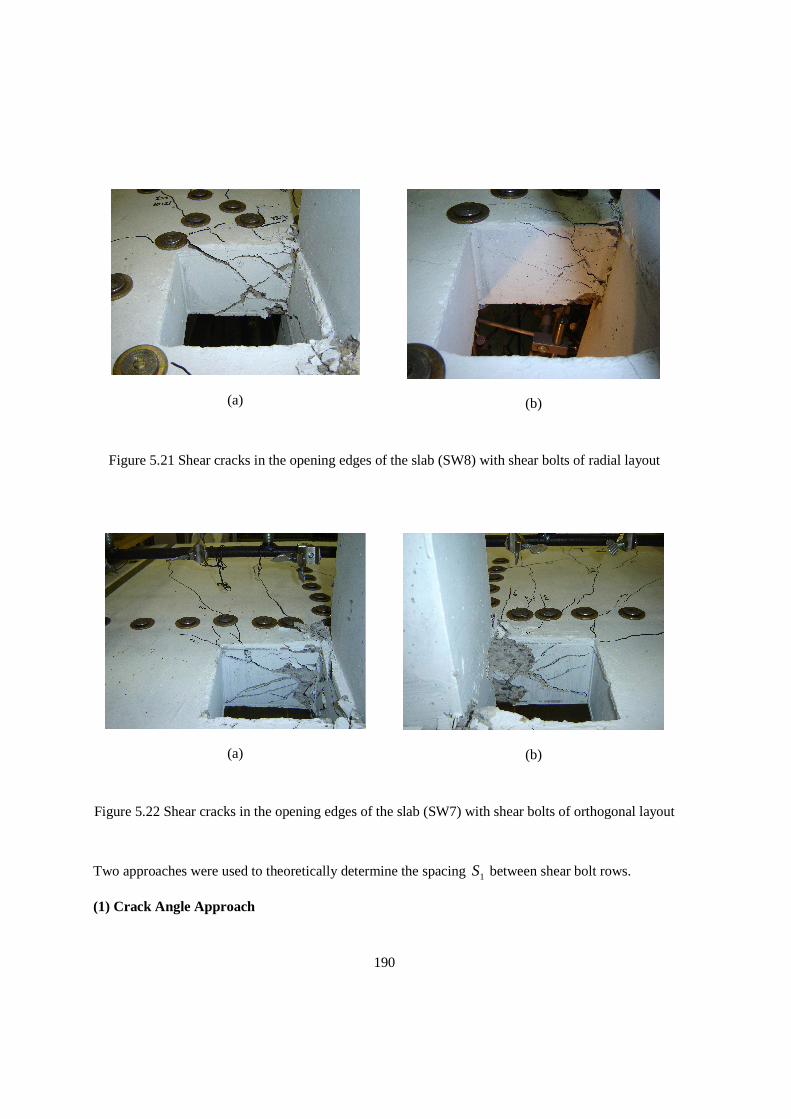
190
(a)
(b)
Figure 5.21 Shear cracks in the opening edges of the slab (SW8) with shear bolts of radial layout
(a)
(b)
Figure 5.22 Shear cracks in the opening edges of the slab (SW7) with shear bolts of orthogonal layout
Two approaches were used to theoretically determine the spacing 1S between shear bolt rows.
(1) Crack Angle Approach
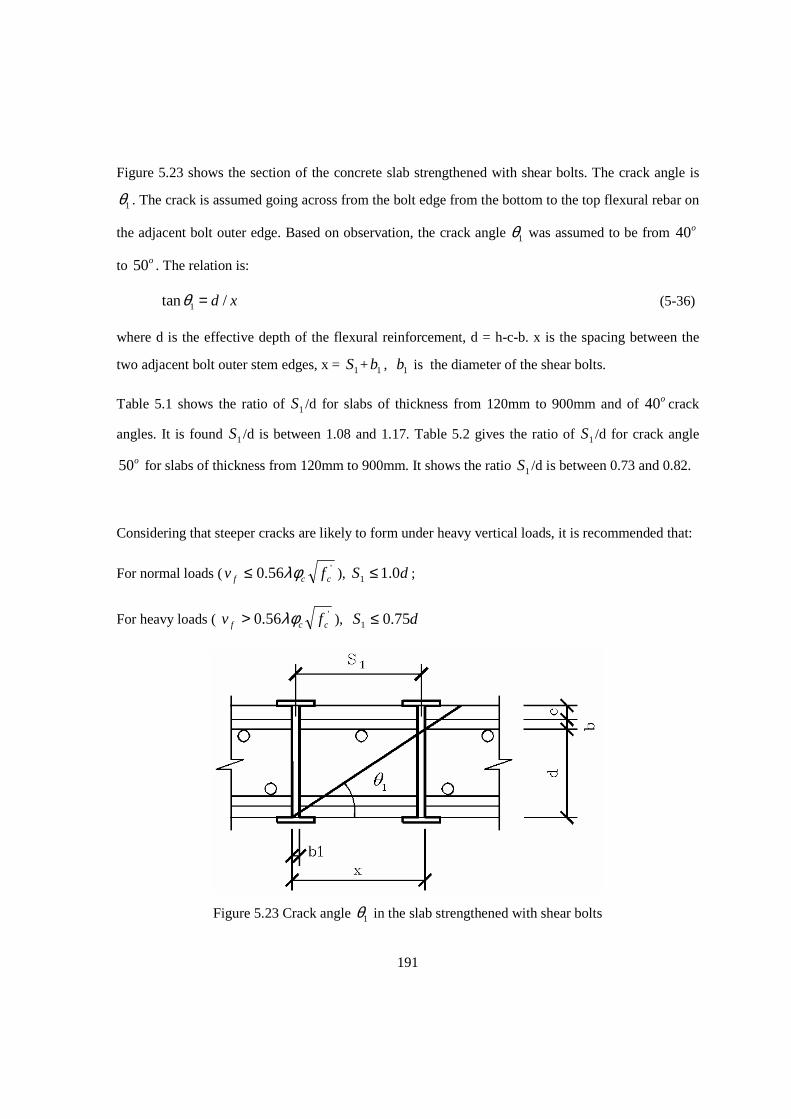
191
Figure 5.23 shows the section of the concrete slab strengthened with shear bolts. The crack angle is
1θ . The crack is assumed going across from the bolt edge from the bottom to the top flexural rebar on
the adjacent bolt outer edge. Based on observation, the crack angle 1θ was assumed to be from 40o
to 50o . The relation is:
1tan /d xθ = (5-36)
where d is the effective depth of the flexural reinforcement, d = h-c-b. x is the spacing between the
two adjacent bolt outer stem edges, x = 1S + 1b , 1b is the diameter of the shear bolts.
Table 5.1 shows the ratio of 1S /d for slabs of thickness from 120mm to 900mm and of 40o crack
angles. It is found 1S /d is between 1.08 and 1.17. Table 5.2 gives the ratio of 1S /d for crack angle
50o for slabs of thickness from 120mm to 900mm. It shows the ratio 1S /d is between 0.73 and 0.82.
Considering that steeper cracks are likely to form under heavy vertical loads, it is recommended that:
For normal loads ( '56.0 ccf fv λφ≤ ), dS 0.11 ≤ ;
For heavy loads ( '56.0 ccf fv λφ> ), dS 75.01 ≤
Figure 5.23 Crack angle 1θ in the slab strengthened with shear bolts
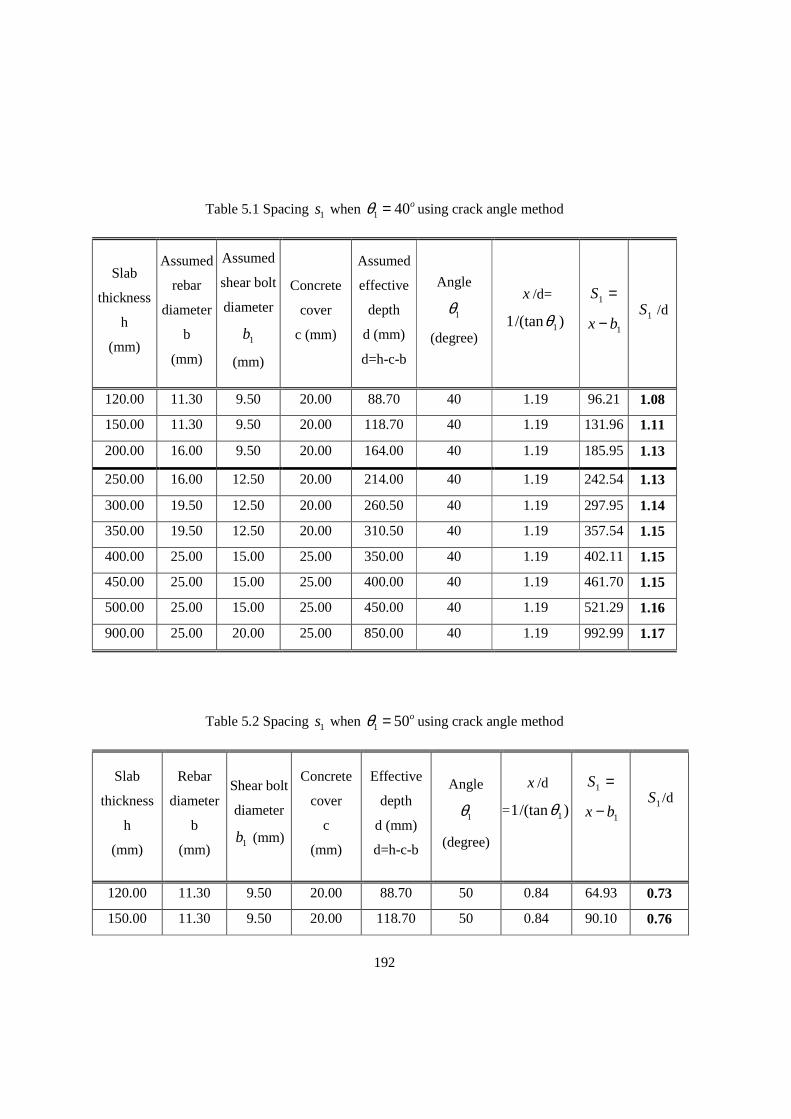
192
Table 5.1 Spacing 1s when 1 40oθ = using crack angle method
Slab
thickness
h
(mm)
Assumed
rebar
diameter
b
(mm)
Assumed
shear bolt
diameter
1b
(mm)
Concrete
cover
c (mm)
Assumed
effective
depth
d (mm)
d=h-c-b
Angle
1θ
(degree)
x /d=
)/(tan1 1θ
=1S
1bx − 1S /d
120.00 11.30 9.50 20.00 88.70 40 1.19 96.21 1.08
150.00 11.30 9.50 20.00 118.70 40 1.19 131.96 1.11
200.00 16.00 9.50 20.00 164.00 40 1.19 185.95 1.13
250.00 16.00 12.50 20.00 214.00 40 1.19 242.54 1.13
300.00 19.50 12.50 20.00 260.50 40 1.19 297.95 1.14
350.00 19.50 12.50 20.00 310.50 40 1.19 357.54 1.15
400.00 25.00 15.00 25.00 350.00 40 1.19 402.11 1.15
450.00 25.00 15.00 25.00 400.00 40 1.19 461.70 1.15
500.00 25.00 15.00 25.00 450.00 40 1.19 521.29 1.16
900.00 25.00 20.00 25.00 850.00 40 1.19 992.99 1.17
Table 5.2 Spacing 1s when 1 50oθ = using crack angle method
Slab
thickness
h
(mm)
Rebar
diameter
b
(mm)
Shear bolt
diameter
1b (mm)
Concrete
cover
c
(mm)
Effective
depth
d (mm)
d=h-c-b
Angle
1θ
(degree)
x /d
= )/(tan1 1θ
=1S
1bx −
1S /d
120.00 11.30 9.50 20.00 88.70 50 0.84 64.93 0.73
150.00 11.30 9.50 20.00 118.70 50 0.84 90.10 0.76
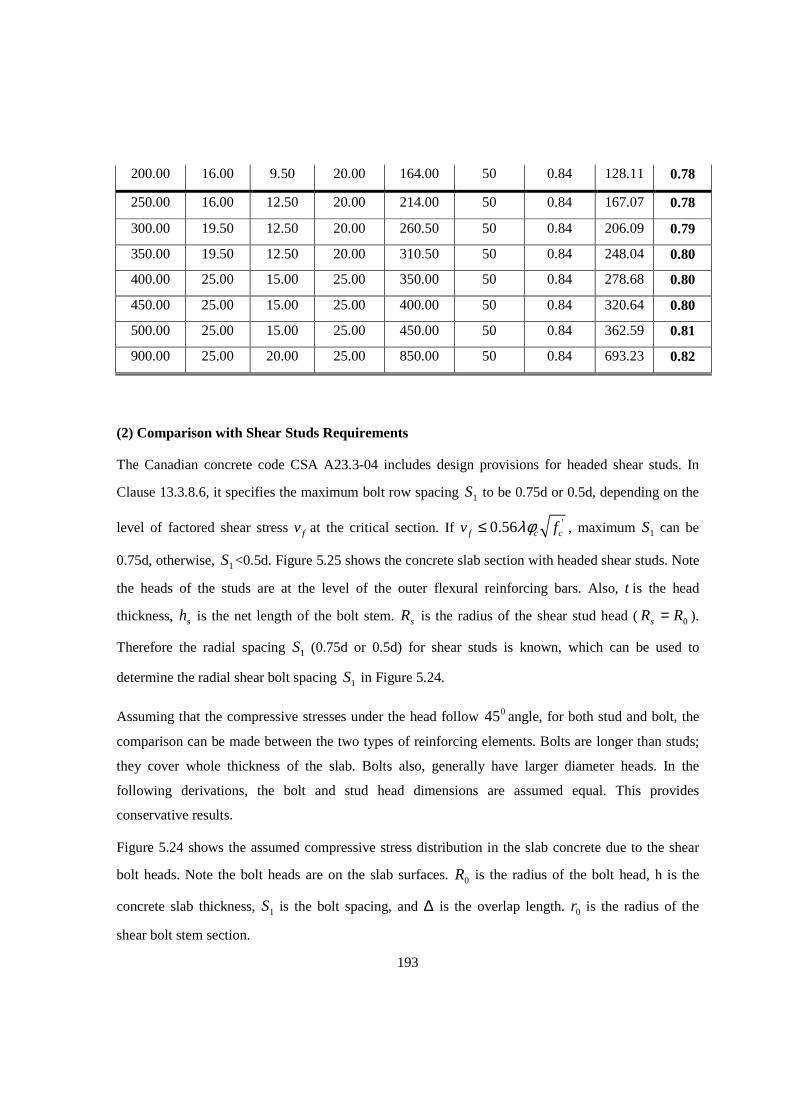
193
200.00 16.00 9.50 20.00 164.00 50 0.84 128.11 0.78
250.00 16.00 12.50 20.00 214.00 50 0.84 167.07 0.78
300.00 19.50 12.50 20.00 260.50 50 0.84 206.09 0.79
350.00 19.50 12.50 20.00 310.50 50 0.84 248.04 0.80
400.00 25.00 15.00 25.00 350.00 50 0.84 278.68 0.80
450.00 25.00 15.00 25.00 400.00 50 0.84 320.64 0.80
500.00 25.00 15.00 25.00 450.00 50 0.84 362.59 0.81
900.00 25.00 20.00 25.00 850.00 50 0.84 693.23 0.82
(2) Comparison with Shear Studs Requirements
The Canadian concrete code CSA A23.3-04 includes design provisions for headed shear studs. In
Clause 13.3.8.6, it specifies the maximum bolt row spacing 1S to be 0.75d or 0.5d, depending on the
level of factored shear stress fv at the critical section. If '0.56f c cv fλφ≤ , maximum 1S can be
0.75d, otherwise, 1S <0.5d. Figure 5.25 shows the concrete slab section with headed shear studs. Note
the heads of the studs are at the level of the outer flexural reinforcing bars. Also, t is the head
thickness, sh is the net length of the bolt stem. sR is the radius of the shear stud head ( 0RRs = ).
Therefore the radial spacing 1S (0.75d or 0.5d) for shear studs is known, which can be used to
determine the radial shear bolt spacing 1S in Figure 5.24.
Assuming that the compressive stresses under the head follow 045 angle, for both stud and bolt, the
comparison can be made between the two types of reinforcing elements. Bolts are longer than studs;
they cover whole thickness of the slab. Bolts also, generally have larger diameter heads. In the
following derivations, the bolt and stud head dimensions are assumed equal. This provides
conservative results.
Figure 5.24 shows the assumed compressive stress distribution in the slab concrete due to the shear
bolt heads. Note the bolt heads are on the slab surfaces. 0R is the radius of the bolt head, h is the
concrete slab thickness, 1S is the bolt spacing, and ∆ is the overlap length. 0r is the radius of the
shear bolt stem section.
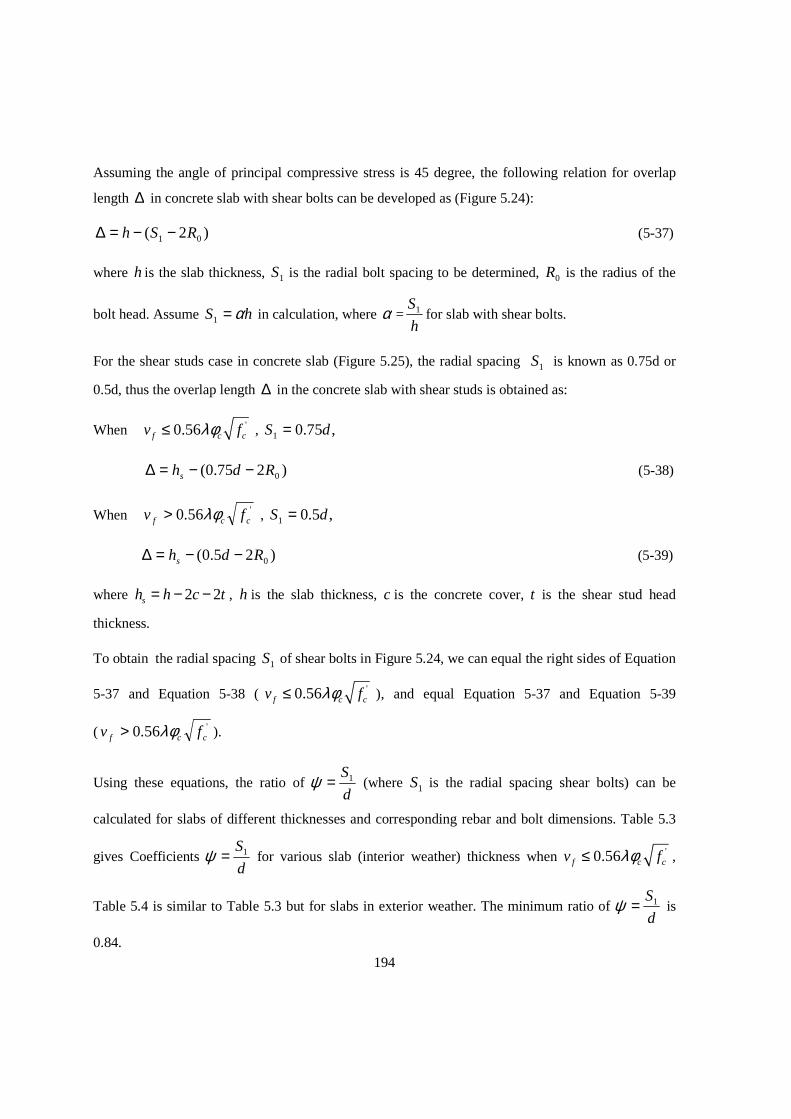
194
Assuming the angle of principal compressive stress is 45 degree, the following relation for overlap
length ∆ in concrete slab with shear bolts can be developed as (Figure 5.24):
)2( 01 RSh −−=∆ (5-37)
where h is the slab thickness, 1S is the radial bolt spacing to be determined, 0R is the radius of the
bolt head. Assume hS α=1 in calculation, where α =h
S1 for slab with shear bolts.
For the shear studs case in concrete slab (Figure 5.25), the radial spacing 1S is known as 0.75d or
0.5d, thus the overlap length ∆ in the concrete slab with shear studs is obtained as:
When '0.56f c cv fλφ≤ , ,75.01 dS =
)275.0( 0Rdhs −−=∆ (5-38)
When '56.0 ccf fv λφ> , ,5.01 dS =
)25.0( 0Rdhs −−=∆ (5-39)
where 2 2sh h c t= − − , h is the slab thickness, c is the concrete cover, t is the shear stud head
thickness.
To obtain the radial spacing 1S of shear bolts in Figure 5.24, we can equal the right sides of Equation
5-37 and Equation 5-38 ( '0.56f c cv fλφ≤ ), and equal Equation 5-37 and Equation 5-39
( '56.0 ccf fv λφ> ).
Using these equations, the ratio of d
S1=ψ (where 1S is the radial spacing shear bolts) can be
calculated for slabs of different thicknesses and corresponding rebar and bolt dimensions. Table 5.3
gives Coefficients d
S1=ψ for various slab (interior weather) thickness when '0.56f c cv fλφ≤ ,
Table 5.4 is similar to Table 5.3 but for slabs in exterior weather. The minimum ratio of d
S1=ψ is
0.84.
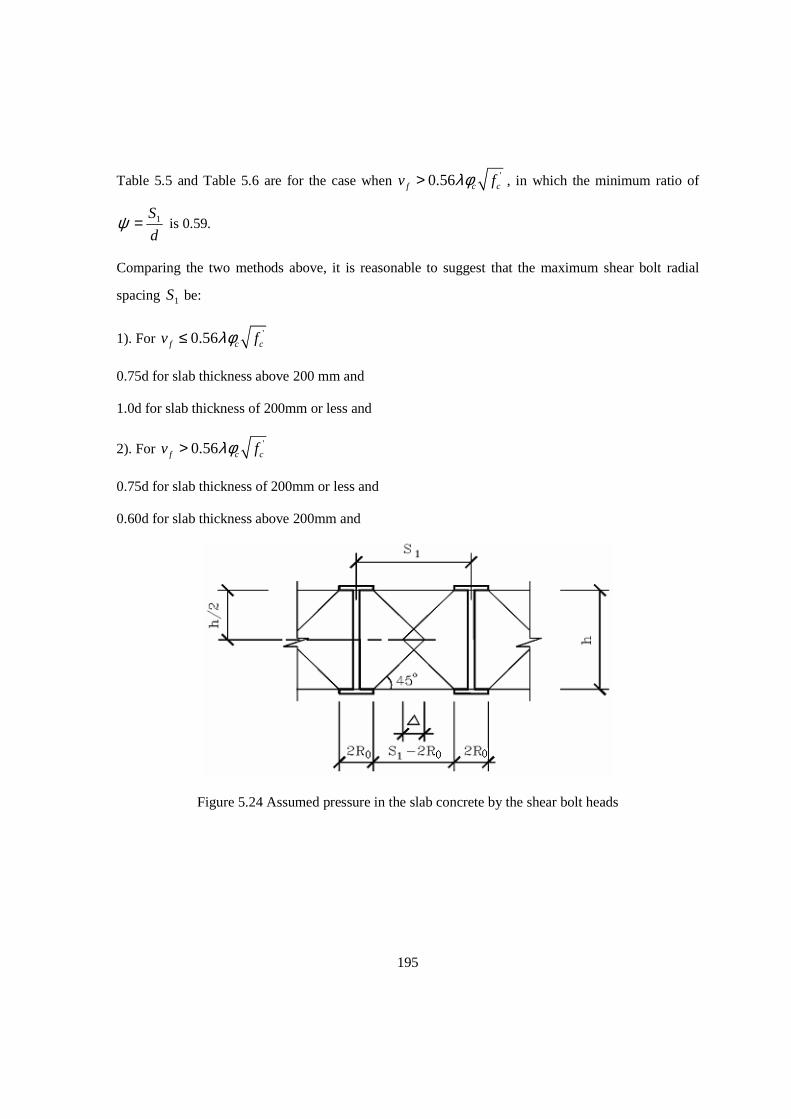
195
Table 5.5 and Table 5.6 are for the case when '0.56f c cv fλφ> , in which the minimum ratio of
d
S1=ψ is 0.59.
Comparing the two methods above, it is reasonable to suggest that the maximum shear bolt radial
spacing 1S be:
1). For '0.56f c cv fλφ≤
0.75d for slab thickness above 200 mm and
1.0d for slab thickness of 200mm or less and
2). For '0.56f c cv fλφ>
0.75d for slab thickness of 200mm or less and
0.60d for slab thickness above 200mm and
Figure 5.24 Assumed pressure in the slab concrete by the shear bolt heads

196
Figure 5.25 Spacing 1S =0.75d (or 0.5d) for Headed shear studs by CSA A23.3-04
Table 5.3 Coefficients d
S1=ψ for various slab (interior weather) thickness, '0.56f c cv fλφ≤
Slab
thickness
h
(mm)
Assumed
rebar
diameter
b
(mm)
Concrete
cover for
interior
weather
c (mm)
Bolt /
stud head
thickness
t
(mm)
Effective
depth
d
(mm)
d=h-c-b
Net stem
length of
studs
sh (mm)
sh =h-2c-2t
d/h
sh /h
( sh -
0.75d)/h α =
h
S1 d
S1=ψ
120.00 11.30 20.00 3.00 88.70 74.00 0.74 0.62 0.06 0.94 1.27
150.00 11.30 20.00 3.00 118.70 104.00 0.79 0.69 0.10 0.90 1.14
200.00 16.00 20.00 4.00 164.00 152.00 0.82 0.76 0.15 0.86 1.04
250.00 16.00 20.00 4.00 214.00 202.00 0.86 0.81 0.17 0.83 0.97
300.00 19.50 20.00 5.00 260.50 250.00 0.87 0.83 0.18 0.82 0.94
350.00 19.50 20.00 5.00 310.50 300.00 0.89 0.86 0.19 0.81 0.91
400.00 25.00 25.00 5.00 350.00 340.00 0.88 0.85 0.19 0.81 0.92
450.00 25.00 25.00 6.00 400.00 388.00 0.89 0.86 0.20 0.80 0.91
500.00 25.00 25.00 6.00 450.00 438.00 0.90 0.88 0.20 0.80 0.89
900.00 25.00 25.00 13.00 850.00 824.00 0.94 0.92 0.21 0.79 0.84
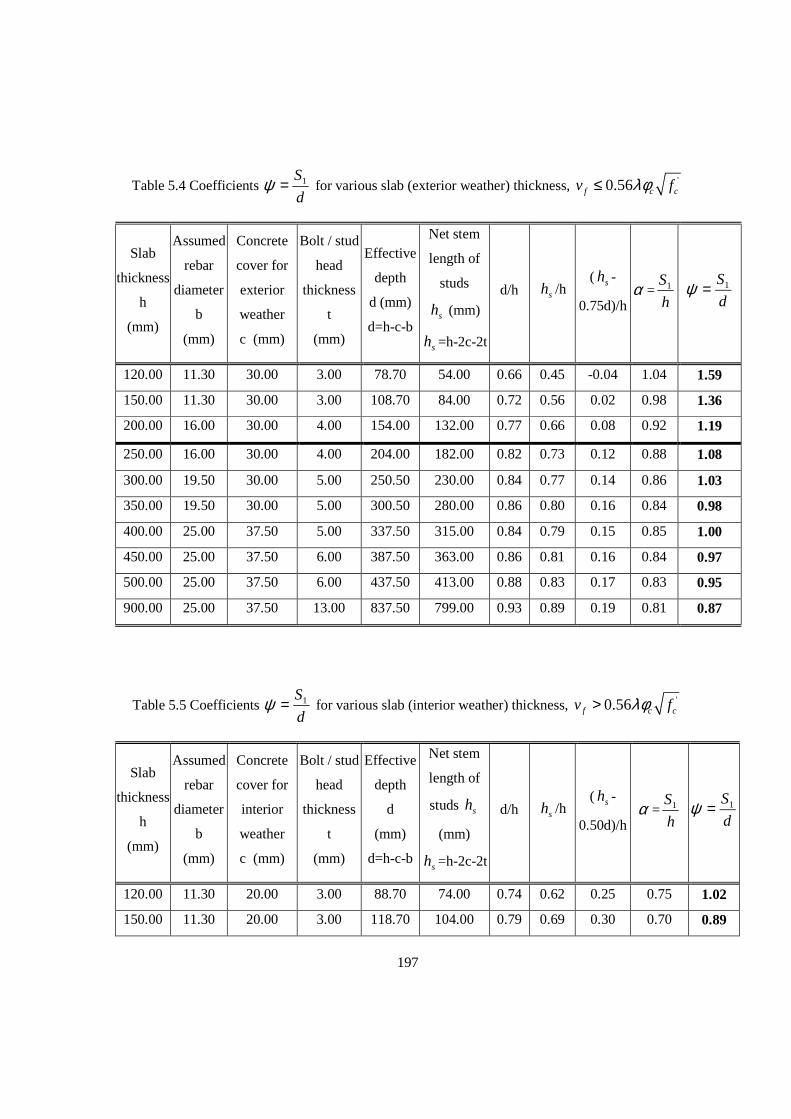
197
Table 5.4 Coefficients d
S1=ψ for various slab (exterior weather) thickness, '0.56f c cv fλφ≤
Slab
thickness
h
(mm)
Assumed
rebar
diameter
b
(mm)
Concrete
cover for
exterior
weather
c (mm)
Bolt / stud
head
thickness
t
(mm)
Effective
depth
d (mm)
d=h-c-b
Net stem
length of
studs
sh (mm)
sh =h-2c-2t
d/h sh /h ( sh -
0.75d)/h α =
h
S1 d
S1=ψ
120.00 11.30 30.00 3.00 78.70 54.00 0.66 0.45 -0.04 1.04 1.59
150.00 11.30 30.00 3.00 108.70 84.00 0.72 0.56 0.02 0.98 1.36
200.00 16.00 30.00 4.00 154.00 132.00 0.77 0.66 0.08 0.92 1.19
250.00 16.00 30.00 4.00 204.00 182.00 0.82 0.73 0.12 0.88 1.08
300.00 19.50 30.00 5.00 250.50 230.00 0.84 0.77 0.14 0.86 1.03
350.00 19.50 30.00 5.00 300.50 280.00 0.86 0.80 0.16 0.84 0.98
400.00 25.00 37.50 5.00 337.50 315.00 0.84 0.79 0.15 0.85 1.00
450.00 25.00 37.50 6.00 387.50 363.00 0.86 0.81 0.16 0.84 0.97
500.00 25.00 37.50 6.00 437.50 413.00 0.88 0.83 0.17 0.83 0.95
900.00 25.00 37.50 13.00 837.50 799.00 0.93 0.89 0.19 0.81 0.87
Table 5.5 Coefficients d
S1=ψ for various slab (interior weather) thickness, '0.56f c cv fλφ>
Slab
thickness
h
(mm)
Assumed
rebar
diameter
b
(mm)
Concrete
cover for
interior
weather
c (mm)
Bolt / stud
head
thickness
t
(mm)
Effective
depth
d
(mm)
d=h-c-b
Net stem
length of
studs sh
(mm)
sh =h-2c-2t
d/h sh /h ( sh -
0.50d)/h α =
h
S1 d
S1=ψ
120.00 11.30 20.00 3.00 88.70 74.00 0.74 0.62 0.25 0.75 1.02
150.00 11.30 20.00 3.00 118.70 104.00 0.79 0.69 0.30 0.70 0.89
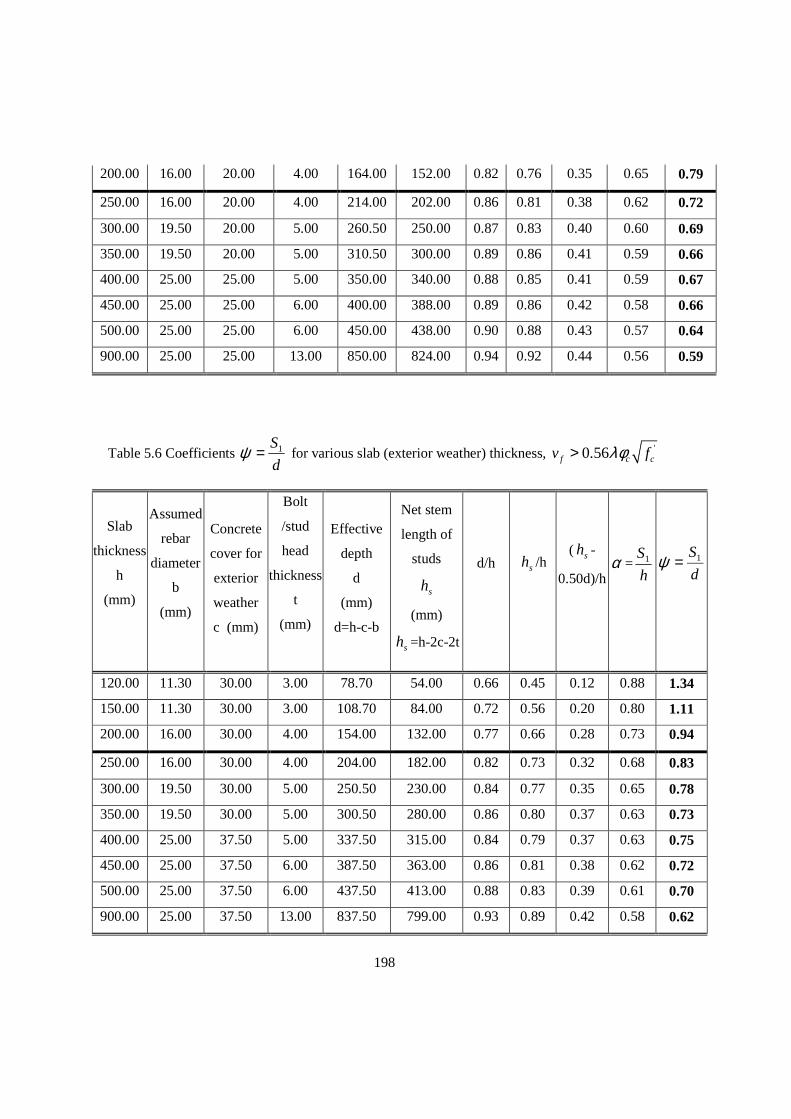
198
200.00 16.00 20.00 4.00 164.00 152.00 0.82 0.76 0.35 0.65 0.79
250.00 16.00 20.00 4.00 214.00 202.00 0.86 0.81 0.38 0.62 0.72
300.00 19.50 20.00 5.00 260.50 250.00 0.87 0.83 0.40 0.60 0.69
350.00 19.50 20.00 5.00 310.50 300.00 0.89 0.86 0.41 0.59 0.66
400.00 25.00 25.00 5.00 350.00 340.00 0.88 0.85 0.41 0.59 0.67
450.00 25.00 25.00 6.00 400.00 388.00 0.89 0.86 0.42 0.58 0.66
500.00 25.00 25.00 6.00 450.00 438.00 0.90 0.88 0.43 0.57 0.64
900.00 25.00 25.00 13.00 850.00 824.00 0.94 0.92 0.44 0.56 0.59
Table 5.6 Coefficients d
S1=ψ for various slab (exterior weather) thickness, '0.56f c cv fλφ>
Slab
thickness
h
(mm)
Assumed
rebar
diameter
b
(mm)
Concrete
cover for
exterior
weather
c (mm)
Bolt
/stud
head
thickness
t
(mm)
Effective
depth
d
(mm)
d=h-c-b
Net stem
length of
studs
sh
(mm)
sh =h-2c-2t
d/h
sh /h
( sh -
0.50d)/h
α =h
S1
d
S1=ψ
120.00 11.30 30.00 3.00 78.70 54.00 0.66 0.45 0.12 0.88 1.34
150.00 11.30 30.00 3.00 108.70 84.00 0.72 0.56 0.20 0.80 1.11
200.00 16.00 30.00 4.00 154.00 132.00 0.77 0.66 0.28 0.73 0.94
250.00 16.00 30.00 4.00 204.00 182.00 0.82 0.73 0.32 0.68 0.83
300.00 19.50 30.00 5.00 250.50 230.00 0.84 0.77 0.35 0.65 0.78
350.00 19.50 30.00 5.00 300.50 280.00 0.86 0.80 0.37 0.63 0.73
400.00 25.00 37.50 5.00 337.50 315.00 0.84 0.79 0.37 0.63 0.75
450.00 25.00 37.50 6.00 387.50 363.00 0.86 0.81 0.38 0.62 0.72
500.00 25.00 37.50 6.00 437.50 413.00 0.88 0.83 0.39 0.61 0.70
900.00 25.00 37.50 13.00 837.50 799.00 0.93 0.89 0.42 0.58 0.62
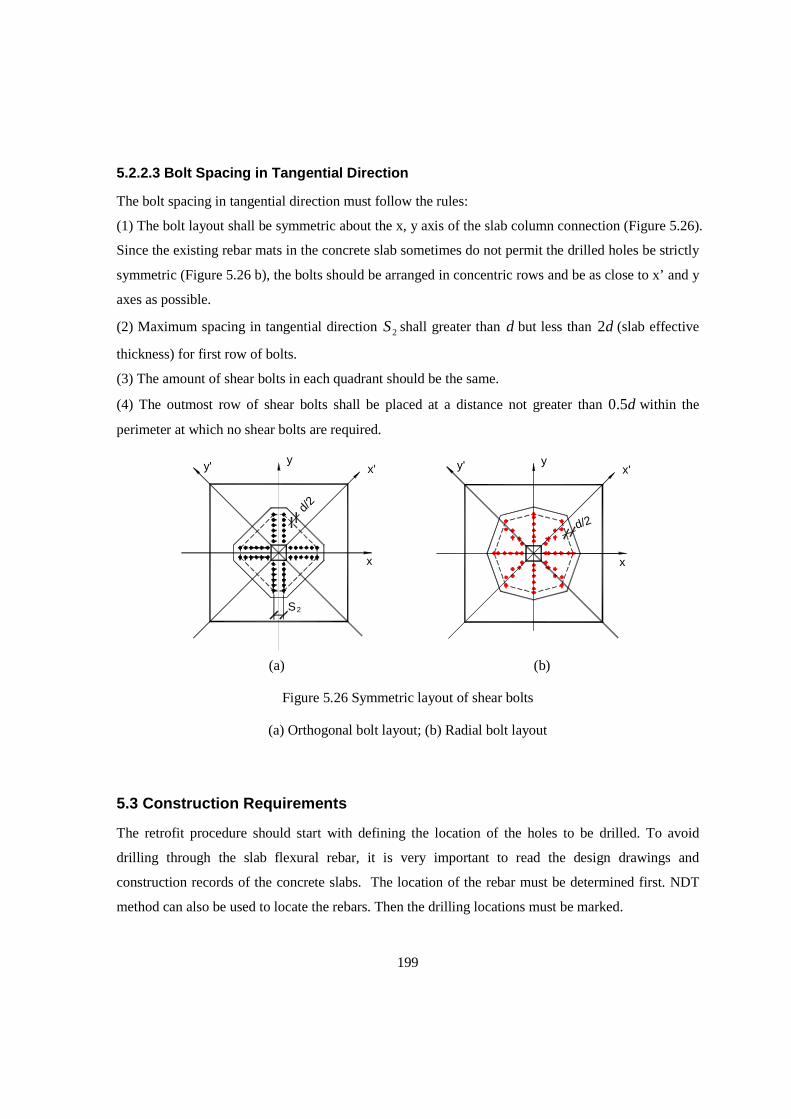
199
5.2.2.3 Bolt Spacing in Tangential Direction
The bolt spacing in tangential direction must follow the rules:
(1) The bolt layout shall be symmetric about the x, y axis of the slab column connection (Figure 5.26).
Since the existing rebar mats in the concrete slab sometimes do not permit the drilled holes be strictly
symmetric (Figure 5.26 b), the bolts should be arranged in concentric rows and be as close to x’ and y
axes as possible.
(2) Maximum spacing in tangential direction 2S shall greater than d but less than d2 (slab effective
thickness) for first row of bolts.
(3) The amount of shear bolts in each quadrant should be the same.
(4) The outmost row of shear bolts shall be placed at a distance not greater than d5.0 within the
perimeter at which no shear bolts are required.
S
y' x'
x
y
2
x
x'y' y
d/2
d/2
(a) (b)
Figure 5.26 Symmetric layout of shear bolts
(a) Orthogonal bolt layout; (b) Radial bolt layout
5.3 Construction Requirements
The retrofit procedure should start with defining the location of the holes to be drilled. To avoid
drilling through the slab flexural rebar, it is very important to read the design drawings and
construction records of the concrete slabs. The location of the rebar must be determined first. NDT
method can also be used to locate the rebars. Then the drilling locations must be marked.
200
If the drill bit hits the rebar, drilling should be stopped. The neighboring location should be used
instead. The unsuccessful holes should be patched using high strength expoxy cement, such as
Sikadur 30 components.
Before drilling, it is important to check the capacity of the slabs with the holes. Two options are
possible for installation sequence:
Shore the flat slab on the bottom, remove the live and removable gravity load on the floor. The
shoring has two advantages: prevent slab punching shear failure and protect the bottom concrete
cover from ripping off by the drill bit. Drill all holes and install the shear bolts.
Drill one (or a few) hole at a time. Install the bolts before proceeding to drill another set of holes. This
method ensures that drilling of the holes does not excessively weaken the slab. All live and
removable gravity loads should also be removed from the slabs before retrofitting.
Fire and corrosion protection of bolts need further investigation. However, some recommendations
can be offered. After installation of all shear bolts, the heads of the bolts shall be covered by concrete
paste, to isolate the bolt from corrosion. Alternatively, epoxy or paint can be applied on the shear
bolts and nuts before installation.
201
Chapter 6
Conclusions and Recommendations
This chapter presents the conclusions from the research described in this thesis and recommendations
for further research. The conclusions based on the experimental results are presented first, followed
by the theoretical investigations on design of slabs with shear bolts.
Based on the experimental research on the flat slab-column connections strengthened with steel shear
bolts, it is concluded that steel shear bolts are an effective method for retrofitting slabs in seismic
zones. Proper application of shear bolts to existing reinforced concrete slabs will result in a change of
the failure mode from brittle punching to ductile flexural. Slabs strengthened with shear bolts showed
higher ductility, larger peak load at larger drift ratio, and the capability of undergoing more large drift
cycles than slabs without such shear bolts.
Openings in the concrete slabs decrease the punching shear capacity and ductility rapidly, especially
under lateral displacement loading. Shear bolts are effective in strengthening slabs with openings;
strengthened slabs experienced ductile failures and were able to undergo large deformations.
Experimental results show that there is no significant difference between the effectiveness of radial
and orthogonal layouts of shear bolts (with the same amount of shear bolts). The slabs behaved very
similarly regardless of the shear reinforcing layout. But the slab strengthened with orthogonal bolt
pattern showed slightly higher ductility (defined by Method II). In addition, from the practical point
of view retrofitting in radial pattern can be difficult due to interference from flexural reinforcement.
Design of shear bolts was done based on the elastic solution and finite element analysis. Strength of
shear bolts retrofitted slabs was estimated using same equations as for other shear reinforcing
elements (CSA A23.3 -04). The analysis for spacing of the peripheral row of shear bolts indicates that
their spacing can be slightly increased as compared to the spacing of shear studs.
6.1 Experimental Series I
Based on the results of the first series of experiments (specimens SW1 – SW5), the following detailed
conclusions are drawn:
202
1. Shear bolts are effective in increasing peak lateral load capacity of slab-column connections. For
the tested specimens, for four rows of bolts an increase of 17%~27% was observed, while for
specimens with six rows of shear bolts the peak load increase was 19~44%).
2. Drift ratio at peak load of the slab-column connection can be significantly increased by
installation of shear bolts. The increase of drift ratio at peak loads was raging from 66% up to
123%.
3. By using shear bolts, the drift ductility of the slab-column connection at peak load point and post
peak can be substantially increased ( 26% - 84% increase in ductility defined by Method I, 78% -
258% increase in ductility defined by Method II).
4. The specimen with shear bolts can undergo more lateral drift cycles at large deformation,
showing a significant increase in energy dissipation capacity.
5. Larger ratio of 0V
V (vertical load over nominal punching shear capacity) leads to less energy
dissipation capability of the flat slab column connection.
6. Shear bolts can change failure mode of the flat slab column connections. Slabs properly
retrofitted with shear bolts will exhibit desirable flexural failure while slabs without shear bolts
can be subjected to abrupt punching shear failure.
7. Shear bolts are installed through the slab in the close vicinity of the column face. For bolts farther
away from the column, at a distance between the bolt and column face exceeding about four
times the slabs effective thickness, d, the effect of shear bolts is small. This was shown in the
strain readings on the instrumented bolts.
8. Strains on the bolts normal to the applied lateral displacements were generally larger than the
strain in the direction of loading.
9. Strains on the bolts were small. Only few bolts yielded at very large drifts.
10. Vertical crack width remained in the range of approximately 1 mm until the punching shear
failure.
6.2 Experimental Series II
Based on the results of second series of experiment for specimens (SW6 – SW9), the following
detailed conclusions are obtained:
11. The two openings in the slab, next to the column and located along the direction of the applied
lateral displacement resulted in 30% decrease in lateral load peak capacity and lateral drift ratio
203
decrease of approximately 45% for the two slabs without shear bolts (SW5 and SW6). It should
be noted however, that the openings, in this case, did cut the flexural reinforcement placed along
the moment application at the location of the openings.
12. Similarly, for slabs with same shear bolts (SW4, SW7, and SW8), the two openings in SW7 and
SW8 resulted in a decrease of approximately 40% in peak moment, and 45% in lateral drift at
peak loads.
13. The radial pattern of bolts lead to 2-5% decrease in peak load and a corresponding 10-27%
decrease in lateral drift at peak loads, for specimens without openings (SW4 and SW9). These
differences in peak loads and drift between radial and orthogonal patterns of bolts are very small
and warrant a conclusion that bolt pattern does not influence the response of the slab to
earthquake loads. Possible reason for the slight decrease in loads and displacements is the fact
that in this test configuration, loads were applied exactly along the column sides. Thus the
orthogonal layout of bolts would be a little more effective for this particular loading direction. In
real earthquake situation, the lateral loads would be applied in an arbitrary direction with respect
to the column sides; the radial pattern could prove, in fact, to be slightly more effective then.
14. For slab with openings, radial pattern bolts lead to an increase of 10 – 12% in peak moments but
4 – 6% decrease in lateral drifts at peak loads (SW7 and SW8). Based on these results it is
concluded that the bolts layout also did not have any significant influence on the behaviour of
slabs with openings.
15. The ductilities (defined by Method I) for the specimens with radial and orthogonal bolt layout
were very similar, for both: slabs with and without openings. However, the specimen
strengthened with orthogonal bolt showed higher ductility (defined by Method II).
16. The strengthened slab-column connections with two openings (SW7 and SW8) did not reach the
peak lateral load as high as that of the unstrengthened slab without openings (SW5). However,
shear bolts increased the drift ratios corresponding to peak loads. The shear bolts also enables the
ductile post-peak behaviour of these two slabs with openings allowing large post peak drift ratios
without brittle failure.
17. Specimen with openings strengthened by radial bolt layout showed higher peak lateral load but
same drift ratio increase than specimen with openings strengthened by orthogonal bolt layout.
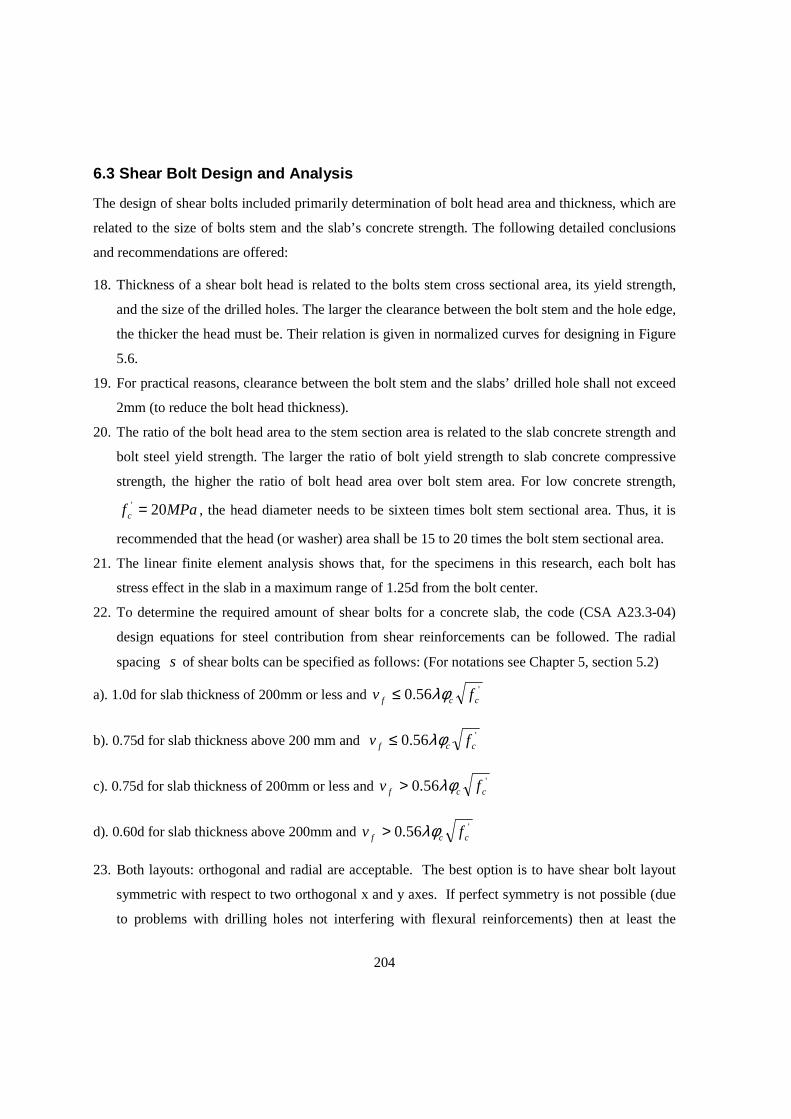
204
6.3 Shear Bolt Design and Analysis
The design of shear bolts included primarily determination of bolt head area and thickness, which are
related to the size of bolts stem and the slab’s concrete strength. The following detailed conclusions
and recommendations are offered:
18. Thickness of a shear bolt head is related to the bolts stem cross sectional area, its yield strength,
and the size of the drilled holes. The larger the clearance between the bolt stem and the hole edge,
the thicker the head must be. Their relation is given in normalized curves for designing in Figure
5.6.
19. For practical reasons, clearance between the bolt stem and the slabs’ drilled hole shall not exceed
2mm (to reduce the bolt head thickness).
20. The ratio of the bolt head area to the stem section area is related to the slab concrete strength and
bolt steel yield strength. The larger the ratio of bolt yield strength to slab concrete compressive
strength, the higher the ratio of bolt head area over bolt stem area. For low concrete strength,
MPaf c 20' = , the head diameter needs to be sixteen times bolt stem sectional area. Thus, it is
recommended that the head (or washer) area shall be 15 to 20 times the bolt stem sectional area.
21. The linear finite element analysis shows that, for the specimens in this research, each bolt has
stress effect in the slab in a maximum range of 1.25d from the bolt center.
22. To determine the required amount of shear bolts for a concrete slab, the code (CSA A23.3-04)
design equations for steel contribution from shear reinforcements can be followed. The radial
spacing s of shear bolts can be specified as follows: (For notations see Chapter 5, section 5.2)
a). 1.0d for slab thickness of 200mm or less and '56.0 ccf fv λφ≤
b). 0.75d for slab thickness above 200 mm and '56.0 ccf fv λφ≤
c). 0.75d for slab thickness of 200mm or less and '56.0 ccf fv λφ>
d). 0.60d for slab thickness above 200mm and '56.0 ccf fv λφ>
23. Both layouts: orthogonal and radial are acceptable. The best option is to have shear bolt layout
symmetric with respect to two orthogonal x and y axes. If perfect symmetry is not possible (due
to problems with drilling holes not interfering with flexural reinforcements) then at least the
205
requirement of same amount of shear reinforcing elements in each quadrant of the slab defined by
x-y axes should be maintained.
24. Before drilling holes in the concrete slab, it is important to remove the live gravity load on the
floor. Installation of shear bolts can be done gradually by drilling few holes only and installing
shear bolts in them before proceeding to drill more holes (and install bolts in them).
25. Protection of shear bolts from corrosion and fire is also important. Polymeric resins or cement
grout can be used to fill the drilled holes. Typical fire protection for steel element should be used.
6.4 Recommendations for Future Research
In the presented test programs, the lateral loading direction was kept constant; along the column sides.
In order to fully understand the influence of the shear bolt layout on the behaviour of retrofitted slabs,
the loading should be applied along both orthogonal axes of the column, which would effectively
result in the lateral loading applied at arbitrary direction with respect to the axes defined by the
column sides.
More research could also be done on the effects of openings on the behaviour of slabs with shear
reinforcements. Openings located on different sides of the column and at a distance from the column
could be researched by testing appropriate specimens.
Work should also be done on the effect of shear bolts on corrosion of flexural steel and the method to
protect the reinforcements from corrosion. Polymeric resins should possibly be injected in the drilled
holes for that purpose.
Experimental programs are expensive and time consuming and, therefore, can only provide limited
amount of data and information about various parameters influencing slab behaviour. Therefore
future research should include nonlinear finite element modeling of the behaviour of these slabs.
Properly calibrated 3-dimensional finite element analysis can be a powerful tool in drawing
conclusions regarding slabs’ and reinforcements’ behaviour and can lead to the development of future
design code formulations. The presented experimental programs will be excellent sources for
calibrating such finite element formulations.
.

206
Appendix A
Abbreviations and Notations
ACI American Concrete Institute
ASCE American Society of Civil Engineers
CEB Comite Euro-international du Beton
CSA Canadian Standard Association
vsA Section area of the shear reinforcement
TstA Section area of flexural reinforcements that is close enough to the column to participate as a
shear strut
barA Area of a single reinforcing bar
swA Section area of shear reinforcements of each periphery row
b Perimeter length of the critical section
1b Width of the critical section side perpendicular to the moment vector
2b Width of the critical section side parallel to the moment vector
0b Perimeter length of the critical section at 2/d from the column face
botb Bottom edge length of the facet
topb Top edge length of the facet
,x yc c Column dimensions
d Effective thickness of a slab
D Dowel force in the reinforcement intersecting with the conical shear crack
DR Maximum story drift ratio
'd Cover of reinforcing mat measuring from center of the mat to the near slab surface
bd Diameter of the rebar
e Distance from the centroid of the critical section to the point where shear stress is calculated
cf Uniaxial concrete strength

207
'cf Concrete compressive strength
ckf Characteristic cylinder compressive strength (28-day), MPa
yf Yield strength of the reinforcement
ywdf Design yield strength of the shear reinforcement
yvf Strength of the shear reinforcement
tf Tensile strength of concrete
h Slab thickness
sh Net length of the bolt stem
effsh , Average effective length of the stud
J Analogous to polar moment of inertia of the shear critical section around the yx, centrioda1
axes, respectively
k Correlation coefficient determined from experiment data
fM Factored unbalanced moment in yx, direction, which is transferred by slab shear and flexural
stresses
negM Flexural capacity of the strip
n Number of shear studs
P Punching shear load on the connection (the applied load at the slab periphery or at the column)
maxP Maximum lateral load
R Radius of drilled hole in the concrete slab for the bolts
0R Shear bolt head radius
1Rκ Force component in the tangential direction of reinforcement cutting across the shear crack
2R Force in radial direction of the reinforcement cutting across the shear crack
3R Force of shear reinforcement (not included in this model)
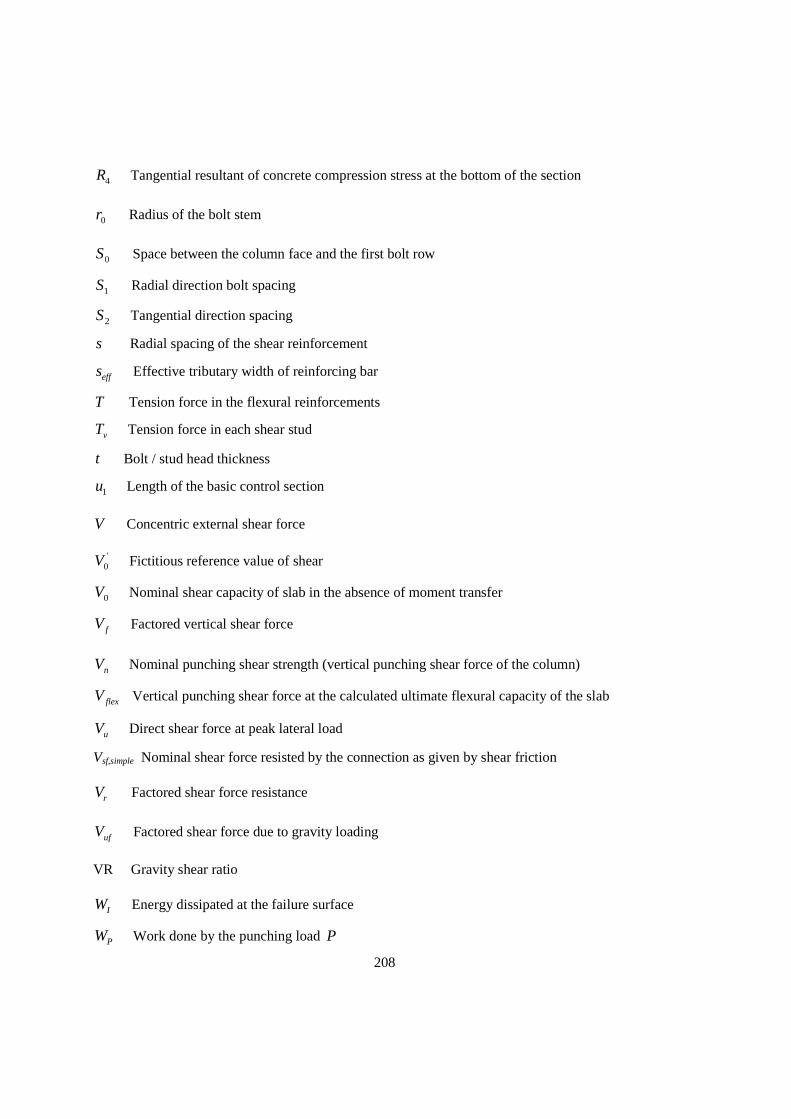
208
4R Tangential resultant of concrete compression stress at the bottom of the section
0r Radius of the bolt stem
0S Space between the column face and the first bolt row
1S Radial direction bolt spacing
2S Tangential direction spacing
s Radial spacing of the shear reinforcement
effs Effective tributary width of reinforcing bar
T Tension force in the flexural reinforcements
vT Tension force in each shear stud
t Bolt / stud head thickness
1u Length of the basic control section
V Concentric external shear force
'0V Fictitious reference value of shear
0V Nominal shear capacity of slab in the absence of moment transfer
fV Factored vertical shear force
nV Nominal punching shear strength (vertical punching shear force of the column)
flexV Vertical punching shear force at the calculated ultimate flexural capacity of the slab
uV Direct shear force at peak lateral load
Vsf,simple Nominal shear force resisted by the connection as given by shear friction
rV Factored shear force resistance
ufV Factored shear force due to gravity loading
VR Gravity shear ratio
IW Energy dissipated at the failure surface
PW Work done by the punching load P
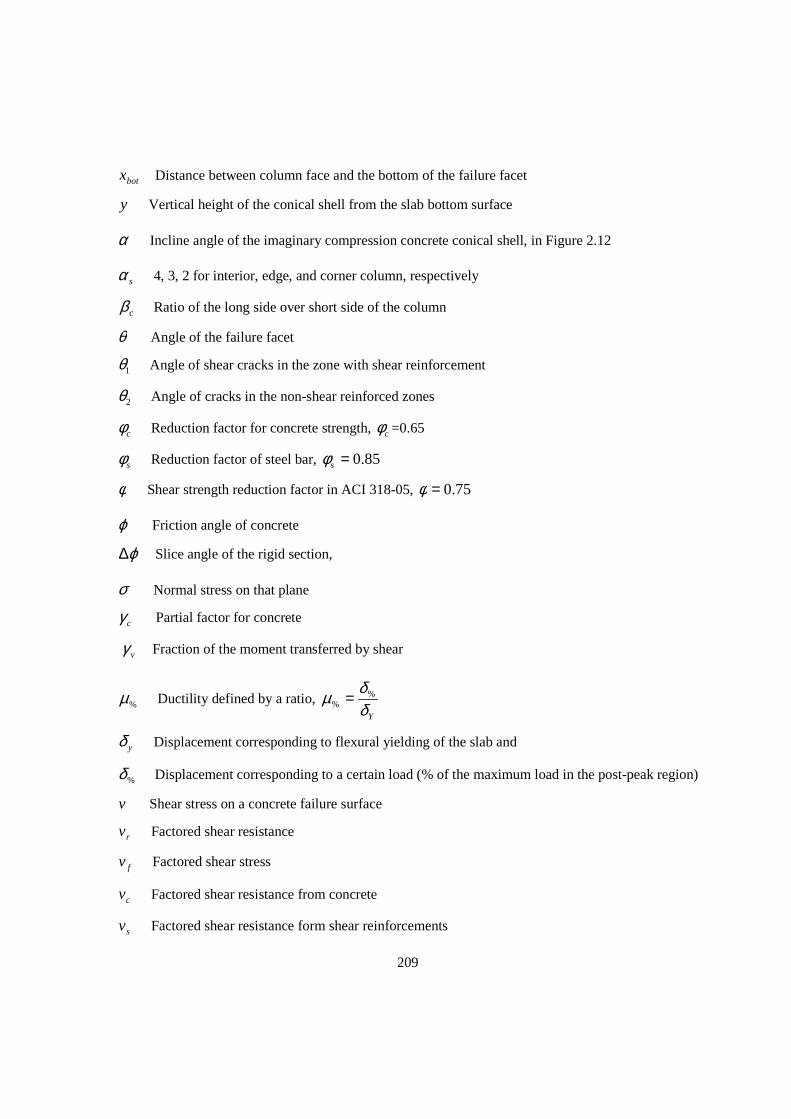
209
botx Distance between column face and the bottom of the failure facet
y Vertical height of the conical shell from the slab bottom surface
α Incline angle of the imaginary compression concrete conical shell, in Figure 2.12
sα 4, 3, 2 for interior, edge, and corner column, respectively
cβ Ratio of the long side over short side of the column
θ Angle of the failure facet
1θ Angle of shear cracks in the zone with shear reinforcement
2θ Angle of cracks in the non-shear reinforced zones
cφ Reduction factor for concrete strength, cφ =0.65
sφ Reduction factor of steel bar, 85.0=sφ
φ Shear strength reduction factor in ACI 318-05, 75.0=φ
ϕ Friction angle of concrete
ϕ∆ Slice angle of the rigid section,
σ Normal stress on that plane
cγ Partial factor for concrete
vγ Fraction of the moment transferred by shear
%µ Ductility defined by a ratio, Yδ
δµ %% =
yδ Displacement corresponding to flexural yielding of the slab and
%δ Displacement corresponding to a certain load (% of the maximum load in the post-peak region)
v Shear stress on a concrete failure surface
rv Factored shear resistance
fv Factored shear stress
cv Factored shear resistance from concrete
sv Factored shear resistance form shear reinforcements

210
nv Nominal shear strength
ncv Nominal shear strength provided by the concrete
w Calculated from the maximum force gradient in the reinforcement perpendicular to the radial
strip
ρ Effective reinforcing ratio (tension reinforcement on the slab top) within the radial strip
,x yρ ρ Flexural reinforcing ratios of the slab in two orthogonal directions
211
References
ACI-ASCE Committee 326 (1962), “Shear and Diagonal Torsion, Chapter 8 - Slabs and
Footings”, Journal of the American Concrete Institute, Proceedings, V. 59, No. 3, Mar.
1962, pp. 353-396.
ACI-ASCE Committee 352, (1988) “Recommendations for Design of RC Slab-Column
Connections in Monolithic Reinforced Concrete Structures,” ACI Structural Journal, Vol.
85, No.6, November-December, pp. 675-696.
ACI-ASCE Committee 421 (1999), Shear Reinforcement for Slabs (ACI 421.1 R-99),
American Concrete Institute, Farminton Hills, Michigan.
ACI Committee 318, Building Code Requirements for Structural Concrete (ACI 318-05),
American Concrete Institute, Farminton Hills, Michigan, 2005.
ACI Innovation Task Group 1 and Collaborators, “Acceptance Criteria for Moment Frames
Based on Structural Testing (ACI T1.1-01) and Commentary (T1.1R-01),” American
Concrete Institute, Farmington Hills, Mich., 2001, 17 pp.
Adetifa, B., (2003) “A New Punching Shear Strengthening Technique for Reinforced concrete
Slabs at Interior Slab-Column Connections,” M.A.Sc Thesis, University of Waterloo,
Waterloo, Ontario, Canada.
Adetifa, B., Polak, M.A., (2005), “Retrofit of Interior Slab Column Connections for Punching
using Shear Bolts”, ACI Structural Journal, March April.
Alexander, S.D.B., Simmonds, S.H., (1987) “Ultimate Strength of Slab-Column Connections,”
ACI Structural Journal, Vol. 84, No. 3, May-June, pp. 255-261.
Alexander, S.D.B., Simmonds, S.H., (1992) “Bond Model for Concentric Punching Shear,”
ACI Structural Journal, Vol. 89, No. 3, May-June, pp. 325-334.
Anderson, J. C., (1989) “Dynamics Response of Building”, The Seismic Design Handbook,
edited by Farzad Naeim, Van Nostrand Reinhold.
Barrett, R. T., (1990) “Fastener Design Manual,” NASA Reference Publication 1228, National
Aeronautics and Space Administration, Office of Management, Scientific and Technical
Information Division
Bazant, Z. P., and Cao, Z., “Size effect in Punching Shear Failure of slabs,” ACI Structural
Journal, V.84, No.1, Jan.-Feb. 1987, pp. 44-53.
212
Bertero, V., (1994), Foreword, International Handbook of Earthquake Engineering (Codes,
Programs, and Examples), edit by Mario Paz, Chapman & Hall Inc.
Brastrup, M.W., Nielsen, M.P., Jensen, B.C., Bach, F., (1976) “Axisymmetric Punching of
Plain and Reinforced Concrete,” Structural Research Laboratory, Technical University of
Demark.
Broms, C. E., (1990) “Punching of Flat Plates-A Question of Concrete Properties in Biaxial
Compression and Size Effect,” ACI Structural Journal, Vol. 87, No.3, May-June, pp. 292-
304.
Bu, W., Polak, M.A., "Seismic Retrofit of RC Slab-Column Connections using Shear Bolts"
ACI Structural Journal, 30 pp. submitted
Bu, W., Polak, M.A., (September, 2007), "Punching Shear Retrofit of Reinforced Concrete,
Flat Slabs Subjected to Static and Reversed Cyclic Loads,” International Association for
Bridge and Structural Engineering (IABSE) Conference, Weimar , 8 pages
Building and Fire Research Laboratory of NIST (USA), (2003) Building and Fire Research at
NBS/NIST 1975-2000, National Institute of Standards and Technology Building Science
Series 179, 339 pages, CODEN: NBSSES, December.
Carino, N. J., Woodward, K.A., Leyendecker, E.V., Fattal, S.G., (1983) “A Review of the
Skyline Plaza Collapse,” Concrete International, Vol. 5, No. 7, July, pp. 35-42.
Cao, H., (1993) “Seismic Design of Slab-Column Connections,” M. A. Sc. Thesis, University
of Calgary, Alberta, Canada.
CEB-FIP MC 90 (1993), Design of Concrete Structures, CEB-FIB-Mode -Code 1990, Thomas,
Telford.
Choi, K. K., Taha, M. M. R., Sherif, A. G., (2007) “Simplified Punching Shear Design Method
for Slab-Column Connections Using Fuzzy learning,” ACI Structural Journal, Vol. 104,
No.4, July-August, pp. 438-447.
Criswell, M.E., Hawkins, N.M., (1974) “Shear Strength of Slab: Basic Principle and Their
Relation to Current Methods of Analysis,” Shear in Reinforced Concrete (Volume 2), ACI
Publication SP-42, pp. 641-676.
Cope, R. J., Clark, L. A., (1984) “Concrete Slabs Analysis and Design”, Elsevier Applied
Science Publishers Ltd., ISBN 0-85334-254-7.
CSA Technical Committee on Reinforced Concrete Design, A23.3-94 Design of Concrete
Structures, Canadian Standard Association, Rexdale, Ontario, 1994, 199 pp.
213
CSA Technical Committee on Reinforced Concrete Design, A23.3-04 Design of Concrete
Structures, Canadian Standard Association, Rexdale, Ontario, 2004.
Dechka,D.C., (2001) “Response of Shear-Stud-Reinforced Continuous Slab-Column Frames to
Seismic Loads,” Ph.D. Dissertation, University of Calgary, Alberta, Canada
Derecho, A. T., (1989) “Seismic Design of Reinforced Concrete Structures”, The Seismic
Design Handbook, edited by Farzad Naeim, Van Nostrand Reinhold.
Dilger, W.H., (2000) “Flat Slab-Column Connections,” Progress in Structural Engineering and
Materials, John Wiley & Sons, Ltd., Volume 2, Issue 3, pp. 386-399.
Dilger, W.H., Ghali, A., (1981) “Shear Reinforcement for Concrete Slabs,” Journal of the
Structural Division, Proceedings of the ASCE, Vol. 107, No. ST12, December.
Ebead, U., Marzouk, H., (2002) “Strengthening of Two-Way Slabs Subjected to Moment and
Cyclic Loading,” ACI Structural Journal, Vol. 99, No.4, July-August, pp. 435-444.
Elstner, R.D., Hognestad, E., (1956) “Shearing Strength of Reinforced Concrete Slabs,” ACI
Structural Journal, Vol. 53, No.1, July 1956, pp. 29-58.
El-Salakawy, E.F., Polak, M.A., Soudiki, K.A., (2003) “New Shear Strengthening Technique
for Concrete Slab-Column Connections,” ACI Structural Journal, Vol. 100, No.3, pp. 297-
304.
El-Salakawy, E.F., Polak, M.A., Soliman, M.H. (1998) “Slab-Column Edge Connections
Subjected to High Moments,” Canadian Journal of Civil Engineering, Vol. 25, pp. 526-
538.
El-Salakawy, E.F., Polak, M.A., Soliman, M.H. (1999) “Reinforced Concrete Slab-Column
Edge Connections with Openings,” ACI Structural Journal, Vol. 96, No.1, pp. 79-87.
El-Salakawy, E.F., Polak, M.A., Soliman, M.H. (2000) “Reinforced Concrete Slab-Column
Edge Connections with Shear Studs,” Canadian Journal of Civil Engineering, Vol. 27, pp.
338-348.
El-Salakawy, E.F., Polak, M.A., Soudiki, K.A., (2003) “New Shear Strengthening Technique
for Concrete Slab-Column Connections,” ACI Structural Journal, Vol. 100, No.3, pp. 297-
304.
EL-Salakawy, E. F., (1998) “Shear Behaviour of Reinforced Concrete Flat Slab-Column Edge
Connections with Openings,” Ph.D. Thesis, University of Waterloo, Waterloo, Ontario,
Canada.
214
Emam, M., Marzouk, H., Hilal, M.S., (1997) “Seismic Response of Slab-Column Connections
Constructed with High-Strength Concrete,” ACI Structural Journal, Vol. 94, No.2, pp. 197-
205.
Eurocode 2: Design of Concrete Structures - Part 1-1: General Rules and Roles for Buildings,
BS EN 1992-1-1, 2004, British Standard, CEN
Feld, J., Carper, K. L., (1997), Construction Failure, 2nd Edition, John Wiley & Sons, Inc.,
ISBN 0-471-57477-5, 512 pp.
FEMA 356 – Prestandard and Commentary for the Seismic Rehabilitation of Buildings, ASCE
and FEMA, November, 2000, USA.
Fib - fédération internationale du béton, The International Federation for Structural Concrete,
Punching of structural concrete slabs, fib Bulletin No. 12, 2001, 314 pp.
Ghali, A., Sargious, M. A., Huizer, a., (1974) “Vertical Prestressing of Flat Plates Around
Columns,” Shear in Reinforced Concrete (Volume 2), ACI Publication SP-42, pp. 905-920.
Hawkins, N.M.,(1974) “Shear Strength of Slabs With Shear Reinforcement,” Shear in
Reinforced Concrete (Volume 2), ACI Publication SP-42, pp. 785-815.
Hawkins, N. M., Corley, W. G., (1974a) “Moment Transfer to Columns in Slabs with
Shearhead Reinforcement,” Shear in Reinforced Concrete (Volume 2), ACI Publication SP-
42, pp. 847-879.
Hawkins, N. M., Criswell, M.E., Roll, F., (1974b) “Shear Strength of Slabs Without Shear
Reinforcement,” Shear in Reinforced Concrete (Volume 2), ACI Publication SP-42, pp.
677-720.
Hawkins, N. M., Mitchell, D., Hanna, S. N., (1975) “The Effect of Shear Reinforcement on the
Reversed Cyclic Loading Behaviour of Flat Plate Structures,” Canadian Journal of Civil
Engineering, Vol. 2, pp. 572-582.
Islam, S., Park, R., (1976) “Tests on Slab-Column Connections with Shear and Unbalanced
Flexure,” Journal of Structural Division, Proceedings of the ASCE, Vol. 102, No. ST3, pp.
549-568.
King, S., Delatte, N. J., (2004) “Collapse of 2000 Commonwealth Avenue: Punching Shear
Case Study,” Journal of Performance of Constructed Facilities, Vol. 18, No.1, Feb. 1, pp.
54-61.
215
Kinnunen, S., (1963) “Punching of Concrete Slabs with Two-Way Reinforcement with Special
Reference to Dowel Effect and Deviation of Reinforcement from Polar Symmetry,”
Transactions, No.198, Royal Institute of Technology, Stockholm, Sweden.
Kinnunen, S., Nylander, H., (1960) “Punching of Concrete Slabs without Shear
Reinforcement,” Transactions, No.158, Royal Institute of Technology, Stockholm, Sweden.
Loov, R.E. (1978), “Design of Precast Connections,” Presentation at a seminar organized by
Compa International Pte. Ltd., Singapore, 1978, 8 pp.
MacGregor, J. G., Bartlett, F. M., (2000) Reinforced Concrete Mechanics and Design, 1st
Edition, Prentice Hall Canada Inc., Scarborough, Ontario.
Megally, S., Ghali, A., (2000a) “Punching Shear Design of Earthquake-Resistant Slab-Column
Connections,” ACI Structural Journal, Vol. 97, No.5, pp. 720-730.
Megally, S., Ghali, A., (2000b) “Seismic Behaviour of Edge Slab-Column Connections with
Stud Shear Reinforcement,” ACI Structural Journal, Vol. 97, No.1 pp. 53-60.
Megally, S., Ghali, A., (2000) “Seismic Behaviour of Slab-Column Connections,” Canadian
Journal of Civil Engineering, .Vol. 27, pp. 84-100.
Moehle, J. P. (1996) “Seismic Design Considerations for Flat-Plate Construction,” Mete A.
Sozen Symposium: A Tribute from his Students, ACI Publication SP-162, pp.1-33.
Moehle, J.P., (2000) "State of Research on Seismic Retrofit of Concrete Building Structures in
the US," US-Japan Symposium and Workshop on Seismic Retrofit of Concrete Structures -
State of Research and Practice, September.
Moehle, J. P., Diebold, J. W., (1985) “lateral Load Response of Flat-Plate Frame,” Journal of
Structural Division, Proceedings of the ASCE, Vol. 111, No. 10, pp. 2149-2164.
Moe, J., (1961) “Shearing Strength of Reinforced Concrete Slabs and Footings Under
Concentrated Loads,” Development Department Bulletin D47, Portland Cement
Association, Skokie, Apr. 1961, 130 pp.
Mo, Y.L., (1994)Dynamic Behaviour of concrete Structures, Elsevier Science B. V.
National Building Code of Canada 2005, Canadian Commission on Building and Fire Codes,
National Research Council, Ottawa
Pan, A. D., Moehle, J. P., (1989) “Lateral Displacement Ductility of Reinforced Concrete Flat
Plates,” ACI Structural Journal, Vol. 86, No. 3, pp. 250-258.
Pan, A. D., Moehle, J. P., (1992) “An Experimental Study of Slab-Column Connections,” ACI
Structural Journal, Vol. 89, No.6 pp. 626-638.
216
Park, R., Paulay, T., (1975) Reinforced Concrete Structures, John Wiley & Sons, Inc.
Paulay, T., Priestley, M. J. N., (1992) Seismic Design of Reinforced Concrete and Masonry
Buildings, John Wiley & Sons, Inc.
PILKLEY W. D., (2005), “Formulas for Stress, Strain, and Structural Matrices, Second
Edition”, John Wiley & Sons, Inc., Hoboken, New Jersey, USA.
Polak, M.A., Bu, W., (2006), "Application and Design of Shear Bolts for Retrofit of Concrete
Slabs", IABSE Conference, Budapest, 8 pp.
Polak, M.A., (2005), “Ductility of Reinforced Concrete Flat Slab-Column Connections”,
Computer-Aided Civil and Infrastructure Engineering, 35 pages, accepted.
Polak, M.A., Adetifa, B., (2004), “Strength and Ductility of Slab-Column Interior Connections
Strengthened with Shear Bolts, Canadian Society of Civil Engineering Conference,
Saskatoon, 9 pages.
Polak, M.A., El-Salakawy, E., (2002), “Punching Shear Strengthening of Existing Slabs”, fib
International Congress in Osaka, Japan, 8 pp.
Rankin, G.I.B., and Long, A.E., (1987) “Predicting the Punching Strength of Conventional
Slab-Column Specimens,” Proceedings of Institution of Civil Engineers, Part 1, 82, April.
Regan, P. E., (1974) “Design for Punching Shear,” The Structural Engineer, June, 1974, No.6,
Volume 52, pp. 197-207
Robertson, I. N., and Durrani, A. J. (1992) “Gravity Load Effect on Seismic Behaviour of
Interior Slab-Column Connections,” ACI Structural Journal, Vol. 89, No.1, pp. 37-45.
Roll, F., Zaidi, S.T.H., Sabnis, G., Chuang, K., (1971) “Shear Resistance of Perforated
Reinforced Concrete Slabs,” Cracking, Deflection, and Ultimate Load of Concrete Slab
Systems, Publication SP-30, American Concrete Institute, Michigan.
Rosenblueth, E., Meli, R., (1986) “The 1985 earthquake: causes and effects in Mexico City,”
Concrete International, May.
Sabol, T. A., (1994) “Flat Slab Failure in Ductile Concrete Frame Building,” 1994 Northridge
Earthquake, Case Study 1.13, pp. 167-187.
Shehata, I. A.E.M., Regan, P. E. (1989) “Punching in R.C. Slabs,” Journal of Structural
Engineering, ASCE, Vol. 115, No. 7, pp. 1726-1740.
Simmonds, S.H., Alexander, S.D.B., (1987) “Truss Model for Edge Column-Slab
Connections,” ACI Structural Journal, pp. 296-303.
217
Stark, A., Binici, B., Bayrak, O., (2005) “Seismic Upgrade of Reinforced Concrete Slab-
Column Connections Using Carbon Fiber-Reinforced Polymers,” ACI Structural Journal,
Vol. 102, No.2, March-April, pp. 324-333.
Talbot, A.N. (1913), “Reinforced Concrete Wall Footings and Column Footings”, Engineering
Experiment Station, University of Illinois, Urbana, Illinois, USA, Bulletin No. 67, Mar.
1913, 114pp.
Wallace, J.W., Kang, T.H.K, Changsoon RHA, “Seismic Performance of Flat plate Systems,”
4th US-Japan Workshop on PBD for RC Buildings (Proceedings), http://
www.seas.ucla.edu/~tkang/.
Wakabayashi, M., (1986) Design of Earthquake-Resistant Buildings, R.R. Donnelley & Sons
Company.
Wey, E. H., Durrani, A., (1992) “Seismic of Interior Slab-Column Connections with Shear
Capitals,” ACI Structural Journal, Vol. 89, No.6, pp. 682-691.
Yitzhaki, D., (1966) “Punching shear Strength of Reinforced Concrete Slabs,” Proceedings of
ACI, Vol.63, May, pp. 527-542.