Embed Size (px)
Citation preview
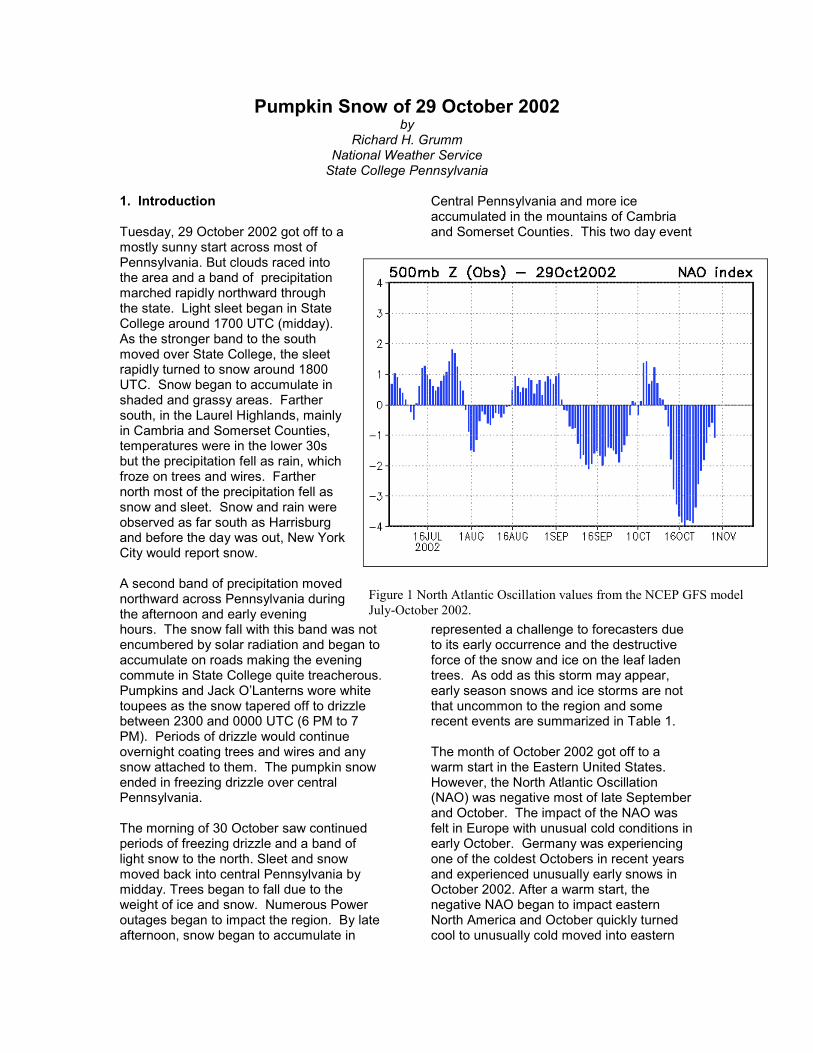
Figure 1 North Atlantic Oscillation values from the NCEP GFS model July-October 2002.
Pumpkin Snow of 29 October 2002 by
Richard H. Grumm National Weather Service
State College Pennsylvania
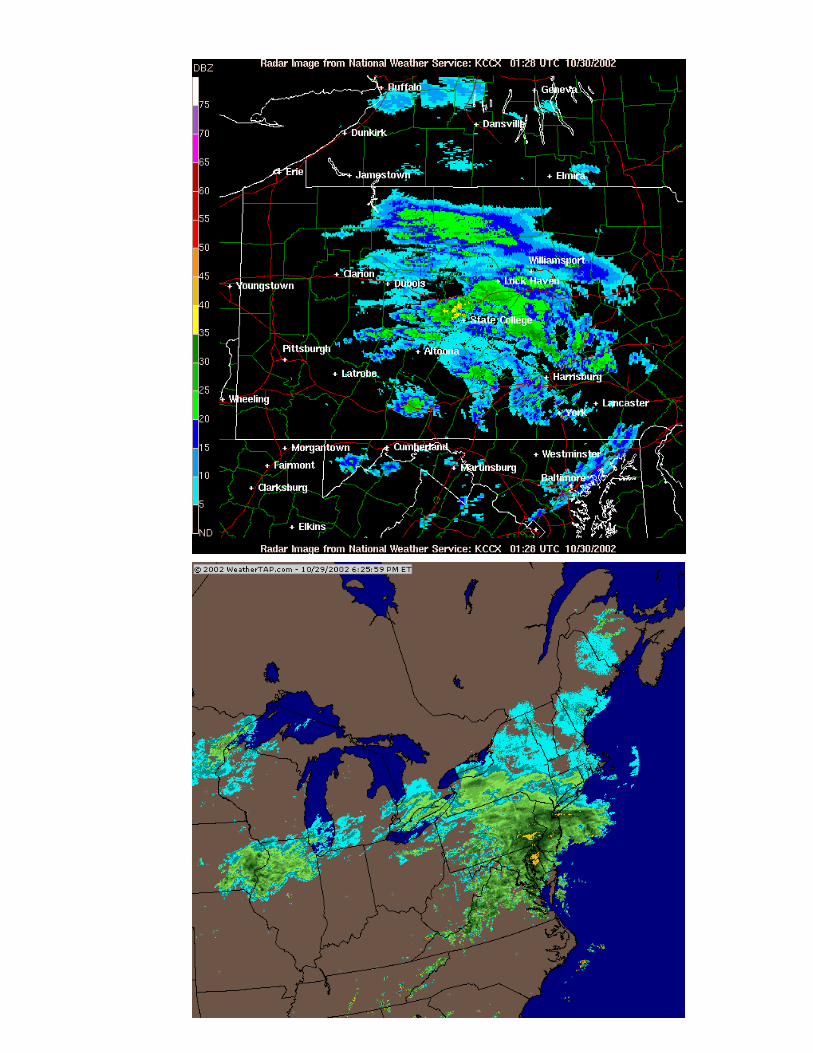
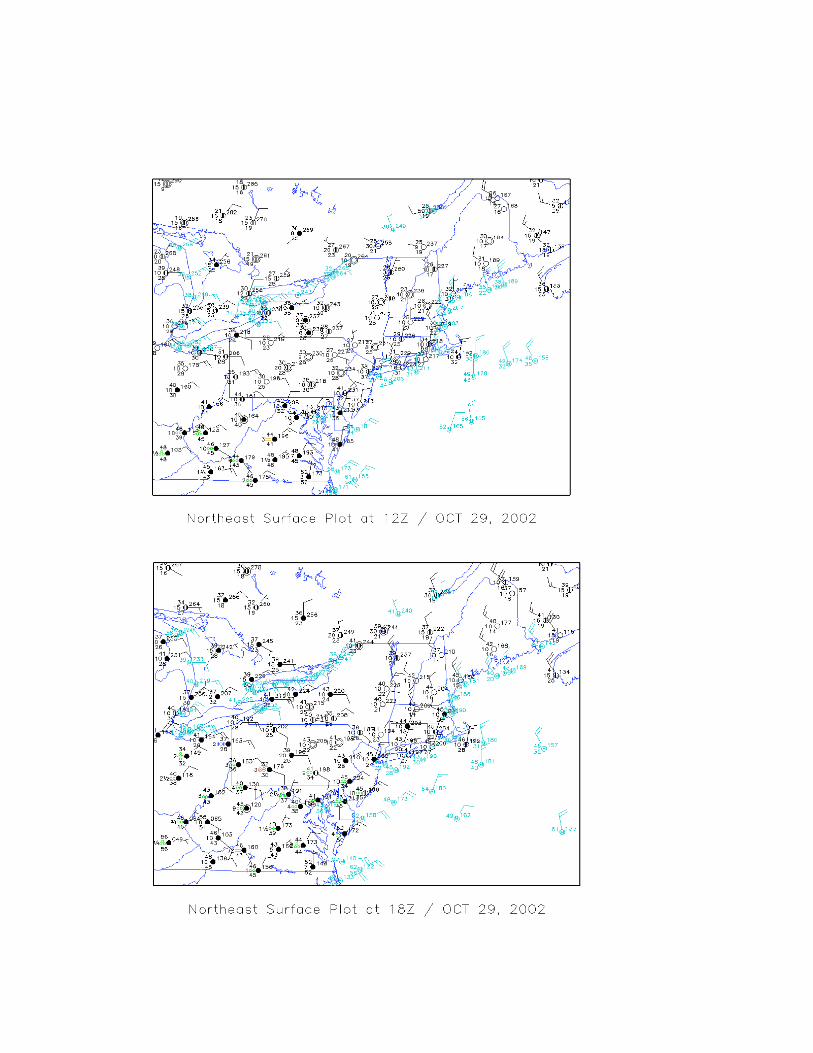
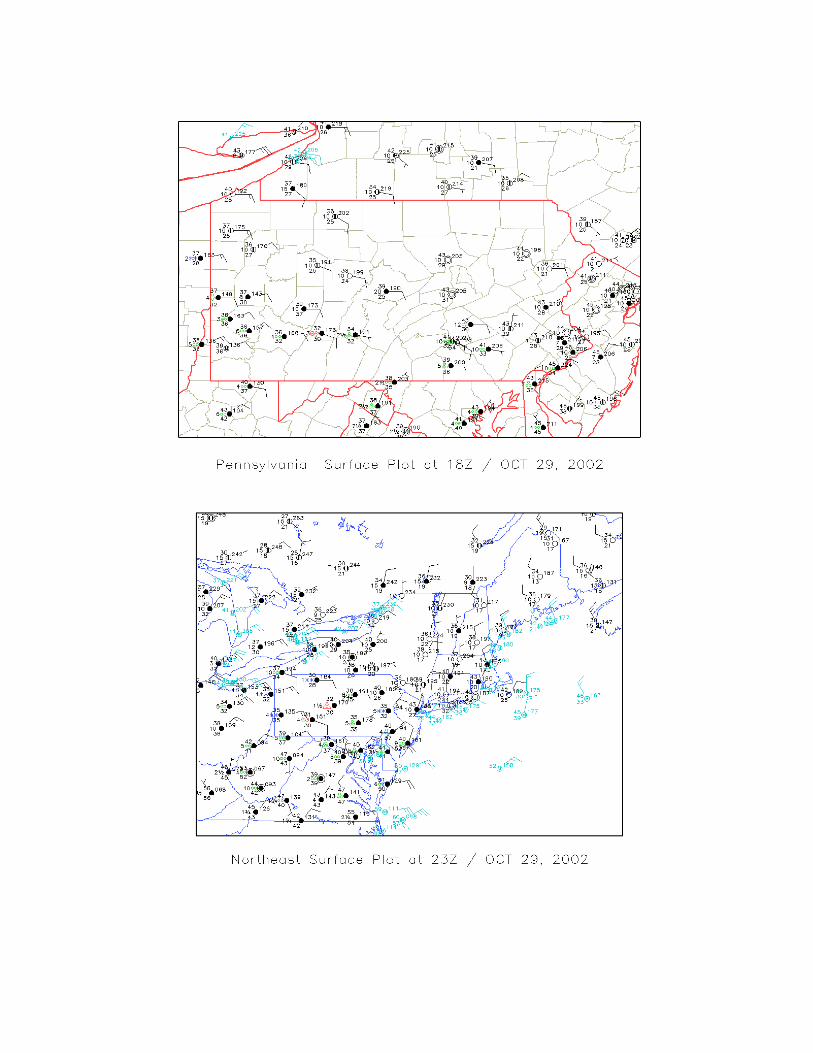
1. Introduction Tuesday, 29 October 2002 got off to a mostly sunny start across most of Pennsylvania. But clouds raced into the area and a band of precipitation marched rapidly northward through the state. Light sleet began in State College around 1700 UTC (midday). As the stronger band to the south moved over State College, the sleet rapidly turned to snow around 1800 UTC. Snow began to accumulate in shaded and grassy areas. Farther south, in the Laurel Highlands, mainly in Cambria and Somerset Counties, temperatures were in the lower 30s but the precipitation fell as rain, which froze on trees and wires. Farther north most of the precipitation fell as snow and sleet. Snow and rain were observed as far south as Harrisburg and before the day was out, New York City would report snow. A second band of precipitation moved northward across Pennsylvania during the afternoon and early evening hours. The snow fall with this band was not encumbered by solar radiation and began to accumulate on roads making the evening commute in State College quite treacherous. Pumpkins and Jack O’Lanterns wore white toupees as the snow tapered off to drizzle between 2300 and 0000 UTC (6 PM to 7 PM). Periods of drizzle would continue overnight coating trees and wires and any snow attached to them. The pumpkin snow ended in freezing drizzle over central Pennsylvania. The morning of 30 October saw continued periods of freezing drizzle and a band of light snow to the north. Sleet and snow moved back into central Pennsylvania by midday. Trees began to fall due to the weight of ice and snow. Numerous Power outages began to impact the region. By late afternoon, snow began to accumulate in
Central Pennsylvania and more ice accumulated in the mountains of Cambria and Somerset Counties. This two day event
represented a challenge to forecasters due to its early occurrence and the destructive force of the snow and ice on the leaf laden trees. As odd as this storm may appear, early season snows and ice storms are not that uncommon to the region and some recent events are summarized in Table 1. The month of October 2002 got off to a warm start in the Eastern United States. However, the North Atlantic Oscillation (NAO) was negative most of late September and October. The impact of the NAO was felt in Europe with unusual cold conditions in early October. Germany was experiencing one of the coldest Octobers in recent years and experienced unusually early snows in October 2002. After a warm start, the negative NAO began to impact eastern North America and October quickly turned cool to unusually cold moved into eastern
North America. During the cold season, a negative NAO has been associated with unseasonably cold weather in eastern North American and Western Europe. Some studies suggest a negative NAO is typically present during most East Coast snowstorms. The pumpkin snow of 29 October occurred during a period of strongly negative NAO. The NAO for the Sep-Oct 2002 is shown in Figure 1. The large scale flow over North America began to show unusually high pressure to the north and a block set up along the West Coast of Greenland early in October. The unusually high pressure over eastern Canada forced cold air southward and led to increased confluence over the region. This produced several jet entrance rain events over the eastern United States during October. The event 24-25 October produced snow in New England. A cold rain event was observed in the Mid-Atlantic region on 25-26 October. The last event of the month occurred on 29 October and snow was observed as far south as Pennsylvania. The snow event of 29-30 October 2002 was the first widespread snow and ice event so far south in Pennsylvania since the Halloween snow of 30-31 October 1993. This report will focus on the unseasonably early wet snow event of 29 and 30 October
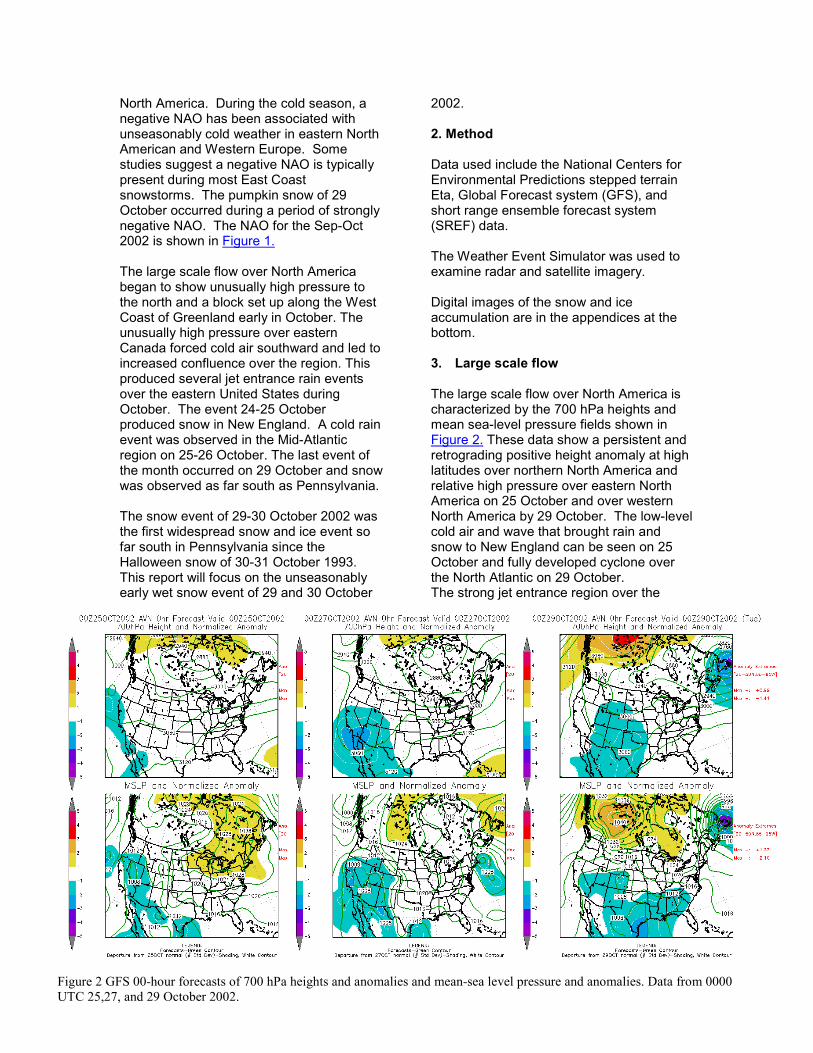
2002. 2. Method Data used include the National Centers for Environmental Predictions stepped terrain Eta, Global Forecast system (GFS), and short range ensemble forecast system (SREF) data. The Weather Event Simulator was used to examine radar and satellite imagery. Digital images of the snow and ice accumulation are in the appendices at the bottom. 3. Large scale flow The large scale flow over North America is characterized by the 700 hPa heights and mean sea-level pressure fields shown in Figure 2. These data show a persistent and retrograding positive height anomaly at high latitudes over northern North America and relative high pressure over eastern North America on 25 October and over western North America by 29 October. The low-level cold air and wave that brought rain and snow to New England can be seen on 25 October and fully developed cyclone over the North Atlantic on 29 October. The strong jet entrance region over the
Figure 2 GFS 00-hour forecasts of 700 hPa heights and anomalies and mean-sea level pressure and anomalies. Data from 0000 UTC 25,27, and 29 October 2002.
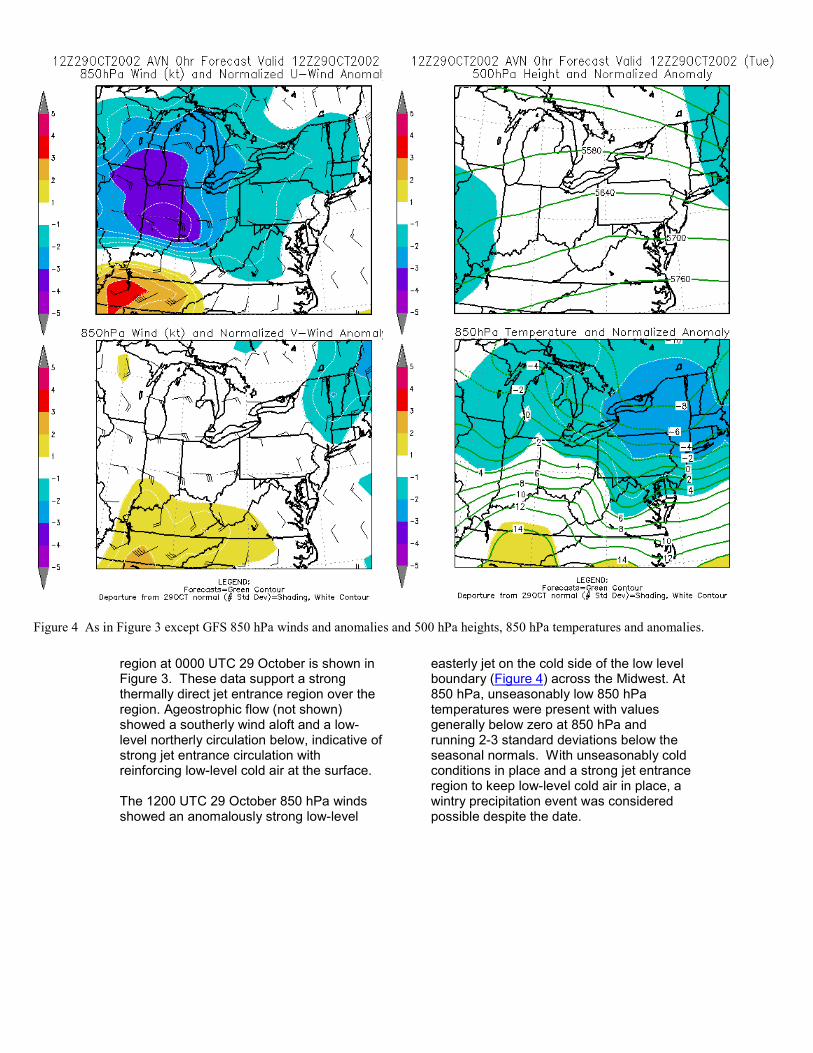
region at 0000 UTC 29 October is shown in Figure 3. These data support a strong thermally direct jet entrance region over the region. Ageostrophic flow (not shown) showed a southerly wind aloft and a low-level northerly circulation below, indicative of strong jet entrance circulation with reinforcing low-level cold air at the surface. The 1200 UTC 29 October 850 hPa winds showed an anomalously strong low-level
easterly jet on the cold side of the low level boundary (Figure 4) across the Midwest. At 850 hPa, unseasonably low 850 hPa temperatures were present with values generally below zero at 850 hPa and running 2-3 standard deviations below the seasonal normals. With unseasonably cold conditions in place and a strong jet entrance region to keep low-level cold air in place, a wintry precipitation event was considered possible despite the date.
Figure 4 As in Figure 3 except GFS 850 hPa winds and anomalies and 500 hPa heights, 850 hPa temperatures and anomalies.
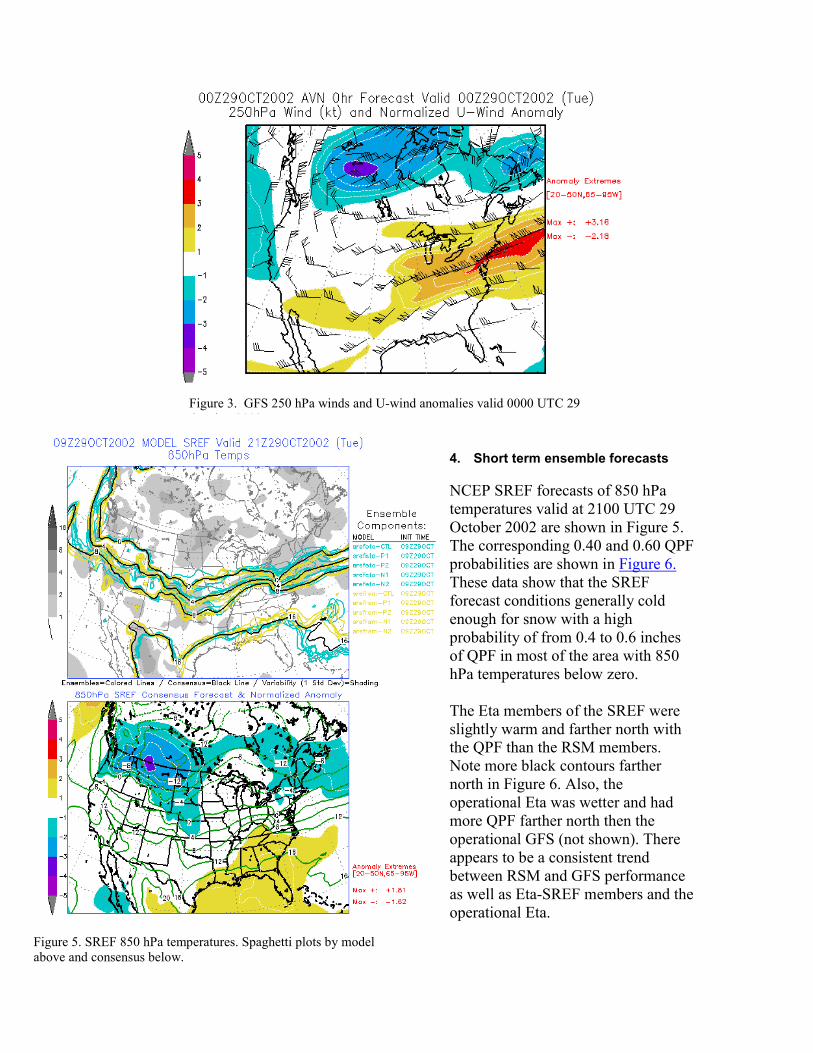
Figure 3. GFS 250 hPa winds and U-wind anomalies valid 0000 UTC 29 O b 2002
Figure 5. SREF 850 hPa temperatures. Spaghetti plots by model above and consensus below.
4. Short term ensemble forecasts NCEP SREF forecasts of 850 hPa temperatures valid at 2100 UTC 29 October 2002 are shown in Figure 5. The corresponding 0.40 and 0.60 QPF probabilities are shown in Figure 6. These data show that the SREF forecast conditions generally cold enough for snow with a high probability of from 0.4 to 0.6 inches of QPF in most of the area with 850 hPa temperatures below zero. The Eta members of the SREF were slightly warm and farther north with the QPF than the RSM members. Note more black contours farther north in Figure 6. Also, the operational Eta was wetter and had more QPF farther north then the operational GFS (not shown). There appears to be a consistent trend between RSM and GFS performance as well as Eta-SREF members and the operational Eta.
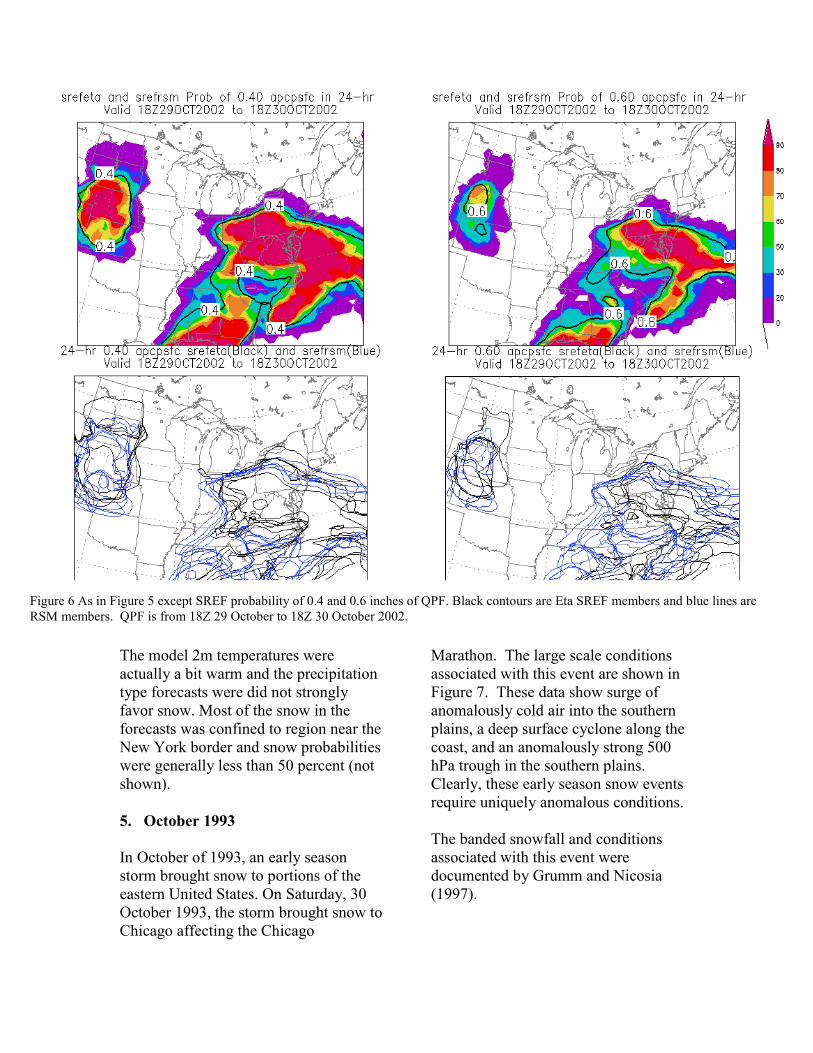
Figure 6 As in Figure 5 except SREF probability of 0.4 and 0.6 inches of QPF. Black contours are Eta SREF members and blue lines are RSM members. QPF is from 18Z 29 October to 18Z 30 October 2002.
The model 2m temperatures were actually a bit warm and the precipitation type forecasts were did not strongly favor snow. Most of the snow in the forecasts was confined to region near the New York border and snow probabilities were generally less than 50 percent (not shown). 5. October 1993 In October of 1993, an early season storm brought snow to portions of the eastern United States. On Saturday, 30 October 1993, the storm brought snow to Chicago affecting the Chicago
Marathon. The large scale conditions associated with this event are shown in Figure 7. These data show surge of anomalously cold air into the southern plains, a deep surface cyclone along the coast, and an anomalously strong 500 hPa trough in the southern plains. Clearly, these early season snow events require uniquely anomalous conditions. The banded snowfall and conditions associated with this event were documented by Grumm and Nicosia (1997).
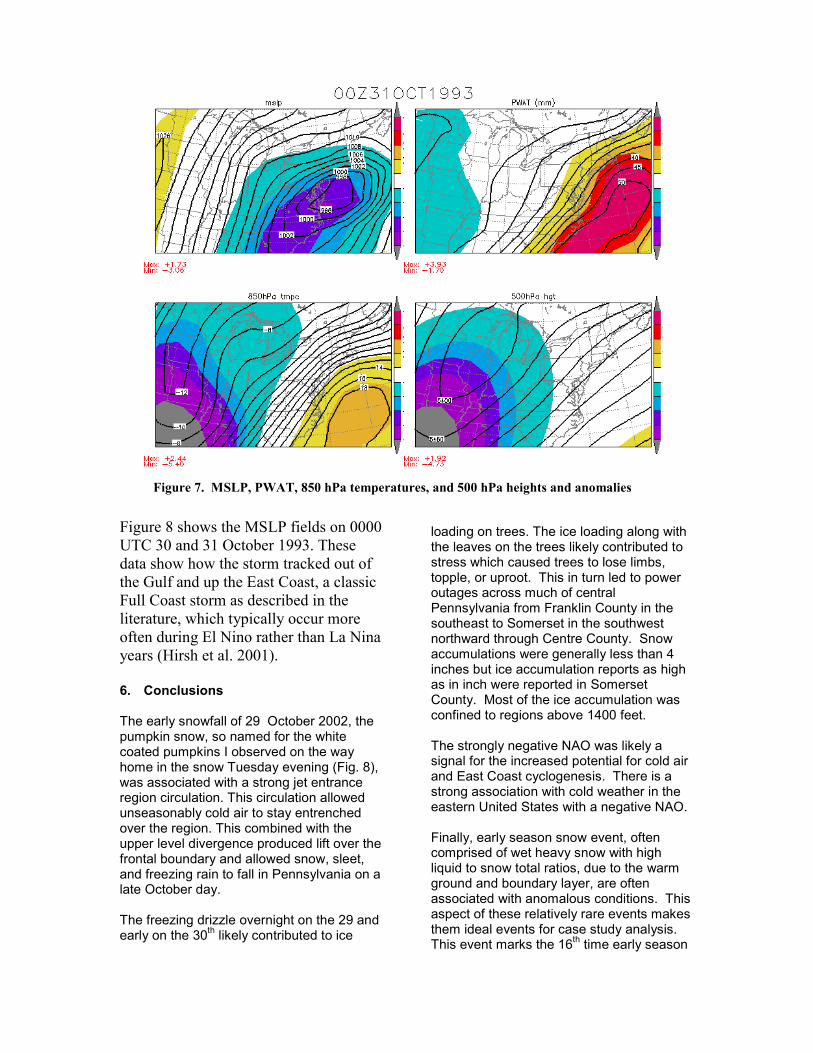
Figure 7. MSLP, PWAT, 850 hPa temperatures, and 500 hPa heights and anomalies
Figure 8 shows the MSLP fields on 0000 UTC 30 and 31 October 1993. These data show how the storm tracked out of the Gulf and up the East Coast, a classic Full Coast storm as described in the literature, which typically occur more often during El Nino rather than La Nina years (Hirsh et al. 2001). 6. Conclusions The early snowfall of 29 October 2002, the pumpkin snow, so named for the white coated pumpkins I observed on the way home in the snow Tuesday evening (Fig. 8), was associated with a strong jet entrance region circulation. This circulation allowed unseasonably cold air to stay entrenched over the region. This combined with the upper level divergence produced lift over the frontal boundary and allowed snow, sleet, and freezing rain to fall in Pennsylvania on a late October day. The freezing drizzle overnight on the 29 and early on the 30th likely contributed to ice
loading on trees. The ice loading along with the leaves on the trees likely contributed to stress which caused trees to lose limbs, topple, or uproot. This in turn led to power outages across much of central Pennsylvania from Franklin County in the southeast to Somerset in the southwest northward through Centre County. Snow accumulations were generally less than 4 inches but ice accumulation reports as high as in inch were reported in Somerset County. Most of the ice accumulation was confined to regions above 1400 feet. The strongly negative NAO was likely a signal for the increased potential for cold air and East Coast cyclogenesis. There is a strong association with cold weather in the eastern United States with a negative NAO. Finally, early season snow event, often comprised of wet heavy snow with high liquid to snow total ratios, due to the warm ground and boundary layer, are often associated with anomalous conditions. This aspect of these relatively rare events makes them ideal events for case study analysis. This event marks the 16th time early season

snows have impacted the region during October (Table 2). Final note, a sheriff in Grant Co. WV was quoted on 31 October 2002 as saying that “at higher elevations, this was one of the worst ice storms in 50 years!” 7. References
Grumm, R. H., and D. J. Nicosia, 1997: WSR-88D observations of mesoscale precipitation bands over Pennsylvania. Natl. Wea. Dig., 21, 10–23. Hirsch, M.E., A.T. DeGaetano, and S.J. Colucci, 2001: An east coast winter storm climatology. J. Climate, 14,882-899.

Table 1 List of recent early season snow and ice storms in central Pennsylvania.
Date Type Notes 30-31 Oct 1993 Wet snow • First CSI bands on KCCX radar
• 3-6 inch snowfall • Heavier snow in New York
14-15 November 1995 Wet snow • Record heavy wet snow in central PA
• Damaging snow with widespread tree damage
• Snowfall in some areas 12-24 inches 13 November 1997 Sleet
storm with some snow
• Accumulating sleet • 2-4 inch snow/sleet accumulation • some 6 inch snow in New York State
Table 2 Summary of know October snowfalls that impacted at least 1 observing location with at least four inches of snowfall within the State of Pennsylvania during the month of October
Date Type Notes 19 October 1940 Wet Snow Max snow 4.2 inches 20 October 1952 Wet Snow Max snow 4 inches 31 October 1954 Wet Snow Max snow 5 inches 25 October 1955 Wet Snow Max snow 6.5 inches
24-25 October 1960 Wet Snow Max snow 5.5 inches 26-27 October 1962 Wet Snow Max snow 6 inches 30 October 1968* Wet Snow Max snow 5 inches 23 October 1969* Wet Snow Max snow 6 inches
18-19 October 1972* Wet Snow Max snow 4.5 inches 20 October 1974 Wet Snow Max snow 4.4 inches 22 October 1976* Wet Snow Max snow 6.2 inches
17-18 October 1977 Wet Snow October record over 1 foot Thunder snow observed
26 October 1980 Wet Snow Max snow 5 inches 22 October 1987 Wet Snow Max snow 4 inches
30-31 October 1993 Wet Snow Max snow 6.6 inches *Denotes single station, Meadville south of Erie indicative of Lake Effect snow 17-18 October 1977 was a big snowfall mainly in the Poconos with a report of over 12 inches on the 17th at Mahoney City and a 5 inch report on the 18th
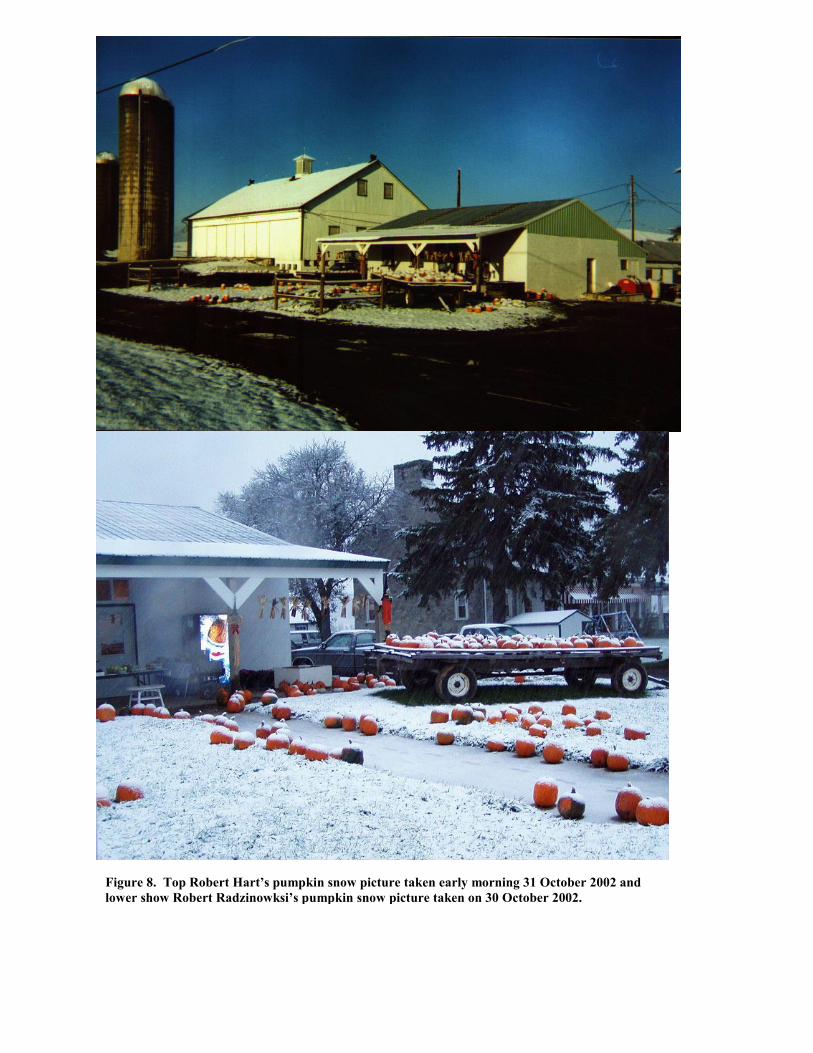
Figure 8. Top Robert Hart’s pumpkin snow picture taken early morning 31 October 2002 and lower show Robert Radzinowksi’s pumpkin snow picture taken on 30 October 2002.


![Snow Avalanche Risk Zone Mapping for Gar Creek, Johnsons ...Management/Snow Aval… · Avalanche Risk Determination and Mapping in Canada (Canadian Avalanche Association [CAA], 2002)](https://img.pdfslide.us/doc/110x75/5f9a87116a309e6b520104cd/snow-avalanche-risk-zone-mapping-for-gar-creek-johnsons-managementsnow-aval.jpg)