Embed Size (px)
Citation preview
Received May 21, 2019, accepted July 26, 2019, date of publication August 8, 2019, date of current version August 21, 2019.
Digital Object Identifier 10.1109/ACCESS.2019.2933946
PUGTIFs: Passively User-GeneratedThermal Invariant FeaturesEDWARD JACKSON , (Student Member, IEEE), AND LOUNIS CHERMAK , (Member, IEEE)Centre of Electronic Warfare Information and Cyber (CEWIC), Cranfield University, Cranfield SN6 8LA, U.K.
Corresponding author: Edward Jackson ([email protected])
This work was supported in part by the Engineering and Physical Sciences Research Council (EPSRC), and in part by the BAE Systems.
ABSTRACT Feature detection is a vital aspect of computer vision applications, but adverse environments,distance and illumination can affect the quality and repeatability of features or even prevent their identi-fication. Invariance to these constraints would make an ideal feature attribute. Here we propose the firstexploitation of consistently occurring thermal signatures generated by a moving platform, a paradigmwe define as passively user-generated thermal invariant features (PUGTIFs). In this particular instance,the PUGTIF concept is applied through the use of thermal footprints that are passively and continuouslyuser generated by heat differences, so that features are no longer dependent on the changing scene structure(as in classical approaches) but now maintain a spatial coherency and remain invariant to changes inillumination. A framework suitable for any PUGTIF has been designed consisting of three methods: first,the known footprint size is used to solve for monocular localisation and thus scale ambiguity; second,the consistent spatial pattern allows us to determine heading orientation; and third, these principles arecombined in our automated thermal footprint detector (ATFD) method to achieve segmentation/featuredetection. We evaluated the detection of PUGTIFs in four laboratory environments (sand, grass, grass withfoliage, and carpet) and compared ATFD to typical image segmentation methods. We found that ATFD issuperior to other methods while also solving for scaled monocular camera localisation and providing userheading in multiple environments.
INDEX TERMS feature detector, image segmentation, monocular scaled localisation, thermal footprint.
I. INTRODUCTIONFeature detection is a fundamental and widely-studied aspectof computer vision systems. Feature detectors aim to describeimage content by computing abstractions such as points,edges/lines or image patches representing structure withinscenes [1]. They are used in numerous applications, includingthe localisation and tracking of people or ground, naval andspace vehicles, obstacle avoidance, and facial recognition.The repeatability and robustness of features as scenes change(or become obscured by obstacles or challenging illuminationconditions such as glare and darkness) are two of the mostdesirable qualities of a feature detector.
We have therefore developed a new approach based onthe detection of passively user-generated thermal invariantfeatures (PUGTIFs), in this case the PUGTIF concept (patentpending, BAE Systems) is applied through thermal footprints
The associate editor coordinating the review of this article and approvingit for publication was Christopher H. T. Lee.
generated by a walking person. Thermal footprints are con-sistently available and independent of the changing scenesthat typify classical feature detection methods. State-of-the-art feature detectors use classical features that are dependenton the changing scene structure and are based on methodsthat detect local points (e.g., SIFT [2], SURF [3], ORB [4],BRISK [5] and FAST [6]), edges (e.g., Canny [7] andSobel), or regions (e.g., MSER [8] and Salient Regions [9]).
The performance and repeatability of feature detectionmethods have been discussed extensively in the literature, butpublished comparisons focus mainly on evaluations based onthe performance of image features when the image is trans-formed, scaled or rotated [10], [11]. In contrast, the effectof the scene content has been investigated only recently.A comparison of image feature detectors using a largedatabase of 20,482 images with 539 scenes revealed thatfeature detectors are influenced by the scene content [12], andfurther analysis indicated that the scene content influencesfeature detectors using the same database [13]. The authors
109566 This work is licensed under a Creative Commons Attribution 4.0 License. For more information, see http://creativecommons.org/licenses/by/4.0/ VOLUME 7, 2019
E. Jackson, L. Chermak: PUGTIFs
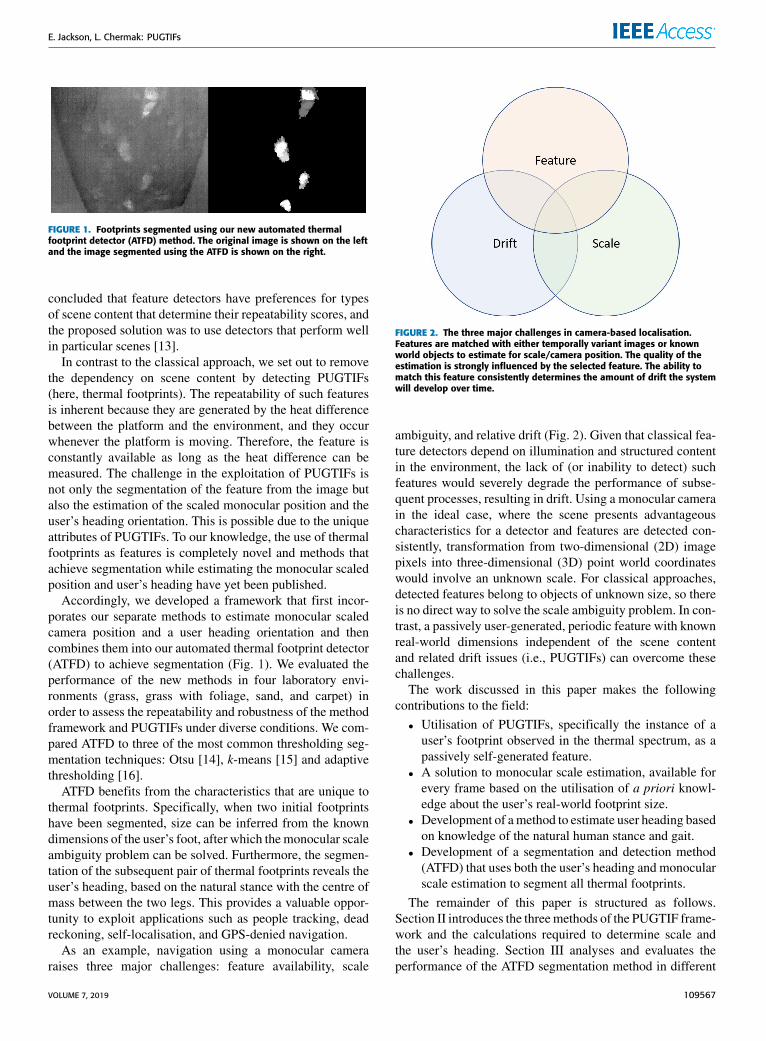
FIGURE 1. Footprints segmented using our new automated thermalfootprint detector (ATFD) method. The original image is shown on the leftand the image segmented using the ATFD is shown on the right.
concluded that feature detectors have preferences for typesof scene content that determine their repeatability scores, andthe proposed solution was to use detectors that perform wellin particular scenes [13].
In contrast to the classical approach, we set out to removethe dependency on scene content by detecting PUGTIFs(here, thermal footprints). The repeatability of such featuresis inherent because they are generated by the heat differencebetween the platform and the environment, and they occurwhenever the platform is moving. Therefore, the feature isconstantly available as long as the heat difference can bemeasured. The challenge in the exploitation of PUGTIFs isnot only the segmentation of the feature from the image butalso the estimation of the scaled monocular position and theuser’s heading orientation. This is possible due to the uniqueattributes of PUGTIFs. To our knowledge, the use of thermalfootprints as features is completely novel and methods thatachieve segmentation while estimating the monocular scaledposition and user’s heading have yet been published.
Accordingly, we developed a framework that first incor-porates our separate methods to estimate monocular scaledcamera position and a user heading orientation and thencombines them into our automated thermal footprint detector(ATFD) to achieve segmentation (Fig. 1). We evaluated theperformance of the new methods in four laboratory envi-ronments (grass, grass with foliage, sand, and carpet) inorder to assess the repeatability and robustness of the methodframework and PUGTIFs under diverse conditions. We com-pared ATFD to three of the most common thresholding seg-mentation techniques: Otsu [14], k-means [15] and adaptivethresholding [16].
ATFD benefits from the characteristics that are unique tothermal footprints. Specifically, when two initial footprintshave been segmented, size can be inferred from the knowndimensions of the user’s foot, after which themonocular scaleambiguity problem can be solved. Furthermore, the segmen-tation of the subsequent pair of thermal footprints reveals theuser’s heading, based on the natural stance with the centre ofmass between the two legs. This provides a valuable oppor-tunity to exploit applications such as people tracking, deadreckoning, self-localisation, and GPS-denied navigation.
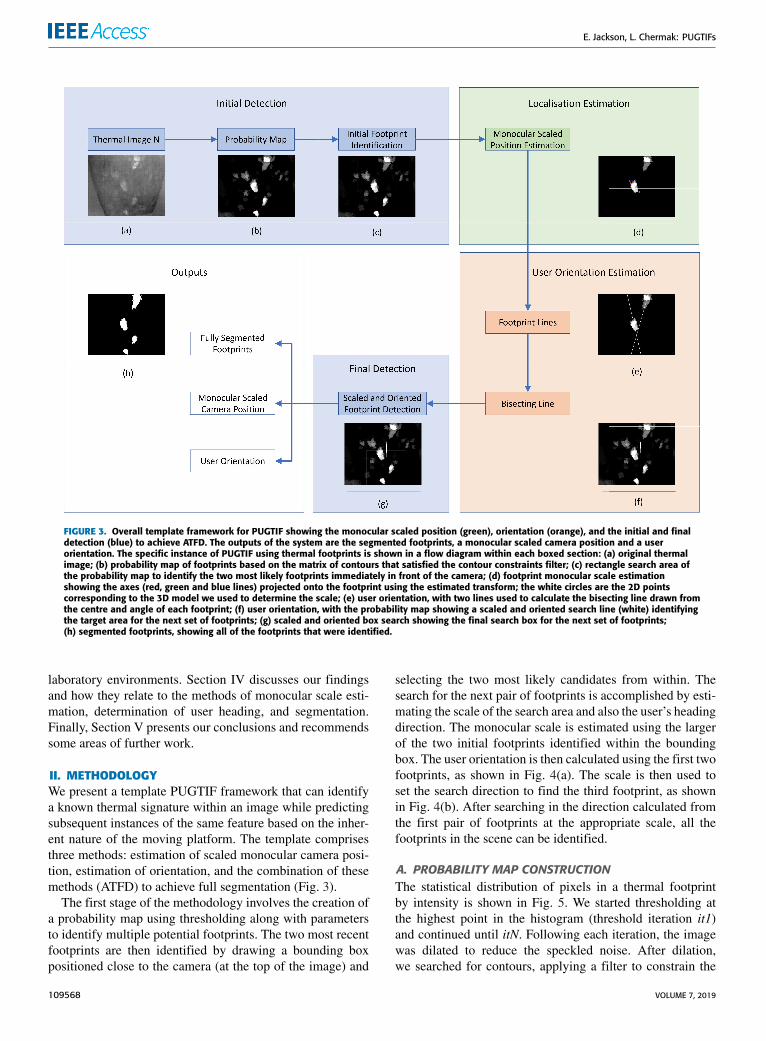
As an example, navigation using a monocular cameraraises three major challenges: feature availability, scale
FIGURE 2. The three major challenges in camera-based localisation.Features are matched with either temporally variant images or knownworld objects to estimate for scale/camera position. The quality of theestimation is strongly influenced by the selected feature. The ability tomatch this feature consistently determines the amount of drift the systemwill develop over time.
ambiguity, and relative drift (Fig. 2). Given that classical fea-ture detectors depend on illumination and structured contentin the environment, the lack of (or inability to detect) suchfeatures would severely degrade the performance of subse-quent processes, resulting in drift. Using a monocular camerain the ideal case, where the scene presents advantageouscharacteristics for a detector and features are detected con-sistently, transformation from two-dimensional (2D) imagepixels into three-dimensional (3D) point world coordinateswould involve an unknown scale. For classical approaches,detected features belong to objects of unknown size, so thereis no direct way to solve the scale ambiguity problem. In con-trast, a passively user-generated, periodic feature with knownreal-world dimensions independent of the scene contentand related drift issues (i.e., PUGTIFs) can overcome thesechallenges.
The work discussed in this paper makes the followingcontributions to the field:• Utilisation of PUGTIFs, specifically the instance of auser’s footprint observed in the thermal spectrum, as apassively self-generated feature.
• A solution to monocular scale estimation, available forevery frame based on the utilisation of a priori knowl-edge about the user’s real-world footprint size.
• Development of amethod to estimate user heading basedon knowledge of the natural human stance and gait.
• Development of a segmentation and detection method(ATFD) that uses both the user’s heading and monocularscale estimation to segment all thermal footprints.
The remainder of this paper is structured as follows.Section II introduces the threemethods of the PUGTIF frame-work and the calculations required to determine scale andthe user’s heading. Section III analyses and evaluates theperformance of the ATFD segmentation method in different
VOLUME 7, 2019 109567
E. Jackson, L. Chermak: PUGTIFs
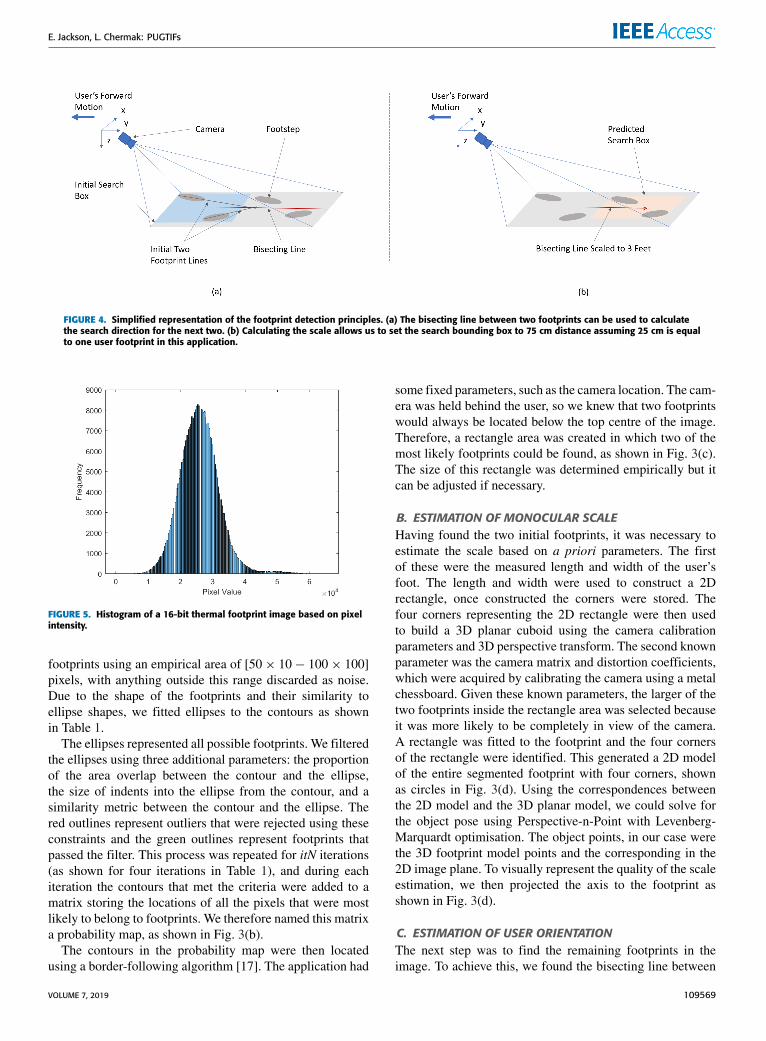
FIGURE 3. Overall template framework for PUGTIF showing the monocular scaled position (green), orientation (orange), and the initial and finaldetection (blue) to achieve ATFD. The outputs of the system are the segmented footprints, a monocular scaled camera position and a userorientation. The specific instance of PUGTIF using thermal footprints is shown in a flow diagram within each boxed section: (a) original thermalimage; (b) probability map of footprints based on the matrix of contours that satisfied the contour constraints filter; (c) rectangle search area ofthe probability map to identify the two most likely footprints immediately in front of the camera; (d) footprint monocular scale estimationshowing the axes (red, green and blue lines) projected onto the footprint using the estimated transform; the white circles are the 2D pointscorresponding to the 3D model we used to determine the scale; (e) user orientation, with two lines used to calculate the bisecting line drawn fromthe centre and angle of each footprint; (f) user orientation, with the probability map showing a scaled and oriented search line (white) identifyingthe target area for the next set of footprints; (g) scaled and oriented box search showing the final search box for the next set of footprints;(h) segmented footprints, showing all of the footprints that were identified.
laboratory environments. Section IV discusses our findingsand how they relate to the methods of monocular scale esti-mation, determination of user heading, and segmentation.Finally, Section V presents our conclusions and recommendssome areas of further work.
II. METHODOLOGYWe present a template PUGTIF framework that can identifya known thermal signature within an image while predictingsubsequent instances of the same feature based on the inher-ent nature of the moving platform. The template comprisesthree methods: estimation of scaled monocular camera posi-tion, estimation of orientation, and the combination of thesemethods (ATFD) to achieve full segmentation (Fig. 3).
The first stage of the methodology involves the creation ofa probability map using thresholding along with parametersto identify multiple potential footprints. The two most recentfootprints are then identified by drawing a bounding boxpositioned close to the camera (at the top of the image) and
selecting the two most likely candidates from within. Thesearch for the next pair of footprints is accomplished by esti-mating the scale of the search area and also the user’s headingdirection. The monocular scale is estimated using the largerof the two initial footprints identified within the boundingbox. The user orientation is then calculated using the first twofootprints, as shown in Fig. 4(a). The scale is then used toset the search direction to find the third footprint, as shownin Fig. 4(b). After searching in the direction calculated fromthe first pair of footprints at the appropriate scale, all thefootprints in the scene can be identified.
A. PROBABILITY MAP CONSTRUCTIONThe statistical distribution of pixels in a thermal footprintby intensity is shown in Fig. 5. We started thresholding atthe highest point in the histogram (threshold iteration it1)and continued until itN. Following each iteration, the imagewas dilated to reduce the speckled noise. After dilation,we searched for contours, applying a filter to constrain the
109568 VOLUME 7, 2019
E. Jackson, L. Chermak: PUGTIFs
FIGURE 4. Simplified representation of the footprint detection principles. (a) The bisecting line between two footprints can be used to calculatethe search direction for the next two. (b) Calculating the scale allows us to set the search bounding box to 75 cm distance assuming 25 cm is equalto one user footprint in this application.
FIGURE 5. Histogram of a 16-bit thermal footprint image based on pixelintensity.
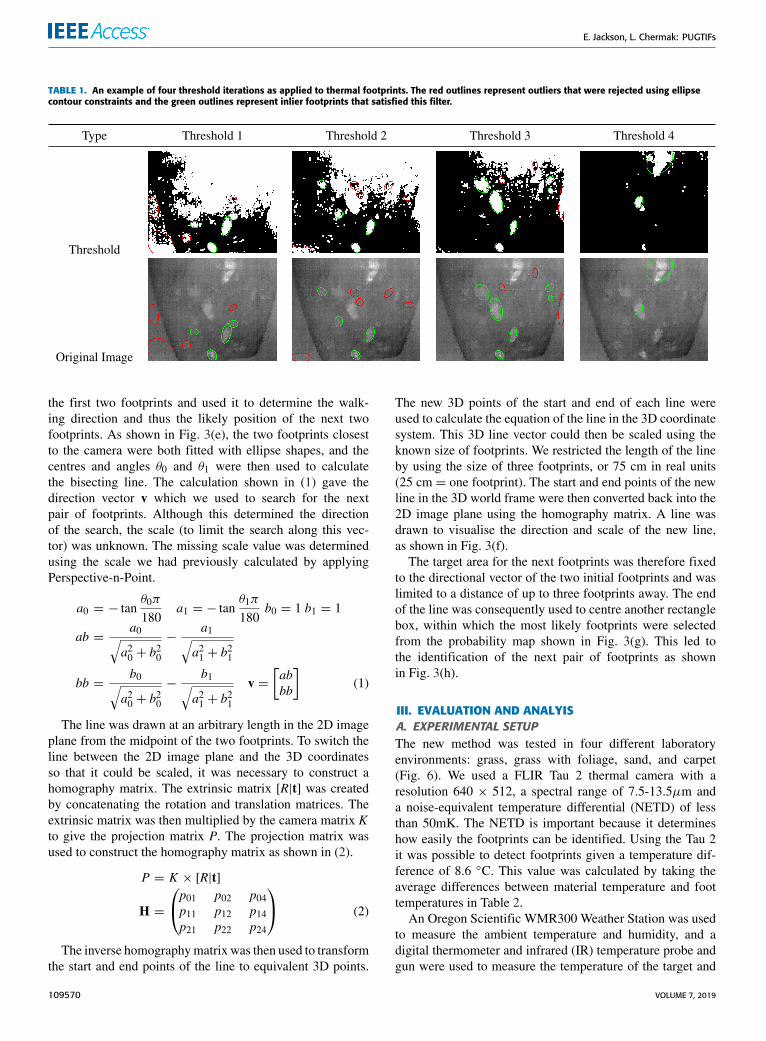
footprints using an empirical area of [50× 10− 100× 100]pixels, with anything outside this range discarded as noise.Due to the shape of the footprints and their similarity toellipse shapes, we fitted ellipses to the contours as shownin Table 1.
The ellipses represented all possible footprints. We filteredthe ellipses using three additional parameters: the proportionof the area overlap between the contour and the ellipse,the size of indents into the ellipse from the contour, and asimilarity metric between the contour and the ellipse. Thered outlines represent outliers that were rejected using theseconstraints and the green outlines represent footprints thatpassed the filter. This process was repeated for itN iterations(as shown for four iterations in Table 1), and during eachiteration the contours that met the criteria were added to amatrix storing the locations of all the pixels that were mostlikely to belong to footprints. We therefore named this matrixa probability map, as shown in Fig. 3(b).
The contours in the probability map were then locatedusing a border-following algorithm [17]. The application had
some fixed parameters, such as the camera location. The cam-era was held behind the user, so we knew that two footprintswould always be located below the top centre of the image.Therefore, a rectangle area was created in which two of themost likely footprints could be found, as shown in Fig. 3(c).The size of this rectangle was determined empirically but itcan be adjusted if necessary.
B. ESTIMATION OF MONOCULAR SCALEHaving found the two initial footprints, it was necessary toestimate the scale based on a priori parameters. The firstof these were the measured length and width of the user’sfoot. The length and width were used to construct a 2Drectangle, once constructed the corners were stored. Thefour corners representing the 2D rectangle were then usedto build a 3D planar cuboid using the camera calibrationparameters and 3D perspective transform. The second knownparameter was the camera matrix and distortion coefficients,which were acquired by calibrating the camera using a metalchessboard. Given these known parameters, the larger of thetwo footprints inside the rectangle area was selected becauseit was more likely to be completely in view of the camera.A rectangle was fitted to the footprint and the four cornersof the rectangle were identified. This generated a 2D modelof the entire segmented footprint with four corners, shownas circles in Fig. 3(d). Using the correspondences betweenthe 2D model and the 3D planar model, we could solve forthe object pose using Perspective-n-Point with Levenberg-Marquardt optimisation. The object points, in our case werethe 3D footprint model points and the corresponding in the2D image plane. To visually represent the quality of the scaleestimation, we then projected the axis to the footprint asshown in Fig. 3(d).
C. ESTIMATION OF USER ORIENTATIONThe next step was to find the remaining footprints in theimage. To achieve this, we found the bisecting line between
VOLUME 7, 2019 109569
E. Jackson, L. Chermak: PUGTIFs
TABLE 1. An example of four threshold iterations as applied to thermal footprints. The red outlines represent outliers that were rejected using ellipsecontour constraints and the green outlines represent inlier footprints that satisfied this filter.
the first two footprints and used it to determine the walk-ing direction and thus the likely position of the next twofootprints. As shown in Fig. 3(e), the two footprints closestto the camera were both fitted with ellipse shapes, and thecentres and angles θ0 and θ1 were then used to calculatethe bisecting line. The calculation shown in (1) gave thedirection vector v which we used to search for the nextpair of footprints. Although this determined the directionof the search, the scale (to limit the search along this vec-tor) was unknown. The missing scale value was determinedusing the scale we had previously calculated by applyingPerspective-n-Point.
a0 = − tanθ0π
180a1 = − tan
θ1π
180b0 = 1 b1 = 1
ab =a0√
a20 + b20
−a1√
a21 + b21
bb =b0√
a20 + b20
−b1√
a21 + b21
v =[abbb
](1)
The line was drawn at an arbitrary length in the 2D imageplane from the midpoint of the two footprints. To switch theline between the 2D image plane and the 3D coordinatesso that it could be scaled, it was necessary to construct ahomography matrix. The extrinsic matrix [R|t] was createdby concatenating the rotation and translation matrices. Theextrinsic matrix was then multiplied by the camera matrix Kto give the projection matrix P. The projection matrix wasused to construct the homography matrix as shown in (2).
P = K × [R|t]
H =
p01 p02 p04p11 p12 p14p21 p22 p24
(2)
The inverse homographymatrix was then used to transformthe start and end points of the line to equivalent 3D points.
The new 3D points of the start and end of each line wereused to calculate the equation of the line in the 3D coordinatesystem. This 3D line vector could then be scaled using theknown size of footprints. We restricted the length of the lineby using the size of three footprints, or 75 cm in real units(25 cm = one footprint). The start and end points of the newline in the 3D world frame were then converted back into the2D image plane using the homography matrix. A line wasdrawn to visualise the direction and scale of the new line,as shown in Fig. 3(f).
The target area for the next footprints was therefore fixedto the directional vector of the two initial footprints and waslimited to a distance of up to three footprints away. The endof the line was consequently used to centre another rectanglebox, within which the most likely footprints were selectedfrom the probability map shown in Fig. 3(g). This led tothe identification of the next pair of footprints as shownin Fig. 3(h).
III. EVALUATION AND ANALYISA. EXPERIMENTAL SETUPThe new method was tested in four different laboratoryenvironments: grass, grass with foliage, sand, and carpet(Fig. 6). We used a FLIR Tau 2 thermal camera with aresolution 640 × 512, a spectral range of 7.5-13.5µm anda noise-equivalent temperature differential (NETD) of lessthan 50mK. The NETD is important because it determineshow easily the footprints can be identified. Using the Tau 2it was possible to detect footprints given a temperature dif-ference of 8.6 ◦C. This value was calculated by taking theaverage differences between material temperature and foottemperatures in Table 2.An Oregon Scientific WMR300 Weather Station was used
to measure the ambient temperature and humidity, and adigital thermometer and infrared (IR) temperature probe andgun were used to measure the temperature of the target and
109570 VOLUME 7, 2019
E. Jackson, L. Chermak: PUGTIFs
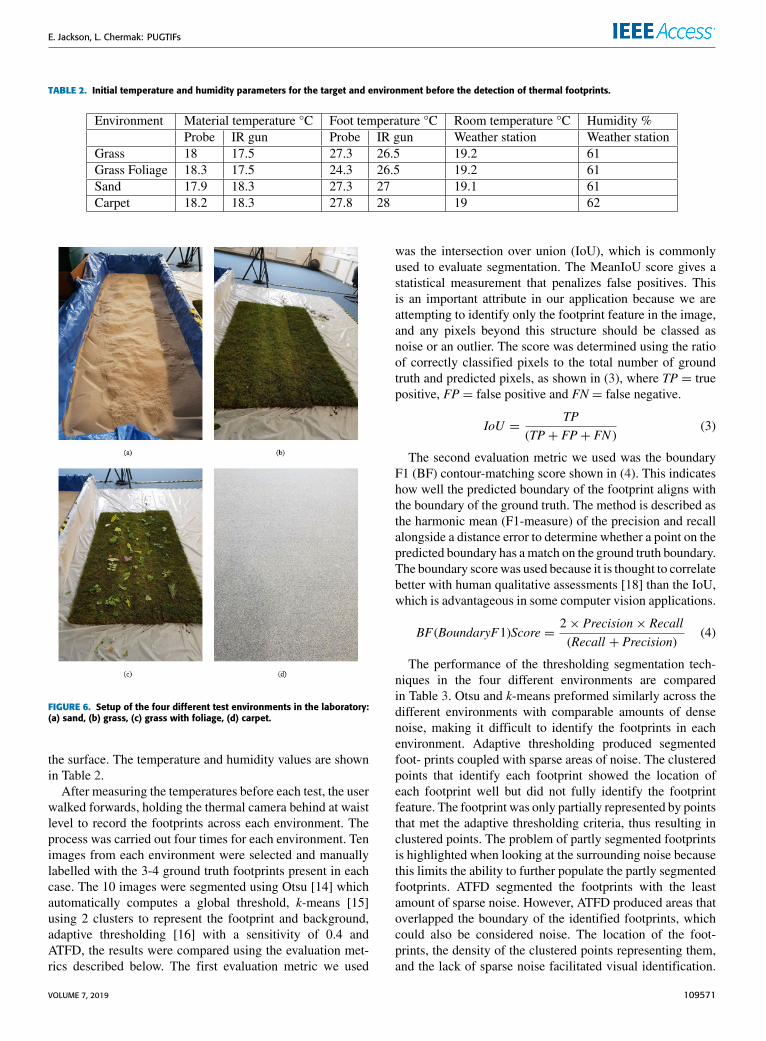
TABLE 2. Initial temperature and humidity parameters for the target and environment before the detection of thermal footprints.
FIGURE 6. Setup of the four different test environments in the laboratory:(a) sand, (b) grass, (c) grass with foliage, (d) carpet.
the surface. The temperature and humidity values are shownin Table 2.
After measuring the temperatures before each test, the userwalked forwards, holding the thermal camera behind at waistlevel to record the footprints across each environment. Theprocess was carried out four times for each environment. Tenimages from each environment were selected and manuallylabelled with the 3-4 ground truth footprints present in eachcase. The 10 images were segmented using Otsu [14] whichautomatically computes a global threshold, k-means [15]using 2 clusters to represent the footprint and background,adaptive thresholding [16] with a sensitivity of 0.4 andATFD, the results were compared using the evaluation met-rics described below. The first evaluation metric we used
was the intersection over union (IoU), which is commonlyused to evaluate segmentation. The MeanIoU score gives astatistical measurement that penalizes false positives. Thisis an important attribute in our application because we areattempting to identify only the footprint feature in the image,and any pixels beyond this structure should be classed asnoise or an outlier. The score was determined using the ratioof correctly classified pixels to the total number of groundtruth and predicted pixels, as shown in (3), where TP = truepositive, FP = false positive and FN = false negative.
IoU =TP
(TP+ FP+ FN )(3)
The second evaluation metric we used was the boundaryF1 (BF) contour-matching score shown in (4). This indicateshow well the predicted boundary of the footprint aligns withthe boundary of the ground truth. The method is described asthe harmonic mean (F1-measure) of the precision and recallalongside a distance error to determine whether a point on thepredicted boundary has amatch on the ground truth boundary.The boundary scorewas used because it is thought to correlatebetter with human qualitative assessments [18] than the IoU,which is advantageous in some computer vision applications.
BF(BoundaryF1)Score =2× Precision× Recall(Recall + Precision)
(4)
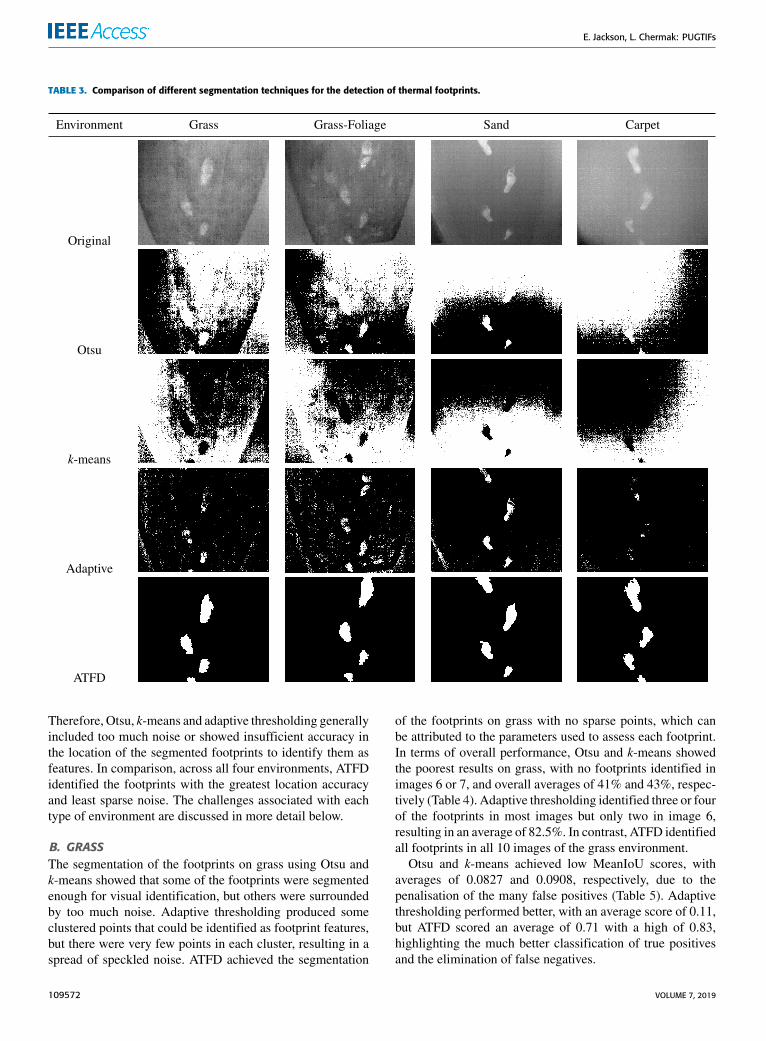
The performance of the thresholding segmentation tech-niques in the four different environments are comparedin Table 3. Otsu and k-means preformed similarly across thedifferent environments with comparable amounts of densenoise, making it difficult to identify the footprints in eachenvironment. Adaptive thresholding produced segmentedfoot- prints coupled with sparse areas of noise. The clusteredpoints that identify each footprint showed the location ofeach footprint well but did not fully identify the footprintfeature. The footprint was only partially represented by pointsthat met the adaptive thresholding criteria, thus resulting inclustered points. The problem of partly segmented footprintsis highlighted when looking at the surrounding noise becausethis limits the ability to further populate the partly segmentedfootprints. ATFD segmented the footprints with the leastamount of sparse noise. However, ATFD produced areas thatoverlapped the boundary of the identified footprints, whichcould also be considered noise. The location of the foot-prints, the density of the clustered points representing them,and the lack of sparse noise facilitated visual identification.
VOLUME 7, 2019 109571
E. Jackson, L. Chermak: PUGTIFs
TABLE 3. Comparison of different segmentation techniques for the detection of thermal footprints.
Therefore, Otsu, k-means and adaptive thresholding generallyincluded too much noise or showed insufficient accuracy inthe location of the segmented footprints to identify them asfeatures. In comparison, across all four environments, ATFDidentified the footprints with the greatest location accuracyand least sparse noise. The challenges associated with eachtype of environment are discussed in more detail below.
B. GRASSThe segmentation of the footprints on grass using Otsu andk-means showed that some of the footprints were segmentedenough for visual identification, but others were surroundedby too much noise. Adaptive thresholding produced someclustered points that could be identified as footprint features,but there were very few points in each cluster, resulting in aspread of speckled noise. ATFD achieved the segmentation
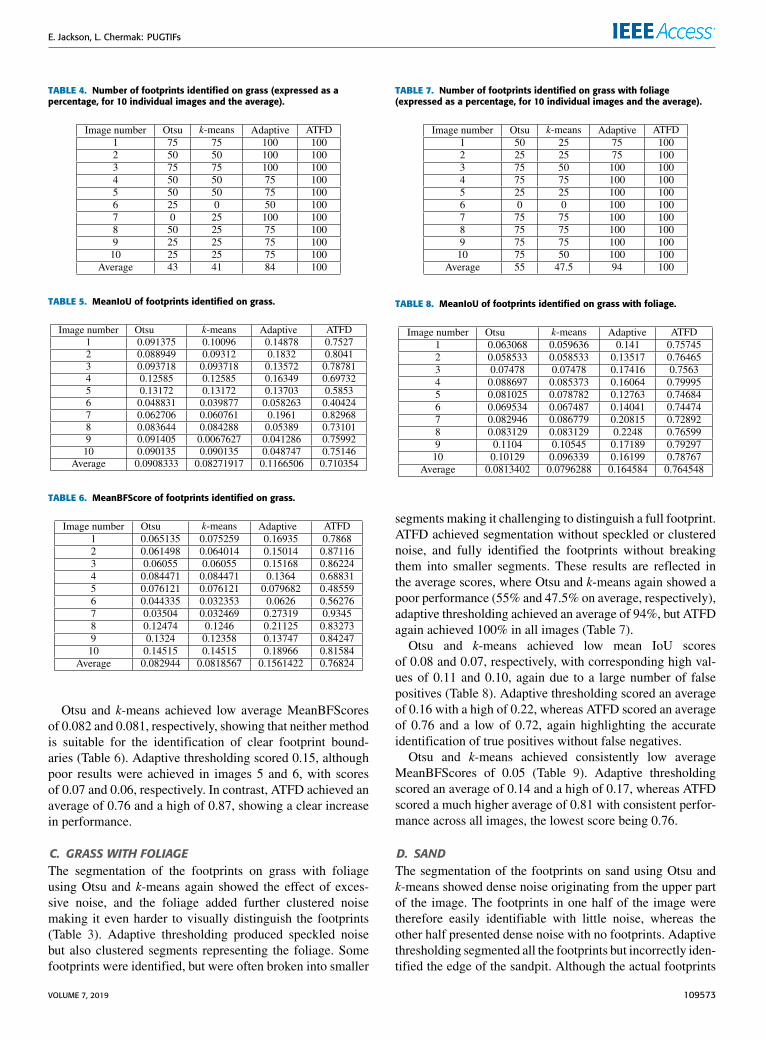
of the footprints on grass with no sparse points, which canbe attributed to the parameters used to assess each footprint.In terms of overall performance, Otsu and k-means showedthe poorest results on grass, with no footprints identified inimages 6 or 7, and overall averages of 41% and 43%, respec-tively (Table 4). Adaptive thresholding identified three or fourof the footprints in most images but only two in image 6,resulting in an average of 82.5%. In contrast, ATFD identifiedall footprints in all 10 images of the grass environment.
Otsu and k-means achieved low MeanIoU scores, withaverages of 0.0827 and 0.0908, respectively, due to thepenalisation of the many false positives (Table 5). Adaptivethresholding performed better, with an average score of 0.11,but ATFD scored an average of 0.71 with a high of 0.83,highlighting the much better classification of true positivesand the elimination of false negatives.
109572 VOLUME 7, 2019
E. Jackson, L. Chermak: PUGTIFs
TABLE 4. Number of footprints identified on grass (expressed as apercentage, for 10 individual images and the average).
TABLE 5. MeanIoU of footprints identified on grass.
TABLE 6. MeanBFScore of footprints identified on grass.
Otsu and k-means achieved low average MeanBFScoresof 0.082 and 0.081, respectively, showing that neither methodis suitable for the identification of clear footprint bound-aries (Table 6). Adaptive thresholding scored 0.15, althoughpoor results were achieved in images 5 and 6, with scoresof 0.07 and 0.06, respectively. In contrast, ATFD achieved anaverage of 0.76 and a high of 0.87, showing a clear increasein performance.
C. GRASS WITH FOLIAGEThe segmentation of the footprints on grass with foliageusing Otsu and k-means again showed the effect of exces-sive noise, and the foliage added further clustered noisemaking it even harder to visually distinguish the footprints(Table 3). Adaptive thresholding produced speckled noisebut also clustered segments representing the foliage. Somefootprints were identified, but were often broken into smaller
TABLE 7. Number of footprints identified on grass with foliage(expressed as a percentage, for 10 individual images and the average).
TABLE 8. MeanIoU of footprints identified on grass with foliage.
segments making it challenging to distinguish a full footprint.ATFD achieved segmentation without speckled or clusterednoise, and fully identified the footprints without breakingthem into smaller segments. These results are reflected inthe average scores, where Otsu and k-means again showed apoor performance (55% and 47.5% on average, respectively),adaptive thresholding achieved an average of 94%, but ATFDagain achieved 100% in all images (Table 7).Otsu and k-means achieved low mean IoU scores
of 0.08 and 0.07, respectively, with corresponding high val-ues of 0.11 and 0.10, again due to a large number of falsepositives (Table 8). Adaptive thresholding scored an averageof 0.16 with a high of 0.22, whereas ATFD scored an averageof 0.76 and a low of 0.72, again highlighting the accurateidentification of true positives without false negatives.
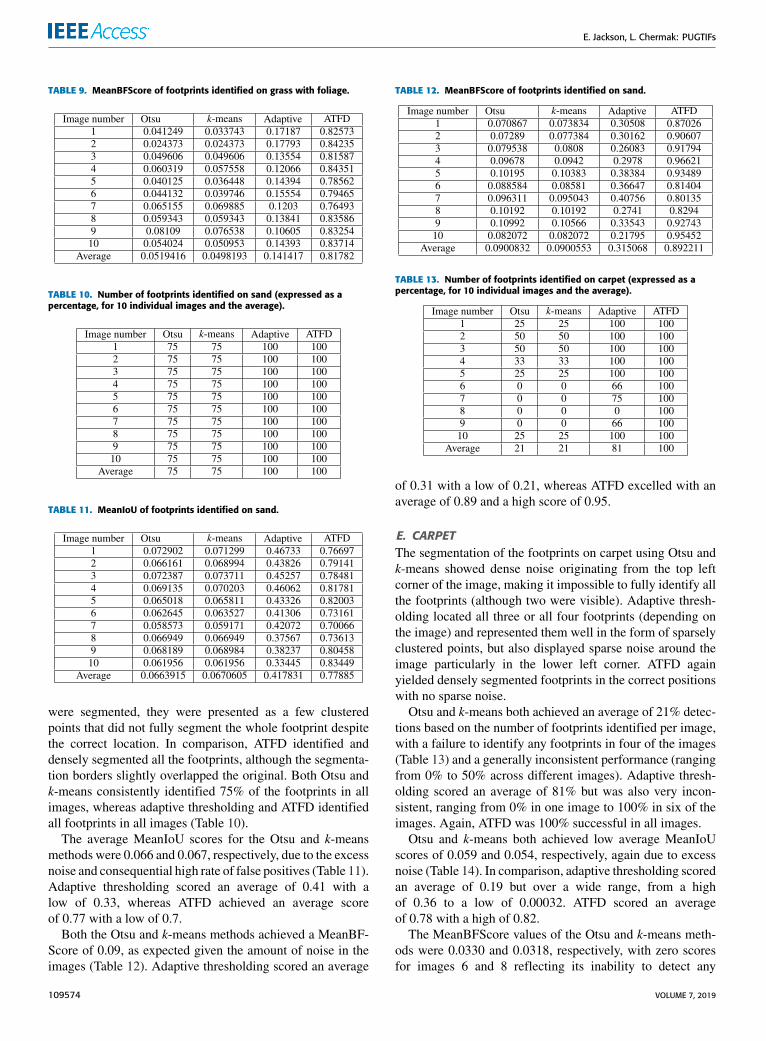
Otsu and k-means achieved consistently low averageMeanBFScores of 0.05 (Table 9). Adaptive thresholdingscored an average of 0.14 and a high of 0.17, whereas ATFDscored a much higher average of 0.81 with consistent perfor-mance across all images, the lowest score being 0.76.
D. SANDThe segmentation of the footprints on sand using Otsu andk-means showed dense noise originating from the upper partof the image. The footprints in one half of the image weretherefore easily identifiable with little noise, whereas theother half presented dense noise with no footprints. Adaptivethresholding segmented all the footprints but incorrectly iden-tified the edge of the sandpit. Although the actual footprints
VOLUME 7, 2019 109573
E. Jackson, L. Chermak: PUGTIFs
TABLE 9. MeanBFScore of footprints identified on grass with foliage.
TABLE 10. Number of footprints identified on sand (expressed as apercentage, for 10 individual images and the average).
TABLE 11. MeanIoU of footprints identified on sand.
were segmented, they were presented as a few clusteredpoints that did not fully segment the whole footprint despitethe correct location. In comparison, ATFD identified anddensely segmented all the footprints, although the segmenta-tion borders slightly overlapped the original. Both Otsu andk-means consistently identified 75% of the footprints in allimages, whereas adaptive thresholding and ATFD identifiedall footprints in all images (Table 10).
The average MeanIoU scores for the Otsu and k-meansmethods were 0.066 and 0.067, respectively, due to the excessnoise and consequential high rate of false positives (Table 11).Adaptive thresholding scored an average of 0.41 with alow of 0.33, whereas ATFD achieved an average scoreof 0.77 with a low of 0.7.
Both the Otsu and k-means methods achieved a MeanBF-Score of 0.09, as expected given the amount of noise in theimages (Table 12). Adaptive thresholding scored an average
TABLE 12. MeanBFScore of footprints identified on sand.
TABLE 13. Number of footprints identified on carpet (expressed as apercentage, for 10 individual images and the average).
of 0.31 with a low of 0.21, whereas ATFD excelled with anaverage of 0.89 and a high score of 0.95.
E. CARPETThe segmentation of the footprints on carpet using Otsu andk-means showed dense noise originating from the top leftcorner of the image, making it impossible to fully identify allthe footprints (although two were visible). Adaptive thresh-olding located all three or all four footprints (depending onthe image) and represented them well in the form of sparselyclustered points, but also displayed sparse noise around theimage particularly in the lower left corner. ATFD againyielded densely segmented footprints in the correct positionswith no sparse noise.
Otsu and k-means both achieved an average of 21% detec-tions based on the number of footprints identified per image,with a failure to identify any footprints in four of the images(Table 13) and a generally inconsistent performance (rangingfrom 0% to 50% across different images). Adaptive thresh-olding scored an average of 81% but was also very incon-sistent, ranging from 0% in one image to 100% in six of theimages. Again, ATFD was 100% successful in all images.
Otsu and k-means both achieved low average MeanIoUscores of 0.059 and 0.054, respectively, again due to excessnoise (Table 14). In comparison, adaptive thresholding scoredan average of 0.19 but over a wide range, from a highof 0.36 to a low of 0.00032. ATFD scored an averageof 0.78 with a high of 0.82.
The MeanBFScore values of the Otsu and k-means meth-ods were 0.0330 and 0.0318, respectively, with zero scoresfor images 6 and 8 reflecting its inability to detect any
109574 VOLUME 7, 2019
E. Jackson, L. Chermak: PUGTIFs
TABLE 14. MeanIoU of footprints identified on carpet.
TABLE 15. MeanBFScore of footprints identified on carpet.
contour boundaries (Table 15). Adaptive thresholding scoredan average of 0.194 (also with a zero score for image 8),whereas ATFD averaged 0.889 with no individual zeroscores.
IV. DISCUSSIONThe concept of PUGTIFs was demonstrated through theinstance of thermal footprints, which highlighted severaladvantages. The features were shown to be passively user-generated as well as inherently non-reliant on the scene con-tent and illumination in several environments. The ability ofthermal footprints to allow for a scaled monocular positionwas confirmed, allowing us to develop a system to estimatethe user heading. Finally, these processes were combined todevelop a method for the segmentation of the PUGTIFs infour environments.
A. ENVIRONMENTSWe found that PUGTIFs were available in four diverseenvironments. The grass environment is representative ofmany situations, including the middle of an open grass field,in which the features are far away. This would present achallenge for classical feature detection methods because thescene contains very little content and the salient featuresare far away. Even so, we have shown that a thermal foot-print feature is available. Similarly, the grass with foliageenvironment simulates more complex grass scenes, such asforests or fields with foliage, but we have shown thermalfootprints are present and can be detected. The carpet environ-ment can represent several classical feature scenes, includinga plain wall in a room. The classical feature approach wouldpick up poor features and a lot of noise due to the absenceof significant scene content. However, thermal footprints aresuitable features even in this environment. Similarly, the sand
environment represents a desert scene, which provides verylittle content for classical feature detectors, but we haveshown that thermal footprints are present in this contexttoo. Representation in all these environments shows thatPUGTIFs are available to be utilised.We have described threemethods that are required to utilise thermal footprints.
B. MONOCULAR SCALED LOCALISATIONThe first method is the estimation of monocular scaled posi-tion. The ability to estimate the position accurately and thusdetermine the scale is entirely dependent on the initial seg-mentation phase of the framework, hence the performanceis reflected in the overall ATFD scores. The score assessingthe boundary of the footprints gives a good indication as tothe accuracy of localisation. This is because the estimationof monocular scaled position is dependent on the corre-spondence between a 3D world model of the foot and theassociated 2D image of the thermal footprint. The averageMeanBFScores across each environment were 0.77, 0.82,0.90 and 0.89, showing that a strong 2D model was availableto use as a representation of the 3D counterpart. Therefore,we can expect a good estimate of the monocular scaled posi-tion. This is supported by the detection rate of ATFD, whichinherently uses the estimated scale and frequently achievesaverage scores of 100%.
C. USER HEADINGThe second method is the estimation of user heading. Thesuccess of this method can be determined by looking atthe average ATDF scores, which depend on the orientationestimation method. The scores, sometimes averaging 100%,reflect the ability of the method to accurately locate a searcharea for the next footprints.
D. SEGMENTATIONThe combination of the first two methods gives rise to theATFD approach, which allows the segmentation of thermalfootprints while also estimating the scale and orientation.We compared our method in terms of segmentation perfor-mance to three other common segmentation techniques infour different laboratory environments.We found that the newmethod was superior and also necessary to achieve the correctsegmentation of thermal footprints.
In grass, the segmentation of this feature using currentmethods achieved a maximum MeanIoU score of 0.11,whereas ATFD achieved a score of 0.76 as well as higheridentification and boundary scores. Similarly, the ATFDmethod outperformed its competitors in grass with foliage,achieving a MeanIoU score of 0.76 and a MeanBFScoreof 0.81, compared to maximum values of 0.16 and 0.14,respectively, for the othermethods. In the carpet environment,ATFD achieved a MeanIoU score of 0.78 compared to amaximum of 0.19 for the other methods, confirming that it isnecessary for feature detection in an indoor carpeted environ-ment. In the sand environment, ATFD segmented the thermalfootprint feature with a MeanIoU score of 0.77, comparedto a maximum of 0.4 for the other methods. By comparing
VOLUME 7, 2019 109575
E. Jackson, L. Chermak: PUGTIFs
multiple threshold segmentation methods in several differentenvironments, we confirmed that ATDF is necessary for thedetection of thermal footprint features. The efficiency withwhich segmentation was achieved reflected the ability of theindividual methods to estimatemonocular scaled position anduser heading.
We have demonstrated the application and feasibility ofPUGTIFs, i.e. features that are consistently user generated aslong as the sensor can measure the heat difference betweenthe platform and environment. We used the instance of athermal footprint to demonstrate the availability of PUGTIFsin four different environments. We confirmed that PUGTIFscan be used to estimate a scaled position using only one cam-era and from a single image, followed by the determinationof user heading. Finally, these methods were combined tosegment thermal footprints, achieving much higher MeanIoUandMeanBFScore values than three competing segmentationmethods.
V. FUTURE WORK AND APPLICATIONSPUGTIFs allow the use of passively user-generated featuresthat are consistently present as long as the thermal sensor canidentify the signature. The application of this approach couldbe extremely beneficial considering current methods rely onclassical features that are dependent on the scene and thusnot repeatable consistently, particularly in the case of locali-sation and tracking, where feature quality and repeatabilityare fundamental to success [19]. PUGTIFs can be used inany environment given the availability of a thermal sensor.We have confirmed that such features solve for monocularscaled position as well as user heading, already showing theapplication of localisation from a single image. We havetherefore explored the wider field of localisation, mappingand navigation applications, but further work is necessaryto evaluate the broader possibilities of PUGTIFs. Futureresearch should therefore consider the diverse applications ofPUGTIFs and focus on those with the greatest potential forexploitation.
ACKNOWLEDGMENTCurrently my work is patent pending by BAE Systems.
REFERENCES[1] T. Tuytelaars and K. Mikolajczyk, ‘‘Local invariant feature detectors:
A survey,’’ Found. Trends Comput. Graph. Vis., vol. 3, pp. 177–280,Nov. 2007.
[2] D. G. Lowe, ‘‘Distinctive image features from scale-invariant keypoints,’’Int. J. Comput. Vis., vol. 60, no. 2, pp. 91–110, 2004.
[3] H. Bay, A. Ess, T. Tuytelaars, and L. Van Gool, ‘‘Speeded-up robustfeatures (SURF),’’ Comput. Vis. Image Understand., vol. 110, no. 3,pp. 346–359, 2008.
[4] E. Rublee, V. Rabaud, K. Konolige, and G. Bradski, ‘‘ORB: An efficientalternative to SIFT or SURF,’’ inProc. IEEE Int. Conf. Comput., Nov. 2011,pp. 2564–2571.
[5] S. Leutenegger, M. Chli, and R. Siegwart, ‘‘BRISK: Binary robust invari-ant scalable keypoints,’’ in Proc. IEEE Int. Conf. Comput., Nov. 2011,pp. 2548–2555.
[6] E. Rosten and T. Drummond, ‘‘Fusing points and lines for high perfor-mance tracking,’’ inProc. 10th IEEE Int. Conf. Comput. Vis. (ICCV), vol. 2,Oct. 2005, pp. 1508–1515.
[7] J. Canny, ‘‘A computational approach to edge detection,’’ IEEE Trans.Pattern. Anal. Mach. Intell., vol. PAMI-8, no. 6, pp. 679–698, Nov. 1986.
[8] J. Matas, O. Chum, M. Urban, and T. Pajdla, ‘‘Robust wide baseline stereofrom maximally stable extremal regions,’’ Image Vis. Comput., vol. 22,no. 10, pp. 761–767, 2004.
[9] R. Achanta, F. Estrada, P. Wils, and S. Süsstrunk, ‘‘Salient region detectionand segmentation,’’ in Computer Vision Systems (Lecture Notes in Com-puter Science), vol. 5008, A. Gasteratos, M. Vincze, and J. K. Tsotsos, Eds.Berlin, Germany: Springer, 2008, pp. 65–75.
[10] M. El-Gayar, H. Soliman, and N. Meky, ‘‘A comparative study of imagelow level feature extraction algorithms,’’ Egyptian Informat. J., vol. 14,no. 2, pp. 175–181, 2013.
[11] J. Heinly, E. Dunn, and J.-M. Frahm, ‘‘Comparative evaluation of binaryfeatures,’’ in Computer Vision—ECCV, A. Fitzgibbon, S. Lazebnik, P. Per-ona, Y. Sato, and C. Schmid, Eds. Berlin, Germany: Springer, 2012,pp. 759–773.
[12] B. Ferrarini, S. Ehsan, N. U. Rehman, and K. D. McDonald-Maier, ‘‘Per-formance comparison of image feature detectors utilizing a large numberof scenes,’’ J. Electron. Imag., vol. 25, no. 1, 2016, Art. no. 010501.
[13] B. Ferrarini, S. Ehsan, A. Leonardis, N. U. Rehman, andK. D. McDonald-Maier, ‘‘Performance characterization of imagefeature detectors in relation to the scene content utilizing a large imagedatabase,’’ IEEE Access, vol. 6, pp. 8564–8573, 2018.
[14] N. Otsu, ‘‘A threshold selection method from gray-level histograms,’’IEEE Trans. Syst., Man, Cybern., vol. SMC-9, no. 1, pp. 62–66,Jan. 1979.
[15] D. Arthur and S. Vassilvitskii, ‘‘K-means++: The advantages of carefulseeding,’’ in Proc. 18th Annu. ACM-SIAM Symp. Discrete Algorithms(SODA). Philadelphia, PA, USA: SIAM, 2007, pp. 1027–1035.
[16] D. Bradley and G. Roth, ‘‘Adaptive thresholding using the integral image,’’J. Graph. Tools, vol. 12, no. 2, pp. 13–21, 2007.
[17] S. Suzuki and K. Be, ‘‘Topological structural analysis of digitized binaryimages by border following,’’ Comput. Vis., Graph., Image Process.,vol. 30, no. 1, pp. 32–46, 1985.
[18] G. Csurka, D. Larlus, and F. Perronnin, ‘‘What is a good evaluationmeasure for semantic segmentation?’’ in Proc. BMVC, 2013, pp. 1–11.
[19] D. Scaramuzza and F. Fraundorfer, ‘‘Visual odometry [tutorial],’’ IEEERobot. Autom. Mag., vol. 18, no. 4, pp. 80–92, Dec. 2011.
EDWARD JACKSON received the B.Eng. degree(Hons.) in electrical and electronic engineeringfrom Northumbria University, Newcastle, U.K.,in 2016. He is currently pursuing the Ph.D. degreein computer vision with Cranfield University. Hejoined the Autonomy Group, Centre of Elec-tronic Warfare Information and Cyber, School ofDefence and Security, in 2016. Previously, he waswith the Rutherford Appleton Laboratory Space,Imaging Systems Department. He currently works
in computer vision for localization and autonomous navigation.
LOUNIS CHERMAK (M’12) received the Engi-neering degree in electrical engineering fromPoly-tech Grenoble, Grenoble, France, in 2010, andthe M.Sc. and Ph.D. degrees in computer visionfrom Cranfield University, Cranfield, Shrivenham,U.K., in 2011 and 2014, respectively. From 2014 to2017, he was a Research Fellow, and since 2017,he has been an Assistant Professor in computervision and autonomous systems with CranfieldUniversity, where he currently leads the Auton-
omy Group and Autonomous Systems Laboratory, Centre of ElectronicWarfare Information and Cyber, School of Defence and Security. He hasauthored or coauthored several technical papers, and has been a reviewerfor high-impact journals and conferences. His research interests includedevelopment and implementation of techniques and algorithms for visual-based aerial, ground, and space applications toward autonomousmobility. Hewas a recipient of the Selwyn Award from the Royal Photography Society,in 2017. He has been appointed as a Technical Member and the Co-Chairof one of the Autonomous Vehicle Technology Exploratory Teams, NATOScience and Technology Organization, since 2018.
109576 VOLUME 7, 2019