Embed Size (px)
Citation preview
Public Version of the Staff Report
_________________________________________________________________
UNITED STATES INTERNATIONAL TRADE COMMISSION
Washington, DC
_________________________________________________________________
CARBON AND CERTAIN ALLOY STEEL WIRE ROD FROM CHINA
Staff Report Investigation Nos. 701-TA-512 and 731-TA-1248 (Final)
Staff assigned:
Carolyn Esko, Investigator (205-3002) Karl Tsuji, Industry Analyst (205-3434) Samantha Day, Economist (205-2088) Charles Yost, Accountant (205-3432)
Mara Alexander, Statistician (205-2538) Carolyn Holmes, Statistical Assistant (205-3168)
Charles St. Charles, Attorney (205-3782) Douglas Corkran, Supervisory Investigator (205-3057)
December 2, 2014

CONTENTS
Page
Introduction ................................................................................................................... I-1 Part I:
Background ...................................................................................................................................... I-1
Statutory criteria and organization of the report ............................................................................ I-3
Statutory criteria .......................................................................................................................... I-3
Organization of report.................................................................................................................. I-4
Market summary .............................................................................................................................. I-5
Summary data and data sources ...................................................................................................... I-6
Previous and related investigations ................................................................................................. I-6
Prior investigations ....................................................................................................................... I-6
Safeguard investigation ................................................................................................................ I-9
Nature and extent of subsidies and sales at LTFV ......................................................................... I-10
Subsidies ..................................................................................................................................... I-10
Sales at LTFV ............................................................................................................................... I-14
The subject merchandise ............................................................................................................... I-16
Commerce’s scope ..................................................................................................................... I-16
Tariff treatment .......................................................................................................................... I-16
The product .................................................................................................................................... I-17
Description and uses .................................................................................................................. I-17
Manufacturing processes ........................................................................................................... I-20
Domestic like product issues .......................................................................................................... I-27
Part II: Conditions of competition in the U.S. market ................................................................ II-1
U.S. market characteristics ............................................................................................................. II-1
Channels of distribution .................................................................................................................. II-1
Geographic distribution .................................................................................................................. II-2
U.S. purchasers ................................................................................................................................ II-3
Supply and demand considerations ................................................................................................ II-5
U.S. supply ................................................................................................................................... II-5
U.S. demand .............................................................................................................................. II-13
i
CONTENTS
Page
Part II: Conditions of competition in the U.S. market--Continued
Substitutability issues .................................................................................................................... II-18
Lead times ................................................................................................................................. II-18
Knowledge of country sources .................................................................................................. II-19
Factors affecting purchasing decisions ..................................................................................... II-20
Comparisons of domestic products, subject imports, and nonsubject imports ....................... II-27
Comparison of U.S.-produced and importer wire rod .............................................................. II-30
Elasticity estimates ........................................................................................................................ II-32
U.S. supply elasticity .................................................................................................................. II-33
U.S. demand elasticity ............................................................................................................... II-33
Substitution elasticity ................................................................................................................ II-34
Part III: U.S. producers’ production, shipments, and employment ............................................ III-1
U.S. producers ................................................................................................................................ III-1
U.S. production, capacity, and capacity utilization ........................................................................ III-5
Wire rod ..................................................................................................................................... III-5
Overall capacity and production ................................................................................................ III-6
U.S. producers’ U.S. shipments and exports .................................................................................. III-9
U.S. shipments by application .................................................................................................. III-11
Captive consumption ................................................................................................................... III-14
Transfers and sale of significant production of the domestic like product ............................. III-14
First statutory criterion in captive consumption ..................................................................... III-15
Second statutory criterion in captive consumption ................................................................. III-16
Third statutory criterion in captive consumption .................................................................... III-16
U.S. producers’ inventories .......................................................................................................... III-17
U.S. employment, wages, and productivity ................................................................................. III-18
ii
CONTENTS
Page
Part IV: U.S. imports, apparent U.S. consumption, and market shares...................................... IV-1
U.S. importers ............................................................................................................................... IV-1
U.S. imports ................................................................................................................................... IV-4
China .......................................................................................................................................... IV-4
Nonsubject countries ................................................................................................................ IV-6
U.S. shipments of imports by application ................................................................................. IV-7
Negligible imports ................................................................................................................... IV-11
Critical circumstances ................................................................................................................. IV-12
Apparent U.S. consumption ........................................................................................................ IV-18
Total apparent U.S. consumption and market shares ............................................................ IV-18
Merchant market apparent U.S. consumption and market shares ........................................ IV-20
Part V: Pricing data .................................................................................................................. V-1
Factors affecting prices .................................................................................................................. V-1
Raw material costs ..................................................................................................................... V-1
U.S. inland transportation costs ................................................................................................. V-4
Pricing practices ............................................................................................................................. V-5
Pricing methods.......................................................................................................................... V-5
Sales terms and discounts .......................................................................................................... V-6
Price leadership .......................................................................................................................... V-7
Price data ....................................................................................................................................... V-7
Price trends .............................................................................................................................. V-19
Price comparisons .................................................................................................................... V-19
Lost sales and lost revenue .......................................................................................................... V-21
Additional information from lost sales and lost revenue responses ....................................... V-33
iii
CONTENTS
Page
Part VI: Financial experience of U.S. producers ........................................................................ VI-1
Background ................................................................................................................................... VI-1
Operations on wire rod ................................................................................................................. VI-2
Total net sales quantity and value .......................................................................................... VI-14
Operating costs and expenses ................................................................................................ VI-15
Profitability .............................................................................................................................. VI-20
Variance analysis ......................................................................................................................... VI-21
Capital expenditures and research and development expenses ................................................ VI-24
Assets and return on investment ................................................................................................ VI-25
Capital and investment ............................................................................................................... VI-26
Actual negative effects ............................................................................................................ VI-27
Anticipated negative effects ................................................................................................... VI-28
Part VII: Threat considerations and information on nonsubject countries ............................... VII-1
The industry in China ................................................................................................................... VII-3
Overview .................................................................................................................................. VII-3
Operations on wire rod ............................................................................................................ VII-8
Alternative products .............................................................................................................. VII-11
U.S. inventories of imported merchandise ................................................................................ VII-13
U.S. importers’ outstanding orders ............................................................................................ VII-14
Antidumping or countervailing duty orders in third-country markets ...................................... VII-14
Information on nonsubject countries ........................................................................................ VII-15
General information ............................................................................................................... VII-15
Canada .................................................................................................................................... VII-18
Other leading sources of wire rod to the United States ........................................................ VII-18
iv
CONTENTS
Page
Appendixes
A. Federal Register notices ......................................................................................................... A-1
B. Calendar of the public hearing ................................................................................................ B-1
C. Summary data ......................................................................................................................... C-1
D. Nonsubject country price data ............................................................................................... D-1
E. Results of merchant market operations by U.S. producers .................................................... E-1
Note.—Information that would reveal confidential operations of individual concerns may not be published and therefore has been redacted and replaced with asterisks.
v

PART I: INTRODUCTION
BACKGROUND
These investigations result from a petition filed with the U.S. Department of Commerce
(“Commerce”) and the U.S. International Trade Commission (“USITC” or “Commission”) by
ArcelorMittal USA LLC (“ArcelorMittal”), Chicago, Illinois; Charter Steel (“Charter”), Saukville,
Wisconsin; Evraz Pueblo1 (“Evraz”), Pueblo, Colorado; Gerdau Ameristeel US Inc. (“Gerdau”),
Tampa, Florida; Keystone Consolidated Industries, Inc. (“Keystone”), Dallas, Texas; and Nucor
Corporation (“Nucor”), Charlotte, North Carolina, on January 31, 2014, alleging that an industry
in the United States is materially injured and threatened with material injury by reason of
subsidized and less-than-fair-value (“LTFV”) imports of carbon and certain alloy steel wire rod
(“wire rod”)2 from China. The following tabulation provides information relating to the
background of these investigations.3 4
1 On January 31, 2014, Evraz Rocky Mountain Steel became Evraz Pueblo. 2 See the section entitled “The Subject Merchandise” in Part I of this report for a complete
description of the merchandise subject to these investigations. 3 Pertinent Federal Register notices are referenced in appendix A, and may be found at the
Commission’s website (www.usitc.gov). 4 A list of witnesses appearing at the hearing is presented in appendix B of this report.
I-1
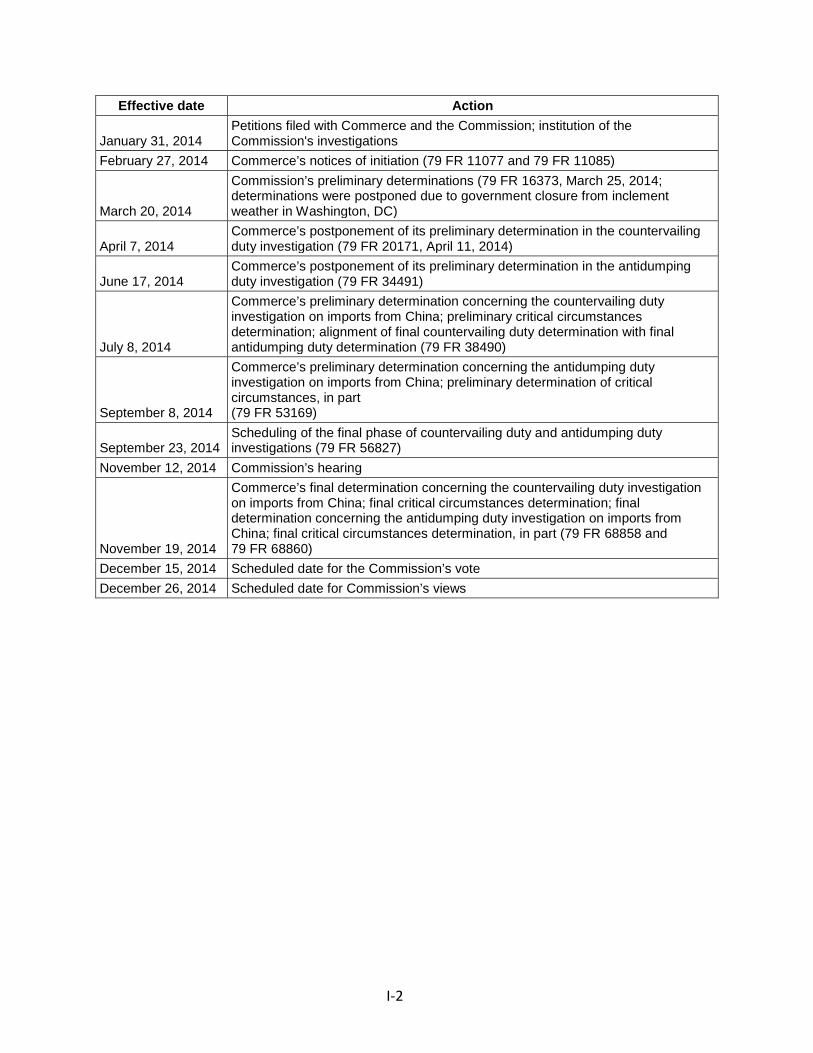
Effective date Action
January 31, 2014 Petitions filed with Commerce and the Commission; institution of the Commission's investigations
February 27, 2014 Commerce’s notices of initiation (79 FR 11077 and 79 FR 11085)
March 20, 2014
Commission’s preliminary determinations (79 FR 16373, March 25, 2014; determinations were postponed due to government closure from inclement weather in Washington, DC)
April 7, 2014 Commerce’s postponement of its preliminary determination in the countervailing duty investigation (79 FR 20171, April 11, 2014)
June 17, 2014 Commerce’s postponement of its preliminary determination in the antidumping duty investigation (79 FR 34491)
July 8, 2014
Commerce’s preliminary determination concerning the countervailing duty investigation on imports from China; preliminary critical circumstances determination; alignment of final countervailing duty determination with final antidumping duty determination (79 FR 38490)
September 8, 2014
Commerce’s preliminary determination concerning the antidumping duty investigation on imports from China; preliminary determination of critical circumstances, in part (79 FR 53169)
September 23, 2014 Scheduling of the final phase of countervailing duty and antidumping duty investigations (79 FR 56827)
November 12, 2014 Commission’s hearing
November 19, 2014
Commerce’s final determination concerning the countervailing duty investigation on imports from China; final critical circumstances determination; final determination concerning the antidumping duty investigation on imports from China; final critical circumstances determination, in part (79 FR 68858 and 79 FR 68860)
December 15, 2014 Scheduled date for the Commission’s vote December 26, 2014 Scheduled date for Commission’s views
I-2
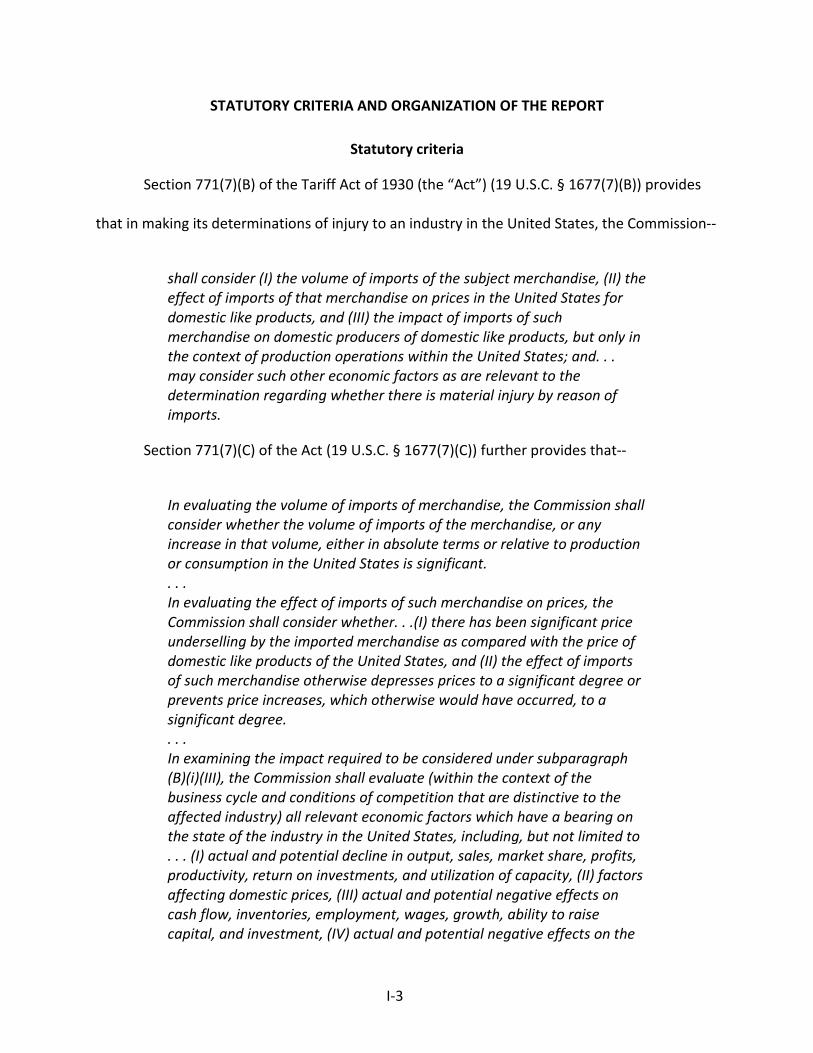
STATUTORY CRITERIA AND ORGANIZATION OF THE REPORT
Statutory criteria
Section 771(7)(B) of the Tariff Act of 1930 (the “Act”) (19 U.S.C. § 1677(7)(B)) provides
that in making its determinations of injury to an industry in the United States, the Commission--
shall consider (I) the volume of imports of the subject merchandise, (II) the effect of imports of that merchandise on prices in the United States for domestic like products, and (III) the impact of imports of such merchandise on domestic producers of domestic like products, but only in the context of production operations within the United States; and. . . may consider such other economic factors as are relevant to the determination regarding whether there is material injury by reason of imports.
Section 771(7)(C) of the Act (19 U.S.C. § 1677(7)(C)) further provides that--
In evaluating the volume of imports of merchandise, the Commission shall consider whether the volume of imports of the merchandise, or any increase in that volume, either in absolute terms or relative to production or consumption in the United States is significant. . . . In evaluating the effect of imports of such merchandise on prices, the Commission shall consider whether. . .(I) there has been significant price underselling by the imported merchandise as compared with the price of domestic like products of the United States, and (II) the effect of imports of such merchandise otherwise depresses prices to a significant degree or prevents price increases, which otherwise would have occurred, to a significant degree. . . . In examining the impact required to be considered under subparagraph (B)(i)(III), the Commission shall evaluate (within the context of the business cycle and conditions of competition that are distinctive to the affected industry) all relevant economic factors which have a bearing on the state of the industry in the United States, including, but not limited to . . . (I) actual and potential decline in output, sales, market share, profits, productivity, return on investments, and utilization of capacity, (II) factors affecting domestic prices, (III) actual and potential negative effects on cash flow, inventories, employment, wages, growth, ability to raise capital, and investment, (IV) actual and potential negative effects on the
I-3
existing development and production efforts of the domestic industry, including efforts to develop a derivative or more advanced version of the domestic like product, and (V) in {an antidumping investigation}, the magnitude of the margin of dumping.
Organization of report
Part I of this report presents information on the subject merchandise, subsidy/dumping
margins, and domestic like product. Part II of this report presents information on conditions of
competition and other relevant economic factors. Part III presents information on the condition
of the U.S. industry, including data on capacity, production, shipments, inventories, and
employment. Parts IV and V present the volume of subject imports and pricing of domestic and
imported products, respectively. Part VI presents information on the financial experience of
U.S. producers. Part VII presents the statutory requirements and information obtained for use
in the Commission’s consideration of the question of threat of material injury as well as
information regarding nonsubject countries.
I-4
MARKET SUMMARY
Wire rod generally is used as an intermediate product for drawing into wire. The leading
U.S. producers of wire rod are Charter, Gerdau, Keystone, Nucor, and Sterling Steel Company
LLC (“Sterling”), while leading producers of wire rod in China include Benxi Beiying Iron and
Steel Group Co., Ltd., Hebei Iron and Steel Group Co., Ltd., Jiangsu Shagang Group Co., Ltd.,
Qiananshi Jiujiang Wire Co., Ltd., Wuhan Iron & Steel Group Corp., and Xingtai Iron & Steel Co.,
Ltd. The leading U.S. importers of wire rod from China are ***. The leading importers of
product from nonsubject countries (primarily Canada) are ***. U.S. purchasers of wire rod are
primarily firms that draw wire and use this wire for a large variety of end use products; leading
purchasers include ***.
Apparent U.S. consumption of wire rod totaled approximately 5.3 million short tons
($3.8 billion) in 2013. Currently, ten firms are known to produce wire rod in the United States.
U.S. producers’ U.S. shipments of wire rod totaled 3.6 million short tons ($2.5 billion) in 2013,
and accounted for 67.8 percent of apparent U.S. consumption by quantity and 67.3 percent by
value. U.S. imports from China totaled 618,790 short tons ($335.9 million) in 2013 and
accounted for 11.7 percent of apparent U.S. consumption by quantity and 8.9 percent by value.
U.S. imports from nonsubject sources totaled 1.1 million short tons ($895.7 million) in 2013 and
accounted for 20.5 percent of apparent U.S. consumption by quantity and 23.8 percent by
value.
I-5
SUMMARY DATA AND DATA SOURCES
A summary of data collected in these investigations is presented in appendix C.5 Except
as noted, U.S. industry data are based on questionnaire responses of ten firms that accounted
for all U.S. production of wire rod in 2013. U.S. imports are based on official import statistics, as
adjusted for ***,6 and on questionnaire responses from 30 U.S. importers that are believed to
have accounted for virtually all wire rod imports from China and 83.5 percent of wire rod
imports from nonsubject sources in 2013.
PREVIOUS AND RELATED INVESTIGATIONS
Prior investigations
The Commission has conducted a number of previous import relief investigations on
wire rod products or similar merchandise. There are currently antidumping orders in effect
covering wire rod from Brazil, Indonesia, Mexico, Moldova, and Trinidad and Tobago, as well as
a countervailing duty order in effect covering wire rod from Brazil. Table I-1 presents the
Commission’s countervailing and antidumping duty investigations concerning wire rod since
1982.
5 Table C-1 presents data for the total market and table C-2 presents data for the U.S. merchant market (excluding internal consumption and company transfers by U.S. producers).
6 ***.
I-6
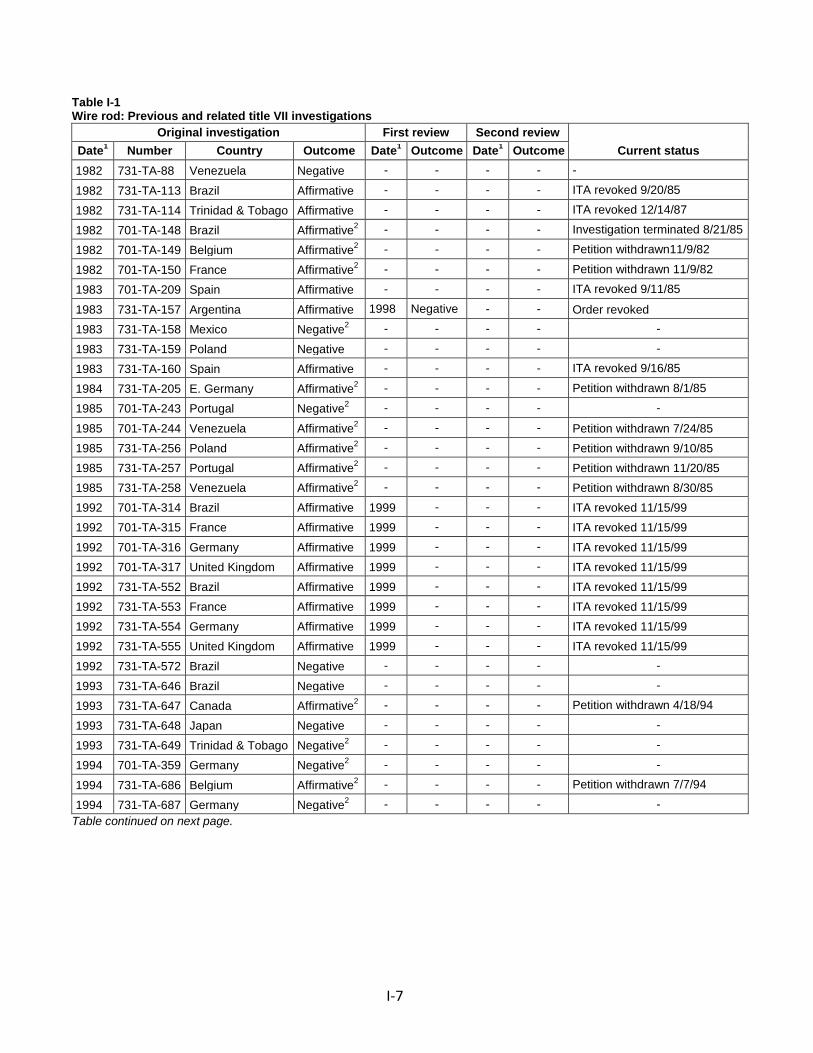
Table I-1 Wire rod: Previous and related title VII investigations
Original investigation First review Second review Current status Date1 Number Country Outcome Date1 Outcome Date1 Outcome
1982 731-TA-88 Venezuela Negative - - - - -
1982 731-TA-113 Brazil Affirmative - - - - ITA revoked 9/20/85
1982 731-TA-114 Trinidad & Tobago Affirmative - - - - ITA revoked 12/14/87
1982 701-TA-148 Brazil Affirmative2 - - - - Investigation terminated 8/21/85
1982 701-TA-149 Belgium Affirmative2 - - - - Petition withdrawn11/9/82
1982 701-TA-150 France Affirmative2 - - - - Petition withdrawn 11/9/82
1983 701-TA-209 Spain Affirmative - - - - ITA revoked 9/11/85
1983 731-TA-157 Argentina Affirmative 1998 Negative - - Order revoked 1983 731-TA-158 Mexico Negative2 - - - - -
1983 731-TA-159 Poland Negative - - - - -
1983 731-TA-160 Spain Affirmative - - - - ITA revoked 9/16/85
1984 731-TA-205 E. Germany Affirmative2 - - - - Petition withdrawn 8/1/85
1985 701-TA-243 Portugal Negative2 - - - - -
1985 701-TA-244 Venezuela Affirmative2 - - - - Petition withdrawn 7/24/85 1985 731-TA-256 Poland Affirmative2 - - - - Petition withdrawn 9/10/85 1985 731-TA-257 Portugal Affirmative2 - - - - Petition withdrawn 11/20/85 1985 731-TA-258 Venezuela Affirmative2 - - - - Petition withdrawn 8/30/85 1992 701-TA-314 Brazil Affirmative 1999 - - - ITA revoked 11/15/99 1992 701-TA-315 France Affirmative 1999 - - - ITA revoked 11/15/99
1992 701-TA-316 Germany Affirmative 1999 - - - ITA revoked 11/15/99 1992 701-TA-317 United Kingdom Affirmative 1999 - - - ITA revoked 11/15/99 1992 731-TA-552 Brazil Affirmative 1999 - - - ITA revoked 11/15/99 1992 731-TA-553 France Affirmative 1999 - - - ITA revoked 11/15/99 1992 731-TA-554 Germany Affirmative 1999 - - - ITA revoked 11/15/99 1992 731-TA-555 United Kingdom Affirmative 1999 - - - ITA revoked 11/15/99
1992 731-TA-572 Brazil Negative - - - - -
1993 731-TA-646 Brazil Negative - - - - -
1993 731-TA-647 Canada Affirmative2 - - - - Petition withdrawn 4/18/94
1993 731-TA-648 Japan Negative - - - - -
1993 731-TA-649 Trinidad & Tobago Negative2 - - - - -
1994 701-TA-359 Germany Negative2 - - - - -
1994 731-TA-686 Belgium Affirmative2 - - - - Petition withdrawn 7/7/94
1994 731-TA-687 Germany Negative2 - - - - - Table continued on next page.
I-7
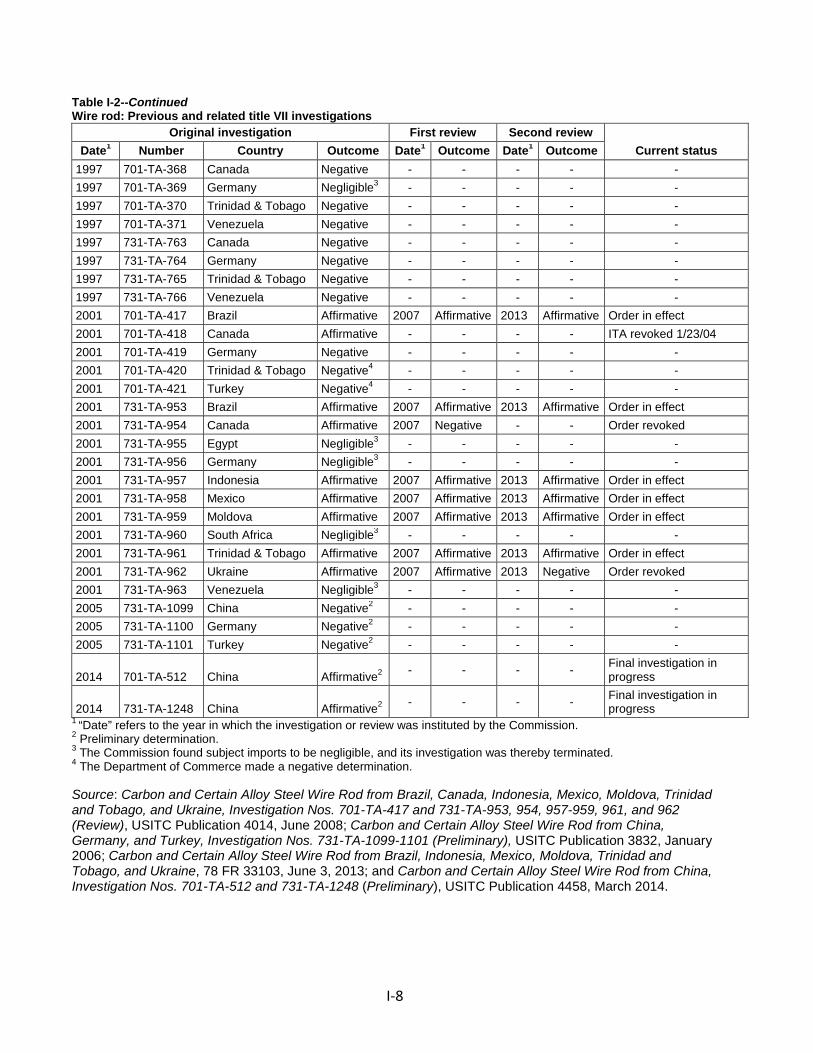
Table I-2--Continued Wire rod: Previous and related title VII investigations
Original investigation First review Second review Current status Date1 Number Country Outcome Date1 Outcome Date1 Outcome
1997 701-TA-368 Canada Negative - - - - - 1997 701-TA-369 Germany Negligible3 - - - - - 1997 701-TA-370 Trinidad & Tobago Negative - - - - - 1997 701-TA-371 Venezuela Negative - - - - - 1997 731-TA-763 Canada Negative - - - - - 1997 731-TA-764 Germany Negative - - - - - 1997 731-TA-765 Trinidad & Tobago Negative - - - - - 1997 731-TA-766 Venezuela Negative - - - - - 2001 701-TA-417 Brazil Affirmative 2007 Affirmative 2013 Affirmative Order in effect 2001 701-TA-418 Canada Affirmative - - - - ITA revoked 1/23/04 2001 701-TA-419 Germany Negative - - - - - 2001 701-TA-420 Trinidad & Tobago Negative4 - - - - - 2001 701-TA-421 Turkey Negative4 - - - - - 2001 731-TA-953 Brazil Affirmative 2007 Affirmative 2013 Affirmative Order in effect 2001 731-TA-954 Canada Affirmative 2007 Negative - - Order revoked 2001 731-TA-955 Egypt Negligible3 - - - - - 2001 731-TA-956 Germany Negligible3 - - - - - 2001 731-TA-957 Indonesia Affirmative 2007 Affirmative 2013 Affirmative Order in effect 2001 731-TA-958 Mexico Affirmative 2007 Affirmative 2013 Affirmative Order in effect 2001 731-TA-959 Moldova Affirmative 2007 Affirmative 2013 Affirmative Order in effect 2001 731-TA-960 South Africa Negligible3 - - - - - 2001 731-TA-961 Trinidad & Tobago Affirmative 2007 Affirmative 2013 Affirmative Order in effect 2001 731-TA-962 Ukraine Affirmative 2007 Affirmative 2013 Negative Order revoked 2001 731-TA-963 Venezuela Negligible3 - - - - - 2005 731-TA-1099 China Negative2 - - - - - 2005 731-TA-1100 Germany Negative2 - - - - - 2005 731-TA-1101 Turkey Negative2 - - - - -
2014 701-TA-512 China Affirmative2 - - - - Final investigation in progress
2014 731-TA-1248 China Affirmative2 - - - - Final investigation in progress
1 “Date” refers to the year in which the investigation or review was instituted by the Commission. 2 Preliminary determination. 3 The Commission found subject imports to be negligible, and its investigation was thereby terminated. 4 The Department of Commerce made a negative determination. Source: Carbon and Certain Alloy Steel Wire Rod from Brazil, Canada, Indonesia, Mexico, Moldova, Trinidad and Tobago, and Ukraine, Investigation Nos. 701-TA-417 and 731-TA-953, 954, 957-959, 961, and 962 (Review), USITC Publication 4014, June 2008; Carbon and Certain Alloy Steel Wire Rod from China, Germany, and Turkey, Investigation Nos. 731-TA-1099-1101 (Preliminary), USITC Publication 3832, January 2006; Carbon and Certain Alloy Steel Wire Rod from Brazil, Indonesia, Mexico, Moldova, Trinidad and Tobago, and Ukraine, 78 FR 33103, June 3, 2013; and Carbon and Certain Alloy Steel Wire Rod from China, Investigation Nos. 701-TA-512 and 731-TA-1248 (Preliminary), USITC Publication 4458, March 2014.
I-8
Safeguard investigation
In 1999, the Commission conducted a safeguard investigation under section 202 of the
Trade Act of 1974 to determine whether steel wire rod was being imported into the United
States in such increased quantities as to be a substantial cause of serious injury, or the threat
thereof, to the domestic industry producing an article like or directly competitive with the
imported article. The Commission was equally divided in its injury determination.7 The
President considered the determination of the Commissioners voting in the affirmative and
issued Proclamation 7273 imposing relief in the form of a Tariff Rate Quota (“TRQ”) on imports
of steel wire rod for a period of three years and one day, effective March 1, 2000.
Imports of subject products in excess of the quarterly or the annual quota amounts
were assessed duties in addition to the column-1 general rates of duty in the amounts of 10
percent ad valorem in the first year of relief (in-quota quantity of 1,580,000 short tons); 7.5
percent ad valorem in the second year of relief (in-quota quantity of 1,611,600 short tons); and
5 percent ad valorem in the third year of relief (in-quota quantity of 1,643,832 short tons). The
President subsequently issued Proclamation 7505 effective November 24, 2001, modifying the
TRQ, by providing that the in-quota quantity of the TRQ be allocated among these four supplier
7 Pursuant to section 311(a) of the North American Free Trade Agreement (“NAFTA”) Implementation Act, the Commission made negative findings with respect to imports of wire rod from Canada and Mexico.
I-9
country groupings: European Community; Commonwealth of Independent States; Trinidad and
Tobago; and all other countries.8
NATURE AND EXTENT OF SUBSIDIES AND SALES AT LTFV
Subsidies
On July 8, 2014, Commerce published a notice in the Federal Register of its preliminary
determination of countervailable subsidies for producers and exporters of wire rod from
China.9 On June 4, 2014, petitioners filed timely allegations of critical circumstances with
respect to imports of wire rod from China. Commerce preliminarily determined that critical
circumstances exist with respect to all Chinese exporters except Benxi Steel.10 Table I-2
presents Commerce’s findings of subsidization of wire rod in China.
On November 19, 2014, Commerce published a notice in the Federal Register of its
affirmative final determination of countervailable subsidies for producers and exporters of wire
rod from China.11 Commerce changed its critical circumstances finding with regard to Benxi
8 Carbon and Certain Alloy Steel Wire Rod from Brazil, Canada, Indonesia, Mexico, Moldova, Trinidad and Tobago, and Ukraine, Investigation Nos. 701‐TA‐417 and 731‐TA‐953, 954, 957‐959, 961, and 962 (Review), USITC Publication 4014, June 2008, pp. I-11-I-12.
9 Carbon and Certain Alloy Steel Wire Rod From the People’s Republic of China: Preliminary Affirmative Countervailing Duty Determination, Preliminary Affirmative Critical Circumstances Determination, and Alignment of Final Countervailing Duty Determination With Final Antidumping Duty Determination, 79 FR 38490, July 8, 2014.
10 Countervailing Duty Investigation of Carbon and Certain Alloy Steel Wire Rod from the People’s Republic of China: Decision Memorandum for the Preliminary Determination, United States Department of Commerce, International Trade Administration, June 30, 2014.
11 Carbon and Certain Alloy Steel Wire Rod from the People’s Republic of China: Final Affirmative Countervailing Duty Determination and Final Affirmative Critical Circumstances Determination, 79 FR 68858, November 19, 2014.
I-10
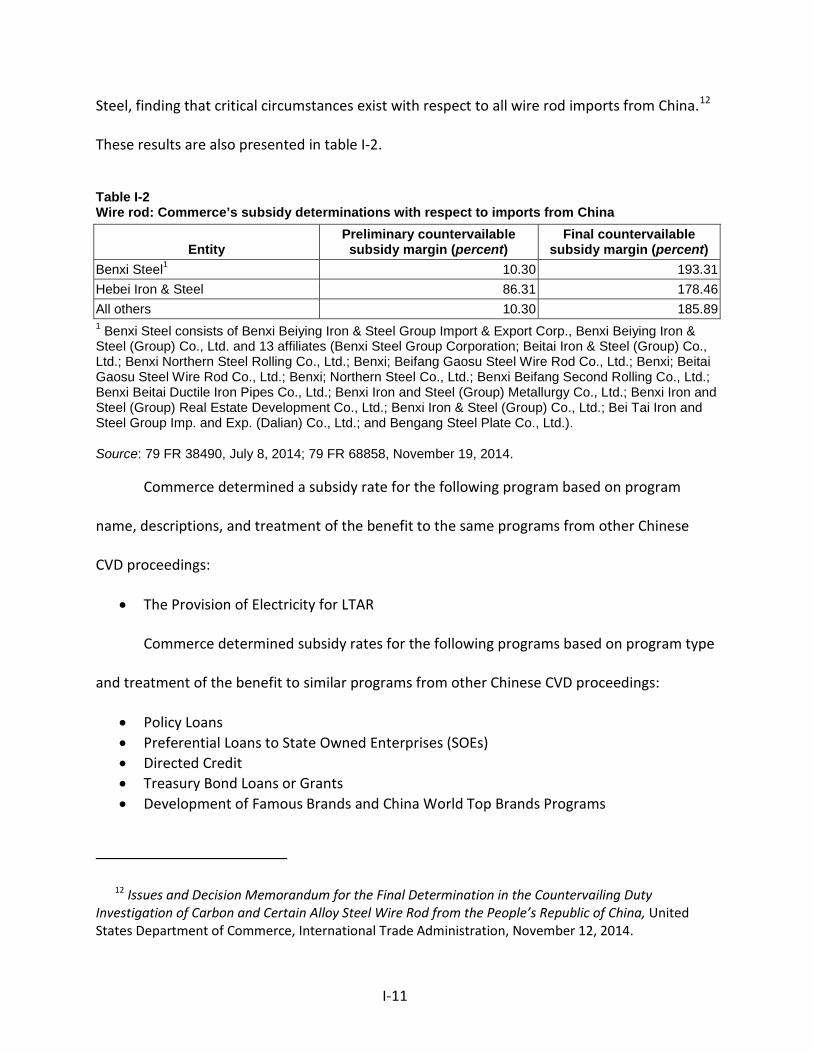
Steel, finding that critical circumstances exist with respect to all wire rod imports from China.12
These results are also presented in table I-2.
Table I-2 Wire rod: Commerce’s subsidy determinations with respect to imports from China
Entity Preliminary countervailable subsidy margin (percent)
Final countervailable subsidy margin (percent)
Benxi Steel1 10.30 193.31 Hebei Iron & Steel 86.31 178.46 All others 10.30 185.89 1 Benxi Steel consists of Benxi Beiying Iron & Steel Group Import & Export Corp., Benxi Beiying Iron & Steel (Group) Co., Ltd. and 13 affiliates (Benxi Steel Group Corporation; Beitai Iron & Steel (Group) Co., Ltd.; Benxi Northern Steel Rolling Co., Ltd.; Benxi; Beifang Gaosu Steel Wire Rod Co., Ltd.; Benxi; Beitai Gaosu Steel Wire Rod Co., Ltd.; Benxi; Northern Steel Co., Ltd.; Benxi Beifang Second Rolling Co., Ltd.; Benxi Beitai Ductile Iron Pipes Co., Ltd.; Benxi Iron and Steel (Group) Metallurgy Co., Ltd.; Benxi Iron and Steel (Group) Real Estate Development Co., Ltd.; Benxi Iron & Steel (Group) Co., Ltd.; Bei Tai Iron and Steel Group Imp. and Exp. (Dalian) Co., Ltd.; and Bengang Steel Plate Co., Ltd.).
Source: 79 FR 38490, July 8, 2014; 79 FR 68858, November 19, 2014.
Commerce determined a subsidy rate for the following program based on program
name, descriptions, and treatment of the benefit to the same programs from other Chinese
CVD proceedings:
• The Provision of Electricity for LTAR
Commerce determined subsidy rates for the following programs based on program type
and treatment of the benefit to similar programs from other Chinese CVD proceedings:
• Policy Loans • Preferential Loans to State Owned Enterprises (SOEs) • Directed Credit • Treasury Bond Loans or Grants • Development of Famous Brands and China World Top Brands Programs
12 Issues and Decision Memorandum for the Final Determination in the Countervailing Duty Investigation of Carbon and Certain Alloy Steel Wire Rod from the People’s Republic of China, United States Department of Commerce, International Trade Administration, November 12, 2014.
I-11
• Sub-Central Government Subsidies for Development of Famous Brands and China World Top Brands
• Funds for Outward Expansion of Industries in Guangdong Province • Provincial Fund for Fiscal and Technological Innovation • State Specific Fund for Promoting Key Industries and Innovation Technologies • Shandong Province’s Special Fund for the Establishment of Key Enterprise Technology
Centers • Grants for Antidumping Investigations • Shandong Province’s Award Fund for Industrialization of Key Energy-Saving Technology • Shandong Province’s Environmental Protection Industry R&D Funds • Shandong Province’s Construction Fund for Promotion of Key Industries • Waste Water Treatment Subsidies • Funds of Guangdong Province to Support the Adoption of E-Commerce by Foreign Trade
Enterprises • Technology to Improve Trade R&D Fund • The Provision of Steel Billet for Less than Adequate Remuneration (LTAR) • The Provision of Land-Use to SOEs for LTAR • Land-Use Rights Extension • Tax Offsets for R&D Under the EIT • Tax Offsets for R&D by FIEs • Tax Refunds for Reinvestment of FIE Profits in Export-Oriented Enterprises • Tax Benefits to Enterprises in the Northeast Region • Forgiveness of Tax Arrears for Enterprises Located in the Old Industrial Bases of
Northeast China • VAT and Import Duty Exemptions for Use of Imported Equipment • VAT Rebates on FIE Purchases of Chinese-Made Equipment • VAT and Tariff Exemptions for Purchases of Fixed Assets Under the Foreign Trade
Development Fund Program Commerce made an adverse inference that Hebei Iron & Steel benefited from direct
government grants to Hebei Iron & Steel, which Commerce was able to match based on
program type and treatment of the benefit to a similar program from another Chinese CVD
proceeding. Similarly, Commerce made an adverse inference that Benxi Steel benefited from
the grants listed below, which Commerce was able to match based on program type and
treatment of the benefit to a similar program from another Chinese CVD proceeding:
I-12
• 2nd Batch Science and Technology Plan Projects of Liaoning Province • Dandong Finance Bureau Directly Pays the Zero-Balance Account With Discounted
Interest • Demonstration Project to Improve the Mixed Iron Ore Recovery in Dressing Plant • Energy-Efficiency Subsidies of Electricity Generating Project • Financial Discounts • Financial Operation Subsidy for Environmental Protection Project • Financial Reward Funds of Energy-Saving Technical Transformation • Fiscal Award for Energy-Saving Technical Reconstruction • Fund for Sewage Charges • Funds of Government Support • Government Allocated Fund for Technology Advancement • Government Subsidy for Electricity Purchase Fund • Governmental Subsidiary for Low-Rent Lease • Governmental Support Funds • Land Transfer Fee of Canvas Factory Returned by Government • Return of Land Acquisition Costs of the Second Tailing Pond of Nanfen Dressing Plant of
Bengang • Returned Tax • Reward Fund for Developing International Steel Market • Special Eco-Friendly Subsidy for Sewage Charges • Special Environmental Protection Subsidy • Special Fund for Introducing Overseas Advanced and Applicable Technology into the
Province in 2013 • Special Funds of the Municipal Environmental Protection Bureau • Subsidies for Closing Down Outdated Production Facilities • Subsidies for Motor Bus (2010) • Subsidies for the Dry Quenching Project of #6 and #7 Coking Oven • Subsidy Fund For Cleaner Production Demonstration Project • Supporting Funds for the Infrastructures of the Finance Bureau of Dandong Border
Economic Cooperation Zone • The 2nd Central Clean Production Demonstration Project13
13 Issues and Decision Memorandum for the Final Determination in the Countervailing Duty Investigation of Carbon and Certain Alloy Steel Wire Rod from the People’s Republic of China, United States Department of Commerce, International Trade Administration, November 12, 2014.
I-13
Sales at LTFV
On September 8, 2014, Commerce published a notice in the Federal Register of its
preliminary determination of sales at LTFV with respect to imports from China. Commerce
preliminary determined that critical circumstances exist for all Chinese exporters except Rizhao
Steel Wire Co. Ltd., Hunan Valin Xiangtan Iron & Steel Co. Ltd., and Jiangsu Shagang
International Trade Co. Ltd.14 Table I-3 presents Commerce’s dumping margins with respect to
imports of wire rod from China.
On November 19, 2014, Commerce published a notice in the Federal Register of its
affirmative final determination of sales at LTFV with respect to imports from China.15
Commerce made no changes to its preliminary determinations in this investigation. These
results are also presented in table I-3.
14 Carbon and Certain Alloy Steel Wire Rod From the People’s Republic of China: Preliminary Determination of Sales at Less Than Fair Value and Preliminary Determination of Critical Circumstances, in Part, 79 FR 53169, September 8, 2014.
15 Carbon and Certain Alloy Steel Wire Rod from the People’s Republic of China: Final Determination of Sales at Less Than Fair Value and Final Affirmative Determination of Critical Circumstances, in Part, 79 FR 68860, November 19, 2014.
I-14
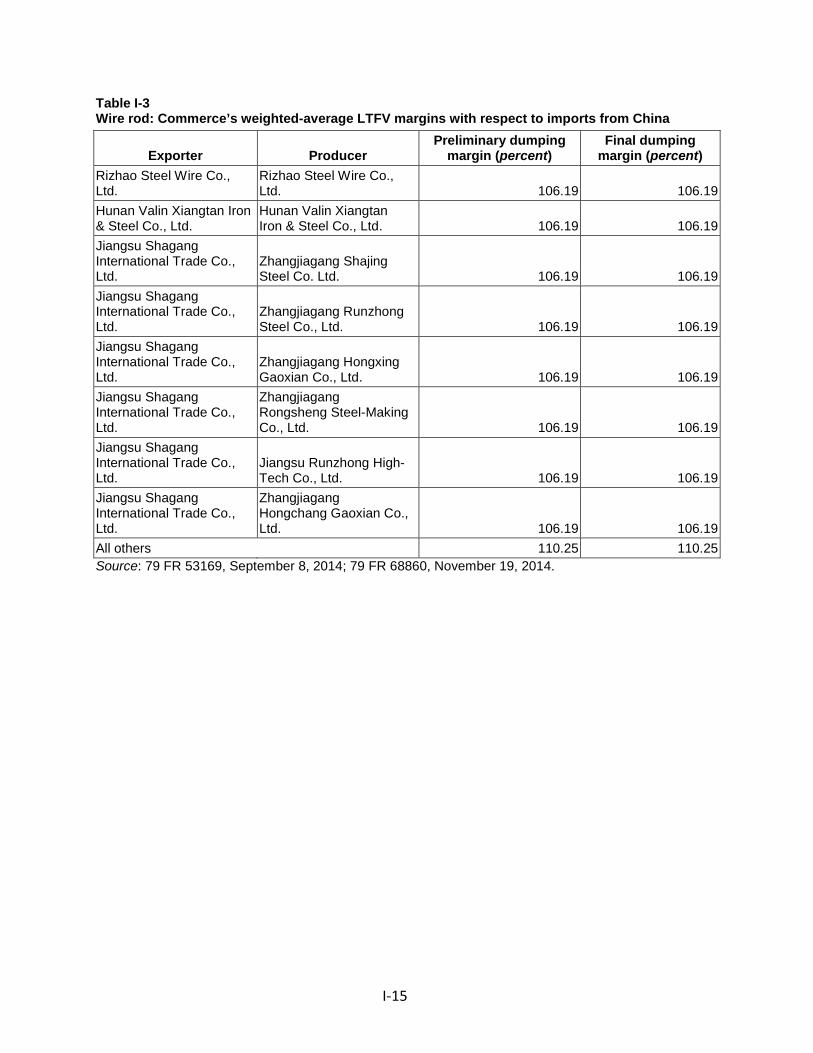
Table I-3 Wire rod: Commerce’s weighted-average LTFV margins with respect to imports from China
Exporter Producer Preliminary dumping
margin (percent) Final dumping
margin (percent) Rizhao Steel Wire Co., Ltd.
Rizhao Steel Wire Co., Ltd. 106.19 106.19
Hunan Valin Xiangtan Iron & Steel Co., Ltd.
Hunan Valin Xiangtan Iron & Steel Co., Ltd. 106.19 106.19
Jiangsu Shagang International Trade Co., Ltd.
Zhangjiagang Shajing Steel Co. Ltd. 106.19 106.19
Jiangsu Shagang International Trade Co., Ltd.
Zhangjiagang Runzhong Steel Co., Ltd. 106.19 106.19
Jiangsu Shagang International Trade Co., Ltd.
Zhangjiagang Hongxing Gaoxian Co., Ltd. 106.19 106.19
Jiangsu Shagang International Trade Co., Ltd.
Zhangjiagang Rongsheng Steel-Making Co., Ltd. 106.19 106.19
Jiangsu Shagang International Trade Co., Ltd.
Jiangsu Runzhong High-Tech Co., Ltd. 106.19 106.19
Jiangsu Shagang International Trade Co., Ltd.
Zhangjiagang Hongchang Gaoxian Co., Ltd. 106.19 106.19
All others 110.25 110.25 Source: 79 FR 53169, September 8, 2014; 79 FR 68860, November 19, 2014.
I-15
THE SUBJECT MERCHANDISE
Commerce’s scope
Commerce has defined the scope of these investigations as follows:
The merchandise covered by these investigations are certain hot‐rolled products of carbon steel and alloy steel, in coils, of approximately round cross section, less than 19.00 mm in actual solid cross‐sectional diameter. Specifically excluded are steel products possessing the above‐noted physical characteristics and meeting the Harmonized Tariff Schedule of the United States (HTSUS) definitions for (a) stainless steel; (b) tool steel; (c) high‐nickel steel; (d) ball bearing steel; or (e) concrete reinforcing bars and rods. Also excluded are free cutting steel (also known as free machining steel) products (i.e., products that contain by weight one or more of the following elements: 0.1 percent or more of lead, 0.05 percent or more of bismuth, 0.08 percent or more of sulfur, more than 0.04 percent of phosphorous, more than 0.05 percent of selenium, or more than 0.01 percent of tellurium). All products meeting the physical description of subject merchandise that are not specifically excluded are included in this scope. The products under investigation are currently classifiable under subheadings 7213.91.3011, 7213.91.3015, 7213.91.3020, 7213.91.3093; 7213.91.4500, 7213.91.6000, 7213.99.0030, 7227.20.0030, 7227.20.0080, 7227.90.6010, 7227.90.6020, 7227.90.6030, and 7227.90.6035 of the HTSUS. Products entered under subheadings 7213.99.0090 and 7227.90.6090 of the HTSUS also may be included in this scope if they meet the physical description of subject merchandise above. Although the HTSUS subheadings are provided for convenience and customs purposes, the written description of the scope of this proceeding is dispositive.
Tariff treatment
Based upon the scope set forth by the Department of Commerce, information available
to the Commission indicates that the merchandise subject to these investigations is currently
imported under the following provisions of the 2014 Harmonized Tariff Schedule (“HTS”) of the
United States: 7213.91.3011, 7213.91.3015, 7213.91.3020, 7213.91.3093; 7213.91.4500,
I-16
7213.91.6000, 7213.99.0030, 7227.20.0030, 7227.20.0080, 7227.90.6010, 7227.90.6020,
7227.90.6030, and 7227.90.6035.16 The column-1 General duty rate for imports of wire rod
under all of these provisions is “free.”
THE PRODUCT
Description and uses17
Wire rod is a hot-rolled intermediate steel product of circular or approximately circular
cross section that typically is produced in nominal fractional diameters up to 47/64 inch (18.7
mm) and sold in irregularly wound coils, primarily for subsequent drawing and finishing by wire
drawers.18 Wire rod sold in the United States is categorized by quality according to end use.
16 From 2011 through 2013, certain subject alloy wire rod products were classified with nonsubject hot-rolled bar and rod products in HTS subheading 7227.90.6085. As of January 1, 2014, HTS 7227.90.6085 was replaced with four new breakouts, including 7227.90.6030 (covering circular alloy wire rod with a diameter of less than 14 mm) and 7227.90.6035 (covering circular alloy wire rod with a diameter of 14 mm or more but less than 19 mm). The other two new HTS numbers, 7227.90.6040 (circular alloy bars and rods with a diameter of 19 mm or more) and 7227.90.6090 (cross-section shapes other than circular), are considered bar and rod products outside the scope of these investigations. HTSUS (2014), “Change Record,” January 1, 2014, pp. 6–7. These breakouts for steel wire rod were not changed any further with release of the HTSUS 2014 (revision 1) edition, dated July 1, 2014.
17 Compiled from Petition, Vol. I, Exhibit GEN-3; Carbon and Certain Alloy Steel Wire Rod from Brazil, Indonesia, Mexico, Moldova, Trinidad and Tobago, and Ukraine, Inv. Nos. 701‐TA‐417 and 731‐TA‐953, 957‐959, 961, and 962 (Second Review), USITC Publication 4472, June 2014, pp. I-26–I-30; Carbon and Certain Alloy Steel Wire Rod from China , Inv. Nos. 701‐TA‐512 and 731‐TA‐1248 (Preliminary), USITC Publication 4458, March 2014, pp. I-10‒ I-12; Carbon and Certain Alloy Steel Wire Rod from Brazil, Canada, Indonesia, Mexico, Moldova, Trinidad and Tobago, and Ukraine, Inv. Nos. 701‐TA‐417 and 731‐TA‐953, 954, 957‐959, 961, and 962 (Review), USITC Publication 4014, June 2008, pp. I-22–I-24; and Carbon and Certain Alloy Steel Wire Rod from China, Germany, and Turkey, Inv. Nos. 731‐TA‐1099‐1101 (Preliminary), USITC Publication 3832, January 2006, pp. I-6‒I-7.
18 Wire drawers (also referred to as redrawers) manufacture wire and wire products and may be independent of the wire rod manufacturers or may be affiliated parties.
The AWPA emphasized that wire rod is essentially used only to manufacture wire which is either fabricated into downstream wire products or incorporated into finished products. AWPA’s postconference brief, p. 6.
I-17
End-use categories are broad descriptions with overlapping metallurgical qualities,
chemistries,19 and physical characteristics.20
Table I-4 presents quality and commodity descriptions for 11 major types of wire rod, as
indicated by the Iron and Steel Society. Industrial quality wire rod currently accounts for the
majority of wire rod consumed in the United States. It is primarily intended for drawing into
industrial (or standard) quality wire that, in turn, is used to manufacture such products as nails,
reinforcing wire mesh, and chain link fence. Most of the industrial quality wire rod is produced
and sold in the smallest cross-sectional diameter that is hot rolled in substantial commercial
quantities (7/32 inch or 5.6 mm).21 Industrial quality wire rod generally is manufactured from
low- or medium-low-carbon steel.22 Other relatively large-volume qualities of wire rod
consumed in the United States include high- and medium-high carbon and cold-heading quality.
19 Steel chemistries are designated as “grades” of standardized composition ranges for carbon, nonferrous metals, and nonmetallic elements. See e.g., table 2-1, Standard Steels for Wire Rods and Wire Nonresulfurized Carbon Steels, Manganese Maximum Not Exceeding 1.00 Percent. Iron and Steel Society (“I&SS”), Steel Products Manual: Carbon Steel Wire and Rods, August 1993, p. 36.
20 Steel ductility, hardness, and tensile strength are positively correlated with carbon content. Alloying elements can be added at the steel melting stage of the manufacturing process to impart various characteristics to the wire rod.
21 Wire rod with a nominal diameter of less than from 7/32 inch (5.6 mm) has become commercially available in the United States since previous investigations. Carbon and Certain Alloy Steel Wire Rod from Brazil, Indonesia, Mexico, Moldova, Trinidad and Tobago, and Ukraine, Inv. Nos. 701‐TA‐417 and 731‐TA‐953, 957‐959, 961, and 962 (Second Review), USITC Publication 4472, June 2014, pp. I-28–I-30.
22 I&SS, Steel Products Manual: Carbon Steel Wire and Rods, August 1993, p. 36.
I-18
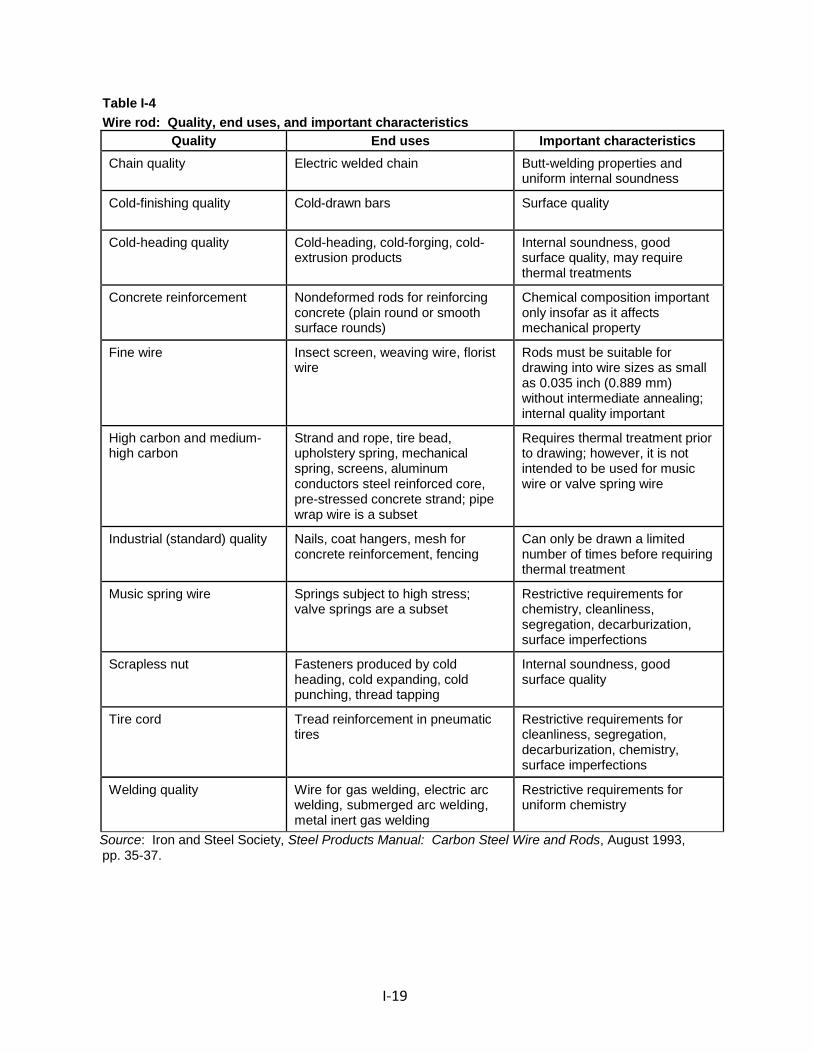
Table I-4 Wire rod: Quality, end uses, and important characteristics
Quality End uses Important characteristics
Chain quality Electric welded chain Butt-welding properties and uniform internal soundness
Cold-finishing quality Cold-drawn bars Surface quality
Cold-heading quality Cold-heading, cold-forging, cold- extrusion products
Internal soundness, good surface quality, may require thermal treatments
Concrete reinforcement Nondeformed rods for reinforcing concrete (plain round or smooth surface rounds)
Chemical composition important only insofar as it affects mechanical property
Fine wire Insect screen, weaving wire, florist wire
Rods must be suitable for drawing into wire sizes as small as 0.035 inch (0.889 mm) without intermediate annealing; internal quality important
High carbon and medium- high carbon
Strand and rope, tire bead, upholstery spring, mechanical spring, screens, aluminum conductors steel reinforced core, pre-stressed concrete strand; pipe wrap wire is a subset
Requires thermal treatment prior to drawing; however, it is not intended to be used for music wire or valve spring wire
Industrial (standard) quality Nails, coat hangers, mesh for concrete reinforcement, fencing
Can only be drawn a limited number of times before requiring thermal treatment
Music spring wire Springs subject to high stress; valve springs are a subset
Restrictive requirements for chemistry, cleanliness, segregation, decarburization, surface imperfections
Scrapless nut Fasteners produced by cold heading, cold expanding, cold punching, thread tapping
Internal soundness, good surface quality
Tire cord Tread reinforcement in pneumatic tires
Restrictive requirements for cleanliness, segregation, decarburization, chemistry, surface imperfections
Welding quality Wire for gas welding, electric arc welding, submerged arc welding, metal inert gas welding
Restrictive requirements for uniform chemistry
Source: Iron and Steel Society, Steel Products Manual: Carbon Steel Wire and Rods, August 1993, pp. 35-37.
I-19
High- and medium-high carbon wire rod are intended for drawing into wire for such products as
strand, upholstery spring, mechanical spring, rope, screens, and pre-stressed concrete wire.23
Manufacturing processes24
The manufacturing process for wire rod consists of several stages: (1) melting and
refining to set the steel’s chemical and metallurgical properties; (2) casting the steel into a
semifinished shape (billet); (3) hot-rolling the billet into rod on a multistand, high-speed rolling
mill; and (4) coiling and controlled cooling of the wire rod as it passes along a Stelmor deck, a
specialized conveyor unique to the wire rod industry. According to one witness, the equipment
used to produce wire rod is much the same throughout the world and without significant
differences in production technology.25
U.S. and foreign wire rod manufacturers have made capital investments in their
production facilities to improve processing efficiencies and product quality. Higher standards
for product quality (e.g., dimensional tolerances, control over residual or trace elements, and
23 The end uses of very high quality wire rod are those where manufacturing process involve large amounts of cold deformation of the steel such as in recessed quality cold heading; those that are safety critical, such as automotive wheel bolts and tire reinforcing wire; those that have very demanding consistency requirements or unusual steel chemistry requirements, such as certain welding grades; and other applications that put unusual and demanding requirements on the steel.
24 Compiled from Petition, Vol. I, Exhibit GEN-3; Carbon and Certain Alloy Steel Wire Rod from Brazil, Indonesia, Mexico, Moldova, Trinidad and Tobago, and Ukraine, Inv. Nos. 701‐TA‐417 and 731‐TA‐953, 957‐959, 961, and 962 (Second Review), USITC Publication 4472, June 2014, pp. I-30 – I-35; Carbon and Certain Alloy Steel Wire Rod from China , Inv. Nos. 701‐TA‐512 and 731‐TA‐1248 (Preliminary), USITC Publication 4458, March 2014, pp. I-13‒ I-19; Carbon and Certain Alloy Steel Wire Rod from Brazil, Canada, Indonesia, Mexico, Moldova, Trinidad and Tobago, and Ukraine, Inv. Nos. 701‐TA‐417 and 731‐TA‐953, 954, 957‐959, 961, and 962 (Review), USITC Publication 4014, June 2008, pp. I-24–I-27; and Carbon and Certain Alloy Steel Wire Rod from China, Germany, and Turkey, Inv. Nos. 731‐TA‐1099‐1101 (Preliminary), USITC Publication 3832, January 2006, p. I-8.
25 Conference transcript, p. 69 (Nystrom); and Nucor’s postconference brief, p. 31.
I-20
coil weights) have been applied across the entire range of wire rod products largely in response
to customer demands for improved performance on the customer's equipment. These
improvements have tended to blur the distinctions among quality terms over time.26
Melting stage
There are two primary process routes by which steel for rod has been made in the
United States and in foreign countries: the integrated process, which employs blast furnaces
and basic oxygen furnaces (“BOFs”), and the nonintegrated (or “minimill”) production processes
which utilize an electric arc furnace (“EAF”) to produce raw steel. In both processes, pig iron,
ferrous scrap, and/or direct reduced iron (“DRI”)27 are charged into BOFs or EAFs. In the United
States, all steel28 (or nearly all steel29) for rod production is melted from ferrous scrap in an EAF,
along with other raw materials that may also be added as part of the EAF charge.30 Alloy agents
are added to the liquid steel to impart specific properties to finished steel products. The molten
26 Carbon and Certain Alloy Steel Wire Rod from China, Germany, and Turkey, Inv. Nos. 731‐TA‐1099‐ 1101 (Preliminary), USITC Publication 3832, January 2006, p. I-8.
27 Carbon and Certain Alloy Steel Wire Rod from China, Germany, and Turkey, Inv. Nos. 731‐TA‐1099‐ 1101 (Preliminary), USITC Publication 3832, January 2006, p. I-8.
28 Conference transcript, p. 61 (Kirkvliet). 29 Conference transcript, p. 61 (Fuller). 30 Minimills use ferrous scrap as their primary raw material but may add DRI or hot-briquetted iron
and/or pig iron, with the mix— which may vary over time and locations— depending on the relative costs of the raw materials, specifications for the end product, and individual furnace configurations. Minimills that produce high quality rod products, such as high carbon, cold heading quality, tire cord quality, and/or other special quality wire rod may use less ferrous scrap and more DRI than other steelmakers, however the production process in general does not change. Domestic producers’ posthearing brief, Exhibit 1, Responses to Commission Questions, pp. 7‒8; and China Iron & Steel Association’s (“CISA”) posthearing brief, Commissioner Questions, p. 14, and Affidavit of Bruce Malashevich, p. 16.
ArcelorMittal adds DRI as a premium raw material to attain the same effects as BOF steel. Conference transcript, p. 61 (Fuller). Similarly, with addition of scrap blends and substitute materials, Nucor reportedly has the full capability to produce all steel grades currently being imported, using the EAF process compared to the BOF process. Conference transcript, p. 62 (Nystrom).
I-21
steel is poured or tapped from the furnace to a ladle, which is an open-topped, refractory-lined
vessel that has an off-center opening in its bottom and is equipped with a nozzle. Meanwhile,
the primary steelmaking vessel (either EAF or BOF) may be charged with new materials to begin
another refining cycle.
Molten steel typically is further treated in a ladle metallurgy station, where its chemistry
is refined to give the steel those properties required for specific applications. At the ladle
metallurgy, or secondary steel making, station the chemical content (particularly that of carbon
and sulfur) is adjusted and alloying agents may be added.31 The steel may be degassed
31 Boron can be added as ferroboron to molten steel (in concentrations of 0.0015–0.0030 percent or 15–30 parts per million (ppm)) to increase the hardenability of the steel. However, because of boron’s high reactivity with any dissolved oxygen and nitrogen in the molten steel, ferroboron is the last addition at the ladle metallurgy station, under controlled conditions, and only after the molten steel is “killed” (deoxidized or degassed). Shieldalloy Metallurgical Corp., “Boron,” Ferroalloys & Alloying Additives Online Handbook, November 23, 2000.
According to the Iron & Steel Society, fine-grained, standard killed carbon steels may include 0.0005– 0.003 percent (5–30 ppm) boron to enhance the steel’s hardenability. Standard boron alloy steels can contain 0.0005–0.003 percent (5–30 ppm) boron. Iron & Steel Society, Note 4 to “Table 1 Standard Carbon Steels, Cast or Heat Chemical Ranges and Limits, Bars, Wire Rods, Blooms, Billets and Slabs” and footnote “a” to Standard Boron Alloy Steels in “Table 7 Standard Alloy Steels, Cast or Heat Chemical Ranges and Limits, Bars, Wire Rods, Blooms, Billets and Slabs,” Pocketbook of Standard Steels, July 1996.
According to staff conference testimony, boron enhances the ductility (drawability) of low carbon steels, hardness of cold heading grade steels, and heat treatability and tensile strength of higher carbon steels. Conference transcript, p. 70 (Goettl) and pp. 70–71 (Nystrom).
According to hearing testimony, the domestic industry can produce any grade of wire rod including boron-added wire rod, but U.S. customers are not requesting this product. Hearing transcript, p. 42 (Nystrom).
According to petitioners, the vast majority of Chinese wire rod contains trace additions of boron (exceeding 0.0008 percent or 8 ppm) for it to be classified as alloy steel rather than carbon steel. In July 2010, the Chinese government removed a VAT rebate for carbon steel exports but continued offering the rebate for alloy steel exports. Subsequently, Chinese producers reportedly added boron to claim the rebate for their alloy steel exports, rather than for metallurgical purposes. HTSUS (2014), “Chapter 72 Iron and Steel, Note 1(f) Other Alloy Steel,” January 1, 2014, p. XV 72-2; Domestic producers’ postconference brief, p. 37; Nucor’s postconference brief, Exhibit 1, Answers to Staff Questions, pp. 23–24; Nucor’s postconference brief, Exhibit 20, ***;
I-22
(continued...)
(eliminating oxygen and hydrogen) at low pressures.32 Ladle metallurgy stations are equipped
with electric arc power to adjust the temperature of the molten steel for optimum casting and
to allow it to serve as a holding reservoir for the tundish.
Casting stage
Once molten steel with the requisite properties has been produced, it is cast into a form
that can enter the rolling process. Continuous (strand) casting is the method primarily used in
the United States. In strand casting, the ladle containing molten steel is transferred from the
ladle metallurgy station to the caster and the molten steel is poured at a controlled rate into a
refractory-lined tundish (reservoir dam), which in turn controls the rate of flow of the molten
steel into the molds at the top of the caster. The tundish may have a special design or employ
electromagnetic stirring to ensure homogeneity of the steel. The strand caster is designed to
hearing transcript, p. 42 (Nystrom) and p. 108 (Kerkvliet); and Domestic producers’ posthearing brief, Exhibit 1, Answers to Commissioners’ Questions, pp. 15‒17.
CISA cites a technical article to argue that the purpose for adding boron is to enhance the hardness of the steel. CISA’s posthearing brief, Commissioner Questions, p.33; and Key to Metals, “Boron in Steel, Part Two,” December 2007, found in: CISA’s posthearing brief, pp. 34‒36; but see Nucor’s posthearing brief, p. 16.
Articles appearing in the industry and trade press mention boron additions to wire rod as a means of both avoiding Chinese export taxes and of gaining tax rebates. See, e.g., Metal bulletin, “Chinese Wire Rod Imports to USA Double in H1 2013,” August 20, 2013; Frizell, Samuel, “Chinese Wire Rod Imports Spike,” American Metal Market, August 19, 2013; Nagi, Catherine, “Chinese Rod Hits Shores But Avoids Import Data,” American Metal Market, January 11, 2013; and Cowden, Michael, “Chinese Wire Rod Imports Rising: Trader,” American Metal Market, May 22, 2012.
32 Liquid steel absorbs gasses from the atmosphere and from the materials used in the steelmaking process. These gasses, chiefly oxygen and hydrogen, cause embrittlement, voids, and nonmetallic inclusions. Low pressures, such as in a vacuum, aid the release of oxygen in gas form without the need for additions of deoxidizers such as silicon, aluminum, or titanium, which form nonmetallic inclusions in steel. Additionally, the carbon content may be reduced more readily at low pressure (because it combines with oxygen to form carbon monoxide and is released in gaseous form), resulting in a more ductile steel.
Moreover, hydrogen gas causes embrittlement, low ductility, and blow holes in steel; vacuum treatment more readily removes hydrogen from the steel. Hence the use of deoxidizing processes result in more efficient processing and cleaner steel.
I-23
(…continued)
produce billets in the desired cross-sectional dimensions, based on the dimensions of the rod
and the design of the rolling mill. Billets may be sent directly (“hot-charged”) into the rolling
mill or, depending upon the rolling mill's schedule, sent to a storage yard. While in storage,
billets may be inspected and subjected to one or more conditioning operations (e.g., grinding or
turning) to prepare them for hot rolling. This preparation is more common with cold-heading
quality rods intended to be made into fasteners.33
Rolling stage
The wire rod rolling process determines the rod’s size (diameter) and dimensional
precision, depth of decarburization, surface defects and seams, amount of mill scale, structural
grain size, and within limits set by the chemistry, tensile strength and other physical properties.
There is little or no difference among the wire rod rolling mills in the United States, or between
U.S. mills and their foreign competitors.34 A larger billet will produce a heavier coil. Also, usable
coil size may be limited by the capabilities of the wire drawer's equipment and machinery.
Modern rod rolling mills consist of five parts: a roughing mill, an intermediate mill, a
pre-finishing mill, a no-twist finishing mill, and a coiler combined with a conveyor cooling bed
along which the coiled rod travels prior to being collected, tied, compacted, and readied for
shipment. Wire rod mills typically consist of 22 to 29 rolling stands and the specialized Stelmor
33 The purpose of these surface treatments is to make the steel billet softer and more ductile (annealing); in the case of surface grinding, seam and folds are removed.
34 The rolling process, however, can be optimized for various quality levels. The rolling process for higher quality steel, such as for cold heading quality and other surface sensitive products, must be designed to maximize surface integrity. This is managed by the number of rolling stands used to get to a specific end diameter, the design of the reductions taken at each step, and the design of the guiding equipment used to keep the steel moving on the proper path through the mill.
I-24
conveyor deck;35 the need for uniform metallurgical properties requires close temperature
control accomplished by accelerating or retarding the rod's cooling as it is rolled and conveyed
along the Stelmor deck. This is accomplished by water quench, forced air drafts, or by lowering
removable hoods overtop the deck. Metallurgical quality, temperature, and dimensional
tolerance usually are inspected in-line.
Exiting the reheat furnace, the billet is initially reduced on a roughing mill (which usually
consists of approximately five stands). It then is passed through and successively reduced in size
on several more stands, termed intermediate rolling. After the last intermediate rolling stand,
the rolling mill usually splits into dual lines and the product is passed along to a pre-finishing mill
which reduces it further in diameter. Rod mills often employ a “twist” mill for primary and
intermediate rolling, but the final rolling is nearly always on a no-twist Morgan vee mill (the rolls
in each of approximately five stands are set a 90-degree angles to allow the rod to be rolled
without twisting). This produces a nearly uniform non-oriented grain structure in the steel.
Cooling stage
After exiting the last finishing stand, the rod is coiled into concentric loops and placed
on a conveyor which moves the hot wire rod along while it cools. During rolling, the rod is
water-cooled as it travels along the Stelmor deck; cooling practices are varied depending on the
35 The Stelmor conveyor deck allows for controlled cooling of the wire rod. The cooling speed imparts certain physical characteristics, thereby enabling producers to produce a wider range of wire rod qualities. Likewise, the Stelmor deck may be optimized for specific end products. For example, ***. Most, if not all, U.S. wire rod producers have installed controlled cooling capacities.
I-25
designated end use of the rod and the customer's preferences. The speed at which the rod is
cooled affects the consistency and formation of its metallurgical structure (grain structure and
physical properties such as tensile strength). It also affects scale buildup, which determines
yield losses at the wire drawer. The cooling rate may be varied through the use of removable
covers (insulating hoods which may be independently raised or lowered) over the deck or
blown-air cooling, or a combination of the two, or through varying the speed of the roller table.
The end user often specifies the cooling practice of the rod purchased.
At the end of the cooling deck, workers crop the ends of each rod to remove the part of
the rod which may be of lower quality due to uneven temperature control; the cropped ends
are also used for testing and inspection. The rod is then collected onto a carrier, transferred to a
“c” hook, compacted, tied, and readied for shipment, or for further finishing or in-house
fabrication. Figure I-1 illustrates the reheat through cooling stages of the wire rod production
process.
Domestic producers manufacture various types of wire rod on essentially the same
equipment, in the same facilities, and with the same production personnel. While changes to
production processes are limited, changes in chemical composition, alloying elements and other
raw materials, stand fittings, and cooling speed determine the quality of the wire rod produced.
The basic equipment, machinery, facilities, and production personnel, however, remain the
same for the production of industrial quality, tire cord quality, welding quality, and cold heading
quality wire rod.
I-26
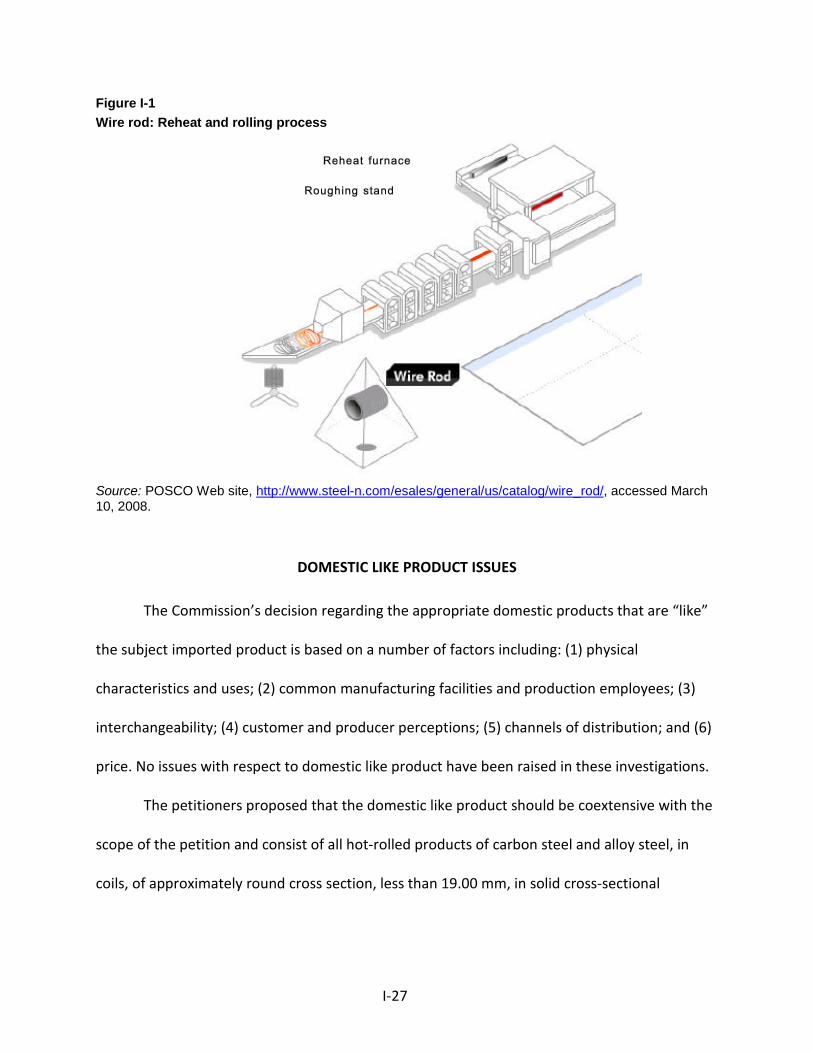
Figure I-1 Wire rod: Reheat and rolling process
Source: POSCO Web site, http://www.steel-n.com/esales/general/us/catalog/wire_rod/, accessed March 10, 2008.
DOMESTIC LIKE PRODUCT ISSUES
The Commission’s decision regarding the appropriate domestic products that are “like”
the subject imported product is based on a number of factors including: (1) physical
characteristics and uses; (2) common manufacturing facilities and production employees; (3)
interchangeability; (4) customer and producer perceptions; (5) channels of distribution; and (6)
price. No issues with respect to domestic like product have been raised in these investigations.
The petitioners proposed that the domestic like product should be coextensive with the
scope of the petition and consist of all hot-rolled products of carbon steel and alloy steel, in
coils, of approximately round cross section, less than 19.00 mm, in solid cross-sectional
I-27
diameter not specifically excluded from the scope.36 This domestic like product is generally
consistent with the like product definition the Commission adopted in its previous
investigations and review of wire rod.37 The scope in these investigations differs from existing
wire rod orders in that it does not contain exclusions for 1080 tire cord quality and grade 1080
tire bead quality wire rod and does not reference a lower diameter range for wire rod. In
previous investigations, however, the Commission found a single like product consisting of all
wire rod, including certain grade 1080 tire cord and the grade 1080 tire bead wire rod products
that Commerce excluded from the scope of the investigations.38 Petitioners also contend that
removing the lower diameter limit of 5.0 mm does not change the like product analysis because
there was no domestic or subject foreign production of hot-rolled wire rod in diameters below
5.0 mm at the time of the 2002 investigations. Since then, Mexican producer Deacero S.A. de
C.V. has started producing wire rod in diameters of less than 5.0 mm.39 No U.S. producer,
however, is believed to produce wire rod in diameters of less than 5.0 mm.40
36 Petition, Vol. I, pp.9-12; domestic producers’ prehearing brief, pp. 3-4. 37 Carbon and Certain Alloy Steel Wire Rod from Brazil, Canada, Germany, Indonesia, Mexico,
Moldova, Trinidad and Tobago, Turkey, and Ukraine, Inv. Nos. 701‐TA‐417‐421 and 731‐TA‐953, 954, 956‐959, 961 and 962 (Final), USITC Publication 3546, October 2002, pp. 6-12.; Carbon and Certain Alloy Steel Wire Rod from Brazil, Canada, Indonesia, Mexico, Moldova, Trinidad and Tobago, and Ukraine, Inv. Nos. 701‐TA‐417 and 731‐TA‐953, 954, 957‐959, 961 and 962 (Review), USITC Publication 4014, June 2008, pp. 6-8.
38 Carbon and Certain Alloy Steel Wire Rod from Brazil, Canada, Germany, Indonesia, Mexico, Moldova, Trinidad and Tobago, Turkey, and Ukraine, Inv. Nos. 701‐TA‐417‐421 and 731‐TA‐953, 954, 956‐959, 961 and 962 (Final), USITC Publication 3546, October 2002, p. 12.
39 Domestic producers’ postconference brief, pp. 4-6. 40 Conference transcript, pp. 42-43 (Cannon and Goettl).
I-28
Respondents agreed with the Commission’s previous like product definitions, including
the proposed definition in the preliminary phase of these investigations,41 and no respondent
parties presented any arguments in favor of an alternative domestic like product during the
final phase of these investigations.
In the preliminary phase of these investigations, the Commission found the domestic
like product to be coextensive with the scope of the petition.42 No additional comments or
requests for data specifically concerning the domestic like product were provided by parties in
their comments on the draft questionnaires in the final phase of these investigations.
41 Conference transcript, p. 99 (Waite). 42 Carbon and Certain Alloy Steel Wire Rod from China, Inv. Nos. 701‐TA‐512 and 731‐TA‐1248
(Preliminary), USITC Publication 4458, p. 8.
I-29

II‐1
PART II: CONDITIONS OF COMPETITION IN THE U.S. MARKET
U.S. MARKET CHARACTERISTICS
Wire rod is a hot‐rolled intermediate steel product for a variety of downstream products
used in construction, automotive, energy, and agriculture industries.1 These industries
accounted for the majority of U.S. demand for wire rod.2 U.S. producers and importers sell wire
rod to wire drawing firms, and/or draw wire rod internally, for the production and sale of wire
or wire products. U.S. production that was internally consumed or transferred to a related firm
increased from *** percent of total shipments in 2011 to *** percent in 2013.
Apparent U.S. consumption of wire rod increased during 2011‐13. Overall, apparent U.S.
consumption in 2013 was 3.5 percent higher than in 2011.
CHANNELS OF DISTRIBUTION
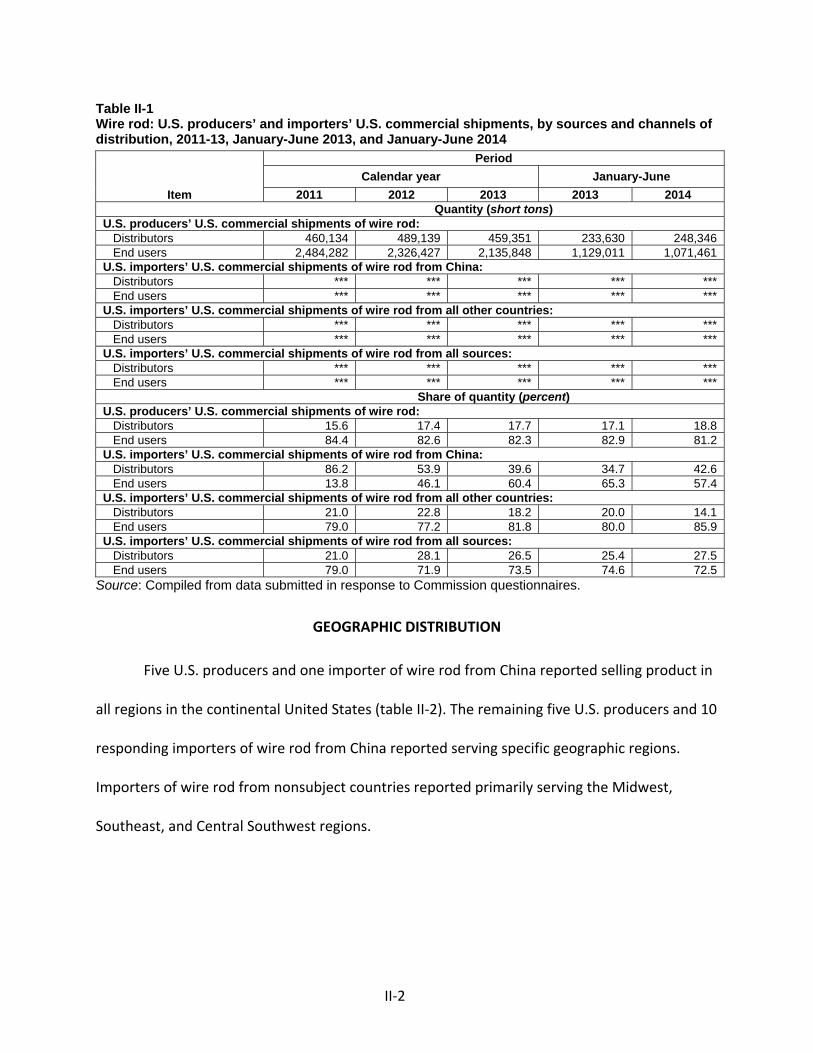
U.S. producers sold mainly to end users during 2011‐13 and January‐June 2014 (table II‐
1). Importers of wire rod from China sold mainly to distributors during 2011‐12 and mainly to
end users during 2013 and January‐June 2014.
1 Petitioners reported that the construction, automotive, and energy markets account for the majority of the demand for their wire rod. Conference transcript, p. 53 (Goettl). In addition to the three markets identified by Petitioners, Respondents added that agriculture is also a high volume end use market for wire rod. Conference transcript, p. 106 (Korbel).
2 Conference transcript, pp. 53‐54 (Goettl and Stirnaman).
II‐2
Table II-1 Wire rod: U.S. producers’ and importers’ U.S. commercial shipments, by sources and channels of distribution, 2011-13, January-June 2013, and January-June 2014
Item
PeriodCalendar year January-June
2011 2012 2013 2013 2014 Quantity (short tons)U.S. producers’ U.S. commercial shipments of wire rod: Distributors 460,134 489,139 459,351 233,630 248,346 End users 2,484,282 2,326,427 2,135,848 1,129,011 1,071,461 U.S. importers’ U.S. commercial shipments of wire rod from China: Distributors *** *** *** *** *** End users *** *** *** *** *** U.S. importers’ U.S. commercial shipments of wire rod from all other countries: Distributors *** *** *** *** *** End users *** *** *** *** *** U.S. importers’ U.S. commercial shipments of wire rod from all sources: Distributors *** *** *** *** *** End users *** *** *** *** *** Share of quantity (percent)U.S. producers’ U.S. commercial shipments of wire rod: Distributors 15.6 17.4 17.7 17.1 18.8 End users 84.4 82.6 82.3 82.9 81.2 U.S. importers’ U.S. commercial shipments of wire rod from China: Distributors 86.2 53.9 39.6 34.7 42.6 End users 13.8 46.1 60.4 65.3 57.4 U.S. importers’ U.S. commercial shipments of wire rod from all other countries: Distributors 21.0 22.8 18.2 20.0 14.1 End users 79.0 77.2 81.8 80.0 85.9 U.S. importers’ U.S. commercial shipments of wire rod from all sources: Distributors 21.0 28.1 26.5 25.4 27.5 End users 79.0 71.9 73.5 74.6 72.5
Source: Compiled from data submitted in response to Commission questionnaires.
GEOGRAPHIC DISTRIBUTION
Five U.S. producers and one importer of wire rod from China reported selling product in
all regions in the continental United States (table II‐2). The remaining five U.S. producers and 10
responding importers of wire rod from China reported serving specific geographic regions.
Importers of wire rod from nonsubject countries reported primarily serving the Midwest,
Southeast, and Central Southwest regions.

II‐3
Table II-2 Wire rod: Geographic market areas in the United States served by U.S. producers and importers, by number of responding firms
Region U.S. producers U.S. importers
China All other Northeast 9 5 5 Midwest 10 6 16 Southeast 9 7 19 Central Southwest 8 9 13 Mountains 7 2 3 Pacific Coast 7 5 4 Other1 1 0 0 All regions in the continental United States 5 1 0
1 All other U.S. markets, including AK, HI, PR, and VI, among others. Source: Compiled from data submitted in response to Commission questionnaires.
For U.S. producers, 13.7 percent of sales were within 100 miles of their production
facility, 79.2 percent were between 101 and 1,000 miles, and 7.2 percent were over 1,000
miles. Importers of wire rod from China sold 53.7 percent within 100 miles of their U.S. point of
shipment, 44.1 percent between 101 and 1,000 miles, and 2.2 percent over 1,000 miles.3
U.S. PURCHASERS
The Commission received 58 usable questionnaire responses from firms that have
purchased wire rod since January 2011.4 These firms reported purchases totaling 3.4 million
short tons in 2013, equivalent to 64.6 percent of 2013 U.S. wire rod consumption. The largest
purchasers are ***, which accounted for *** percent of 2013 U.S. wire rod consumption; ***,
which accounted for *** percent of 2013 U.S. wire rod consumption;
3 One importer of wire rod from nonsubject countries reported its shipping distances. Importer *** reported ***.
4 Of the 58 responding purchasers, all 58 purchased domestic wire rod, 33 purchased imports of wire rod from China, and 46 purchased imports of wire rod from other sources (Belgium, Brazil, Canada, Egypt, Germany, India, Italy, Japan, Korea, Malaysia, Mexico, the Netherlands, Peru, South Africa, Spain, Taiwan, Turkey, United Arab Emirates, United Kingdom, and Venezuela).
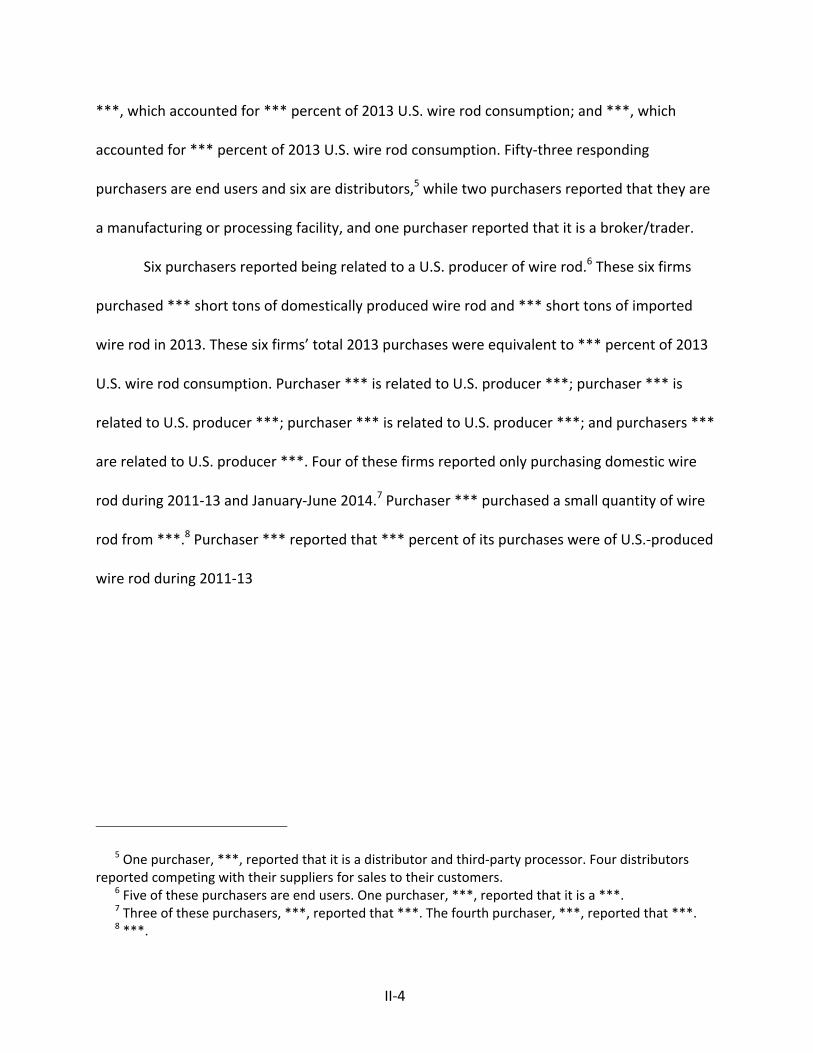
II‐4
***, which accounted for *** percent of 2013 U.S. wire rod consumption; and ***, which
accounted for *** percent of 2013 U.S. wire rod consumption. Fifty‐three responding
purchasers are end users and six are distributors,5 while two purchasers reported that they are
a manufacturing or processing facility, and one purchaser reported that it is a broker/trader.
Six purchasers reported being related to a U.S. producer of wire rod.6 These six firms
purchased *** short tons of domestically produced wire rod and *** short tons of imported
wire rod in 2013. These six firms’ total 2013 purchases were equivalent to *** percent of 2013
U.S. wire rod consumption. Purchaser *** is related to U.S. producer ***; purchaser *** is
related to U.S. producer ***; purchaser *** is related to U.S. producer ***; and purchasers ***
are related to U.S. producer ***. Four of these firms reported only purchasing domestic wire
rod during 2011‐13 and January‐June 2014.7 Purchaser *** purchased a small quantity of wire
rod from ***.8 Purchaser *** reported that *** percent of its purchases were of U.S.‐produced
wire rod during 2011‐13
5 One purchaser, ***, reported that it is a distributor and third‐party processor. Four distributors reported competing with their suppliers for sales to their customers.
6 Five of these purchasers are end users. One purchaser, ***, reported that it is a ***. 7 Three of these purchasers, ***, reported that ***. The fourth purchaser, ***, reported that ***. 8 ***.
II‐5
and January‐June 2014, *** percent were of Chinese‐produced wire rod, and *** percent were
of wire rod from nonsubject sources.9
SUPPLY AND DEMAND CONSIDERATIONS
U.S. supply
Domestic production
Based on available information, U.S. producers of wire rod have the ability to respond to
changes in demand with moderate changes in the quantity of shipments of U.S.‐produced wire
rod to the U.S. market. The main contributing factors to this degree of responsiveness of supply
are the availability of unused capacity and the ability to produce alternative products; however,
other factors such as limited export markets and low inventory levels tend to moderate this
degree of supply responsiveness.
Industry capacity
U.S. producers have unused capacity with which they could increase production of wire
rod in the event of a price change. U.S. producers’ capacity utilization decreased from 75.9
percent in 2011 to 72.4 percent in 2013.10 U.S. producers’ production decreased by 6.5 percent
from 3.9 million short tons in 2011 to 3.7 million short tons in 2013, while capacity decreased
by 1.9 percent from 5.2 million short tons in 2011 to 5.1 million short tons in 2013.
9 *** identified these nonsubject sources as ***. 10 U.S. producers’ capacity utilization was lower in January‐June 2014 (73.1 percent) than in January‐
June 2013 (77.0 percent).
II‐6
Alternative markets
U.S. producers have very limited ability to divert shipments to or from alternative
markets in response to changes in the price of wire rod. U.S. producers’ exports as a share of
their total shipments declined from 0.9 percent in 2011 to 0.7 percent in 2013.11 U.S. producers
reported that their principal export markets include Canada, Honduras, Jamaica, Mexico, and
Panama.
Internal consumption and transfers to related firms
U.S. producers’ internal consumption of wire rod increased from *** percent to ***
percent of total U.S. shipments during 2011‐13.12 U.S. producers’ transfers to related firms
increased from *** percent of total shipments in 2011 to *** percent in 2013.13 Combined,
these shipments increased from *** percent of total shipments in 2011 to *** percent in 2013.
Inventory levels
U.S. producers have some ability to use inventories as a means of increasing shipments
of wire rod to the U.S. market. U.S. producers’ ratio of end‐of‐period inventories to total
shipments increased from 4.9 percent in 2011 to 7.4 percent in 2013.14
11 U.S. producers’ exports as a share of total shipments were *** percent in January‐June 2013 and *** percent in January‐June 2014.
12 U.S. producers’ internal consumption was *** percent of total shipments during January‐June 2013 and *** percent during January‐June 2014.
13 U.S. producers’ transfers to related firms were *** percent of total shipments during January‐June 2013 and *** percent in January‐June 2014.
14 U.S. producers’ ratio of end‐of‐period inventories to U.S. shipments was higher in January‐June 2014 (*** percent) than in January‐June 2013 (*** percent).
II‐7
Production alternatives
Nine of 10 U.S. producers reported producing other products on the same equipment
and machinery used to produce wire rod.15 Seven producers reported at least some ability to
shift production between wire rod and other products. Two firms reported no constraints on
switching production between wire rod and other products, and one firm noted that it switches
production based on product demand. One producer reported that wire rod is the only product
it produces and another producer reported that it cannot easily shift production.
Supply constraints
One U.S. producer, ***, reported that it has refused, declined, or been unable to supply
wire rod since January 1, 2011, and stated that ***. Eighteen of 57 purchasers reported
experiencing supply constraints. Eight of these purchasers reported being refused, declined, or
unable to purchase wire rod from a U.S. producer.16 Purchaser *** reported that ***. ***
reported ***. *** reported that ***. *** reported supply constraints from ***. *** added that
***
15 Seven firms reported producing rebar, and five firms reported producing other products including hot‐rolled SBQ, SBQ bar, merchant bar, rounds, flats, angles, and pencil rod.
16 The other 10 purchasers reported supply constraints including limited capacity, equipment shutdowns, seasonal conditions affecting river transportation, and a shortage of trucks. These firms did not identify any particular U.S. producer or importer. Purchaser *** noted that market growth has placed pressure on lead times and that sometimes lead times have been extended.
II‐8
***. Purchasers *** did not identify any specific U.S. producer but reported delayed shipments
due to production problems at the mill, mill allocations, controlled order entry, limited capacity,
and delivery performance.
Domestic producers assert that they have been able to supply their customers’
requests.17 At the hearing, U.S. producer Keystone reported that is has not refused any orders
in the last three to four years, other than for credit issues.18 U.S. producer ArcelorMittal also
reported that is has not refused to supply wire rod to a customer.19 U.S. producer Evraz
reported that it has not turned down any orders from a customer unless they are competing
with China.20 U.S. producer Gerdau reported that it has not turned down any opportunities to
supply a customer, but that there have been occasions when it did not meet the offer because
the requested price was below Gerdau’s cost.21 U.S. producer Nucor reported that ***.22
17 Domestic producers’ posthearing brief, Exhibit 1, p. 28. 18 Hearing transcript, p. 81 (Brachbill). 19 Hearing transcript, p. 82 (Fuller). 20 Hearing transcript, p. 82 (Ashby). 21 Hearing transcript, p. 82 (Kerkvliet). 22 Nucor’s posthearing brief, Exhibit 9, p. 1.
II‐9
Subject imports from China23
Based on available information, producers of wire rod from China have the ability to
respond to changes in demand with large changes in the quantity of shipments of wire rod to
the U.S. market. The main contributing factor to this degree of responsiveness of supply is
availability of alternative markets.24
Industry capacity
Responding Chinese producers have limited unused capacity with which they could
increase production of wire rod in the event of a price change. Chinese producers’ capacity
utilization increased from 92.5 percent in 2011 to 95.3 percent in 2013.25 Chinese producers’
reported production increased by 2.5 percent from 16.9 million short tons in 2011 to 17.3
million short tons in 2013, while capacity remained relatively stable at approximately 18 million
short tons.
Alternative markets
Chinese producers reported that the largest share of their wire rod shipments were to
their home market. Chinese producers’ home market shipments increased from 62.8 percent in
2011 to 72.8 percent in 2013. Chinese producers’ exports to the United States as a share of
23 The Commission received questionnaire responses from seven Chinese producers. These firms’ exports to the United States were equivalent to 91.8 percent of U.S. imports of wire rod from China during 2011‐13 and January‐June 2014, but their 2013 production was equivalent to only 11.5 percent of published production data for China in 2013. See Part VII for additional details.
24 Chinese producers reported shipping the largest share of their wire rod to their home market. Chinese producers’ home market shipments, by quantity, were more than twice that of U.S. wire rod consumption during 2011‐13 and January‐June 2014.
25 Chinese producers’ capacity utilization was lower in January‐June 2014 (86.4 percent) than in January‐June 2013 (94.1 percent).
II‐10
their total shipments increased from less than 0.05 percent in 201126 to 3.8 percent in 2013.27
Chinese producers’ exports to all other markets decreased from 37.1 percent in 2011 to 23.3
percent in 2013. Chinese producers reported that their principal export markets include Brazil,
Chile, Ghana, Honduras, India, Indonesia, Japan, Korea, Malaysia, Mauritius, Myanmar,
Philippines, Singapore, South Africa, Taiwan, Thailand, Togo, and Vietnam.28
Internal consumption and transfers to related firms
Chinese producers’ internal consumption and transfers to related firms accounted for
0.1 percent of their total shipments during 2011‐13 and January‐June 2014.
Inventory levels
Chinese producers have somewhat limited ability to use inventories as a means of
increasing shipments of wire rod to the U.S. market. Chinese producers’ ratio of end‐of‐period
inventories to total shipments increased from 3.6 percent in 2011 to 4.9 percent in 2013.29
Production alternatives
No Chinese producers reported producing other products on the same equipment and
machinery used to produce wire rod.
26 Chinese producers reported exporting *** short tons of wire rod to the United States during 2011. 27 Chinese producers’ exports to the United States as a share of total shipments was 3.0 percent in
January‐June 2013 and 3.2 percent in January‐June 2014. 28 Domestic producers reported that Chinese wire rod is subject to antidumping duties in Malaysia
(since February 2013) and that Indonesia instituted a safeguard investigation on Chinese wire rod in January 2014. Domestic producers’ prehearing brief, p. 36.
29 Chinese producers’ ratio of end‐of‐period inventories to total shipments was 5.7 percent in January‐June 2013 and 5.4 percent in January‐June 2014.
II‐11
Supply constraints
No importer of wire rod from China reported refusing, declining, or being unable to
supply wire rod to their U.S. customers since January 1, 2011.
Nonsubject imports
The largest sources of nonsubject imports during 2011‐13 were Canada, Japan, and
Brazil. Combined, these countries accounted for 76.6 percent of nonsubject imports in 2013
and 48.9 percent of total imports in 2013.
New suppliers
Twenty‐three of 58 purchasers indicated that new suppliers entered the U.S. market
since January 1, 2011. Purchasers reported two new U.S. suppliers: Nucor’s new production
facility30 in Darlington, South Carolina (10 firms) and Evraz (3 firms). Purchasers reported new
Chinese suppliers including Beitei (2 firms), Xuanhua, Jiujang, Rizhao, and Tangshan (1 firm
each). Purchasers also identified new suppliers from nonsubject countries, including Aceros
Arequipa (Peru) and ArcelorMittal Krivy Rih (Ukraine) reported by two firms each and Saarstahl
AG (Germany) reported by 1 firm. Purchasers reported additional new suppliers from Egypt
and Turkey but did not name any specific firms. Purchasers reported learning of new foreign
suppliers at trade shows.
30 This facility came on line in late 2013. Hearing transcript, p. 39 (Nystrom).
II‐12
Purchaser inventory
Petitioners assert that purchasers have built up inventories of Chinese wire rod.31
Duferco contends that petitioners are relying on a statements made by a single purchaser,
***.32 In their posthearing brief, petitioners identified 21 purchasers that reported holding
inventory of Chinese wire rod.33
Forty‐nine purchasers provided their end‐of‐period inventories of wire rod, by source,
for June 2013, December 2013, and June 2014 (table II‐3).34 All 49 purchasers reported holding
inventory of U.S.‐produced wire rod, 24 of Chinese wire rod, and 33 of wire rod from all other
sources. Purchasers’ total end‐of‐period inventories of wire rod increased from June 2013 to
June 2014. Purchasers’ end‐of‐period inventories of wire rod produced in the United States
increased from June 2013 to December 2013 then declined in June 2014 while end‐of‐period
inventories of wire rod from China increased from June 2013 to June 2014.
31 Domestic producers’ prehearing brief, pp. 41‐42, Nucor’s prehearing brief, p. 35, hearing transcript, p. 41 (Nystrom) and pp. 49‐50 (Cannon), and Nucor’s posthearing brief, pp. 2 and 13.
32 Duferco’s posthearing brief, p. 13. 33 Domestic producers’ posthearing brief, p. 13, Exhibit 6, p. 1, Exhibit 7, p. 1, and Exhibit 8, p. 1.
Fifteen of these purchasers responded to the Commission’s U.S. purchaser questionnaire and 13 provided data on their inventories of wire rod.
34 Five additional purchasers (***) reported that they did not keep track of their inventory in a manner that would allow them to provide the data by source as requested. These firms reported their total inventory for each of the requested periods. This data is presented in table II‐3 as “Unknown source.” Four of these firms, ***, reported purchasing Chinese wire rod.
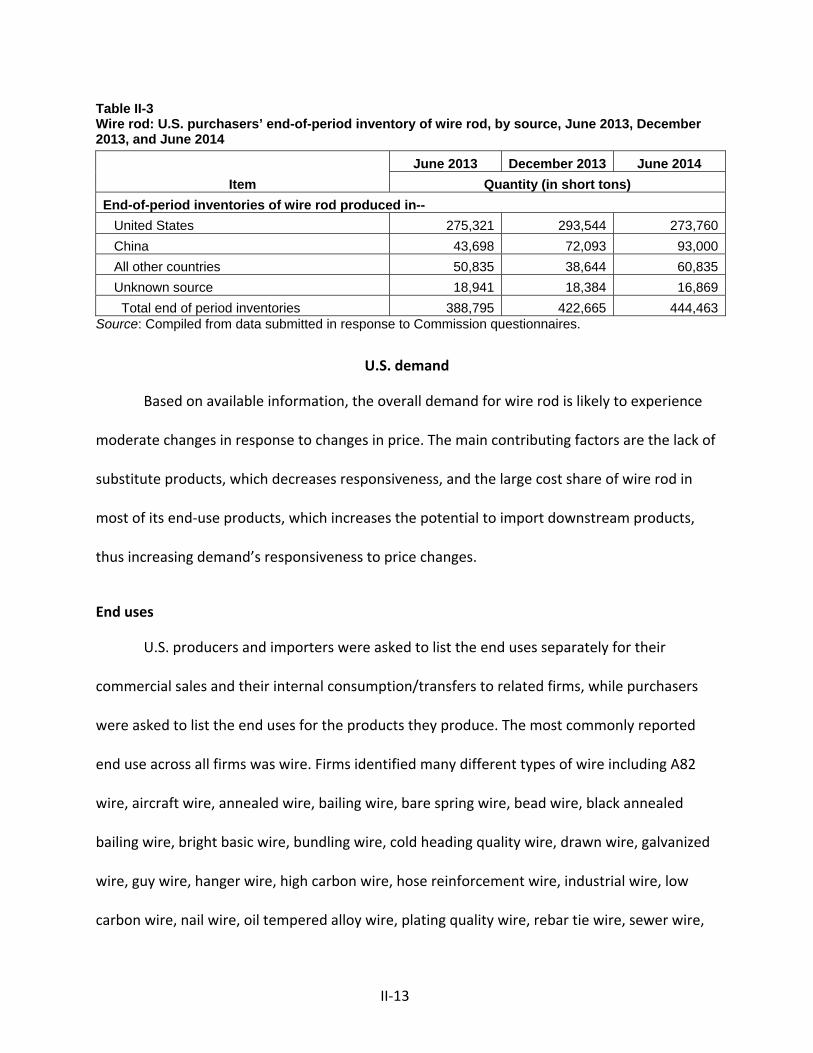
II‐13
Table II-3 Wire rod: U.S. purchasers’ end-of-period inventory of wire rod, by source, June 2013, December 2013, and June 2014
Item June 2013 December 2013 June 2014
Quantity (in short tons) End-of-period inventories of wire rod produced in-- United States 275,321 293,544 273,760 China 43,698 72,093 93,000 All other countries 50,835 38,644 60,835 Unknown source 18,941 18,384 16,869 Total end of period inventories 388,795 422,665 444,463
Source: Compiled from data submitted in response to Commission questionnaires.
U.S. demand
Based on available information, the overall demand for wire rod is likely to experience
moderate changes in response to changes in price. The main contributing factors are the lack of
substitute products, which decreases responsiveness, and the large cost share of wire rod in
most of its end‐use products, which increases the potential to import downstream products,
thus increasing demand’s responsiveness to price changes.
End uses
U.S. producers and importers were asked to list the end uses separately for their
commercial sales and their internal consumption/transfers to related firms, while purchasers
were asked to list the end uses for the products they produce. The most commonly reported
end use across all firms was wire. Firms identified many different types of wire including A82
wire, aircraft wire, annealed wire, bailing wire, bare spring wire, bead wire, black annealed
bailing wire, bright basic wire, bundling wire, cold heading quality wire, drawn wire, galvanized
wire, guy wire, hanger wire, high carbon wire, hose reinforcement wire, industrial wire, low
carbon wire, nail wire, oil tempered alloy wire, plating quality wire, rebar tie wire, sewer wire,
II‐14
shelving wire, spring wire, tire wire, vineyard wire, welded wire mesh, welding wire, wire
decking, wire line, wire mesh, wire rope, and wire used for appliances.
U.S. producers also identified additional end‐use products for their commercial sales
and internal consumption/transfers including CF bar/pencil rod, chain link fence, concrete
reinforcing mesh, fabricated wire products, fasteners, mesh, nails, staples, and tire cord.
Products which U.S. producers only reported under commercial sales were cold headed parts,
prestressed concrete (PC) strand, shelving, and tire bead, while end‐use products U.S.
producers only identified for their internal consumption/transfers included ***.
Products which importers only reported under commercial sales were armatures for
starters and alternators, automotive parts (bearings, bolts, fasteners, and springs), brake
springs, chain link fence, clutch spring, formed products, low carbon drawing, low carbon mesh,
nails, PC rod, PC strand, springs, staples threaded rod, tire bead, transmission spring, valve
spring, welded mesh, and welding rod. Products which importers only reported for their
internal consumption/transfers included ***. Importers identified tire cord as an end‐use
product for both their commercial sales and internal consumption/transfers.
End uses identified by purchasers included all‐thread rod, anchor bolts, bolts,
building/construction mesh, chain, chain link fence, cleaned and coated rod, coil spring, cold
finish bar, commercial and consumer wire shelving, galvanized flooring, ground rods, hog rings,
mill galvanized wire, mine mesh, nails, nuts, PC strand, pipe, plumbing tools, point of purchase
II‐15
displays, screens, staples, steel cord, steel fasteners, threaded rod, threaded studs, tire chain,
tire cord, tow chains, trade wire, U bolts, welding electrodes, and wire garment hangers.
Purchasers were also asked if they purchased wire rod from a wire rod producer that
also produced the same end‐use products as the purchaser during 2013. Seventeen of 53
purchasers reported that their suppliers also produced the same end‐use products. Ten
purchasers reported that this affected 15 percent or less of their 2013 purchases while four
firms (***) reported that it affected 75 percent or more of their 2013 purchases. Firms
identified these suppliers and products: Charter Steel (low carbon wire and cold heading quality
wire), Deacero (wire), Gerdau (black annealed wire, bailing wire, mesh products, and industrial
wire), Ivaco (bolts and cold heading quality wire), Keystone (agricultural products, galvanized
wire, and mesh products), Mid American (agricultural products and mesh products), Nucor
(cold finish bar, galvanized wire, and mesh), Republic (cold heading quality wire), and Sterling
(bright basic, galvanized, oil tempered and spring wire).
Cost share
Wire rod accounts for a large share of the cost of the end‐use products in which it is
used. Cost shares for the most commonly identified end‐use products reported by most U.S.
producers, importers, and purchasers are presented in table II‐4.
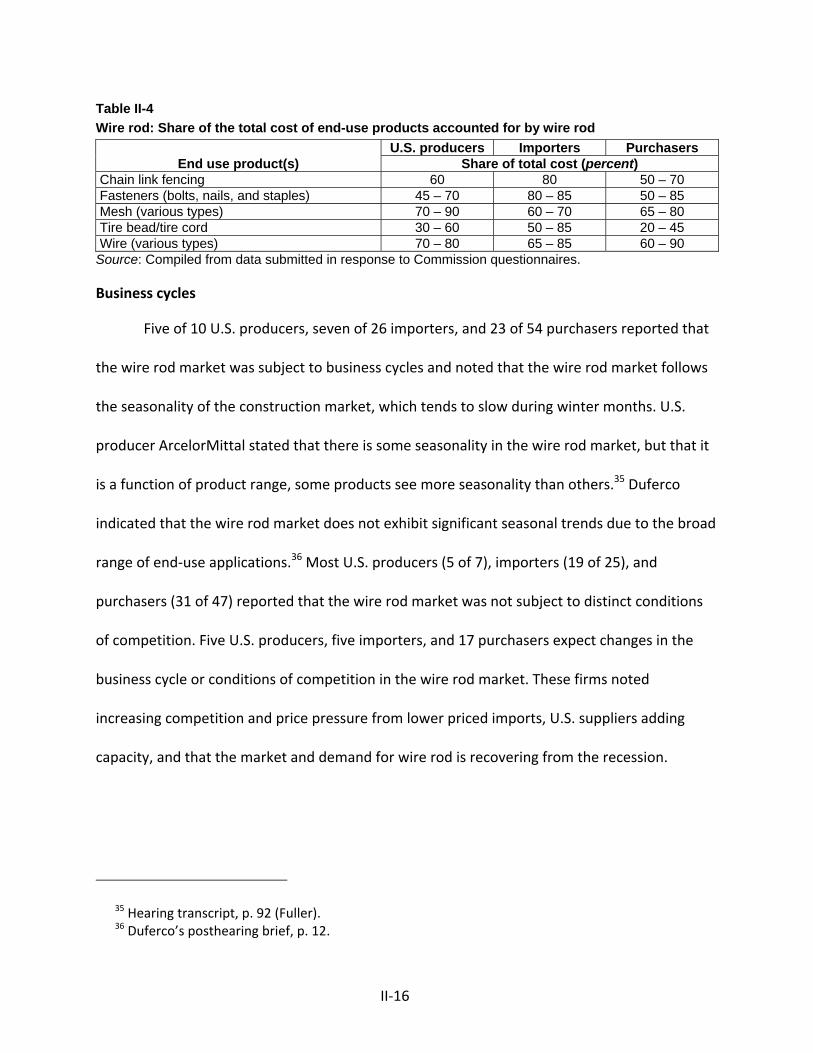
II‐16
Table II-4 Wire rod: Share of the total cost of end-use products accounted for by wire rod
End use product(s) U.S. producers Importers Purchasers
Share of total cost (percent) Chain link fencing 60 80 50 – 70 Fasteners (bolts, nails, and staples) 45 – 70 80 – 85 50 – 85 Mesh (various types) 70 – 90 60 – 70 65 – 80 Tire bead/tire cord 30 – 60 50 – 85 20 – 45 Wire (various types) 70 – 80 65 – 85 60 – 90 Source: Compiled from data submitted in response to Commission questionnaires.
Business cycles
Five of 10 U.S. producers, seven of 26 importers, and 23 of 54 purchasers reported that
the wire rod market was subject to business cycles and noted that the wire rod market follows
the seasonality of the construction market, which tends to slow during winter months. U.S.
producer ArcelorMittal stated that there is some seasonality in the wire rod market, but that it
is a function of product range, some products see more seasonality than others.35 Duferco
indicated that the wire rod market does not exhibit significant seasonal trends due to the broad
range of end‐use applications.36 Most U.S. producers (5 of 7), importers (19 of 25), and
purchasers (31 of 47) reported that the wire rod market was not subject to distinct conditions
of competition. Five U.S. producers, five importers, and 17 purchasers expect changes in the
business cycle or conditions of competition in the wire rod market. These firms noted
increasing competition and price pressure from lower priced imports, U.S. suppliers adding
capacity, and that the market and demand for wire rod is recovering from the recession.
35 Hearing transcript, p. 92 (Fuller). 36 Duferco’s posthearing brief, p. 12.
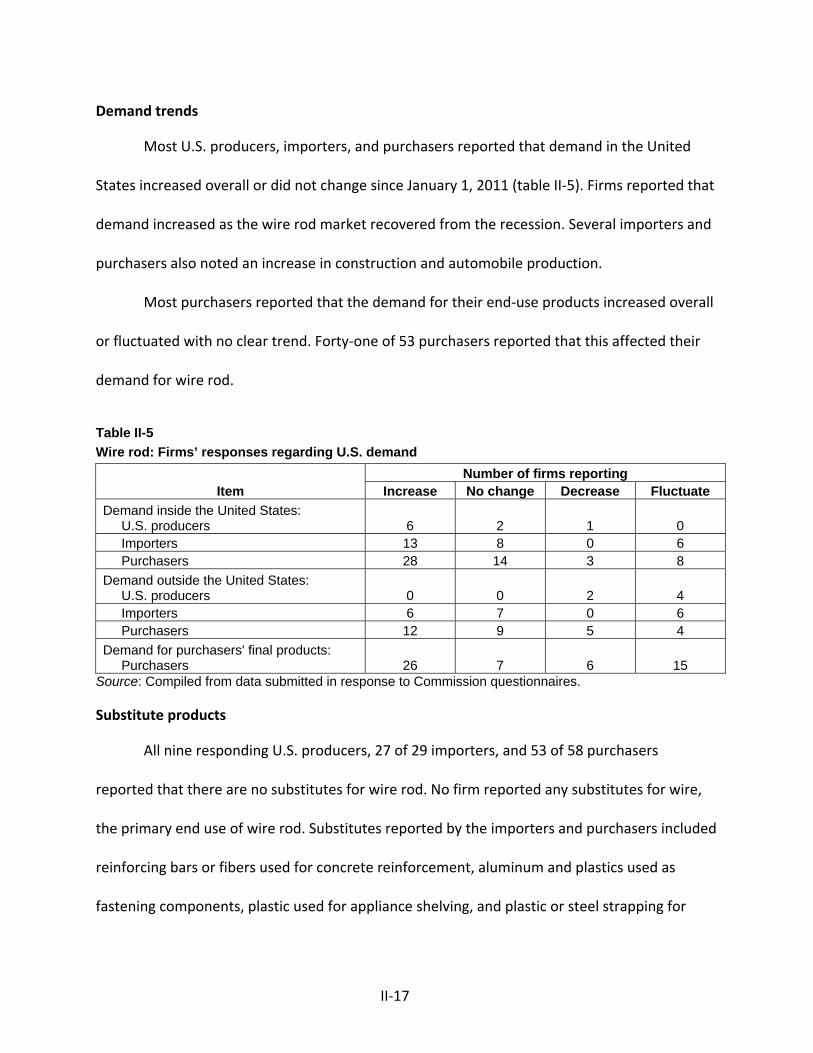
II‐17
Demand trends
Most U.S. producers, importers, and purchasers reported that demand in the United
States increased overall or did not change since January 1, 2011 (table II‐5). Firms reported that
demand increased as the wire rod market recovered from the recession. Several importers and
purchasers also noted an increase in construction and automobile production.
Most purchasers reported that the demand for their end‐use products increased overall
or fluctuated with no clear trend. Forty‐one of 53 purchasers reported that this affected their
demand for wire rod.
Table II-5 Wire rod: Firms’ responses regarding U.S. demand
Item Number of firms reporting
Increase No change Decrease Fluctuate Demand inside the United States: U.S. producers 6 2 1 0 Importers 13 8 0 6 Purchasers 28 14 3 8 Demand outside the United States: U.S. producers 0 0 2 4 Importers 6 7 0 6 Purchasers 12 9 5 4 Demand for purchasers' final products: Purchasers 26 7 6 15
Source: Compiled from data submitted in response to Commission questionnaires.
Substitute products
All nine responding U.S. producers, 27 of 29 importers, and 53 of 58 purchasers
reported that there are no substitutes for wire rod. No firm reported any substitutes for wire,
the primary end use of wire rod. Substitutes reported by the importers and purchasers included
reinforcing bars or fibers used for concrete reinforcement, aluminum and plastics used as
fastening components, plastic used for appliance shelving, and plastic or steel strapping for
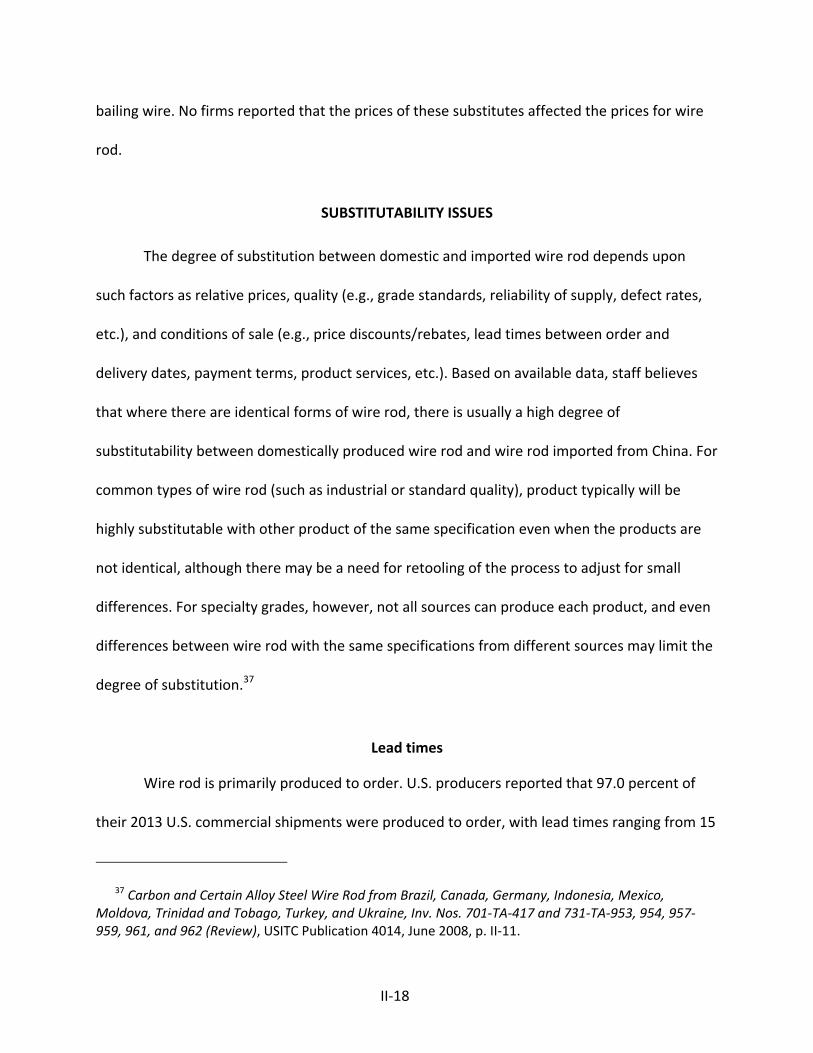
II‐18
bailing wire. No firms reported that the prices of these substitutes affected the prices for wire
rod.
SUBSTITUTABILITY ISSUES
The degree of substitution between domestic and imported wire rod depends upon
such factors as relative prices, quality (e.g., grade standards, reliability of supply, defect rates,
etc.), and conditions of sale (e.g., price discounts/rebates, lead times between order and
delivery dates, payment terms, product services, etc.). Based on available data, staff believes
that where there are identical forms of wire rod, there is usually a high degree of
substitutability between domestically produced wire rod and wire rod imported from China. For
common types of wire rod (such as industrial or standard quality), product typically will be
highly substitutable with other product of the same specification even when the products are
not identical, although there may be a need for retooling of the process to adjust for small
differences. For specialty grades, however, not all sources can produce each product, and even
differences between wire rod with the same specifications from different sources may limit the
degree of substitution.37
Lead times
Wire rod is primarily produced to order. U.S. producers reported that 97.0 percent of
their 2013 U.S. commercial shipments were produced to order, with lead times ranging from 15
37 Carbon and Certain Alloy Steel Wire Rod from Brazil, Canada, Germany, Indonesia, Mexico, Moldova, Trinidad and Tobago, Turkey, and Ukraine, Inv. Nos. 701‐TA‐417 and 731‐TA‐953, 954, 957‐959, 961, and 962 (Review), USITC Publication 4014, June 2008, p. II‐11.
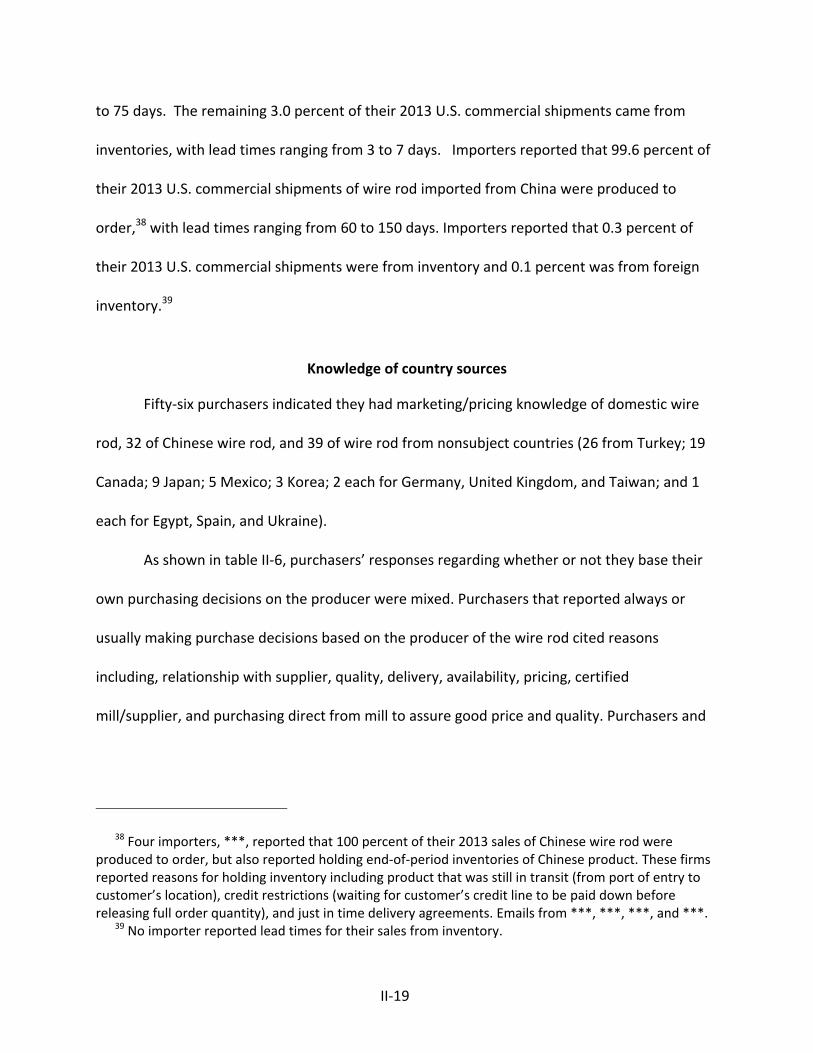
II‐19
to 75 days. The remaining 3.0 percent of their 2013 U.S. commercial shipments came from
inventories, with lead times ranging from 3 to 7 days. Importers reported that 99.6 percent of
their 2013 U.S. commercial shipments of wire rod imported from China were produced to
order,38 with lead times ranging from 60 to 150 days. Importers reported that 0.3 percent of
their 2013 U.S. commercial shipments were from inventory and 0.1 percent was from foreign
inventory.39
Knowledge of country sources
Fifty‐six purchasers indicated they had marketing/pricing knowledge of domestic wire
rod, 32 of Chinese wire rod, and 39 of wire rod from nonsubject countries (26 from Turkey; 19
Canada; 9 Japan; 5 Mexico; 3 Korea; 2 each for Germany, United Kingdom, and Taiwan; and 1
each for Egypt, Spain, and Ukraine).
As shown in table II‐6, purchasers’ responses regarding whether or not they base their
own purchasing decisions on the producer were mixed. Purchasers that reported always or
usually making purchase decisions based on the producer of the wire rod cited reasons
including, relationship with supplier, quality, delivery, availability, pricing, certified
mill/supplier, and purchasing direct from mill to assure good price and quality. Purchasers and
38 Four importers, ***, reported that 100 percent of their 2013 sales of Chinese wire rod were produced to order, but also reported holding end‐of‐period inventories of Chinese product. These firms reported reasons for holding inventory including product that was still in transit (from port of entry to customer’s location), credit restrictions (waiting for customer’s credit line to be paid down before releasing full order quantity), and just in time delivery agreements. Emails from ***, ***, ***, and ***.
39 No importer reported lead times for their sales from inventory.
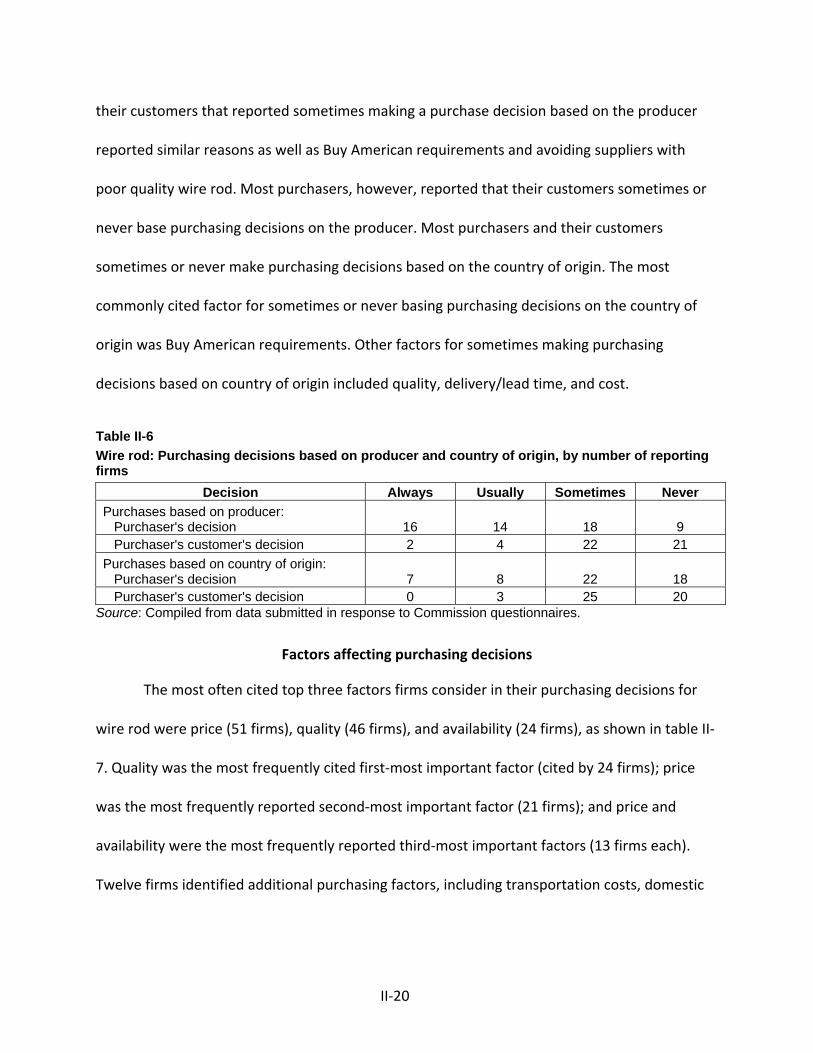
II‐20
their customers that reported sometimes making a purchase decision based on the producer
reported similar reasons as well as Buy American requirements and avoiding suppliers with
poor quality wire rod. Most purchasers, however, reported that their customers sometimes or
never base purchasing decisions on the producer. Most purchasers and their customers
sometimes or never make purchasing decisions based on the country of origin. The most
commonly cited factor for sometimes or never basing purchasing decisions on the country of
origin was Buy American requirements. Other factors for sometimes making purchasing
decisions based on country of origin included quality, delivery/lead time, and cost.
Table II-6 Wire rod: Purchasing decisions based on producer and country of origin, by number of reporting firms
Decision Always Usually Sometimes Never Purchases based on producer: Purchaser's decision 16 14 18 9 Purchaser's customer's decision 2 4 22 21 Purchases based on country of origin: Purchaser's decision 7 8 22 18 Purchaser's customer's decision 0 3 25 20
Source: Compiled from data submitted in response to Commission questionnaires.
Factors affecting purchasing decisions
The most often cited top three factors firms consider in their purchasing decisions for
wire rod were price (51 firms), quality (46 firms), and availability (24 firms), as shown in table II‐
7. Quality was the most frequently cited first‐most important factor (cited by 24 firms); price
was the most frequently reported second‐most important factor (21 firms); and price and
availability were the most frequently reported third‐most important factors (13 firms each).
Twelve firms identified additional purchasing factors, including transportation costs, domestic
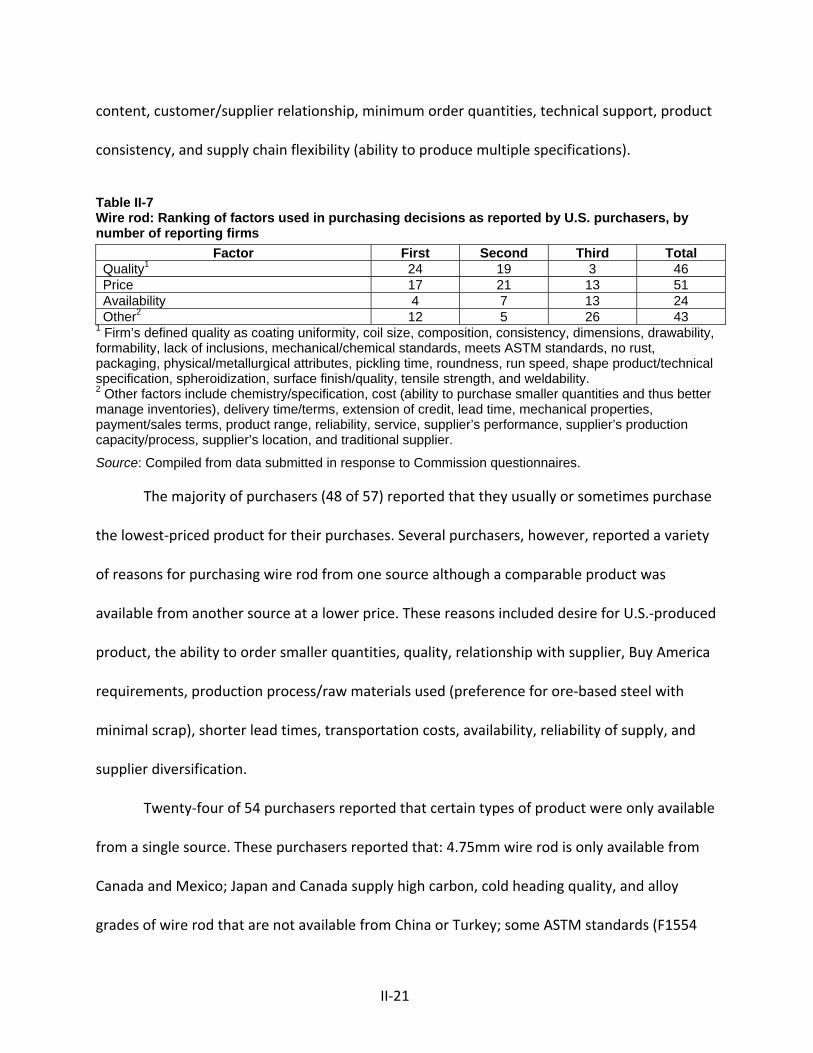
II‐21
content, customer/supplier relationship, minimum order quantities, technical support, product
consistency, and supply chain flexibility (ability to produce multiple specifications).
Table II-7 Wire rod: Ranking of factors used in purchasing decisions as reported by U.S. purchasers, by number of reporting firms
Factor First Second Third Total Quality1 24 19 3 46 Price 17 21 13 51 Availability 4 7 13 24 Other2 12 5 26 43
1 Firm’s defined quality as coating uniformity, coil size, composition, consistency, dimensions, drawability, formability, lack of inclusions, mechanical/chemical standards, meets ASTM standards, no rust, packaging, physical/metallurgical attributes, pickling time, roundness, run speed, shape product/technical specification, spheroidization, surface finish/quality, tensile strength, and weldability. 2 Other factors include chemistry/specification, cost (ability to purchase smaller quantities and thus better manage inventories), delivery time/terms, extension of credit, lead time, mechanical properties, payment/sales terms, product range, reliability, service, supplier’s performance, supplier’s production capacity/process, supplier’s location, and traditional supplier.
Source: Compiled from data submitted in response to Commission questionnaires.
The majority of purchasers (48 of 57) reported that they usually or sometimes purchase
the lowest‐priced product for their purchases. Several purchasers, however, reported a variety
of reasons for purchasing wire rod from one source although a comparable product was
available from another source at a lower price. These reasons included desire for U.S.‐produced
product, the ability to order smaller quantities, quality, relationship with supplier, Buy America
requirements, production process/raw materials used (preference for ore‐based steel with
minimal scrap), shorter lead times, transportation costs, availability, reliability of supply, and
supplier diversification.
Twenty‐four of 54 purchasers reported that certain types of product were only available
from a single source. These purchasers reported that: 4.75mm wire rod is only available from
Canada and Mexico; Japan and Canada supply high carbon, cold heading quality, and alloy
grades of wire rod that are not available from China or Turkey; some ASTM standards (F1554
II‐22
Grades 35, 55, and 105) are only available from domestic suppliers; there is limited availability
of wire rod made from iron ore from U.S. suppliers; some specialty grades are only available
from the United States and Canada; and wire rod with specification C1090 5.5mm is only
available from Japan and Germany due to antidumping duties. Purchaser *** added that ***.
Twenty‐three of 56 purchasers reported purchasing wire rod from one country in
particular over other possible sources of supply. Nine purchasers reported a preference for
U.S.‐produced wire rod. Six purchasers reported purchasing U.S.‐produced wire rod to meet
Buy America requirements. Three purchasers reported a preference for purchasing automotive
and aircraft quality wire rod from Japan. Two purchasers reported a preference for Chinese
wire rod. One stated that Chinese suppliers offered competitive pricing and a broad product
range.40 Another purchaser stated that the best iron ore based steel is manufactured in China.
Importance of specified purchase factors
Purchasers were asked to rate the importance of 15 factors in their purchasing decisions
(table II‐8). Nearly all responding purchasers (56 of 57) rated price as a very important factor in
their purchasing decisions.41 Fifty‐two of 57 responding purchasers reported that product
consistency was also a very important purchasing factor. More than half of responding
40 This purchaser (***) noted that since the filing of this case, it has shifted purchases to other countries that offer a more competitive price than U.S. suppliers.
41 Purchaser *** reported that price was only somewhat important in its purchasing decisions.
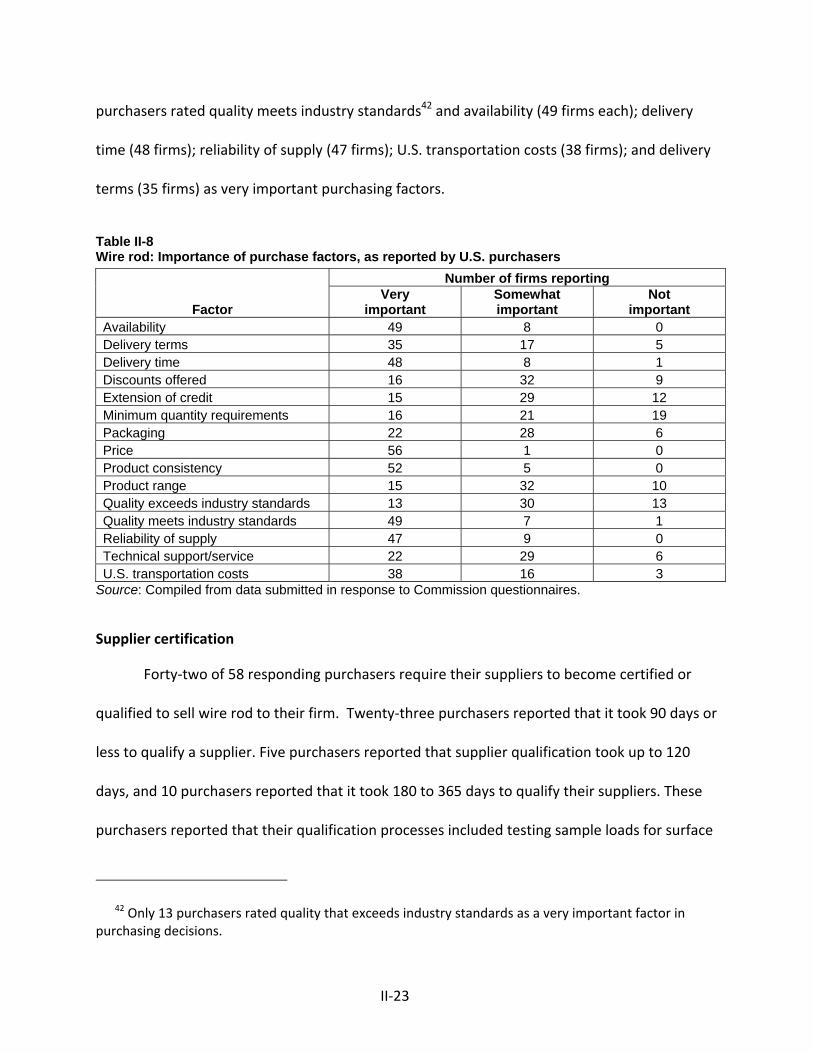
II‐23
purchasers rated quality meets industry standards42 and availability (49 firms each); delivery
time (48 firms); reliability of supply (47 firms); U.S. transportation costs (38 firms); and delivery
terms (35 firms) as very important purchasing factors.
Table II-8 Wire rod: Importance of purchase factors, as reported by U.S. purchasers
Factor
Number of firms reporting Very
important Somewhat important
Not important
Availability 49 8 0 Delivery terms 35 17 5 Delivery time 48 8 1 Discounts offered 16 32 9 Extension of credit 15 29 12 Minimum quantity requirements 16 21 19 Packaging 22 28 6 Price 56 1 0 Product consistency 52 5 0 Product range 15 32 10 Quality exceeds industry standards 13 30 13 Quality meets industry standards 49 7 1 Reliability of supply 47 9 0 Technical support/service 22 29 6 U.S. transportation costs 38 16 3
Source: Compiled from data submitted in response to Commission questionnaires.
Supplier certification
Forty‐two of 58 responding purchasers require their suppliers to become certified or
qualified to sell wire rod to their firm. Twenty‐three purchasers reported that it took 90 days or
less to qualify a supplier. Five purchasers reported that supplier qualification took up to 120
days, and 10 purchasers reported that it took 180 to 365 days to qualify their suppliers. These
purchasers reported that their qualification processes included testing sample loads for surface
42 Only 13 purchasers rated quality that exceeds industry standards as a very important factor in purchasing decisions.
II‐24
quality, hardness, tensile, and bending yield; reviewing mill certifications; performing quality
audits; and auditing the supplier’s system and processes. Two purchasers reported that the
time needed to qualify a supplier varied and was dependent on the supplier’s capability and
process, product quality, and the type of product. One purchaser, ***, stated that the number
of days to qualify a supplier is not relevant. It is the number of trials that are needed, and the
number of trials depends on the application of the wire rod (one trial is usually sufficient for
mesh, while four or five trials are often required for bead). Purchaser *** reported that their
supplier certification process is quality driven and is based on ISO 9000 requirements. Lincoln
Electric reported that ***.43
Fourteen purchasers reported that a supplier had failed in its attempt to qualify
product, or had lost its approved status since January 1, 2011. Quality was the main reason for
suppliers becoming disqualified or being dropped from an approved supplier list. Purchasers
identified quality problems with the following suppliers: Beitai (Chinese supplier), Charter Steel
(U.S. producer), Keystone (U.S. producer), Ivaco (Canadian supplier), Mechel (Russian supplier),
Nucor (U.S. producer), and Xuanhua (Chinese supplier). Other factors cited as reasons for
disqualifying a supplier included inability to consistently meet product specifications (U.S.
43 Lincoln Electric’s postconference statement, p. 6.
II‐25
producer Charter Steel), failure to meet chemical and mechanical specifications (U.S. producers
ArcelorMittal and Nucor), and excessive rust (CMC, Chinese and Mexican product). Purchaser
*** reported that consistently meeting *** standards is very difficult to achieve. *** reported
that is has tested product from many suppliers that have not been approved or lost their
approved status because of poor product performance.44
Changes in purchasing patterns
Purchasers were asked about changes in their purchasing patterns from different
sources since 2011 (table II‐9). The most commonly reported reason for decreasing purchases
of U.S.‐produced wire rod and increasing purchases of Chinese wire rod was price. Purchasers
reported that prices for U.S.‐produced wire rod were higher than prices for imported product.
Most purchasers that reported fluctuating purchases of U.S.‐produced wire rod indicated that
their purchasing patterns followed general market demand/pricing trends.
Table II-9 Wire rod: Changes in purchase patterns from U.S., subject, and nonsubject countries
Source of purchases Did not
purchase Decreased Increased Constant FluctuatedUnited States 0 17 12 15 15 China 21 2 23 1 5 Other 10 12 10 14 13
Source: Compiled from data submitted in response to Commission questionnaires.
Eleven purchasers reported purchasing wire rod from only one source. These purchasers
only purchased U.S.‐produced wire rod and reported doing so because of product availability,
44 Purchaser *** added that its company policies require ***.
II‐26
price, delivery, desire to only purchase domestic product or from a local supplier, U.S.‐produced
product is required for most of their purchases, and affiliations with U.S. producers of wire rod.
Twenty of 57 responding purchasers reported that they had changed suppliers since
2011. Purchasers reported shifting volumes between Charter Steel, Ivaco, ArcelorMittal, and
Republic due to pricing, delivery, quality, and performance issues; adding Keystone and Evraz to
increase supplier base; adding Nucor’s new South Carolina mill; adding Ivaco due to better
pricing and dropping Republic Steel due to poor delivery and pricing; and dropping Deacero due
to trade restrictions. Some purchasers reported changing suppliers due to special deals,
competitiveness, price, increasing import supply, quality, lead time, payment terms, coil size,
and product performance, but did not identify any specific supplier in their response.
Importance of purchasing domestic product
U.S. producers reported that Buy America is not a significant factor in the wire rod
market, accounting for only a small portion, and that their customers do not often specify
whether the wire rod they are purchasing is for a project with Buy America requirements.45
Twenty‐nine of 58 purchasers reported that U.S.‐produced product was required by law for at
least some of their wire rod purchases. Most of the 29 firms (20) reported that U.S.‐produced
product was required by law for 15 percent or less of their wire rod purchases, while three
purchasers reported U.S.‐produced wire rod was required by law for 60 to 80 percent of their
purchases. Twenty‐three purchasers reported that U.S.‐produced wire rod was required by
45 Conference transcript, p. 58 (Ashby), hearing transcript, pp. 57‐58 (Nystrom, Brachbill, Kerkvliet, and Ashby) and pp. 73‐74 (Nystrom and Price), and domestic producers’ posthearing brief, p. 8 and Exhibit 1, pp. 32‐33.
II‐27
their customers; 18 of these firms reported that this represented less than 25 percent of their
purchases. Eighteen purchasers reported that 100 percent of their purchases did not require
U.S.‐produced wire rod.46
Comparisons of domestic products, subject imports, and nonsubject imports
Purchasers were asked a number of questions comparing wire rod produced in the
United States, subject countries, and nonsubject countries. First, purchasers were asked for a
country‐by‐country comparison on the same 15 factors (table II‐10) for which they were asked
to rate the importance.
46 An additional 20 purchasers reported that 90 to 99 percent of their purchases did not require U.S.‐produced wire rod.
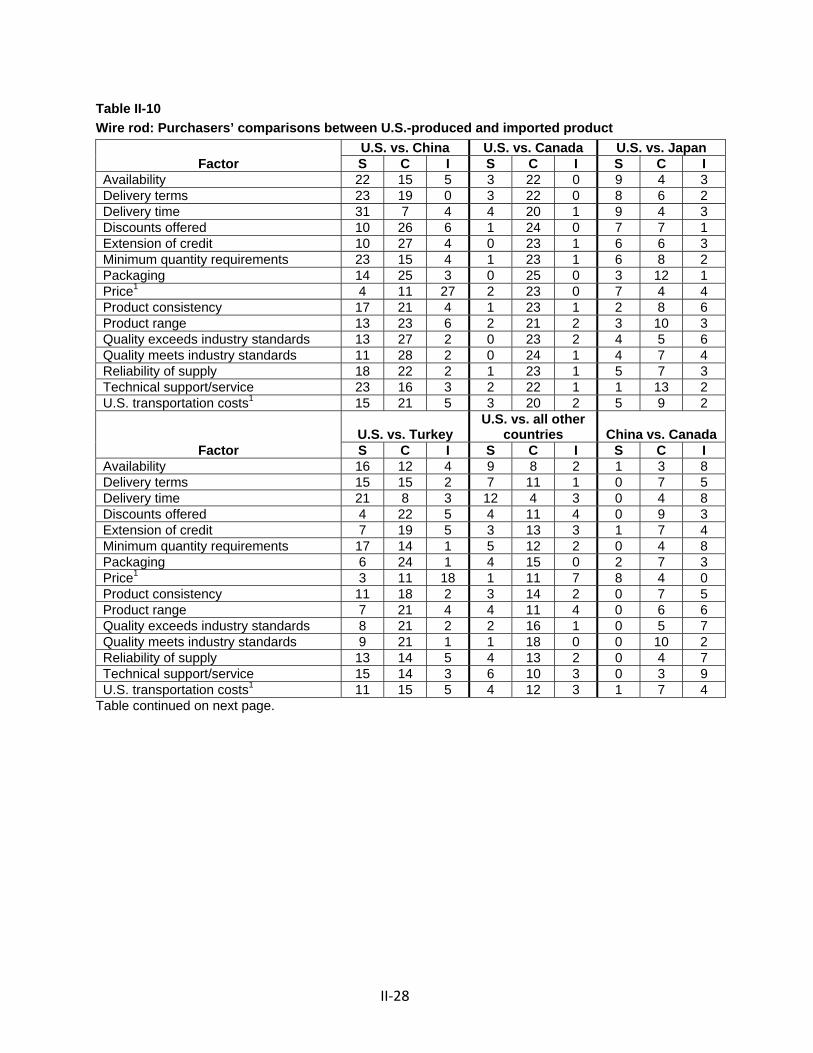
II‐28
Table II-10 Wire rod: Purchasers’ comparisons between U.S.-produced and imported product
Factor U.S. vs. China U.S. vs. Canada U.S. vs. Japan S C I S C I S C I
Availability 22 15 5 3 22 0 9 4 3 Delivery terms 23 19 0 3 22 0 8 6 2 Delivery time 31 7 4 4 20 1 9 4 3 Discounts offered 10 26 6 1 24 0 7 7 1 Extension of credit 10 27 4 0 23 1 6 6 3 Minimum quantity requirements 23 15 4 1 23 1 6 8 2 Packaging 14 25 3 0 25 0 3 12 1 Price1 4 11 27 2 23 0 7 4 4 Product consistency 17 21 4 1 23 1 2 8 6 Product range 13 23 6 2 21 2 3 10 3 Quality exceeds industry standards 13 27 2 0 23 2 4 5 6 Quality meets industry standards 11 28 2 0 24 1 4 7 4 Reliability of supply 18 22 2 1 23 1 5 7 3 Technical support/service 23 16 3 2 22 1 1 13 2 U.S. transportation costs1 15 21 5 3 20 2 5 9 2
Factor U.S. vs. Turkey
U.S. vs. all other countries China vs. Canada
S C I S C I S C I Availability 16 12 4 9 8 2 1 3 8 Delivery terms 15 15 2 7 11 1 0 7 5 Delivery time 21 8 3 12 4 3 0 4 8 Discounts offered 4 22 5 4 11 4 0 9 3 Extension of credit 7 19 5 3 13 3 1 7 4 Minimum quantity requirements 17 14 1 5 12 2 0 4 8 Packaging 6 24 1 4 15 0 2 7 3 Price1 3 11 18 1 11 7 8 4 0 Product consistency 11 18 2 3 14 2 0 7 5 Product range 7 21 4 4 11 4 0 6 6 Quality exceeds industry standards 8 21 2 2 16 1 0 5 7 Quality meets industry standards 9 21 1 1 18 0 0 10 2 Reliability of supply 13 14 5 4 13 2 0 4 7 Technical support/service 15 14 3 6 10 3 0 3 9 U.S. transportation costs1 11 15 5 4 12 3 1 7 4
Table continued on next page.
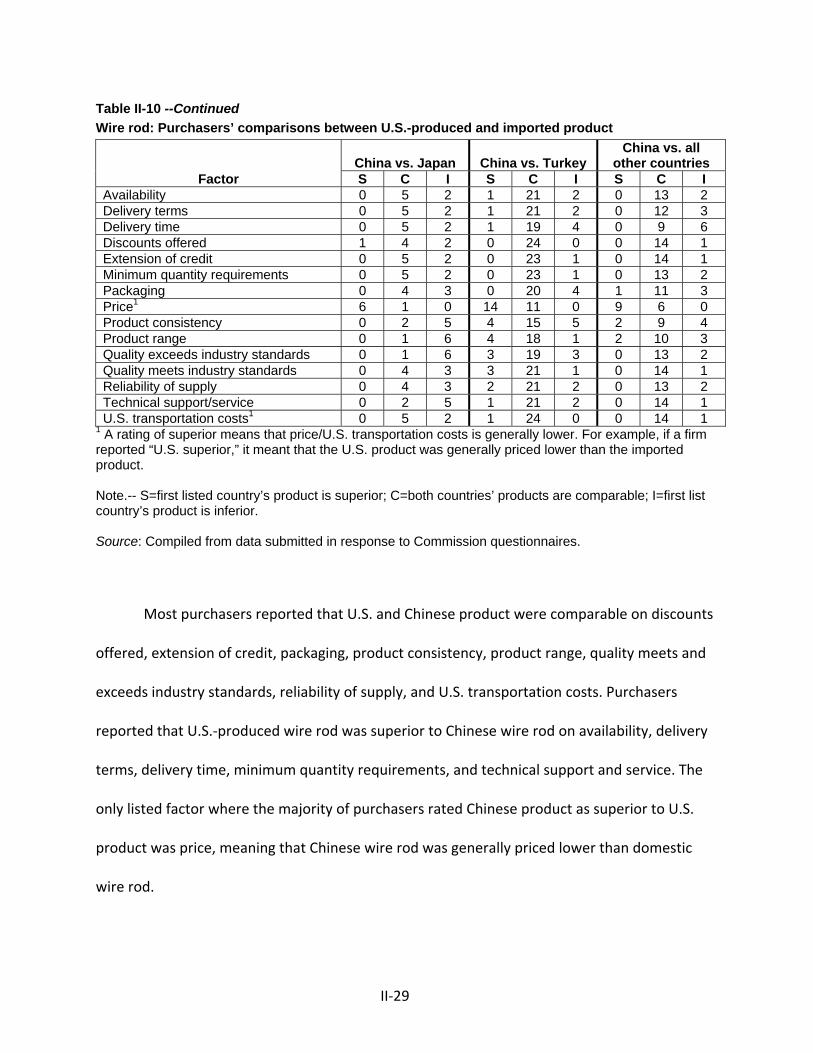
II‐29
Table II-10 --Continued Wire rod: Purchasers’ comparisons between U.S.-produced and imported product
Factor China vs. Japan China vs. Turkey
China vs. all other countries
S C I S C I S C I Availability 0 5 2 1 21 2 0 13 2 Delivery terms 0 5 2 1 21 2 0 12 3 Delivery time 0 5 2 1 19 4 0 9 6 Discounts offered 1 4 2 0 24 0 0 14 1 Extension of credit 0 5 2 0 23 1 0 14 1 Minimum quantity requirements 0 5 2 0 23 1 0 13 2 Packaging 0 4 3 0 20 4 1 11 3 Price1 6 1 0 14 11 0 9 6 0 Product consistency 0 2 5 4 15 5 2 9 4 Product range 0 1 6 4 18 1 2 10 3 Quality exceeds industry standards 0 1 6 3 19 3 0 13 2 Quality meets industry standards 0 4 3 3 21 1 0 14 1 Reliability of supply 0 4 3 2 21 2 0 13 2 Technical support/service 0 2 5 1 21 2 0 14 1 U.S. transportation costs1 0 5 2 1 24 0 0 14 1
1 A rating of superior means that price/U.S. transportation costs is generally lower. For example, if a firm reported “U.S. superior,” it meant that the U.S. product was generally priced lower than the imported product. Note.-- S=first listed country’s product is superior; C=both countries’ products are comparable; I=first list country’s product is inferior. Source: Compiled from data submitted in response to Commission questionnaires.
Most purchasers reported that U.S. and Chinese product were comparable on discounts
offered, extension of credit, packaging, product consistency, product range, quality meets and
exceeds industry standards, reliability of supply, and U.S. transportation costs. Purchasers
reported that U.S.‐produced wire rod was superior to Chinese wire rod on availability, delivery
terms, delivery time, minimum quantity requirements, and technical support and service. The
only listed factor where the majority of purchasers rated Chinese product as superior to U.S.
product was price, meaning that Chinese wire rod was generally priced lower than domestic
wire rod.
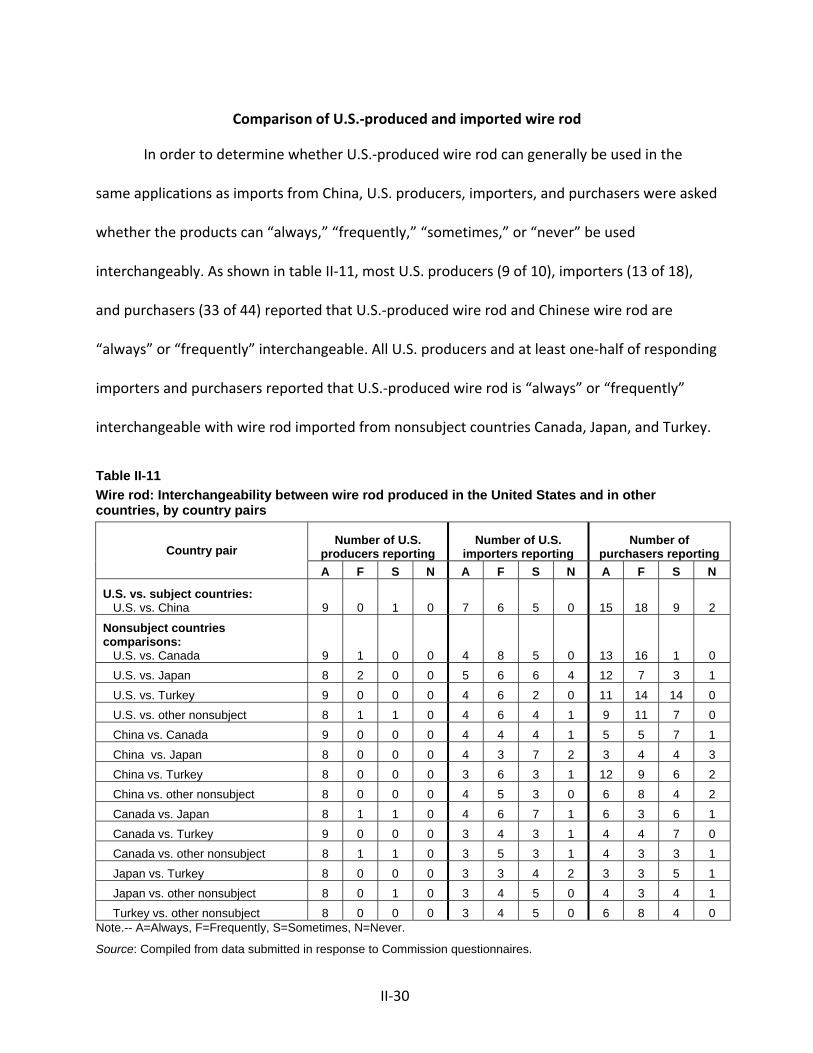
II‐30
Comparison of U.S.‐produced and imported wire rod
In order to determine whether U.S.‐produced wire rod can generally be used in the
same applications as imports from China, U.S. producers, importers, and purchasers were asked
whether the products can “always,” “frequently,” “sometimes,” or “never” be used
interchangeably. As shown in table II‐11, most U.S. producers (9 of 10), importers (13 of 18),
and purchasers (33 of 44) reported that U.S.‐produced wire rod and Chinese wire rod are
“always” or “frequently” interchangeable. All U.S. producers and at least one‐half of responding
importers and purchasers reported that U.S.‐produced wire rod is “always” or “frequently”
interchangeable with wire rod imported from nonsubject countries Canada, Japan, and Turkey.
Table II-11 Wire rod: Interchangeability between wire rod produced in the United States and in other countries, by country pairs
Country pair Number of U.S.
producers reporting Number of U.S.
importers reporting Number of
purchasers reporting A F S N A F S N A F S N
U.S. vs. subject countries: U.S. vs. China 9 0 1 0 7 6 5 0 15 18 9 2
Nonsubject countries comparisons: U.S. vs. Canada 9 1 0 0 4 8 5 0 13 16 1 0 U.S. vs. Japan 8 2 0 0 5 6 6 4 12 7 3 1 U.S. vs. Turkey 9 0 0 0 4 6 2 0 11 14 14 0 U.S. vs. other nonsubject 8 1 1 0 4 6 4 1 9 11 7 0 China vs. Canada 9 0 0 0 4 4 4 1 5 5 7 1 China vs. Japan 8 0 0 0 4 3 7 2 3 4 4 3 China vs. Turkey 8 0 0 0 3 6 3 1 12 9 6 2 China vs. other nonsubject 8 0 0 0 4 5 3 0 6 8 4 2 Canada vs. Japan 8 1 1 0 4 6 7 1 6 3 6 1 Canada vs. Turkey 9 0 0 0 3 4 3 1 4 4 7 0 Canada vs. other nonsubject 8 1 1 0 3 5 3 1 4 3 3 1 Japan vs. Turkey 8 0 0 0 3 3 4 2 3 3 5 1 Japan vs. other nonsubject 8 0 1 0 3 4 5 0 4 3 4 1 Turkey vs. other nonsubject 8 0 0 0 3 4 5 0 6 8 4 0
Note.-- A=Always, F=Frequently, S=Sometimes, N=Never.
Source: Compiled from data submitted in response to Commission questionnaires.
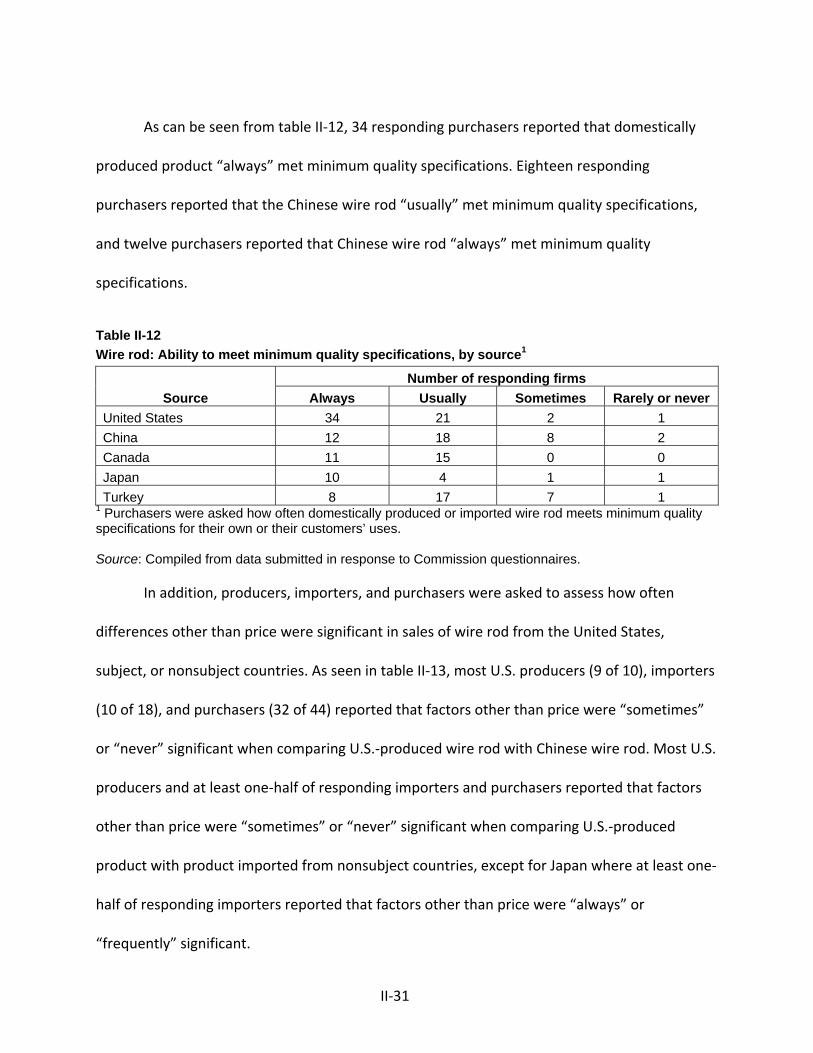
II‐31
As can be seen from table II‐12, 34 responding purchasers reported that domestically
produced product “always” met minimum quality specifications. Eighteen responding
purchasers reported that the Chinese wire rod “usually” met minimum quality specifications,
and twelve purchasers reported that Chinese wire rod “always” met minimum quality
specifications.
Table II-12 Wire rod: Ability to meet minimum quality specifications, by source1
Source Number of responding firms
Always Usually Sometimes Rarely or never United States 34 21 2 1 China 12 18 8 2 Canada 11 15 0 0 Japan 10 4 1 1 Turkey 8 17 7 1
1 Purchasers were asked how often domestically produced or imported wire rod meets minimum quality specifications for their own or their customers’ uses. Source: Compiled from data submitted in response to Commission questionnaires.
In addition, producers, importers, and purchasers were asked to assess how often
differences other than price were significant in sales of wire rod from the United States,
subject, or nonsubject countries. As seen in table II‐13, most U.S. producers (9 of 10), importers
(10 of 18), and purchasers (32 of 44) reported that factors other than price were “sometimes”
or “never” significant when comparing U.S.‐produced wire rod with Chinese wire rod. Most U.S.
producers and at least one‐half of responding importers and purchasers reported that factors
other than price were “sometimes” or “never” significant when comparing U.S.‐produced
product with product imported from nonsubject countries, except for Japan where at least one‐
half of responding importers reported that factors other than price were “always” or
“frequently” significant.
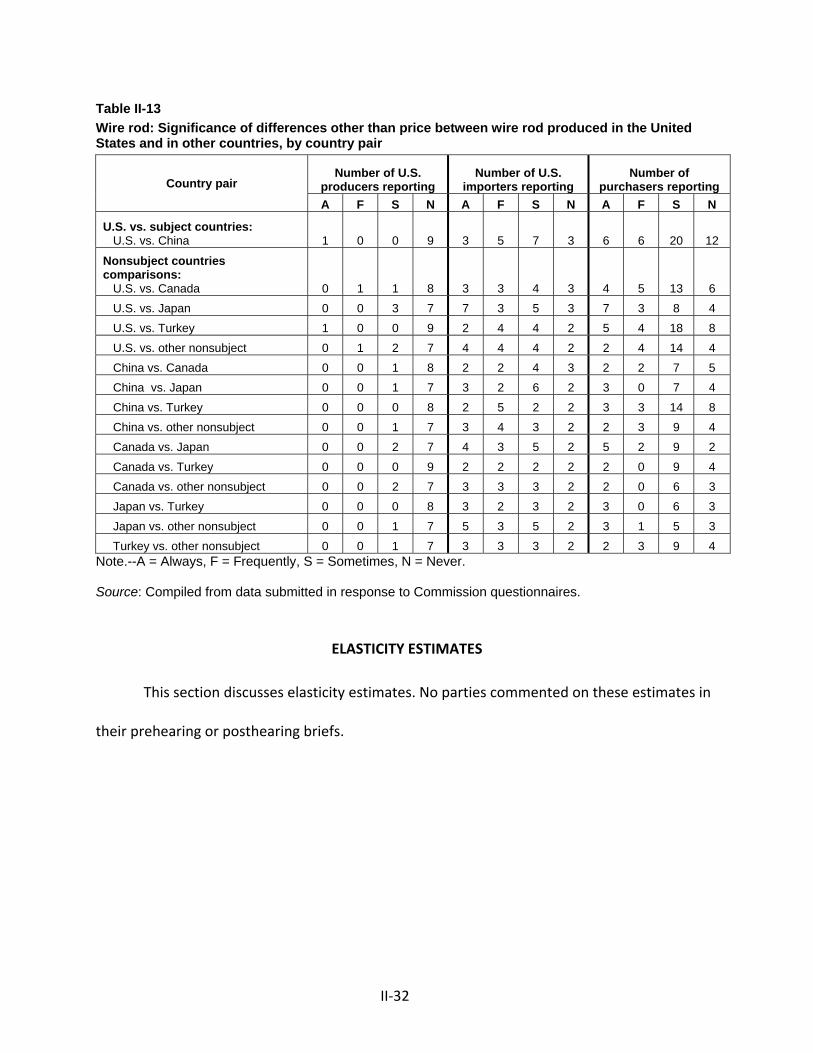
II‐32
Table II-13 Wire rod: Significance of differences other than price between wire rod produced in the United States and in other countries, by country pair
Country pair Number of U.S.
producers reporting Number of U.S.
importers reporting Number of
purchasers reporting A F S N A F S N A F S N
U.S. vs. subject countries: U.S. vs. China 1 0 0 9 3 5 7 3 6 6 20 12
Nonsubject countries comparisons: U.S. vs. Canada 0 1 1 8 3 3 4 3 4 5 13 6 U.S. vs. Japan 0 0 3 7 7 3 5 3 7 3 8 4 U.S. vs. Turkey 1 0 0 9 2 4 4 2 5 4 18 8 U.S. vs. other nonsubject 0 1 2 7 4 4 4 2 2 4 14 4 China vs. Canada 0 0 1 8 2 2 4 3 2 2 7 5 China vs. Japan 0 0 1 7 3 2 6 2 3 0 7 4 China vs. Turkey 0 0 0 8 2 5 2 2 3 3 14 8 China vs. other nonsubject 0 0 1 7 3 4 3 2 2 3 9 4 Canada vs. Japan 0 0 2 7 4 3 5 2 5 2 9 2 Canada vs. Turkey 0 0 0 9 2 2 2 2 2 0 9 4 Canada vs. other nonsubject 0 0 2 7 3 3 3 2 2 0 6 3 Japan vs. Turkey 0 0 0 8 3 2 3 2 3 0 6 3 Japan vs. other nonsubject 0 0 1 7 5 3 5 2 3 1 5 3 Turkey vs. other nonsubject 0 0 1 7 3 3 3 2 2 3 9 4
Note.--A = Always, F = Frequently, S = Sometimes, N = Never. Source: Compiled from data submitted in response to Commission questionnaires.
ELASTICITY ESTIMATES
This section discusses elasticity estimates. No parties commented on these estimates in
their prehearing or posthearing briefs.
II‐33
U.S. supply elasticity
The domestic supply elasticity47 for wire rod measures the sensitivity of the quantity
supplied by U.S. producers to changes in the U.S. market price of wire rod. The elasticity of
domestic supply depends on several factors including the level of excess capacity, the ease with
which producers can alter capacity, producers’ ability to shift to production of other products,
the existence of inventories, and the availability of alternate markets for U.S.‐produced wire
rod. Analysis of these factors earlier indicates that the U.S. industry has the ability to slightly
increase or decrease shipments to the U.S. market; an estimate in the range of 1 to 3 is
suggested.
U.S. demand elasticity
The U.S. demand elasticity for wire rod measures the sensitivity of the overall quantity
demanded to a change in the U.S. market price of wire rod. This estimate depends on factors
discussed earlier such as the existence, availability, and commercial viability of substitute
products, as well as the component share of the wire rod in the production of any downstream
products. Based on the available information, the aggregate demand for wire rod is likely to be
moderately elastic; a range of ‐0.5 to ‐0.75 is suggested.
47 A supply function is not defined in the case of a non‐competitive market.
II‐34
Substitution elasticity
The elasticity of substitution depends upon the extent of product differentiation
between the domestic and imported products.48 Product differentiation, in turn, depends upon
such factors as quality (e.g., chemistry, appearance, etc.) and conditions of sale (e.g.,
availability, sales terms/ discounts/ promotions, etc.). Based on available information, the
elasticity of substitution between U.S.‐produced wire rod and wire rod imported from China is
likely to be in the range of 3 to 5.
48 The substitution elasticity measures the responsiveness of the relative U.S. consumption levels of the subject imports and the domestic like products to changes in their relative prices. This reflects how easily purchasers switch from the U.S. product to the subject products (or vice versa) when prices change.
PART III: U.S. PRODUCERS’ PRODUCTION, SHIPMENTS, AND EMPLOYMENT
The Commission analyzes a number of factors in making injury determinations (see 19
U.S.C. §§ 1677(7)(B) and 1677(7)(C)). Information on the subsidies and dumping margins was
presented in Part I of this report and information on the volume and pricing of imports of the
subject merchandise is presented in Part IV and Part V. Information on the other factors
specified is presented in this section and/or Part VI and (except as noted) is based on the
questionnaire responses of ten firms that accounted for all U.S. production of wire rod during
2013.
U.S. PRODUCERS
The Commission issued a U.S. producer questionnaire to ten firms based on information
contained in the petition. In addition to the petitioners, U.S. producers include Cascade Steel
Rolling Mills Inc. (“Cascade”), Mid American Steel and Wire (“Mid American”), Republic Steel
(“Republic”), and Sterling. All ten firms provided questionnaire responses describing their
productive operations. Table III-1 lists U.S. producers of wire rod, their production locations,
positions on the petition, and shares of total production.
III-1
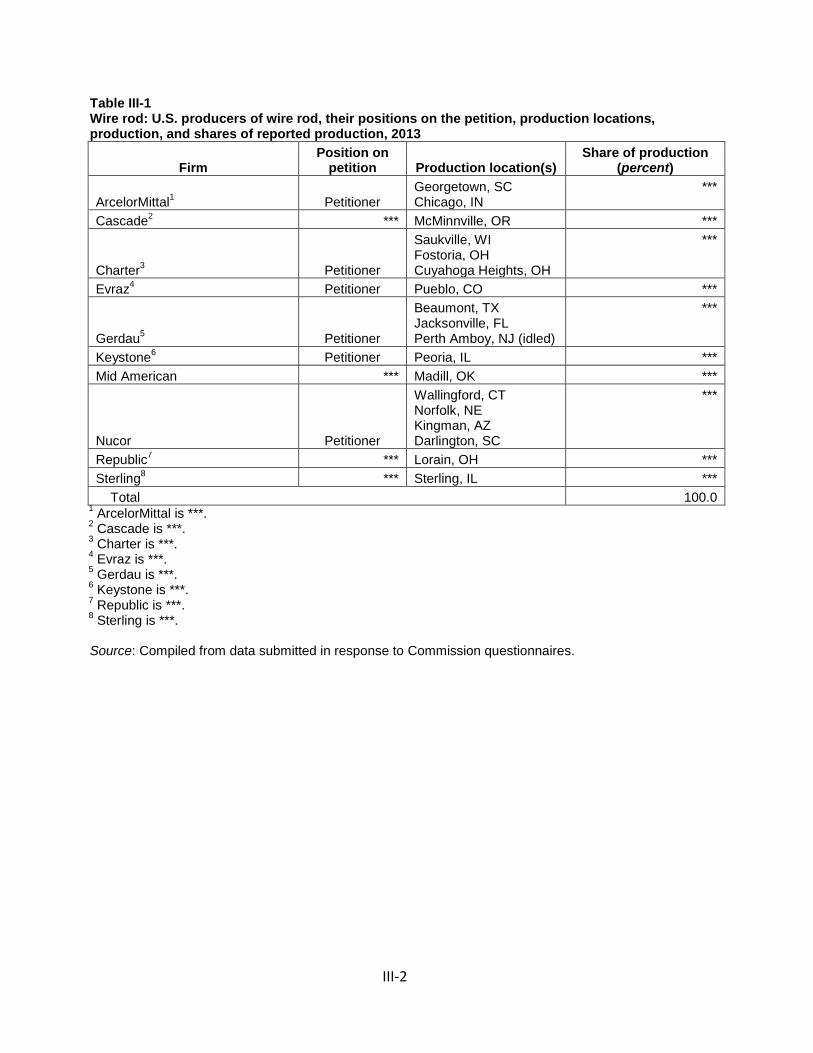
Table III-1 Wire rod: U.S. producers of wire rod, their positions on the petition, production locations, production, and shares of reported production, 2013
Firm Position on
petition Production location(s) Share of production
(percent)
ArcelorMittal1 Petitioner Georgetown, SC Chicago, IN
***
Cascade2 *** McMinnville, OR ***
Charter3 Petitioner
Saukville, WI Fostoria, OH Cuyahoga Heights, OH
***
Evraz4 Petitioner Pueblo, CO ***
Gerdau5 Petitioner
Beaumont, TX Jacksonville, FL Perth Amboy, NJ (idled)
***
Keystone6 Petitioner Peoria, IL *** Mid American *** Madill, OK ***
Nucor Petitioner
Wallingford, CT Norfolk, NE Kingman, AZ Darlington, SC
***
Republic7 *** Lorain, OH *** Sterling8 *** Sterling, IL *** Total 100.0
1 ArcelorMittal is ***. 2 Cascade is ***. 3 Charter is ***. 4 Evraz is ***. 5 Gerdau is ***. 6 Keystone is ***. 7 Republic is ***. 8 Sterling is ***.
Source: Compiled from data submitted in response to Commission questionnaires.
III-2
Charter Steel, Keystone, and Gerdau are the top domestic producers, accounting for ***
percent of total 2013 domestic production of wire rod. None of the U.S. producers reported
that they directly import or purchase the subject merchandise from U.S. importers.1 In addition,
all of the U.S. producers indicated in their questionnaire responses that they were not related
to any Chinese wire rod producers or to any U.S. importers of wire rod from China.
Producers were asked to report any changes in operations such as plant openings, plant
closings, relocations, expansions, acquisitions, consolidations, prolonged shutdowns or
production curtailments, or revised labor agreements since January 1, 2011. Table III-2 presents
selected information regarding the U.S. wire rod industry since 2011.
1 ***, purchased *** short tons of wire rod from China between 2011-13 and January-June 2014, which ***. These *** short tons are equivalent to *** percent of *** production in 2011-13 and January-June 2014. Its top five suppliers are ***.
III-3
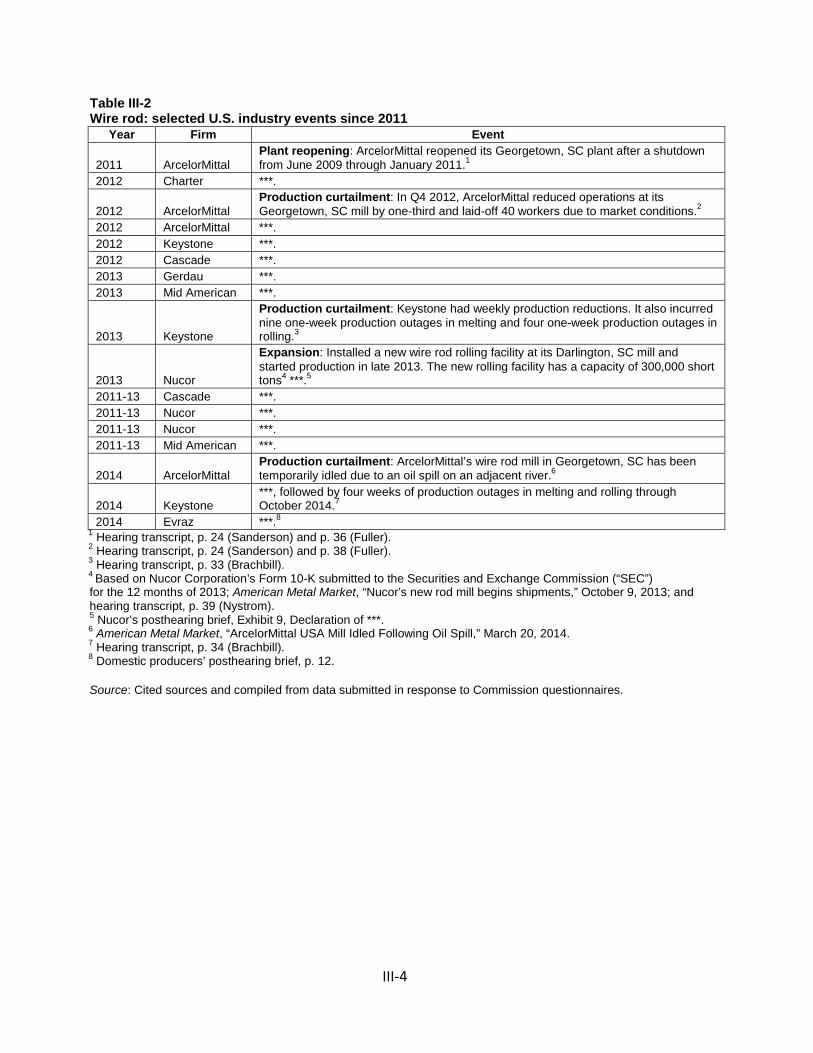
Table III-2 Wire rod: selected U.S. industry events since 2011
Year Firm Event
2011 ArcelorMittal Plant reopening: ArcelorMittal reopened its Georgetown, SC plant after a shutdown from June 2009 through January 2011.1
2012 Charter ***.
2012 ArcelorMittal Production curtailment: In Q4 2012, ArcelorMittal reduced operations at its Georgetown, SC mill by one-third and laid-off 40 workers due to market conditions.2
2012 ArcelorMittal ***. 2012 Keystone ***. 2012 Cascade ***. 2013 Gerdau ***. 2013 Mid American ***.
2013 Keystone
Production curtailment: Keystone had weekly production reductions. It also incurred nine one-week production outages in melting and four one-week production outages in rolling.3
2013 Nucor
Expansion: Installed a new wire rod rolling facility at its Darlington, SC mill and started production in late 2013. The new rolling facility has a capacity of 300,000 short tons4 ***.5
2011-13 Cascade ***. 2011-13 Nucor ***.
2011-13 Nucor ***.
2011-13 Mid American ***.
2014 ArcelorMittal Production curtailment: ArcelorMittal’s wire rod mill in Georgetown, SC has been temporarily idled due to an oil spill on an adjacent river.6
2014 Keystone ***, followed by four weeks of production outages in melting and rolling through October 2014.7
2014 Evraz ***.8 1 Hearing transcript, p. 24 (Sanderson) and p. 36 (Fuller). 2 Hearing transcript, p. 24 (Sanderson) and p. 38 (Fuller). 3 Hearing transcript, p. 33 (Brachbill). 4 Based on Nucor Corporation’s Form 10-K submitted to the Securities and Exchange Commission (“SEC”) for the 12 months of 2013; American Metal Market, “Nucor’s new rod mill begins shipments,” October 9, 2013; and hearing transcript, p. 39 (Nystrom). 5 Nucor’s posthearing brief, Exhibit 9, Declaration of ***. 6 American Metal Market, “ArcelorMittal USA Mill Idled Following Oil Spill,” March 20, 2014. 7 Hearing transcript, p. 34 (Brachbill). 8 Domestic producers’ posthearing brief, p. 12.
Source: Cited sources and compiled from data submitted in response to Commission questionnaires.
III-4
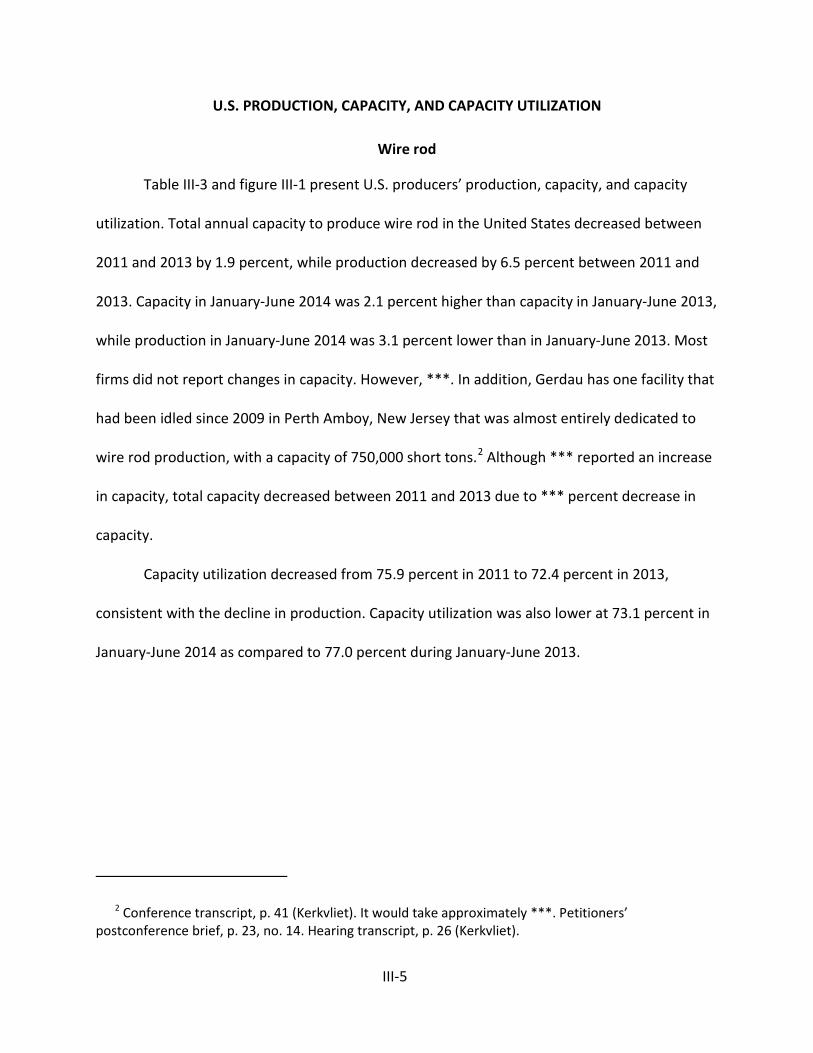
U.S. PRODUCTION, CAPACITY, AND CAPACITY UTILIZATION
Wire rod
Table III-3 and figure III-1 present U.S. producers’ production, capacity, and capacity
utilization. Total annual capacity to produce wire rod in the United States decreased between
2011 and 2013 by 1.9 percent, while production decreased by 6.5 percent between 2011 and
2013. Capacity in January-June 2014 was 2.1 percent higher than capacity in January-June 2013,
while production in January-June 2014 was 3.1 percent lower than in January-June 2013. Most
firms did not report changes in capacity. However, ***. In addition, Gerdau has one facility that
had been idled since 2009 in Perth Amboy, New Jersey that was almost entirely dedicated to
wire rod production, with a capacity of 750,000 short tons.2 Although *** reported an increase
in capacity, total capacity decreased between 2011 and 2013 due to *** percent decrease in
capacity.
Capacity utilization decreased from 75.9 percent in 2011 to 72.4 percent in 2013,
consistent with the decline in production. Capacity utilization was also lower at 73.1 percent in
January-June 2014 as compared to 77.0 percent during January-June 2013.
2 Conference transcript, p. 41 (Kerkvliet). It would take approximately ***. Petitioners’ postconference brief, p. 23, no. 14. Hearing transcript, p. 26 (Kerkvliet).
III-5
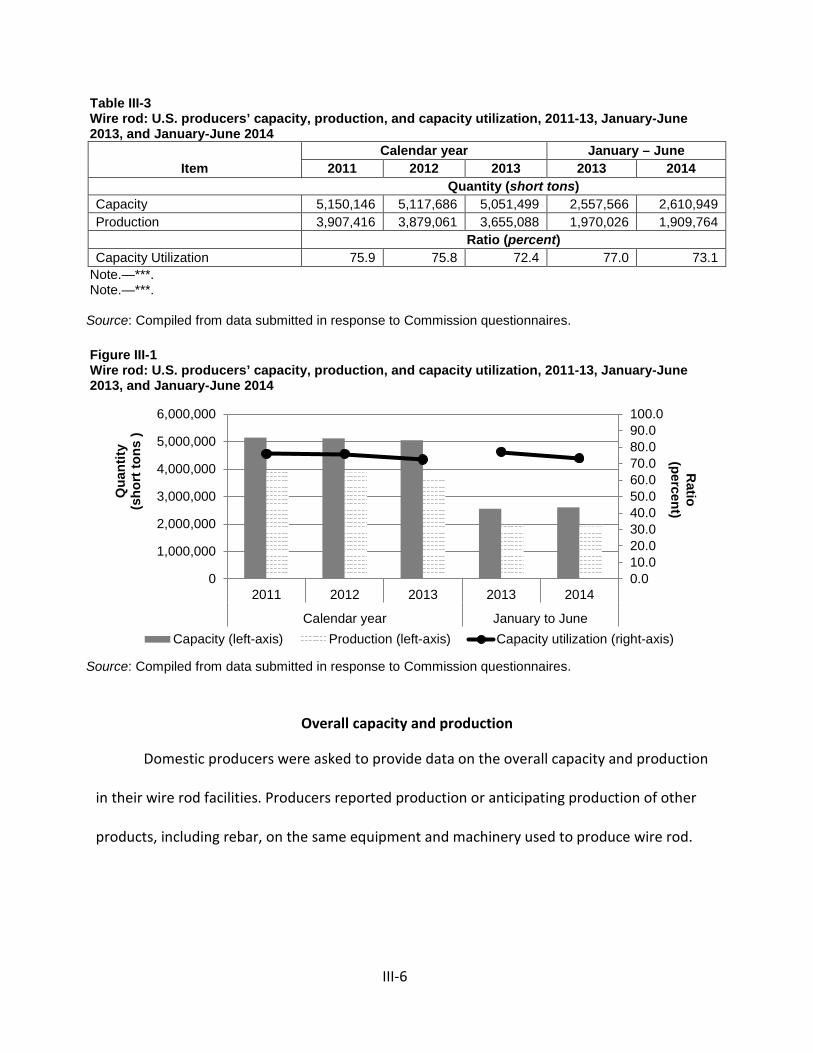
Table III-3 Wire rod: U.S. producers’ capacity, production, and capacity utilization, 2011-13, January-June 2013, and January-June 2014
Item Calendar year January – June
2011 2012 2013 2013 2014 Quantity (short tons) Capacity 5,150,146 5,117,686 5,051,499 2,557,566 2,610,949 Production 3,907,416 3,879,061 3,655,088 1,970,026 1,909,764 Ratio (percent) Capacity Utilization 75.9 75.8 72.4 77.0 73.1
Note.—***. Note.—***.
Source: Compiled from data submitted in response to Commission questionnaires.
Figure III-1 Wire rod: U.S. producers’ capacity, production, and capacity utilization, 2011-13, January-June 2013, and January-June 2014
Source: Compiled from data submitted in response to Commission questionnaires.
Overall capacity and production
Domestic producers were asked to provide data on the overall capacity and production
in their wire rod facilities. Producers reported production or anticipating production of other
products, including rebar, on the same equipment and machinery used to produce wire rod.
0.010.020.030.040.050.060.070.080.090.0100.0
0
1,000,000
2,000,000
3,000,000
4,000,000
5,000,000
6,000,000
2011 2012 2013 2013 2014
Calendar year January to June
Ratio
(percent) Q
uant
ity
(sho
rt to
ns )
Capacity (left-axis) Production (left-axis) Capacity utilization (right-axis)
III-6
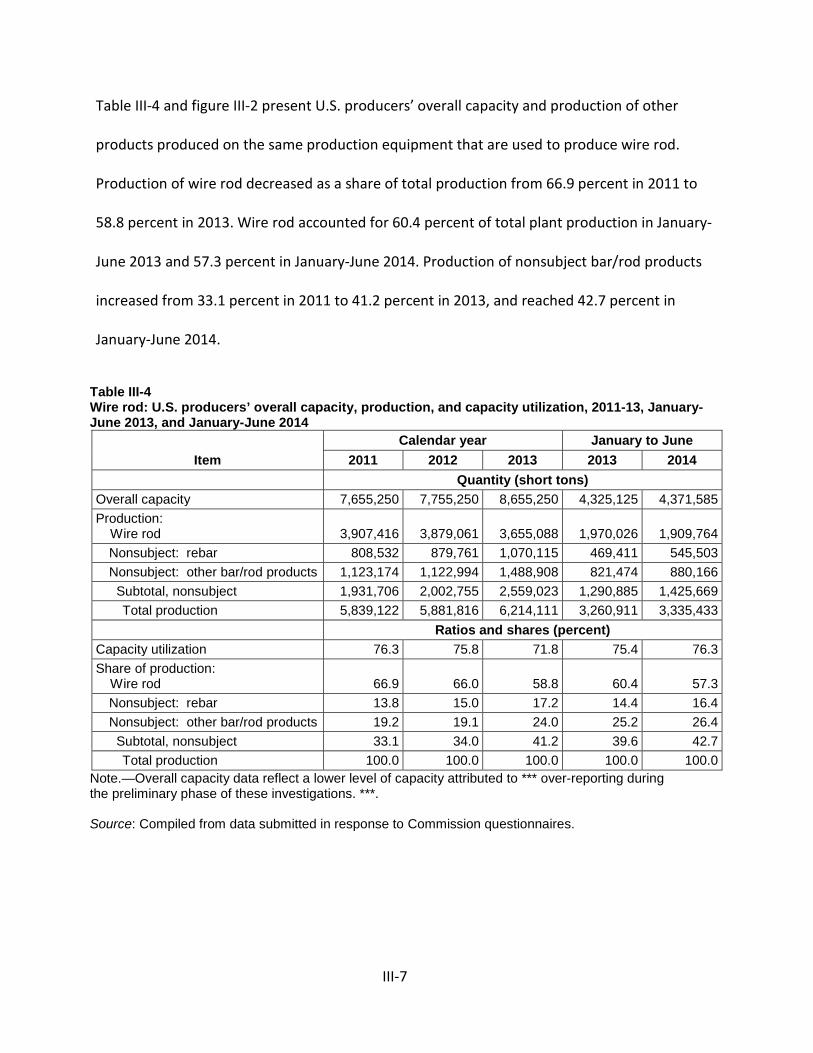
Table III-4 and figure III-2 present U.S. producers’ overall capacity and production of other
products produced on the same production equipment that are used to produce wire rod.
Production of wire rod decreased as a share of total production from 66.9 percent in 2011 to
58.8 percent in 2013. Wire rod accounted for 60.4 percent of total plant production in January-
June 2013 and 57.3 percent in January-June 2014. Production of nonsubject bar/rod products
increased from 33.1 percent in 2011 to 41.2 percent in 2013, and reached 42.7 percent in
January-June 2014.
Table III-4 Wire rod: U.S. producers’ overall capacity, production, and capacity utilization, 2011-13, January- June 2013, and January-June 2014
Item Calendar year January to June
2011 2012 2013 2013 2014 Quantity (short tons) Overall capacity 7,655,250 7,755,250 8,655,250 4,325,125 4,371,585 Production: Wire rod 3,907,416 3,879,061 3,655,088 1,970,026 1,909,764
Nonsubject: rebar 808,532 879,761 1,070,115 469,411 545,503 Nonsubject: other bar/rod products 1,123,174 1,122,994 1,488,908 821,474 880,166 Subtotal, nonsubject 1,931,706 2,002,755 2,559,023 1,290,885 1,425,669
Total production 5,839,122 5,881,816 6,214,111 3,260,911 3,335,433 Ratios and shares (percent) Capacity utilization 76.3 75.8 71.8 75.4 76.3 Share of production: Wire rod 66.9 66.0 58.8 60.4 57.3
Nonsubject: rebar 13.8 15.0 17.2 14.4 16.4 Nonsubject: other bar/rod products 19.2 19.1 24.0 25.2 26.4 Subtotal, nonsubject 33.1 34.0 41.2 39.6 42.7
Total production 100.0 100.0 100.0 100.0 100.0 Note.—Overall capacity data reflect a lower level of capacity attributed to *** over-reporting during the preliminary phase of these investigations. ***.
Source: Compiled from data submitted in response to Commission questionnaires.
III-7
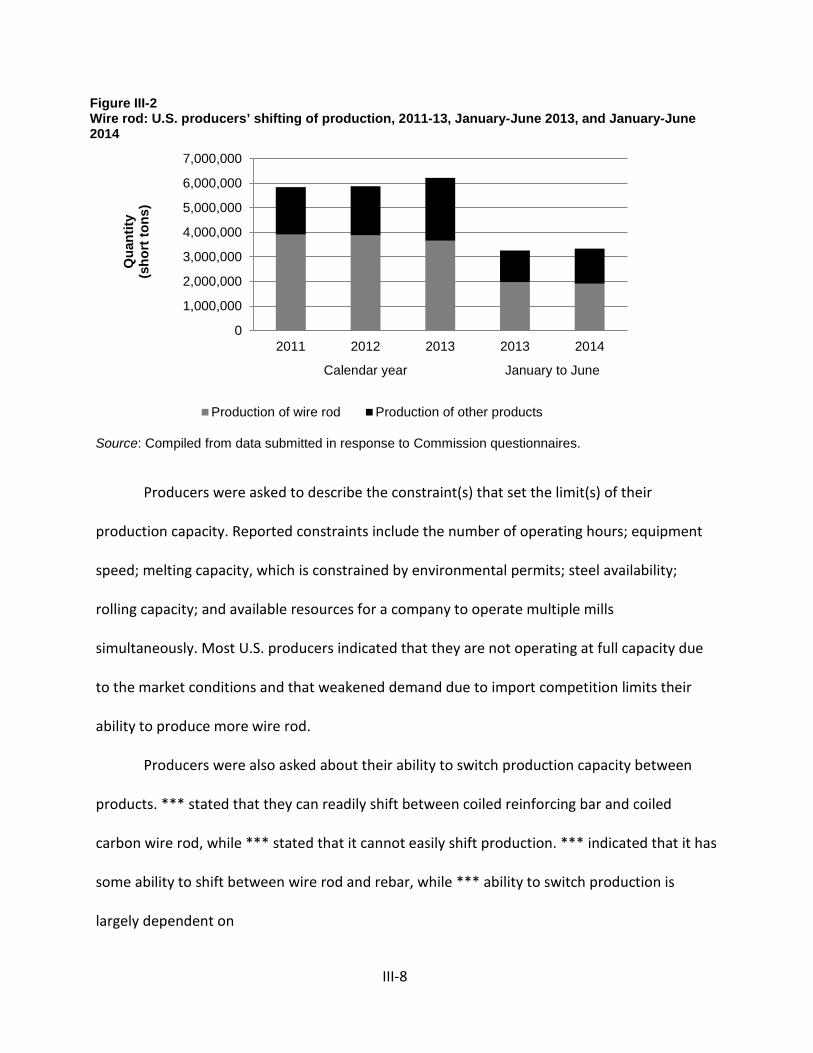
Figure III-2 Wire rod: U.S. producers’ shifting of production, 2011-13, January-June 2013, and January-June 2014
Source: Compiled from data submitted in response to Commission questionnaires.
Producers were asked to describe the constraint(s) that set the limit(s) of their
production capacity. Reported constraints include the number of operating hours; equipment
speed; melting capacity, which is constrained by environmental permits; steel availability;
rolling capacity; and available resources for a company to operate multiple mills
simultaneously. Most U.S. producers indicated that they are not operating at full capacity due
to the market conditions and that weakened demand due to import competition limits their
ability to produce more wire rod.
Producers were also asked about their ability to switch production capacity between
products. *** stated that they can readily shift between coiled reinforcing bar and coiled
carbon wire rod, while *** stated that it cannot easily shift production. *** indicated that it has
some ability to shift between wire rod and rebar, while *** ability to switch production is
largely dependent on
0
1,000,000
2,000,000
3,000,000
4,000,000
5,000,000
6,000,000
7,000,000
2011 2012 2013 2013 2014
Calendar year January to June
Qua
ntity
(s
hort
tons
)
Production of wire rod Production of other products
III-8
customer demand for those products. In addition, *** noted its ability to switch sizes within
rolling mills has the greatest influence on its ability to shift production capacity between
products.
U.S. PRODUCERS’ U.S. SHIPMENTS AND EXPORTS
Table III-5 presents U.S. producers’ U.S. shipments, export shipments, and total
shipments. The quantity of U.S. producers’ commercial U.S. shipments decreased by 11.9
percent in 2011 to 2013 and was 3.1 percent lower in January-June 2014 than in January-June
2013. Average unit values of commercial U.S. shipments decreased by 9.1 percent during 2011
to 2013, although they were 2.3 percent higher in January-June 2014 than in January-June
2014.
The quantity of U.S. producers’ U.S. shipments of wire rod decreased by 7.3 percent
from 2011 to 2013 and were 2.1 percent lower in January-June 2014 than in January-June 2013.
Average unit values of U.S. shipments decreased by 9.4 percent in 2011 to 2013, although they
were 1.9 percent higher in January-June 2014 than in January-June 2014.
The U.S. producers that export wire rod are ***. The quantity these firms’ exports of
wire rod declined by 29.9 percent from 2011 to 2013 although it was *** percent higher in
January-June 2014 than in January-June 2013. Average unit values of exports, which were
above the average unit values of U.S. commercial shipments in every period, increased by 41.8
percent in 2011 to 2012 and decreased by 21.4 percent in 2012 to 2013. Average unit values of
exports were *** percent lower in January-June 2014 relative to January-June 2013. These
firms’ reported exports to be less than one percent of total shipments during January 2011 to
June 2014, and U.S. producers contend that
III-9

is it difficult to compete in the export market due to lower priced products, particularly from
Chinese producers. The export markets of these firms include: ***.
Table III-5 Wire rod: U.S. producers’ U.S. shipments, exports shipments, and total shipments, 2011-13, January-June 2013, and January-June 2014
Item Calendar year January - June
2011 2012 2013 2013 2014 Quantity (short tons) Commercial U.S. shipments 2,944,416 2,815,566 2,595,200 1,362,641 1,319,807 Internal consumption *** *** *** *** *** Transfers to related firms *** *** *** *** *** Subtotal, U.S. shipments 3,876,145 3,809,727 3,599,459 1,892,301 1,850,061 Export shipments 34,687 26,748 24,319 *** *** Total shipments 3,910,832 3,836,475 3,623,778 *** *** Value (1,000 dollars) Commercial U.S. shipments 2,340,739 2,143,895 1,875,625 992,739 983,799 Internal consumption *** *** *** *** *** Transfers to related firms *** *** *** *** *** Subtotal, U.S. shipments 3,012,124 2,827,033 2,529,516 1,345,663 1,341,255 Export shipments 28,888 31,597 22,566 *** *** Total shipments 3,041,012 2,858,630 2,552,082 *** *** Unit value (dollars per short ton) Commercial U.S. shipments 795 761 723 729 745 Internal consumption *** *** *** *** *** Transfers to related firms *** *** *** *** *** Subtotal, U.S. shipments 777 742 703 711 725 Export shipments 833 1,181 928 *** *** Total shipments 778 745 704 *** *** Share of quantity (percent) Commercial U.S. shipments 75.3 73.4 71.6 *** *** Internal consumption *** *** *** *** *** Transfers to related firms *** *** *** *** *** Subtotal, U.S. shipments 99.1 99.3 99.3 *** *** Export shipments 0.9 0.7 0.7 *** *** Total shipments 100.0 100.0 100.0 100.0 100.0 Share of value (percent) Commercial U.S. shipments 77.0 75.0 73.5 *** *** Internal consumption *** *** *** *** *** Transfers to related firms *** *** *** *** *** Subtotal, U.S. shipments 99.1 98.9 99.1 *** *** Export shipments 0.9 1.1 0.9 *** *** Total shipments 100.0 100.0 100.0 100.0 100.0
Source: Compiled from data submitted in response to Commission questionnaires.
III-10
U.S. shipments by application
Table III-6 presents U.S. producers’ U.S. shipments by type of wire rod in 2013. Most
U.S. producers reported U.S. shipments of both high/medium-high carbon industrial/standard
and low/medium-low carbon industrial/standard quality wire rod. Evraz produces low carbon
mesh and industrial grade wire rod although its product mix is heavily weighted toward high
and medium carbon steels. Evraz also produces medium carbon grades of wire rod for the
furniture and bedding spring rod business, high carbon rod to make PC strand, rubber re-
enforcement and wire row, and welding quality wire rod.3 ArcelorMittal makes a wide variety
of wire rod grades including low, medium, high carbon, tire cord, tire bead, and welding wire
rod.4 Charter ***. Gerdau produces wire rod types ranging from low to high carbon wire rod,
welding wire rod, cold-heading quality wire rod, and many other special types of wire rod as
well.5
3 Hearing transcript, pp. 42-43 (Ashby). 4 Conference transcript, p. 22 (Fuller). 5 Conference transcript, p. 12 (Kerkvliet).
III-11

Table III-6 Wire rod: U.S. producers’ U.S. shipments, by type, 2013
Item
2013
Commercial Internal
Consumption
Transfers to related
firms U.S. shipments
Quantity (short tons) Number of firms
Low/medium-low carbon industrial/standard quality 1,139,810 *** *** 1,768,914 *** High/medium-high carbon industrial/standard quality 685,787 *** *** 1,002,824 *** Tire cord quality and tire bead quality *** *** *** *** *** Welding quality *** *** *** *** *** Cold heading quality (CHQ) *** *** *** *** *** Other specialty carbon and alloy quality *** *** *** *** *** All other wire rod *** *** *** *** ***
Total U.S. shipments 2,595,141 *** *** 3,599,400 *** Share of quantity (percent down)
Low/medium-low carbon industrial/standard quality 43.9 *** *** 49.1 High/medium-high carbon industrial/standard quality 26.4 *** *** 27.9
Tire cord quality and tire bead quality *** *** *** *** Welding quality *** *** *** *** Cold heading quality (CHQ) *** *** *** *** Other specialty carbon and alloy quality *** *** *** *** All other wire rod *** *** *** ***
Total U.S. shipments 100.0 100.0 100.0 100.0
Share of quantity (percent across) Low/medium-low carbon industrial/standard quality 64.4 *** *** 100.0 High/medium-high carbon industrial/standard quality 68.4 *** *** 100.0
Tire cord quality and tire bead quality *** *** *** 100.0
Welding quality *** *** *** 100.0
Cold heading quality (CHQ) *** *** *** 100.0
Other specialty carbon and alloy quality *** *** *** 100.0
All other wire rod *** *** *** 100.0
Total U.S. shipments 72.1 *** *** 100.0 Source: Compiled from data submitted in response to Commission questionnaires.
III-12
U.S. producers were asked to describe the qualitative differences among the different
types of wire rod. Three firms said there were no or little differences. Other firms noted that
wire rod is on a continuum of grades, qualities, chemistry variances, tensile range, and end
uses, and that these qualitative differences between each type related to charge design and
scrap cost to create a higher carbon product. Difference types have various applications,
ranging from mesh to spring wire and automotive. One firm stated that some overlap occurs
especially if higher quality materials are used in a lower quality application. For example, cold
heading quality could be used in some industrial quality applications, or welding wire could be
used in industrial quality applications. Another firm stated that cold heading quality, other
special carbon and alloy, and tire cord are the highest quality wire rod. Furthermore, *** U.S.
producers produce cold heading quality (CHQ) wire rod. U.S. producers indicate that this is a
niche market in the United States, which has not seen imports during 2011 to 2013.6
6 Conference transcript, p. 78 (Cannon).
III-13
CAPTIVE CONSUMPTION
Section 771(7)(C)(iv) of the Act states that–
If domestic producers internally transfer significant production of the domestic like product for the production of a downstream article and sell significant production of the domestic like product in the merchant market, and the Commission finds that–
(I) the domestic like product produced that is internally transferred
for processing into that downstream article does not enter the merchant market for the domestic like product,
(II) the domestic like product is the predominant material input in the
production of that downstream article, and
(III the production of the domestic like product sold in the merchant market is not generally used in the production of that downstream article,
then the Commission, in determining market share and the factors affecting financial performance . . ., shall focus primarily on the merchant market for the domestic like product.
Transfers and sale of significant production of the domestic like product
As reported in table III-5 above, internal consumption accounted for between *** and
*** percent of U.S. producers’ U.S. shipments of wire rod; transfers to related firms accounted
for between *** and *** percent.7 Seven firms, ***,
7 ***.
III-14
reported internally consuming or transferring wire rod to a related firm to produce a
downstream product. Six of these firms priced transfers to related parties at market value,
while *** priced transfers using a ***. Commercial U.S. shipments accounted for between ***
and *** percent of U.S. shipments and, in contrast to internal consumption and transfers to
related, declined from 2011 to 2013.
Domestic producers contend that the Commission should consider the significant level
of internal transfers to comprise a relevant condition of competition and should examine both
the total industry and the merchant market sector in assessing the impact of wire rod imports
from China.8
First statutory criterion in captive consumption
The first requirement for application of the captive consumption provision is that the
domestic like product that is internally transferred for processing into that downstream article
not enter the merchant market for the domestic like product. U.S. producers reported internal
consumption and company transfers of wire rod for the production of nails, garment hangers,
wire shelving, prestressed concrete strand, oil tempered and other high carbon wire, drawn
wire (including tire bead, high carbon and fine wire quality), cold finished bars, cold headed
parts, mesh, agricultural fencing, armoring wire, galvanized wire, concrete reinforcing mesh,
8 Domestic producers’ prehearing brief, p. 11.
III-15
and bed spring components. One U.S. producer (***), however, reported diverting ***9 of wire
rod intended for internal consumption to the merchant market for the production of ***.
Second statutory criterion in captive consumption
The second criterion of the captive consumption provision concerns whether the
domestic like product is the predominant material input in the production of the downstream
article that is captively produced. According to questionnaire responses, with respect to the
downstream articles resulting from captive production, wire rod reportedly comprises 70-80
percent of the finished cost of mesh, industrial wire, welded wire reinforcement, drawn wire,
and fencing products. U.S. producers also reported producing other downstream articles
resulting from captive production, where wire rod comprised between 28 and 90 percent of the
finished product.
Third statutory criterion in captive consumption
The third criterion of the captive consumption provision is that the production of the
domestic like product sold in the merchant market is not generally used in the production of
the downstream article. The share of U.S. producers’ captive shipments internally transferred
for processing into the same downstream wire products that their customers produce was 50.2
percent.10 The six producers11 reporting merchant sales of wire rod used by its customers to
9 This represents only *** percent of internal consumption and transfers to related firms in 2013. Such shipments in 2013 were ***.
10 Captive shipments totaled *** short tons in 2013. The following firms reported their shares as ***. Applying these shares, 2013 captive shipments that are produced into products that compete with U.S. producers’ customers totaled *** short tons.
III-16
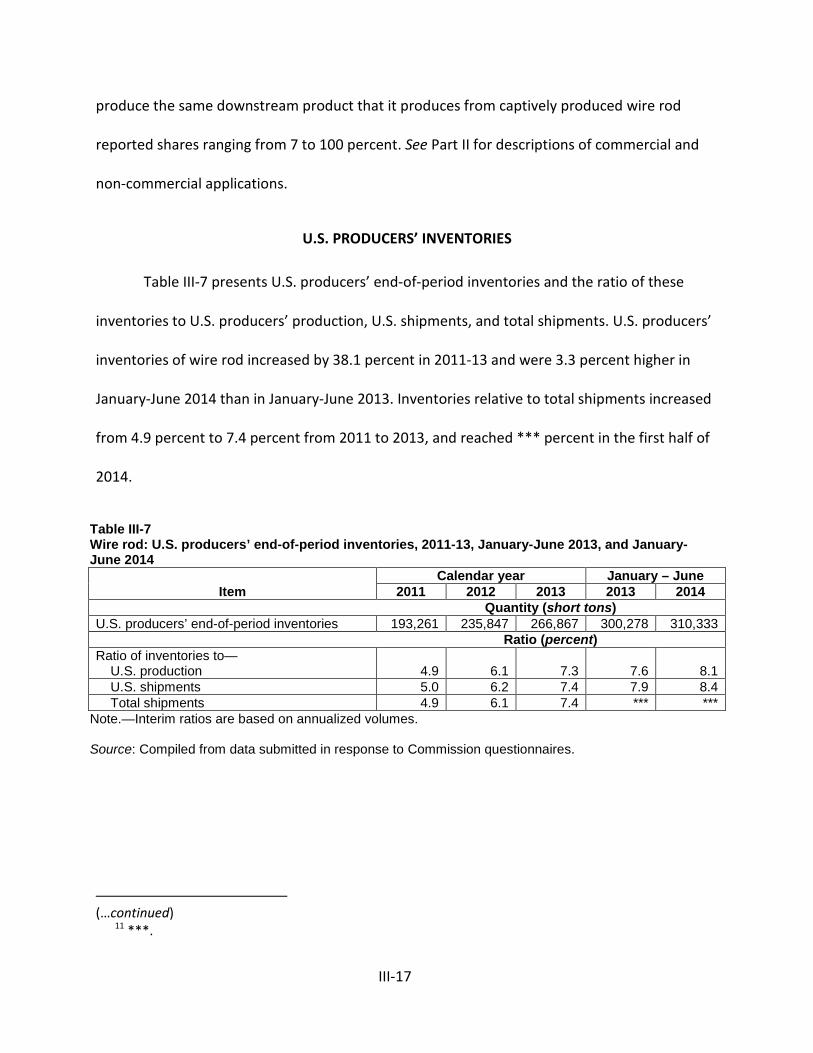
produce the same downstream product that it produces from captively produced wire rod
reported shares ranging from 7 to 100 percent. See Part II for descriptions of commercial and
non-commercial applications.
U.S. PRODUCERS’ INVENTORIES
Table III-7 presents U.S. producers’ end-of-period inventories and the ratio of these
inventories to U.S. producers’ production, U.S. shipments, and total shipments. U.S. producers’
inventories of wire rod increased by 38.1 percent in 2011-13 and were 3.3 percent higher in
January-June 2014 than in January-June 2013. Inventories relative to total shipments increased
from 4.9 percent to 7.4 percent from 2011 to 2013, and reached *** percent in the first half of
2014.
Table III-7 Wire rod: U.S. producers’ end-of-period inventories, 2011-13, January-June 2013, and January- June 2014
Item Calendar year January – June
2011 2012 2013 2013 2014 Quantity (short tons) U.S. producers’ end-of-period inventories 193,261 235,847 266,867 300,278 310,333 Ratio (percent) Ratio of inventories to— U.S. production 4.9 6.1 7.3 7.6 8.1 U.S. shipments 5.0 6.2 7.4 7.9 8.4 Total shipments 4.9 6.1 7.4 *** ***
Note.—Interim ratios are based on annualized volumes. Source: Compiled from data submitted in response to Commission questionnaires.
11 ***.
III-17
(…continued)
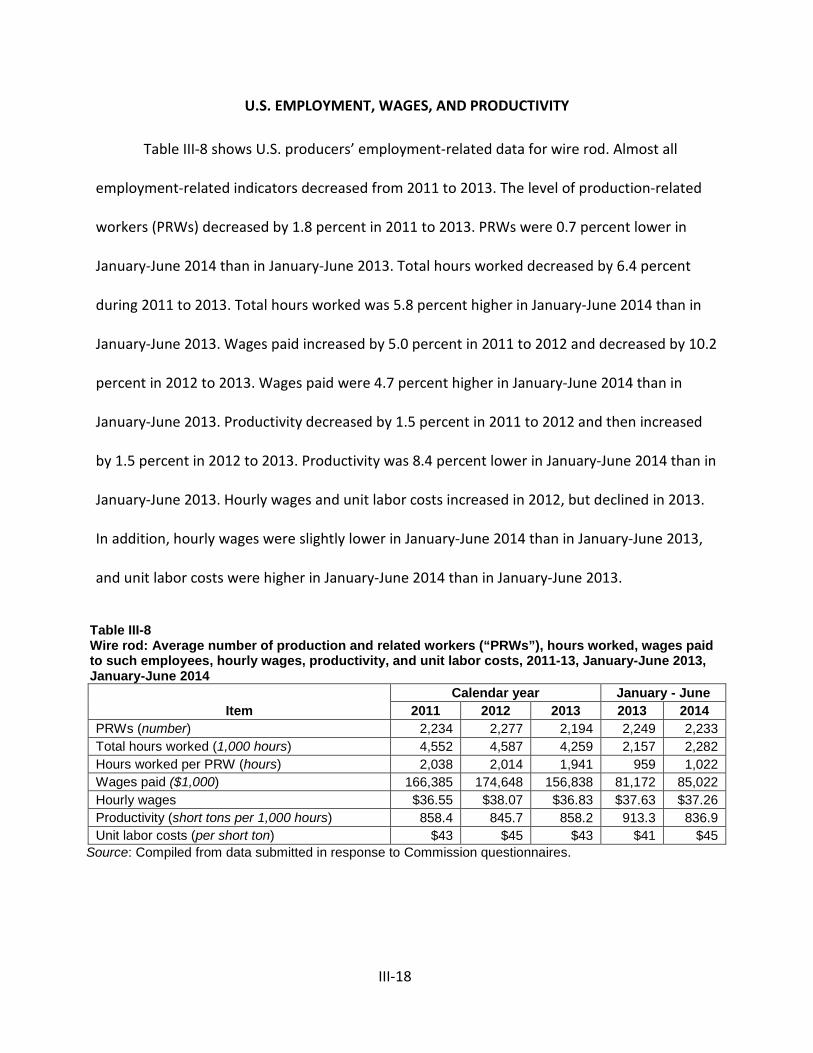
U.S. EMPLOYMENT, WAGES, AND PRODUCTIVITY
Table III-8 shows U.S. producers’ employment-related data for wire rod. Almost all
employment-related indicators decreased from 2011 to 2013. The level of production-related
workers (PRWs) decreased by 1.8 percent in 2011 to 2013. PRWs were 0.7 percent lower in
January-June 2014 than in January-June 2013. Total hours worked decreased by 6.4 percent
during 2011 to 2013. Total hours worked was 5.8 percent higher in January-June 2014 than in
January-June 2013. Wages paid increased by 5.0 percent in 2011 to 2012 and decreased by 10.2
percent in 2012 to 2013. Wages paid were 4.7 percent higher in January-June 2014 than in
January-June 2013. Productivity decreased by 1.5 percent in 2011 to 2012 and then increased
by 1.5 percent in 2012 to 2013. Productivity was 8.4 percent lower in January-June 2014 than in
January-June 2013. Hourly wages and unit labor costs increased in 2012, but declined in 2013.
In addition, hourly wages were slightly lower in January-June 2014 than in January-June 2013,
and unit labor costs were higher in January-June 2014 than in January-June 2013.
Table III-8 Wire rod: Average number of production and related workers (“PRWs”), hours worked, wages paid to such employees, hourly wages, productivity, and unit labor costs, 2011-13, January-June 2013, January-June 2014
Item Calendar year January - June
2011 2012 2013 2013 2014 PRWs (number) 2,234 2,277 2,194 2,249 2,233 Total hours worked (1,000 hours) 4,552 4,587 4,259 2,157 2,282 Hours worked per PRW (hours) 2,038 2,014 1,941 959 1,022 Wages paid ($1,000) 166,385 174,648 156,838 81,172 85,022 Hourly wages $36.55 $38.07 $36.83 $37.63 $37.26 Productivity (short tons per 1,000 hours) 858.4 845.7 858.2 913.3 836.9 Unit labor costs (per short ton) $43 $45 $43 $41 $45
Source: Compiled from data submitted in response to Commission questionnaires.
III-18
PART IV: U.S. IMPORTS, APPARENT U.S. CONSUMPTION, AND MARKET SHARES
U.S. IMPORTERS
The Commission issued importer questionnaires to 54 firms believed to be importers of
subject wire rod, as well as to all U.S. producers of wire rod.1 Usable questionnaire responses
were received from 30 companies. Responding companies reported imports of wire rod
representing virtually all U.S. imports from China and 83.5 percent of U.S. imports from
nonsubject sources in 2013 under the relevant HTS statistical reporting numbers.2 Table IV-1
lists all responding U.S. importers of wire rod from China and other sources, their locations, and
their shares of U.S. imports, during 2013.
1 The Commission issued questionnaires to those firms identified in the petition, along with firms that, based on a review of data ***, may have accounted for more than one percent of total imports under HTS subheadings 7213.91.3011, 7213.91.3015, 7213.91.3020, 7213.91.3093; 7213.91.4500, 7213.91.6000, 7213.99.0030, 7227.20.0030, 7227.20.0080, 7227.90.6010, 7227.90.6020, 7227.90.6030, 7227.90.6035, and 7227.90.6085 in 2011, 2012, 2013, or 2014.
2 Coverage was based on official statistics. The Commission received questionnaires from 14 importers of wire rod from China, including the top five importers, and from 26 importers of wire rod from nonsubject sources, including the top nonsubject importer from Canada (representing *** percent of total nonsubject imports in 2013, according to ***).
IV-1
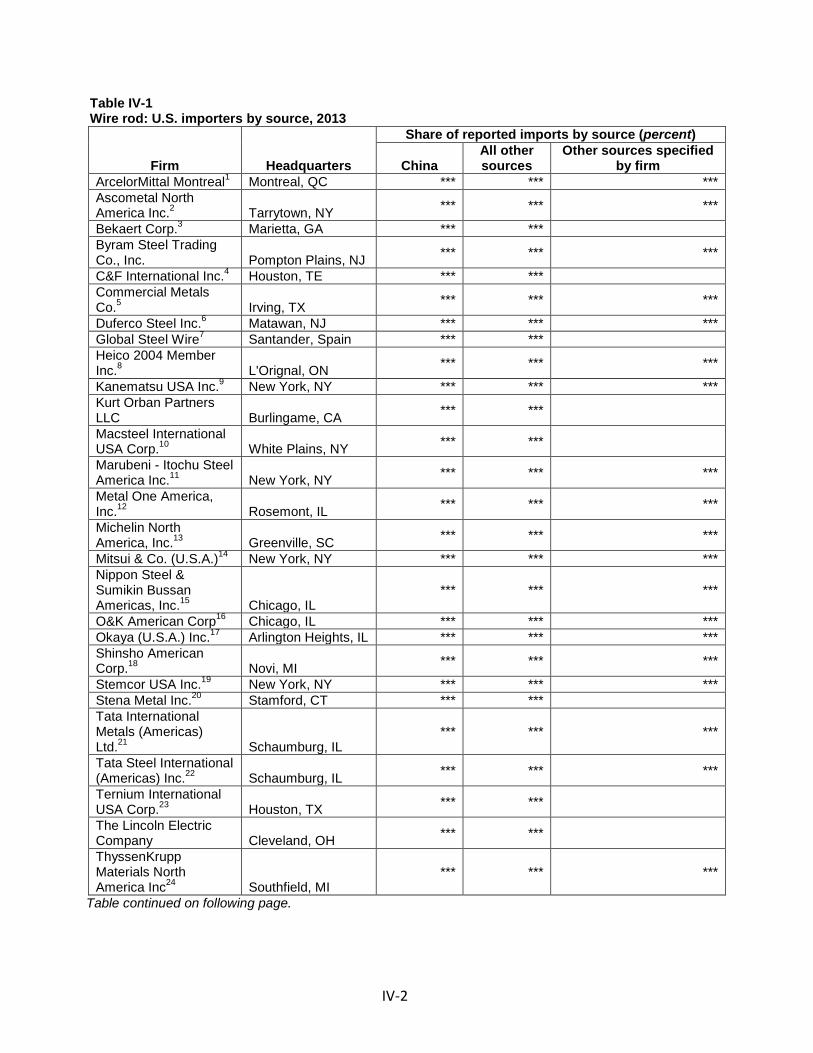
Table IV-1 Wire rod: U.S. importers by source, 2013
Firm Headquarters
Share of reported imports by source (percent)
China All other sources
Other sources specified by firm
ArcelorMittal Montreal1 Montreal, QC *** *** *** Ascometal North America Inc.2 Tarrytown, NY *** *** ***
Bekaert Corp.3 Marietta, GA *** *** Byram Steel Trading Co., Inc. Pompton Plains, NJ *** *** ***
C&F International Inc.4 Houston, TE *** *** Commercial Metals Co.5 Irving, TX *** *** ***
Duferco Steel Inc.6 Matawan, NJ *** *** *** Global Steel Wire7 Santander, Spain *** *** Heico 2004 Member Inc.8 L'Orignal, ON *** *** ***
Kanematsu USA Inc.9 New York, NY *** *** *** Kurt Orban Partners LLC Burlingame, CA *** *** Macsteel International USA Corp.10 White Plains, NY *** *** Marubeni - Itochu Steel America Inc.11 New York, NY *** *** ***
Metal One America, Inc.12 Rosemont, IL *** *** ***
Michelin North America, Inc.13 Greenville, SC *** *** ***
Mitsui & Co. (U.S.A.)14 New York, NY *** *** *** Nippon Steel & Sumikin Bussan Americas, Inc.15 Chicago, IL
*** *** ***
O&K American Corp16 Chicago, IL *** *** *** Okaya (U.S.A.) Inc.17 Arlington Heights, IL *** *** *** Shinsho American Corp.18 Novi, MI *** *** ***
Stemcor USA Inc.19 New York, NY *** *** *** Stena Metal Inc.20 Stamford, CT *** *** Tata International Metals (Americas) Ltd.21 Schaumburg, IL
*** *** ***
Tata Steel International (Americas) Inc.22 Schaumburg, IL *** *** ***
Ternium International USA Corp.23 Houston, TX *** *** The Lincoln Electric Company Cleveland, OH *** *** ThyssenKrupp Materials North America Inc24 Southfield, MI
*** *** ***
Table continued on following page.
IV-2
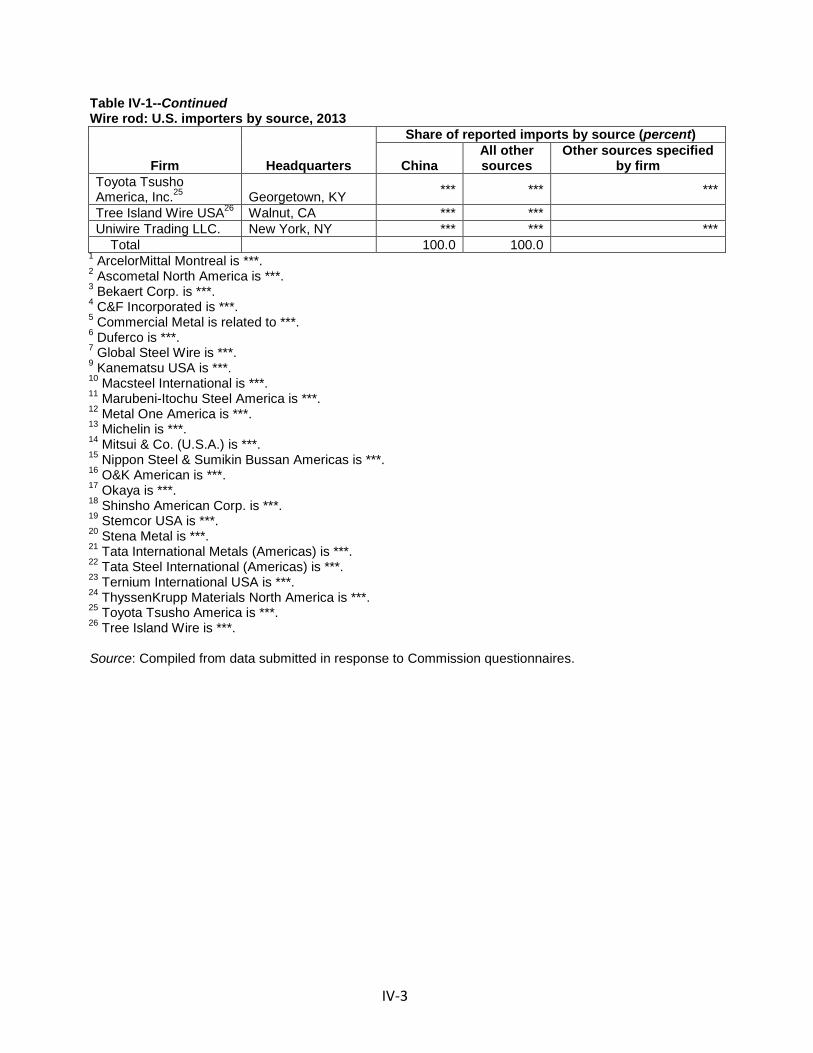
Table IV-1--Continued Wire rod: U.S. importers by source, 2013
Firm Headquarters
Share of reported imports by source (percent)
China All other sources
Other sources specified by firm
Toyota Tsusho America, Inc.25 Georgetown, KY *** *** ***
Tree Island Wire USA26 Walnut, CA *** *** Uniwire Trading LLC. New York, NY *** *** *** Total 100.0 100.0
1 ArcelorMittal Montreal is ***. 2 Ascometal North America is ***. 3 Bekaert Corp. is ***. 4 C&F Incorporated is ***. 5 Commercial Metal is related to ***. 6 Duferco is ***. 7 Global Steel Wire is ***. 9 Kanematsu USA is ***. 10 Macsteel International is ***. 11 Marubeni-Itochu Steel America is ***. 12 Metal One America is ***. 13 Michelin is ***. 14 Mitsui & Co. (U.S.A.) is ***. 15 Nippon Steel & Sumikin Bussan Americas is ***. 16 O&K American is ***. 17 Okaya is ***. 18 Shinsho American Corp. is ***. 19 Stemcor USA is ***. 20 Stena Metal is ***. 21 Tata International Metals (Americas) is ***. 22 Tata Steel International (Americas) is ***. 23 Ternium International USA is ***. 24 ThyssenKrupp Materials North America is ***. 25 Toyota Tsusho America is ***. 26 Tree Island Wire is ***.
Source: Compiled from data submitted in response to Commission questionnaires.
IV-3

U.S. IMPORTS
China
Table IV-2 presents data for U.S. imports of wire rod from China and all other sources.
U.S. import statistics are compiled from official import statistics based on fourteen HTS
statistical reporting numbers,3 which have been adjusted for ***.4 Imports of wire rod from
China increased from 144 short tons in 2011 to more than 600,000 short tons in 2013 and were
*** percent higher in January-June 2014 than in January-June 2013. Imports of wire rod from
nonsubject sources decreased by 13.1 percent between 2011 and 2013, but were 12.7 percent
higher in January-June 2014 than in January-June 2013. Total imports of wire rod increased by
36.2 percent in 2011 to 2013 and were *** percent higher in January-June 2014 than in
January-June 2013.5
Table IV-2 also presents data on the ratio of U.S. imports to U.S. production. Imports of
wire rod from China were equivalent to 16.9 percent of U.S. production in 2013, while they
were less than 0.05 percent in 2011. Imports of wire rod from nonsubject sources were
equivalent to 29.8 percent of U.S. production in 2013, a decrease of 2.3 percentage points from
2011. Total imports of wire rod were equivalent to 46.7 percent of U.S. production in 2013, an
increase of 14.7 percentage points since 2011.
3 7213.91.3011, 7213.91.3015, 7213.91.3020, 7213.91.3093, 7213.91.4500, 7213.91.6000, 7213.99.0030, 7227.20.0030, 7227.20.0080, 7227.90.6010, 7227.90.6020, 7227.90.6030 (starting in 2014), 7227.90.6035 (starting in 2014), and 7227.90.6085 (for the 2011-13 period).
4 ***. 5 Data were greater than unadjusted official statistics in every year. In 2011 and 2012, reported
imports from China were *** short tons and *** short tons greater than official import statistics in 2011 and 2012, respectively. In addition, reported imports from China were *** short tons and *** short tons greater than official import statistics in 2013 and January-June 2014, respectively.
IV-4
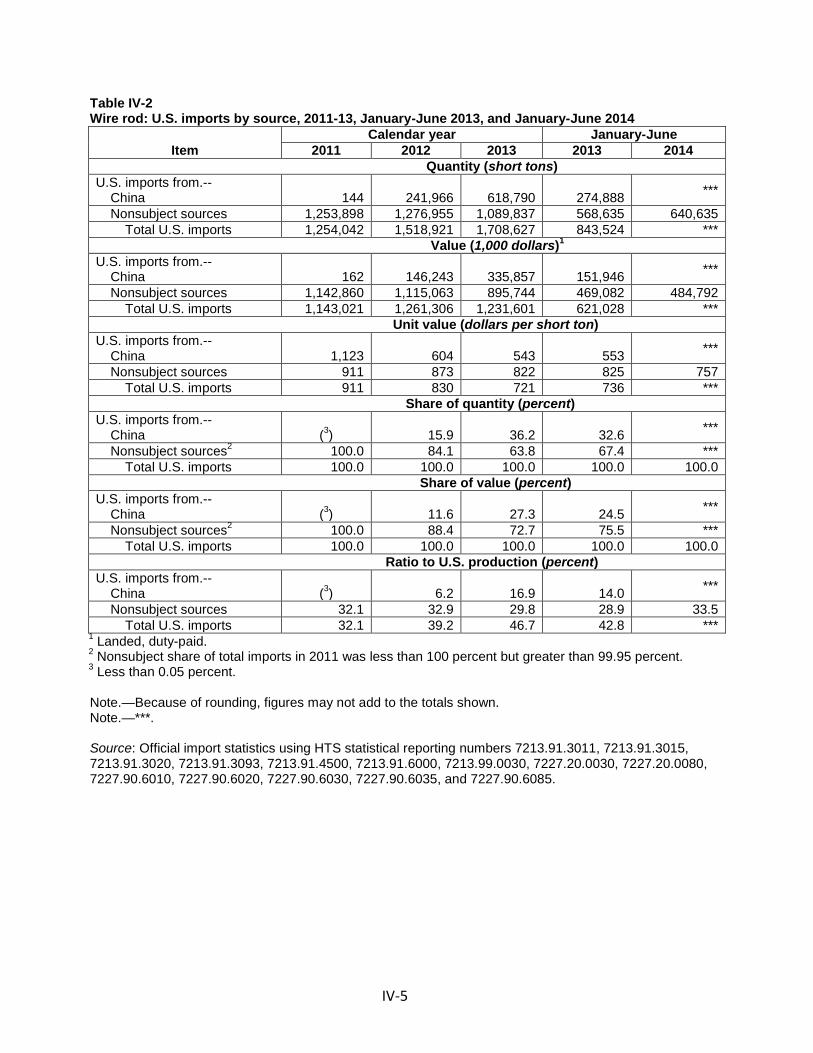
Table IV-2 Wire rod: U.S. imports by source, 2011-13, January-June 2013, and January-June 2014
Item Calendar year January-June
2011 2012 2013 2013 2014 Quantity (short tons)
U.S. imports from.-- China 144 241,966 618,790 274,888 ***
Nonsubject sources 1,253,898 1,276,955 1,089,837 568,635 640,635 Total U.S. imports 1,254,042 1,518,921 1,708,627 843,524 ***
Value (1,000 dollars)1 U.S. imports from.-- China 162 146,243 335,857 151,946 ***
Nonsubject sources 1,142,860 1,115,063 895,744 469,082 484,792 Total U.S. imports 1,143,021 1,261,306 1,231,601 621,028 ***
Unit value (dollars per short ton) U.S. imports from.-- China 1,123 604 543 553 ***
Nonsubject sources 911 873 822 825 757 Total U.S. imports 911 830 721 736 ***
Share of quantity (percent) U.S. imports from.-- China (3) 15.9 36.2 32.6 ***
Nonsubject sources2 100.0 84.1 63.8 67.4 *** Total U.S. imports 100.0 100.0 100.0 100.0 100.0
Share of value (percent) U.S. imports from.-- China (3) 11.6 27.3 24.5 ***
Nonsubject sources2 100.0 88.4 72.7 75.5 *** Total U.S. imports 100.0 100.0 100.0 100.0 100.0
Ratio to U.S. production (percent) U.S. imports from.-- China (3) 6.2 16.9 14.0 ***
Nonsubject sources 32.1 32.9 29.8 28.9 33.5 Total U.S. imports 32.1 39.2 46.7 42.8 ***
1 Landed, duty-paid. 2 Nonsubject share of total imports in 2011 was less than 100 percent but greater than 99.95 percent. 3 Less than 0.05 percent.
Note.—Because of rounding, figures may not add to the totals shown. Note.—***.
Source: Official import statistics using HTS statistical reporting numbers 7213.91.3011, 7213.91.3015, 7213.91.3020, 7213.91.3093, 7213.91.4500, 7213.91.6000, 7213.99.0030, 7227.20.0030, 7227.20.0080, 7227.90.6010, 7227.90.6020, 7227.90.6030, 7227.90.6035, and 7227.90.6085.
IV-5
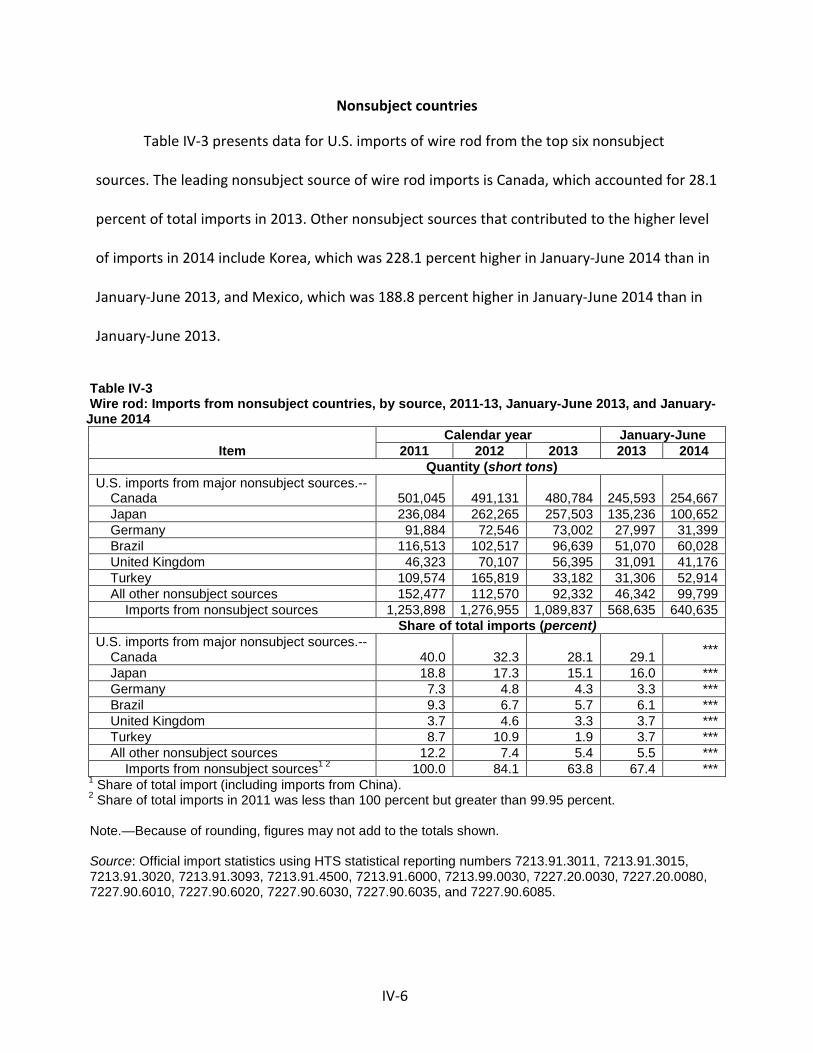
Nonsubject countries
Table IV-3 presents data for U.S. imports of wire rod from the top six nonsubject
sources. The leading nonsubject source of wire rod imports is Canada, which accounted for 28.1
percent of total imports in 2013. Other nonsubject sources that contributed to the higher level
of imports in 2014 include Korea, which was 228.1 percent higher in January-June 2014 than in
January-June 2013, and Mexico, which was 188.8 percent higher in January-June 2014 than in
January-June 2013.
Table IV-3 Wire rod: Imports from nonsubject countries, by source, 2011-13, January-June 2013, and January-June 2014
Item Calendar year January-June
2011 2012 2013 2013 2014 Quantity (short tons)
U.S. imports from major nonsubject sources.-- Canada 501,045 491,131 480,784 245,593 254,667 Japan 236,084 262,265 257,503 135,236 100,652 Germany 91,884 72,546 73,002 27,997 31,399 Brazil 116,513 102,517 96,639 51,070 60,028 United Kingdom 46,323 70,107 56,395 31,091 41,176 Turkey 109,574 165,819 33,182 31,306 52,914 All other nonsubject sources 152,477 112,570 92,332 46,342 99,799 Imports from nonsubject sources 1,253,898 1,276,955 1,089,837 568,635 640,635
Share of total imports (percent) U.S. imports from major nonsubject sources.-- Canada 40.0 32.3 28.1 29.1 ***
Japan 18.8 17.3 15.1 16.0 *** Germany 7.3 4.8 4.3 3.3 *** Brazil 9.3 6.7 5.7 6.1 *** United Kingdom 3.7 4.6 3.3 3.7 *** Turkey 8.7 10.9 1.9 3.7 *** All other nonsubject sources 12.2 7.4 5.4 5.5 *** Imports from nonsubject sources1 2 100.0 84.1 63.8 67.4 ***
1 Share of total import (including imports from China). 2 Share of total imports in 2011 was less than 100 percent but greater than 99.95 percent.
Note.—Because of rounding, figures may not add to the totals shown.
Source: Official import statistics using HTS statistical reporting numbers 7213.91.3011, 7213.91.3015, 7213.91.3020, 7213.91.3093, 7213.91.4500, 7213.91.6000, 7213.99.0030, 7227.20.0030, 7227.20.0080, 7227.90.6010, 7227.90.6020, 7227.90.6030, 7227.90.6035, and 7227.90.6085.
IV-6
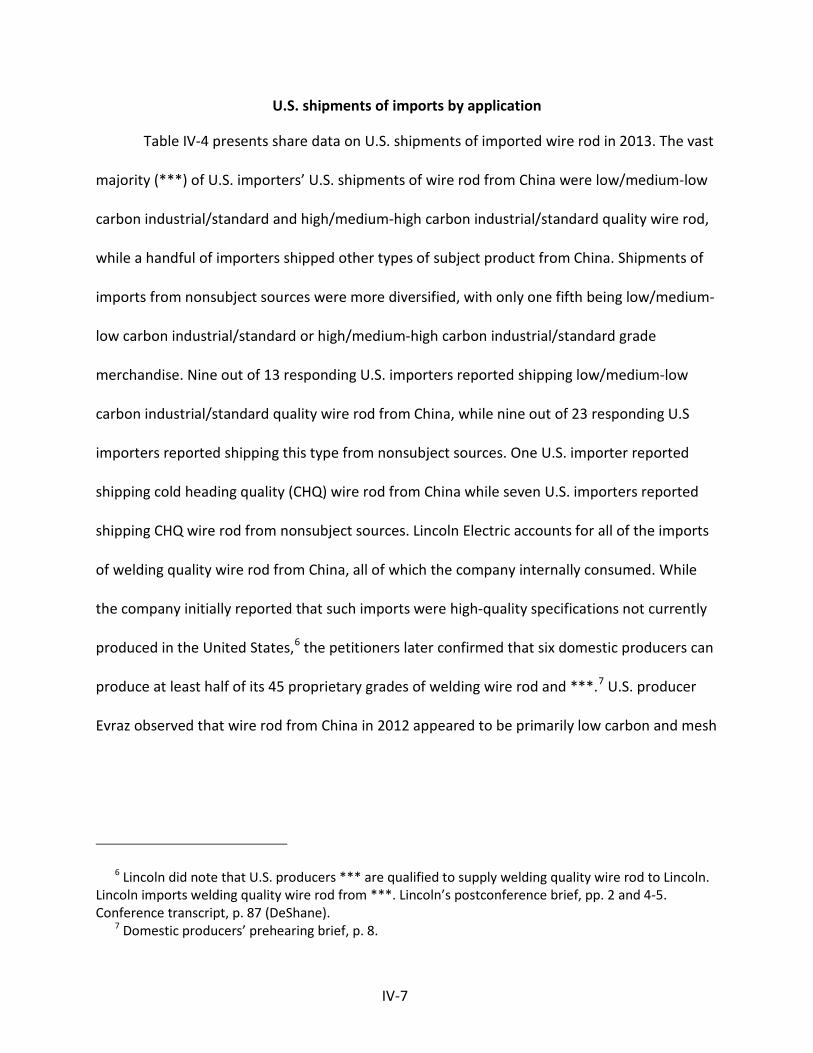
U.S. shipments of imports by application
Table IV-4 presents share data on U.S. shipments of imported wire rod in 2013. The vast
majority (***) of U.S. importers’ U.S. shipments of wire rod from China were low/medium-low
carbon industrial/standard and high/medium-high carbon industrial/standard quality wire rod,
while a handful of importers shipped other types of subject product from China. Shipments of
imports from nonsubject sources were more diversified, with only one fifth being low/medium-
low carbon industrial/standard or high/medium-high carbon industrial/standard grade
merchandise. Nine out of 13 responding U.S. importers reported shipping low/medium-low
carbon industrial/standard quality wire rod from China, while nine out of 23 responding U.S
importers reported shipping this type from nonsubject sources. One U.S. importer reported
shipping cold heading quality (CHQ) wire rod from China while seven U.S. importers reported
shipping CHQ wire rod from nonsubject sources. Lincoln Electric accounts for all of the imports
of welding quality wire rod from China, all of which the company internally consumed. While
the company initially reported that such imports were high-quality specifications not currently
produced in the United States,6 the petitioners later confirmed that six domestic producers can
produce at least half of its 45 proprietary grades of welding wire rod and ***.7 U.S. producer
Evraz observed that wire rod from China in 2012 appeared to be primarily low carbon and mesh
6 Lincoln did note that U.S. producers *** are qualified to supply welding quality wire rod to Lincoln. Lincoln imports welding quality wire rod from ***. Lincoln’s postconference brief, pp. 2 and 4-5. Conference transcript, p. 87 (DeShane).
7 Domestic producers’ prehearing brief, p. 8.
IV-7
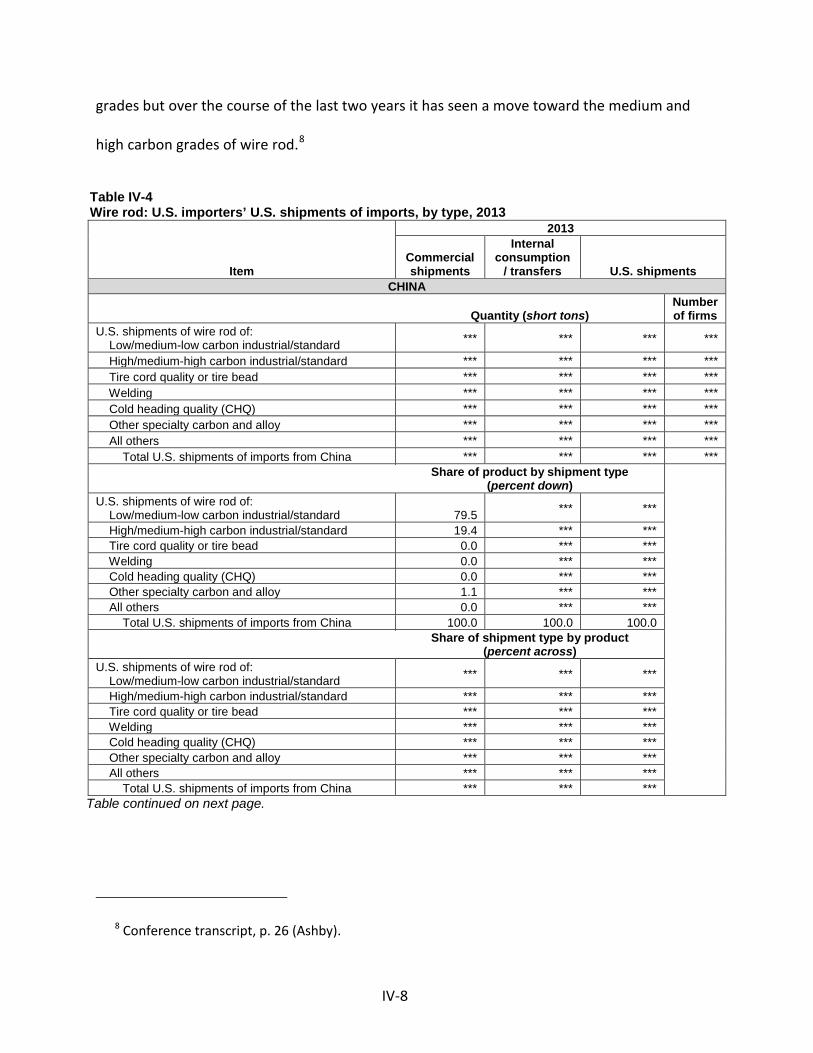
grades but over the course of the last two years it has seen a move toward the medium and
high carbon grades of wire rod.8
Table IV-4 Wire rod: U.S. importers’ U.S. shipments of imports, by type, 2013
Item
2013
Commercial shipments
Internal consumption
/ transfers U.S. shipments CHINA
Quantity (short tons) Number of firms
U.S. shipments of wire rod of: Low/medium-low carbon industrial/standard *** *** *** ***
High/medium-high carbon industrial/standard *** *** *** *** Tire cord quality or tire bead *** *** *** *** Welding *** *** *** *** Cold heading quality (CHQ) *** *** *** *** Other specialty carbon and alloy *** *** *** *** All others *** *** *** *** Total U.S. shipments of imports from China *** *** *** *** Share of product by shipment type
(percent down)
U.S. shipments of wire rod of: Low/medium-low carbon industrial/standard 79.5 *** ***
High/medium-high carbon industrial/standard 19.4 *** *** Tire cord quality or tire bead 0.0 *** *** Welding 0.0 *** *** Cold heading quality (CHQ) 0.0 *** *** Other specialty carbon and alloy 1.1 *** *** All others 0.0 *** *** Total U.S. shipments of imports from China 100.0 100.0 100.0 Share of shipment type by product
(percent across) U.S. shipments of wire rod of: Low/medium-low carbon industrial/standard *** *** ***
High/medium-high carbon industrial/standard *** *** *** Tire cord quality or tire bead *** *** *** Welding *** *** *** Cold heading quality (CHQ) *** *** *** Other specialty carbon and alloy *** *** *** All others *** *** *** Total U.S. shipments of imports from China *** *** ***
Table continued on next page.
8 Conference transcript, p. 26 (Ashby).
IV-8
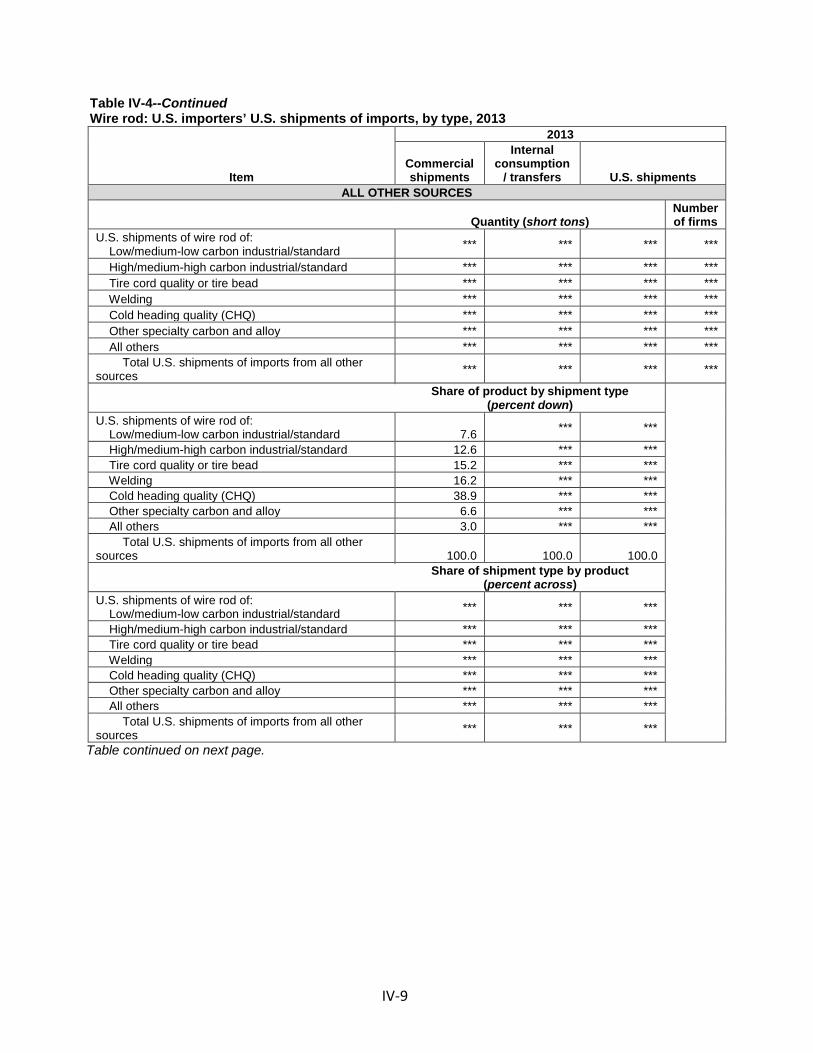
Table IV-4--Continued Wire rod: U.S. importers’ U.S. shipments of imports, by type, 2013
Item
2013
Commercial shipments
Internal consumption
/ transfers U.S. shipments ALL OTHER SOURCES
Quantity (short tons) Number of firms
U.S. shipments of wire rod of: Low/medium-low carbon industrial/standard *** *** *** ***
High/medium-high carbon industrial/standard *** *** *** *** Tire cord quality or tire bead *** *** *** *** Welding *** *** *** *** Cold heading quality (CHQ) *** *** *** *** Other specialty carbon and alloy *** *** *** *** All others *** *** *** *** Total U.S. shipments of imports from all other sources *** *** *** ***
Share of product by shipment type (percent down)
U.S. shipments of wire rod of: Low/medium-low carbon industrial/standard 7.6 *** ***
High/medium-high carbon industrial/standard 12.6 *** *** Tire cord quality or tire bead 15.2 *** *** Welding 16.2 *** *** Cold heading quality (CHQ) 38.9 *** *** Other specialty carbon and alloy 6.6 *** *** All others 3.0 *** *** Total U.S. shipments of imports from all other sources 100.0 100.0 100.0 Share of shipment type by product
(percent across) U.S. shipments of wire rod of: Low/medium-low carbon industrial/standard *** *** ***
High/medium-high carbon industrial/standard *** *** *** Tire cord quality or tire bead *** *** *** Welding *** *** *** Cold heading quality (CHQ) *** *** *** Other specialty carbon and alloy *** *** *** All others *** *** *** Total U.S. shipments of imports from all other sources *** *** ***
Table continued on next page.
IV-9

Table IV-4--Continued Wire rod: U.S. importers’ U.S. shipments of imports, by type, 2013
Item
2013
Commercial shipments
Internal consumption
/ transfers U.S. shipments ALL SOURCES
Quantity (short tons) Number of firms
U.S. shipments of wire rod of: Low/medium-low carbon industrial/standard *** *** *** ***
High/medium-high carbon industrial/standard *** *** *** *** Tire cord quality or tire bead *** *** *** *** Welding *** *** *** *** Cold heading quality (CHQ) *** *** *** *** Other specialty carbon and alloy *** *** *** *** All others *** *** *** *** Total U.S. shipments of imports from all sources *** *** *** *** Share of product by shipment type
(percent down)
U.S. shipments of wire rod of: Low/medium-low carbon industrial/standard 35.6 *** ***
High/medium-high carbon industrial/standard 15.2 *** *** Tire cord quality or tire bead 9.3 *** *** Welding 9.9 *** *** Cold heading quality (CHQ) 23.7 *** *** Other specialty carbon and alloy 4.5 *** *** All others 1.8 *** *** Total U.S. shipments of imports from all sources 100.0 100.0 100.0 Share of shipment type by product
(percent across) U.S. shipments of wire rod of: Low/medium-low carbon industrial/standard *** *** ***
High/medium-high carbon industrial/standard *** *** *** Tire cord quality or tire bead *** *** *** Welding *** *** *** Cold heading quality (CHQ) *** *** *** Other specialty carbon and alloy *** *** *** All others *** *** *** Total U.S. shipments of imports from all sources *** *** ***
Source: Compiled from data submitted in response to Commission questionnaires.
IV-10
Negligible imports
The statute requires that an investigation be terminated without an injury
determination if imports of the subject merchandise are found to be negligible.9 Negligible
imports are generally defined in the Tariff Act of 1930, as amended, as imports from a country
of merchandise corresponding to a domestic like product where such imports account for less
than 3 percent of the volume of all such merchandise imported into the United States in the
most recent 12-month period for which data are available that precedes the filing of the
petition or the initiation of the investigation. However, if there are imports of such merchandise
from a number of countries subject to investigations initiated on the same day that individually
account for less than 3 percent of the total volume of the subject merchandise, and if the
imports from those countries collectively account for more than 7 percent of the volume of all
such merchandise imported into the United States during the applicable 12-month period, then
imports from such countries are deemed not to be negligible.10 Imports from China accounted
for 36.2 percent of total imports of wire rod by quantity during January - December 2013.
9 Sections 703(a)(1), 705(b)(1), 733(a)(1), and 735(b)(1) of the Act (19 U.S.C. §§ 1671b(a)(1), 1671d(b)(1), 1673b(a)(1), and 1673d(b)(1)).
10 Section 771 (24) of the Act (19 U.S.C § 1677(24)).
IV-11
CRITICAL CIRCUMSTANCES
On July 8, 2014, Commerce preliminarily determined that critical circumstances exist
with respect to all Chinese exporters except Benxi Steel in relation to its countervailing duty
investigation.11 On September 8, 2014, Commerce preliminarily determined that critical
circumstances exist for all Chinese exports except Rizhao Steel Wire Co. Ltd., Hunan Valin
Xiangtan Iron & Steel Co. Ltd., and Jiangsu Shagang International Trade Co. Ltd in relation to its
antidumping duty investigation.12 13 In these investigations, if both Commerce and the
Commission make affirmative final critical circumstances determinations, certain subject
imports may be subject to duties retroactive by 90 days from July 8, 2014, and September 8,
2014, the effective dates of Commerce’s preliminary affirmative countervailing and LTFV
determinations respectively. In making its critical circumstances determination, the
Commission may consider, among other factors it considers relevant, (1) the timing and the
volume of imports, (2) a rapid increase in inventories of the imports, and (3) any other
11 Carbon and Certain Alloy Steel Wire Rod From the People’s Republic of China: Preliminary Affirmative Countervailing Duty Determination, Preliminary Affirmative Critical Circumstances Determination, and Alignment of Final Countervailing Duty Determination With Final Antidumping Duty Determination, 79 FR 38490, July 8, 2014.
12 Carbon and Certain Alloy Steel Wire Rod From the People’s Republic of China: Preliminary Determination of Sales at Less Than Fair Value and Preliminary Determination of Critical Circumstances, in Part, 79 FR 53169, September 8, 2014.
13 When petitioners file timely allegations of critical circumstances, Commerce examines whether there is a reasonable basis to believe or suspect that (1) either there is a history of dumping and material injury by reason of dumped imports in the United States or elsewhere of the subject merchandise, or the person by whom, or for whose account, the merchandise was imported knew or should have known that the exporter was selling the subject merchandise at LTFV and that there was likely to be material injury by reason of such sales; and (2) there have been massive imports of the subject merchandise over a relatively short period.
IV-12
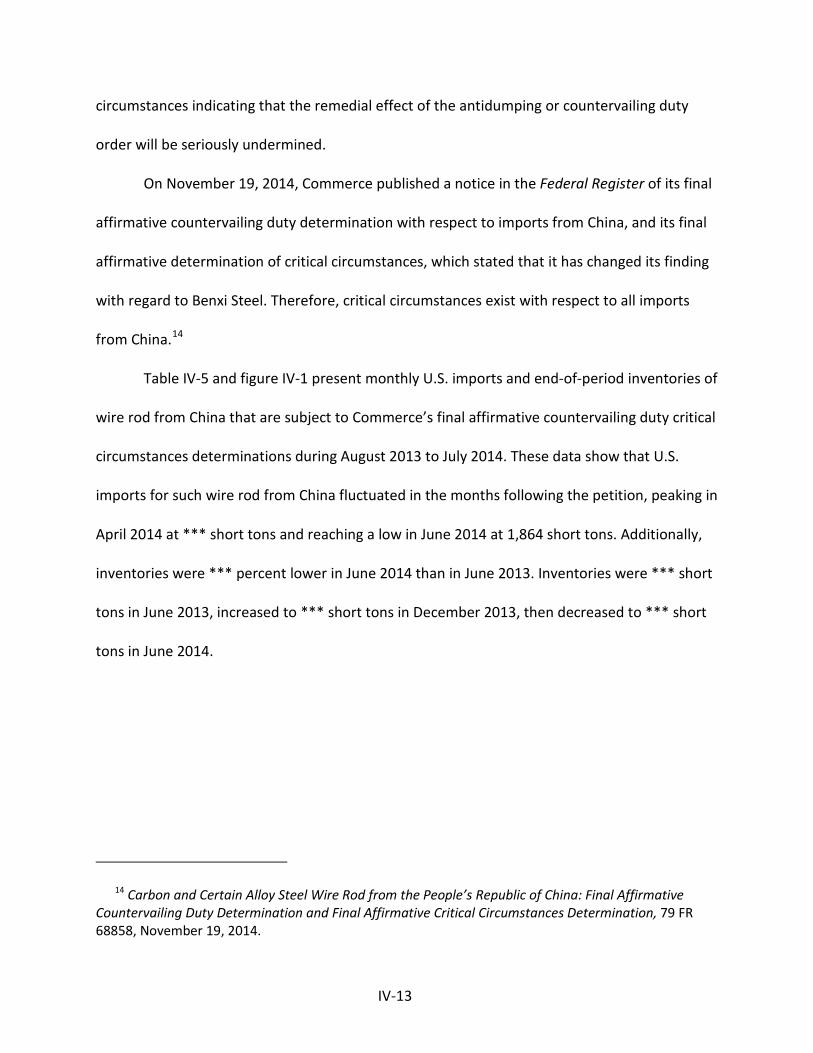
circumstances indicating that the remedial effect of the antidumping or countervailing duty
order will be seriously undermined.
On November 19, 2014, Commerce published a notice in the Federal Register of its final
affirmative countervailing duty determination with respect to imports from China, and its final
affirmative determination of critical circumstances, which stated that it has changed its finding
with regard to Benxi Steel. Therefore, critical circumstances exist with respect to all imports
from China.14
Table IV-5 and figure IV-1 present monthly U.S. imports and end-of-period inventories of
wire rod from China that are subject to Commerce’s final affirmative countervailing duty critical
circumstances determinations during August 2013 to July 2014. These data show that U.S.
imports for such wire rod from China fluctuated in the months following the petition, peaking in
April 2014 at *** short tons and reaching a low in June 2014 at 1,864 short tons. Additionally,
inventories were *** percent lower in June 2014 than in June 2013. Inventories were *** short
tons in June 2013, increased to *** short tons in December 2013, then decreased to *** short
tons in June 2014.
14 Carbon and Certain Alloy Steel Wire Rod from the People’s Republic of China: Final Affirmative Countervailing Duty Determination and Final Affirmative Critical Circumstances Determination, 79 FR 68858, November 19, 2014.
IV-13
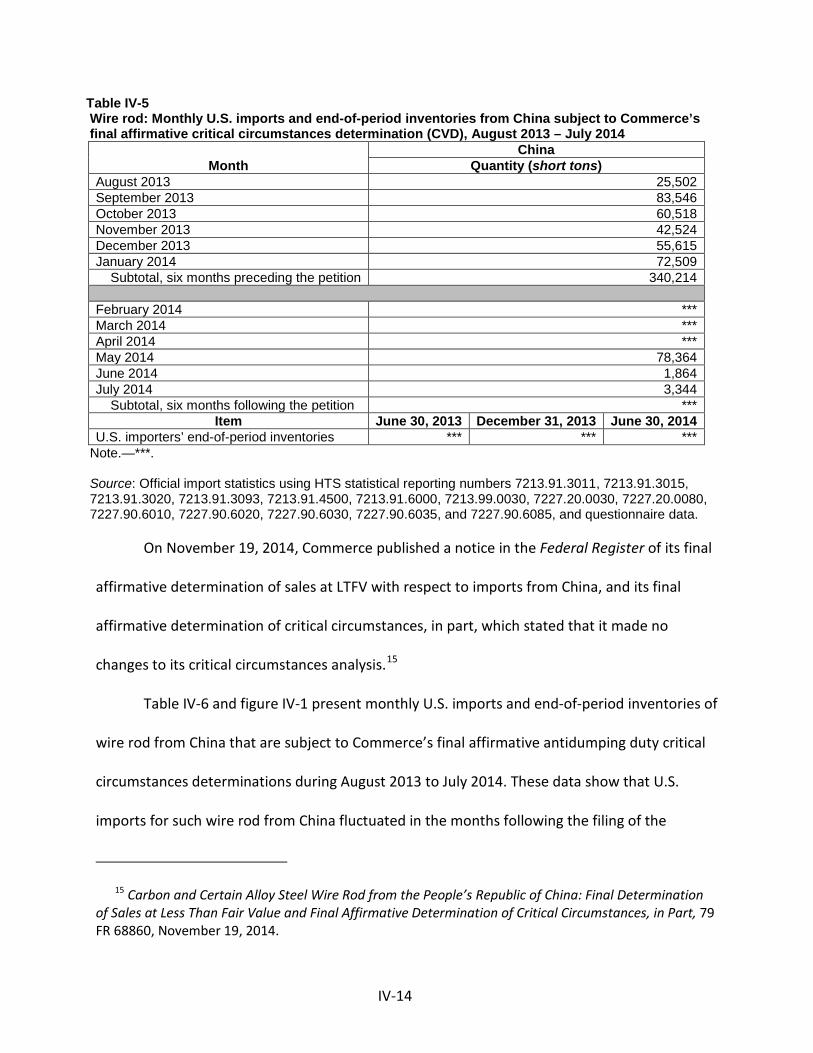
Table IV-5 Wire rod: Monthly U.S. imports and end-of-period inventories from China subject to Commerce’s final affirmative critical circumstances determination (CVD), August 2013 – July 2014
Month China
Quantity (short tons) August 2013 25,502 September 2013 83,546 October 2013 60,518 November 2013 42,524 December 2013 55,615 January 2014 72,509 Subtotal, six months preceding the petition 340,214
February 2014 *** March 2014 *** April 2014 *** May 2014 78,364 June 2014 1,864 July 2014 3,344 Subtotal, six months following the petition ***
Item June 30, 2013 December 31, 2013 June 30, 2014 U.S. importers’ end-of-period inventories *** *** ***
Note.—***. Source: Official import statistics using HTS statistical reporting numbers 7213.91.3011, 7213.91.3015, 7213.91.3020, 7213.91.3093, 7213.91.4500, 7213.91.6000, 7213.99.0030, 7227.20.0030, 7227.20.0080, 7227.90.6010, 7227.90.6020, 7227.90.6030, 7227.90.6035, and 7227.90.6085, and questionnaire data.
On November 19, 2014, Commerce published a notice in the Federal Register of its final
affirmative determination of sales at LTFV with respect to imports from China, and its final
affirmative determination of critical circumstances, in part, which stated that it made no
changes to its critical circumstances analysis.15
Table IV-6 and figure IV-1 present monthly U.S. imports and end-of-period inventories of
wire rod from China that are subject to Commerce’s final affirmative antidumping duty critical
circumstances determinations during August 2013 to July 2014. These data show that U.S.
imports for such wire rod from China fluctuated in the months following the filing of the
15 Carbon and Certain Alloy Steel Wire Rod from the People’s Republic of China: Final Determination of Sales at Less Than Fair Value and Final Affirmative Determination of Critical Circumstances, in Part, 79 FR 68860, November 19, 2014.
IV-14
petition, peaking in April 2014 at *** short tons and reaching a low in June 2014 at *** short
tons. Additionally, end-of-period inventories were *** percent lower in June 2014 than in June
2013. Inventories were *** short tons in June 2013, increased to *** short tons in December
2013, then decreased to *** short tons in June 2014.
Table IV-6 Wire rod: Monthly U.S. imports and end-of-period inventories from China subject to Commerce’s final affirmative critical circumstances determination (AD), August 2013 – July 2014
Month China
Quantity (short tons) August 2013 *** September 2013 *** October 2013 *** November 2013 *** December 2013 *** January 2014 *** Subtotal, six months preceding the petition ***
February 2014 *** March 2014 *** April 2014 *** May 2014 *** June 2014 *** July 2014 *** Subtotal, six months following the petition ***
Item June 30, 2013 December 31, 2013 June 30, 2014 U.S. importers’ end-of-period inventories *** *** ***
Note.—These data exclude imports from Hunan Valin, Jiangsu Shagang International Trade Co., and Rizhao Steel as they are not subject to Commerce’s affirmative antidumping duty critical circumstances determinations. Note.—***. Note.—***. Source: Compiled from proprietary *** data.
IV-15
Figure IV-1 Wire rod: Monthly U.S. imports from China subject to Commerce’s final affirmative critical circumstances determinations (CVD and AD), August 2013 – July 2014
* * * * * * *
Domestic producers advocate for an affirmative critical circumstances finding with
regard to the countervailing duty allegations. Petitioners contend that the “behavior of Chinese
exporters attempting to ‘beat’ the imposition of duties by selling the increased volumes of wire
rod at extremely low prices into the United States is precisely the action that the critical
circumstances provision was meant to remedy.”16 According to Nucor, “the timing and volume
of subject imports, coupled with a rapid increase in inventories and other relevant
circumstances, all indicate that the effectiveness of any eventual trade relief will be
undermined if critical circumstances are not found.”17 Nucor further states that “substantial
Chinese governmental subsidies, Chinese overcapacity, and weak demand within China have
16 Domestic producers’ prehearing brief, p. 39. 17 Nucor’s prehearing brief, p. 25.
IV-16
contributed to the injurious acceleration of imports and the buildup of inventories.”18
Additionally, the domestic producers contend that the “continued build-up and presence of
large inventories of dumped and subsidized Chinese wire rod has continuing knock-on effects
for U.S. producers. These include increasing domestic inventories as U.S. producers are
increasingly unable to sell wire rod to consumers working off inventories of Chinese wire
rod.”19
In contrast, U.S. importers Duferco, Macsteel, and Stemcor contend that the
Commission should find that critical circumstances do not exist with respect to imports of wire
rod from China. According to these firms, “imports of wire rod from China decreased after the
petition was filed,” 20 and inventories of subject merchandise held by importers were lower in
interim 2014 than in interim 2013,21 which warrants a negative critical circumstances
determination. Chinese respondent China Iron & Steel Association (CISA) also contends that
there is no basis for finding critical circumstances since “there are no massive increases in
imports” and “no increase in inventories of subject imports.”22
18 Nucor’s posthearing brief, p. 9. 19 Nucor’s prehearing brief, p. 38. 20 Macsteel and Stemcor’s prehearing brief, p. 7. 21 Macsteel and Stemcor’s posthearing brief, p. 12. 22 CISA’s prehearing brief, p. 18.
IV-17
APPARENT U.S. CONSUMPTION
Total apparent U.S. consumption and market shares
Table IV-7 and figure IV-2 present data on apparent U.S. consumption and U.S. market
shares for wire rod during 2011 to 2013, January-June 2013, and January-June 2014.23 These
data show that apparent U.S. consumption, based on quantity, increased by 3.5 percent from
2011 to 2013 and it was *** percent higher in January-June 2014 than in January-June 2013.
Apparent U.S. consumption, based on value, decreased by 9.5 percent from 2011 to 2013, but
was *** percent higher in January-June 2014 than in January-June 2013. U.S. producers’ share
of apparent U.S. consumption, based on quantity, decreased steadily from 2011 to 2013,
declining by 7.7 percentage points overall. The market share of imports of wire rod from China
increased steadily from 2011 to 2013, increasing overall by 11.7 percentage points. U.S.
producers’ share of apparent U.S. consumption was lower, and that of subject imports from
China was higher, in January-June 2014 than in January-June 2013.
23 Total apparent consumption includes internal consumption and transfers to related firms by U.S. producers.
IV-18
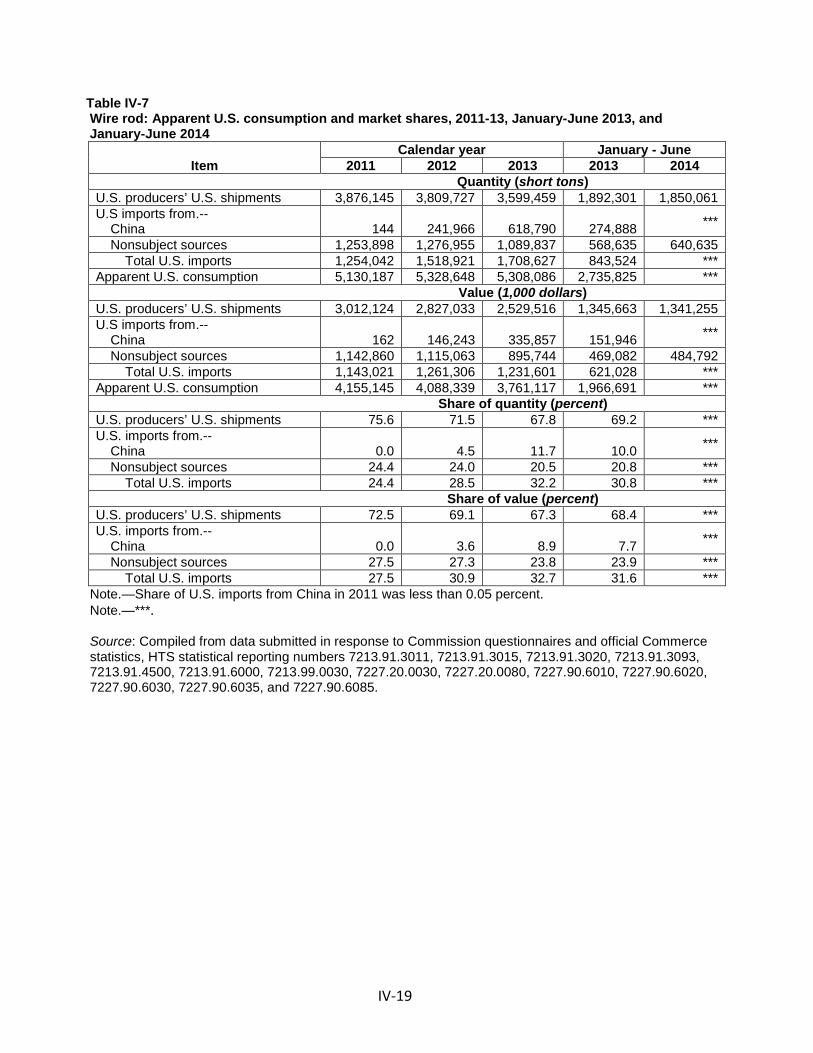
Table IV-7 Wire rod: Apparent U.S. consumption and market shares, 2011-13, January-June 2013, and January-June 2014
Item Calendar year January - June
2011 2012 2013 2013 2014 Quantity (short tons) U.S. producers’ U.S. shipments 3,876,145 3,809,727 3,599,459 1,892,301 1,850,061 U.S imports from.-- China 144 241,966 618,790 274,888 ***
Nonsubject sources 1,253,898 1,276,955 1,089,837 568,635 640,635 Total U.S. imports 1,254,042 1,518,921 1,708,627 843,524 *** Apparent U.S. consumption 5,130,187 5,328,648 5,308,086 2,735,825 *** Value (1,000 dollars) U.S. producers’ U.S. shipments 3,012,124 2,827,033 2,529,516 1,345,663 1,341,255 U.S imports from.-- China 162 146,243 335,857 151,946 ***
Nonsubject sources 1,142,860 1,115,063 895,744 469,082 484,792 Total U.S. imports 1,143,021 1,261,306 1,231,601 621,028 *** Apparent U.S. consumption 4,155,145 4,088,339 3,761,117 1,966,691 *** Share of quantity (percent) U.S. producers’ U.S. shipments 75.6 71.5 67.8 69.2 *** U.S. imports from.-- China 0.0 4.5 11.7 10.0 ***
Nonsubject sources 24.4 24.0 20.5 20.8 *** Total U.S. imports 24.4 28.5 32.2 30.8 *** Share of value (percent) U.S. producers’ U.S. shipments 72.5 69.1 67.3 68.4 *** U.S. imports from.-- China 0.0 3.6 8.9 7.7 ***
Nonsubject sources 27.5 27.3 23.8 23.9 *** Total U.S. imports 27.5 30.9 32.7 31.6 ***
Note.—Share of U.S. imports from China in 2011 was less than 0.05 percent. Note.—***. Source: Compiled from data submitted in response to Commission questionnaires and official Commerce statistics, HTS statistical reporting numbers 7213.91.3011, 7213.91.3015, 7213.91.3020, 7213.91.3093, 7213.91.4500, 7213.91.6000, 7213.99.0030, 7227.20.0030, 7227.20.0080, 7227.90.6010, 7227.90.6020, 7227.90.6030, 7227.90.6035, and 7227.90.6085.
IV-19
Figure IV-2 Wire rod: Apparent U.S. consumption and market shares, 2011-13, January-June 2013, and January-June 2014
* * * * * * *
Merchant market apparent U.S. consumption and market shares
Table IV-8 and figure IV-3 present data on merchant market apparent U.S. consumption
and U.S. market shares for wire rod during 2011 to 2013, January-June 2013, and January-June
2014.24 Merchant market apparent consumption, based on quantity, increased by 2.5 percent
from 2011 to 2013 and it was *** percent higher in January-June 2014 than in January-June
2013. Merchant market apparent U.S. consumption, based on value, decreased by 10.8 percent
from 2011 to 2013 and was *** percent higher in January-June 2014 than in January-June 2013.
U.S. producers’ share of merchant market apparent consumption, based on quantity, decreased
steadily from 2011 to 2013, by 9.8 percentage points. The market share of imports of wire rod
from China increased steadily from 2011 to 2013, reaching 14.4 percent in 2013. U.S.
24 Merchant market apparent consumption does not include internal consumption and transfers to related firms by U.S. producers.
IV-20
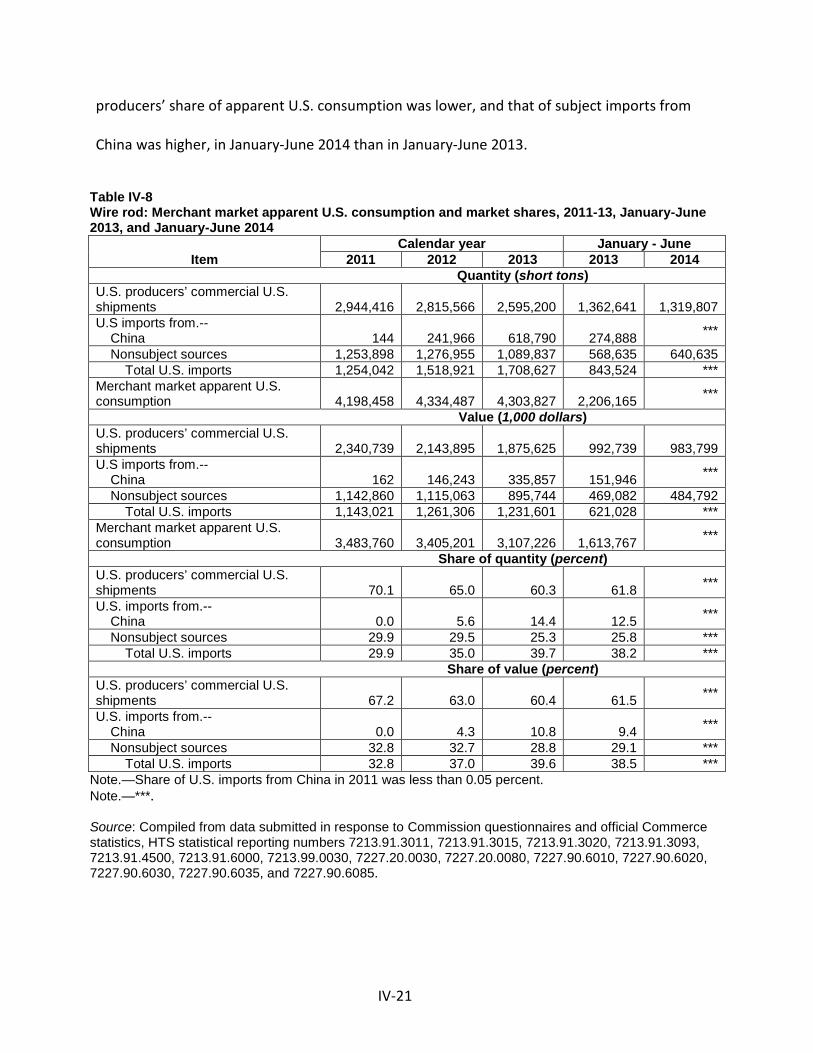
producers’ share of apparent U.S. consumption was lower, and that of subject imports from
China was higher, in January-June 2014 than in January-June 2013.
Table IV-8 Wire rod: Merchant market apparent U.S. consumption and market shares, 2011-13, January-June 2013, and January-June 2014
Item Calendar year January - June
2011 2012 2013 2013 2014 Quantity (short tons) U.S. producers’ commercial U.S. shipments 2,944,416 2,815,566 2,595,200 1,362,641 1,319,807 U.S imports from.-- China 144 241,966 618,790 274,888 ***
Nonsubject sources 1,253,898 1,276,955 1,089,837 568,635 640,635 Total U.S. imports 1,254,042 1,518,921 1,708,627 843,524 *** Merchant market apparent U.S. consumption 4,198,458 4,334,487 4,303,827 2,206,165 *** Value (1,000 dollars) U.S. producers’ commercial U.S. shipments 2,340,739 2,143,895 1,875,625 992,739 983,799 U.S imports from.-- China 162 146,243 335,857 151,946 ***
Nonsubject sources 1,142,860 1,115,063 895,744 469,082 484,792 Total U.S. imports 1,143,021 1,261,306 1,231,601 621,028 *** Merchant market apparent U.S. consumption 3,483,760 3,405,201 3,107,226 1,613,767 *** Share of quantity (percent) U.S. producers’ commercial U.S. shipments 70.1 65.0 60.3 61.8 *** U.S. imports from.-- China 0.0 5.6 14.4 12.5 *** Nonsubject sources 29.9 29.5 25.3 25.8 *** Total U.S. imports 29.9 35.0 39.7 38.2 *** Share of value (percent) U.S. producers’ commercial U.S. shipments 67.2 63.0 60.4 61.5 *** U.S. imports from.-- China 0.0 4.3 10.8 9.4 *** Nonsubject sources 32.8 32.7 28.8 29.1 *** Total U.S. imports 32.8 37.0 39.6 38.5 ***
Note.—Share of U.S. imports from China in 2011 was less than 0.05 percent. Note.—***. Source: Compiled from data submitted in response to Commission questionnaires and official Commerce statistics, HTS statistical reporting numbers 7213.91.3011, 7213.91.3015, 7213.91.3020, 7213.91.3093, 7213.91.4500, 7213.91.6000, 7213.99.0030, 7227.20.0030, 7227.20.0080, 7227.90.6010, 7227.90.6020, 7227.90.6030, 7227.90.6035, and 7227.90.6085.
IV-21

Figure IV-3 Wire rod: Merchant market apparent U.S. consumption and market shares, 2011-13, January-June 2013, and January-June 2014
* * * * * * *
IV-22
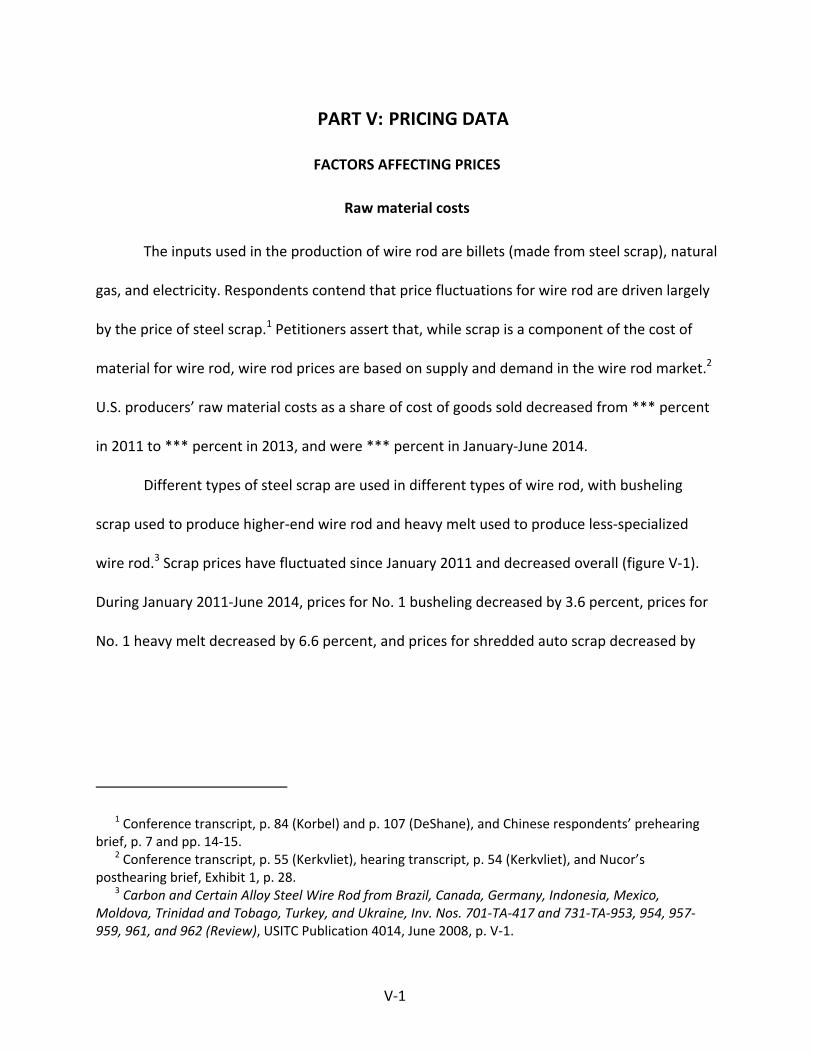
V‐1
PART V: PRICING DATA
FACTORS AFFECTING PRICES
Raw material costs
The inputs used in the production of wire rod are billets (made from steel scrap), natural
gas, and electricity. Respondents contend that price fluctuations for wire rod are driven largely
by the price of steel scrap.1 Petitioners assert that, while scrap is a component of the cost of
material for wire rod, wire rod prices are based on supply and demand in the wire rod market.2
U.S. producers’ raw material costs as a share of cost of goods sold decreased from *** percent
in 2011 to *** percent in 2013, and were *** percent in January‐June 2014.
Different types of steel scrap are used in different types of wire rod, with busheling
scrap used to produce higher‐end wire rod and heavy melt used to produce less‐specialized
wire rod.3 Scrap prices have fluctuated since January 2011 and decreased overall (figure V‐1).
During January 2011‐June 2014, prices for No. 1 busheling decreased by 3.6 percent, prices for
No. 1 heavy melt decreased by 6.6 percent, and prices for shredded auto scrap decreased by
1 Conference transcript, p. 84 (Korbel) and p. 107 (DeShane), and Chinese respondents’ prehearing brief, p. 7 and pp. 14‐15.
2 Conference transcript, p. 55 (Kerkvliet), hearing transcript, p. 54 (Kerkvliet), and Nucor’s posthearing brief, Exhibit 1, p. 28.
3 Carbon and Certain Alloy Steel Wire Rod from Brazil, Canada, Germany, Indonesia, Mexico, Moldova, Trinidad and Tobago, Turkey, and Ukraine, Inv. Nos. 701‐TA‐417 and 731‐TA‐953, 954, 957‐959, 961, and 962 (Review), USITC Publication 4014, June 2008, p. V‐1.
V‐2
8.9 percent. Scrap prices have remained relatively stable since June 2014. U.S. producer Gerdau
reported that the scrap market is globally traded and it is difficult to forecast scrap prices.4
Figure V-1 U.S. ferrous scrap prices: Weekly scrap prices, January 2011-October 2014
Source: American Metal Market, retrieved February 6, 2014 and October 13, 2014.
Wire rod can also be made from a number of different iron inputs including scrap blends
and substitutes.5 There is no single input mix for any grade of wire rod that is used by all wire
rod producers. Each producer will have its own wire rod blend of steel scrap and other iron
inputs to reach the same chemistry depending on the cost and availability of the raw materials
and their furnace set up. Domestic producers reported that industrial grades of wire rod
(pricing products 1, 2, and 3) are likely made with a higher proportion of No. 1 heavy melt scrap
4 Hearing transcript, p. 54 (Kerkvliet). 5 Domestic producers’ posthearing brief, Exhibit 1, p. 7. See also, Chinese respondents’ posthearing
brief, Commissioner Questions, pp. 14‐16.
V‐3
while more specialized, higher‐valued wire rod (pricing products 4 and 5) are likely to use a
scrap mix that includes busheling scrap and other higher cost iron units.6 Respondents agree
that individual steel mills can include various grades of scrap in their melt but contend that No.
1 heavy melt scrap prices are used as the “bellwether price” for setting steel scrap prices.7
Energy prices have also fluctuated since 2011. Natural gas prices decreased from
January 2011 through April 2012 then increased irregularly through June 2014 after which they
decreased (figure V‐2). Natural gas prices peaked at $6.18 per thousand cubic foot in February
2014 and increased overall by 2.4 percent from January 2011 to June 2014. Electricity prices are
seasonal and peaked during the summer months, with the highest price at 7.40 cents per
kilowatt hour in August 2011. Overall, electricity prices increased 6.6 percent from January
2011 to January 2014, and 2.2 percent from June 2011 to June 2014.
6 Domestic producers’ posthearing brief, Exhibit 1, p. 8. 7 Chinese respondents’ posthearing brief, Commissioner Questions, pp. 15‐16.
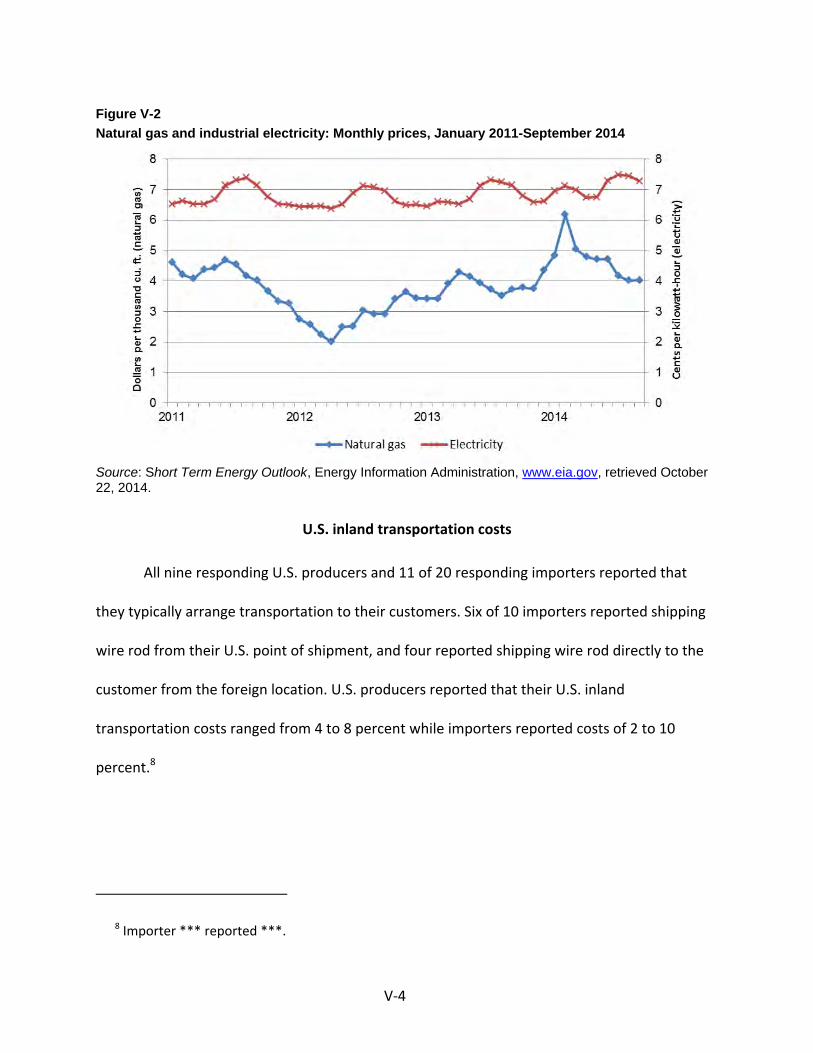
V‐4
Figure V-2 Natural gas and industrial electricity: Monthly prices, January 2011-September 2014
Source: Short Term Energy Outlook, Energy Information Administration, www.eia.gov, retrieved October 22, 2014.
U.S. inland transportation costs
All nine responding U.S. producers and 11 of 20 responding importers reported that
they typically arrange transportation to their customers. Six of 10 importers reported shipping
wire rod from their U.S. point of shipment, and four reported shipping wire rod directly to the
customer from the foreign location. U.S. producers reported that their U.S. inland
transportation costs ranged from 4 to 8 percent while importers reported costs of 2 to 10
percent.8
8 Importer *** reported ***.
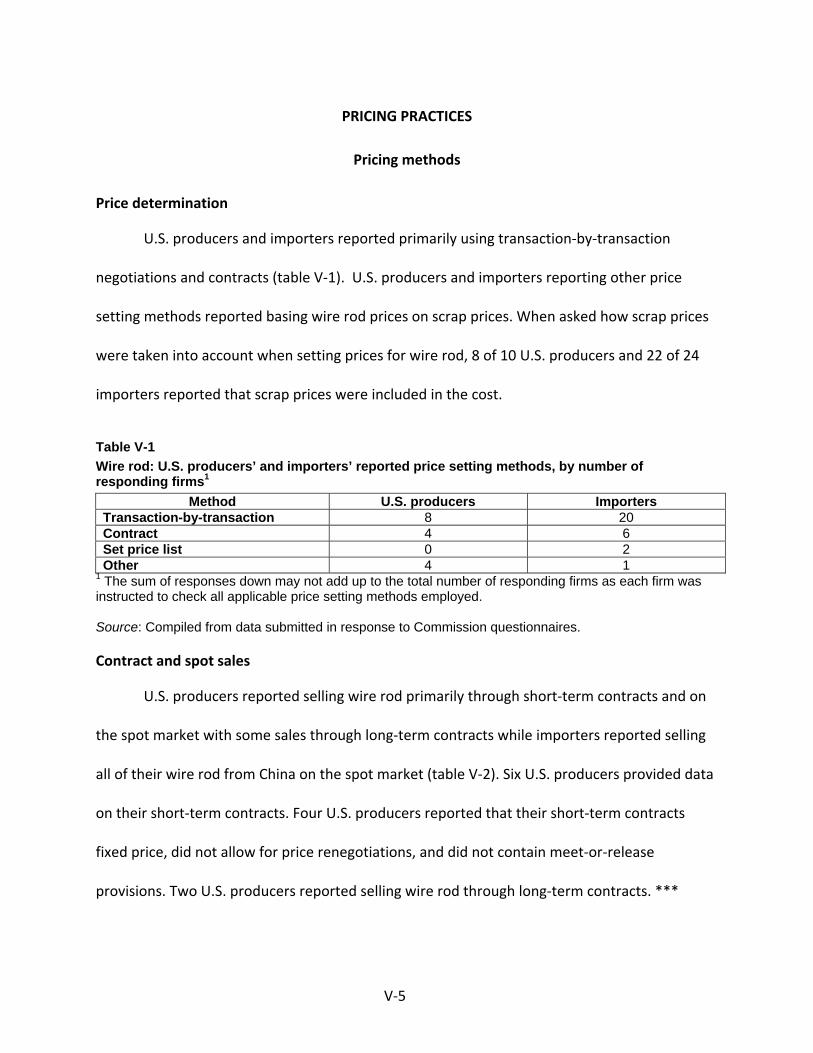
V‐5
PRICING PRACTICES
Pricing methods
Price determination
U.S. producers and importers reported primarily using transaction‐by‐transaction
negotiations and contracts (table V‐1). U.S. producers and importers reporting other price
setting methods reported basing wire rod prices on scrap prices. When asked how scrap prices
were taken into account when setting prices for wire rod, 8 of 10 U.S. producers and 22 of 24
importers reported that scrap prices were included in the cost.
Table V-1 Wire rod: U.S. producers’ and importers’ reported price setting methods, by number of responding firms1
Method U.S. producers Importers Transaction-by-transaction 8 20 Contract 4 6 Set price list 0 2 Other 4 1
1 The sum of responses down may not add up to the total number of responding firms as each firm was instructed to check all applicable price setting methods employed. Source: Compiled from data submitted in response to Commission questionnaires.
Contract and spot sales
U.S. producers reported selling wire rod primarily through short‐term contracts and on
the spot market with some sales through long‐term contracts while importers reported selling
all of their wire rod from China on the spot market (table V‐2). Six U.S. producers provided data
on their short‐term contracts. Four U.S. producers reported that their short‐term contracts
fixed price, did not allow for price renegotiations, and did not contain meet‐or‐release
provisions. Two U.S. producers reported selling wire rod through long‐term contracts. ***
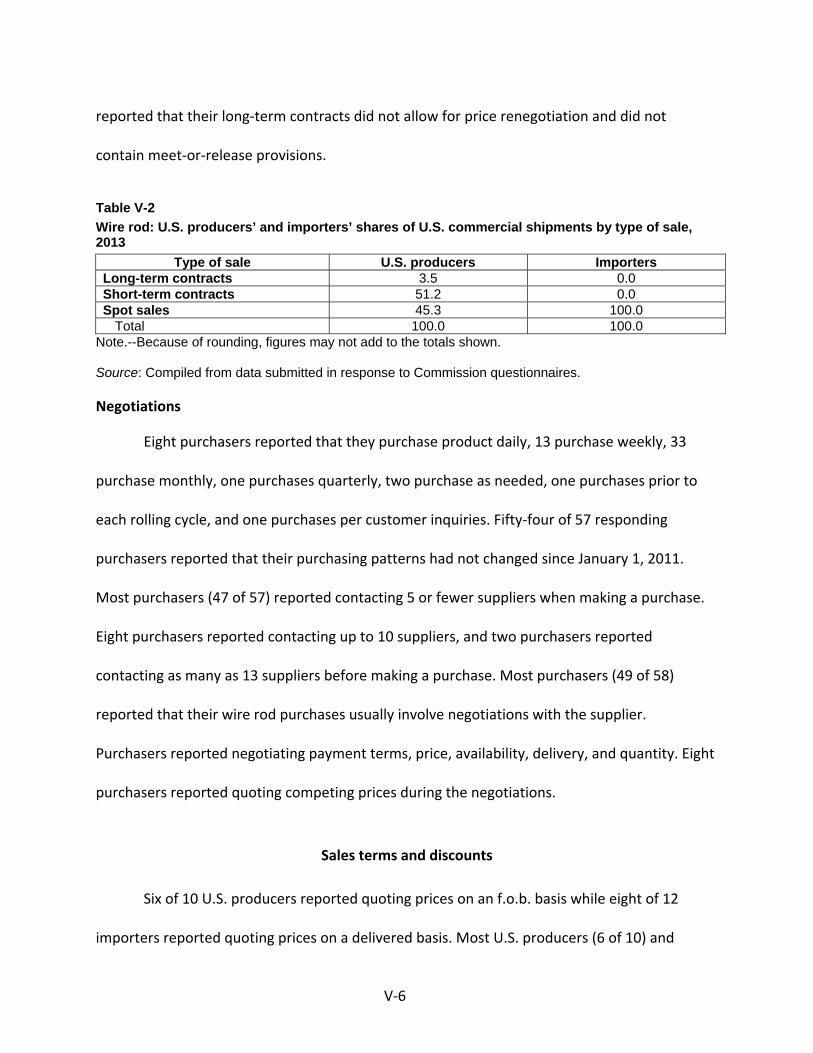
V‐6
reported that their long‐term contracts did not allow for price renegotiation and did not
contain meet‐or‐release provisions.
Table V-2 Wire rod: U.S. producers’ and importers’ shares of U.S. commercial shipments by type of sale, 2013
Type of sale U.S. producers Importers Long-term contracts 3.5 0.0 Short-term contracts 51.2 0.0 Spot sales 45.3 100.0
Total 100.0 100.0 Note.--Because of rounding, figures may not add to the totals shown. Source: Compiled from data submitted in response to Commission questionnaires.
Negotiations
Eight purchasers reported that they purchase product daily, 13 purchase weekly, 33
purchase monthly, one purchases quarterly, two purchase as needed, one purchases prior to
each rolling cycle, and one purchases per customer inquiries. Fifty‐four of 57 responding
purchasers reported that their purchasing patterns had not changed since January 1, 2011.
Most purchasers (47 of 57) reported contacting 5 or fewer suppliers when making a purchase.
Eight purchasers reported contacting up to 10 suppliers, and two purchasers reported
contacting as many as 13 suppliers before making a purchase. Most purchasers (49 of 58)
reported that their wire rod purchases usually involve negotiations with the supplier.
Purchasers reported negotiating payment terms, price, availability, delivery, and quantity. Eight
purchasers reported quoting competing prices during the negotiations.
Sales terms and discounts
Six of 10 U.S. producers reported quoting prices on an f.o.b. basis while eight of 12
importers reported quoting prices on a delivered basis. Most U.S. producers (6 of 10) and
V‐7
importers (24 of 25) reported offering no discounts. Three U.S. producers reported offering
quantity and total volume discounts, and one U.S. producer reported offering a discount for
early payment. One U.S. producer and one importer reported offering cash discounts. Four U.S.
producers reported offering sales terms of ½ percent 10, net 30 days, three reported net 30
days, and three reported other terms. Eleven importers reported sales terms of net 30 days,
two reported net 60 days, and one reported net 90 days for their sales of wire rod imported
from China.
Price leadership
Nucor was the most frequently reported price leader (27 purchasers) followed by
Gerdau (named by 9 purchasers), ArcelorMittal and Keystone (8 purchasers each), and Charter
(5 purchasers). Purchasers reported that these firms were generally the first to announce price
increases. Purchasers also reported that Leggett and Platt and Ivaco (Canada) were price
leaders. One purchaser stated that all domestic producers were price leaders and one
purchaser stated that importers were price leaders but did not name any specific firms.
PRICE DATA
The Commission requested U.S. producers and importers to provide quarterly data for
the total quantity and f.o.b. value of the following wire rod products shipped to unrelated U.S.
customers during January 2011‐June 2014.
Product 1.‐‐ Industrial quality wire rod, grade C1006, 5.5 mm (7/32 inch) through 12 mm (15/32 inch) in diameter, for hangers, chain link fencing, collated
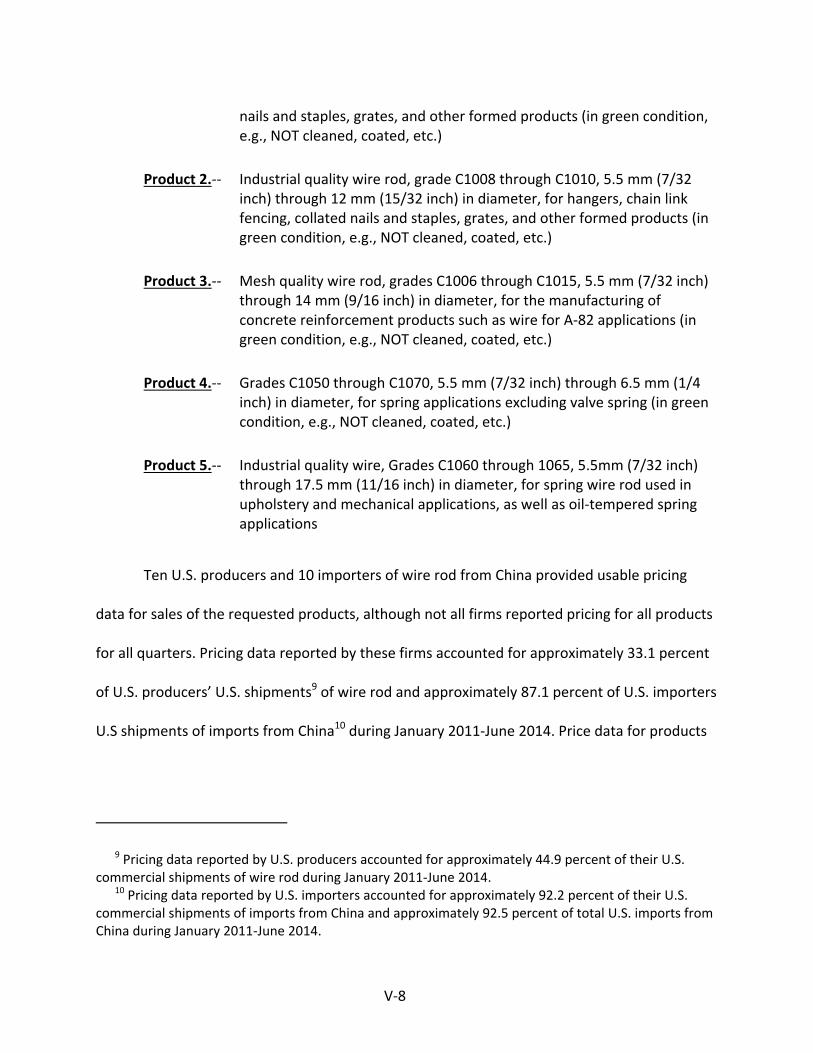
V‐8
nails and staples, grates, and other formed products (in green condition, e.g., NOT cleaned, coated, etc.)
Product 2.‐‐ Industrial quality wire rod, grade C1008 through C1010, 5.5 mm (7/32 inch) through 12 mm (15/32 inch) in diameter, for hangers, chain link fencing, collated nails and staples, grates, and other formed products (in green condition, e.g., NOT cleaned, coated, etc.)
Product 3.‐‐ Mesh quality wire rod, grades C1006 through C1015, 5.5 mm (7/32 inch) through 14 mm (9/16 inch) in diameter, for the manufacturing of concrete reinforcement products such as wire for A‐82 applications (in green condition, e.g., NOT cleaned, coated, etc.)
Product 4.‐‐ Grades C1050 through C1070, 5.5 mm (7/32 inch) through 6.5 mm (1/4 inch) in diameter, for spring applications excluding valve spring (in green condition, e.g., NOT cleaned, coated, etc.)
Product 5.‐‐ Industrial quality wire, Grades C1060 through 1065, 5.5mm (7/32 inch) through 17.5 mm (11/16 inch) in diameter, for spring wire rod used in upholstery and mechanical applications, as well as oil‐tempered spring applications
Ten U.S. producers and 10 importers of wire rod from China provided usable pricing
data for sales of the requested products, although not all firms reported pricing for all products
for all quarters. Pricing data reported by these firms accounted for approximately 33.1 percent
of U.S. producers’ U.S. shipments9 of wire rod and approximately 87.1 percent of U.S. importers
U.S shipments of imports from China10 during January 2011‐June 2014. Price data for products
9 Pricing data reported by U.S. producers accounted for approximately 44.9 percent of their U.S. commercial shipments of wire rod during January 2011‐June 2014.
10 Pricing data reported by U.S. importers accounted for approximately 92.2 percent of their U.S. commercial shipments of imports from China and approximately 92.5 percent of total U.S. imports from China during January 2011‐June 2014.
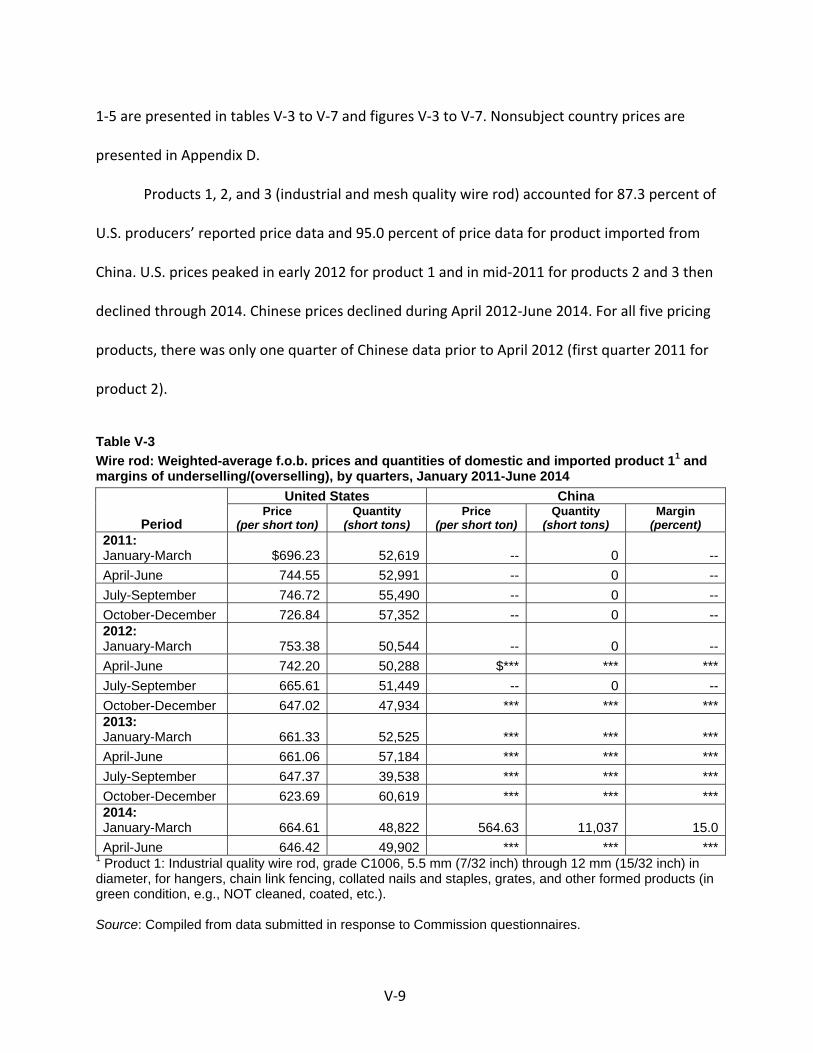
V‐9
1‐5 are presented in tables V‐3 to V‐7 and figures V‐3 to V‐7. Nonsubject country prices are
presented in Appendix D.
Products 1, 2, and 3 (industrial and mesh quality wire rod) accounted for 87.3 percent of
U.S. producers’ reported price data and 95.0 percent of price data for product imported from
China. U.S. prices peaked in early 2012 for product 1 and in mid‐2011 for products 2 and 3 then
declined through 2014. Chinese prices declined during April 2012‐June 2014. For all five pricing
products, there was only one quarter of Chinese data prior to April 2012 (first quarter 2011 for
product 2).
Table V-3 Wire rod: Weighted-average f.o.b. prices and quantities of domestic and imported product 11 and margins of underselling/(overselling), by quarters, January 2011-June 2014
Period
United States China Price
(per short ton) Quantity
(short tons) Price
(per short ton) Quantity
(short tons) Margin
(percent) 2011: January-March $696.23 52,619 -- 0 --April-June 744.55 52,991 -- 0 --July-September 746.72 55,490 -- 0 --October-December 726.84 57,352 -- 0 --2012: January-March 753.38 50,544 -- 0 --April-June 742.20 50,288 $*** *** ***July-September 665.61 51,449 -- 0 --October-December 647.02 47,934 *** *** ***2013: January-March 661.33 52,525 *** *** ***April-June 661.06 57,184 *** *** ***July-September 647.37 39,538 *** *** ***October-December 623.69 60,619 *** *** ***2014: January-March 664.61 48,822 564.63 11,037 15.0April-June 646.42 49,902 *** *** ***
1 Product 1: Industrial quality wire rod, grade C1006, 5.5 mm (7/32 inch) through 12 mm (15/32 inch) in diameter, for hangers, chain link fencing, collated nails and staples, grates, and other formed products (in green condition, e.g., NOT cleaned, coated, etc.). Source: Compiled from data submitted in response to Commission questionnaires.
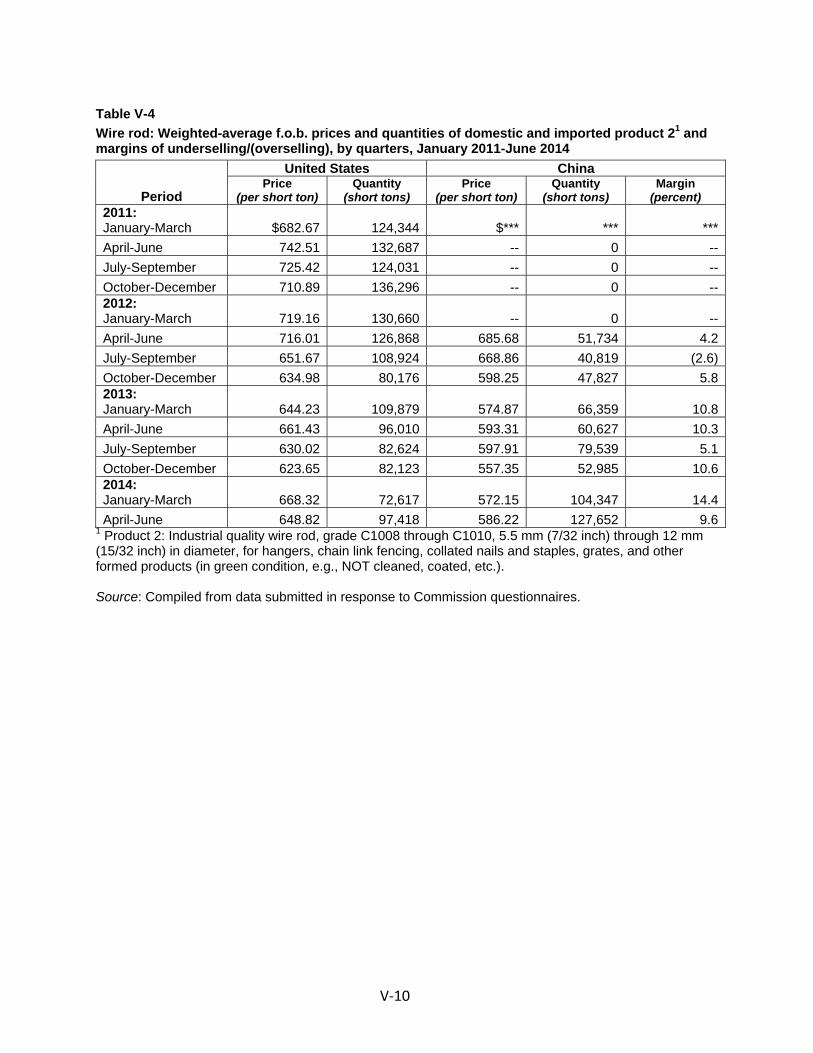
V‐10
Table V-4 Wire rod: Weighted-average f.o.b. prices and quantities of domestic and imported product 21 and margins of underselling/(overselling), by quarters, January 2011-June 2014
Period
United States China Price
(per short ton) Quantity
(short tons) Price
(per short ton) Quantity
(short tons) Margin
(percent) 2011: January-March $682.67 124,344 $*** *** ***April-June 742.51 132,687 -- 0 --July-September 725.42 124,031 -- 0 --October-December 710.89 136,296 -- 0 --2012: January-March 719.16 130,660 -- 0 --April-June 716.01 126,868 685.68 51,734 4.2July-September 651.67 108,924 668.86 40,819 (2.6)October-December 634.98 80,176 598.25 47,827 5.82013: January-March 644.23 109,879 574.87 66,359 10.8April-June 661.43 96,010 593.31 60,627 10.3July-September 630.02 82,624 597.91 79,539 5.1October-December 623.65 82,123 557.35 52,985 10.62014: January-March 668.32 72,617 572.15 104,347 14.4April-June 648.82 97,418 586.22 127,652 9.6
1 Product 2: Industrial quality wire rod, grade C1008 through C1010, 5.5 mm (7/32 inch) through 12 mm (15/32 inch) in diameter, for hangers, chain link fencing, collated nails and staples, grates, and other formed products (in green condition, e.g., NOT cleaned, coated, etc.). Source: Compiled from data submitted in response to Commission questionnaires.
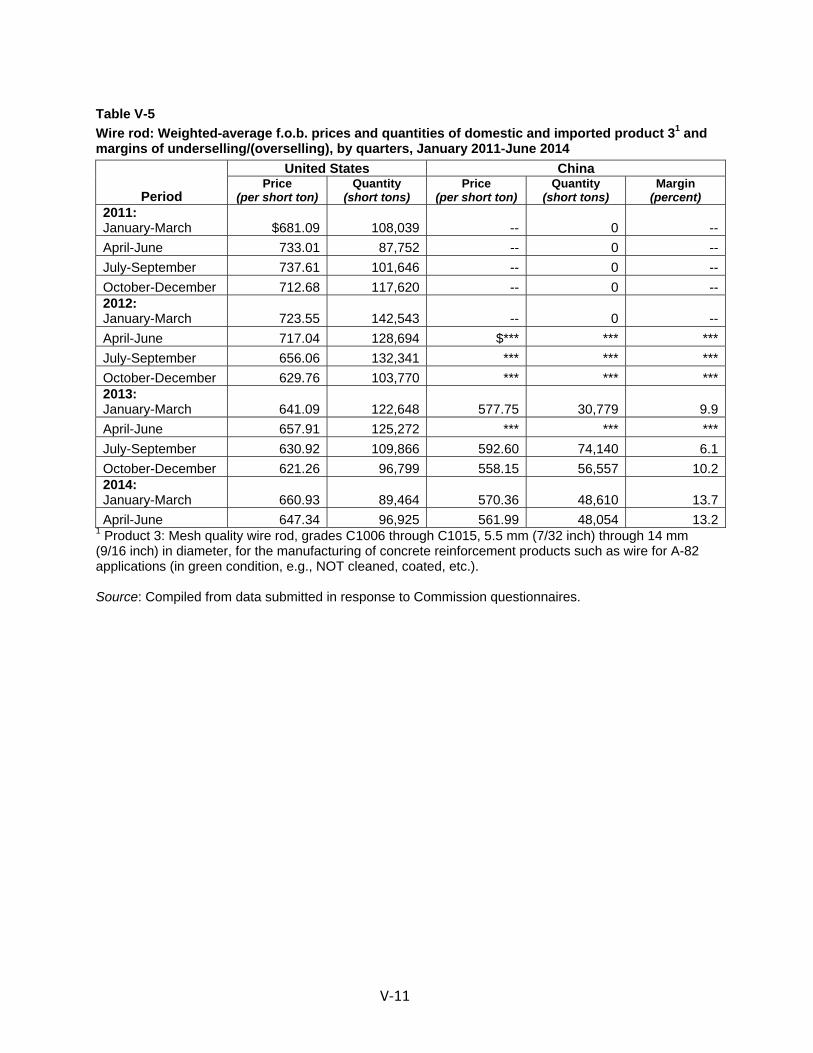
V‐11
Table V-5 Wire rod: Weighted-average f.o.b. prices and quantities of domestic and imported product 31 and margins of underselling/(overselling), by quarters, January 2011-June 2014
Period
United States China Price
(per short ton) Quantity
(short tons) Price
(per short ton) Quantity
(short tons) Margin
(percent) 2011: January-March $681.09 108,039 -- 0 --April-June 733.01 87,752 -- 0 --July-September 737.61 101,646 -- 0 --October-December 712.68 117,620 -- 0 --2012: January-March 723.55 142,543 -- 0 --April-June 717.04 128,694 $*** *** ***July-September 656.06 132,341 *** *** ***October-December 629.76 103,770 *** *** ***2013: January-March 641.09 122,648 577.75 30,779 9.9April-June 657.91 125,272 *** *** ***July-September 630.92 109,866 592.60 74,140 6.1October-December 621.26 96,799 558.15 56,557 10.22014: January-March 660.93 89,464 570.36 48,610 13.7April-June 647.34 96,925 561.99 48,054 13.2
1 Product 3: Mesh quality wire rod, grades C1006 through C1015, 5.5 mm (7/32 inch) through 14 mm (9/16 inch) in diameter, for the manufacturing of concrete reinforcement products such as wire for A-82 applications (in green condition, e.g., NOT cleaned, coated, etc.). Source: Compiled from data submitted in response to Commission questionnaires.
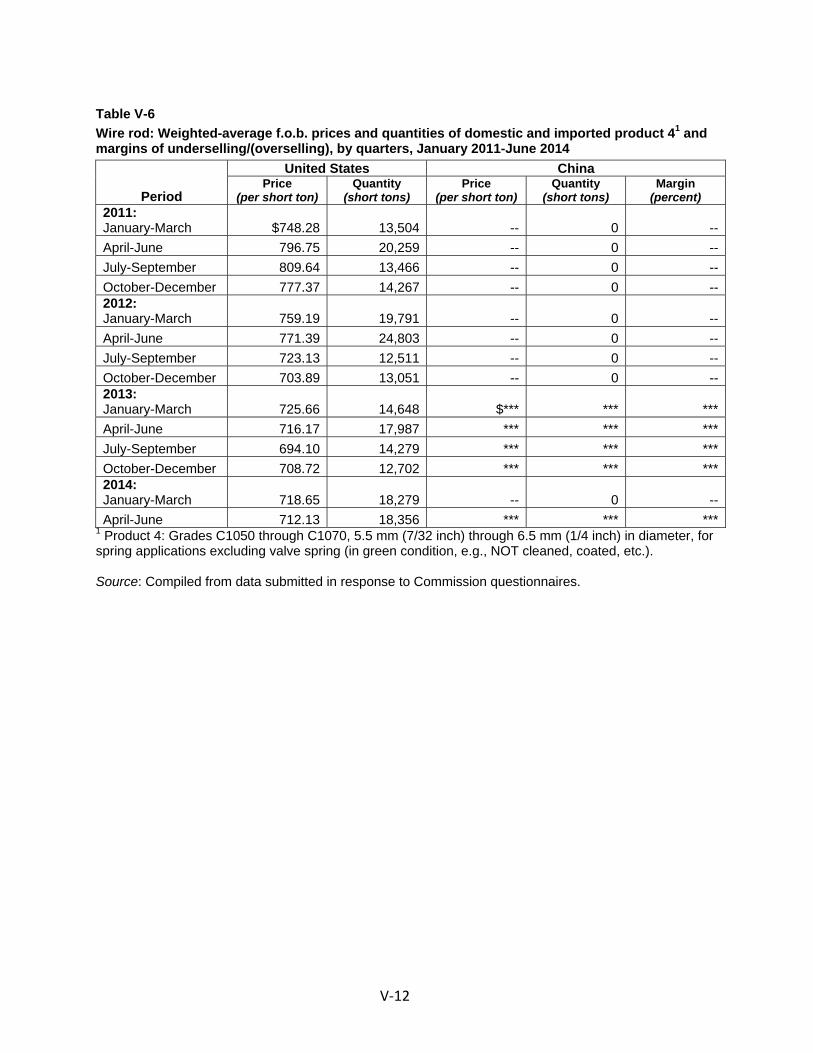
V‐12
Table V-6 Wire rod: Weighted-average f.o.b. prices and quantities of domestic and imported product 41 and margins of underselling/(overselling), by quarters, January 2011-June 2014
Period
United States China Price
(per short ton) Quantity
(short tons) Price
(per short ton) Quantity
(short tons) Margin
(percent) 2011: January-March $748.28 13,504 -- 0 --April-June 796.75 20,259 -- 0 --July-September 809.64 13,466 -- 0 --October-December 777.37 14,267 -- 0 --2012: January-March 759.19 19,791 -- 0 --April-June 771.39 24,803 -- 0 --July-September 723.13 12,511 -- 0 --October-December 703.89 13,051 -- 0 --2013: January-March 725.66 14,648 $*** *** ***April-June 716.17 17,987 *** *** ***July-September 694.10 14,279 *** *** ***October-December 708.72 12,702 *** *** ***2014: January-March 718.65 18,279 -- 0 --April-June 712.13 18,356 *** *** ***
1 Product 4: Grades C1050 through C1070, 5.5 mm (7/32 inch) through 6.5 mm (1/4 inch) in diameter, for spring applications excluding valve spring (in green condition, e.g., NOT cleaned, coated, etc.). Source: Compiled from data submitted in response to Commission questionnaires.
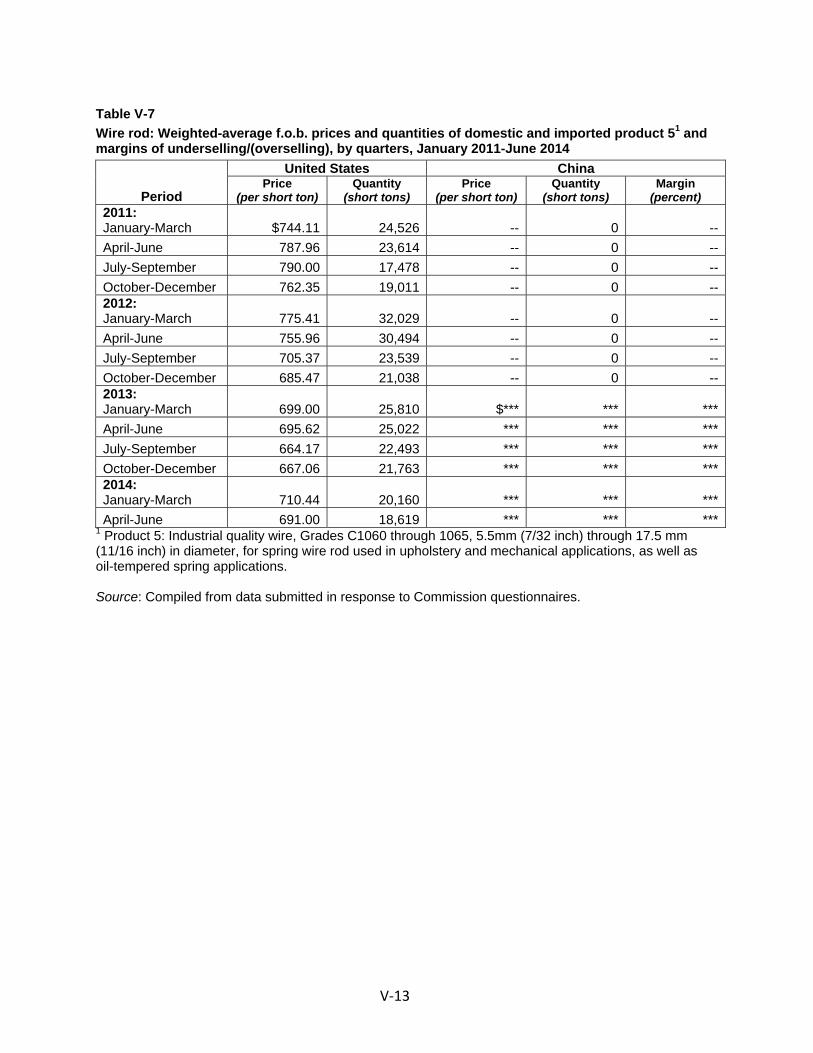
V‐13
Table V-7 Wire rod: Weighted-average f.o.b. prices and quantities of domestic and imported product 51 and margins of underselling/(overselling), by quarters, January 2011-June 2014
Period
United States China Price
(per short ton) Quantity
(short tons) Price
(per short ton) Quantity
(short tons) Margin
(percent) 2011: January-March $744.11 24,526 -- 0 --April-June 787.96 23,614 -- 0 --July-September 790.00 17,478 -- 0 --October-December 762.35 19,011 -- 0 --2012: January-March 775.41 32,029 -- 0 --April-June 755.96 30,494 -- 0 --July-September 705.37 23,539 -- 0 --October-December 685.47 21,038 -- 0 --2013: January-March 699.00 25,810 $*** *** ***April-June 695.62 25,022 *** *** ***July-September 664.17 22,493 *** *** ***October-December 667.06 21,763 *** *** ***2014: January-March 710.44 20,160 *** *** ***April-June 691.00 18,619 *** *** ***
1 Product 5: Industrial quality wire, Grades C1060 through 1065, 5.5mm (7/32 inch) through 17.5 mm (11/16 inch) in diameter, for spring wire rod used in upholstery and mechanical applications, as well as oil-tempered spring applications. Source: Compiled from data submitted in response to Commission questionnaires.

V‐14
Figure V-3 Wire rod: Weighted-average prices and quantities of domestic and imported product 1,1 by quarters, January 2011-June 2014
* * * * * * *
1 Product 1: Industrial quality wire rod, grade C1006, 5.5 mm (7/32 inch) through 12 mm (15/32 inch) in diameter, for hangers, chain link fencing, collated nails and staples, grates, and other formed products (in green condition, e.g., NOT cleaned, coated, etc.). Source: Compiled from data submitted in response to Commission questionnaires.

V‐15
Figure V-4 Wire rod: Weighted-average prices and quantities of domestic and imported product 2,1 by quarters, January 2011-June 2014
* * * * * * *
1 Product 2: Industrial quality wire rod, grade C1008 through C1010, 5.5 mm (7/32 inch) through 12 mm (15/32 inch) in diameter, for hangers, chain link fencing, collated nails and staples, grates, and other formed products (in green condition, e.g., NOT cleaned, coated, etc.). Source: Compiled from data submitted in response to Commission questionnaires.

V‐16
Figure V-5 Wire rod: Weighted-average prices and quantities of domestic and imported product 3,1 by quarters, January 2011-June 2014
* * * * * * *
1 Product 3: Mesh quality wire rod, grades C1006 through C1015, 5.5 mm (7/32 inch) through 14 mm (9/16 inch) in diameter, for the manufacturing of concrete reinforcement products such as wire for A-82 applications (in green condition, e.g., NOT cleaned, coated, etc.). Source: Compiled from data submitted in response to Commission questionnaires.
V‐17
Figure V-6 Wire rod: Weighted-average prices and quantities of domestic and imported product 4,1 by quarters, January 2011-June 2014
* * * * * * *
1 Product 4: Grades C1050 through C1070, 5.5 mm (7/32 inch) through 6.5 mm (1/4 inch) in diameter, for spring applications excluding valve spring (in green condition, e.g., NOT cleaned, coated, etc.). Source: Compiled from data submitted in response to Commission questionnaires.
V‐18
Figure V-7 Wire rod: Weighted-average prices and quantities of domestic and imported product 5,1 by quarters, January 2011-June 2014
* * * * * * *
1 Product 5: Industrial quality wire, Grades C1060 through 1065, 5.5mm (7/32 inch) through 17.5 mm (11/16 inch) in diameter, for spring wire rod used in upholstery and mechanical applications, as well as oil-tempered spring applications. Source: Compiled from data submitted in response to Commission questionnaires.
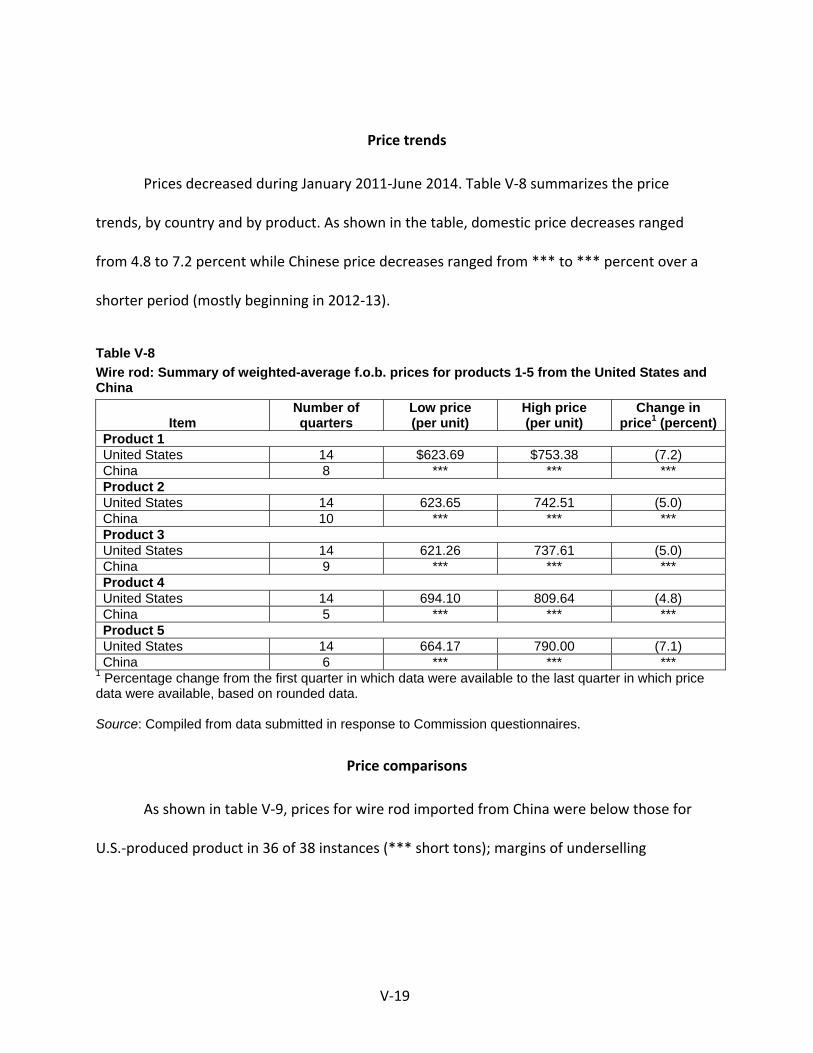
V‐19
Price trends
Prices decreased during January 2011‐June 2014. Table V‐8 summarizes the price
trends, by country and by product. As shown in the table, domestic price decreases ranged
from 4.8 to 7.2 percent while Chinese price decreases ranged from *** to *** percent over a
shorter period (mostly beginning in 2012‐13).
Table V-8 Wire rod: Summary of weighted-average f.o.b. prices for products 1-5 from the United States and China
Item Number of quarters
Low price (per unit)
High price (per unit)
Change in price1 (percent)
Product 1 United States 14 $623.69 $753.38 (7.2) China 8 *** *** *** Product 2 United States 14 623.65 742.51 (5.0) China 10 *** *** *** Product 3 United States 14 621.26 737.61 (5.0) China 9 *** *** *** Product 4 United States 14 694.10 809.64 (4.8) China 5 *** *** *** Product 5 United States 14 664.17 790.00 (7.1) China 6 *** *** ***
1 Percentage change from the first quarter in which data were available to the last quarter in which price data were available, based on rounded data. Source: Compiled from data submitted in response to Commission questionnaires.
Price comparisons
As shown in table V‐9, prices for wire rod imported from China were below those for
U.S.‐produced product in 36 of 38 instances (*** short tons); margins of underselling
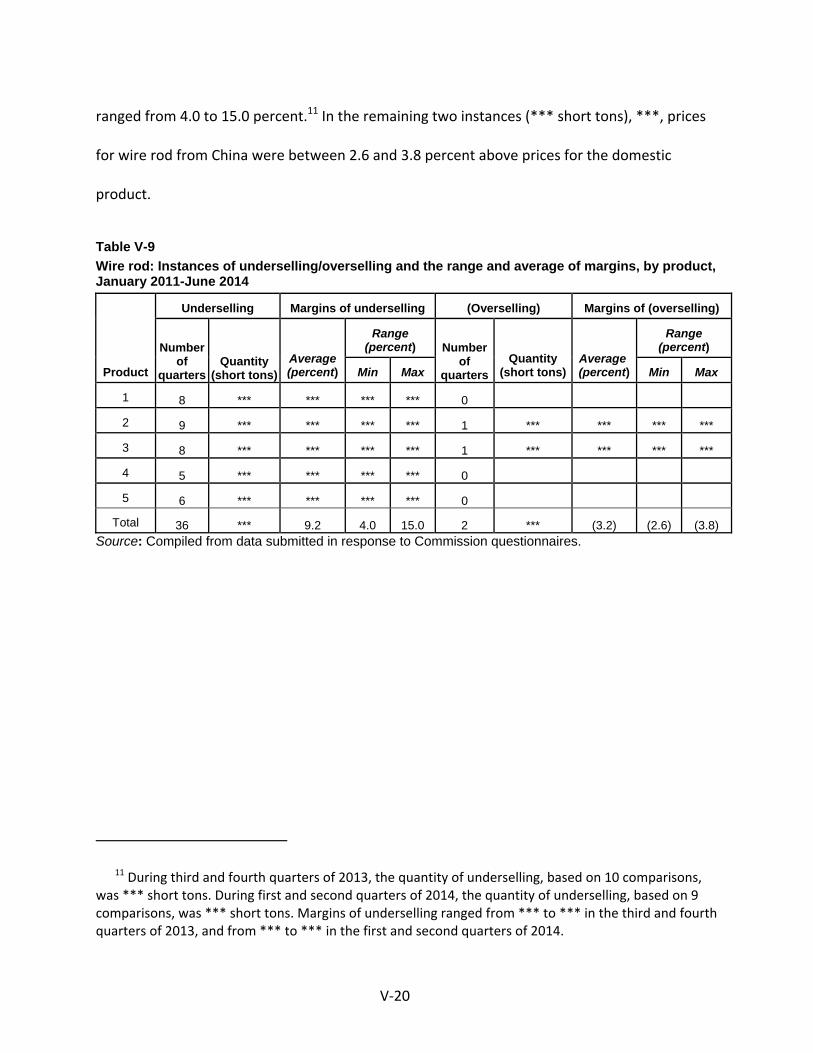
V‐20
ranged from 4.0 to 15.0 percent.11 In the remaining two instances (*** short tons), ***, prices
for wire rod from China were between 2.6 and 3.8 percent above prices for the domestic
product.
Table V-9 Wire rod: Instances of underselling/overselling and the range and average of margins, by product, January 2011-June 2014
Product
Underselling Margins of underselling (Overselling) Margins of (overselling)
Number of
quarters Quantity
(short tons) Average (percent)
Range (percent) Number
of quarters
Quantity (short tons)
Average (percent)
Range (percent)
Min Max Min Max
1 8 *** *** *** *** 0
2 9 *** *** *** *** 1 *** *** *** ***
3 8 *** *** *** *** 1 *** *** *** ***
4 5 *** *** *** *** 0
5 6 *** *** *** *** 0
Total 36 *** 9.2 4.0 15.0 2 *** (3.2) (2.6) (3.8) Source: Compiled from data submitted in response to Commission questionnaires.
11 During third and fourth quarters of 2013, the quantity of underselling, based on 10 comparisons, was *** short tons. During first and second quarters of 2014, the quantity of underselling, based on 9 comparisons, was *** short tons. Margins of underselling ranged from *** to *** in the third and fourth quarters of 2013, and from *** to *** in the first and second quarters of 2014.
V‐21
LOST SALES AND LOST REVENUE
The Commission requested U.S. producers of wire rod to report any instances of lost
sales or revenue they experienced due to competition from imports of wire rod from China
since January 1, 2011. Of the 10 responding U.S. producers, eight reported that they had to
either reduce prices or roll back announced price increases. The 102 lost sales allegations
totaled $208 million and involved 313,897 short tons of wire rod12 and the 17 lost revenue
allegations totaled $2.7 million and involved 64,121 short tons of wire rod.13 Staff contacted
purchasers named in the allegations and a summary of the information obtained is presented in
tables V‐10 and V‐11.
Purchasers responding to the lost sales allegations also were asked whether they shifted
their purchases of wire rod from U.S. producers to suppliers of wire rod from China since
January 1, 2011. In addition, they were asked whether U.S. producers reduced their prices in
order to compete with suppliers of wire rod from China. Eight of the 13 responding purchasers
reported that they had not shifted purchases of wire rod from U.S. producers to subject imports
since January 1, 2011. All five purchasers that reported shifting purchases from U.S. suppliers to
suppliers of Chinese wire rod, reported that price was the reason for the shift.14 A slight
12 As noted in table V‐10, some lost sales allegations contained ranges for the alleged quantity or the alleged rejected U.S. quote value. Staff used the lower end of the range for calculations. If no price was reported in the allegation, the value was not estimated.
13 Petitioners provided one lost revenue allegation involving a sale that occurred prior to 2011. This allegation, dated ***, involved *** short tons of wire rod and totaled $*** in lost revenue. This allegation was not sent to the purchaser for verification and is not included in table V‐11.
14 One purchaser, ***, also reported shifting purchases due to availability of material.
V‐22
majority of responding purchasers (6 of 11)15 reported that the U.S. producers had not reduced
their prices in order to compete with the prices of subject imports since January 1, 2011.
Purchaser *** reported that U.S. producers have lowered their prices, but are still unable to
compete with low‐priced Chinese imports; and one purchaser, ***, reported that U.S.
producers ***.16
15 Purchaser *** clarified that U.S. producers had only reduced their prices by a very small degree, and only if the purchaser informed the U.S. producer of available pricing. ***.
16 Purchaser ***.

V‐23
Table V-10 Wire rod: U.S. producers’ lost sales allegations
* * * * * * *
Table continued.

V‐24
Table V-10 --Continued Wire rod: U.S. producers’ lost sales allegations
* * * * * * *
Table continued.

V‐25
Table V-10 --Continued Wire rod: U.S. producers’ lost sales allegations
* * * * * * *
Table continued.

V‐26
Table V-10 --Continued Wire rod: U.S. producers’ lost sales allegations
* * * * * * *
Table continued.
V‐27
Table V-10 --Continued Wire rod: U.S. producers’ lost sales allegations
* * * * * * *
Table continued.

V‐28
Table V-10 --Continued Wire rod: U.S. producers’ lost sales allegations
* * * * * * *
Table continued.

V‐29
Table V-10 --Continued Wire rod: U.S. producers’ lost sales allegations
* * * * * * *
Table continued.
V‐30
Table V-10 --Continued Wire rod: U.S. producers’ lost sales allegations
* * * * * * *
1 This column in not a staff assessment of whether the purchaser comments agree or disagree; rather, it is only reporting whether the purchaser wrote agree or disagree and comments on the allegations. 2 Data not reported. Note.-- A range was provided for the quantity or rejected U.S. quote value in some allegations. Staff used the lower end of the range for calculations. If no price was reported in the allegation, the value was not estimated. Source: Compiled from data submitted in response to Commission questionnaires.

V‐31
Table V-11 Wire rod: U.S. producers’ lost revenue allegations
* * * * * * *
Table continued.
V‐32
Table V-11 --Continued Wire rod: U.S. producers’ lost revenue allegations
* * * * * * *
1 This column in not a staff assessment of whether the purchaser comments agree or disagree; rather, it is only reporting whether the purchaser wrote agree or disagree and comments on the allegations. Source: Compiled from data submitted in response to Commission questionnaires.

V‐33
Additional information from lost sales and lost revenue responses
***
***.
***
***

V‐34
***.
***
***.
PART VI: FINANCIAL EXPERIENCE OF U.S. PRODUCERS
BACKGROUND
Ten U.S. producers provided financial data for their total operations on wire rod as well
as their merchant market operations on wire rod.1 *** firms reported internal consumption of
wire rod to produce wire and wire products and *** firms reported transfers of wire rod to
affiliates for the production of wire and wire products.2 The questionnaire responses are
believed to account for all known sales by U.S. producers of wire rod. Differences in average
unit values of sales and costs are largely attributable to differences in product mix between
firms.
***, each of the reporting firms produces other products in their facilities that make
wire rod, including rebar and other bar and rod products. Wire rod accounted for a declining
share of overall production, decreasing from 66.9 percent in 2011 and 66.0 percent in 2012 to
58.8 percent in 2013 and 57.3 percent in January-June 2014.3 Several of the reporting firms also
produce downstream wire and wire products either in the same facilities or in affiliated
facilities.
1 These firms are: ArcelorMittal; Cascade ***; Charter; Evraz; Gerdau; Keystone; Mid American ***; Nucor; Republic; and Sterling. Unless otherwise noted, each has a fiscal year that ends on or about December 31. Each of the firms reported U.S. commercial shipments and exports (presented in Part III of this report) that were the same as their merchant market sales. Very small differences between the data reported in the trade and financial sections of the Commission’s questionnaire are due to rounding.
2 Reporting firms described their transfers as being at fair market value. 3 See table III-4. ***. Each of the other firms reported that they produced rebar, (*** in 2013), as well
as “other bar and rod” (led by *** in 2013). Overall, it should also be noted that most of the reporting firms produce a broad range of long products in their facilities and wire rod represents a small fraction of these firms’ total operations.
VI-1
OPERATIONS ON WIRE ROD
Table VI-1 presents aggregated data on U.S. producers’ total operations while table VI-2
presents their merchant market operations only in relation to wire rod. Table VI-3 presents U.S.
producers’ total operations on wire rod on a firm-by-firm basis.4 In general, total net sales,
costs, operating income, net income, and cash flows fell steadily in dollar terms between 2011
and 2013. As a ratio to sales, cost of goods sold (“COGS”) increased as did selling, general and
administrative (“SG&A”) expenses while operating income declined. On a per-unit basis, sales,
COGS, and operating income declined between 2011 and 2013. The industry’s operating
income fell from 2011 to 2013 and the number of firms reporting operating losses increased.
Net income before taxes and cash flows also fell during 2011-13. The changes and trends in
financial indicators for the industry’s merchant market shipments (table VI-2) followed a similar
pattern.
4 Appendix table E-1 presents financial information on merchant market operations on a firm-by-firm basis.
VI-2
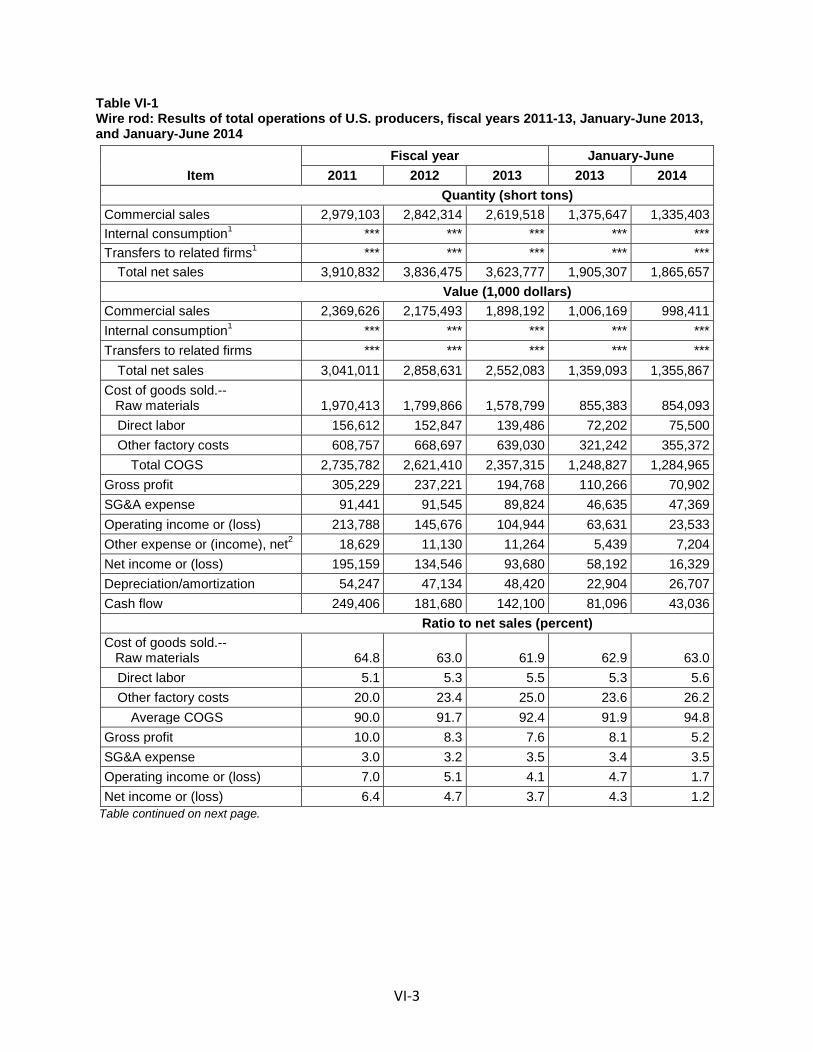
Table VI-1 Wire rod: Results of total operations of U.S. producers, fiscal years 2011-13, January-June 2013, and January-June 2014
Item Fiscal year January-June
2011 2012 2013 2013 2014 Quantity (short tons) Commercial sales 2,979,103 2,842,314 2,619,518 1,375,647 1,335,403 Internal consumption1 *** *** *** *** *** Transfers to related firms1 *** *** *** *** ***
Total net sales 3,910,832 3,836,475 3,623,777 1,905,307 1,865,657 Value (1,000 dollars) Commercial sales 2,369,626 2,175,493 1,898,192 1,006,169 998,411 Internal consumption1 *** *** *** *** *** Transfers to related firms *** *** *** *** ***
Total net sales 3,041,011 2,858,631 2,552,083 1,359,093 1,355,867 Cost of goods sold.-- Raw materials 1,970,413 1,799,866 1,578,799 855,383 854,093
Direct labor 156,612 152,847 139,486 72,202 75,500 Other factory costs 608,757 668,697 639,030 321,242 355,372
Total COGS 2,735,782 2,621,410 2,357,315 1,248,827 1,284,965 Gross profit 305,229 237,221 194,768 110,266 70,902 SG&A expense 91,441 91,545 89,824 46,635 47,369 Operating income or (loss) 213,788 145,676 104,944 63,631 23,533 Other expense or (income), net2 18,629 11,130 11,264 5,439 7,204 Net income or (loss) 195,159 134,546 93,680 58,192 16,329 Depreciation/amortization 54,247 47,134 48,420 22,904 26,707 Cash flow 249,406 181,680 142,100 81,096 43,036 Ratio to net sales (percent) Cost of goods sold.-- Raw materials 64.8 63.0 61.9 62.9 63.0
Direct labor 5.1 5.3 5.5 5.3 5.6 Other factory costs 20.0 23.4 25.0 23.6 26.2
Average COGS 90.0 91.7 92.4 91.9 94.8 Gross profit 10.0 8.3 7.6 8.1 5.2 SG&A expense 3.0 3.2 3.5 3.4 3.5 Operating income or (loss) 7.0 5.1 4.1 4.7 1.7 Net income or (loss) 6.4 4.7 3.7 4.3 1.2
Table continued on next page.
VI-3
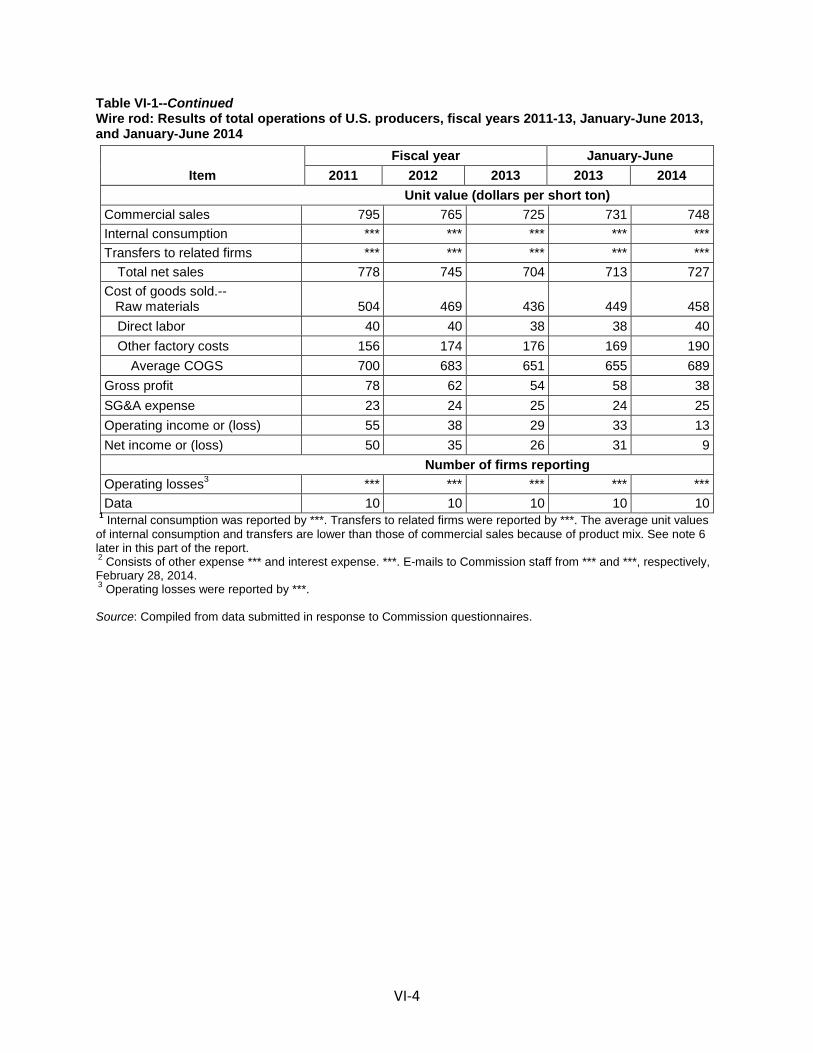
Table VI-1--Continued Wire rod: Results of total operations of U.S. producers, fiscal years 2011-13, January-June 2013, and January-June 2014
Item Fiscal year January-June
2011 2012 2013 2013 2014 Unit value (dollars per short ton)
Commercial sales 795 765 725 731 748 Internal consumption *** *** *** *** *** Transfers to related firms *** *** *** *** ***
Total net sales 778 745 704 713 727 Cost of goods sold.-- Raw materials 504 469 436 449 458
Direct labor 40 40 38 38 40 Other factory costs 156 174 176 169 190
Average COGS 700 683 651 655 689 Gross profit 78 62 54 58 38 SG&A expense 23 24 25 24 25 Operating income or (loss) 55 38 29 33 13 Net income or (loss) 50 35 26 31 9 Number of firms reporting Operating losses3 *** *** *** *** *** Data 10 10 10 10 10
1 Internal consumption was reported by ***. Transfers to related firms were reported by ***. The average unit values of internal consumption and transfers are lower than those of commercial sales because of product mix. See note 6 later in this part of the report. 2 Consists of other expense *** and interest expense. ***. E-mails to Commission staff from *** and ***, respectively, February 28, 2014. 3 Operating losses were reported by ***. Source: Compiled from data submitted in response to Commission questionnaires.
VI-4
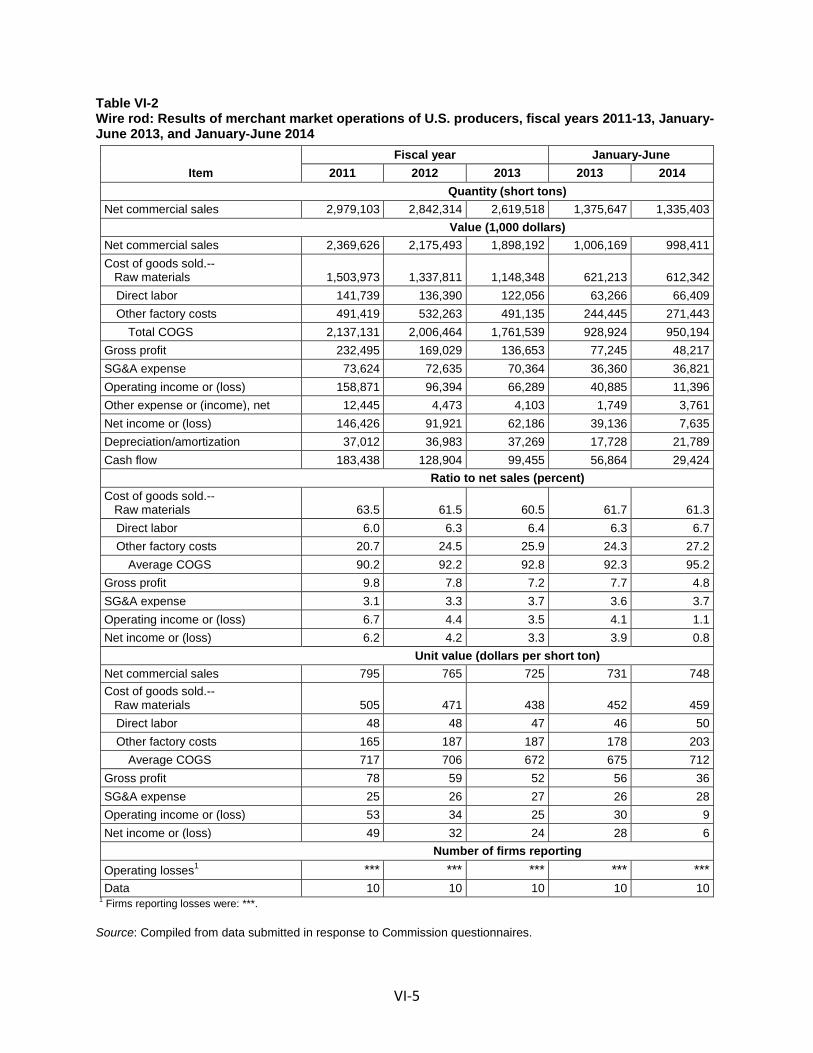
Table VI-2 Wire rod: Results of merchant market operations of U.S. producers, fiscal years 2011-13, January-June 2013, and January-June 2014
Item Fiscal year January-June
2011 2012 2013 2013 2014 Quantity (short tons) Net commercial sales 2,979,103 2,842,314 2,619,518 1,375,647 1,335,403 Value (1,000 dollars) Net commercial sales 2,369,626 2,175,493 1,898,192 1,006,169 998,411 Cost of goods sold.-- Raw materials 1,503,973 1,337,811 1,148,348 621,213 612,342
Direct labor 141,739 136,390 122,056 63,266 66,409 Other factory costs 491,419 532,263 491,135 244,445 271,443
Total COGS 2,137,131 2,006,464 1,761,539 928,924 950,194 Gross profit 232,495 169,029 136,653 77,245 48,217 SG&A expense 73,624 72,635 70,364 36,360 36,821 Operating income or (loss) 158,871 96,394 66,289 40,885 11,396 Other expense or (income), net 12,445 4,473 4,103 1,749 3,761 Net income or (loss) 146,426 91,921 62,186 39,136 7,635 Depreciation/amortization 37,012 36,983 37,269 17,728 21,789 Cash flow 183,438 128,904 99,455 56,864 29,424 Ratio to net sales (percent) Cost of goods sold.-- Raw materials 63.5 61.5 60.5 61.7 61.3
Direct labor 6.0 6.3 6.4 6.3 6.7 Other factory costs 20.7 24.5 25.9 24.3 27.2
Average COGS 90.2 92.2 92.8 92.3 95.2 Gross profit 9.8 7.8 7.2 7.7 4.8 SG&A expense 3.1 3.3 3.7 3.6 3.7 Operating income or (loss) 6.7 4.4 3.5 4.1 1.1 Net income or (loss) 6.2 4.2 3.3 3.9 0.8
Unit value (dollars per short ton) Net commercial sales 795 765 725 731 748 Cost of goods sold.-- Raw materials 505 471 438 452 459
Direct labor 48 48 47 46 50 Other factory costs 165 187 187 178 203
Average COGS 717 706 672 675 712 Gross profit 78 59 52 56 36 SG&A expense 25 26 27 26 28 Operating income or (loss) 53 34 25 30 9 Net income or (loss) 49 32 24 28 6 Number of firms reporting Operating losses1 *** *** *** *** *** Data 10 10 10 10 10
1 Firms reporting losses were: ***. Source: Compiled from data submitted in response to Commission questionnaires.
VI-5
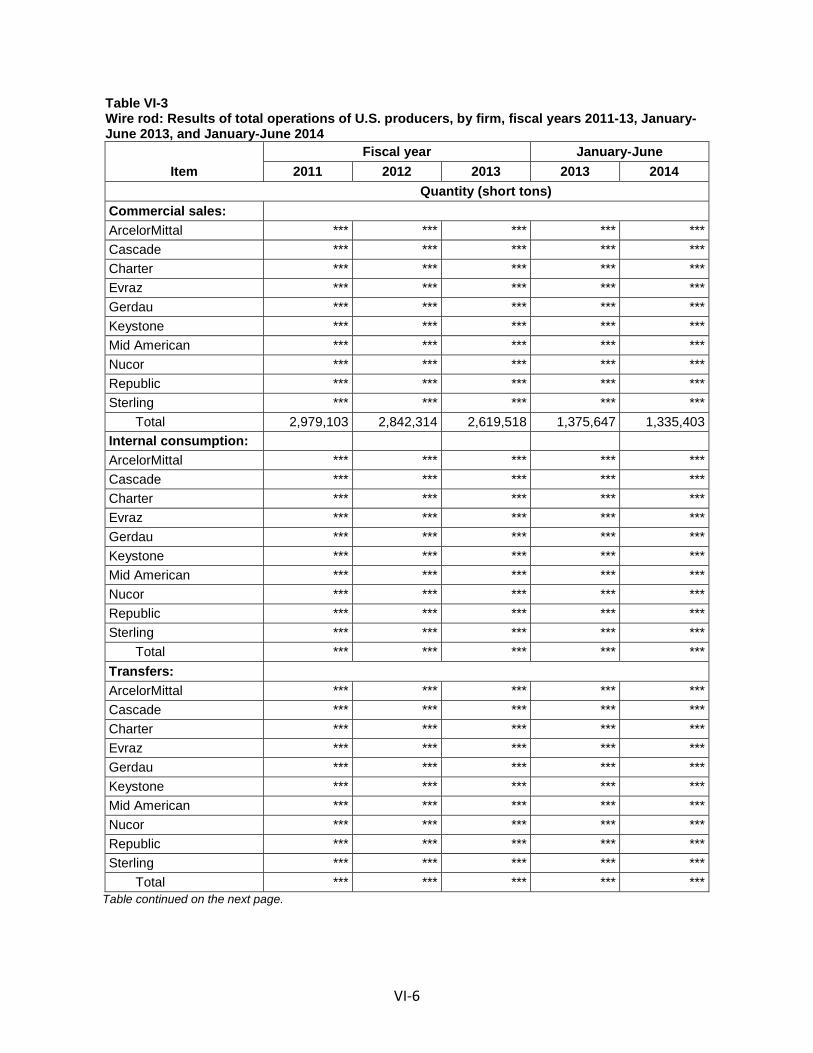
Table VI-3 Wire rod: Results of total operations of U.S. producers, by firm, fiscal years 2011-13, January-June 2013, and January-June 2014
Item Fiscal year January-June
2011 2012 2013 2013 2014 Quantity (short tons) Commercial sales: ArcelorMittal *** *** *** *** *** Cascade *** *** *** *** *** Charter *** *** *** *** *** Evraz *** *** *** *** *** Gerdau *** *** *** *** *** Keystone *** *** *** *** *** Mid American *** *** *** *** *** Nucor *** *** *** *** *** Republic *** *** *** *** *** Sterling *** *** *** *** ***
Total 2,979,103 2,842,314 2,619,518 1,375,647 1,335,403 Internal consumption: ArcelorMittal *** *** *** *** *** Cascade *** *** *** *** *** Charter *** *** *** *** *** Evraz *** *** *** *** *** Gerdau *** *** *** *** *** Keystone *** *** *** *** *** Mid American *** *** *** *** *** Nucor *** *** *** *** *** Republic *** *** *** *** *** Sterling *** *** *** *** ***
Total *** *** *** *** *** Transfers: ArcelorMittal *** *** *** *** *** Cascade *** *** *** *** *** Charter *** *** *** *** *** Evraz *** *** *** *** *** Gerdau *** *** *** *** *** Keystone *** *** *** *** *** Mid American *** *** *** *** *** Nucor *** *** *** *** *** Republic *** *** *** *** *** Sterling *** *** *** *** ***
Total *** *** *** *** *** Table continued on the next page.
VI-6
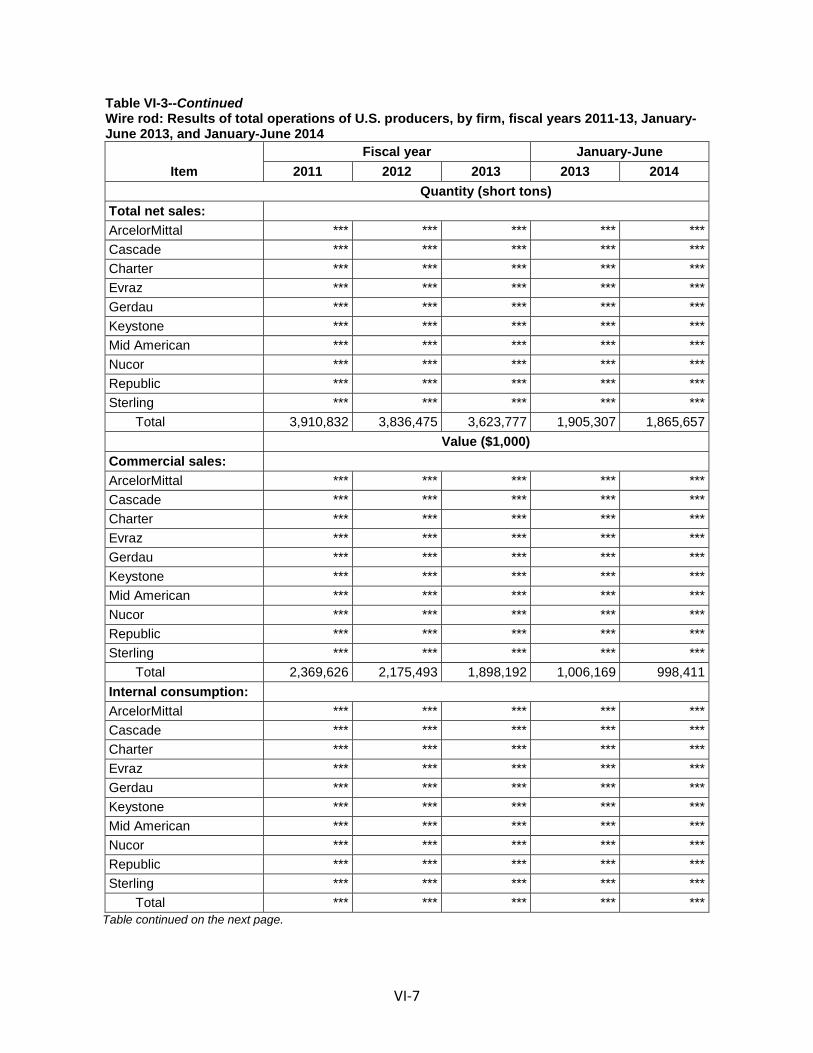
Table VI-3--Continued Wire rod: Results of total operations of U.S. producers, by firm, fiscal years 2011-13, January-June 2013, and January-June 2014
Item Fiscal year January-June
2011 2012 2013 2013 2014 Quantity (short tons) Total net sales: ArcelorMittal *** *** *** *** *** Cascade *** *** *** *** *** Charter *** *** *** *** *** Evraz *** *** *** *** *** Gerdau *** *** *** *** *** Keystone *** *** *** *** *** Mid American *** *** *** *** *** Nucor *** *** *** *** *** Republic *** *** *** *** *** Sterling *** *** *** *** ***
Total 3,910,832 3,836,475 3,623,777 1,905,307 1,865,657 Value ($1,000)
Commercial sales: ArcelorMittal *** *** *** *** *** Cascade *** *** *** *** *** Charter *** *** *** *** *** Evraz *** *** *** *** *** Gerdau *** *** *** *** *** Keystone *** *** *** *** *** Mid American *** *** *** *** *** Nucor *** *** *** *** *** Republic *** *** *** *** *** Sterling *** *** *** *** ***
Total 2,369,626 2,175,493 1,898,192 1,006,169 998,411 Internal consumption: ArcelorMittal *** *** *** *** *** Cascade *** *** *** *** *** Charter *** *** *** *** *** Evraz *** *** *** *** *** Gerdau *** *** *** *** *** Keystone *** *** *** *** *** Mid American *** *** *** *** *** Nucor *** *** *** *** *** Republic *** *** *** *** *** Sterling *** *** *** *** ***
Total *** *** *** *** *** Table continued on the next page.
VI-7
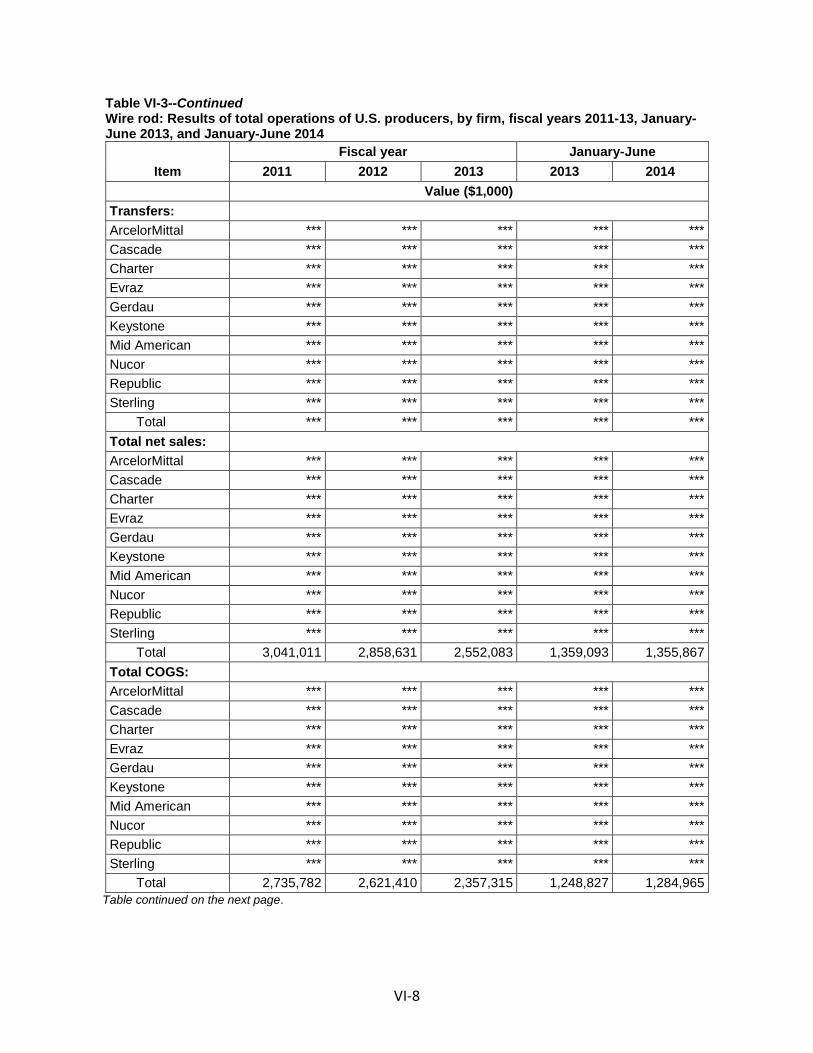
Table VI-3--Continued Wire rod: Results of total operations of U.S. producers, by firm, fiscal years 2011-13, January-June 2013, and January-June 2014
Item Fiscal year January-June
2011 2012 2013 2013 2014 Value ($1,000)
Transfers: ArcelorMittal *** *** *** *** *** Cascade *** *** *** *** *** Charter *** *** *** *** *** Evraz *** *** *** *** *** Gerdau *** *** *** *** *** Keystone *** *** *** *** *** Mid American *** *** *** *** *** Nucor *** *** *** *** *** Republic *** *** *** *** *** Sterling *** *** *** *** ***
Total *** *** *** *** *** Total net sales: ArcelorMittal *** *** *** *** *** Cascade *** *** *** *** *** Charter *** *** *** *** *** Evraz *** *** *** *** *** Gerdau *** *** *** *** *** Keystone *** *** *** *** *** Mid American *** *** *** *** *** Nucor *** *** *** *** *** Republic *** *** *** *** *** Sterling *** *** *** *** ***
Total 3,041,011 2,858,631 2,552,083 1,359,093 1,355,867 Total COGS: ArcelorMittal *** *** *** *** *** Cascade *** *** *** *** *** Charter *** *** *** *** *** Evraz *** *** *** *** *** Gerdau *** *** *** *** *** Keystone *** *** *** *** *** Mid American *** *** *** *** *** Nucor *** *** *** *** *** Republic *** *** *** *** *** Sterling *** *** *** *** ***
Total 2,735,782 2,621,410 2,357,315 1,248,827 1,284,965 Table continued on the next page.
VI-8
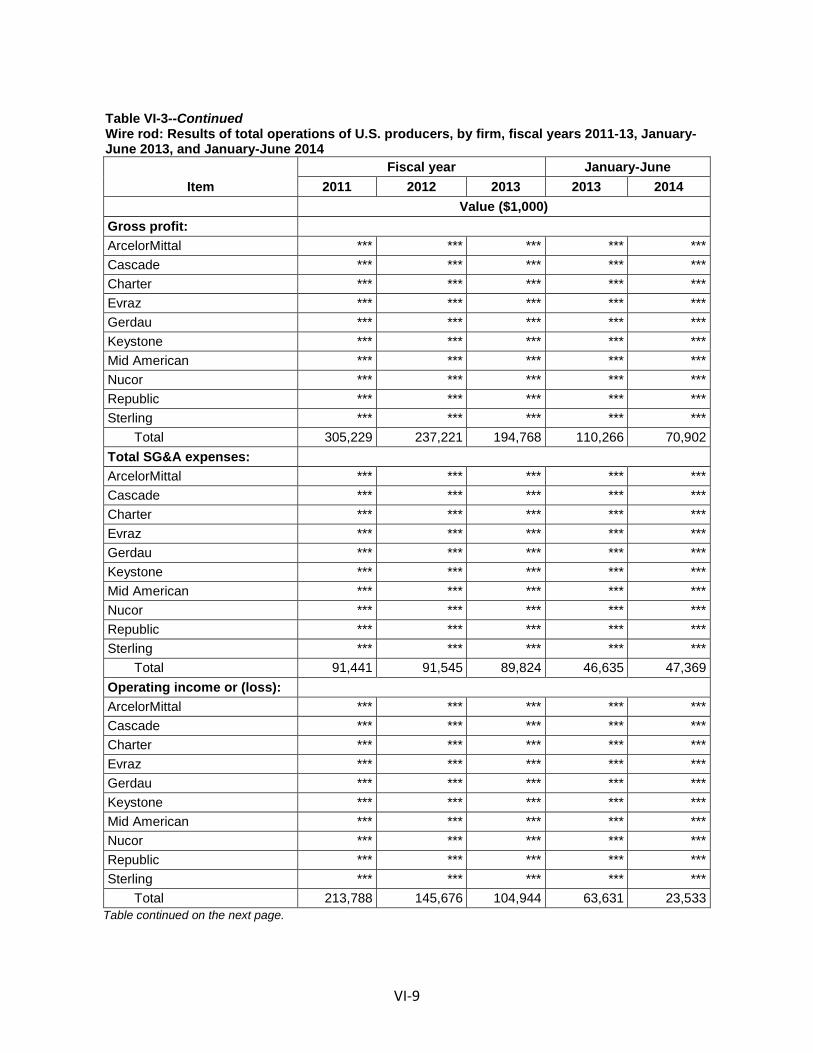
Table VI-3--Continued Wire rod: Results of total operations of U.S. producers, by firm, fiscal years 2011-13, January-June 2013, and January-June 2014
Item Fiscal year January-June
2011 2012 2013 2013 2014 Value ($1,000)
Gross profit: ArcelorMittal *** *** *** *** *** Cascade *** *** *** *** *** Charter *** *** *** *** *** Evraz *** *** *** *** *** Gerdau *** *** *** *** *** Keystone *** *** *** *** *** Mid American *** *** *** *** *** Nucor *** *** *** *** *** Republic *** *** *** *** *** Sterling *** *** *** *** ***
Total 305,229 237,221 194,768 110,266 70,902 Total SG&A expenses: ArcelorMittal *** *** *** *** *** Cascade *** *** *** *** *** Charter *** *** *** *** *** Evraz *** *** *** *** *** Gerdau *** *** *** *** *** Keystone *** *** *** *** *** Mid American *** *** *** *** *** Nucor *** *** *** *** *** Republic *** *** *** *** *** Sterling *** *** *** *** ***
Total 91,441 91,545 89,824 46,635 47,369 Operating income or (loss): ArcelorMittal *** *** *** *** *** Cascade *** *** *** *** *** Charter *** *** *** *** *** Evraz *** *** *** *** *** Gerdau *** *** *** *** *** Keystone *** *** *** *** *** Mid American *** *** *** *** *** Nucor *** *** *** *** *** Republic *** *** *** *** *** Sterling *** *** *** *** ***
Total 213,788 145,676 104,944 63,631 23,533 Table continued on the next page.
VI-9
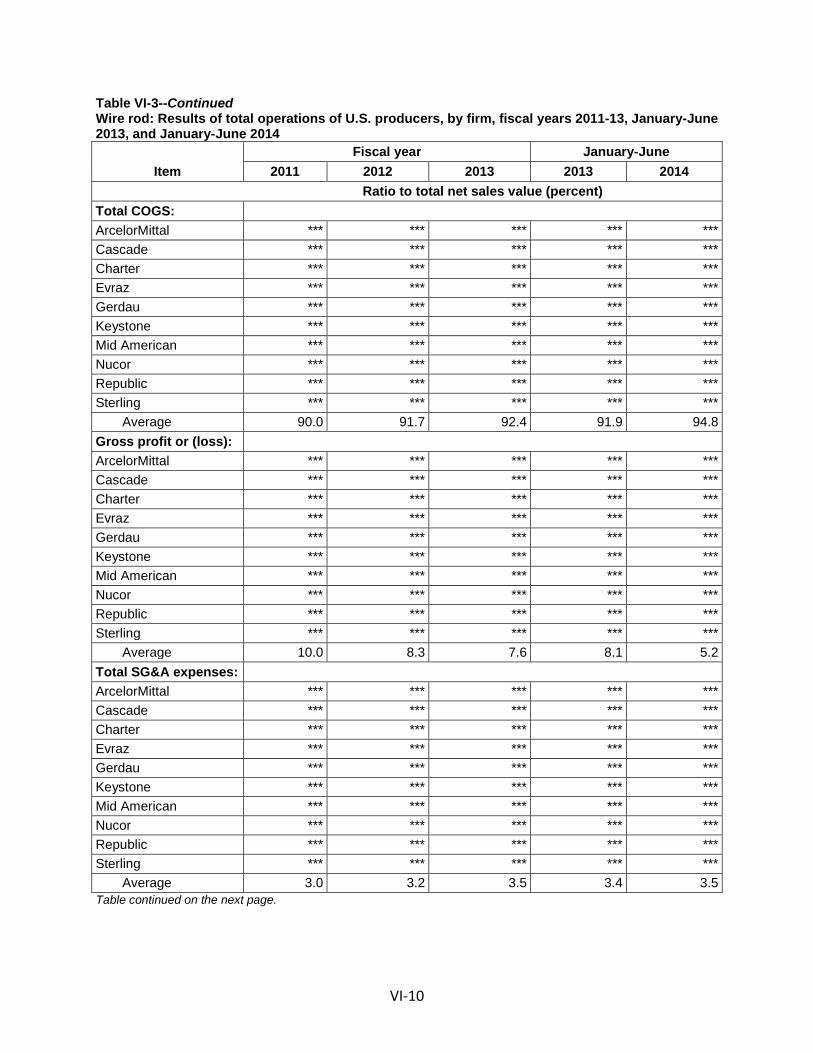
Table VI-3--Continued Wire rod: Results of total operations of U.S. producers, by firm, fiscal years 2011-13, January-June 2013, and January-June 2014
Item Fiscal year January-June
2011 2012 2013 2013 2014 Ratio to total net sales value (percent)
Total COGS: ArcelorMittal *** *** *** *** *** Cascade *** *** *** *** *** Charter *** *** *** *** *** Evraz *** *** *** *** *** Gerdau *** *** *** *** *** Keystone *** *** *** *** *** Mid American *** *** *** *** *** Nucor *** *** *** *** *** Republic *** *** *** *** *** Sterling *** *** *** *** ***
Average 90.0 91.7 92.4 91.9 94.8 Gross profit or (loss): ArcelorMittal *** *** *** *** *** Cascade *** *** *** *** *** Charter *** *** *** *** *** Evraz *** *** *** *** *** Gerdau *** *** *** *** *** Keystone *** *** *** *** *** Mid American *** *** *** *** *** Nucor *** *** *** *** *** Republic *** *** *** *** *** Sterling *** *** *** *** ***
Average 10.0 8.3 7.6 8.1 5.2 Total SG&A expenses: ArcelorMittal *** *** *** *** *** Cascade *** *** *** *** *** Charter *** *** *** *** *** Evraz *** *** *** *** *** Gerdau *** *** *** *** *** Keystone *** *** *** *** *** Mid American *** *** *** *** *** Nucor *** *** *** *** *** Republic *** *** *** *** *** Sterling *** *** *** *** ***
Average 3.0 3.2 3.5 3.4 3.5 Table continued on the next page.
VI-10
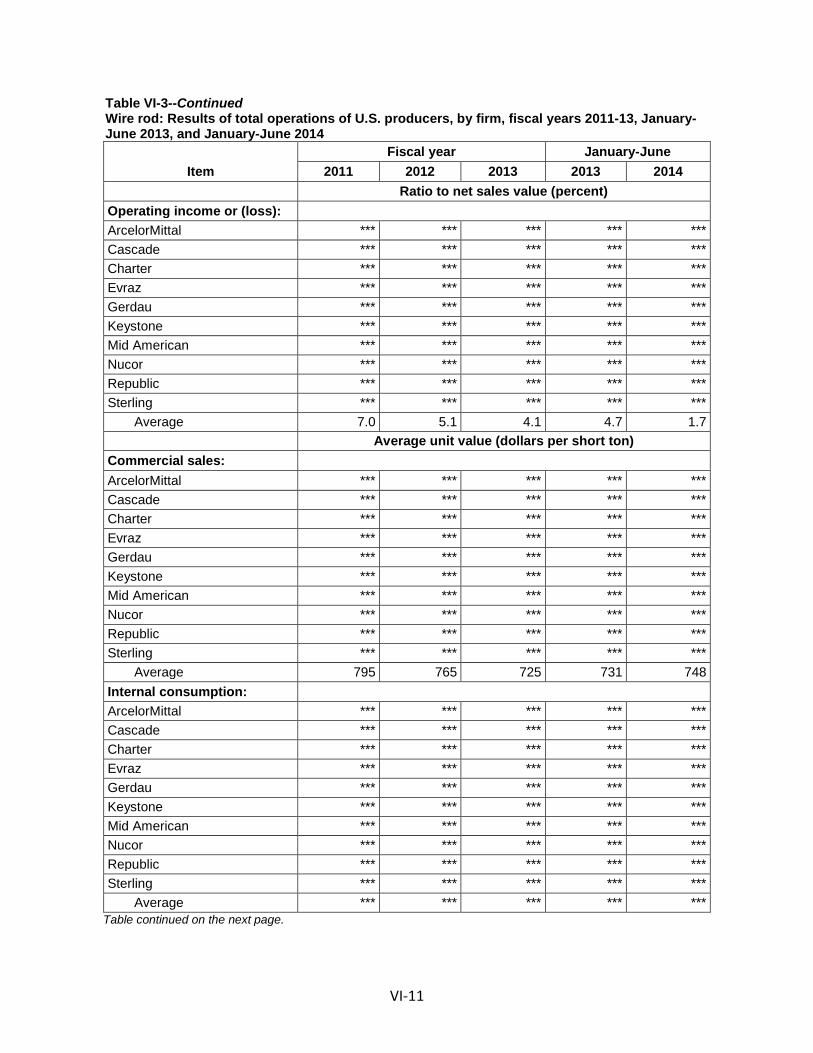
Table VI-3--Continued Wire rod: Results of total operations of U.S. producers, by firm, fiscal years 2011-13, January-June 2013, and January-June 2014
Item Fiscal year January-June
2011 2012 2013 2013 2014 Ratio to net sales value (percent)
Operating income or (loss): ArcelorMittal *** *** *** *** *** Cascade *** *** *** *** *** Charter *** *** *** *** *** Evraz *** *** *** *** *** Gerdau *** *** *** *** *** Keystone *** *** *** *** *** Mid American *** *** *** *** *** Nucor *** *** *** *** *** Republic *** *** *** *** *** Sterling *** *** *** *** ***
Average 7.0 5.1 4.1 4.7 1.7
Average unit value (dollars per short ton)
Commercial sales: ArcelorMittal *** *** *** *** *** Cascade *** *** *** *** *** Charter *** *** *** *** *** Evraz *** *** *** *** *** Gerdau *** *** *** *** *** Keystone *** *** *** *** *** Mid American *** *** *** *** *** Nucor *** *** *** *** *** Republic *** *** *** *** *** Sterling *** *** *** *** ***
Average 795 765 725 731 748 Internal consumption: ArcelorMittal *** *** *** *** *** Cascade *** *** *** *** *** Charter *** *** *** *** *** Evraz *** *** *** *** *** Gerdau *** *** *** *** *** Keystone *** *** *** *** *** Mid American *** *** *** *** *** Nucor *** *** *** *** *** Republic *** *** *** *** *** Sterling *** *** *** *** ***
Average *** *** *** *** *** Table continued on the next page.
VI-11
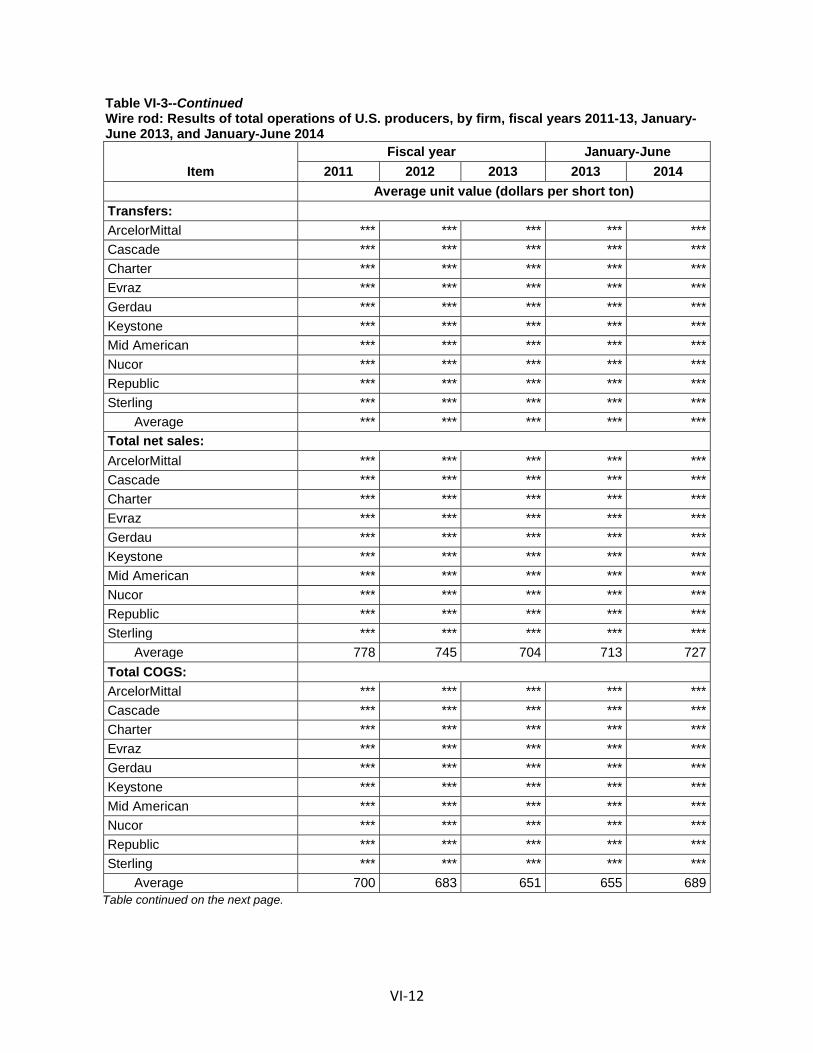
Table VI-3--Continued Wire rod: Results of total operations of U.S. producers, by firm, fiscal years 2011-13, January-June 2013, and January-June 2014
Item Fiscal year January-June
2011 2012 2013 2013 2014 Average unit value (dollars per short ton)
Transfers: ArcelorMittal *** *** *** *** *** Cascade *** *** *** *** *** Charter *** *** *** *** *** Evraz *** *** *** *** *** Gerdau *** *** *** *** *** Keystone *** *** *** *** *** Mid American *** *** *** *** *** Nucor *** *** *** *** *** Republic *** *** *** *** *** Sterling *** *** *** *** ***
Average *** *** *** *** *** Total net sales:
ArcelorMittal *** *** *** *** *** Cascade *** *** *** *** *** Charter *** *** *** *** *** Evraz *** *** *** *** *** Gerdau *** *** *** *** *** Keystone *** *** *** *** *** Mid American *** *** *** *** *** Nucor *** *** *** *** *** Republic *** *** *** *** *** Sterling *** *** *** *** ***
Average 778 745 704 713 727 Total COGS: ArcelorMittal *** *** *** *** *** Cascade *** *** *** *** *** Charter *** *** *** *** *** Evraz *** *** *** *** *** Gerdau *** *** *** *** *** Keystone *** *** *** *** *** Mid American *** *** *** *** *** Nucor *** *** *** *** *** Republic *** *** *** *** *** Sterling *** *** *** *** ***
Average 700 683 651 655 689 Table continued on the next page.
VI-12

Table VI-3--Continued Wire rod: Results of total operations of U.S. producers, by firm, fiscal years 2011-13, January-June 2013, and January-June 2014
Item Fiscal year January-June
2011 2012 2013 2013 2014
Unit value (dollars per short ton)
Gross profit or (loss): ArcelorMittal *** *** *** *** *** Cascade *** *** *** *** *** Charter *** *** *** *** *** Evraz *** *** *** *** *** Gerdau *** *** *** *** *** Keystone *** *** *** *** *** Mid American *** *** *** *** *** Nucor *** *** *** *** *** Republic *** *** *** *** *** Sterling *** *** *** *** ***
Average 78 62 54 58 38 Total SG&A expenses: ArcelorMittal *** *** *** *** *** Cascade *** *** *** *** *** Charter *** *** *** *** *** Evraz *** *** *** *** *** Gerdau *** *** *** *** *** Keystone *** *** *** *** *** Mid American *** *** *** *** *** Nucor *** *** *** *** *** Republic *** *** *** *** *** Sterling *** *** *** *** ***
Average 23 24 25 24 25 Operating income or (loss): ArcelorMittal *** *** *** *** *** Cascade *** *** *** *** *** Charter *** *** *** *** *** Evraz *** *** *** *** *** Gerdau *** *** *** *** *** Keystone *** *** *** *** *** Mid American *** *** *** *** *** Nucor *** *** *** *** *** Republic *** *** *** *** *** Sterling *** *** *** *** ***
Average 55 38 29 33 13 1 Not applicable or not meaningful.
Source: Compiled from data submitted in response to Commission questionnaires.
VI-13
Total net sales quantity and value
As shown in table VI-1, total net sales includes commercial sales, internal consumption,
and transfers to related firms. Total sales declined from 2011 to 2013 in terms of quantity,
value, and average unit value. The quantity reported for internal consumption and transfers
increased,5 comparing 2011 to 2013 (unlike that of commercial sales), but the sales value of
both categories was lower in 2013 compared with 2011 because of the lower average unit
values (down $74 per short ton overall between 2011 and 2013, and $14 per short ton higher in
interim 2014 than in interim 2013). Total merchant market sales likewise fell on a quantity,
value, and average unit value basis (down $70 per short ton) from 2011 to 2013. Both total
sales and merchant market sales were lower in January-June 2014 compared with January-June
2013 (a small increase in the average unit value of sales of $17 per short ton was outweighed
by the lower sales quantity).
Table VI-3 shows that most of the reporting U.S. producers reported lower commercial
sales quantities in 2013 compared to 2011 (the exceptions were ***). The quantity of reported
internal consumption by ***, comparing 2013 to 2011, while the value of internal consumption
***. The total quantity of transfers was greater in 2013 compared to 2011, but was lower in
5 Approximately *** percent of U.S. commercial shipments were of industrial/standard wire rod (low, medium, or high carbon) in 2013, while and cold-heading quality wire rod and specialty wire rod accounted for *** and *** percent, respectively. Industrial/standard quality wire rod (low, medium, or high carbon) made up approximately *** percent of internal consumption. Industrial/standard quality wire rod (low, medium, or high carbon) accounted for approximately *** percent of reported transfers. These data are presented in full in table III-6. Internal consumption accounted or *** percent and transfers accounted for *** percent of U.S. shipments, by quantity, in 2013.
VI-14
2013 compared to 2011 in total value because the average unit value of transfers was lower in
2013 than in 2011.6 *** firms reported an increase in the quantity while three firms reported
that the quantity of transfers declined or irregularly declined. The reported value of transfers
rose for *** firms while it declined for *** firms between 2011 and 2013.
Operating costs and expenses
As shown in table VI-1, raw material costs represent the single largest component of
overall COGS, averaging approximately 69.3 percent of total COGS on a cumulative basis during
2011-13, and ranging from 64.8 percent of sales value in 2011 to 63.0 percent of sales value in
2012 and 61.9 percent in 2013. Average raw material costs, direct labor, and other factory costs
(i.e., conversion costs) vary from company to company. These costs generally reflect underlying
differences in input costs from types of scrap and scrap substitutes7 and conversion costs (labor
and overhead). The highest average raw material costs as a ratio to sales were reported by ***.
Location and sales product mix may account for some of the costs; ***. Table VI-2 shows that
most U.S. producers as a whole
6 Differences between the average unit values of commercial (or merchant market) sales, internal consumption, and transfers to related firms are attributable to differences in product mix being sold in those categories. For example, ***. E-mail to Commission staff from ***, February 26, 2014.
7 Different iron inputs, including scrap blends and scrap substitutes are used to make different chemistries of wire rod. Forms of scrap include busheling, heavy melt, shredded auto, and scrap substitutes may include direct reduced iron or hot briquetted iron, and pig iron.
VI-15
reported lower raw material costs in 2013 than in 2011 on both a per-unit basis and as
expressed as a ratio to sales.
With regard to the merchant market, average raw material costs for U.S. producers
were slightly lower as a ratio to total COGS (67.6 percent average on a cumulative basis) or
when expressed as a ratio to merchant market sales compared to raw material costs for total
operations’ sales and, likewise, declined from 2011 to 2013. As a per-unit measure, raw
material costs were slightly higher overall when compared with the producers’ total operations.
Company-by-company reporting was mixed although the difference was not large in any case.
The steel industry uses the terms “metal spread” and “metal margin,” which refer to the
difference in total dollars or in dollars per ton of product between the sales price and the cost
of a firm’s raw material inputs and the metal spread as a percentage of the product price,
respectively. A decreasing metal spread indicates a narrowing between a firm’s sales value and
its cost of raw materials, for example when a firm’s sales price is decreasing more than is the
cost of its raw materials. Changes in the metal margin indicate similar aspects of changes in the
underlying factors (as indicated here, that the difference between the average unit values is a
VI-16
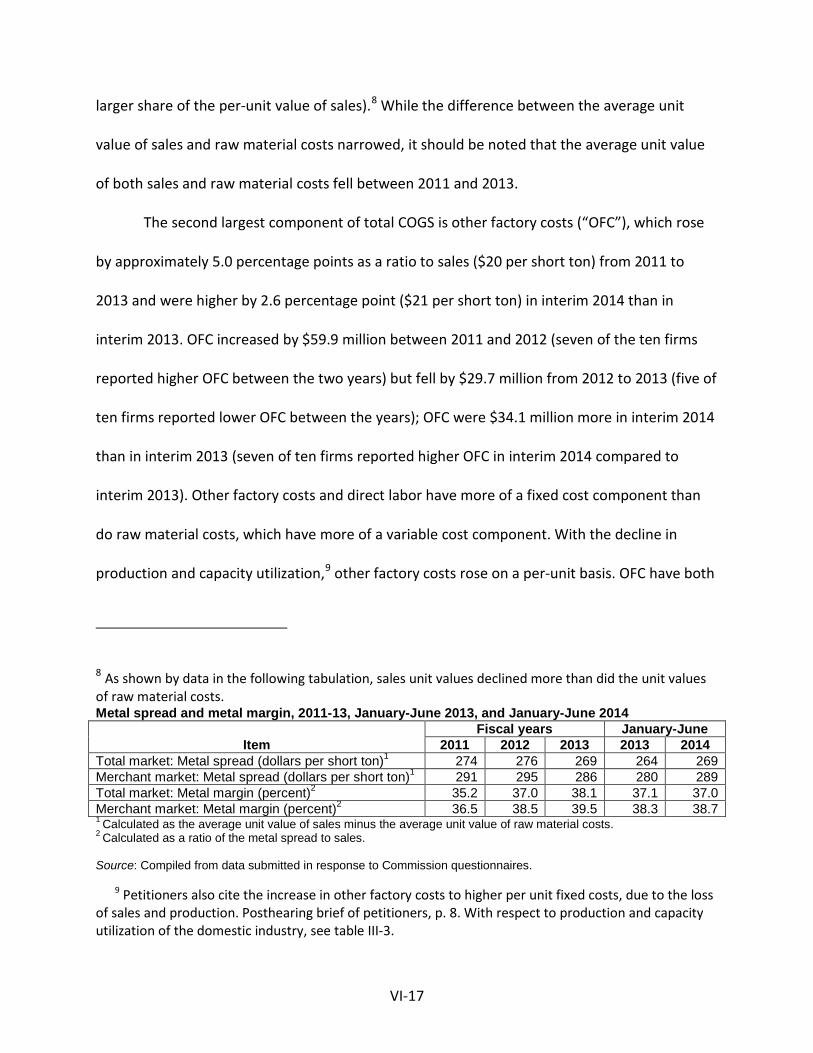
larger share of the per-unit value of sales).8 While the difference between the average unit
value of sales and raw material costs narrowed, it should be noted that the average unit value
of both sales and raw material costs fell between 2011 and 2013.
The second largest component of total COGS is other factory costs (“OFC”), which rose
by approximately 5.0 percentage points as a ratio to sales ($20 per short ton) from 2011 to
2013 and were higher by 2.6 percentage point ($21 per short ton) in interim 2014 than in
interim 2013. OFC increased by $59.9 million between 2011 and 2012 (seven of the ten firms
reported higher OFC between the two years) but fell by $29.7 million from 2012 to 2013 (five of
ten firms reported lower OFC between the years); OFC were $34.1 million more in interim 2014
than in interim 2013 (seven of ten firms reported higher OFC in interim 2014 compared to
interim 2013). Other factory costs and direct labor have more of a fixed cost component than
do raw material costs, which have more of a variable cost component. With the decline in
production and capacity utilization,9 other factory costs rose on a per-unit basis. OFC have both
8 As shown by data in the following tabulation, sales unit values declined more than did the unit values of raw material costs. Metal spread and metal margin, 2011-13, January-June 2013, and January-June 2014
Item Fiscal years January-June
2011 2012 2013 2013 2014 Total market: Metal spread (dollars per short ton)1 274 276 269 264 269 Merchant market: Metal spread (dollars per short ton)1 291 295 286 280 289 Total market: Metal margin (percent)2 35.2 37.0 38.1 37.1 37.0 Merchant market: Metal margin (percent)2 36.5 38.5 39.5 38.3 38.7 1 Calculated as the average unit value of sales minus the average unit value of raw material costs. 2 Calculated as a ratio of the metal spread to sales. Source: Compiled from data submitted in response to Commission questionnaires.
9 Petitioners also cite the increase in other factory costs to higher per unit fixed costs, due to the loss of sales and production. Posthearing brief of petitioners, p. 8. With respect to production and capacity utilization of the domestic industry, see table III-3.
VI-17
variable and fixed cost components. Petitioners explained that “factors driving these cost
increases include electricity prices, which rose by 11.6 percent over the POI, and natural gas
prices, which increased by 2.4 percent.”10 Also, OFC changed with changes in production and
sales volume, namely, as production and sales volume increased between 2011 and 2012 and
between the interim periods, OFC increased; as production/sales volume decreased between
2012 and 2013, OFC declined.11 Other cost components of OFC also increased for certain firms
in addition to those indicated earlier. 12 Startup expenses, from new or expanded facilities, and
10 Posthearing brief of petitioners, p. 7. Costs of utilities to run the plant are typically classified in OFC. *** stated “in addition, between 2011 and 2013, the cost of natural gas increased and shipment quantities fell. The rise in energy costs and declining sales base also contributed to increasing other factory costs over 2011-2013.” Email to Commission staff from ***, December 1, 2014.
11 For example, compare the changes in sales quantity and OFC of ***. These *** firms accounted for most of the increase in total OFC between 2011 and 2013. Commission staff asked *** about that firm’s OFC and received the following response: “***.” Email to Commission staff from ***, December 2, 2014. Also, *** explained ***. Email to Commission staff from ***, December 2, 2014. From 2011 to 2013, the OFC of ***, increased *** or did not fall as much as did the firm’s total sales quantity, which is an explained by the increase in fixed costs and utilities.
12 One firm, ***, reported non-recurring charges that were included in other factory costs. These ranged from $*** in 2011 (which included $***) down to $*** in 2013. See questionnaire response of ***, sections II-2 and III-9.
VI-18
depreciation expense, which is the period charge to capital expenditures, are typically included
in other factory costs. For example, “***.”13 While total depreciation charges fell from 2011 to
2013 and were higher in interim 2014 than in interim 2013, they increased for certain firms
during the periods investigated. 14
Direct labor costs, the smallest component of COGS, fluctuated and were *** on a value
basis and as a per-unit of sales in 2013 than in 2011 but rose *** between 2011 and 2013 as a
ratio to sales. SG&A expenses increased as a ratio to sales as well as on a per-unit basis
between 2011 and 2013. 15
13 Email to Commission staff from ***, December 1, 2014. 14 Total depreciation charges fell by $5.8 million between 2011 and 2013 and were $3.8 million
higher in interim 2014 than in interim 2013. See table VI-1. Firms that accounted for most of the reported decreased depreciation were *** while those that reported increased depreciation expenses were ***. ***. ***. ***.
15 The categories of direct labor cost, OFC, and SG&A expenses have elements that are variable (change with production) and fixed (does not change with production), although some categories may exhibit cost behavior that has a constant level and above that point is variable. Petitioners referred to “contribution margin,” which is defined as sales revenues minus variable costs, and is a non-GAAP measure used by many firms to evaluate managers on their effectiveness in managing controllable, or variable, costs. For both the total market and the merchant market the variable costs are a subset of gross profit (if only the variable portion of direct labor and OFC are used) or operating income (if the variable portion of SG&A expenses are included in the calculation), and the trend in the contribution margin would be similar to those two indicators.
VI-19
With regard to the merchant market, average labor and other factory costs for U.S.
producers were higher when expressed as a ratio to sales compared to those two cost
categories for total sales. As a per-unit measure, both were higher overall when compared with
the producers’ total operations. Company-by-company reporting was mixed although the
difference was not large in any case.
Profitability
Table VI-1 shows that the industry’s gross profit, on an absolute and relative basis, fell
from 2011 to 2013 and was lower in January-June 2014 than in the comparable period one year
earlier. Changes in the industry’s gross profit margin primarily reflect the decline in volume and
average unit value of sales that were partially offset by lower raw material costs but relatively
higher labor and other factory costs. Operating income was substantially lower in 2013 than in
2011 as well as in interim 2014 compared to interim 2013. As depicted in table VI-3, a majority
of the reporting firms were consistently profitable although the number of firms reporting
losses increased between 2011 and 2013. ***. Also, ***. On the other hand, ***.
With regard to the merchant market, as shown in table VI-2, operating profit was lower
on an overall basis than for total operations. The trend was similar in that operating profit was
substantially lower in 2013 than in 2011 and was *** lower in interim 2014 than in interim
2013. As a ratio to sales and on a per-unit basis, merchant market gross profit and operating
VI-20
profit were similar to those measures for the industry’s total operations although slightly lower.
Besides the ***.16
VARIANCE ANALYSIS
A variance analysis for the operations of U.S. producers of wire rod on their total
operations and on their merchant market operations is presented in tables VI-4 and VI-5.17 The
information for these variance analyses is derived from tables VI-1 and VI-2, respectively. The
operating income variance was negative between each of the years because the unfavorable
price variance (unit prices fell) was greater than a favorable net cost/expense variance (unit
costs fell). Operating income was lower in January-June 2014 because the unfavorable net
cost/expense variance was greater than the favorable price variance in both the total market
and the merchant market.
16 Table E-1 presents financial data for merchant market operations on a firm-by-firm basis. 17 The Commission’s variance analysis is calculated in three parts: Sales variance, cost of sales
variance (COGS variance), and SG&A expense variance. Each part consists of a price variance (in the case of the sales variance) or a cost or expense variance (in the case of the COGS and SG&A expense variance), and a volume variance. The sales or cost/expense variance is calculated as the change in unit price or per-unit cost/expense times the new volume, while the volume variance is calculated as the change in volume times the old unit price or per-unit cost/expense. Summarized at the bottom of the table, the price variance is from sales; the cost/expense variance is the sum of those items from COGS and SG&A variances, respectively, and the volume variance is the sum of the volume components of the net sales, COGS, and SG&A expense variances. The overall volume component of the variance analysis is generally small.
VI-21
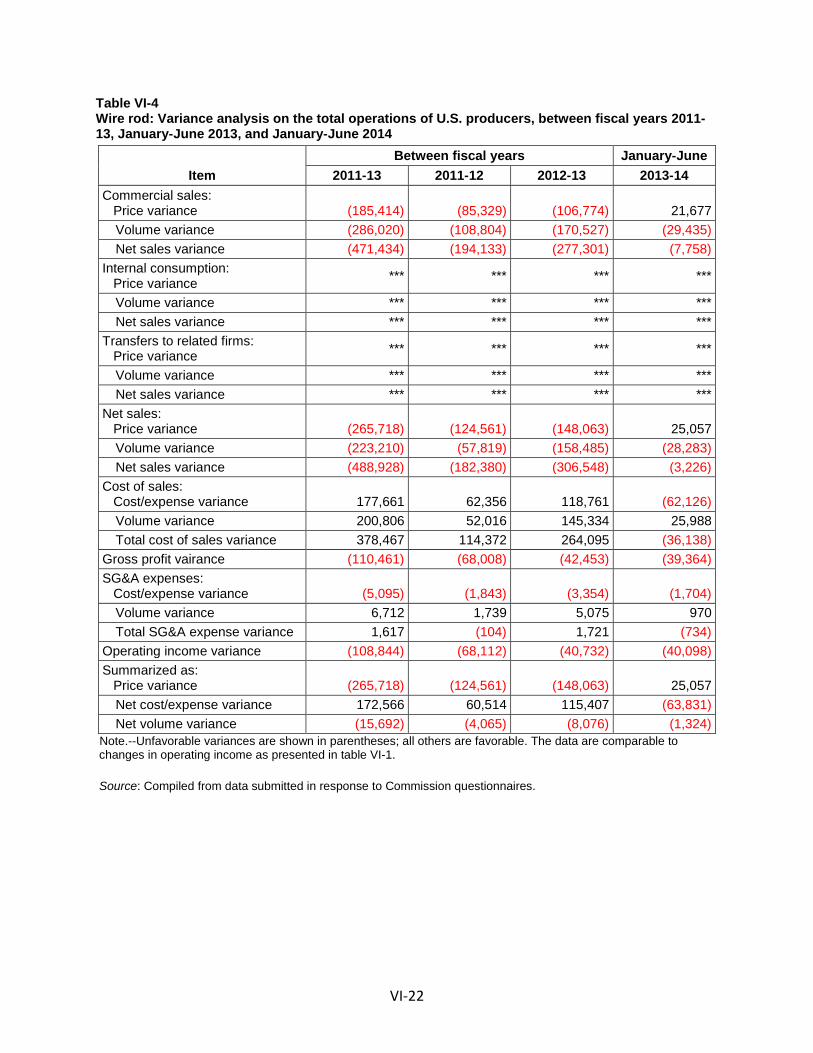
Table VI-4 Wire rod: Variance analysis on the total operations of U.S. producers, between fiscal years 2011-13, January-June 2013, and January-June 2014
Item Between fiscal years January-June
2011-13 2011-12 2012-13 2013-14 Commercial sales: Price variance (185,414) (85,329) (106,774) 21,677
Volume variance (286,020) (108,804) (170,527) (29,435) Net sales variance (471,434) (194,133) (277,301) (7,758)
Internal consumption: Price variance *** *** *** ***
Volume variance *** *** *** *** Net sales variance *** *** *** ***
Transfers to related firms: Price variance *** *** *** ***
Volume variance *** *** *** *** Net sales variance *** *** *** ***
Net sales: Price variance (265,718) (124,561) (148,063) 25,057
Volume variance (223,210) (57,819) (158,485) (28,283) Net sales variance (488,928) (182,380) (306,548) (3,226)
Cost of sales: Cost/expense variance 177,661 62,356 118,761 (62,126)
Volume variance 200,806 52,016 145,334 25,988 Total cost of sales variance 378,467 114,372 264,095 (36,138)
Gross profit vairance (110,461) (68,008) (42,453) (39,364) SG&A expenses: Cost/expense variance (5,095) (1,843) (3,354) (1,704)
Volume variance 6,712 1,739 5,075 970 Total SG&A expense variance 1,617 (104) 1,721 (734)
Operating income variance (108,844) (68,112) (40,732) (40,098) Summarized as: Price variance (265,718) (124,561) (148,063) 25,057
Net cost/expense variance 172,566 60,514 115,407 (63,831) Net volume variance (15,692) (4,065) (8,076) (1,324)
Note.--Unfavorable variances are shown in parentheses; all others are favorable. The data are comparable to changes in operating income as presented in table VI-1. Source: Compiled from data submitted in response to Commission questionnaires.
VI-22
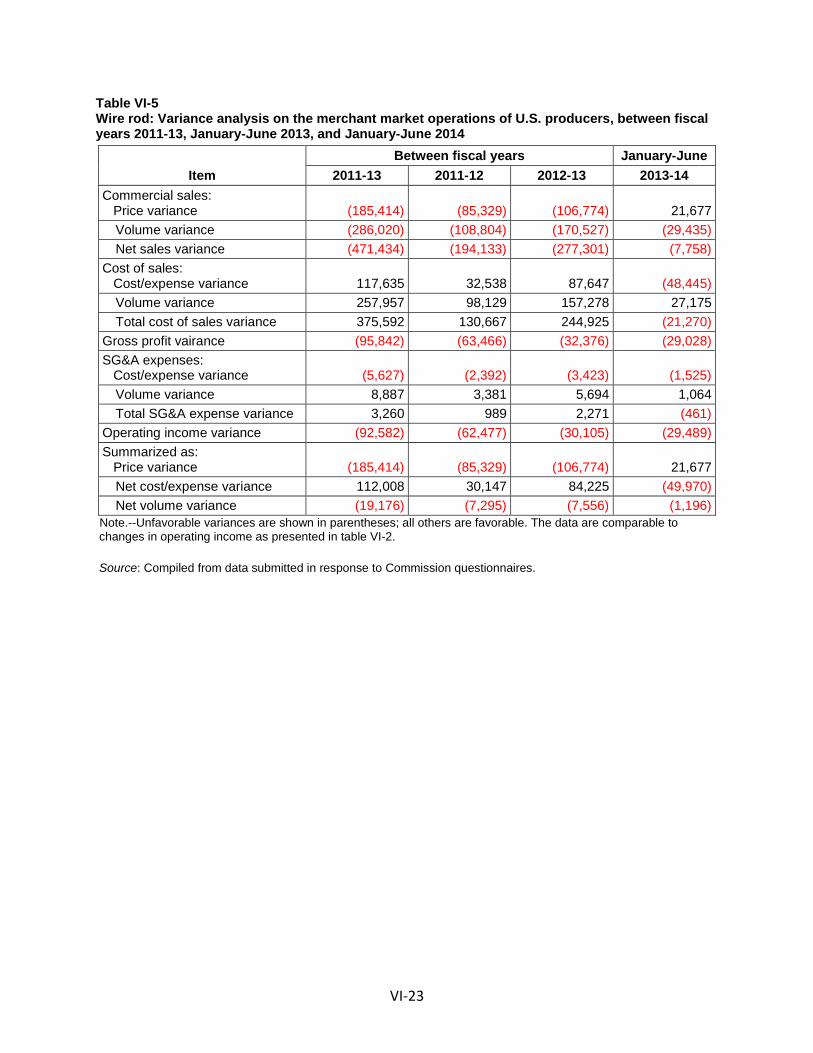
Table VI-5 Wire rod: Variance analysis on the merchant market operations of U.S. producers, between fiscal years 2011-13, January-June 2013, and January-June 2014
Item Between fiscal years January-June
2011-13 2011-12 2012-13 2013-14 Commercial sales: Price variance (185,414) (85,329) (106,774) 21,677
Volume variance (286,020) (108,804) (170,527) (29,435) Net sales variance (471,434) (194,133) (277,301) (7,758)
Cost of sales: Cost/expense variance 117,635 32,538 87,647 (48,445)
Volume variance 257,957 98,129 157,278 27,175 Total cost of sales variance 375,592 130,667 244,925 (21,270)
Gross profit vairance (95,842) (63,466) (32,376) (29,028) SG&A expenses: Cost/expense variance (5,627) (2,392) (3,423) (1,525)
Volume variance 8,887 3,381 5,694 1,064 Total SG&A expense variance 3,260 989 2,271 (461)
Operating income variance (92,582) (62,477) (30,105) (29,489) Summarized as: Price variance (185,414) (85,329) (106,774) 21,677
Net cost/expense variance 112,008 30,147 84,225 (49,970) Net volume variance (19,176) (7,295) (7,556) (1,196)
Note.--Unfavorable variances are shown in parentheses; all others are favorable. The data are comparable to changes in operating income as presented in table VI-2. Source: Compiled from data submitted in response to Commission questionnaires.
VI-23
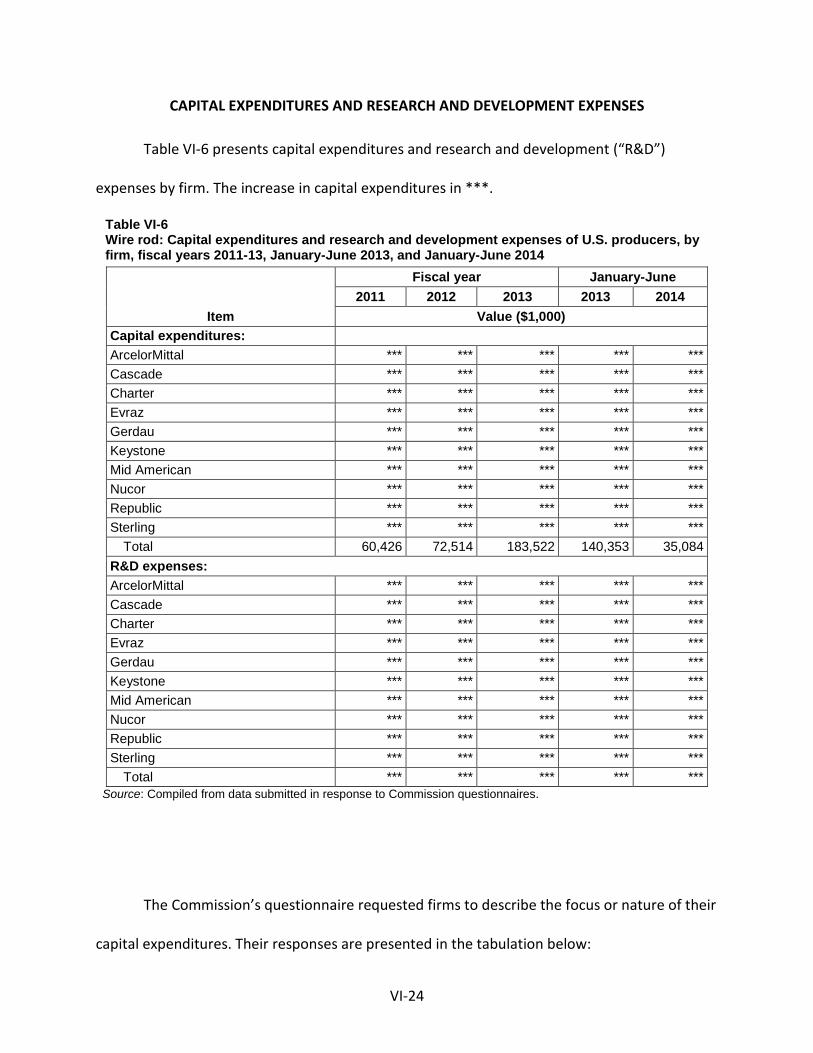
CAPITAL EXPENDITURES AND RESEARCH AND DEVELOPMENT EXPENSES
Table VI-6 presents capital expenditures and research and development (“R&D”)
expenses by firm. The increase in capital expenditures in ***.
Table VI-6 Wire rod: Capital expenditures and research and development expenses of U.S. producers, by firm, fiscal years 2011-13, January-June 2013, and January-June 2014
Item
Fiscal year January-June 2011 2012 2013 2013 2014
Value ($1,000) Capital expenditures: ArcelorMittal *** *** *** *** *** Cascade *** *** *** *** *** Charter *** *** *** *** *** Evraz *** *** *** *** *** Gerdau *** *** *** *** *** Keystone *** *** *** *** *** Mid American *** *** *** *** *** Nucor *** *** *** *** *** Republic *** *** *** *** *** Sterling *** *** *** *** ***
Total 60,426 72,514 183,522 140,353 35,084 R&D expenses:
ArcelorMittal *** *** *** *** *** Cascade *** *** *** *** *** Charter *** *** *** *** *** Evraz *** *** *** *** *** Gerdau *** *** *** *** *** Keystone *** *** *** *** *** Mid American *** *** *** *** *** Nucor *** *** *** *** *** Republic *** *** *** *** *** Sterling *** *** *** *** ***
Total *** *** *** *** *** Source: Compiled from data submitted in response to Commission questionnaires.
The Commission’s questionnaire requested firms to describe the focus or nature of their
capital expenditures. Their responses are presented in the tabulation below:
VI-24
* * * * * * *
ASSETS AND RETURN ON INVESTMENT
Table VI-7 presents data on the U.S. producers’ total assets as well as the ratio of
operating income (or loss) to total assets. Because operating income declined while total assets
increased overall, this ratio was lower in each consecutive period.
VI-25
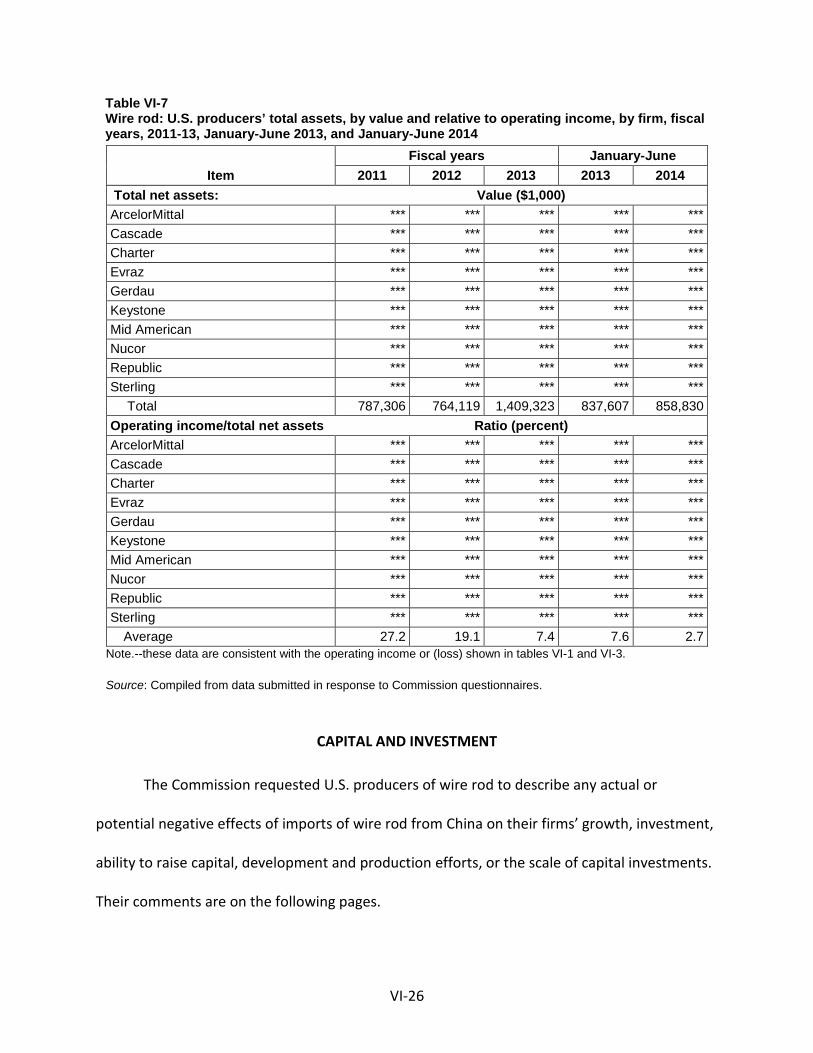
Table VI-7 Wire rod: U.S. producers’ total assets, by value and relative to operating income, by firm, fiscal years, 2011-13, January-June 2013, and January-June 2014
Item Fiscal years January-June
2011 2012 2013 2013 2014 Total net assets: Value ($1,000) ArcelorMittal *** *** *** *** *** Cascade *** *** *** *** *** Charter *** *** *** *** *** Evraz *** *** *** *** *** Gerdau *** *** *** *** *** Keystone *** *** *** *** *** Mid American *** *** *** *** *** Nucor *** *** *** *** *** Republic *** *** *** *** *** Sterling *** *** *** *** ***
Total 787,306 764,119 1,409,323 837,607 858,830 Operating income/total net assets Ratio (percent) ArcelorMittal *** *** *** *** *** Cascade *** *** *** *** *** Charter *** *** *** *** *** Evraz *** *** *** *** *** Gerdau *** *** *** *** *** Keystone *** *** *** *** *** Mid American *** *** *** *** *** Nucor *** *** *** *** *** Republic *** *** *** *** *** Sterling *** *** *** *** ***
Average 27.2 19.1 7.4 7.6 2.7 Note.--these data are consistent with the operating income or (loss) shown in tables VI-1 and VI-3. Source: Compiled from data submitted in response to Commission questionnaires.
CAPITAL AND INVESTMENT
The Commission requested U.S. producers of wire rod to describe any actual or
potential negative effects of imports of wire rod from China on their firms’ growth, investment,
ability to raise capital, development and production efforts, or the scale of capital investments.
Their comments are on the following pages.
VI-26
Actual negative effects
ArcelorMittal: ***. Cascade: ***. Charter: ***. Evraz: ***. Gerdau: ***. Keystone: ***. Mid American: ***. Nucor: ***. Republic Steel: ***.
VI-27
Sterling: ***.
Anticipated negative effects
ArcelorMittal: ***. Cascade: ***. Charter: ***. Evraz: ***. Gerdau: ***. Keystone: ***. Mid American: ***. Nucor: ***. Republic Steel: ***. Sterling: ***.
VI-28
PART VII: THREAT CONSIDERATIONS AND INFORMATION ON NONSUBJECT COUNTRIES
Section 771(7)(F)(i) of the Act (19 U.S.C. § 1677(7)(F)(i)) provides that—
In determining whether an industry in the United States is threatened with material injury by reason of imports (or sales for importation) of the subject merchandise, the Commission shall consider, among other relevant economic factors1-- (I) if a countervailable subsidy is involved, such information as may
be presented to it by the administering authority as to the nature of the subsidy (particularly as to whether the countervailable subsidy is a subsidy described in Article 3 or 6.1 of the Subsidies Agreement), and whether imports of the subject merchandise are likely to increase,
(II) any existing unused production capacity or imminent, substantial increase in production capacity in the exporting country indicating the likelihood of substantially increased imports of the subject merchandise into the United States, taking into account the availability of other export markets to absorb any additional exports,
(III) a significant rate of increase of the volume or market penetration of imports of the subject merchandise indicating the likelihood of substantially increased imports,
(IV) whether imports of the subject merchandise are entering at prices that are likely to have a significant depressing or suppressing effect on domestic prices, and are likely to increase demand for further imports,
(V) inventories of the subject merchandise,
1 Section 771(7)(F)(ii) of the Act (19 U.S.C. § 1677(7)(F)(ii)) provides that “The Commission shall consider {these factors} . . . as a whole in making a determination of whether further dumped or subsidized imports are imminent and whether material injury by reason of imports would occur unless an order is issued or a suspension agreement is accepted under this title. The presence or absence of any factor which the Commission is required to consider . . . shall not necessarily give decisive guidance with respect to the determination. Such a determination may not be made on the basis of mere conjecture or supposition.”
VII-1
(VI) the potential for product-shifting if production facilities in the foreign country, which can be used to produce the subject merchandise, are currently being used to produce other products,
(VII) in any investigation under this title which involves imports of both a raw agricultural product (within the meaning of paragraph (4)(E)(iv)) and any product processed from such raw agricultural product, the likelihood that there will be increased imports, by reason of product shifting, if there is an affirmative determination by the Commission under section 705(b)(1) or 735(b)(1) with respect to either the raw agricultural product or the processed agricultural product (but not both),
(VIII) the actual and potential negative effects on the existing development and production efforts of the domestic industry, including efforts to develop a derivative or more advanced version of the domestic like product, and
(IX) any other demonstrable adverse trends that indicate the probability that there is likely to be material injury by reason of imports (or sale for importation) of the subject merchandise (whether or not it is actually being imported at the time).2
Information on the nature of the subsidies was presented earlier in this report;
information on the volume and pricing of imports of the subject merchandise is presented in
Parts IV and V; and information on the effects of imports of the subject merchandise on U.S.
producers’ existing development and production efforts is presented in Part VI. Information on
inventories of the subject merchandise; foreign producers’ operations, including the potential
for “product-shifting;” any other threat indicators, if applicable; and any dumping in third-
2 Section 771(7)(F)(iii) of the Act (19 U.S.C. § 1677(7)(F)(iii)) further provides that, in antidumping investigations, “. . . the Commission shall consider whether dumping in the markets of foreign countries (as evidenced by dumping findings or antidumping remedies in other WTO member markets against the same class or kind of merchandise manufactured or exported by the same party as under investigation) suggests a threat of material injury to the domestic industry.”
VII-2

country markets, follows. Also presented in this section of the report is information obtained
for consideration by the Commission on nonsubject countries.
THE INDUSTRY IN CHINA
Overview
China is the world’s largest producer of wire rod; production of all forms of wire rod in
China totaled 150.9 million short tons in 2013, representing 77.3 percent of total global wire
rod production.3 By one estimate, wire rod capacity in 2011 totaled 160.9 million short tons,
and increased to 167.6 million short tons in 2012 and then to 172.0 million short tons in 2013.
Capacity is expected to grow to 176.4 million short tons by 2015 with renovation and technical
improvement.4
Domestic producers estimate the total capacity for the subject wire rod in China to be
*** short tons in 2013, and total production to be *** short tons in 2013. They identified top
Chinese producers of wire rod (producing more than *** short tons each in 2013 as ***.5
Alloy steel wire rod exported from China receives an export tax rebate. Chinese
producers allegedly qualify for these rebates if they add a trace amount of boron to the wire
3 World Steel Association, “Steel Statistical Yearbook 2014”, p. 43. Production figure may be over-inclusive because it encompasses all wire rod, including that outside the scope of these investigations.
4 World Steel Dynamics, “Chinese Steel Hits the Great Wall IV”, May 2013, pp. 18 and 30. 5 Domestic producers’ prehearing brief, exh. 5.
VII-3
rod. Minimal amounts of boron (exceeding 0.0008 percent (8 ppm) by weight) added to wire
rod allow it to be classified for customs purposes as alloy steel wire rod in HTSUS subheading
7227.90.6 The addition of boron permits Chinese producers to take advantage of a nine percent
export tax rebate on exports of alloy steel wire rod.7 According to domestic producers, wire rod
that has a minimal amount of boron is used in many of the same applications as wire rod
without boron, and it reportedly costs relatively little to add trace amounts of boron to wire
rod. Although boron can increase the drawability in some products,8 importers reported the
majority of wire rod imports from China in 2013 as industrial/standard wire rod since boron
generally does not change the characteristics of wire rod. In contrast, however, foreign
respondents contend that “boron is very useful as an enhancement to the hardenability of the
steel,”9 and reported *** of alloy steel wire rod exported to the United States in 2013 as other
specialty carbon and alloy quality wire rod.10
The Commission issued foreign producers’ or exporters’ questionnaires to 29 firms
believed to produce and/or export wire rod from China.11 Useable responses to the
Commission’s questionnaire were received from seven firms: Angang Group International Trade
Corporation (“Angang”), Benxi Beiying Iron & Steel Group Import & Export Corp. Ltd. (“Benxi
6 HTSUS (2014), “Chapter 72 Iron and Steel, Note 1(f) Other Alloy Steel,” January 1, 2014, p. XV 72-2. 7 Hearing transcript, p. 108 (Kerkvliet); Nucor’s posthearing brief, exh. 1, p. 15. 8 Hearing transcript, pp. 42 and 108 (Nystrom and Kerkvliet); Nucor’s posthearing brief, exh. 1, p. 15. 9 CISA’s posthearing brief, exh. 2, p. 33. 10 CISA’s prehearing brief, exh. 2. 11 These firms were identified through a review of information submitted in the petition and
contained in proprietary *** records.
VII-4
Beiying”),12 Jiangsu Shagang International Trade Co. Ltd. (“Jiangsu Shagang”), Qingdao Iron &
Steel Co. Ltd. (“Qingdao”), Rizhao Steel Holding Group Co. Ltd. (“Rizhao”), Tangshan Iron &
Steel Group Co. Ltd. (“Tangshan”), and Xuanhua Iron & Steel Group Corp. Ltd. (“Xuanhua”).
None of these firms reported the approximate share of their production to total wire rod
production in China nor did they report the approximate share of their exports to total exports
of wire rod to the United States. Table VII-1 presents information on the wire rod operations of
the responding producers and exporters in China. Table VII-2 presents Chinese exports of wire
rod from 2011-13 as reported by Chinese customs.
12 ***. Email from ***, November 18, 2014.
VII-5
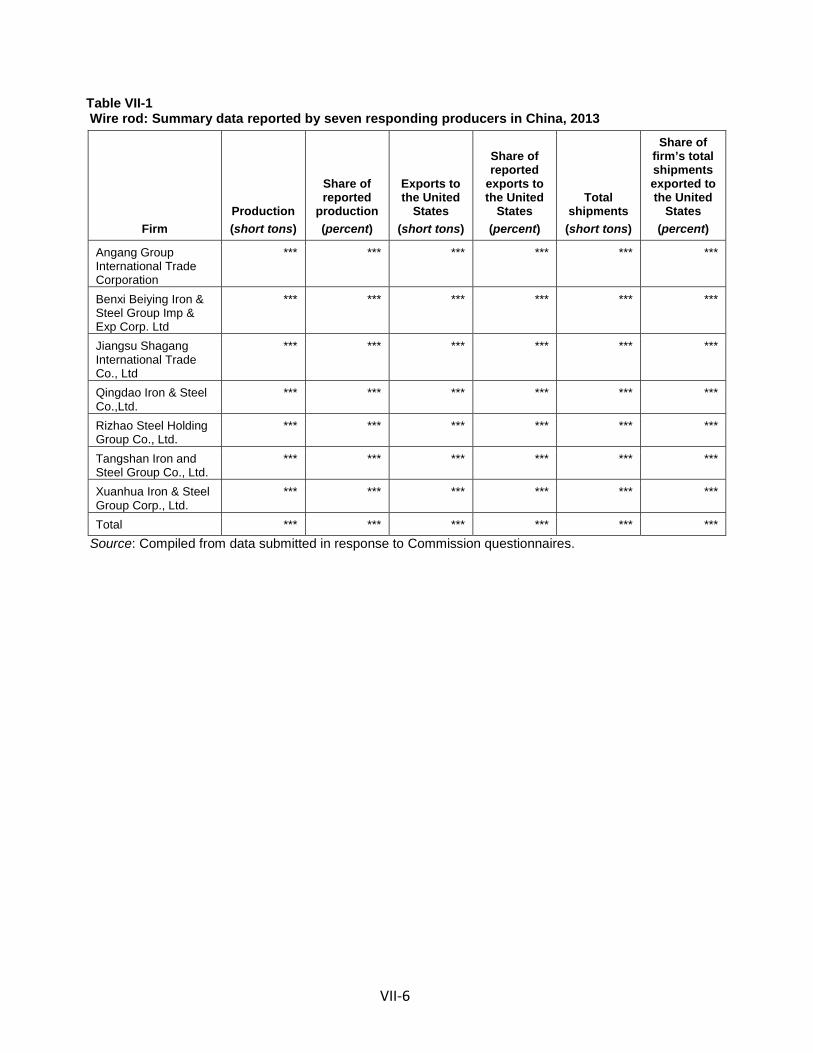
Table VII-1 Wire rod: Summary data reported by seven responding producers in China, 2013
Firm Production (short tons)
Share of reported
production (percent)
Exports to the United
States (short tons)
Share of reported
exports to the United
States (percent)
Total shipments
(short tons)
Share of firm’s total shipments exported to the United
States (percent)
Angang Group International Trade Corporation
*** *** *** *** *** ***
Benxi Beiying Iron & Steel Group Imp & Exp Corp. Ltd
*** *** *** *** *** ***
Jiangsu Shagang International Trade Co., Ltd
*** *** *** *** *** ***
Qingdao Iron & Steel Co.,Ltd.
*** *** *** *** *** ***
Rizhao Steel Holding Group Co., Ltd.
*** *** *** *** *** ***
Tangshan Iron and Steel Group Co., Ltd.
*** *** *** *** *** ***
Xuanhua Iron & Steel Group Corp., Ltd.
*** *** *** *** *** ***
Total *** *** *** *** *** *** Source: Compiled from data submitted in response to Commission questionnaires.
VII-6
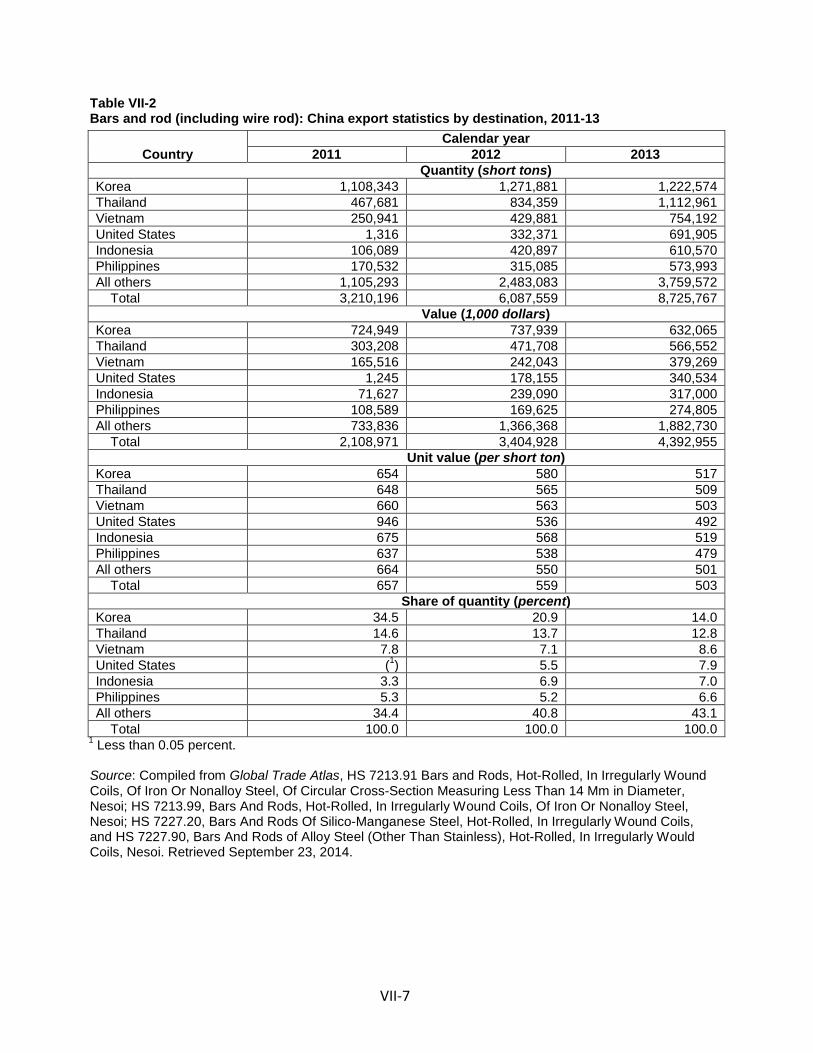
Table VII-2 Bars and rod (including wire rod): China export statistics by destination, 2011-13
Country Calendar year
2011 2012 2013 Quantity (short tons) Korea 1,108,343 1,271,881 1,222,574 Thailand 467,681 834,359 1,112,961 Vietnam 250,941 429,881 754,192 United States 1,316 332,371 691,905 Indonesia 106,089 420,897 610,570 Philippines 170,532 315,085 573,993 All others 1,105,293 2,483,083 3,759,572 Total 3,210,196 6,087,559 8,725,767 Value (1,000 dollars) Korea 724,949 737,939 632,065 Thailand 303,208 471,708 566,552 Vietnam 165,516 242,043 379,269 United States 1,245 178,155 340,534 Indonesia 71,627 239,090 317,000 Philippines 108,589 169,625 274,805 All others 733,836 1,366,368 1,882,730 Total 2,108,971 3,404,928 4,392,955 Unit value (per short ton) Korea 654 580 517 Thailand 648 565 509 Vietnam 660 563 503 United States 946 536 492 Indonesia 675 568 519 Philippines 637 538 479 All others 664 550 501 Total 657 559 503 Share of quantity (percent) Korea 34.5 20.9 14.0 Thailand 14.6 13.7 12.8 Vietnam 7.8 7.1 8.6 United States (1) 5.5 7.9 Indonesia 3.3 6.9 7.0 Philippines 5.3 5.2 6.6 All others 34.4 40.8 43.1 Total 100.0 100.0 100.0
1 Less than 0.05 percent.
Source: Compiled from Global Trade Atlas, HS 7213.91 Bars and Rods, Hot-Rolled, In Irregularly Wound Coils, Of Iron Or Nonalloy Steel, Of Circular Cross-Section Measuring Less Than 14 Mm in Diameter, Nesoi; HS 7213.99, Bars And Rods, Hot-Rolled, In Irregularly Wound Coils, Of Iron Or Nonalloy Steel, Nesoi; HS 7227.20, Bars And Rods Of Silico-Manganese Steel, Hot-Rolled, In Irregularly Wound Coils, and HS 7227.90, Bars And Rods of Alloy Steel (Other Than Stainless), Hot-Rolled, In Irregularly Would Coils, Nesoi. Retrieved September 23, 2014.
VII-7
Operations on wire rod
Table VII-3 presents information on wire rod operations reported by the seven
responding Chinese producers. The capacity of these producers decreased by 1.1 percent from
2011 to 2012 and increased by 0.6 percent in 2012 to 2013.13 The reported capacity was 1.0
percent higher in January-June 2014 relative to January-June 2013. Most of the responding
Chinese producers noted that the projections were made based on previous sales data as well
as market factors.14 15 Non-responding Chinese wire rod producers reportedly have expanded
their capacity and at least three non-responding Chinese producers also have plans to add ***
short tons of capacity in the near future:
• ***.
• ***.
• ***.
13 ***. Email from ***, November 13, 2014. 14 The Chinese producers reported that factors considered when calculating production capacity
included number of workers, rest time, public holidays, and days of operation of machines and workers. Production constraints of these companies included equipment maintenance and upgrades, power prices, raw materials supply and cost, and the rising cost of labor.
15 ***. Email from ***, November 14, 2014.
VII-8
• ***.
• ***16 The production of the seven responding firms in China increased by 2.5 percent from
2011 to 2013, although it was 7.2 percent lower in January-June 2014 relative to January-June
2013. Production is projected to decrease by 11.9 percent from 2013 to 2015. ***.17
The capacity utilization of the seven responding firms increased from 92.5 percent in
2011 to 95.3 percent in 2013. Capacity utilization was lower at 86.4 percent in January-June
2014 compared with 94.1 percent in January-June 2013. Capacity utilization of these firms is
projected to be 88.2 and 86.7 percent in 2014 and 2015, respectively.
16 Domestic producers’ prehearing brief, p. 33 and exh. 6 (various Steel Business Briefing articles). 17 Email from ***, November 13, 2014.
VII-9
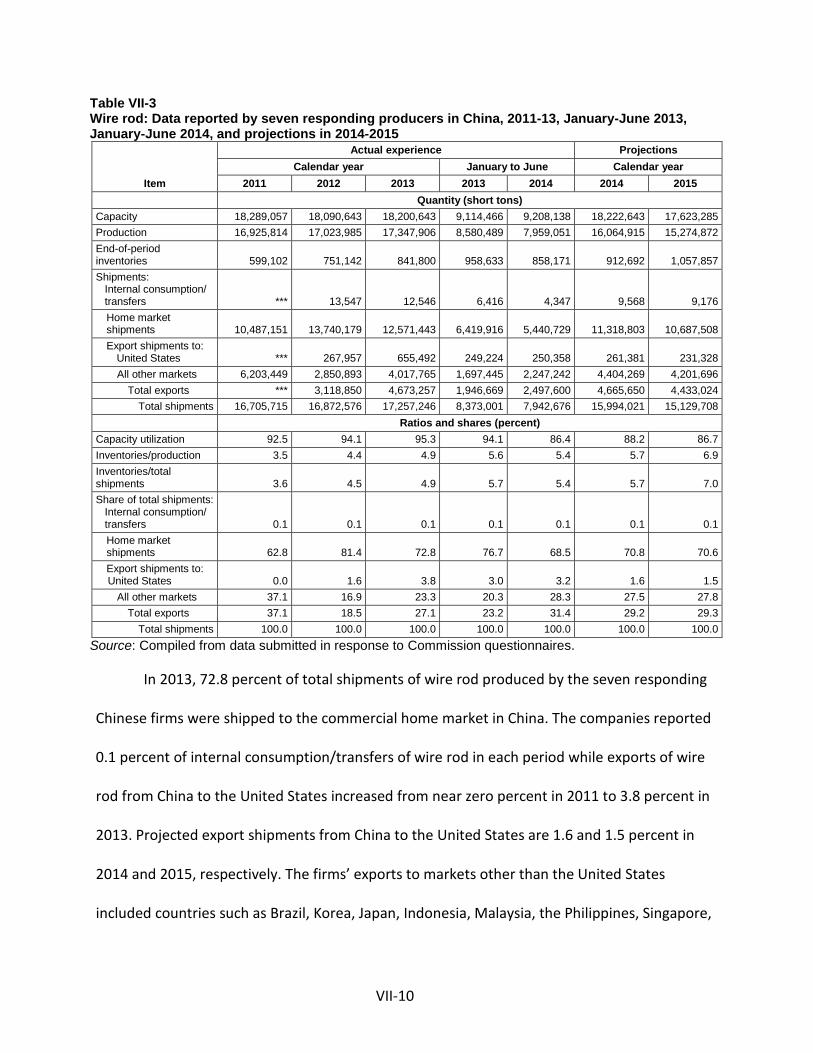
Table VII-3 Wire rod: Data reported by seven responding producers in China, 2011-13, January-June 2013, January-June 2014, and projections in 2014-2015
Item
Actual experience Projections Calendar year January to June Calendar year
2011 2012 2013 2013 2014 2014 2015 Quantity (short tons) Capacity 18,289,057 18,090,643 18,200,643 9,114,466 9,208,138 18,222,643 17,623,285 Production 16,925,814 17,023,985 17,347,906 8,580,489 7,959,051 16,064,915 15,274,872 End-of-period inventories 599,102 751,142 841,800 958,633 858,171 912,692 1,057,857 Shipments: Internal consumption/ transfers *** 13,547 12,546 6,416 4,347 9,568 9,176
Home market shipments 10,487,151 13,740,179 12,571,443 6,419,916 5,440,729 11,318,803 10,687,508 Export shipments to:
United States *** 267,957 655,492 249,224 250,358 261,381 231,328 All other markets 6,203,449 2,850,893 4,017,765 1,697,445 2,247,242 4,404,269 4,201,696
Total exports *** 3,118,850 4,673,257 1,946,669 2,497,600 4,665,650 4,433,024 Total shipments 16,705,715 16,872,576 17,257,246 8,373,001 7,942,676 15,994,021 15,129,708
Ratios and shares (percent) Capacity utilization 92.5 94.1 95.3 94.1 86.4 88.2 86.7 Inventories/production 3.5 4.4 4.9 5.6 5.4 5.7 6.9 Inventories/total shipments 3.6 4.5 4.9 5.7 5.4 5.7 7.0 Share of total shipments: Internal consumption/ transfers 0.1 0.1 0.1 0.1 0.1 0.1 0.1
Home market shipments 62.8 81.4 72.8 76.7 68.5 70.8 70.6 Export shipments to:
United States 0.0 1.6 3.8 3.0 3.2 1.6 1.5 All other markets 37.1 16.9 23.3 20.3 28.3 27.5 27.8
Total exports 37.1 18.5 27.1 23.2 31.4 29.2 29.3 Total shipments 100.0 100.0 100.0 100.0 100.0 100.0 100.0
Source: Compiled from data submitted in response to Commission questionnaires.
In 2013, 72.8 percent of total shipments of wire rod produced by the seven responding
Chinese firms were shipped to the commercial home market in China. The companies reported
0.1 percent of internal consumption/transfers of wire rod in each period while exports of wire
rod from China to the United States increased from near zero percent in 2011 to 3.8 percent in
2013. Projected export shipments from China to the United States are 1.6 and 1.5 percent in
2014 and 2015, respectively. The firms’ exports to markets other than the United States
included countries such as Brazil, Korea, Japan, Indonesia, Malaysia, the Philippines, Singapore,
VII-10
Taiwan, and Thailand, in addition to various countries in Africa and Latin America. These
exports accounted for 23.3 percent of the responding firms’ total shipments of wire rod in
2013.
Alternative products
In response to the Commission’s request for information concerning the production of
products other than the subject wire rod, no firm reported that it produces other products on
the same equipment and machinery used in the production of wire rod. Data regarding the
Chinese producers’ overall wire rod facility capacity and production, as well as the production
of nonsubject merchandise, are presented in table VII-4. ***.18
18 Email from ***, November 21, 2014.
VII-11
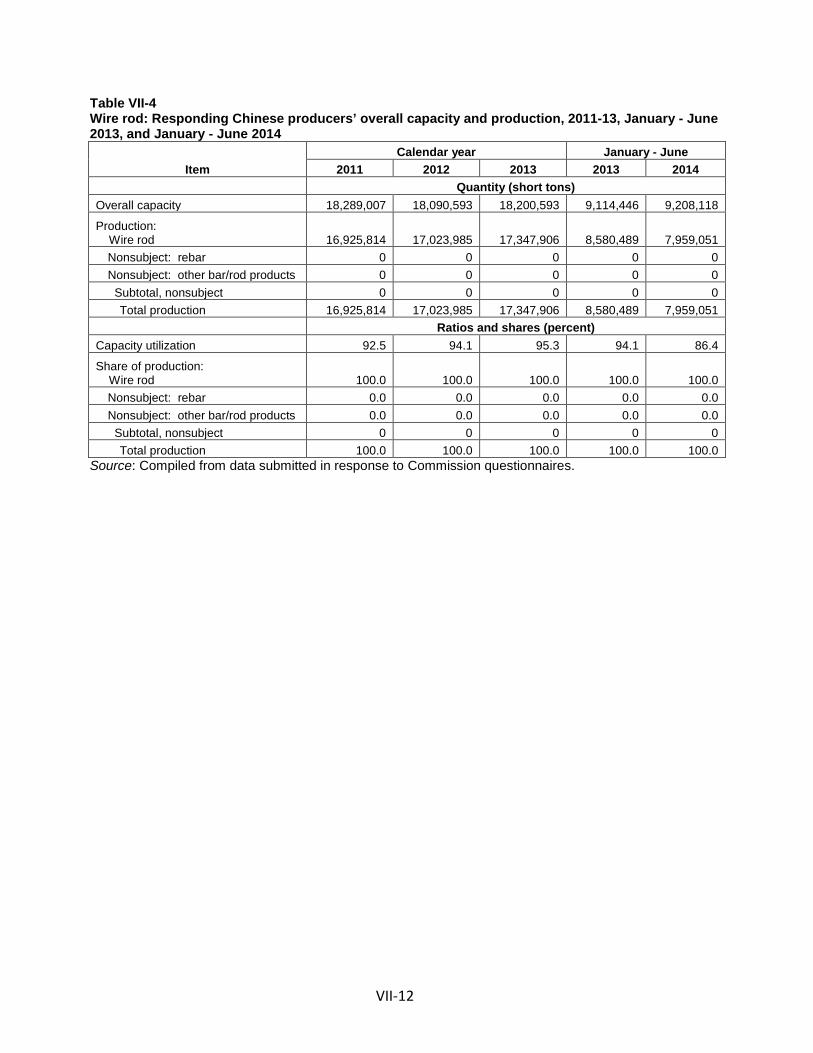
Table VII-4 Wire rod: Responding Chinese producers’ overall capacity and production, 2011-13, January - June 2013, and January - June 2014
Item Calendar year January - June
2011 2012 2013 2013 2014 Quantity (short tons) Overall capacity 18,289,007 18,090,593 18,200,593 9,114,446 9,208,118
Production: Wire rod 16,925,814 17,023,985 17,347,906 8,580,489 7,959,051
Nonsubject: rebar 0 0 0 0 0 Nonsubject: other bar/rod products 0 0 0 0 0 Subtotal, nonsubject 0 0 0 0 0
Total production 16,925,814 17,023,985 17,347,906 8,580,489 7,959,051 Ratios and shares (percent) Capacity utilization 92.5 94.1 95.3 94.1 86.4
Share of production: Wire rod 100.0 100.0 100.0 100.0 100.0
Nonsubject: rebar 0.0 0.0 0.0 0.0 0.0 Nonsubject: other bar/rod products 0.0 0.0 0.0 0.0 0.0 Subtotal, nonsubject 0 0 0 0 0
Total production 100.0 100.0 100.0 100.0 100.0 Source: Compiled from data submitted in response to Commission questionnaires.
VII-12
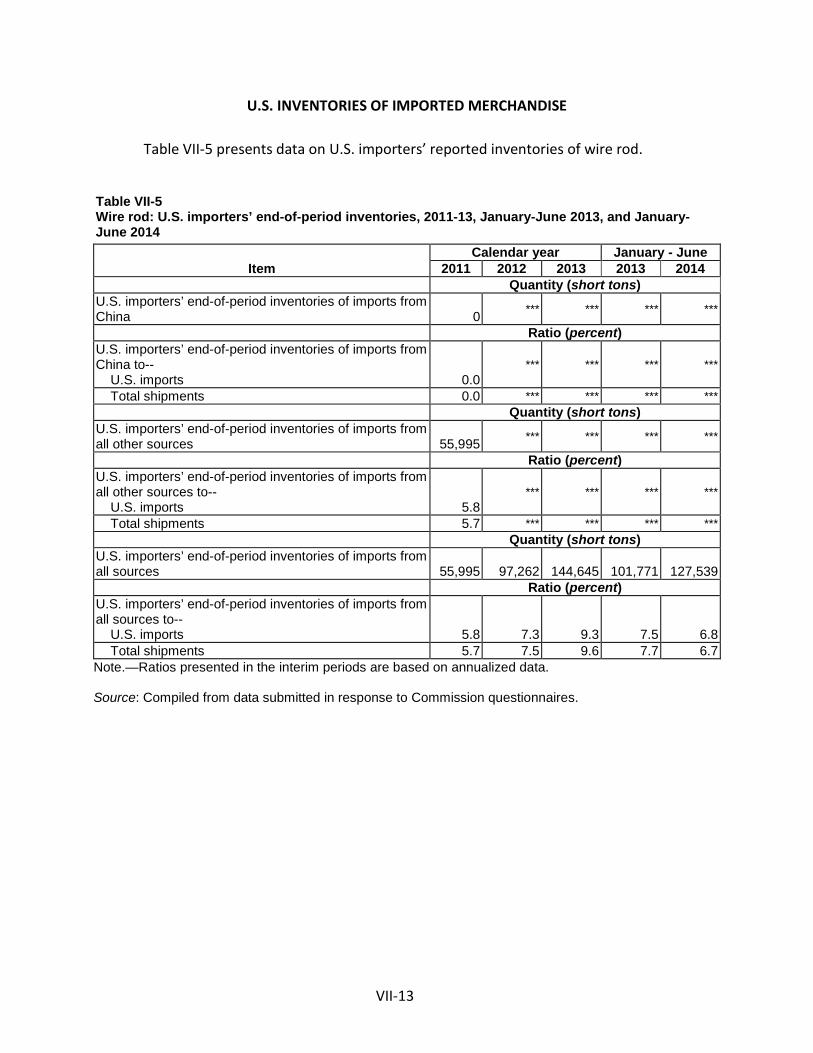
U.S. INVENTORIES OF IMPORTED MERCHANDISE
Table VII-5 presents data on U.S. importers’ reported inventories of wire rod.
Table VII-5 Wire rod: U.S. importers’ end-of-period inventories, 2011-13, January-June 2013, and January-June 2014
Item Calendar year January - June
2011 2012 2013 2013 2014 Quantity (short tons) U.S. importers’ end-of-period inventories of imports from China 0 *** *** *** ***
Ratio (percent) U.S. importers’ end-of-period inventories of imports from China to-- U.S. imports 0.0
*** *** *** ***
Total shipments 0.0 *** *** *** *** Quantity (short tons) U.S. importers’ end-of-period inventories of imports from all other sources 55,995 *** *** *** ***
Ratio (percent) U.S. importers’ end-of-period inventories of imports from all other sources to-- U.S. imports 5.8
*** *** *** ***
Total shipments 5.7 *** *** *** *** Quantity (short tons) U.S. importers’ end-of-period inventories of imports from all sources 55,995 97,262 144,645 101,771 127,539 Ratio (percent) U.S. importers’ end-of-period inventories of imports from all sources to-- U.S. imports 5.8 7.3 9.3 7.5 6.8 Total shipments 5.7 7.5 9.6 7.7 6.7
Note.—Ratios presented in the interim periods are based on annualized data.
Source: Compiled from data submitted in response to Commission questionnaires.
VII-13
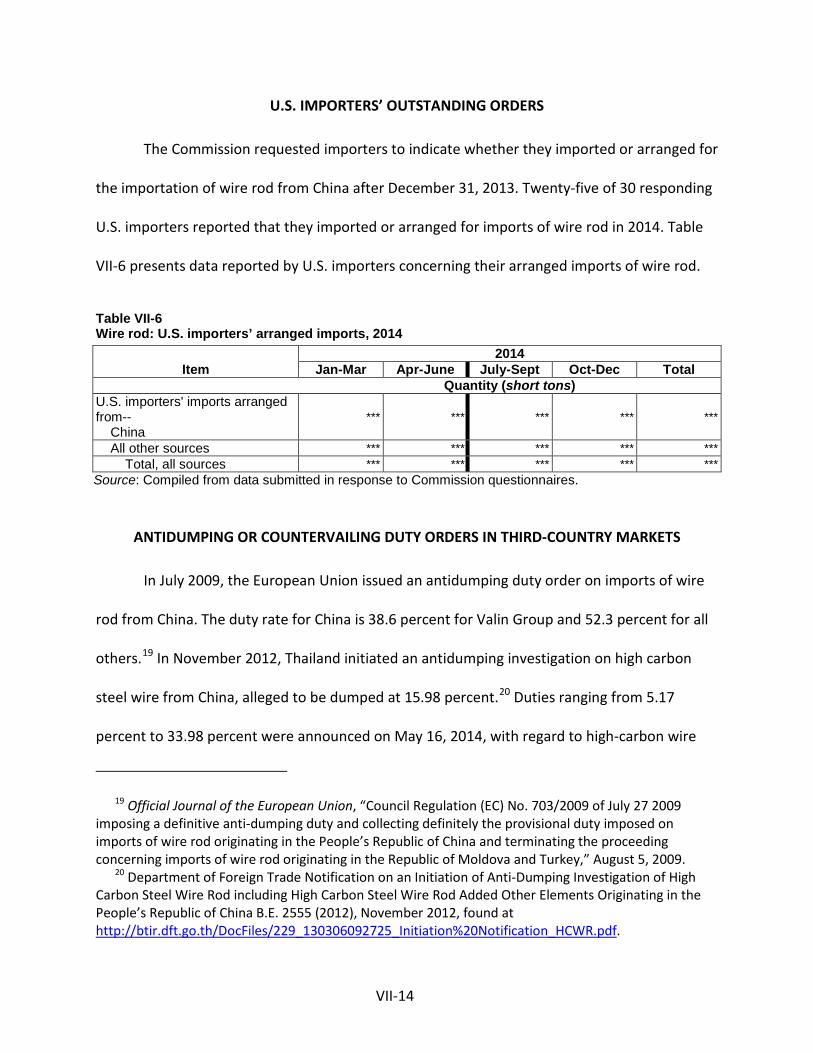
U.S. IMPORTERS’ OUTSTANDING ORDERS
The Commission requested importers to indicate whether they imported or arranged for
the importation of wire rod from China after December 31, 2013. Twenty-five of 30 responding
U.S. importers reported that they imported or arranged for imports of wire rod in 2014. Table
VII-6 presents data reported by U.S. importers concerning their arranged imports of wire rod.
Table VII-6 Wire rod: U.S. importers’ arranged imports, 2014
Item 2014
Jan-Mar Apr-June July-Sept Oct-Dec Total Quantity (short tons) U.S. importers' imports arranged from-- China
*** *** *** *** ***
All other sources *** *** *** *** *** Total, all sources *** *** *** *** ***
Source: Compiled from data submitted in response to Commission questionnaires.
ANTIDUMPING OR COUNTERVAILING DUTY ORDERS IN THIRD-COUNTRY MARKETS
In July 2009, the European Union issued an antidumping duty order on imports of wire
rod from China. The duty rate for China is 38.6 percent for Valin Group and 52.3 percent for all
others.19 In November 2012, Thailand initiated an antidumping investigation on high carbon
steel wire from China, alleged to be dumped at 15.98 percent.20 Duties ranging from 5.17
percent to 33.98 percent were announced on May 16, 2014, with regard to high-carbon wire
19 Official Journal of the European Union, “Council Regulation (EC) No. 703/2009 of July 27 2009 imposing a definitive anti-dumping duty and collecting definitely the provisional duty imposed on imports of wire rod originating in the People’s Republic of China and terminating the proceeding concerning imports of wire rod originating in the Republic of Moldova and Turkey,” August 5, 2009.
20 Department of Foreign Trade Notification on an Initiation of Anti-Dumping Investigation of High Carbon Steel Wire Rod including High Carbon Steel Wire Rod Added Other Elements Originating in the People’s Republic of China B.E. 2555 (2012), November 2012, found at http://btir.dft.go.th/DocFiles/229_130306092725_Initiation%20Notification_HCWR.pdf.
VII-14
rod with 0.76 percent to 0.92 percent carbon content.21 In February 2013, Malaysia imposed
antidumping duties with a rate of 25.2 percent22 on imports of non-alloy wire rod from China
that is effective for five years.23 Additionally, Indonesia initiated a safeguard investigation on
imports of wire rod from many countries including China in January 2014.24 Indonesia’s Trade
Ministry passed a ministerial regulation on June 2, 2014, that importers of all alloy-added steel
products are required to apply for import permits and ensure that cargoes passed pre-shipment
inspections at loading ports. This ruling took effect on August 15, 2014, and will be effective
until December 31, 2016.25 Additionally, Turkey increased import duties on carbon steel wire
rod wire rod from 12 percent to 30-40 percent and on boron-added wire rod from 3 percent to
40 percent on October 18, 2014.26
INFORMATION ON NONSUBJECT COUNTRIES
General information
India is the world’s second largest producer of wire rod, after China; its wire rod
production in 2013 totaled *** short tons, representing *** percent of total global wire rod
production. Other large producers of wire rod include Germany, which produced *** short
tons, Japan which produced *** short tons, Italy which produced ***
21 Metal Bulletin, “Thailand levies anti-dumping duties on high-carbon wire rod from China,” May 20, 2014.
22 Jiangsu Shagang International Trade Co Ltd. and Jiangsu Yonggang Group Co Ltd. are exempt from the order.
23 CISA’s prehearing report, exh. 9. 24 WTO, Committee on Safeguards, Notification under Article 12.1(A), 24.01.2014 (Document
G/SG/N/6/IDN/24). 25 Steel Business Briefing, “Indonesia restricts imports of alloy-added steel,” August 19, 2014. 26 Steel Business Briefing, “Turkey raises import duty on rebar/wire rod; China targeted,” October 21,
2014.
VII-15
short tons, Brazil which produced *** short tons, and Turkey which produced *** short tons in
that year.27 28
Table VII-7 presents exports of bar and rod (including wire rod) to the world from 2011
to 2013. China is the leading source of such exports, with more than 8.7 million short tons in
2013. Worldwide exports from Germany, Japan, and Ukraine also exceeded 1.0 million short
tons in 2013. Exports from Germany and Japan, however, had substantially higher unit values
than those from either Ukraine or China in 2013.
27 Production figure may be over-inclusive because it encompasses all wire rod, including that outside of the scope of these investigations. ***.
28 Wire rod production statistics are also published by the World Steel Association (WSA) but not to the same degree of country coverage; for example, India is not listed among producers of wire rod in the most recent statistical release. WSA, Steel Statistical Yearbook 2014, November 6, 2014, table 19.
VII-16
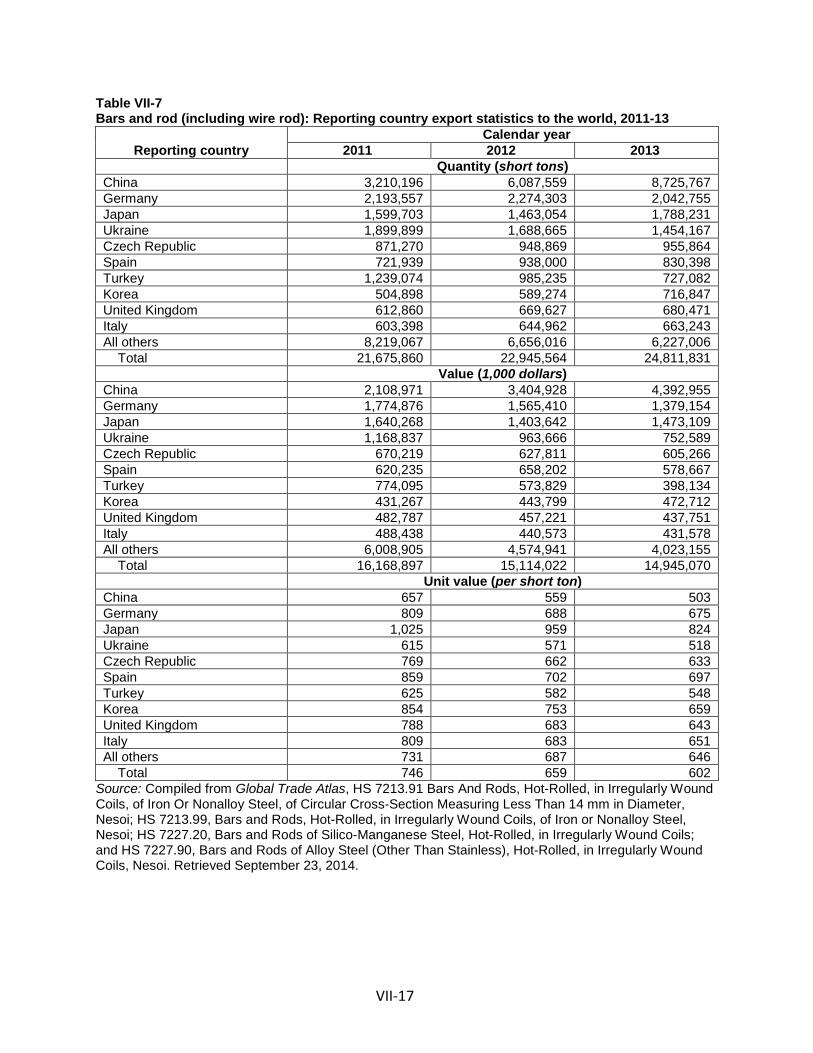
Table VII-7 Bars and rod (including wire rod): Reporting country export statistics to the world, 2011-13
Reporting country Calendar year
2011 2012 2013 Quantity (short tons) China 3,210,196 6,087,559 8,725,767 Germany 2,193,557 2,274,303 2,042,755 Japan 1,599,703 1,463,054 1,788,231 Ukraine 1,899,899 1,688,665 1,454,167 Czech Republic 871,270 948,869 955,864 Spain 721,939 938,000 830,398 Turkey 1,239,074 985,235 727,082 Korea 504,898 589,274 716,847 United Kingdom 612,860 669,627 680,471 Italy 603,398 644,962 663,243 All others 8,219,067 6,656,016 6,227,006 Total 21,675,860 22,945,564 24,811,831 Value (1,000 dollars) China 2,108,971 3,404,928 4,392,955 Germany 1,774,876 1,565,410 1,379,154 Japan 1,640,268 1,403,642 1,473,109 Ukraine 1,168,837 963,666 752,589 Czech Republic 670,219 627,811 605,266 Spain 620,235 658,202 578,667 Turkey 774,095 573,829 398,134 Korea 431,267 443,799 472,712 United Kingdom 482,787 457,221 437,751 Italy 488,438 440,573 431,578 All others 6,008,905 4,574,941 4,023,155 Total 16,168,897 15,114,022 14,945,070 Unit value (per short ton) China 657 559 503 Germany 809 688 675 Japan 1,025 959 824 Ukraine 615 571 518 Czech Republic 769 662 633 Spain 859 702 697 Turkey 625 582 548 Korea 854 753 659 United Kingdom 788 683 643 Italy 809 683 651 All others 731 687 646 Total 746 659 602
Source: Compiled from Global Trade Atlas, HS 7213.91 Bars And Rods, Hot-Rolled, in Irregularly Wound Coils, of Iron Or Nonalloy Steel, of Circular Cross-Section Measuring Less Than 14 mm in Diameter, Nesoi; HS 7213.99, Bars and Rods, Hot-Rolled, in Irregularly Wound Coils, of Iron or Nonalloy Steel, Nesoi; HS 7227.20, Bars and Rods of Silico-Manganese Steel, Hot-Rolled, in Irregularly Wound Coils; and HS 7227.90, Bars and Rods of Alloy Steel (Other Than Stainless), Hot-Rolled, in Irregularly Wound Coils, Nesoi. Retrieved September 23, 2014.
VII-17
Canada
The industry in Canada is not among the larger global producers and exporters of wire
rod. Nonetheless, Canada is a leading source of U.S. wire rod imports. The largest wire rod
producers in Canada are Ivaco Inc. (Heico) and ArcelorMittal. Combined, these producers have
an estimated wire rod and bar/rod/sections rolling capacity of nearly *** short tons in 2013.29
Other leading sources of wire rod to the United States
The industries in Germany and Japan are among the largest global producers and
exporters of wire rod. The largest wire rod producers in Germany include ArcelorMittal,
Badische Stahlwerke, Riva Stahl, and Saarstahl AG. Combined, these and smaller producers
have an estimated wire rod and bar/rod/sections rolling capacity of nearly *** short tons in
2013.30 The largest wire rod producers in Japan include JFE, Kobe Steel, Nakayama Steel Works,
and Nippon Steel & Sumitomo Metals Corp. Combined, these and smaller producers have an
estimated wire rod and bar/rod/sections rolling capacity of more than *** short tons.31
The industries in Brazil, Turkey, and the United Kingdom are not the largest global
producers and exporters of wire rod. Nonetheless, they have maintained a presence in the
United States. The largest wire rod producers in Brazil include ArcelorMittal and Gerdau.
29 ***. Capacity may be overstated due to shared production. 30 ***. Capacity may be overstated due to shared production. 31 ***. Capacity may be overstated due to shared production.
VII-18
Combined, these and smaller producers have an estimated wire rod and bar/rod/sections
rolling capacity of nearly *** short tons.32 The largest wire rod producers in Turkey include Cag
Celik, Isdemir, and Kroman Celik. Combined, these and smaller producers have an estimated
wire rod and bar/rod/sections rolling capacity of more than *** short tons.33 The largest wire
rod producers in the United Kingdom include Celsa and Mir Steel. Combined, these and smaller
producers have an estimated wire rod and bar/rod/sections rolling capacity of nearly *** short
tons.34
32 ***. Capacity may be overstated due to shared production. 33 ***. Capacity may be overstated due to shared production. 34 ***. Capacity may be overstated due to shared production.
VII-19


APPENDIX A
FEDERAL REGISTER NOTICES
A-1

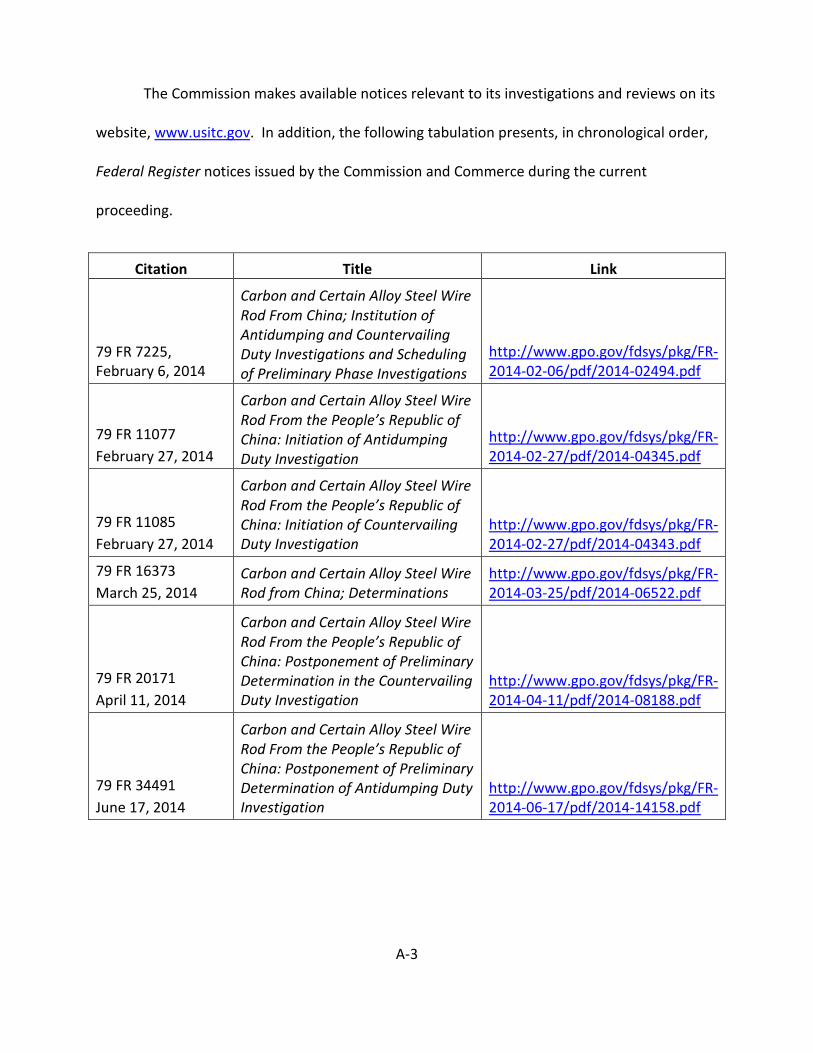
The Commission makes available notices relevant to its investigations and reviews on its
website, www.usitc.gov. In addition, the following tabulation presents, in chronological order,
Federal Register notices issued by the Commission and Commerce during the current
proceeding.
Citation Title Link
79 FR 7225, February 6, 2014
Carbon and Certain Alloy Steel Wire Rod From China; Institution of Antidumping and Countervailing Duty Investigations and Scheduling of Preliminary Phase Investigations
http://www.gpo.gov/fdsys/pkg/FR-2014-02-06/pdf/2014-02494.pdf
79 FR 11077 February 27, 2014
Carbon and Certain Alloy Steel Wire Rod From the People’s Republic of China: Initiation of Antidumping Duty Investigation
http://www.gpo.gov/fdsys/pkg/FR-2014-02-27/pdf/2014-04345.pdf
79 FR 11085 February 27, 2014
Carbon and Certain Alloy Steel Wire Rod From the People’s Republic of China: Initiation of Countervailing Duty Investigation
http://www.gpo.gov/fdsys/pkg/FR-2014-02-27/pdf/2014-04343.pdf
79 FR 16373 March 25, 2014
Carbon and Certain Alloy Steel Wire Rod from China; Determinations
http://www.gpo.gov/fdsys/pkg/FR-2014-03-25/pdf/2014-06522.pdf
79 FR 20171 April 11, 2014
Carbon and Certain Alloy Steel Wire Rod From the People’s Republic of China: Postponement of Preliminary Determination in the Countervailing Duty Investigation
http://www.gpo.gov/fdsys/pkg/FR-2014-04-11/pdf/2014-08188.pdf
79 FR 34491 June 17, 2014
Carbon and Certain Alloy Steel Wire Rod From the People’s Republic of China: Postponement of Preliminary Determination of Antidumping Duty Investigation
http://www.gpo.gov/fdsys/pkg/FR-2014-06-17/pdf/2014-14158.pdf
A-3

79 FR 38490 July 8, 2014
Carbon and Certain Alloy Steel Wire Rod From the People’s Republic of China: Preliminary Affirmative Countervailing Duty Determination, Preliminary Affirmative Critical Circumstances Determination, and Alignment of Final Countervailing Duty Determination With Final Antidumping Duty Determination
http://www.gpo.gov/fdsys/pkg/FR-2014-07-08/pdf/2014-15949.pdf
79 FR 53169 September 8, 2014
Carbon and Certain Alloy Steel Wire Rod From the People’s Republic of China: Preliminary Determination of Sales at Less Than Fair Value and Preliminary Affirmative Determination of Critical Circumstances, in Part
http://www.gpo.gov/fdsys/pkg/FR-2014-09-08/pdf/2014-21335.pdf
79 FR 56827 September 23, 2014
Carbon and Certain Alloy Steel Wire Rod From China; Scheduling of the Final Phase of Countervailing Duty and Antidumping Duty Investigations
http://www.gpo.gov/fdsys/pkg/FR-2014-09-23/pdf/2014-22559.pdf
79 FR 68858 November 19, 2014
Carbon and Certain Alloy Steel Wire Rod from the People’s Republic of China: Final Affirmative Countervailing Duty Determination and Final Affirmative Critical Circumstances Determination
http://www.gpo.gov/fdsys/pkg/FR-2014-11-19/pdf/2014-27410.pdf
79 FR 68860 November 19, 2014
Carbon and Certain Alloy Steel Wire Rod from the People’s Republic of China: Final Determination of Sales at Less Than Fair Value and Final Affirmative Determination of Critical Circumstances, in Part
http://www.gpo.gov/fdsys/pkg/FR-2014-11-19/pdf/2014-27412.pdf
A-4

B-1
APPENDIX B
CALENDAR OF THE PUBLIC HEARING

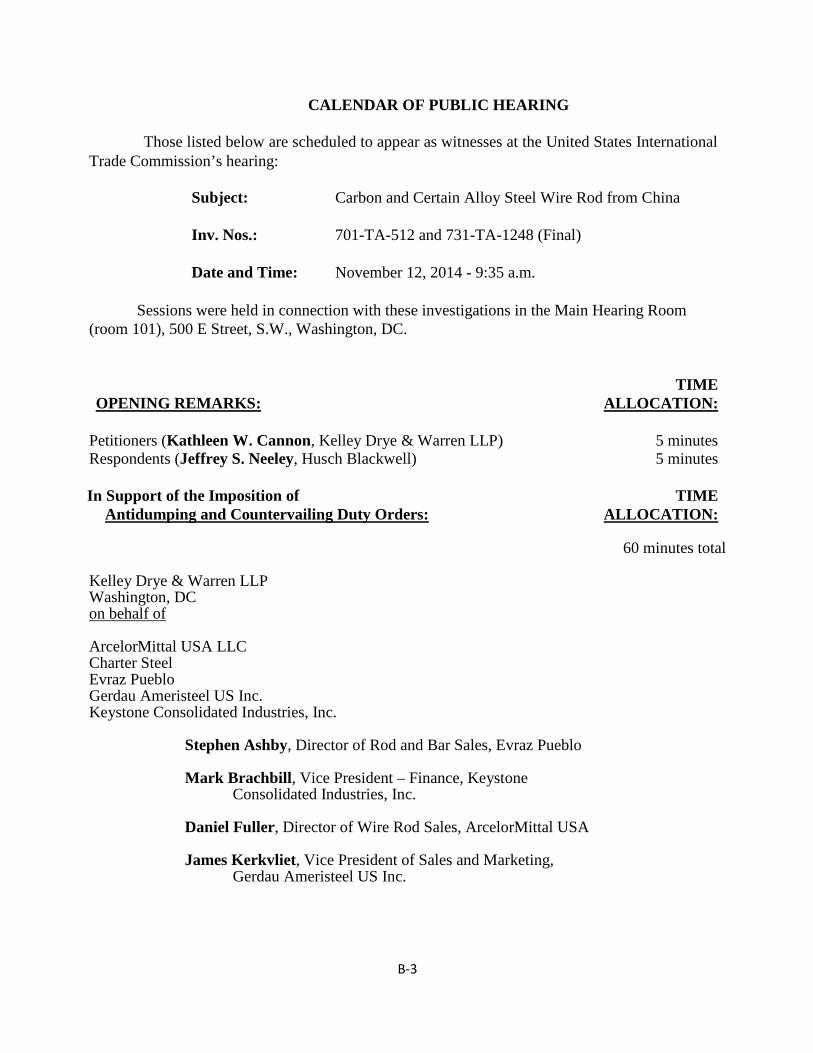
CALENDAR OF PUBLIC HEARING
Those listed below are scheduled to appear as witnesses at the United States International Trade Commission’s hearing:
Subject: Carbon and Certain Alloy Steel Wire Rod from China
Inv. Nos.: 701-TA-512 and 731-TA-1248 (Final)
Date and Time: November 12, 2014 - 9:35 a.m.
Sessions were held in connection with these investigations in the Main Hearing Room
(room 101), 500 E Street, S.W., Washington, DC. TIME
OPENING REMARKS: ALLOCATION: Petitioners (Kathleen W. Cannon, Kelley Drye & Warren LLP) 5 minutes Respondents (Jeffrey S. Neeley, Husch Blackwell) 5 minutes
In Support of the Imposition of TIME Antidumping and Countervailing Duty Orders: ALLOCATION:
60 minutes total Kelley Drye & Warren LLP Washington, DC on behalf of ArcelorMittal USA LLC Charter Steel Evraz Pueblo Gerdau Ameristeel US Inc. Keystone Consolidated Industries, Inc. Stephen Ashby, Director of Rod and Bar Sales, Evraz Pueblo
Mark Brachbill, Vice President – Finance, Keystone Consolidated Industries, Inc. Daniel Fuller, Director of Wire Rod Sales, ArcelorMittal USA James Kerkvliet, Vice President of Sales and Marketing,
Gerdau Ameristeel US Inc.
B-3
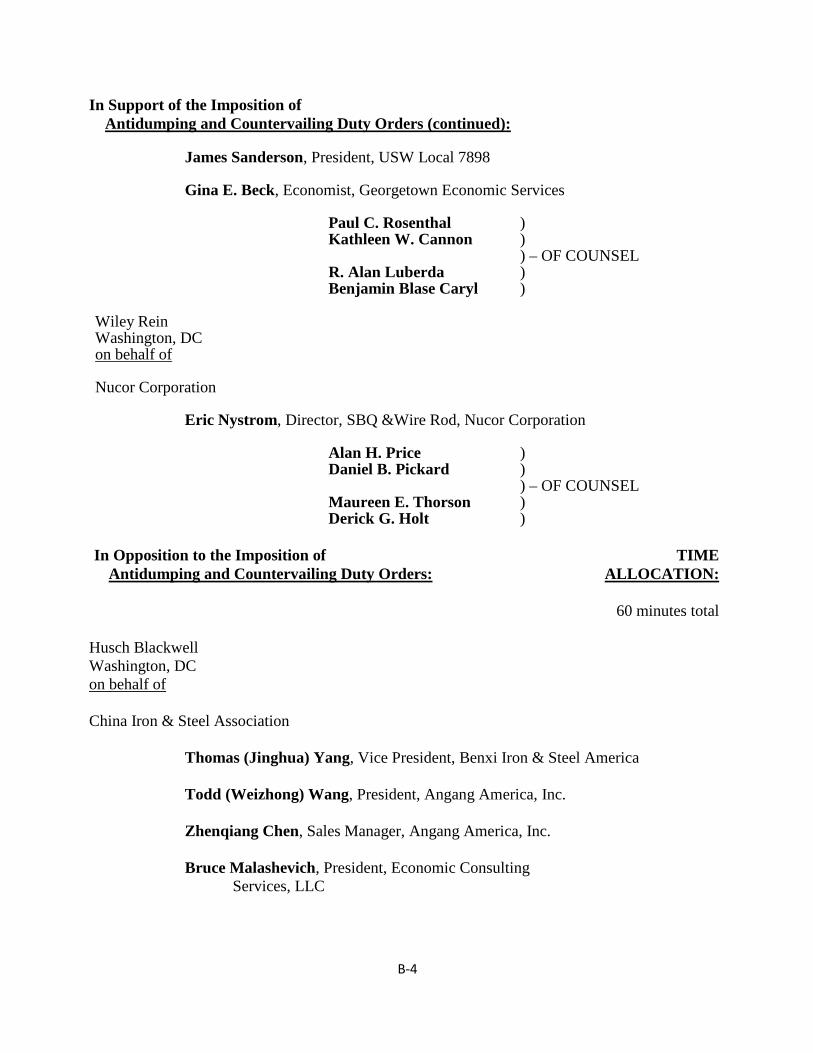
In Support of the Imposition of Antidumping and Countervailing Duty Orders (continued): James Sanderson, President, USW Local 7898 Gina E. Beck, Economist, Georgetown Economic Services Paul C. Rosenthal ) Kathleen W. Cannon ) ) – OF COUNSEL R. Alan Luberda ) Benjamin Blase Caryl ) Wiley Rein Washington, DC on behalf of Nucor Corporation Eric Nystrom, Director, SBQ &Wire Rod, Nucor Corporation Alan H. Price ) Daniel B. Pickard ) ) – OF COUNSEL
Maureen E. Thorson ) Derick G. Holt )
In Opposition to the Imposition of TIME Antidumping and Countervailing Duty Orders: ALLOCATION:
60 minutes total Husch Blackwell Washington, DC on behalf of China Iron & Steel Association Thomas (Jinghua) Yang, Vice President, Benxi Iron & Steel America
Todd (Weizhong) Wang, President, Angang America, Inc. Zhenqiang Chen, Sales Manager, Angang America, Inc. Bruce Malashevich, President, Economic Consulting
Services, LLC
B-4
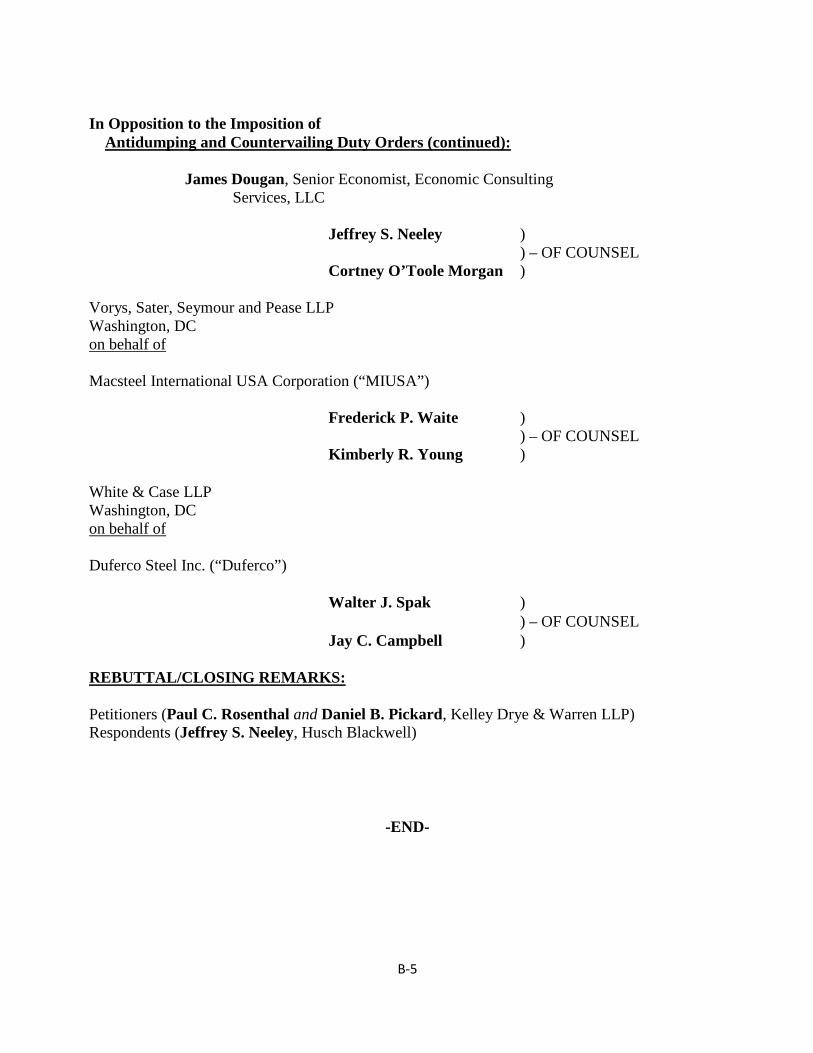
In Opposition to the Imposition of Antidumping and Countervailing Duty Orders (continued): James Dougan, Senior Economist, Economic Consulting
Services, LLC Jeffrey S. Neeley ) ) – OF COUNSEL Cortney O’Toole Morgan ) Vorys, Sater, Seymour and Pease LLP Washington, DC on behalf of Macsteel International USA Corporation (“MIUSA”) Frederick P. Waite ) ) – OF COUNSEL Kimberly R. Young ) White & Case LLP Washington, DC on behalf of
Duferco Steel Inc. (“Duferco”) Walter J. Spak ) ) – OF COUNSEL Jay C. Campbell ) REBUTTAL/CLOSING REMARKS: Petitioners (Paul C. Rosenthal and Daniel B. Pickard, Kelley Drye & Warren LLP) Respondents (Jeffrey S. Neeley, Husch Blackwell)
-END-
B-5


C-1
APPENDIX C
SUMMARY DATA

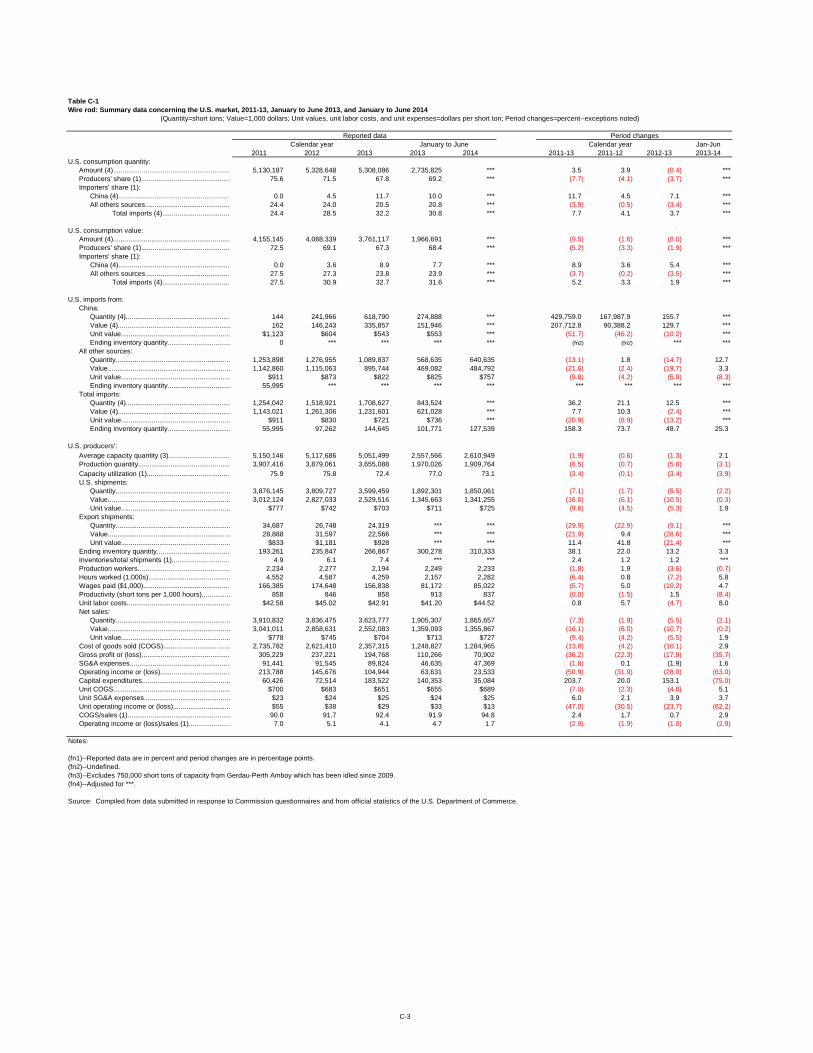
C-3
Table C-1Wire rod: Summary data concerning the U.S. market, 2011-13, January to June 2013, and January to June 2014
Jan-Jun2011 2012 2013 2013 2014 2011-13 2011-12 2012-13 2013-14
U.S. consumption quantity:Amount (4)............................................................. 5,130,187 5,328,648 5,308,086 2,735,825 *** 3.5 3.9 (0.4) ***Producers' share (1).............................................. 75.6 71.5 67.8 69.2 *** (7.7) (4.1) (3.7) ***Importers' share (1):
China (4).......................................................... 0.0 4.5 11.7 10.0 *** 11.7 4.5 7.1 ***All others sources............................................ 24.4 24.0 20.5 20.8 *** (3.9) (0.5) (3.4) ***
Total imports (4)................................... 24.4 28.5 32.2 30.8 *** 7.7 4.1 3.7 ***
U.S. consumption value:Amount (4)............................................................. 4,155,145 4,088,339 3,761,117 1,966,691 *** (9.5) (1.6) (8.0) ***Producers' share (1).............................................. 72.5 69.1 67.3 68.4 *** (5.2) (3.3) (1.9) ***Importers' share (1):
China (4).......................................................... 0.0 3.6 8.9 7.7 *** 8.9 3.6 5.4 ***All others sources............................................ 27.5 27.3 23.8 23.9 *** (3.7) (0.2) (3.5) ***
Total imports (4)................................... 27.5 30.9 32.7 31.6 *** 5.2 3.3 1.9 ***
U.S. imports from:China:
Quantity (4)...................................................... 144 241,966 618,790 274,888 *** 429,759.0 167,987.9 155.7 ***Value (4)........................................................... 162 146,243 335,857 151,946 *** 207,712.8 90,388.2 129.7 ***Unit value......................................................... $1,123 $604 $543 $553 *** (51.7) (46.2) (10.2) ***Ending inventory quantity................................. 0 *** *** *** *** (fn2) (fn2) *** ***
All other sources:Quantity............................................................ 1,253,898 1,276,955 1,089,837 568,635 640,635 (13.1) 1.8 (14.7) 12.7 Value................................................................ 1,142,860 1,115,063 895,744 469,082 484,792 (21.6) (2.4) (19.7) 3.3 Unit value......................................................... $911 $873 $822 $825 $757 (9.8) (4.2) (5.9) (8.3) Ending inventory quantity................................. 55,995 *** *** *** *** *** *** *** ***
Total imports:Quantity (4)...................................................... 1,254,042 1,518,921 1,708,627 843,524 *** 36.2 21.1 12.5 ***Value (4)........................................................... 1,143,021 1,261,306 1,231,601 621,028 *** 7.7 10.3 (2.4) ***Unit value......................................................... $911 $830 $721 $736 *** (20.9) (8.9) (13.2) ***Ending inventory quantity................................. 55,995 97,262 144,645 101,771 127,539 158.3 73.7 48.7 25.3
U.S. producers':Average capacity quantity (3)................................ 5,150,146 5,117,686 5,051,499 2,557,566 2,610,949 (1.9) (0.6) (1.3) 2.1 Production quantity................................................ 3,907,416 3,879,061 3,655,088 1,970,026 1,909,764 (6.5) (0.7) (5.8) (3.1) Capacity utilization (1)........................................... 75.9 75.8 72.4 77.0 73.1 (3.4) (0.1) (3.4) (3.9) U.S. shipments:
Quantity............................................................ 3,876,145 3,809,727 3,599,459 1,892,301 1,850,061 (7.1) (1.7) (5.5) (2.2) Value................................................................ 3,012,124 2,827,033 2,529,516 1,345,663 1,341,255 (16.0) (6.1) (10.5) (0.3) Unit value......................................................... $777 $742 $703 $711 $725 (9.6) (4.5) (5.3) 1.9
Export shipments:Quantity............................................................ 34,687 26,748 24,319 *** *** (29.9) (22.9) (9.1) ***Value................................................................ 28,888 31,597 22,566 *** *** (21.9) 9.4 (28.6) ***Unit value......................................................... $833 $1,181 $928 *** *** 11.4 41.8 (21.4) ***
Ending inventory quantity...................................... 193,261 235,847 266,867 300,278 310,333 38.1 22.0 13.2 3.3 Inventories/total shipments (1).............................. 4.9 6.1 7.4 *** *** 2.4 1.2 1.2 ***Production workers................................................ 2,234 2,277 2,194 2,249 2,233 (1.8) 1.9 (3.6) (0.7) Hours worked (1,000s)........................................... 4,552 4,587 4,259 2,157 2,282 (6.4) 0.8 (7.2) 5.8 Wages paid ($1,000)............................................. 166,385 174,648 156,838 81,172 85,022 (5.7) 5.0 (10.2) 4.7 Productivity (short tons per 1,000 hours)............... 858 846 858 913 837 (0.0) (1.5) 1.5 (8.4) Unit labor costs...................................................... $42.58 $45.02 $42.91 $41.20 $44.52 0.8 5.7 (4.7) 8.0 Net sales:
Quantity............................................................ 3,910,832 3,836,475 3,623,777 1,905,307 1,865,657 (7.3) (1.9) (5.5) (2.1) Value................................................................ 3,041,011 2,858,631 2,552,083 1,359,093 1,355,867 (16.1) (6.0) (10.7) (0.2) Unit value......................................................... $778 $745 $704 $713 $727 (9.4) (4.2) (5.5) 1.9
Cost of goods sold (COGS)................................... 2,735,782 2,621,410 2,357,315 1,248,827 1,284,965 (13.8) (4.2) (10.1) 2.9 Gross profit or (loss).............................................. 305,229 237,221 194,768 110,266 70,902 (36.2) (22.3) (17.9) (35.7) SG&A expenses.................................................... 91,441 91,545 89,824 46,635 47,369 (1.8) 0.1 (1.9) 1.6 Operating income or (loss).................................... 213,788 145,676 104,944 63,631 23,533 (50.9) (31.9) (28.0) (63.0) Capital expenditures.............................................. 60,426 72,514 183,522 140,353 35,084 203.7 20.0 153.1 (75.0) Unit COGS............................................................. $700 $683 $651 $655 $689 (7.0) (2.3) (4.8) 5.1 Unit SG&A expenses............................................. $23 $24 $25 $24 $25 6.0 2.1 3.9 3.7 Unit operating income or (loss).............................. $55 $38 $29 $33 $13 (47.0) (30.5) (23.7) (62.2) COGS/sales (1)...................................................... 90.0 91.7 92.4 91.9 94.8 2.4 1.7 0.7 2.9 Operating income or (loss)/sales (1)...................... 7.0 5.1 4.1 4.7 1.7 (2.9) (1.9) (1.0) (2.9)
Notes:
(fn1)--Reported data are in percent and period changes are in percentage points.(fn2)--Undefined. (fn3)--Excludes 750,000 short tons of capacity from Gerdau-Perth Amboy which has been idled since 2009.(fn4)--Adjusted for ***.
Source: Compiled from data submitted in response to Commission questionnaires and from official statistics of the U.S. Department of Commerce.
(Quantity=short tons; Value=1,000 dollars; Unit values, unit labor costs, and unit expenses=dollars per short ton; Period changes=percent--exceptions noted)
Reported data Period changesCalendar year January to June Calendar year
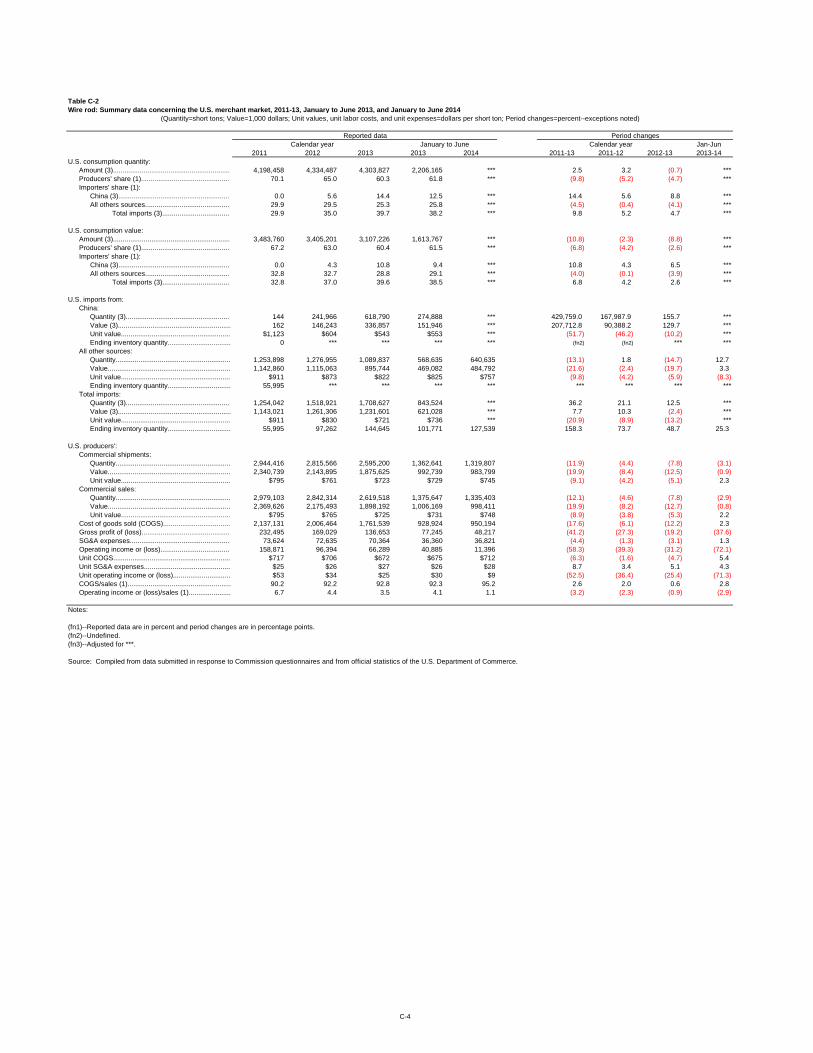
C-4
Table C-2Wire rod: Summary data concerning the U.S. merchant market, 2011-13, January to June 2013, and January to June 2014
Jan-Jun2011 2012 2013 2013 2014 2011-13 2011-12 2012-13 2013-14
U.S. consumption quantity:Amount (3)............................................................. 4,198,458 4,334,487 4,303,827 2,206,165 *** 2.5 3.2 (0.7) ***Producers' share (1).............................................. 70.1 65.0 60.3 61.8 *** (9.8) (5.2) (4.7) ***Importers' share (1):
China (3).......................................................... 0.0 5.6 14.4 12.5 *** 14.4 5.6 8.8 ***All others sources............................................ 29.9 29.5 25.3 25.8 *** (4.5) (0.4) (4.1) ***
Total imports (3)................................... 29.9 35.0 39.7 38.2 *** 9.8 5.2 4.7 ***
U.S. consumption value:Amount (3)............................................................. 3,483,760 3,405,201 3,107,226 1,613,767 *** (10.8) (2.3) (8.8) ***Producers' share (1).............................................. 67.2 63.0 60.4 61.5 *** (6.8) (4.2) (2.6) ***Importers' share (1):
China (3).......................................................... 0.0 4.3 10.8 9.4 *** 10.8 4.3 6.5 ***All others sources............................................ 32.8 32.7 28.8 29.1 *** (4.0) (0.1) (3.9) ***
Total imports (3)................................... 32.8 37.0 39.6 38.5 *** 6.8 4.2 2.6 ***
U.S. imports from:China:
Quantity (3)...................................................... 144 241,966 618,790 274,888 *** 429,759.0 167,987.9 155.7 ***Value (3)........................................................... 162 146,243 336,857 151,946 *** 207,712.8 90,388.2 129.7 ***Unit value......................................................... $1,123 $604 $543 $553 *** (51.7) (46.2) (10.2) ***Ending inventory quantity................................. 0 *** *** *** *** (fn2) (fn2) *** ***
All other sources:Quantity............................................................ 1,253,898 1,276,955 1,089,837 568,635 640,635 (13.1) 1.8 (14.7) 12.7 Value................................................................ 1,142,860 1,115,063 895,744 469,082 484,792 (21.6) (2.4) (19.7) 3.3 Unit value......................................................... $911 $873 $822 $825 $757 (9.8) (4.2) (5.9) (8.3) Ending inventory quantity................................. 55,995 *** *** *** *** *** *** *** ***
Total imports:Quantity (3)...................................................... 1,254,042 1,518,921 1,708,627 843,524 *** 36.2 21.1 12.5 ***Value (3)........................................................... 1,143,021 1,261,306 1,231,601 621,028 *** 7.7 10.3 (2.4) ***Unit value......................................................... $911 $830 $721 $736 *** (20.9) (8.9) (13.2) ***Ending inventory quantity................................. 55,995 97,262 144,645 101,771 127,539 158.3 73.7 48.7 25.3
U.S. producers':Commercial shipments:
Quantity............................................................ 2,944,416 2,815,566 2,595,200 1,362,641 1,319,807 (11.9) (4.4) (7.8) (3.1) Value................................................................ 2,340,739 2,143,895 1,875,625 992,739 983,799 (19.9) (8.4) (12.5) (0.9) Unit value......................................................... $795 $761 $723 $729 $745 (9.1) (4.2) (5.1) 2.3
Commercial sales:Quantity............................................................ 2,979,103 2,842,314 2,619,518 1,375,647 1,335,403 (12.1) (4.6) (7.8) (2.9) Value................................................................ 2,369,626 2,175,493 1,898,192 1,006,169 998,411 (19.9) (8.2) (12.7) (0.8) Unit value......................................................... $795 $765 $725 $731 $748 (8.9) (3.8) (5.3) 2.2
Cost of goods sold (COGS)................................... 2,137,131 2,006,464 1,761,539 928,924 950,194 (17.6) (6.1) (12.2) 2.3 Gross profit of (loss).............................................. 232,495 169,029 136,653 77,245 48,217 (41.2) (27.3) (19.2) (37.6) SG&A expenses.................................................... 73,624 72,635 70,364 36,360 36,821 (4.4) (1.3) (3.1) 1.3 Operating income or (loss).................................... 158,871 96,394 66,289 40,885 11,396 (58.3) (39.3) (31.2) (72.1) Unit COGS............................................................. $717 $706 $672 $675 $712 (6.3) (1.6) (4.7) 5.4 Unit SG&A expenses............................................. $25 $26 $27 $26 $28 8.7 3.4 5.1 4.3 Unit operating income or (loss).............................. $53 $34 $25 $30 $9 (52.5) (36.4) (25.4) (71.3) COGS/sales (1)...................................................... 90.2 92.2 92.8 92.3 95.2 2.6 2.0 0.6 2.8 Operating income or (loss)/sales (1)...................... 6.7 4.4 3.5 4.1 1.1 (3.2) (2.3) (0.9) (2.9)
Notes:
(fn1)--Reported data are in percent and period changes are in percentage points.(fn2)--Undefined. (fn3)--Adjusted for ***.
Source: Compiled from data submitted in response to Commission questionnaires and from official statistics of the U.S. Department of Commerce.
(Quantity=short tons; Value=1,000 dollars; Unit values, unit labor costs, and unit expenses=dollars per short ton; Period changes=percent--exceptions noted)
Reported data Period changesCalendar year January to June Calendar year
D‐1
APPENDIX D
NONSUBJECT COUNTRY PRICE DATA

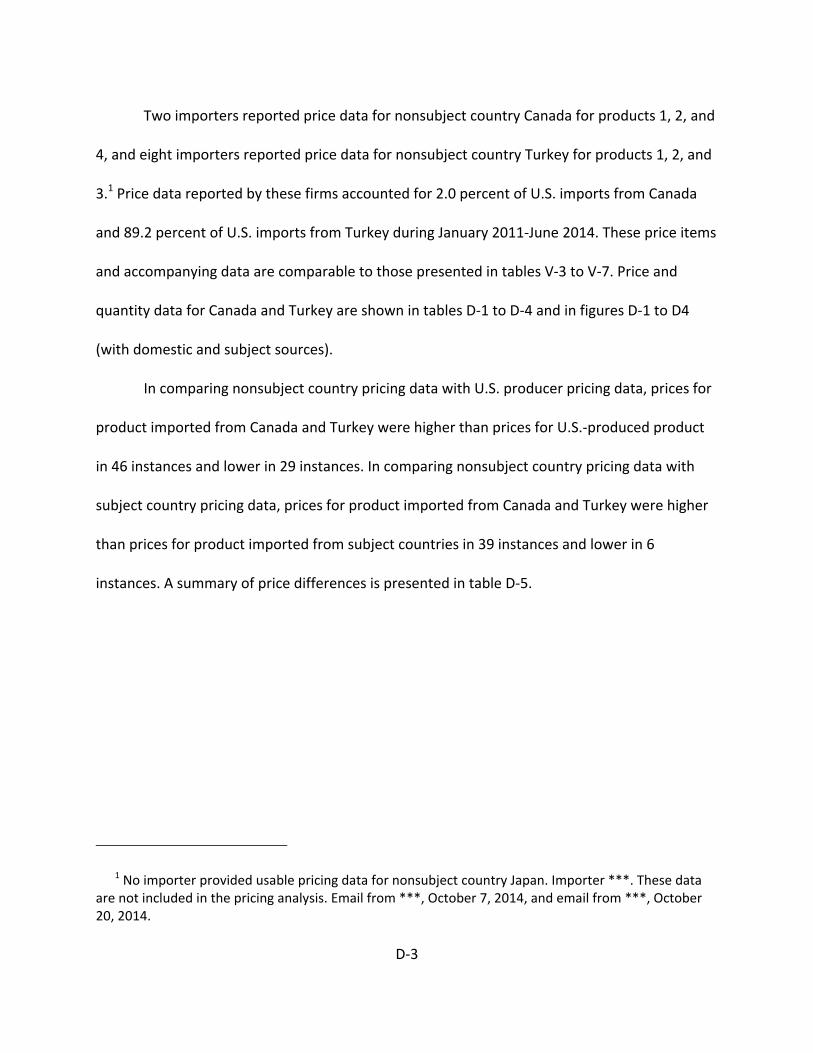
D‐3
Two importers reported price data for nonsubject country Canada for products 1, 2, and
4, and eight importers reported price data for nonsubject country Turkey for products 1, 2, and
3.1 Price data reported by these firms accounted for 2.0 percent of U.S. imports from Canada
and 89.2 percent of U.S. imports from Turkey during January 2011‐June 2014. These price items
and accompanying data are comparable to those presented in tables V‐3 to V‐7. Price and
quantity data for Canada and Turkey are shown in tables D‐1 to D‐4 and in figures D‐1 to D4
(with domestic and subject sources).
In comparing nonsubject country pricing data with U.S. producer pricing data, prices for
product imported from Canada and Turkey were higher than prices for U.S.‐produced product
in 46 instances and lower in 29 instances. In comparing nonsubject country pricing data with
subject country pricing data, prices for product imported from Canada and Turkey were higher
than prices for product imported from subject countries in 39 instances and lower in 6
instances. A summary of price differences is presented in table D‐5.
1 No importer provided usable pricing data for nonsubject country Japan. Importer ***. These data are not included in the pricing analysis. Email from ***, October 7, 2014, and email from ***, October 20, 2014.
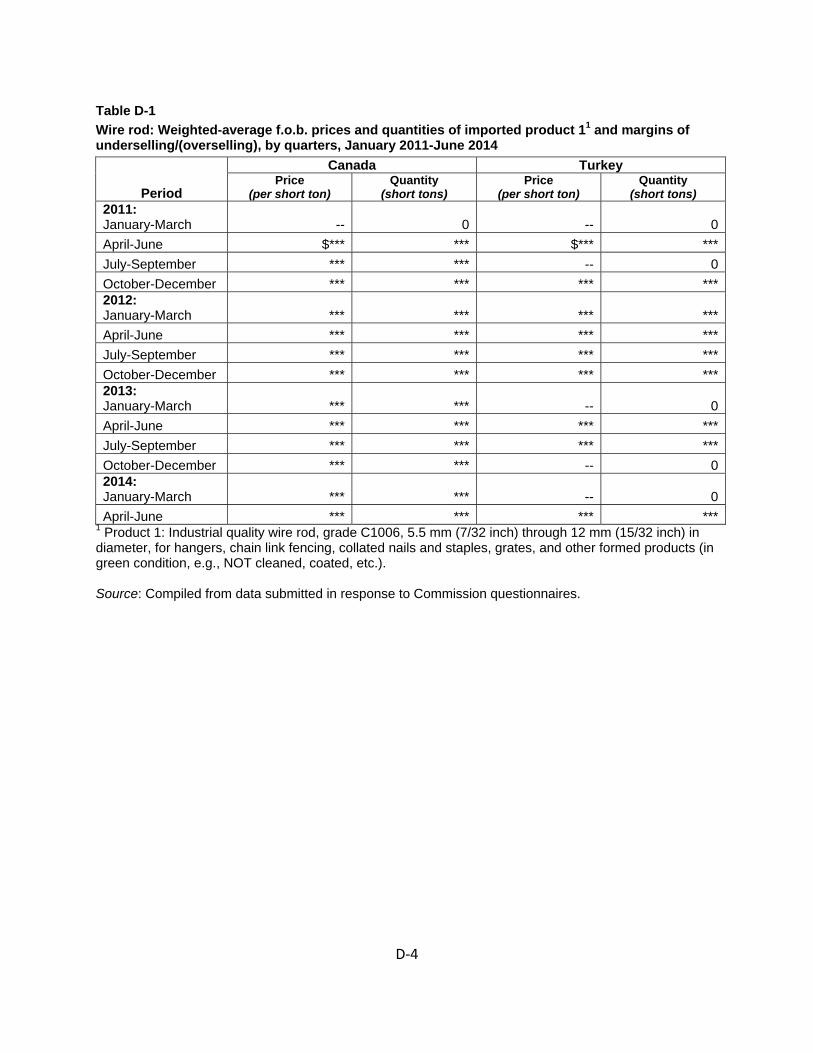
D‐4
Table D-1 Wire rod: Weighted-average f.o.b. prices and quantities of imported product 11 and margins of underselling/(overselling), by quarters, January 2011-June 2014
Period
Canada Turkey Price
(per short ton) Quantity
(short tons) Price
(per short ton) Quantity
(short tons) 2011: January-March -- 0 -- 0 April-June $*** *** $*** ***July-September *** *** -- 0 October-December *** *** *** ***2012: January-March *** *** *** ***April-June *** *** *** ***July-September *** *** *** ***October-December *** *** *** ***2013: January-March *** *** -- 0 April-June *** *** *** ***July-September *** *** *** ***October-December *** *** -- 0 2014: January-March *** *** -- 0 April-June *** *** *** ***
1 Product 1: Industrial quality wire rod, grade C1006, 5.5 mm (7/32 inch) through 12 mm (15/32 inch) in diameter, for hangers, chain link fencing, collated nails and staples, grates, and other formed products (in green condition, e.g., NOT cleaned, coated, etc.). Source: Compiled from data submitted in response to Commission questionnaires.
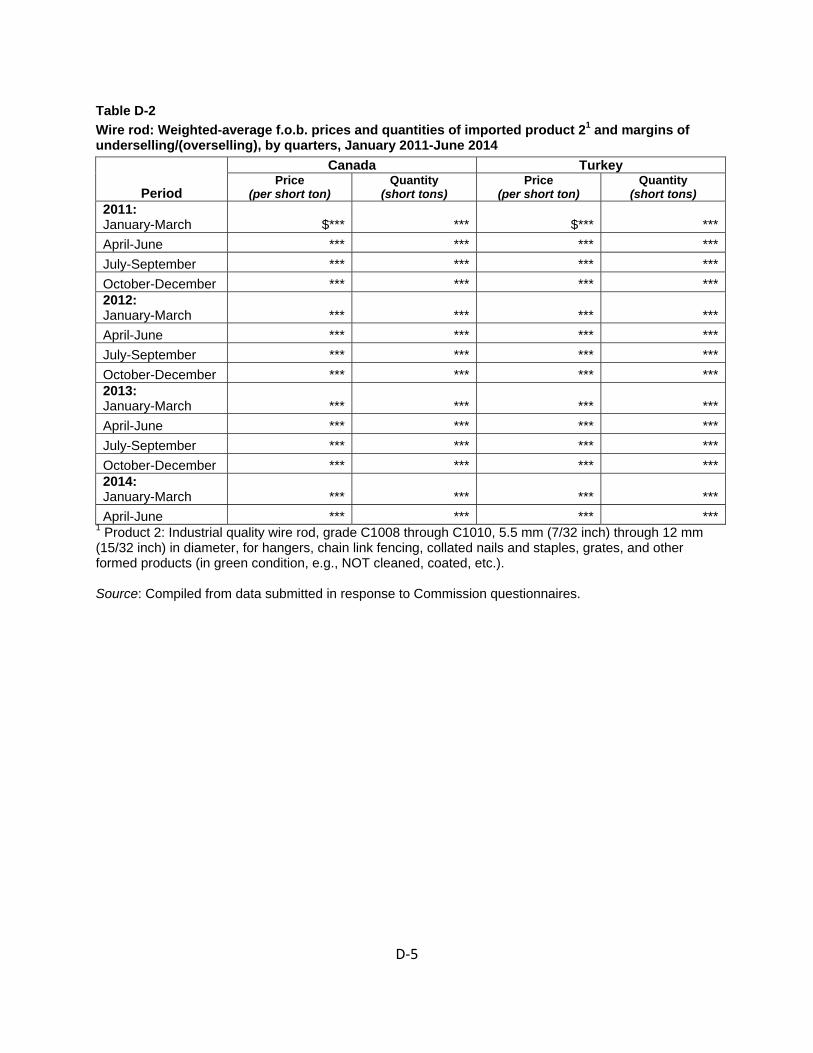
D‐5
Table D-2 Wire rod: Weighted-average f.o.b. prices and quantities of imported product 21 and margins of underselling/(overselling), by quarters, January 2011-June 2014
Period
Canada Turkey Price
(per short ton) Quantity
(short tons) Price
(per short ton) Quantity
(short tons) 2011: January-March $*** *** $*** ***April-June *** *** *** ***July-September *** *** *** ***October-December *** *** *** ***2012: January-March *** *** *** ***April-June *** *** *** ***July-September *** *** *** ***October-December *** *** *** ***2013: January-March *** *** *** ***April-June *** *** *** ***July-September *** *** *** ***October-December *** *** *** ***2014: January-March *** *** *** ***April-June *** *** *** ***
1 Product 2: Industrial quality wire rod, grade C1008 through C1010, 5.5 mm (7/32 inch) through 12 mm (15/32 inch) in diameter, for hangers, chain link fencing, collated nails and staples, grates, and other formed products (in green condition, e.g., NOT cleaned, coated, etc.). Source: Compiled from data submitted in response to Commission questionnaires.
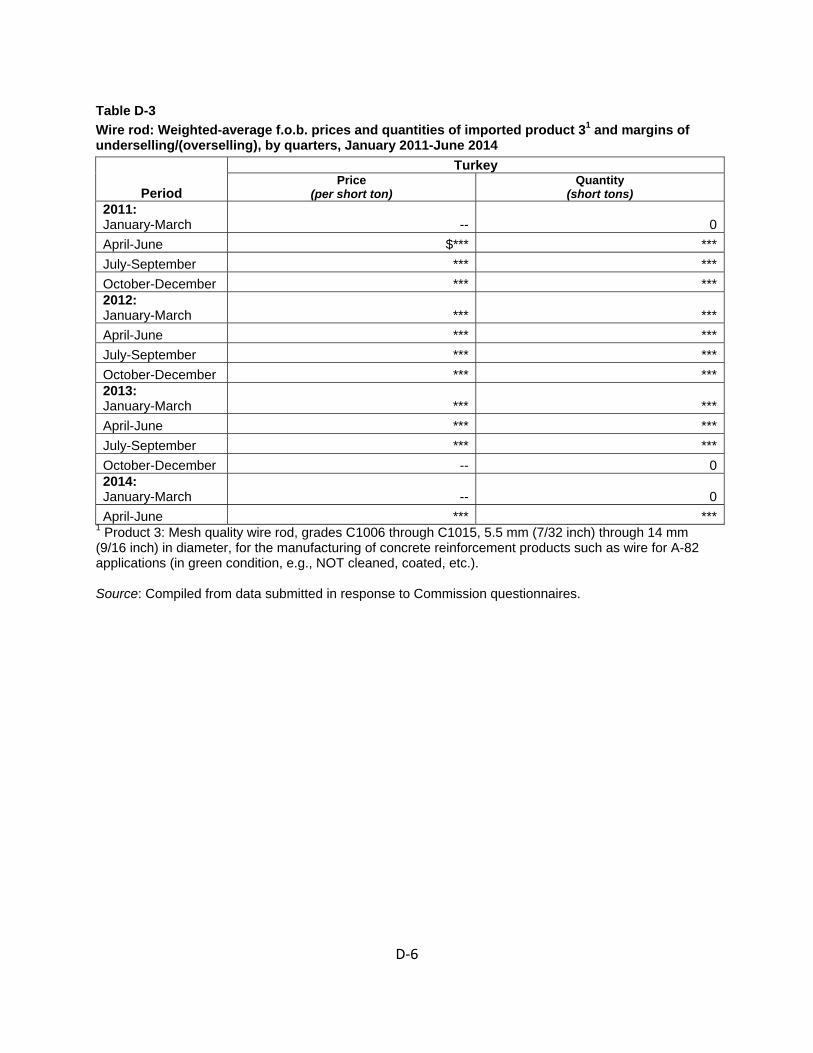
D‐6
Table D-3 Wire rod: Weighted-average f.o.b. prices and quantities of imported product 31 and margins of underselling/(overselling), by quarters, January 2011-June 2014
Period
Turkey Price
(per short ton) Quantity
(short tons) 2011: January-March -- 0 April-June $*** ***July-September *** ***October-December *** ***2012: January-March *** ***April-June *** ***July-September *** ***October-December *** ***2013: January-March *** ***April-June *** ***July-September *** ***October-December -- 0 2014: January-March -- 0 April-June *** ***
1 Product 3: Mesh quality wire rod, grades C1006 through C1015, 5.5 mm (7/32 inch) through 14 mm (9/16 inch) in diameter, for the manufacturing of concrete reinforcement products such as wire for A-82 applications (in green condition, e.g., NOT cleaned, coated, etc.). Source: Compiled from data submitted in response to Commission questionnaires.
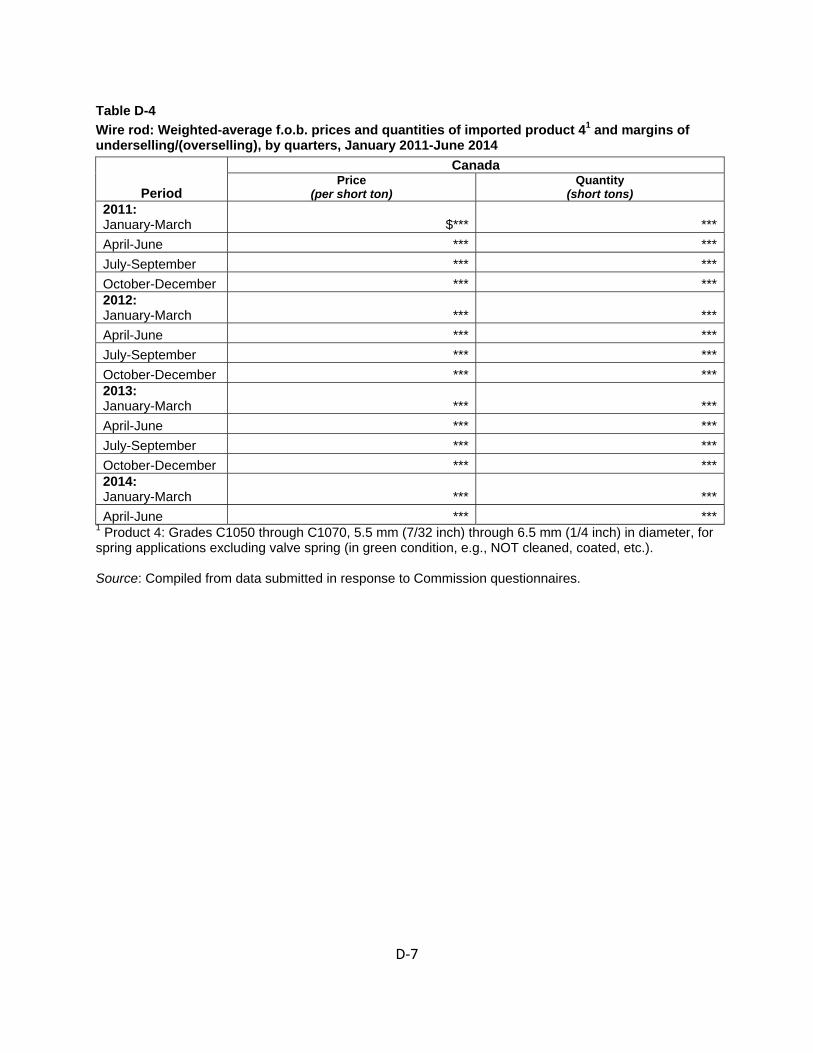
D‐7
Table D-4 Wire rod: Weighted-average f.o.b. prices and quantities of imported product 41 and margins of underselling/(overselling), by quarters, January 2011-June 2014
Period
Canada Price
(per short ton) Quantity
(short tons) 2011: January-March $*** ***April-June *** ***July-September *** ***October-December *** ***2012: January-March *** ***April-June *** ***July-September *** ***October-December *** ***2013: January-March *** ***April-June *** ***July-September *** ***October-December *** ***2014: January-March *** ***April-June *** ***
1 Product 4: Grades C1050 through C1070, 5.5 mm (7/32 inch) through 6.5 mm (1/4 inch) in diameter, for spring applications excluding valve spring (in green condition, e.g., NOT cleaned, coated, etc.). Source: Compiled from data submitted in response to Commission questionnaires.
D‐8
Figure D-1 Wire rod: Weighted-average prices and quantities of domestic and imported product 1,1 by quarters, January 2011-June 2014
* * * * * * *
1 Product 1: Industrial quality wire rod, grade C1006, 5.5 mm (7/32 inch) through 12 mm (15/32 inch) in diameter, for hangers, chain link fencing, collated nails and staples, grates, and other formed products (in green condition, e.g., NOT cleaned, coated, etc.). Source: Compiled from data submitted in response to Commission questionnaires.
D‐9
Figure D-2 Wire rod: Weighted-average prices and quantities of domestic and imported product 2,1 by quarters, January 2011-June 2014
* * * * * * *
1 Product 2: Industrial quality wire rod, grade C1008 through C1010, 5.5 mm (7/32 inch) through 12 mm (15/32 inch) in diameter, for hangers, chain link fencing, collated nails and staples, grates, and other formed products (in green condition, e.g., NOT cleaned, coated, etc.). Source: Compiled from data submitted in response to Commission questionnaires.

D‐10
Figure D-3 Wire rod: Weighted-average prices and quantities of domestic and imported product 3,1 by quarters, January 2011-June 2014
* * * * * * *
1 Product 3: Mesh quality wire rod, grades C1006 through C1015, 5.5 mm (7/32 inch) through 14 mm (9/16 inch) in diameter, for the manufacturing of concrete reinforcement products such as wire for A-82 applications (in green condition, e.g., NOT cleaned, coated, etc.). Source: Compiled from data submitted in response to Commission questionnaires.
D‐11
Figure D-4 Wire rod: Weighted-average prices and quantities of domestic and imported product 4,1 by quarters, January 2011-June 2014
* * * * * * *
1 Product 4: Grades C1050 through C1070, 5.5 mm (7/32 inch) through 6.5 mm (1/4 inch) in diameter, for spring applications excluding valve spring (in green condition, e.g., NOT cleaned, coated, etc.). Source: Compiled from data submitted in response to Commission questionnaires.
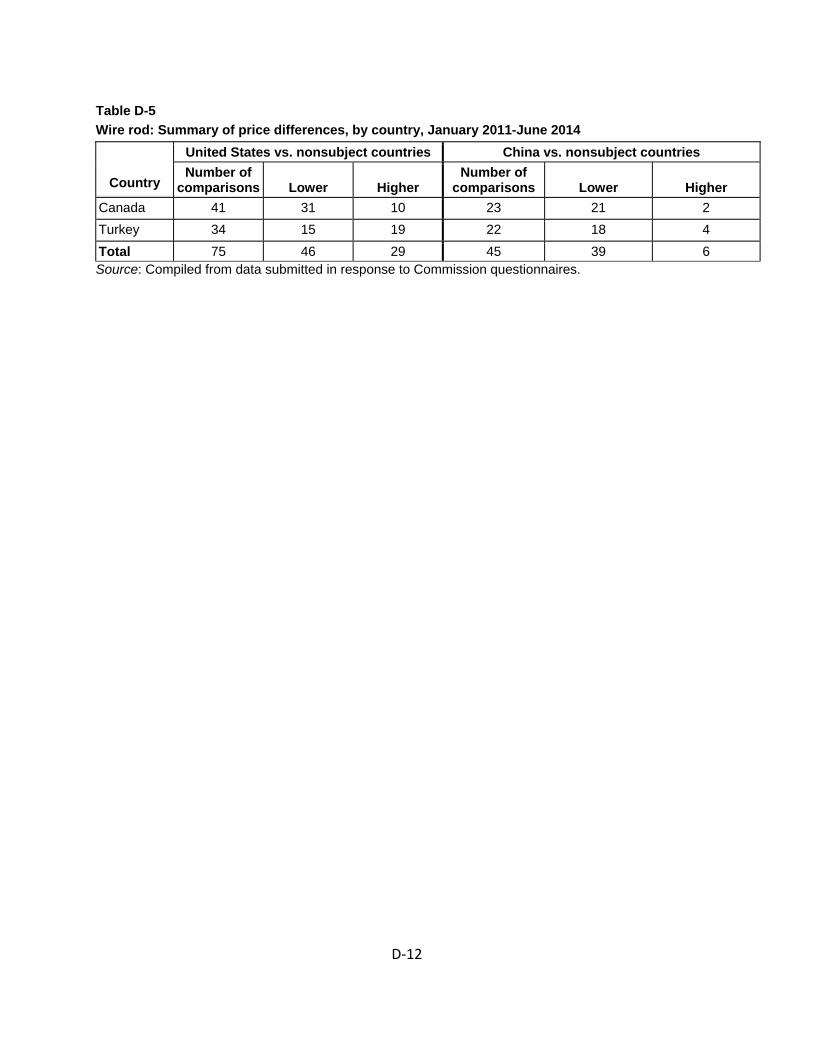
D‐12
Table D-5 Wire rod: Summary of price differences, by country, January 2011-June 2014
Country
United States vs. nonsubject countries China vs. nonsubject countries Number of
comparisons Lower Higher Number of
comparisons Lower Higher Canada 41 31 10 23 21 2 Turkey 34 15 19 22 18 4 Total 75 46 29 45 39 6 Source: Compiled from data submitted in response to Commission questionnaires.
APPENDIX E
RESULTS OF MERCHANT MARKET OPERATIONS BY U.S. PRODUCERS
E-1

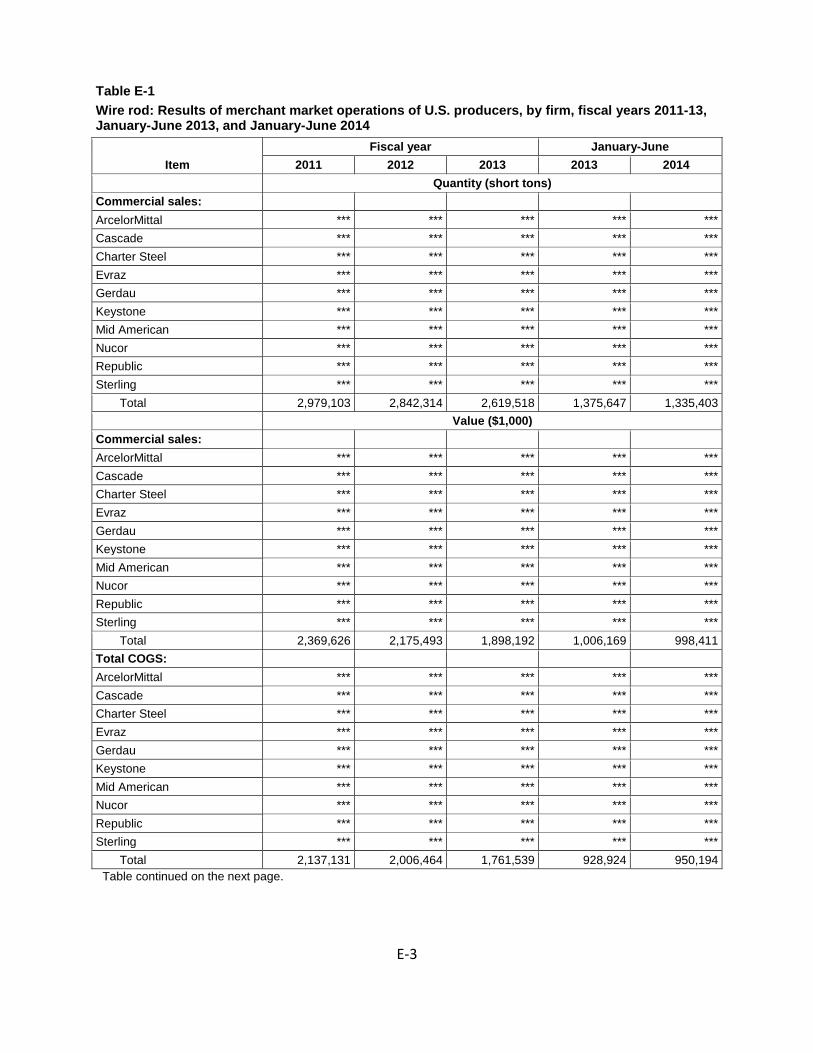
Table E-1 Wire rod: Results of merchant market operations of U.S. producers, by firm, fiscal years 2011-13, January-June 2013, and January-June 2014
Item Fiscal year January-June
2011 2012 2013 2013 2014 Quantity (short tons) Commercial sales: ArcelorMittal *** *** *** *** *** Cascade *** *** *** *** *** Charter Steel *** *** *** *** *** Evraz *** *** *** *** *** Gerdau *** *** *** *** *** Keystone *** *** *** *** *** Mid American *** *** *** *** *** Nucor *** *** *** *** *** Republic *** *** *** *** *** Sterling *** *** *** *** ***
Total 2,979,103 2,842,314 2,619,518 1,375,647 1,335,403 Value ($1,000)
Commercial sales: ArcelorMittal *** *** *** *** *** Cascade *** *** *** *** *** Charter Steel *** *** *** *** *** Evraz *** *** *** *** *** Gerdau *** *** *** *** *** Keystone *** *** *** *** *** Mid American *** *** *** *** *** Nucor *** *** *** *** *** Republic *** *** *** *** *** Sterling *** *** *** *** ***
Total 2,369,626 2,175,493 1,898,192 1,006,169 998,411 Total COGS: ArcelorMittal *** *** *** *** *** Cascade *** *** *** *** *** Charter Steel *** *** *** *** *** Evraz *** *** *** *** *** Gerdau *** *** *** *** *** Keystone *** *** *** *** *** Mid American *** *** *** *** *** Nucor *** *** *** *** *** Republic *** *** *** *** *** Sterling *** *** *** *** ***
Total 2,137,131 2,006,464 1,761,539 928,924 950,194 Table continued on the next page.
E-3

Table E-1--Continued Wire rod: Results of merchant market operations of U.S. producers, by firm, fiscal years 2011-13, January-June 2013, and January-June 2014
Item Fiscal year January-June
2011 2012 2013 2013 2014 Value ($1,000) Gross profit or (loss): ArcelorMittal *** *** *** *** *** Cascade *** *** *** *** *** Charter Steel *** *** *** *** *** Evraz *** *** *** *** *** Gerdau *** *** *** *** *** Keystone *** *** *** *** *** Mid American *** *** *** *** *** Nucor *** *** *** *** *** Republic *** *** *** *** *** Sterling *** *** *** *** ***
Total 232,495 169,029 136,653 77,245 48,217 Total SG&A expense: ArcelorMittal *** *** *** *** *** Cascade *** *** *** *** *** Charter Steel *** *** *** *** *** Evraz *** *** *** *** *** Gerdau *** *** *** *** *** Keystone *** *** *** *** *** Mid American *** *** *** *** *** Nucor *** *** *** *** *** Republic *** *** *** *** *** Sterling *** *** *** *** ***
Total 73,624 72,635 70,364 36,360 36,821 Operating income or (loss): ArcelorMittal *** *** *** *** *** Cascade *** *** *** *** *** Charter Steel *** *** *** *** *** Evraz *** *** *** *** *** Gerdau *** *** *** *** *** Keystone *** *** *** *** *** Mid American *** *** *** *** *** Nucor *** *** *** *** *** Republic *** *** *** *** *** Sterling *** *** *** *** ***
Total 158,871 96,394 66,289 40,885 11,396 Table continued on the next page.
E-4
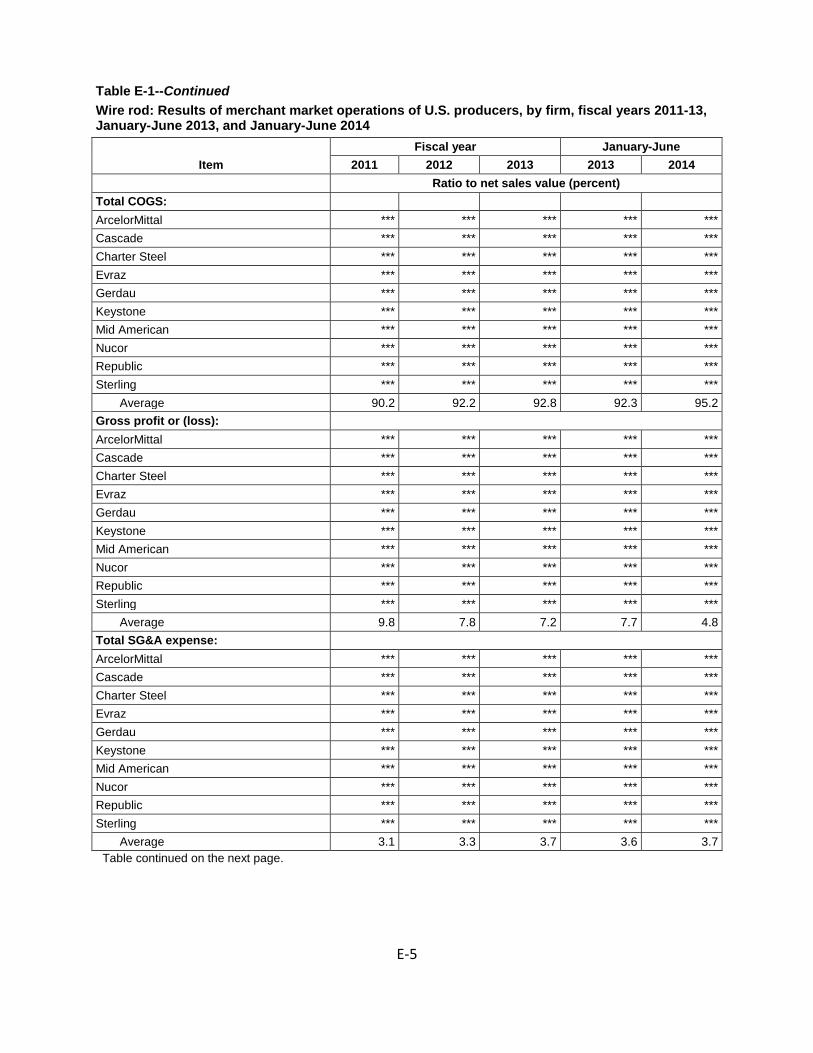
Table E-1--Continued Wire rod: Results of merchant market operations of U.S. producers, by firm, fiscal years 2011-13, January-June 2013, and January-June 2014
Item Fiscal year January-June
2011 2012 2013 2013 2014 Ratio to net sales value (percent)
Total COGS: ArcelorMittal *** *** *** *** *** Cascade *** *** *** *** *** Charter Steel *** *** *** *** *** Evraz *** *** *** *** *** Gerdau *** *** *** *** *** Keystone *** *** *** *** *** Mid American *** *** *** *** *** Nucor *** *** *** *** *** Republic *** *** *** *** *** Sterling *** *** *** *** ***
Average 90.2 92.2 92.8 92.3 95.2 Gross profit or (loss): ArcelorMittal *** *** *** *** *** Cascade *** *** *** *** *** Charter Steel *** *** *** *** *** Evraz *** *** *** *** *** Gerdau *** *** *** *** *** Keystone *** *** *** *** *** Mid American *** *** *** *** *** Nucor *** *** *** *** *** Republic *** *** *** *** *** Sterling *** *** *** *** ***
Average 9.8 7.8 7.2 7.7 4.8 Total SG&A expense: ArcelorMittal *** *** *** *** *** Cascade *** *** *** *** *** Charter Steel *** *** *** *** *** Evraz *** *** *** *** *** Gerdau *** *** *** *** *** Keystone *** *** *** *** *** Mid American *** *** *** *** *** Nucor *** *** *** *** *** Republic *** *** *** *** *** Sterling *** *** *** *** ***
Average 3.1 3.3 3.7 3.6 3.7 Table continued on the next page.
E-5
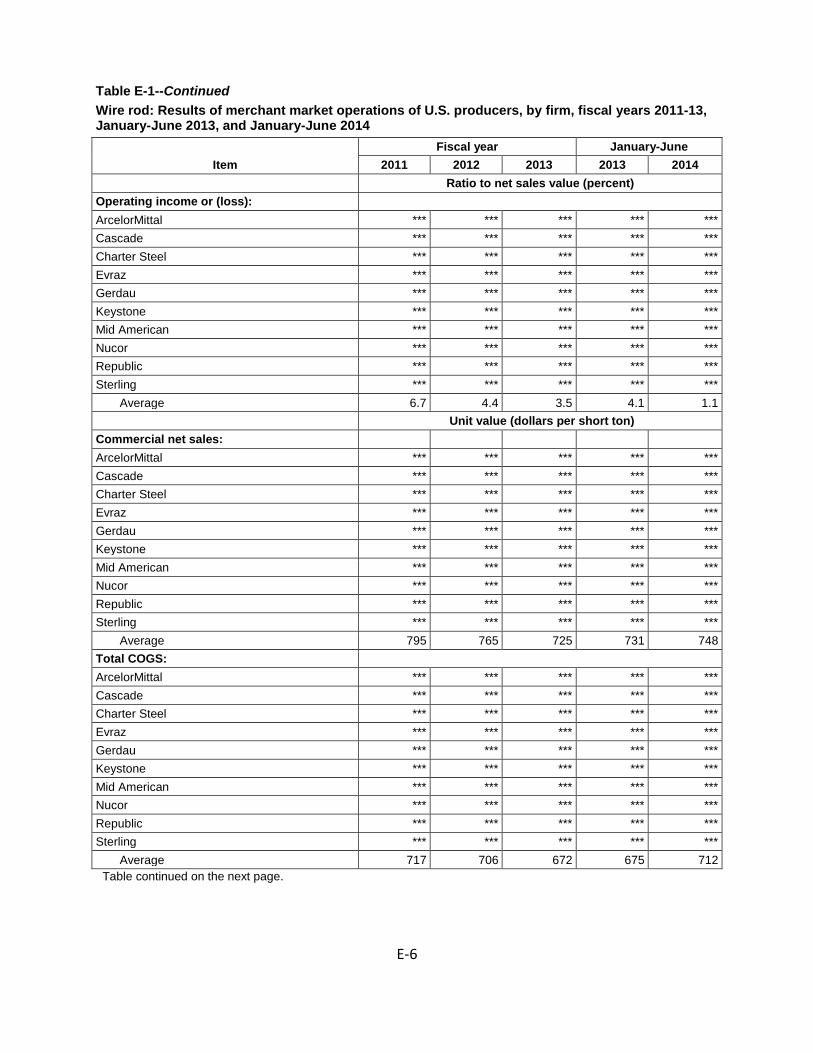
Table E-1--Continued Wire rod: Results of merchant market operations of U.S. producers, by firm, fiscal years 2011-13, January-June 2013, and January-June 2014
Item Fiscal year January-June
2011 2012 2013 2013 2014 Ratio to net sales value (percent)
Operating income or (loss): ArcelorMittal *** *** *** *** *** Cascade *** *** *** *** *** Charter Steel *** *** *** *** *** Evraz *** *** *** *** *** Gerdau *** *** *** *** *** Keystone *** *** *** *** *** Mid American *** *** *** *** *** Nucor *** *** *** *** *** Republic *** *** *** *** *** Sterling *** *** *** *** ***
Average 6.7 4.4 3.5 4.1 1.1 Unit value (dollars per short ton)
Commercial net sales: ArcelorMittal *** *** *** *** *** Cascade *** *** *** *** *** Charter Steel *** *** *** *** *** Evraz *** *** *** *** *** Gerdau *** *** *** *** *** Keystone *** *** *** *** *** Mid American *** *** *** *** *** Nucor *** *** *** *** *** Republic *** *** *** *** *** Sterling *** *** *** *** ***
Average 795 765 725 731 748 Total COGS: ArcelorMittal *** *** *** *** *** Cascade *** *** *** *** *** Charter Steel *** *** *** *** *** Evraz *** *** *** *** *** Gerdau *** *** *** *** *** Keystone *** *** *** *** *** Mid American *** *** *** *** *** Nucor *** *** *** *** *** Republic *** *** *** *** *** Sterling *** *** *** *** ***
Average 717 706 672 675 712 Table continued on the next page.
E-6
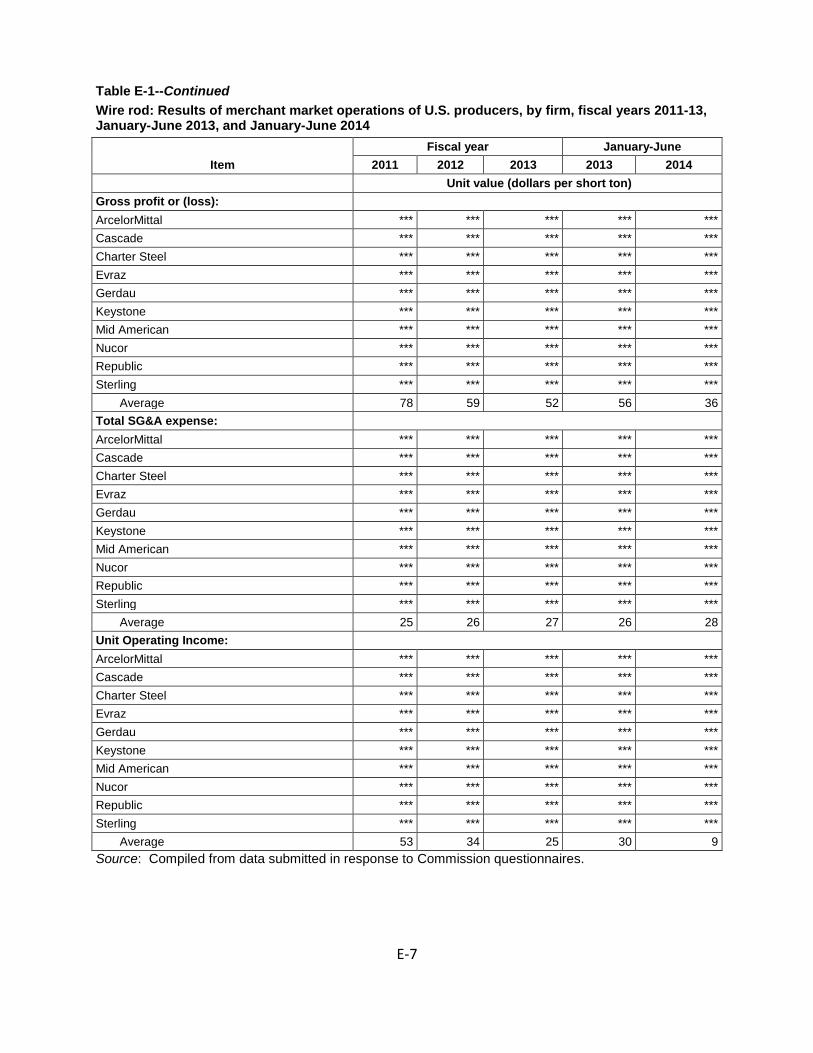
Table E-1--Continued Wire rod: Results of merchant market operations of U.S. producers, by firm, fiscal years 2011-13, January-June 2013, and January-June 2014
Item Fiscal year January-June
2011 2012 2013 2013 2014 Unit value (dollars per short ton)
Gross profit or (loss): ArcelorMittal *** *** *** *** *** Cascade *** *** *** *** *** Charter Steel *** *** *** *** *** Evraz *** *** *** *** *** Gerdau *** *** *** *** *** Keystone *** *** *** *** *** Mid American *** *** *** *** *** Nucor *** *** *** *** *** Republic *** *** *** *** *** Sterling *** *** *** *** ***
Average 78 59 52 56 36 Total SG&A expense: ArcelorMittal *** *** *** *** *** Cascade *** *** *** *** *** Charter Steel *** *** *** *** *** Evraz *** *** *** *** *** Gerdau *** *** *** *** *** Keystone *** *** *** *** *** Mid American *** *** *** *** *** Nucor *** *** *** *** *** Republic *** *** *** *** *** Sterling *** *** *** *** ***
Average 25 26 27 26 28 Unit Operating Income: ArcelorMittal *** *** *** *** *** Cascade *** *** *** *** *** Charter Steel *** *** *** *** *** Evraz *** *** *** *** *** Gerdau *** *** *** *** *** Keystone *** *** *** *** *** Mid American *** *** *** *** *** Nucor *** *** *** *** *** Republic *** *** *** *** *** Sterling *** *** *** *** ***
Average 53 34 25 30 9 Source: Compiled from data submitted in response to Commission questionnaires.
E-7