Embed Size (px)
Citation preview
HAL Id: hal-00607165https://hal.archives-ouvertes.fr/hal-00607165
Submitted on 8 Jul 2011
HAL is a multi-disciplinary open accessarchive for the deposit and dissemination of sci-entific research documents, whether they are pub-lished or not. The documents may come fromteaching and research institutions in France orabroad, or from public or private research centers.
L’archive ouverte pluridisciplinaire HAL, estdestinée au dépôt et à la diffusion de documentsscientifiques de niveau recherche, publiés ou non,émanant des établissements d’enseignement et derecherche français ou étrangers, des laboratoirespublics ou privés.
Public Sector Efficiency: Evidence for New EU MemberStates and Emerging Markets
Ludger Schuknecht
To cite this version:Ludger Schuknecht. Public Sector Efficiency: Evidence for New EU Member States and Emerg-ing Markets. Applied Economics, Taylor & Francis (Routledge), 2010, 42 (17), pp.2147-2164.�10.1080/00036840701765460�. �hal-00607165�

For Peer Review
Public Sector Efficiency: Evidence for New EU Member States and Emerging Markets
Journal: Applied Economics Manuscript ID: APE-07-0204.R1
Journal Selection: Applied Economics Date Submitted by the
Author: 16-Oct-2007
Complete List of Authors: Schuknecht, Ludger; ECB
JEL Code:
C14 - Semiparametric and Nonparametric Methods < C1 - Econometric and Statistical Methods: General < C - Mathematical and Quantitative Methods, H50 - General < H5 - National Government Expenditures and Related Policies < H - Public Economics, H40 - General < H4 - Publicly Provided Goods < H - Public Economics
Keywords: government expenditure, efficiency, DEA, new member states, emerging markets
Editorial Office, Dept of Economics, Warwick University, Coventry CV4 7AL, UK
Submitted Manuscript
For Peer Review
Public Sector Efficiency: Evidence for New EU
Member States and Emerging Markets*
António Afonso, # $ Ludger Schuknecht # and Vito Tanzi ±
Abstract
In this paper we analyse public sector efficiency in the new member states of the EU compared to that in emerging markets. After a conceptual discussion of expenditure efficiency measurement, we compute efficiency scores and rankings by applying a range of measurement techniques. The study finds that expenditure efficiency across new EU member states is rather diverse especially as compared to the group of top performing emerging markets in Asia. Econometric analysis shows that higher income, civil service competence and education levels as well as the security of property rights seem to facilitate the prevention of inefficiencies in the public sector.
Keywords: government expenditure, efficiency, DEA, new EU member states, emerging markets. JEL Classification Numbers: C14, H40, H50.
* We are grateful to participants in conferences at ZEW in Manheim, EPCS in Turku, IAES in Berlin and two anonymous referees for helpful comments. We are also grateful to Gerhard Schwab for assistance with the data, and Elizabeth Morton for editorial assistance. Any remaining errors are the responsibility of the authors. The opinions expressed herein are those of the authors and do not necessarily reflect those of the author’s employers. # European Central Bank, Kaiserstraße 29, D-60311 Frankfurt am Main, Germany, emails: [email protected]; [email protected]. $ ISEG/TULisbon – Technical University of Lisbon, Department of Economics; UECE – Research Unit on Complexity and Economics, R. Miguel Lupi 20, 1249-078 Lisbon, Portugal, email: [email protected]. UECE is supported by FCT (Fundação para a Ciência e a Tecnologia, Portugal), financed by ERDF and Portuguese funds. ± Inter-American Development Bank, Washington, D. C., email: [email protected].
Page 1 of 32
Editorial Office, Dept of Economics, Warwick University, Coventry CV4 7AL, UK
Submitted Manuscript
123456789101112131415161718192021222324252627282930313233343536373839404142434445464748495051525354555657585960
For Peer Review
2
1. Introduction
The importance of an efficient use of public resources and high-quality fiscal policies for
economic growth and stability and for the well-being of individuals has been brought to the
forefront by several developments over recent decades. Macroeconomic constraints limit
countries’ scope for expenditure increases. The member states of the European Union are bound
to fiscal discipline through the Stability and Growth Pact. Globalisation makes capital and
taxpayers more mobile and exerts pressure on governments’ revenue base. New management and
budgeting techniques have been developed and there is more scope for goods and service
provision via markets. Transparency of government practices across the globe has increased,
raising public pressure to use resources more efficiently (see Tanzi and Schuknecht (2000),
Heller (2003), Joumard, Konsgrud, Nam and Price (2004)).
The adequate measurement of public sector efficiency is a difficult empirical issue and the
literature on it is rather scarce. The measurement of the costs of public activities, the
identification of goals and the assessment of efficiency via appropriate cost and outcome
measures of public policies are thorny issues. Academics and economists in international
organisations have made some progress in this regard by paying more attention to the costs of
public activities via rising marginal tax burdens and by looking at the composition of public
expenditure. Moreover, they have been shifting the focus of analysis from the amount of
resources used by ministry or programme (inputs) to the services delivered or outcomes achieved
(see, for instance, OECD (2003), and Afonso, Schuknecht and Tanzi (2005)).
Our contribution in this study is fourfold: first we discuss and survey conceptual and
methodological issues related to the measurement and analysis of public sector efficiency. Second
we construct Public Sector Performance and Efficiency composite indicators for the ten (plus
two) new member states that adhered to the European Union (EU) on 1 May 2004 (on 2007) as
Page 2 of 32
Editorial Office, Dept of Economics, Warwick University, Coventry CV4 7AL, UK
Submitted Manuscript
123456789101112131415161718192021222324252627282930313233343536373839404142434445464748495051525354555657585960
For Peer Review
3
compared to emerging markets from different regions, and some current EU member countries
that show features of emerging markets and/or are undergoing a catching up process. Third we
use Data Envelopment Analysis to compute input and output efficiency scores and country
rankings, which we combine with a Tobit analysis to see whether exogenous, non-discretionary
(and non-fiscal) factors play a role in explaining expenditure inefficiencies. Fourth, we use the
information from the Tobit estimations to correct the efficiency scores for the effect of non-
discretionary factors. To our knowledge, such an efficiency analysis has not been applied before
to this set of countries.
On the second and third objective, the study finds significant differences in expenditure
efficiency across new member countries: the Asian newly industrialised economies perform best
while the new member states show a very diverse picture. The two-step analysis shows that
income, public sector competence and educational levels, as well as the security of property
rights, seem to facilitate the prevention of inefficiencies in the public sector, and such factors can
be used to correct country efficiency scores.
The paper is organised as follows. In section two we briefly discuss our motivation and review
the related literature on public expenditure efficiency. In section three we present the
methodologies used for the measurement of public expenditure efficiency. Section four reports
stylised facts and our empirical analysis of efficiency via i) performance and efficiency analysis
based on cross-country composite indicators, ii) a non-parametric efficiency analysis, and iii) an
explanation of inefficiencies via non-discretionary factors. Section five concludes.
2. Motivation and related literature
Economists are concerned about the efficient use of scarce resources. The concept of efficiency
finds a prominent place in the study of the spending and taxing activities of governments.
Page 3 of 32
Editorial Office, Dept of Economics, Warwick University, Coventry CV4 7AL, UK
Submitted Manuscript
123456789101112131415161718192021222324252627282930313233343536373839404142434445464748495051525354555657585960
For Peer Review
4
Economists believe that these activities should generate optimal potential benefits for the
population and they castigate governments when, in their view, they use public resources
inefficiently. International organisations, such as the World Bank and the IMF, often express
concern about governmental activities that they consider inefficient or unproductive.
There are many reasons why a society needs public expenditure (and consequently tax revenue).
The reasons have been spelled out, over the years, by economists such as Adam Smith, Pigou,
Musgrave, Samuelson, and others. Public expenditure is needed to deal with (a) genuine public
goods, (b) significant externalities, (c) the creation of social institutions and (d) the rule of law
that protect individuals and property. When the focus of public expenditure is on these agreed
activities, and is carried out in an efficient manner, the public sector remains small and efficient.
Problems arise when (a) public sector activity is carried out beyond the theoretically justified
areas; and/or (b) when it is carried out at excessive costs. Of course, the more efficient is the
working of the market economy, the smaller should be the scope of activities in which there is
even a theoretical justification for public spending (see Tanzi, 2005). Thus, as market economies
become more efficient, public spending should fall.
There has been a tendency among economists to measure the output or the benefit in public
activities on the basis of the budgeted allocation: the higher the expenditure, the higher the
benefit. For example calls to allocate a given, or a larger, share of national budgets to health and
education assume such identity between expenditure and benefits. The larger the expenditure, the
greater the benefits received by the intended recipients are assumed to be. But, as argued by
Tanzi (1974) the two can be widely different. This difference is central to the concept of
efficiency.
Page 4 of 32
Editorial Office, Dept of Economics, Warwick University, Coventry CV4 7AL, UK
Submitted Manuscript
123456789101112131415161718192021222324252627282930313233343536373839404142434445464748495051525354555657585960
For Peer Review
5
Additionally, a relevant issue is the distinction between output and outcome. This distinction
should be fundamental in the analysis of the efficiency of public spending. There is often much
attention paid to the outputs of certain activities and too little to the outcomes. For example the
outputs of educational spending may be school enrolments, or number of students completing a
grade. The outputs of health expenditure may be the number of operations performed or days
spent in a hospital bed. However, the outcomes should be based on how much students learned
and how many patients got well enough to return to a productive life.
Some recent papers have used non-parametric approaches for measuring relative expenditure
efficiency across countries, notably Data Envelopment Analysis (DEA). This technique, which is
applied later in this study, was originally developed and applied to firms that convert inputs into
outputs. The term “firm”, sometimes replaced by the more encompassing term “Decision Making
Unit” (henceforth DMUs) may include non-profit or public organisations, such as hospitals,
universities, local authorities, or countries.
Previous research on the performance and efficiency of the public sector and its functions that
applied non-parametric methods found significant inefficiencies in countries. Studies include
notably Gupta and Verhoeven (2001) for education and health in Africa, Clements (2002) for
education in Europe, St. Aubyn (2003) for education spending in the OECD, Afonso,
Schuknecht, and Tanzi (2005) for public sector performance expenditure in the OECD, Afonso
and St. Aubyn (2005, 2006) for efficiency in providing health and education in OECD countries.
De Borger at al. (1994), De Borger and Kerstens (1996), and Afonso and Fernandes (2006) find
evidence of spending inefficiencies for the local government sector. Most studies apply the DEA
method while Afonso and St. Aubyn (2006) undertook a two-step DEA/Tobit analysis, in the
context of a cross-country analysis of secondary education efficiency.
Page 5 of 32
Editorial Office, Dept of Economics, Warwick University, Coventry CV4 7AL, UK
Submitted Manuscript
123456789101112131415161718192021222324252627282930313233343536373839404142434445464748495051525354555657585960
For Peer Review
6
3. Measuring efficiency in public expenditure: methodologies
3.1. Composite indicators for measuring public sector performance and efficiency
In recent years various attempts have been made at measuring the efficiency of public
expenditure via composite indicators. These attempts are of two broad types: macro
measurements, and micro measurements. Macro measurements have as their aim an evaluation
of public spending in its entirety. In other words they attempt to measure, or rather to get some
ideas of, the benefits from higher public spending. When, for example, Sweden spends 1 ½ times
as much in terms of GDP shares as Switzerland, what does it get in return? Micro measurements
attempt to determine the relationship between spending and benefits in a particular budgetary
function or even sub-function (i.e. health spending or the efficiency of spending in hospitals, or
spending for protection against malaria, aids, etc.).
A first macro measurement attempt was made by Tanzi and Schuknecht (1997, 2000) in trying to
assess the benefits from total public spending in eighteen industrialized countries. The approach
attempts to determine whether larger public spending in these industrialized countries provided
returns, in terms of some identifiable benefits, that could justify the additional costs (including
the reduction in individual economic freedom) associated with higher tax burdens. The key
question that it tries to address is whether there is a positive, identifiable relationship between
higher public spending and higher social welfare. The application of this method led the authors
to conclude that additional public expenditure had not been particularly productive in recent
decades. The group of countries with lower levels of public spending had socio-economic
indicators that were as good as or at times better than that of the countries with much higher
spending levels.
Afonso, Schuknecht, and Tanzi (2005) built composite indicators of public sector performance.
They distinguished public sector performance (PSP), defined as the outcome of public policies,
Page 6 of 32
Editorial Office, Dept of Economics, Warwick University, Coventry CV4 7AL, UK
Submitted Manuscript
123456789101112131415161718192021222324252627282930313233343536373839404142434445464748495051525354555657585960
For Peer Review
7
from public sector efficiency, defined as the outcome in relation to the resources employed. This
is also the first method we apply in our country sample analysis later in the paper.
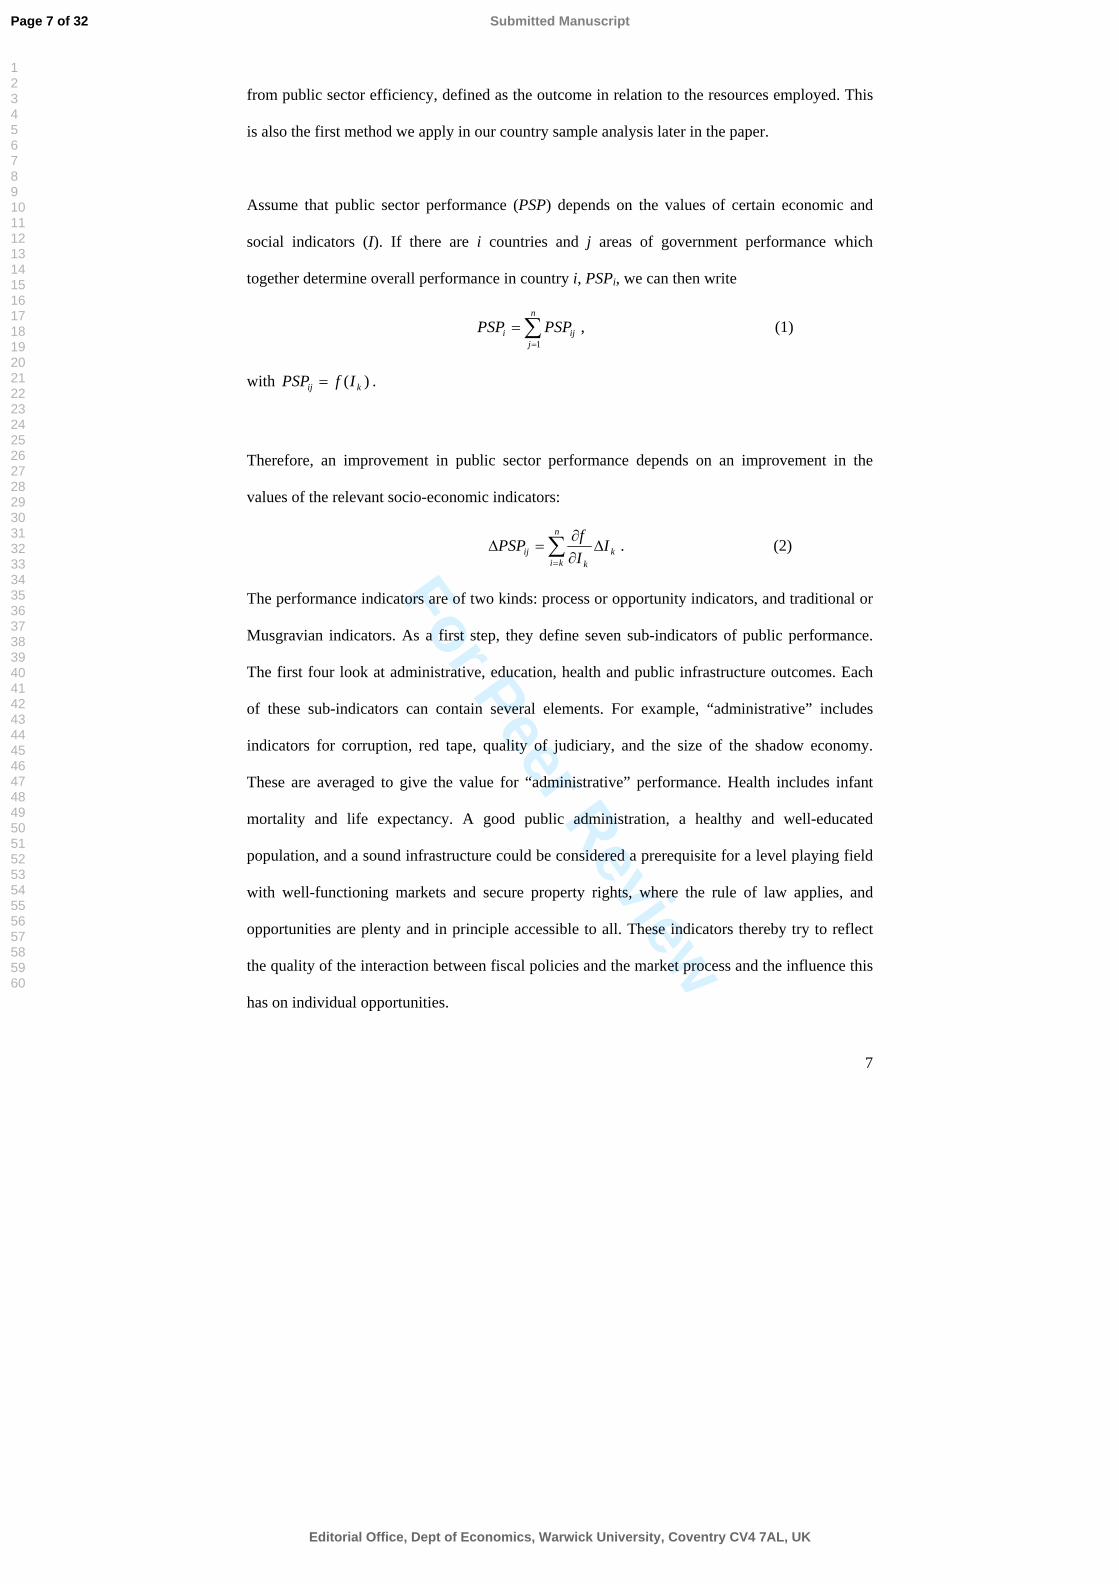
Assume that public sector performance (PSP) depends on the values of certain economic and
social indicators (I). If there are i countries and j areas of government performance which
together determine overall performance in country i, PSPi, we can then write
∑=
=n
jiji PSPPSP
1
, (1)
with )( kij IfPSP = .
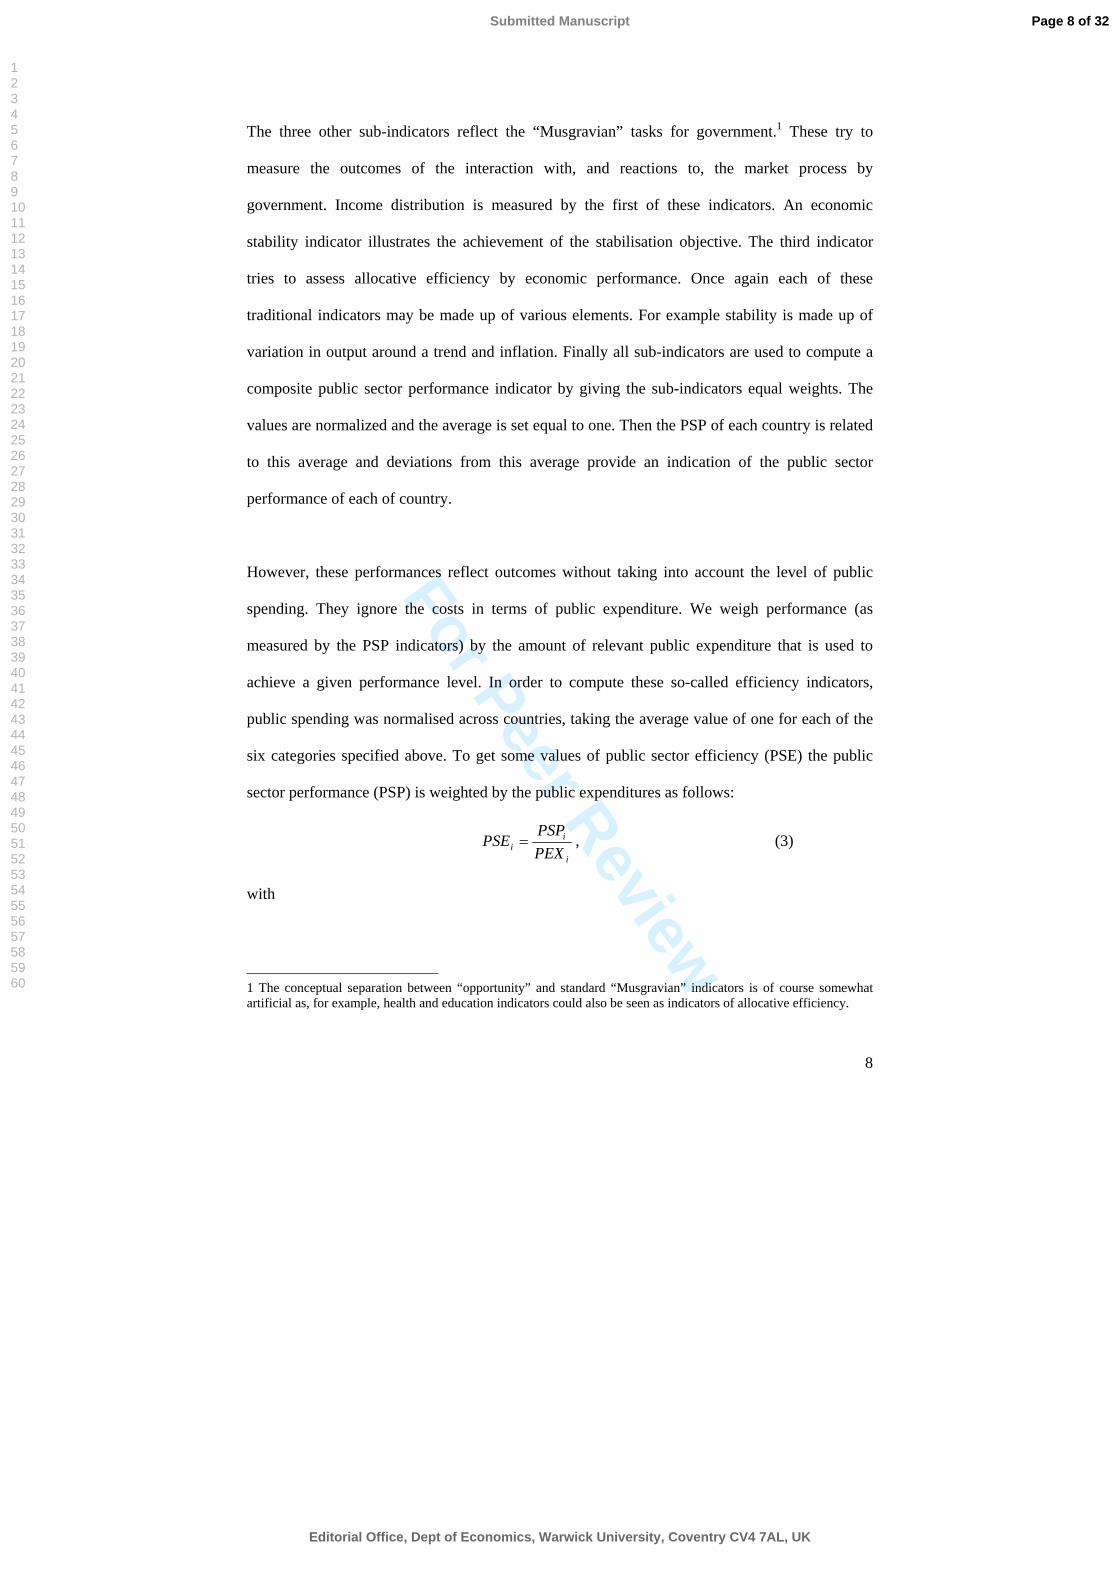
Therefore, an improvement in public sector performance depends on an improvement in the
values of the relevant socio-economic indicators:
∑=
∆∂∂
=∆n
kik
kij I
IfPSP . (2)
The performance indicators are of two kinds: process or opportunity indicators, and traditional or
Musgravian indicators. As a first step, they define seven sub-indicators of public performance.
The first four look at administrative, education, health and public infrastructure outcomes. Each
of these sub-indicators can contain several elements. For example, “administrative” includes
indicators for corruption, red tape, quality of judiciary, and the size of the shadow economy.
These are averaged to give the value for “administrative” performance. Health includes infant
mortality and life expectancy. A good public administration, a healthy and well-educated
population, and a sound infrastructure could be considered a prerequisite for a level playing field
with well-functioning markets and secure property rights, where the rule of law applies, and
opportunities are plenty and in principle accessible to all. These indicators thereby try to reflect
the quality of the interaction between fiscal policies and the market process and the influence this
has on individual opportunities.
Page 7 of 32
Editorial Office, Dept of Economics, Warwick University, Coventry CV4 7AL, UK
Submitted Manuscript
123456789101112131415161718192021222324252627282930313233343536373839404142434445464748495051525354555657585960
For Peer Review
8
The three other sub-indicators reflect the “Musgravian” tasks for government.1 These try to
measure the outcomes of the interaction with, and reactions to, the market process by
government. Income distribution is measured by the first of these indicators. An economic
stability indicator illustrates the achievement of the stabilisation objective. The third indicator
tries to assess allocative efficiency by economic performance. Once again each of these
traditional indicators may be made up of various elements. For example stability is made up of
variation in output around a trend and inflation. Finally all sub-indicators are used to compute a
composite public sector performance indicator by giving the sub-indicators equal weights. The
values are normalized and the average is set equal to one. Then the PSP of each country is related
to this average and deviations from this average provide an indication of the public sector
performance of each of country.
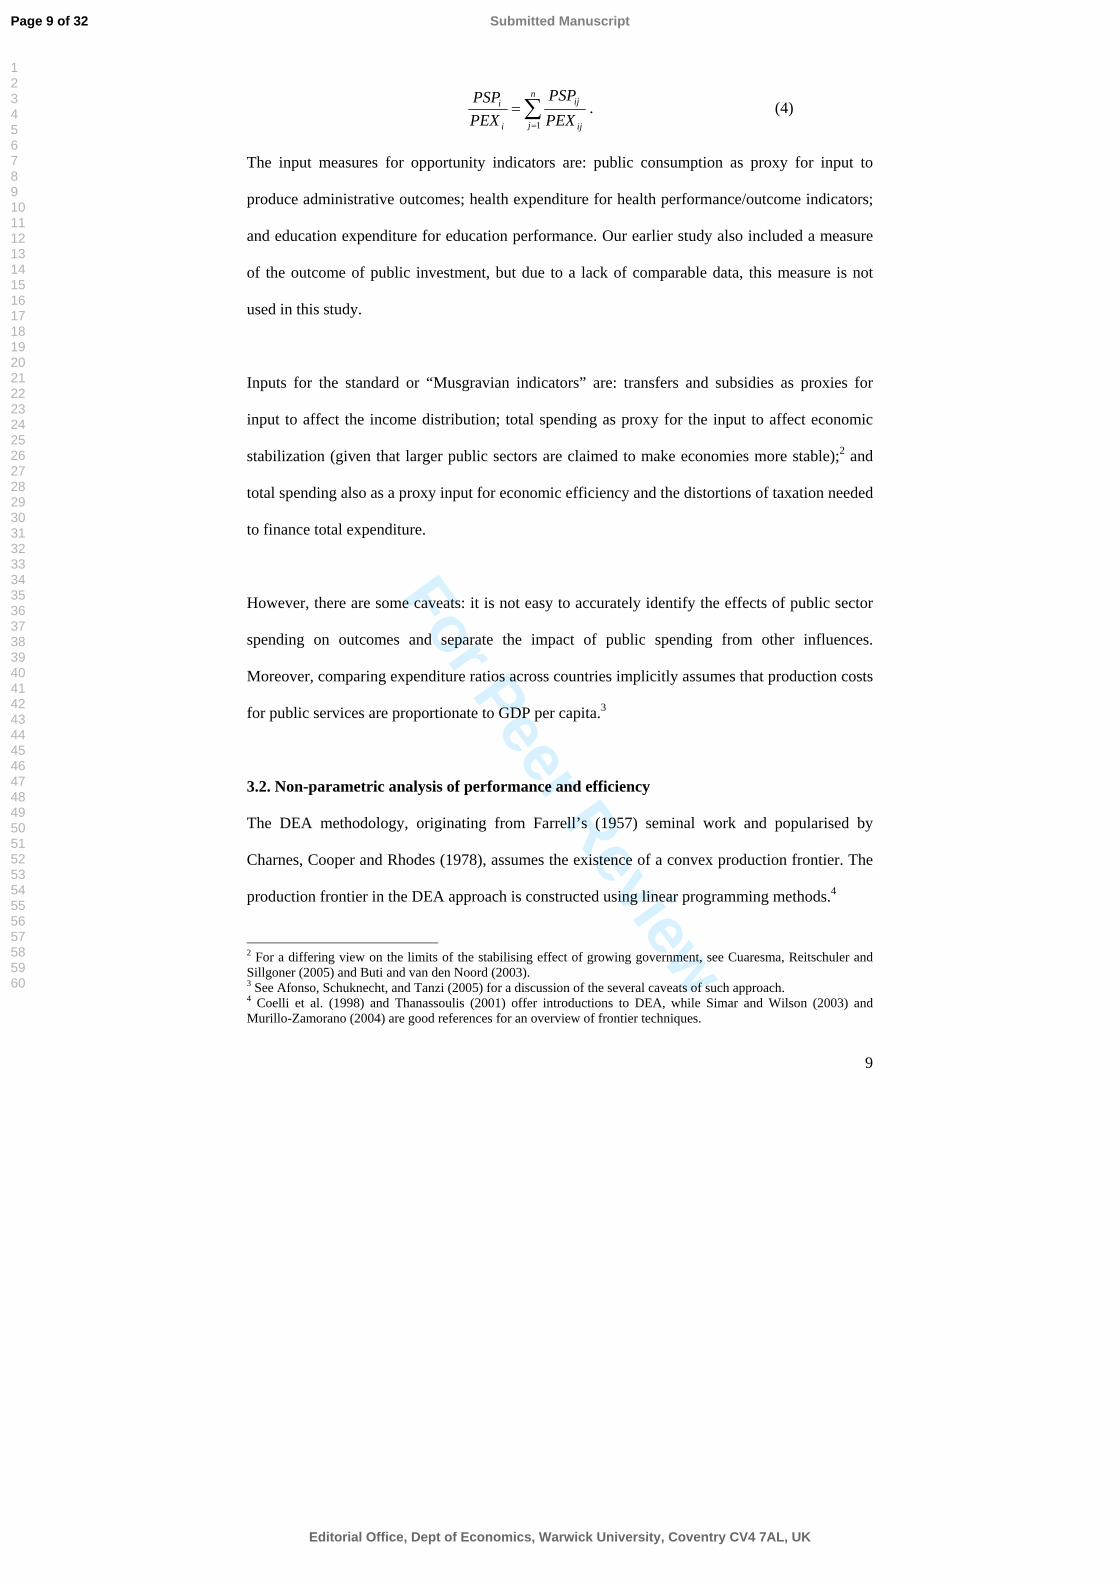
However, these performances reflect outcomes without taking into account the level of public
spending. They ignore the costs in terms of public expenditure. We weigh performance (as
measured by the PSP indicators) by the amount of relevant public expenditure that is used to
achieve a given performance level. In order to compute these so-called efficiency indicators,
public spending was normalised across countries, taking the average value of one for each of the
six categories specified above. To get some values of public sector efficiency (PSE) the public
sector performance (PSP) is weighted by the public expenditures as follows:
i
ii PEX
PSPPSE = , (3)
with
1 The conceptual separation between “opportunity” and standard “Musgravian” indicators is of course somewhat artificial as, for example, health and education indicators could also be seen as indicators of allocative efficiency.
Page 8 of 32
Editorial Office, Dept of Economics, Warwick University, Coventry CV4 7AL, UK
Submitted Manuscript
123456789101112131415161718192021222324252627282930313233343536373839404142434445464748495051525354555657585960
For Peer Review
9
∑=
=n
j ij
ij
i
i
PEXPSP
PEXPSP
1. (4)
The input measures for opportunity indicators are: public consumption as proxy for input to
produce administrative outcomes; health expenditure for health performance/outcome indicators;
and education expenditure for education performance. Our earlier study also included a measure
of the outcome of public investment, but due to a lack of comparable data, this measure is not
used in this study.
Inputs for the standard or “Musgravian indicators” are: transfers and subsidies as proxies for
input to affect the income distribution; total spending as proxy for the input to affect economic
stabilization (given that larger public sectors are claimed to make economies more stable);2 and
total spending also as a proxy input for economic efficiency and the distortions of taxation needed
to finance total expenditure.
However, there are some caveats: it is not easy to accurately identify the effects of public sector
spending on outcomes and separate the impact of public spending from other influences.
Moreover, comparing expenditure ratios across countries implicitly assumes that production costs
for public services are proportionate to GDP per capita.3
3.2. Non-parametric analysis of performance and efficiency
The DEA methodology, originating from Farrell’s (1957) seminal work and popularised by
Charnes, Cooper and Rhodes (1978), assumes the existence of a convex production frontier. The
production frontier in the DEA approach is constructed using linear programming methods.4
2 For a differing view on the limits of the stabilising effect of growing government, see Cuaresma, Reitschuler and Sillgoner (2005) and Buti and van den Noord (2003). 3 See Afonso, Schuknecht, and Tanzi (2005) for a discussion of the several caveats of such approach. 4 Coelli et al. (1998) and Thanassoulis (2001) offer introductions to DEA, while Simar and Wilson (2003) and Murillo-Zamorano (2004) are good references for an overview of frontier techniques.
Page 9 of 32
Editorial Office, Dept of Economics, Warwick University, Coventry CV4 7AL, UK
Submitted Manuscript
123456789101112131415161718192021222324252627282930313233343536373839404142434445464748495051525354555657585960
For Peer Review
10
Regarding public sector efficiency, the general relationship that we expect to test can be given by
the following function for each country i:
)( ii XfY = , i=1,…,n (5)
where we have Yi – a composite indicator reflecting our output measure (the PSP indicator in our
case); Xi – spending or other relevant inputs in country i (government spending will be used
ahead). If )( ii xfY < , it is said that country i exhibits inefficiency. For the observed input level,
the actual output is smaller than the best attainable one and inefficiency can then be measured by
computing the distance to the theoretical efficiency frontier.
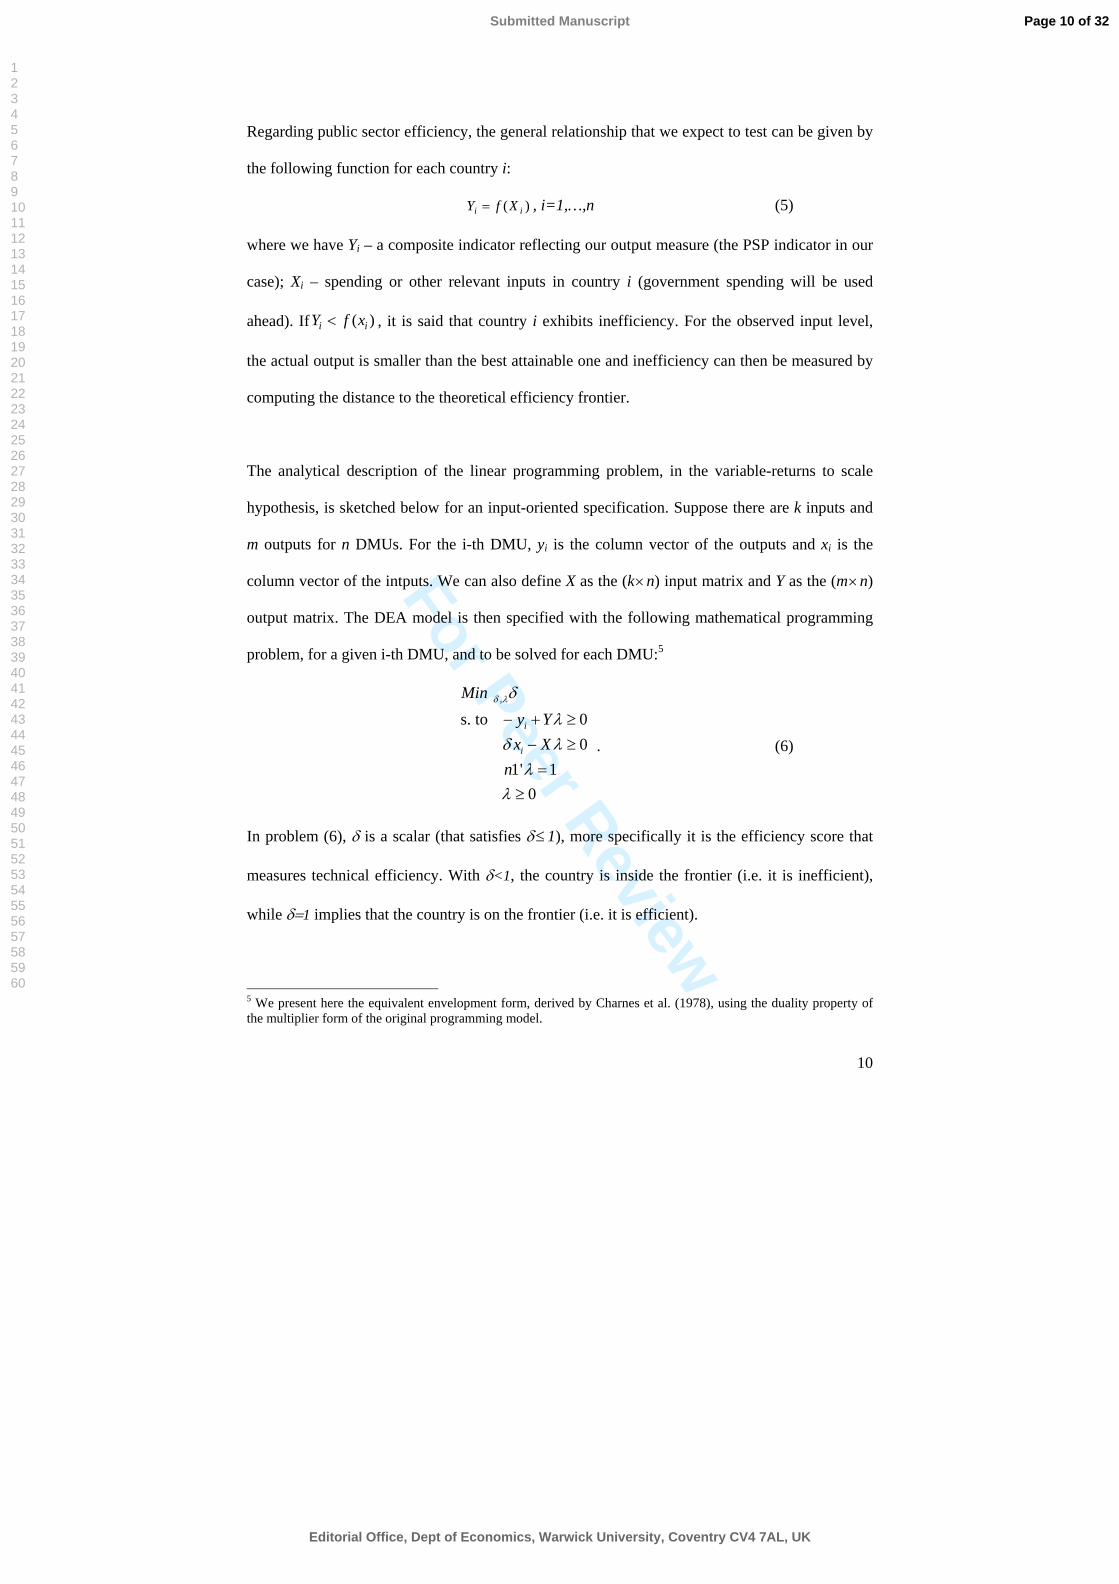
The analytical description of the linear programming problem, in the variable-returns to scale
hypothesis, is sketched below for an input-oriented specification. Suppose there are k inputs and
m outputs for n DMUs. For the i-th DMU, yi is the column vector of the outputs and xi is the
column vector of the intputs. We can also define X as the (k×n) input matrix and Y as the (m×n)
output matrix. The DEA model is then specified with the following mathematical programming
problem, for a given i-th DMU, and to be solved for each DMU:5
, s. to 0 0
1' 1 0
i
i
Miny Yx X
n
δ λδ
λδ λ
λλ
− + ≥
− ≥
=≥
. (6)
In problem (6), δ is a scalar (that satisfies δ≤ 1), more specifically it is the efficiency score that
measures technical efficiency. With δ<1, the country is inside the frontier (i.e. it is inefficient),
while δ=1 implies that the country is on the frontier (i.e. it is efficient).
5 We present here the equivalent envelopment form, derived by Charnes et al. (1978), using the duality property of the multiplier form of the original programming model.
Page 10 of 32
Editorial Office, Dept of Economics, Warwick University, Coventry CV4 7AL, UK
Submitted Manuscript
123456789101112131415161718192021222324252627282930313233343536373839404142434445464748495051525354555657585960
For Peer Review
11
The vector λ is a (n×1) vector of constants that measures the weights used to compute the
location of an inefficient DMU if it were to become efficient. The inefficient DMU would be
projected on the production frontier as a linear combination of those weights, related to the peers
of the inefficient DMU. 1n is a n-dimensional vector of ones. The restriction 1'1 =λn imposes
convexity of the frontier, accounting for variable returns to scale. Dropping this restriction would
amount to admit that returns to scale were constant.
3.3. Using non-discretionary factors to explain inefficiencies
The analysis via composite performance indicators and DEA analysis have assumed tacitly that
expenditure efficiency is purely the result of discretionary (policy and spending) inputs. They do
not take into account the presence of “environmental” factors, also known as non-discretionary or
“exogenous” inputs. However, such factors may play a relevant role in determining heterogeneity
across countries and influence performance and efficiency. Exogenous or non-discretionary
factors can have an economic and non-economic origin.
As non-discretionary and discretionary factors jointly contribute to country performance and
efficiency, there are in the literature several proposals on how to deal with this issue, implying
usually the use of two-stage and even three-stage models.6 Using the DEA output efficiency
scores, we will evaluate the importance of non-discretionary factors below in the context of our
new member and emerging market sample. We will undertake Tobit regressions by regressing the
output efficiency scores, δι, on a set of possible non-discretionary inputs, Z, as as follows
iii Zf εδ += )( . (7)
6 See Ruggiero (2004) and Simar and Wilson (2004) for an overview.
Page 11 of 32
Editorial Office, Dept of Economics, Warwick University, Coventry CV4 7AL, UK
Submitted Manuscript
123456789101112131415161718192021222324252627282930313233343536373839404142434445464748495051525354555657585960
For Peer Review
12
4. A quantitive assessment of public sector performance and expenditure efficiency
4.1. Some stylised facts for the EU new member states and comparative countries
Our country sample includes the ten EU new member states as from 2004 (Cyprus, Czech
Republic, Estonia, Hungary, Latvia, Lithuania, Malta, Poland, Slovak Republic, and Slovenia);
the two EU new member states as from 2007 (Bulgaria, and Romania); three “old” member
countries that underwent a catching up process after entering the EU, (Greece, Ireland and
Portugal); and finally nine countries that can also be considered as emerging markets, (Brazil,
Chile, Korea, Mauritius, Mexico, Singapore, South Africa, Thailand, and Turkey). This country
selection was determined by the search for a sufficient number of countries which can be
compared with the new EU members and for which reasonably good quality data is available so
that an expenditure efficiency analysis becomes meaningful. In addition, we will make occasional
references to comparative indicators for OECD or EU countries and country averages.
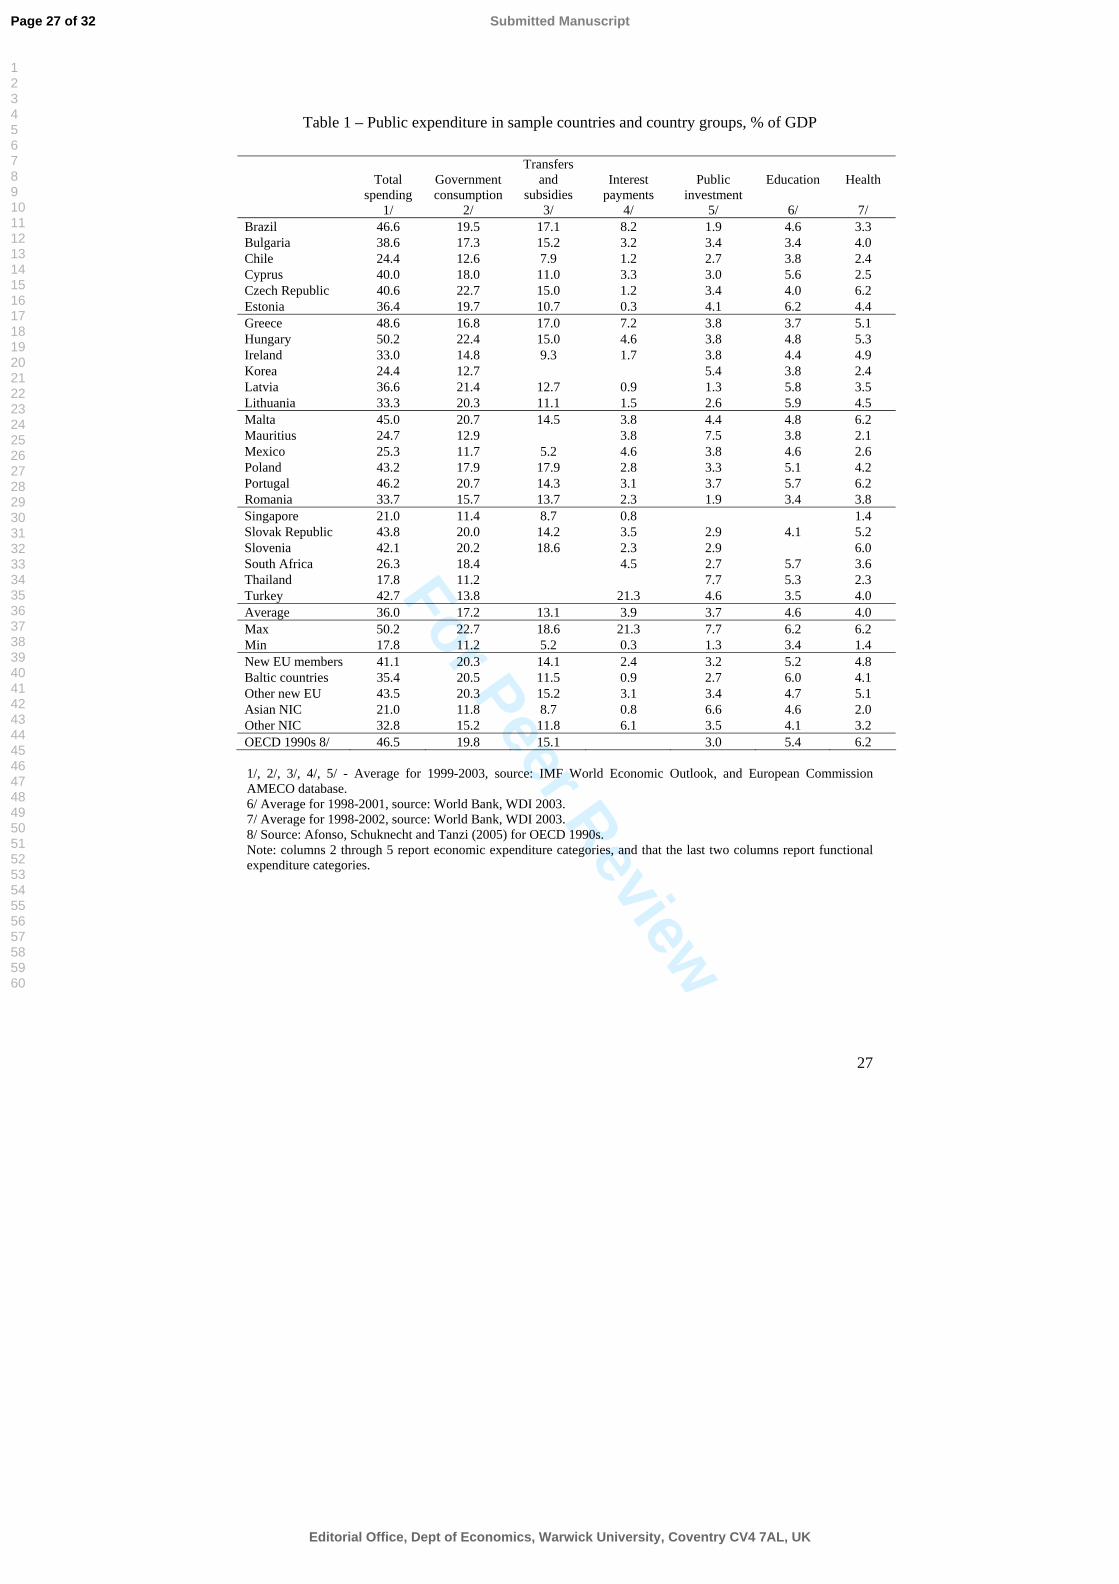
Table 1 illustrates total expenditure and the public expenditure composition across the sample
countries, on an average basis for the period 1999-2003 (or within this period according to data
availability). First, it is striking that the new EU member countries on average report similar total
spending as the “old” EU members and much higher spending than most other emerging markets.
When looking for relatively small governments with spending ratios of less than 40% of GDP, we
only find the Baltic countries belonging to this group. Second, the divergence in expenditure ratios is
enormous ranging from about 18% to 50% of GDP. The Baltics’ relatively low spending ratio is
about one quarter less than that of the central European countries but it is significantly higher than
the average for the Asian emerging economies (Korea, Singapore, and Thailand).
[Insert Table 1 here]
When looking at the expenditure composition, there are further major differences. But these
differences are much more pronounced for less productive spending categories. Small government
Page 12 of 32
Editorial Office, Dept of Economics, Warwick University, Coventry CV4 7AL, UK
Submitted Manuscript
123456789101112131415161718192021222324252627282930313233343536373839404142434445464748495051525354555657585960
For Peer Review
13
countries tend to spend equally as much, or even significantly more, on productive spending such as
investment and education as the rest of the sample countries. New members report public
consumption around 20% of GDP, twice as much as Asian emerging economies, with the reverse
relation holding for public investment where new members spend roughly 3% of GDP while the
Asian countries report an average above 6% of GDP. Data on transfers and subsidies are sketchier
but huge differences are noteworthy: large welfare states of similar size as in the old EU members
predominate in many of the new member countries (with the Baltics’ featuring somewhat lower
expenditure) while such spending in Asian emerging economies is only fractional. When looking at
education, differences across country groups are much smaller than for total spending. New
members, old EU members and other emerging markets are not far apart from each other. In health,
differences are again very significant where central European countries spend almost two and half
times as much in % of GDP as the Asian emerging economies.
4.2. Public sector performance and efficiency via composite indicators
4.2.1. Public sector performance (PSP)
As regards public sector performance we have deviated in a few respects from our earlier study.
In the absence of reasonable data on public infrastructure we in particular focus on three
opportunity indicators and the three respective Musgravian indicators (Annex Tables provide
primary data).7
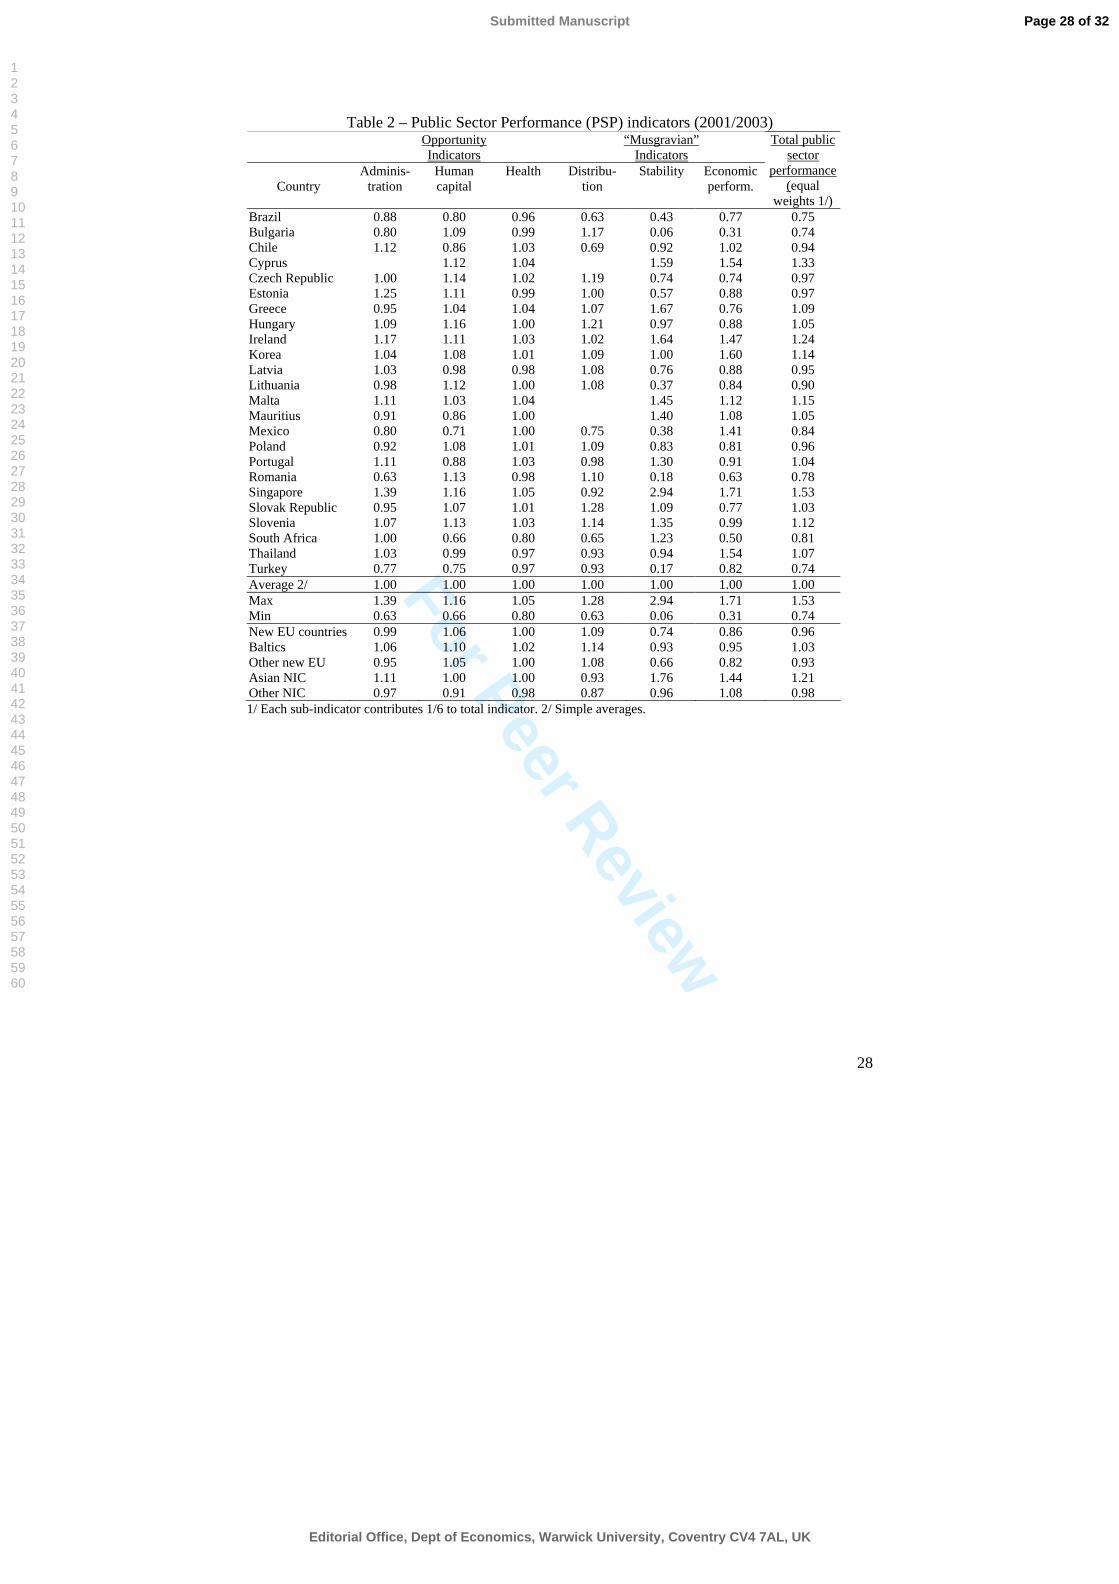
We compile performance indicators from the various indices giving an equal weight to each of
them and the results are reported in Table 2.8 The results for public sector performance show
7 The choice of indicators is slightly different from that used in Afonso, Schuknecht, and Tanzi (2005). In addtion to omitting public infrastructure, education is reflected only by a qualitative measure of education achievement (leaving out secondary school enrolment) and economic performance excludes the level of per-capita GDP (which in this sample would strongly bias in favour of the rich countries). 8 The relevant time period for the several sub-indicators varies a little according to the availability of data but is essentially reported to 2001/2003 with some variables being used as an average of longer time spans (see the Annex for the precise periods).
Page 13 of 32
Editorial Office, Dept of Economics, Warwick University, Coventry CV4 7AL, UK
Submitted Manuscript
123456789101112131415161718192021222324252627282930313233343536373839404142434445464748495051525354555657585960
For Peer Review
14
some interesting patterns, with an overall very diverse picture for the new EU member states.
Starting with the overall PSP indicator, the best performers seem to be Singapore, Cyprus and
Ireland. Other Asian emerging economies and Malta follow this group of top performers while
most new EU member countries and Portugal and Greece post a broadly average performance.
Brazil, Bulgaria and Turkey are placed at the bottom end. The size of government per se appears
to be a too crude instrument of differentiation, when looking at the score for large public sector
countries.
[Insert Table 2]
When comparing the results for the best performers in this study with those from our earlier study
on industrialised OECD countries, it is noteworthy that Ireland was “only” an average performer.
Portugal and Greece, which are near average in this group, were amongst the weakest in the
former study. The results hence show that public sector performance is on average still somewhat
lower in most new EU member countries and emerging markets than in the “old” industrialised
countries but a few of them (notably the new member island countries and Asian Emerging
economies) have broadly caught up.
With regard to sub-indicators, it is interesting to see that the relatively strong performance of the
new EU member states on human capital/education and income distribution contrasts with a
relatively weak one for economic performance and stability. There is no clear pattern of
distinction between Baltics and Central European countries while the two island countries post
strong values for all indicators for which data is available. Asian Emerging economies performed
very strongly on administration, human capital and economic stability and growth. Overall
performance was very equal as regards health indicators.
Page 14 of 32
Editorial Office, Dept of Economics, Warwick University, Coventry CV4 7AL, UK
Submitted Manuscript
123456789101112131415161718192021222324252627282930313233343536373839404142434445464748495051525354555657585960
For Peer Review
15
4.2.2. Public sector efficiency (PSE)
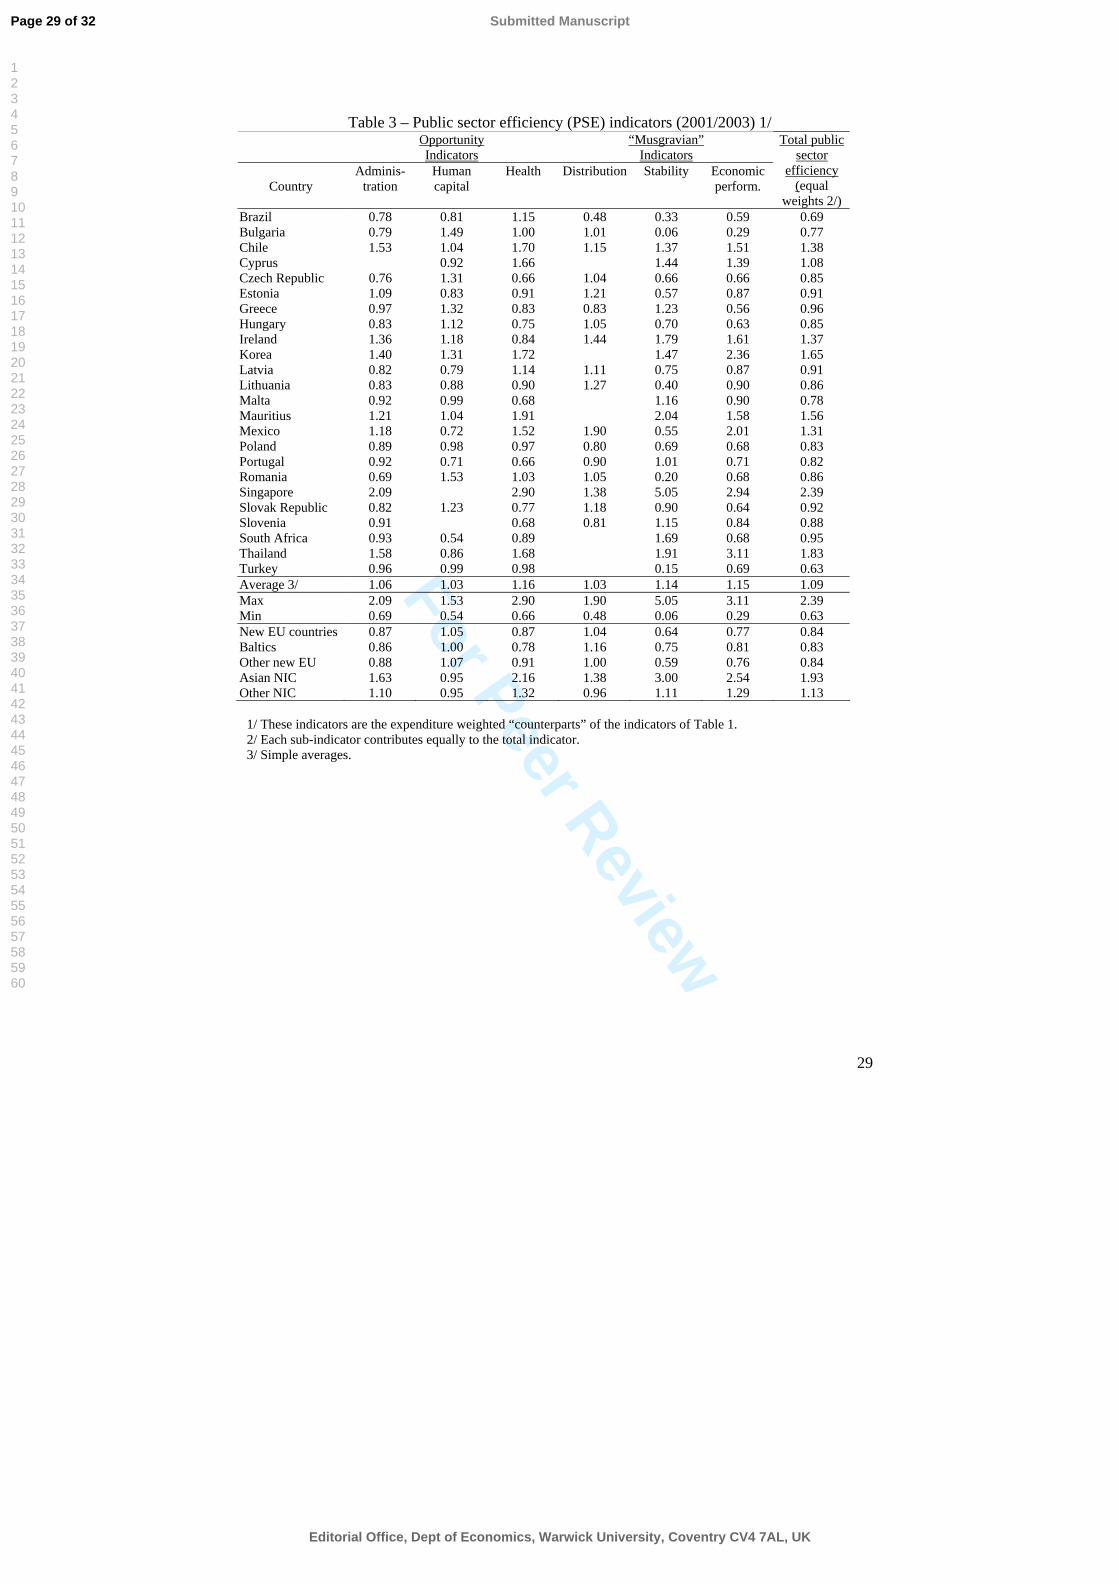
Public sector performance must be set in relation to the inputs used in order to gauge the
efficiency of the state. We compute indicators of Public Sector Efficiency (PSE), taking into
account the expenditure related to each sub-indicator as described in section three. PSE indicators
are presented in Table 3 where, due to data limitations for the pre-1998 period in many countries,
averages of the corresponding expenditure item were used for the relatively short period of 1998-
2003 (see Annex for precise dates and primary data).
[Insert Table 3]
The results for measuring public sector efficiency show an accentuation of the findings for public
sector performance. This suggests that more public spending often has relatively low returns as
regards improved performance (which is consistent with the findings of our earlier study for
industrialised countries). Most low performers, including most new EU member states range
between 0.8 and 0.9 and Cyprus is the only new member country with an average PSE score.
Countries with a small government sector post a higher PSE score than the average (and hence
even more so than the countries with “big” governments). The emerging countries of Asia plus
Mauritius have most of the highest scores as their good performance is achieved with low public
spending.
When looking at sub-indices, the new member states efficiency scores are near average on human
capital and on income distribution. In all other areas, PSE scores are well below average for the
new EU member states. Note also that the income distribution efficiency score is highest in the
countries with smaller welfare states. This confirms findings elsewhere that welfare programmes
in (rich and) poor countries are often poorly targeted and benefit those with special interests
rather than those in need (Alesina (1998) and Schuknecht and Tanzi (2005)).
Page 15 of 32
Editorial Office, Dept of Economics, Warwick University, Coventry CV4 7AL, UK
Submitted Manuscript
123456789101112131415161718192021222324252627282930313233343536373839404142434445464748495051525354555657585960
For Peer Review
16
All in all the results suggest that efficiency differs enormously across countries. In the new
member states, a relatively average performance (PSP scores) in most countries is “bought” with
too many inputs so that efficiency (PSE) is low. In the next section, we will analyse whether these
findings are confirmed by using a DEA approach.
4.3. Relative efficiency analysis via a DEA approach
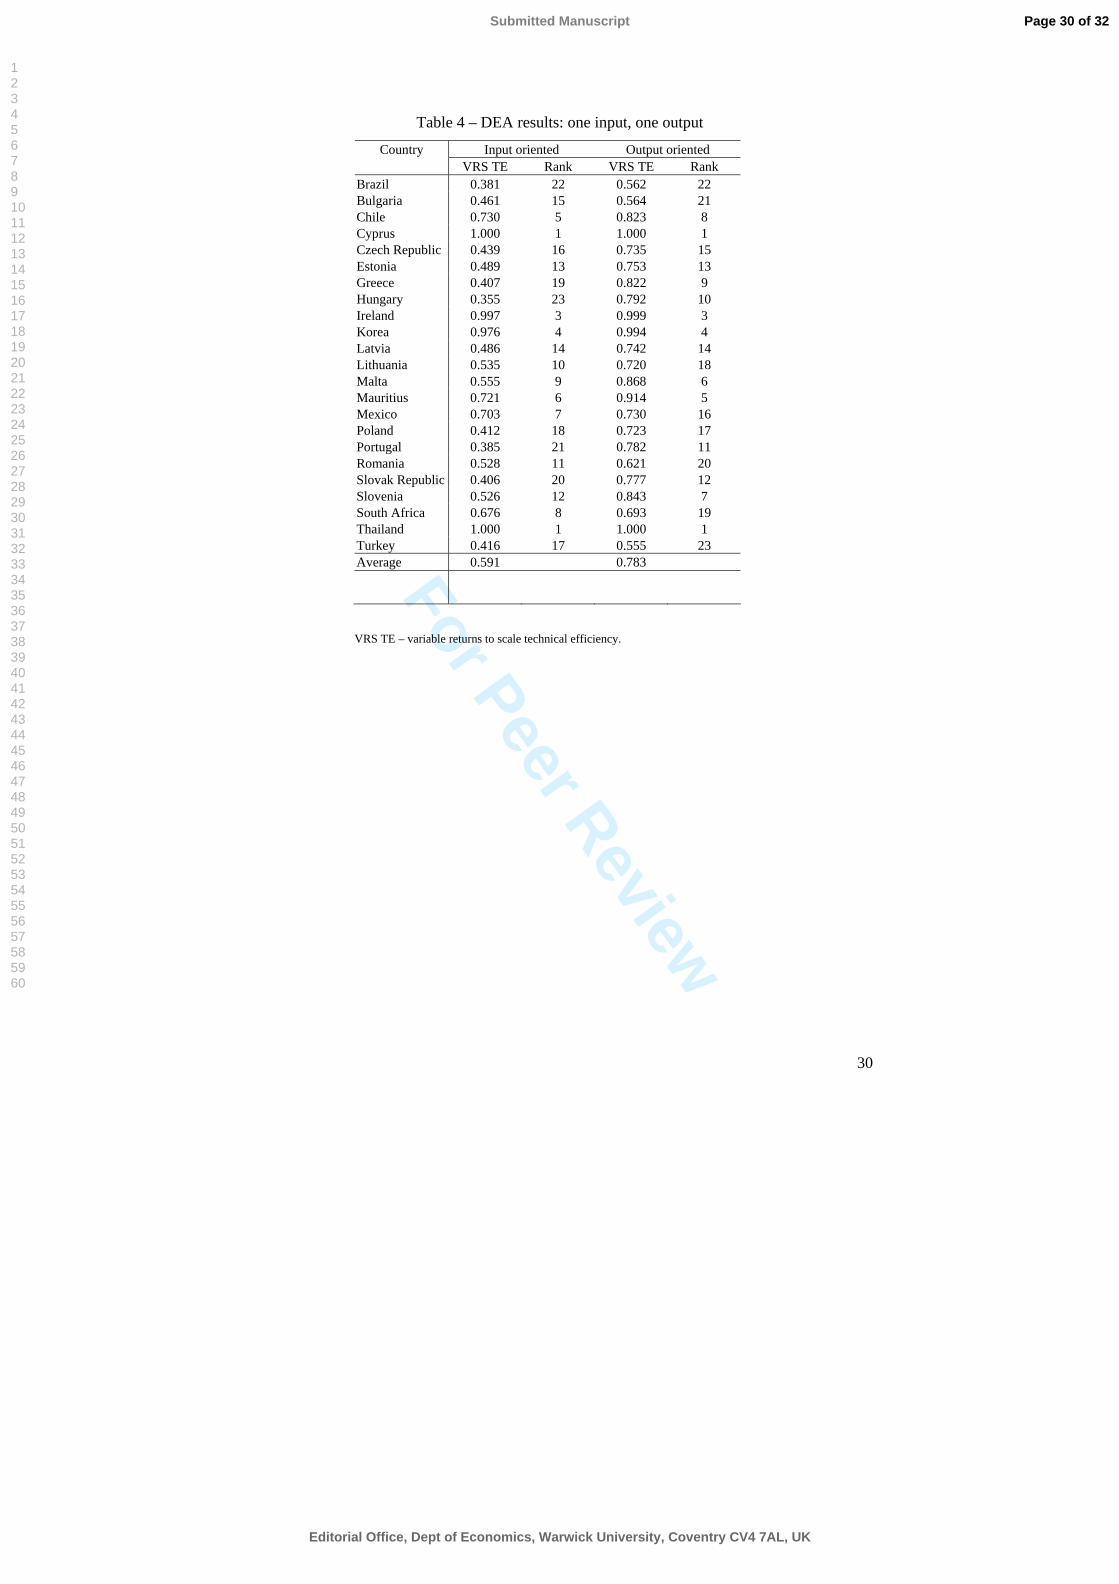
We used a DEA approach as described above, using as our output measure the PSP composite
indicator reported in Table 2 and as an input measure, the total government spending as a ratio of
GDP. Table 4 presents both the input and the output oriented efficiency coefficients of the
variable returns to scale analysis while the constant returns to scale coefficients are also reported
for completeness. We opted for not including Singapore since its economic indicators give it
characteristics of an outlier in the country sample we use.9
[Insert Table 4]
The results largely confirm the findings of the earlier “macro” approach of determining efficiency
of the public sector. New member states are ranked between 9 and 23 on input scores and
between 6 and 21 on output scores, hence reflecting rather diverse and often below average
efficiency. Two countries that also had amongst the top PSE scores are located on the frontier:
Cyprus and Thailand, while Ireland, Korea, Chile and Mauritius come next. From an input
oriented perspective, Brazil, Greece and Hungary find themselves at the bottom of the list while
most new member states fill the middle ranks. The highest-ranking country uses 1/3 of the input
that the bottom ranking one uses to attain a certain PSP score. The average input score of 0.59
hints to the possibility that, for the level of output they are attaining, countries could in theory use
around 41 per cent less resources.
9 Similar overall results are obtained with Singapore, as shown in Afonso et al. (2006).
Page 16 of 32
Editorial Office, Dept of Economics, Warwick University, Coventry CV4 7AL, UK
Submitted Manuscript
123456789101112131415161718192021222324252627282930313233343536373839404142434445464748495051525354555657585960
For Peer Review
17
From an output perspective, the top performer achieves twice as much output as the least efficient
country with the same input. The average output score of 0.78 implies that on average, for the
level of input they are using, the countries are only obtaining around 78 percent of the output they
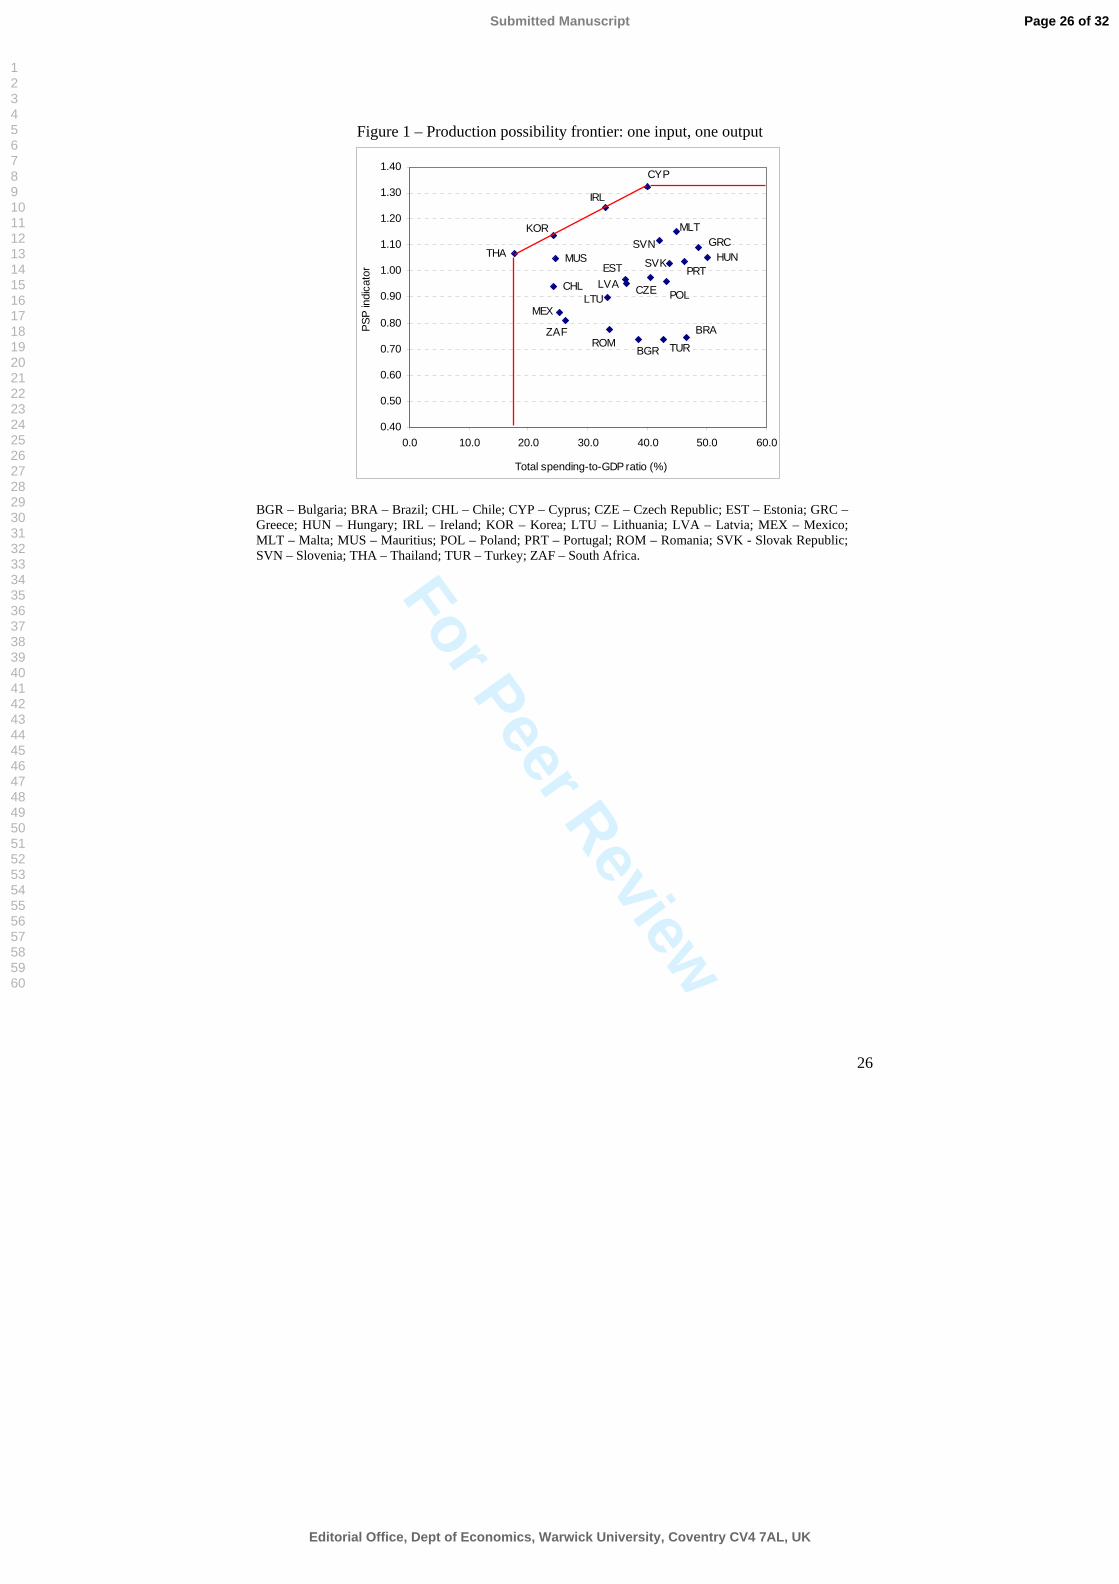
should deliver if they were deemed efficient.10 Figure 1 illustrates the production possibility
frontier associated with the aforementioned set of DEA results.
[Insert Figure 1]
4.4. Explaining inefficiencies via non-discretionary factors
As an additional step, we extend our analysis to exogenous factors that explain expenditure
efficiency (see section three for methodical issues). It is probably reasonable to conjecture that
expenditure efficiency depends on the “technology” applied in the public sector, on factors that
influence the ability of private agents to protect their resources from public claims, on the
monitoring capacities of public and private agents, and on international constraint. The variables
and underlying hypotheses we test are the following:
i) Secondary school enrolment. This variable aims to proxy the level of education of the
population in a given country. More educated people are hypothesized to be better able to
monitor the activities of politicians and bureaucrats and ultimately sanction crass inefficiency.
But more education is also likely to imply better educated and trained (and hence more efficient)
civil servants.
ii) The competence of the civil servants (survey results presented in the Global Competitiveness
Report, see Annex for sources and explanations). This variable aims to measure greater
10 Such calculations are an approximation of potential direct costs of inefficiency. However, indirect costs, implying a higher loss for consumer welfare should also be taken into account. This is outside the scope of our paper, but Afonso and Gaspar (2007) address this issue.
Page 17 of 32
Editorial Office, Dept of Economics, Warwick University, Coventry CV4 7AL, UK
Submitted Manuscript
123456789101112131415161718192021222324252627282930313233343536373839404142434445464748495051525354555657585960
For Peer Review
18
productivity and efficiency in the public sector through better training etc. It is expected to be
correlated with the education variable.
iii) Per capita GDP. This variable aims to proxy the physical capital stock which facilitates an
efficient production of public goods and services but which may also facilitate monitoring of
policy makers.
iv) An indicator of property rights. Secure property rights make it more difficult for governments
to extract wealth/rents from the private sector. They also facilitate holding governments
accountable for their actions.
v) Trade openness (exports and imports as a share of GDP). This indicator proxies the degree of
international competition over labour and capital that would penalise public inefficiency
disproportionately.
vi) Transparency in public policy. This is another indicator that should measure the ease of
monitoring public officials.
vii) Other more direct indicators of political accountability (such as civil liberty, political rights or
checks and balances) do not show much variation for this country group as almost all of them are
in the top group.
Exogenous factors could also include other factors that could be detrimental or favourable to
efficiency (such as the climate, the cultural background) for which economically meaningful
hypotheses are less readily available. We do not include such variables in our analysis.
Using the DEA output efficiency scores computed in the previous subsection, we now evaluate
the importance of non-discretionary inputs via censored Tobit regressions where output efficiency
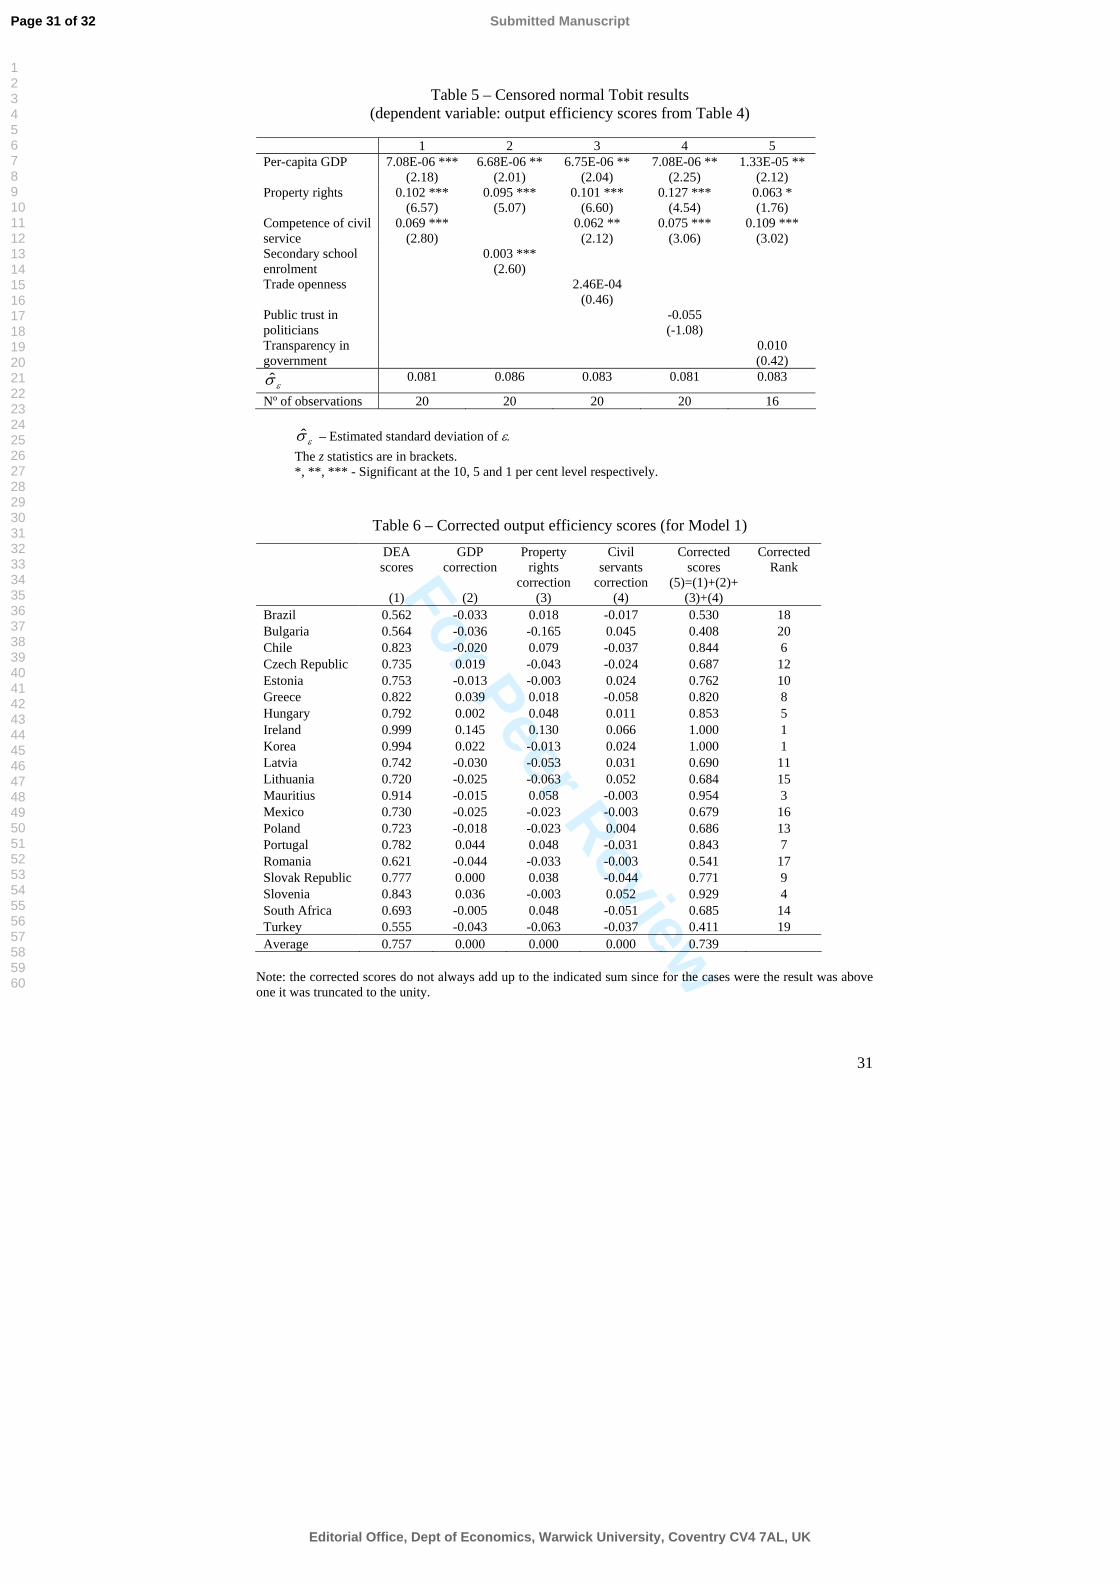
scores are regressed on our choice of exogenous, non-discretionary factors. Table 5 confirms the
relevance of several of our hypotheses and the variables chosen to test them.
[Insert Table 5]
Page 18 of 32
Editorial Office, Dept of Economics, Warwick University, Coventry CV4 7AL, UK
Submitted Manuscript
123456789101112131415161718192021222324252627282930313233343536373839404142434445464748495051525354555657585960
For Peer Review
19
The Tobit analysis suggests that the security of property rights, per capita GDP, the competence
of civil servants, and the education level of people positively affect expenditure efficiency. Due
to significant correlation, however, the two competence/education variables are only significant
in separate regressions while the other two variables are robust over all specifications.
International trade openness, trust in politicians and transparency of the political system have not
been found to display a significant influence on expenditure efficiency (even though only the
coefficient for public trust in politicians had the wrong sign). The regressions’ standard deviation
also points to a reasonable model fit.
In Table 6 we report output efficiency score corrections from model 1 in Table 5 for the
environmental variables detected as statistically significant in the Tobit analysis: GDP, property
rights, competence of civil servants. We computed these corrections by considering that the non-
discretionary factors varied to the sample average in each country. The output scores corrected
for environmental effects (truncated to one when necessary) are presented in column five of
Table 6 as a result of the sum of the previous four columns. One should also notice that the
number of countries considered decreased from twenty-three in the DEA calculations to twenty in
the two-step analysis, since property rights, and competence of public civil servants data was not
available for Cyprus, Malta, and Thailand.11
[Insert Table 6]
Comparing the corrected scores in Table 6, resulting from corrections for environmental variables
with the scores from the standard DEA analysis, we can observe some changes. Some countries
11 We did a similar correction exercise for model 2, where secondary school enrolment is statistically significant, but since the results were not very diferent, this is not reported, being worthwhile noticing that such factor has a positive contribution to the efficiency score of most new EU member states.
Page 19 of 32
Editorial Office, Dept of Economics, Warwick University, Coventry CV4 7AL, UK
Submitted Manuscript
123456789101112131415161718192021222324252627282930313233343536373839404142434445464748495051525354555657585960
For Peer Review
20
decreased their respective distances to the production possibility frontier, for instance this is the
case of Hungary, Slovenia, Mauritius and South Africa. In the case of these two last countries, for
such improvement contributed positively the above average positioning in terms of property
rights, which compensate the negative impact from GDP and competence of civil servants
variables. On the other hand, other countries see a decline in their efficiency scores after taking
into account the non-discretionary factors. For instance, the aforementioned three factors all
contribute negatively to distance away from the frontier Mexico, Romania, and Turkey.
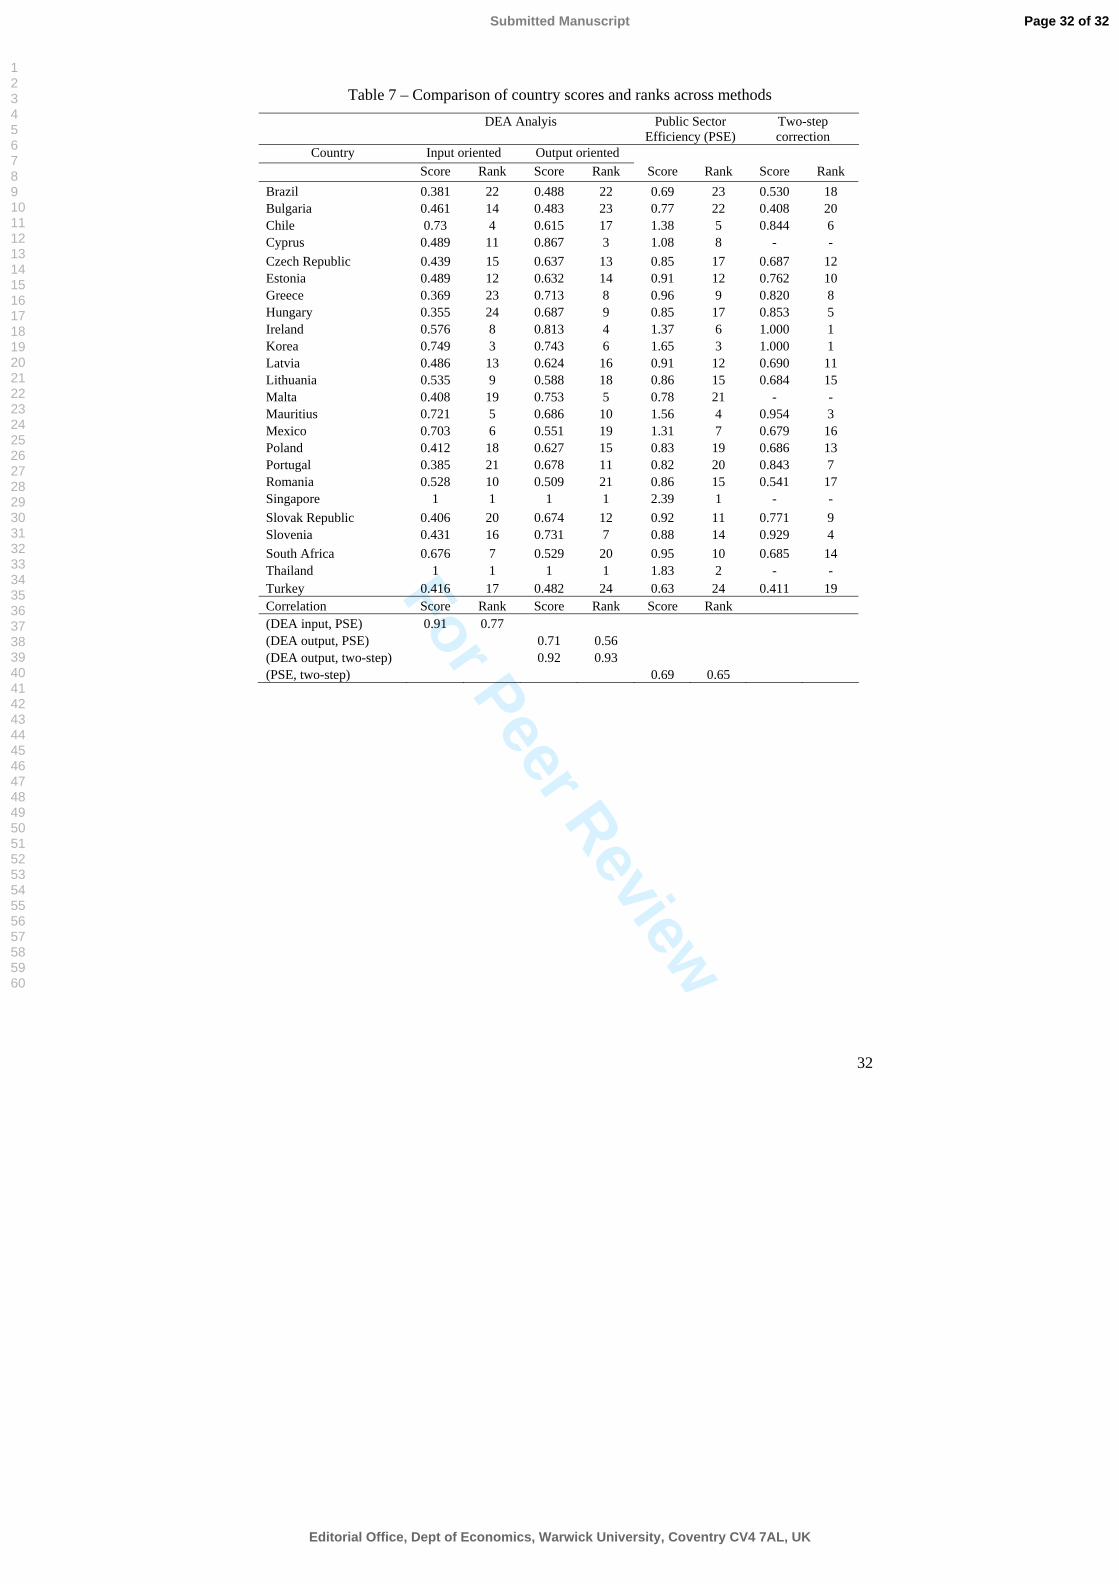
When we compare the results of our composite indicator analysis of performance and efficiency
with those of the standard DEA analysis, and the two-step analysis, we notice rather similar
results as reflected in very high correlation coefficients for scores and ranks across methods (see
Table 7). This is evidence for a certain robustness of our results.
[Insert Table 7]
5. Conclusion
In this paper we analysed public sector efficiency in the new member states of the European
Union as compared to emerging markets. We start with a conceptual discussion of expenditure
efficiency measurement issues where challenges regarding the measurement of costs, the
definition of goals and the measurement of outcomes are significant. Taking these challenges into
account, we calculate efficiency scores and rankings by applying a range of measurement
techniques to the new EU member countries and a selection of emerging markets, catch-up
economies, and EU candidate countries.
The results of our analysis show that expenditure efficiency across new EU member states is
rather diverse, especially compared to the group of top performing emerging markets in Asia.
From the analysis of composite public sector performance (PSP) and efficiency (PSE) scores we
Page 20 of 32
Editorial Office, Dept of Economics, Warwick University, Coventry CV4 7AL, UK
Submitted Manuscript
123456789101112131415161718192021222324252627282930313233343536373839404142434445464748495051525354555657585960
For Peer Review
21
find that countries with lean public sectors and public expenditure ratios not far from 30% of
GDP tend to be most efficient. PSE scores of the most efficient countries are more than twice as
high as those of the poorest performers.
From the DEA results we see that a small set of countries define or are very close to the
theoretical production possibility frontier: Thailand, Cyprus, Korea, and Ireland. From an input
perspective the highest ranking country uses 1/3 of the input that the bottom ranking one uses to
attain a certain PSP score. The average input scores suggest that countries could use around 45
per cent less resources to attain the same outcomes if they were fully efficient. Average output
scores suggest that countries are only delivering around 2/3 of the output they could deliver if
they were on the efficiency frontier.
Finally we examine via Tobit analysis the influence of non-discretionary factors, notably non-
fiscal variables, on expenditure efficiency. The study shows that per-capita income, public sector
competence and education levels as well as the security of property rights seem to facilitate the
prevention of inefficiencies in the public sector. Additionally, we corrected output scores by
considering the effects of non-discretionary factors. The country rankings and output scores
resulting from such correction, even if not considerably different from the DEA results, allow
decomposing the specific non-discretionary factor contribution to the change in the efficiency
scores.
From a policy perspective, one should be careful to draw overly strong conclusions and we have
referred to a number of caveats in the course of the paper. Nevertheless, it is apparent that many
new members states and other emerging markets can still considerably increase the efficiency of
public spending by improving the outcomes and by restraining the resource use. The final
Page 21 of 32
Editorial Office, Dept of Economics, Warwick University, Coventry CV4 7AL, UK
Submitted Manuscript
123456789101112131415161718192021222324252627282930313233343536373839404142434445464748495051525354555657585960
For Peer Review
22
econometric analysis also suggests that high education levels, a competent civil service and the
security of property rights seem to provide an “extra boost” to public expenditure efficiency.
References
Afonso A, Fernandes S. Local Government Spending Efficiency: DEA Evidence for the Lisbon
Region. Regional Studies, 2006; 40; 39-53.
Afonso A, Gaspar V. Dupuit, Pigou and cost of inefficiency in public services provision, Public
Choice, 2007; 132 (3-4); 485-502.
Afonso A, Schuknecht L, Tanzi V. Public Sector Efficiency: An International Comparison.
Public Choice, 2005; 123; 321-347.
Afonso A, Schuknecht L, Tanzi V. Public Sector Efficiency: Evidence for the New EU Member
States and Emerging Markets. European Central Bank, 2006; Working Paper n. 581.
Afonso A, St. Aubyn M. Non-parametric Approaches to Education and Health Efficiency in
OECD Countries. Journal of Applied Economics, 2005; 8; 227-246.
Afonso A, St. Aubyn M. Cross-country Efficiency of Secondary Education Provision: a Semi-
parametric Analysis with Non-discretionary Inputs. Economic Modelling, 2006; 23; 476-491.
Alesina A 1998. The Political Economy of Macroeconomic Stabilization and Income Inequality:
Myths and Reality. In: Tanzi V, Chu K-Y (Eds), Income Distribution and High-Quality
Growth. Cambridge and London, MIT Press.
Buti M, van den Noord P. What is the Impact of Tax and Welfare Reforms on Fiscal Stabilisers?
A Simple Model and an Application to EMU. European Economy – Economic Papers, 2003; 187.
Charnes A, Cooper W, Rhodes E. Measuring the efficiency of decision making units. European
Journal of Operational Research, 1978; 2; 429–444.
Clements B. How Efficient is Education Spending in Europe? European Review of Economics
and Finance, 2002; 1; 3-26.
Coelli T, Rao D, Battese G. An Introduction to Efficiency and Productivity Analysis. 6th edition,
Massachusetts, Kluwer Academic Publishers; 2002.
Cuaresma C, Reitschuler G, Sillgoner M. The Fiscal Smile – On the Effectinveness and Limits of
Fiscal Stabilisers. Money Macro and Finance Research Group, 87; 2004.
De Borger B, Kerstens K, Moesen W, Vanneste J. Explaining differences in productive
efficiency: An application to Belgian Municipalities. Public Choice, 1994; 80; 339-358.
Page 22 of 32
Editorial Office, Dept of Economics, Warwick University, Coventry CV4 7AL, UK
Submitted Manuscript
123456789101112131415161718192021222324252627282930313233343536373839404142434445464748495051525354555657585960
For Peer Review
23
De Borger B, Kerstens K. Cost efficiency of Belgian local governments: A comparative analysis
of FDH, DEA, and econometric approaches, Regional Science and Urban Economics, 1996; 26;
145-170.
Fakin B, de Crombrugghe A. Fiscal adjustment in transition economies: social transfers and the
efficiency of public spending: a comparison with OECD countries. Policy Research Working
Paper 1803; 1997. Washington, DC: World Bank.
Farrell M. The Measurement of Productive Efficiency. Journal of the Royal Statistical Society
Series A (General) 1957; 120; 253-281.
Gupta S, Verhoeven M. The efficiency of government expenditure Experiences from Africa.
Journal of Policy Modelling 2001; 23; 433– 467.
Heller P. Who Will Pay? Coping with Aging Societies, Climate Change and Other Long Term
Fiscal Challenges, 2003. Washington D.C.: IMF.
Joumard I, Kongsrud P, Nam Y-S, Price R. Enhancing the Effectiveness of Public Spending:
Experience in OECD Countries. OECD Economics Department, 2004; Working Paper 380.
Murillo-Zamorano L. Economic Efficiency and Frontier Techniques. Journal of Economic
Surveys, 2004; 18; 33-77.
OECD. Enhancing the Cost Effectiveness of Public Spending. Economic Outlook, 2003; vol.
2003/02, n. 74, December, OECD.
Ruggiero, J. (2004). “Performance evaluation when non-discretionary factors correlate with
technical efficiency”, European Journal of Operational Research 159, 250–257.
Schuknecht L, Tanzi V. Reforming public expenditure in industrialised countries: are there trade-
offs. European Central Bank, 2005; Working Paper n. 435.
Simar L, Wilson P. Efficiency analysis: the statistical approach. Lecture notes, 2003; January.
St. Aubyn M. Evaluating Efficiency in the Portuguese Education Sector. Economia, 2003; 26; 25-
51.
Tanzi V. Redistributing Income through the Budget in Latin America. Banca Nazionale del
Lavoro, Quarterly Review; 1974, March.
Tanzi, V. The Economic Role of the State in the 21st Century”, Cato Journal, 2005; 25; 617-638.
Tanzi V, Schuknecht L. Reconsidering the Fiscal Role of Government: The International
Perspective. American Economic Review, 1997; 87; 164-168.
Tanzi V, Schuknecht L. Public Spending in the 20th Century: A Global Perspective. Cambridge:
Cambridge University Press; 2000.
Thanassoulis E. Introduction to the Theory and Application of Data Envelopment Analysis.
Kluwer Academic Publishers; 2001.
Page 23 of 32
Editorial Office, Dept of Economics, Warwick University, Coventry CV4 7AL, UK
Submitted Manuscript
123456789101112131415161718192021222324252627282930313233343536373839404142434445464748495051525354555657585960
For Peer Review
24
Van den Eeckhaut P, Tulkens H, Jamar M-A. Cost-efficiency in Belgian municipalities. In Fried
H, Lovell C, Schmidt S (Eds), The Measurement of Productive Efficiency: Techniques and
Applications. New York: Oxford Univ. Press; 1993.
Annex – Data and sources
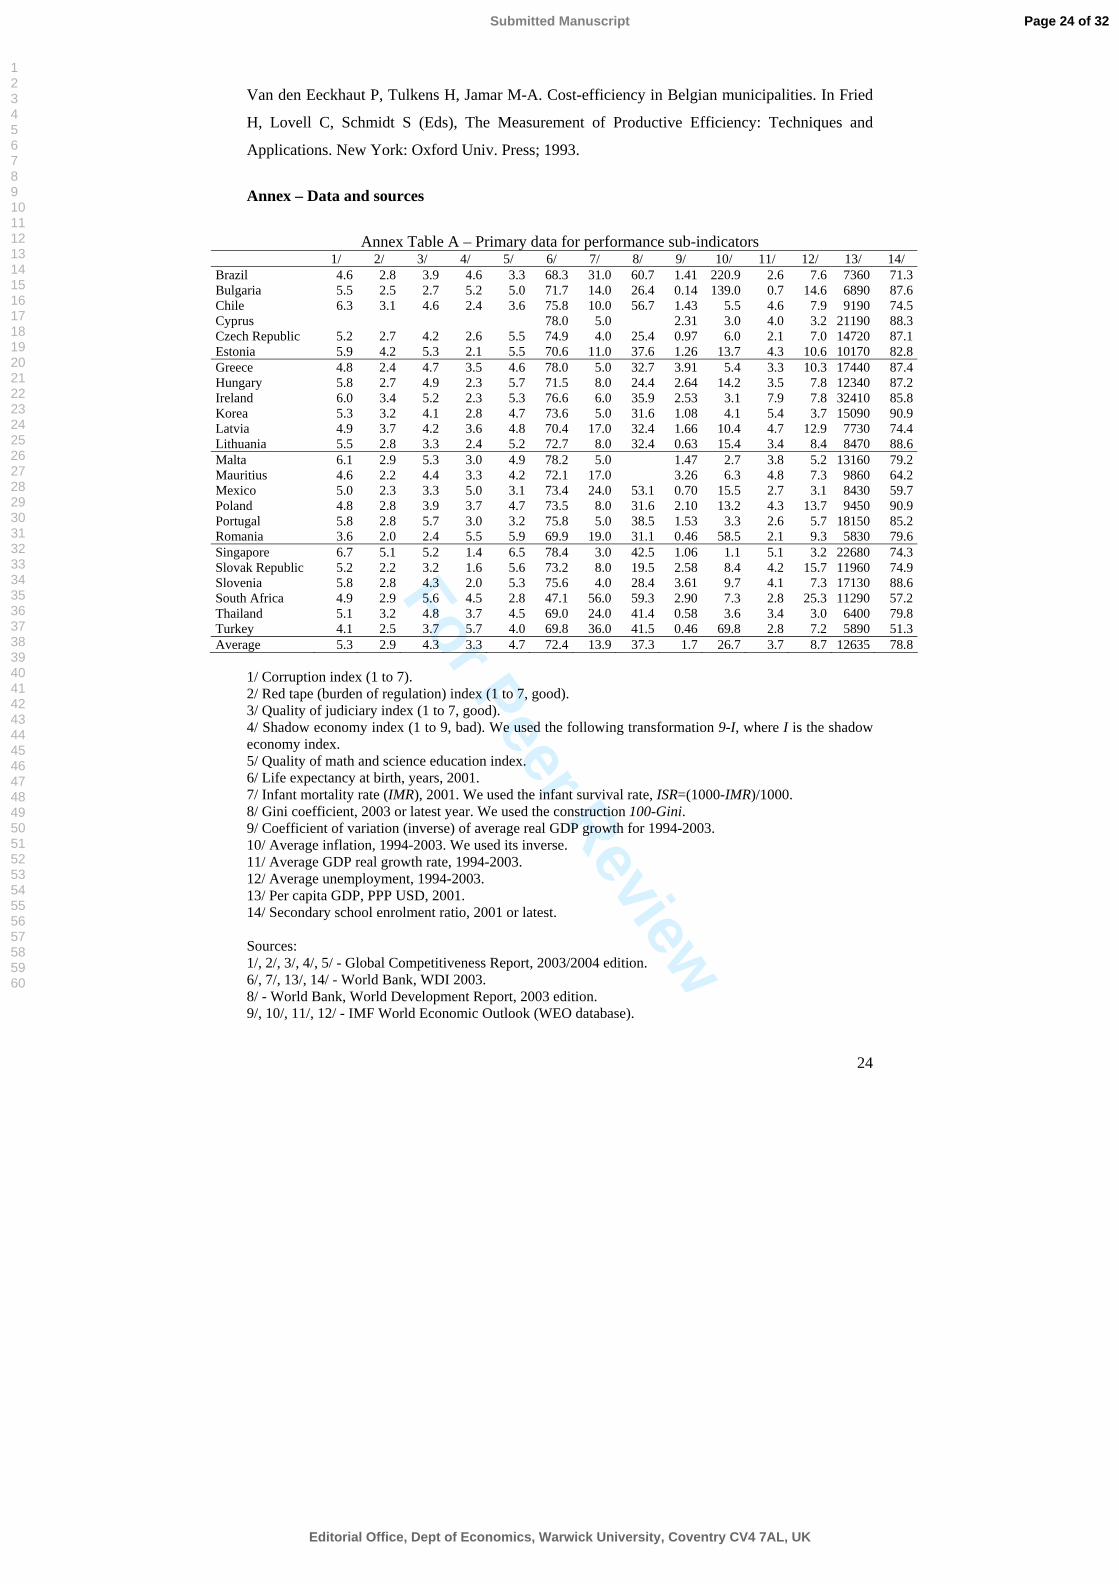
Annex Table A – Primary data for performance sub-indicators
1/ 2/ 3/ 4/ 5/ 6/ 7/ 8/ 9/ 10/ 11/ 12/ 13/ 14/ Brazil 4.6 2.8 3.9 4.6 3.3 68.3 31.0 60.7 1.41 220.9 2.6 7.6 7360 71.3Bulgaria 5.5 2.5 2.7 5.2 5.0 71.7 14.0 26.4 0.14 139.0 0.7 14.6 6890 87.6Chile 6.3 3.1 4.6 2.4 3.6 75.8 10.0 56.7 1.43 5.5 4.6 7.9 9190 74.5Cyprus 78.0 5.0 2.31 3.0 4.0 3.2 21190 88.3Czech Republic 5.2 2.7 4.2 2.6 5.5 74.9 4.0 25.4 0.97 6.0 2.1 7.0 14720 87.1Estonia 5.9 4.2 5.3 2.1 5.5 70.6 11.0 37.6 1.26 13.7 4.3 10.6 10170 82.8Greece 4.8 2.4 4.7 3.5 4.6 78.0 5.0 32.7 3.91 5.4 3.3 10.3 17440 87.4Hungary 5.8 2.7 4.9 2.3 5.7 71.5 8.0 24.4 2.64 14.2 3.5 7.8 12340 87.2Ireland 6.0 3.4 5.2 2.3 5.3 76.6 6.0 35.9 2.53 3.1 7.9 7.8 32410 85.8Korea 5.3 3.2 4.1 2.8 4.7 73.6 5.0 31.6 1.08 4.1 5.4 3.7 15090 90.9Latvia 4.9 3.7 4.2 3.6 4.8 70.4 17.0 32.4 1.66 10.4 4.7 12.9 7730 74.4Lithuania 5.5 2.8 3.3 2.4 5.2 72.7 8.0 32.4 0.63 15.4 3.4 8.4 8470 88.6Malta 6.1 2.9 5.3 3.0 4.9 78.2 5.0 1.47 2.7 3.8 5.2 13160 79.2Mauritius 4.6 2.2 4.4 3.3 4.2 72.1 17.0 3.26 6.3 4.8 7.3 9860 64.2Mexico 5.0 2.3 3.3 5.0 3.1 73.4 24.0 53.1 0.70 15.5 2.7 3.1 8430 59.7Poland 4.8 2.8 3.9 3.7 4.7 73.5 8.0 31.6 2.10 13.2 4.3 13.7 9450 90.9Portugal 5.8 2.8 5.7 3.0 3.2 75.8 5.0 38.5 1.53 3.3 2.6 5.7 18150 85.2Romania 3.6 2.0 2.4 5.5 5.9 69.9 19.0 31.1 0.46 58.5 2.1 9.3 5830 79.6Singapore 6.7 5.1 5.2 1.4 6.5 78.4 3.0 42.5 1.06 1.1 5.1 3.2 22680 74.3Slovak Republic 5.2 2.2 3.2 1.6 5.6 73.2 8.0 19.5 2.58 8.4 4.2 15.7 11960 74.9Slovenia 5.8 2.8 4.3 2.0 5.3 75.6 4.0 28.4 3.61 9.7 4.1 7.3 17130 88.6South Africa 4.9 2.9 5.6 4.5 2.8 47.1 56.0 59.3 2.90 7.3 2.8 25.3 11290 57.2Thailand 5.1 3.2 4.8 3.7 4.5 69.0 24.0 41.4 0.58 3.6 3.4 3.0 6400 79.8Turkey 4.1 2.5 3.7 5.7 4.0 69.8 36.0 41.5 0.46 69.8 2.8 7.2 5890 51.3Average 5.3 2.9 4.3 3.3 4.7 72.4 13.9 37.3 1.7 26.7 3.7 8.7 12635 78.8
1/ Corruption index (1 to 7). 2/ Red tape (burden of regulation) index (1 to 7, good). 3/ Quality of judiciary index (1 to 7, good). 4/ Shadow economy index (1 to 9, bad). We used the following transformation 9-I, where I is the shadow economy index. 5/ Quality of math and science education index. 6/ Life expectancy at birth, years, 2001. 7/ Infant mortality rate (IMR), 2001. We used the infant survival rate, ISR=(1000-IMR)/1000. 8/ Gini coefficient, 2003 or latest year. We used the construction 100-Gini. 9/ Coefficient of variation (inverse) of average real GDP growth for 1994-2003. 10/ Average inflation, 1994-2003. We used its inverse. 11/ Average GDP real growth rate, 1994-2003. 12/ Average unemployment, 1994-2003. 13/ Per capita GDP, PPP USD, 2001. 14/ Secondary school enrolment ratio, 2001 or latest. Sources: 1/, 2/, 3/, 4/, 5/ - Global Competitiveness Report, 2003/2004 edition. 6/, 7/, 13/, 14/ - World Bank, WDI 2003. 8/ - World Bank, World Development Report, 2003 edition. 9/, 10/, 11/, 12/ - IMF World Economic Outlook (WEO database).
Page 24 of 32
Editorial Office, Dept of Economics, Warwick University, Coventry CV4 7AL, UK
Submitted Manuscript
123456789101112131415161718192021222324252627282930313233343536373839404142434445464748495051525354555657585960
For Peer Review
25
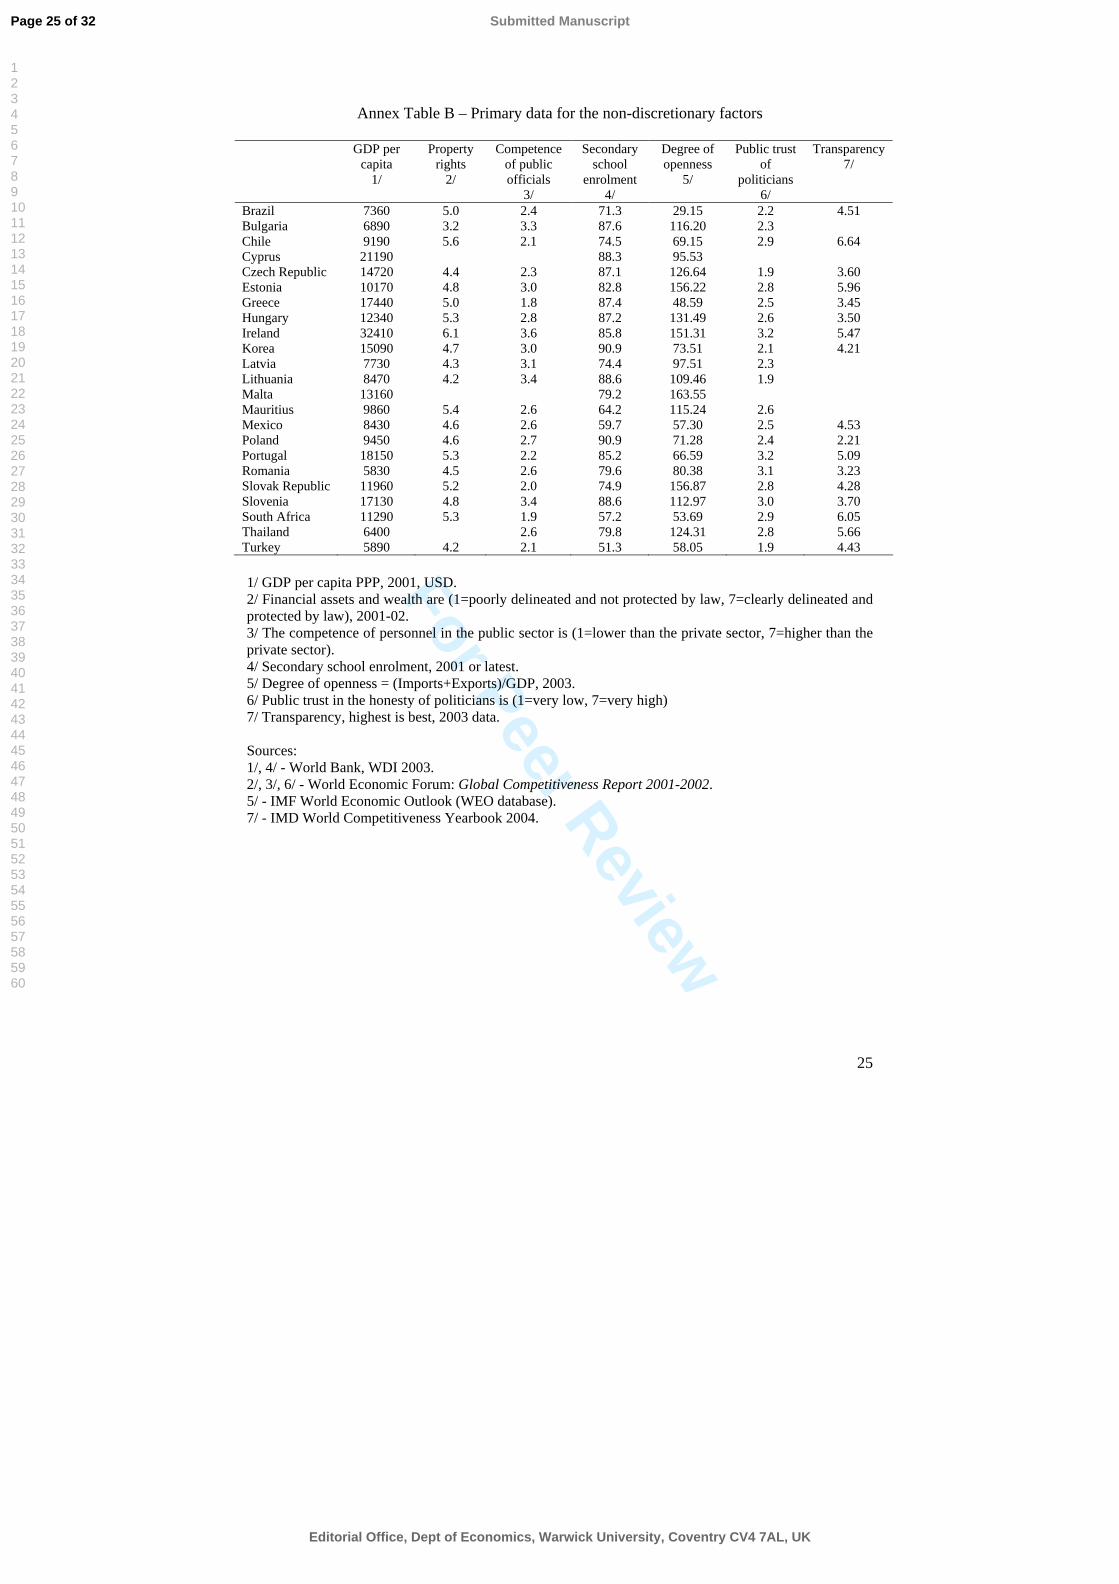
Annex Table B – Primary data for the non-discretionary factors
GDP per capita
1/
Property rights
2/
Competence of public officials
3/
Secondary school
enrolment 4/
Degree of openness
5/
Public trust of
politicians 6/
Transparency 7/
Brazil 7360 5.0 2.4 71.3 29.15 2.2 4.51 Bulgaria 6890 3.2 3.3 87.6 116.20 2.3 Chile 9190 5.6 2.1 74.5 69.15 2.9 6.64 Cyprus 21190 88.3 95.53 Czech Republic 14720 4.4 2.3 87.1 126.64 1.9 3.60 Estonia 10170 4.8 3.0 82.8 156.22 2.8 5.96 Greece 17440 5.0 1.8 87.4 48.59 2.5 3.45 Hungary 12340 5.3 2.8 87.2 131.49 2.6 3.50 Ireland 32410 6.1 3.6 85.8 151.31 3.2 5.47 Korea 15090 4.7 3.0 90.9 73.51 2.1 4.21 Latvia 7730 4.3 3.1 74.4 97.51 2.3 Lithuania 8470 4.2 3.4 88.6 109.46 1.9 Malta 13160 79.2 163.55 Mauritius 9860 5.4 2.6 64.2 115.24 2.6 Mexico 8430 4.6 2.6 59.7 57.30 2.5 4.53 Poland 9450 4.6 2.7 90.9 71.28 2.4 2.21 Portugal 18150 5.3 2.2 85.2 66.59 3.2 5.09 Romania 5830 4.5 2.6 79.6 80.38 3.1 3.23 Slovak Republic 11960 5.2 2.0 74.9 156.87 2.8 4.28 Slovenia 17130 4.8 3.4 88.6 112.97 3.0 3.70 South Africa 11290 5.3 1.9 57.2 53.69 2.9 6.05 Thailand 6400 2.6 79.8 124.31 2.8 5.66 Turkey 5890 4.2 2.1 51.3 58.05 1.9 4.43
1/ GDP per capita PPP, 2001, USD. 2/ Financial assets and wealth are (1=poorly delineated and not protected by law, 7=clearly delineated and protected by law), 2001-02. 3/ The competence of personnel in the public sector is (1=lower than the private sector, 7=higher than the private sector). 4/ Secondary school enrolment, 2001 or latest. 5/ Degree of openness = (Imports+Exports)/GDP, 2003. 6/ Public trust in the honesty of politicians is (1=very low, 7=very high) 7/ Transparency, highest is best, 2003 data. Sources: 1/, 4/ - World Bank, WDI 2003. 2/, 3/, 6/ - World Economic Forum: Global Competitiveness Report 2001-2002. 5/ - IMF World Economic Outlook (WEO database). 7/ - IMD World Competitiveness Yearbook 2004.
Page 25 of 32
Editorial Office, Dept of Economics, Warwick University, Coventry CV4 7AL, UK
Submitted Manuscript
123456789101112131415161718192021222324252627282930313233343536373839404142434445464748495051525354555657585960
For Peer Review
26
Figure 1 – Production possibility frontier: one input, one output
CZELVA
MLT
TURZAF
THA MUS
IRL
CYP
PRT
GRCKOR
CHL
ROMBGR
POLLTU
SVNHUNSVKEST
MEX
BRA
0.40
0.50
0.60
0.70
0.80
0.90
1.00
1.10
1.20
1.30
1.40
0.0 10.0 20.0 30.0 40.0 50.0 60.0
Total spending-to-GDP ratio (%)
PSP
indi
cato
r
BGR – Bulgaria; BRA – Brazil; CHL – Chile; CYP – Cyprus; CZE – Czech Republic; EST – Estonia; GRC – Greece; HUN – Hungary; IRL – Ireland; KOR – Korea; LTU – Lithuania; LVA – Latvia; MEX – Mexico; MLT – Malta; MUS – Mauritius; POL – Poland; PRT – Portugal; ROM – Romania; SVK - Slovak Republic; SVN – Slovenia; THA – Thailand; TUR – Turkey; ZAF – South Africa.
Page 26 of 32
Editorial Office, Dept of Economics, Warwick University, Coventry CV4 7AL, UK
Submitted Manuscript
123456789101112131415161718192021222324252627282930313233343536373839404142434445464748495051525354555657585960
For Peer Review
27
Table 1 – Public expenditure in sample countries and country groups, % of GDP
Total spending
1/
Government consumption
2/
Transfers and
subsidies 3/
Interest payments
4/
Public investment
5/
Education
6/
Health
7/ Brazil 46.6 19.5 17.1 8.2 1.9 4.6 3.3 Bulgaria 38.6 17.3 15.2 3.2 3.4 3.4 4.0 Chile 24.4 12.6 7.9 1.2 2.7 3.8 2.4 Cyprus 40.0 18.0 11.0 3.3 3.0 5.6 2.5 Czech Republic 40.6 22.7 15.0 1.2 3.4 4.0 6.2 Estonia 36.4 19.7 10.7 0.3 4.1 6.2 4.4 Greece 48.6 16.8 17.0 7.2 3.8 3.7 5.1 Hungary 50.2 22.4 15.0 4.6 3.8 4.8 5.3 Ireland 33.0 14.8 9.3 1.7 3.8 4.4 4.9 Korea 24.4 12.7 5.4 3.8 2.4 Latvia 36.6 21.4 12.7 0.9 1.3 5.8 3.5 Lithuania 33.3 20.3 11.1 1.5 2.6 5.9 4.5 Malta 45.0 20.7 14.5 3.8 4.4 4.8 6.2 Mauritius 24.7 12.9 3.8 7.5 3.8 2.1 Mexico 25.3 11.7 5.2 4.6 3.8 4.6 2.6 Poland 43.2 17.9 17.9 2.8 3.3 5.1 4.2 Portugal 46.2 20.7 14.3 3.1 3.7 5.7 6.2 Romania 33.7 15.7 13.7 2.3 1.9 3.4 3.8 Singapore 21.0 11.4 8.7 0.8 1.4 Slovak Republic 43.8 20.0 14.2 3.5 2.9 4.1 5.2 Slovenia 42.1 20.2 18.6 2.3 2.9 6.0 South Africa 26.3 18.4 4.5 2.7 5.7 3.6 Thailand 17.8 11.2 7.7 5.3 2.3 Turkey 42.7 13.8 21.3 4.6 3.5 4.0 Average 36.0 17.2 13.1 3.9 3.7 4.6 4.0 Max 50.2 22.7 18.6 21.3 7.7 6.2 6.2 Min 17.8 11.2 5.2 0.3 1.3 3.4 1.4 New EU members 41.1 20.3 14.1 2.4 3.2 5.2 4.8 Baltic countries 35.4 20.5 11.5 0.9 2.7 6.0 4.1 Other new EU 43.5 20.3 15.2 3.1 3.4 4.7 5.1 Asian NIC 21.0 11.8 8.7 0.8 6.6 4.6 2.0 Other NIC 32.8 15.2 11.8 6.1 3.5 4.1 3.2 OECD 1990s 8/ 46.5 19.8 15.1 3.0 5.4 6.2 1/, 2/, 3/, 4/, 5/ - Average for 1999-2003, source: IMF World Economic Outlook, and European Commission AMECO database. 6/ Average for 1998-2001, source: World Bank, WDI 2003. 7/ Average for 1998-2002, source: World Bank, WDI 2003. 8/ Source: Afonso, Schuknecht and Tanzi (2005) for OECD 1990s. Note: columns 2 through 5 report economic expenditure categories, and that the last two columns report functional expenditure categories.
Page 27 of 32
Editorial Office, Dept of Economics, Warwick University, Coventry CV4 7AL, UK
Submitted Manuscript
123456789101112131415161718192021222324252627282930313233343536373839404142434445464748495051525354555657585960
For Peer Review
28
Table 2 – Public Sector Performance (PSP) indicators (2001/2003) Opportunity Indicators
“Musgravian” Indicators
Country
Adminis-tration
Human capital
Health Distribu-tion
Stability Economic perform.
Total public sector
performance(equal
weights 1/) Brazil 0.88 0.80 0.96 0.63 0.43 0.77 0.75 Bulgaria 0.80 1.09 0.99 1.17 0.06 0.31 0.74 Chile 1.12 0.86 1.03 0.69 0.92 1.02 0.94 Cyprus 1.12 1.04 1.59 1.54 1.33 Czech Republic 1.00 1.14 1.02 1.19 0.74 0.74 0.97 Estonia 1.25 1.11 0.99 1.00 0.57 0.88 0.97 Greece 0.95 1.04 1.04 1.07 1.67 0.76 1.09 Hungary 1.09 1.16 1.00 1.21 0.97 0.88 1.05 Ireland 1.17 1.11 1.03 1.02 1.64 1.47 1.24 Korea 1.04 1.08 1.01 1.09 1.00 1.60 1.14 Latvia 1.03 0.98 0.98 1.08 0.76 0.88 0.95 Lithuania 0.98 1.12 1.00 1.08 0.37 0.84 0.90 Malta 1.11 1.03 1.04 1.45 1.12 1.15 Mauritius 0.91 0.86 1.00 1.40 1.08 1.05 Mexico 0.80 0.71 1.00 0.75 0.38 1.41 0.84 Poland 0.92 1.08 1.01 1.09 0.83 0.81 0.96 Portugal 1.11 0.88 1.03 0.98 1.30 0.91 1.04 Romania 0.63 1.13 0.98 1.10 0.18 0.63 0.78 Singapore 1.39 1.16 1.05 0.92 2.94 1.71 1.53 Slovak Republic 0.95 1.07 1.01 1.28 1.09 0.77 1.03 Slovenia 1.07 1.13 1.03 1.14 1.35 0.99 1.12 South Africa 1.00 0.66 0.80 0.65 1.23 0.50 0.81 Thailand 1.03 0.99 0.97 0.93 0.94 1.54 1.07 Turkey 0.77 0.75 0.97 0.93 0.17 0.82 0.74 Average 2/ 1.00 1.00 1.00 1.00 1.00 1.00 1.00 Max 1.39 1.16 1.05 1.28 2.94 1.71 1.53 Min 0.63 0.66 0.80 0.63 0.06 0.31 0.74 New EU countries 0.99 1.06 1.00 1.09 0.74 0.86 0.96 Baltics 1.06 1.10 1.02 1.14 0.93 0.95 1.03 Other new EU 0.95 1.05 1.00 1.08 0.66 0.82 0.93 Asian NIC 1.11 1.00 1.00 0.93 1.76 1.44 1.21 Other NIC 0.97 0.91 0.98 0.87 0.96 1.08 0.98 1/ Each sub-indicator contributes 1/6 to total indicator. 2/ Simple averages.
Page 28 of 32
Editorial Office, Dept of Economics, Warwick University, Coventry CV4 7AL, UK
Submitted Manuscript
123456789101112131415161718192021222324252627282930313233343536373839404142434445464748495051525354555657585960
For Peer Review
29
Table 3 – Public sector efficiency (PSE) indicators (2001/2003) 1/ Opportunity Indicators
“Musgravian” Indicators
Country
Adminis-tration
Human capital
Health Distribution
Stability Economic perform.
Total public sector
efficiency (equal
weights 2/) Brazil 0.78 0.81 1.15 0.48 0.33 0.59 0.69 Bulgaria 0.79 1.49 1.00 1.01 0.06 0.29 0.77 Chile 1.53 1.04 1.70 1.15 1.37 1.51 1.38 Cyprus 0.92 1.66 1.44 1.39 1.08 Czech Republic 0.76 1.31 0.66 1.04 0.66 0.66 0.85 Estonia 1.09 0.83 0.91 1.21 0.57 0.87 0.91 Greece 0.97 1.32 0.83 0.83 1.23 0.56 0.96 Hungary 0.83 1.12 0.75 1.05 0.70 0.63 0.85 Ireland 1.36 1.18 0.84 1.44 1.79 1.61 1.37 Korea 1.40 1.31 1.72 1.47 2.36 1.65 Latvia 0.82 0.79 1.14 1.11 0.75 0.87 0.91 Lithuania 0.83 0.88 0.90 1.27 0.40 0.90 0.86 Malta 0.92 0.99 0.68 1.16 0.90 0.78 Mauritius 1.21 1.04 1.91 2.04 1.58 1.56 Mexico 1.18 0.72 1.52 1.90 0.55 2.01 1.31 Poland 0.89 0.98 0.97 0.80 0.69 0.68 0.83 Portugal 0.92 0.71 0.66 0.90 1.01 0.71 0.82 Romania 0.69 1.53 1.03 1.05 0.20 0.68 0.86 Singapore 2.09 2.90 1.38 5.05 2.94 2.39 Slovak Republic 0.82 1.23 0.77 1.18 0.90 0.64 0.92 Slovenia 0.91 0.68 0.81 1.15 0.84 0.88 South Africa 0.93 0.54 0.89 1.69 0.68 0.95 Thailand 1.58 0.86 1.68 1.91 3.11 1.83 Turkey 0.96 0.99 0.98 0.15 0.69 0.63 Average 3/ 1.06 1.03 1.16 1.03 1.14 1.15 1.09 Max 2.09 1.53 2.90 1.90 5.05 3.11 2.39 Min 0.69 0.54 0.66 0.48 0.06 0.29 0.63 New EU countries 0.87 1.05 0.87 1.04 0.64 0.77 0.84 Baltics 0.86 1.00 0.78 1.16 0.75 0.81 0.83 Other new EU 0.88 1.07 0.91 1.00 0.59 0.76 0.84 Asian NIC 1.63 0.95 2.16 1.38 3.00 2.54 1.93 Other NIC 1.10 0.95 1.32 0.96 1.11 1.29 1.13
1/ These indicators are the expenditure weighted “counterparts” of the indicators of Table 1. 2/ Each sub-indicator contributes equally to the total indicator. 3/ Simple averages.
Page 29 of 32
Editorial Office, Dept of Economics, Warwick University, Coventry CV4 7AL, UK
Submitted Manuscript
123456789101112131415161718192021222324252627282930313233343536373839404142434445464748495051525354555657585960
For Peer Review
30
Table 4 – DEA results: one input, one output
Input oriented Output oriented Country VRS TE Rank VRS TE Rank
Brazil 0.381 22 0.562 22 Bulgaria 0.461 15 0.564 21 Chile 0.730 5 0.823 8 Cyprus 1.000 1 1.000 1 Czech Republic 0.439 16 0.735 15 Estonia 0.489 13 0.753 13 Greece 0.407 19 0.822 9 Hungary 0.355 23 0.792 10 Ireland 0.997 3 0.999 3 Korea 0.976 4 0.994 4 Latvia 0.486 14 0.742 14 Lithuania 0.535 10 0.720 18 Malta 0.555 9 0.868 6 Mauritius 0.721 6 0.914 5 Mexico 0.703 7 0.730 16 Poland 0.412 18 0.723 17 Portugal 0.385 21 0.782 11 Romania 0.528 11 0.621 20 Slovak Republic 0.406 20 0.777 12 Slovenia 0.526 12 0.843 7 South Africa 0.676 8 0.693 19 Thailand 1.000 1 1.000 1 Turkey 0.416 17 0.555 23 Average 0.591 0.783
VRS TE – variable returns to scale technical efficiency.
Page 30 of 32
Editorial Office, Dept of Economics, Warwick University, Coventry CV4 7AL, UK
Submitted Manuscript
123456789101112131415161718192021222324252627282930313233343536373839404142434445464748495051525354555657585960
For Peer Review
31
Table 5 – Censored normal Tobit results (dependent variable: output efficiency scores from Table 4)
1 2 3 4 5 Per-capita GDP 7.08E-06 ***
(2.18) 6.68E-06 **
(2.01) 6.75E-06 **
(2.04) 7.08E-06 **
(2.25) 1.33E-05 **
(2.12) Property rights 0.102 ***
(6.57) 0.095 ***
(5.07) 0.101 ***
(6.60) 0.127 ***
(4.54) 0.063 * (1.76)
Competence of civil service
0.069 *** (2.80)
0.062 ** (2.12)
0.075 *** (3.06)
0.109 *** (3.02)
Secondary school enrolment
0.003 *** (2.60)
Trade openness 2.46E-04 (0.46)
Public trust in politicians
-0.055 (-1.08)
Transparency in government
0.010 (0.42)
εσ̂ 0.081 0.086 0.083 0.081 0.083
Nº of observations 20 20 20 20 16
εσ̂ – Estimated standard deviation of ε. The z statistics are in brackets. *, **, *** - Significant at the 10, 5 and 1 per cent level respectively.
Table 6 – Corrected output efficiency scores (for Model 1) DEA
scores
(1)
GDP correction
(2)
Property rights
correction (3)
Civil servants
correction (4)
Corrected scores
(5)=(1)+(2)+ (3)+(4)
Corrected Rank
Brazil 0.562 -0.033 0.018 -0.017 0.530 18 Bulgaria 0.564 -0.036 -0.165 0.045 0.408 20 Chile 0.823 -0.020 0.079 -0.037 0.844 6 Czech Republic 0.735 0.019 -0.043 -0.024 0.687 12 Estonia 0.753 -0.013 -0.003 0.024 0.762 10 Greece 0.822 0.039 0.018 -0.058 0.820 8 Hungary 0.792 0.002 0.048 0.011 0.853 5 Ireland 0.999 0.145 0.130 0.066 1.000 1 Korea 0.994 0.022 -0.013 0.024 1.000 1 Latvia 0.742 -0.030 -0.053 0.031 0.690 11 Lithuania 0.720 -0.025 -0.063 0.052 0.684 15 Mauritius 0.914 -0.015 0.058 -0.003 0.954 3 Mexico 0.730 -0.025 -0.023 -0.003 0.679 16 Poland 0.723 -0.018 -0.023 0.004 0.686 13 Portugal 0.782 0.044 0.048 -0.031 0.843 7 Romania 0.621 -0.044 -0.033 -0.003 0.541 17 Slovak Republic 0.777 0.000 0.038 -0.044 0.771 9 Slovenia 0.843 0.036 -0.003 0.052 0.929 4 South Africa 0.693 -0.005 0.048 -0.051 0.685 14 Turkey 0.555 -0.043 -0.063 -0.037 0.411 19 Average 0.757 0.000 0.000 0.000 0.739
Note: the corrected scores do not always add up to the indicated sum since for the cases were the result was above one it was truncated to the unity.
Page 31 of 32
Editorial Office, Dept of Economics, Warwick University, Coventry CV4 7AL, UK
Submitted Manuscript
123456789101112131415161718192021222324252627282930313233343536373839404142434445464748495051525354555657585960
For Peer Review
32
Table 7 – Comparison of country scores and ranks across methods
DEA Analyis Public Sector
Efficiency (PSE) Two-step correction
Country Input oriented Output oriented Score Rank Score Rank Score Rank Score Rank Brazil 0.381 22 0.488 22 0.69 23 0.530 18 Bulgaria 0.461 14 0.483 23 0.77 22 0.408 20 Chile 0.73 4 0.615 17 1.38 5 0.844 6 Cyprus 0.489 11 0.867 3 1.08 8 - - Czech Republic 0.439 15 0.637 13 0.85 17 0.687 12 Estonia 0.489 12 0.632 14 0.91 12 0.762 10 Greece 0.369 23 0.713 8 0.96 9 0.820 8 Hungary 0.355 24 0.687 9 0.85 17 0.853 5 Ireland 0.576 8 0.813 4 1.37 6 1.000 1 Korea 0.749 3 0.743 6 1.65 3 1.000 1 Latvia 0.486 13 0.624 16 0.91 12 0.690 11 Lithuania 0.535 9 0.588 18 0.86 15 0.684 15 Malta 0.408 19 0.753 5 0.78 21 - - Mauritius 0.721 5 0.686 10 1.56 4 0.954 3 Mexico 0.703 6 0.551 19 1.31 7 0.679 16 Poland 0.412 18 0.627 15 0.83 19 0.686 13 Portugal 0.385 21 0.678 11 0.82 20 0.843 7 Romania 0.528 10 0.509 21 0.86 15 0.541 17 Singapore 1 1 1 1 2.39 1 - - Slovak Republic 0.406 20 0.674 12 0.92 11 0.771 9 Slovenia 0.431 16 0.731 7 0.88 14 0.929 4 South Africa 0.676 7 0.529 20 0.95 10 0.685 14 Thailand 1 1 1 1 1.83 2 - - Turkey 0.416 17 0.482 24 0.63 24 0.411 19 Correlation Score Rank Score Rank Score Rank (DEA input, PSE) 0.91 0.77 (DEA output, PSE) 0.71 0.56 (DEA output, two-step) 0.92 0.93 (PSE, two-step) 0.69 0.65
Page 32 of 32
Editorial Office, Dept of Economics, Warwick University, Coventry CV4 7AL, UK
Submitted Manuscript
123456789101112131415161718192021222324252627282930313233343536373839404142434445464748495051525354555657585960