Embed Size (px)
Citation preview
Public Sector Capacity Constraints –A Critical Review
Paper prepared for the Centre for Development and Enterprise
June 2006
1
Capacity constraints in the public sector – a critical review
1. Introduction
Since the White Paper on Reconstruction and Development was released in 1994,government has put socio economic development and poverty alleviation at the forefrontof its developmental agenda. These priorities were reinforced in the Constitution of SouthAfrica which places a clear responsibility on government to deliver on basic services asenshrined in the Bill of Rights1.
The efficiency and effectiveness of the public sector is key to the achievement of theseobjectives. As the pressure to extend service delivery to all South Africans increases,particularly within previously marginalized communities, and the government looks toimplement and expand an ambitious transformational agenda, the capacity of the publicservice has come under increasing scrutiny.
The pressures on and limitations of the public sector are recognised in the Acceleratedand Shared Growth Initiative (ASGISA) launched by the Deputy President in 2006:‘deficiencies in the state organization, capacity and leadership’ are identified as one ofthe six binding constraints to higher economic growth in South Africa. More recently,the high levels of vacancies within individual government departments and in specificskills categories have been highlighted within parliament and in the media.
This paper attempts to describe the scale and nature capacity constraints in government,focusing on the high level of vacancies across the public sector. It begins with ananalysis of the available data on staff vacancies and turnover and reveals some of thesymptoms of these problems. This is followed by a review of the possible causes ofcapacity constraints in government and a description of some of the main initiatives thathave been implemented to address these issues.
2. Scope of research and methodology
2.1 Scope
Given the limited time and resources available for this research paper, it is important todefine the scope and outline the limitations of this work from the outset. This paperproposes to provide background research that will foster debate around the followingresearch questions:
• What is the nature of the ‘capacity constraint’ within the South African publicsector?
• What are the possible causes of this capacity constraint?• What are the symptoms of a lack of capacity in government?• What initiatives have been tried or are in place to address capacity constraints?
2
• What more could government do to address capacity constraints in the publicsector?
This paper does not purport to provide comprehensive overview of the above mentionedresearch questions and the recommendations presented in this study are extremelypreliminary. Rather, it provides a reasonable ‘snapshot’ of the scale of this problem andhighlights some broad areas where further research, discussion and policy intervention isrequired.
2.2 Methodology
In order to address each of these research questions, the researcher collected data fromthe Department of Public Service and Administration (DPSA), interviewed variousofficials and completed a desktop review of existing research and commentary on theissues.
Material was also sourced from published reports, newspaper articles, parliamentarycommittee reports and conference papers. In addition, the researcher reviewed provisionsin the numerous pieces of legislations relating to the issue of capacity building.
Sources of information in government include:• The Department of Public Service and Administration • The Department of Labour• The Auditor General • The Public Service Commission
For the purposes of this paper, government is defined as national, provincial and localgovernment and thus excludes parastatals and public entities, for which there is limitedinformation on vacancies.
2.3 Limitations
The most important limitation of this paper is the lack of consolidated data for localgovernment. Furthermore, the reliability of information from the PERSAL2 system onvacancies at national and provincial government is questionable given the inherentproblems with the way the data is inputted on the system (see box). Given the dataproblems associated with PERSAL, it becomes difficult to identify which posts withinthe dataset are funded, unfunded or frozen (as a result of attempts to limit personnelexpenditure). This compounds the problem associated with trying to assess the true extentof capacity constraints amongst funded and unfilled positions in government, Finally,accessing information from some government departments proved problematic.
3. The nature of capacity constraints in national and provincial government
3

In his 2007 State of the Nation address, the President acknowledged the capacityconstraints that exist throughout government and pledged to keep the issue of capacitybuilding high on the agenda of the state in the period leading up to 20093. But whatexactly is meant by ‘capacity constraints’ and how does this problem manifest itself inthe South African public sector?
In 2006, the public sector employed about 1,65 million people made up of about 1,15million people in national and provincial government, 181 000 in local government and afurther 304 000 people in public entities and state owned enterprises4. The public sectoremploys about 3,5 per cent of population of the country5.
Officially, and for the purposes of this study, ‘the public service’ is defined to includenational and provincial government and excludes local government, public entities andparastatals. We therefore consider capacity constraints in national and provincialdepartments (the public service) and local government separately.
Capacity constraints can be broadly defined as the lack of adequate and suitable human,scientific, technological, organizational, institutional and resource capabilities to deliveron the constitutional mandate of government6. Adopting this definition, capacityconstraints might exist at three different dimensions: at the system level, at theinstitutional level and at the individual level.
At the system level, capacity constraints manifest themselves in the lack of legal andpolicy frameworks to govern structured and effective service delivery. For example, thereis no clear and comprehensive human resource policy to attract and retain high skilledlabour in key areas of the public service.
At an institutional level, capacity constraints refer to the lack of systems and structureswithin an organization to support capacity building strategies and implement policies. Forexample, within national and provincial government, poor performance managementsystems hinder skills development and career planning for personnel.
Finally, at an individual level, capacity constraints refer to the lack of human resourcesand/or a lack of skills amongst personnel to perform their jobs effectively. Theseconstraints could be evidenced in many different ways: an absence of qualified people (inthe sense of certification to an agreed minimum standard); an absence of people who arequalified and meet ancillary criteria (like racial designation for the purpose of‘transformation’ policies); the quality of certification possessed by job incumbents;deficiencies in attributes like experience and skills less likely to be certified, likeleadership.
These three dimensions of capacity constraints are interdependent and interlinked. Forexample, without the proper legal and policy framework in place, it becomes difficult toimplement procedures and processes that will support the development of skills,knowledge and understanding at an individual level within government departments.
4
Although, this paper focuses largely on capacity constraints at a human resource level,the impact of a lack of capacity at the institutional and system level often has far reachingimpacts on service delivery and public sector productivity.
3.1 Vacancies
In the last few years, human resource capacity constraints and skills shortages havereceived substantial media attention7. In 2006, a study commissioned by the DemocraticAlliance based on information found in annual reports found that there were 40 000vacancies at the national government level8. However, at a media briefing in November2006, the Department of Public Service and Administration contested that figure sayingthat it has identified 28 000 unfunded vacancies amongst all vacancies at nationaldepartments, bringing the total number of funded vacancies to around 26 0009.
In this section, we attempt to provide a more recent estimate of the number of vacanciesat the national and provincial levels of government using personnel data obtained fromthe Department of Public Service and Administration. However, the accuracy of ourcalculations are hampered by limitations inherent in data obtained from PERSAL and thisimpacts on our understanding of the true extent of capacity constraints in the publicsector (see Box 1 below).
5
Despite, the limitations of the data, an analysis of the existing information on vacanciesmight help to highlight some of the potential problem areas in the public sector at aninstitutional, systemic and individual level. In particular, we can use this data to identifythose departments and provinces which have the highest and lowest vacancy rates and thereasons for this; and can look deeper to identify the main skills categories in which thesevacancies exist.
3.1.1 Vacancies in National and Provincial Departments
Box1: Understanding the PERSAL problem
PERSAL is payroll system used to process salary payments for all public service employees.PERSAL is also able to keep each employees ‘personnel file’ electronically which includestheir biographical details, information on occupation and salary level, data on education,training and development, information on performance rewards received and finally the datesand reason for terminations. National and provincial departments are required to develop strategic plans based on theirconstitutional and legislative mandate. These annual strategic plans are furthermore informedby policy priorities of the government at the time. The strategic planning process starts with anoverview of the internal and external service delivery environment. Thereafter, the departmentidentifies the resources, including human capital, that it needs to deliver on its service deliveryobligations. The departmental organogram is then revised to reflect changes in theorganisational structure and sent to the Director General for approval. Once approved, the neworganogram, including new positions, is loaded onto the PERSAL by the human resourcemanagement department.
It is only once the strategic planning process has ended that the budgeting process commences.The department drafts a budget based on its resources required and submits this to the MediumTerm Expenditure Committee (MTEC). The MTEC committee reviews the budgets and makesrecommendations on budgetary allocations to the MinComBud. The MinComBud amendsand/or approves final allocations and submits to the Cabinet for adoption.
According to the DPSA, a problem arises when departments fail to update their PERSALrecords to reflect the approved and funded vacancies. Thus, the number of posts shown onPERSAL, particularly the vacancy statistics, usually include all funded and unfundedvacancies. In other words, the records on PERSAL reflect a rolling wishlist of what thedepartment has requested over time rather than what is has received in terms of its personnelbudget. In addition, when restructuring, departments may duplicate positions on PERSAL asthey transfer positions from structure to another, sometimes failing to delete old posts. Thesepractices have reduced the reliability of the vacancy rate, as shown in PERSAL, as an indicatorof capacity constraints in the public sector.
It is likely that within the senior management band, the vacancy rates reflected by PERSAL aremore accurate given that the creation of a senior management post would require approvalfrom the executive and hence would most likely be funded.
6
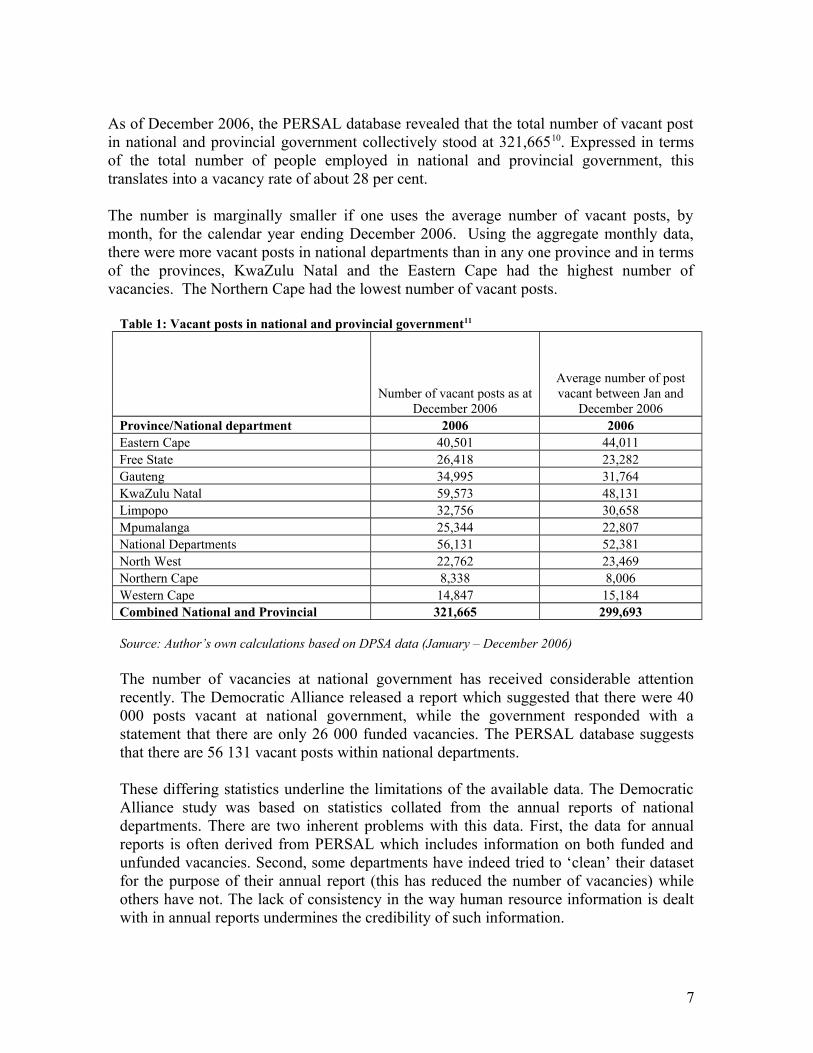
As of December 2006, the PERSAL database revealed that the total number of vacant postin national and provincial government collectively stood at 321,66510. Expressed in termsof the total number of people employed in national and provincial government, thistranslates into a vacancy rate of about 28 per cent.
The number is marginally smaller if one uses the average number of vacant posts, bymonth, for the calendar year ending December 2006. Using the aggregate monthly data,there were more vacant posts in national departments than in any one province and in termsof the provinces, KwaZulu Natal and the Eastern Cape had the highest number ofvacancies. The Northern Cape had the lowest number of vacant posts.
Table 1: Vacant posts in national and provincial government11
Number of vacant posts as atDecember 2006
Average number of postvacant between Jan and
December 2006Province/National department 2006 2006Eastern Cape 40,501 44,011Free State 26,418 23,282Gauteng 34,995 31,764KwaZulu Natal 59,573 48,131Limpopo 32,756 30,658Mpumalanga 25,344 22,807National Departments 56,131 52,381North West 22,762 23,469Northern Cape 8,338 8,006Western Cape 14,847 15,184Combined National and Provincial 321,665 299,693
Source: Author’s own calculations based on DPSA data (January – December 2006)
The number of vacancies at national government has received considerable attentionrecently. The Democratic Alliance released a report which suggested that there were 40000 posts vacant at national government, while the government responded with astatement that there are only 26 000 funded vacancies. The PERSAL database suggeststhat there are 56 131 vacant posts within national departments.
These differing statistics underline the limitations of the available data. The DemocraticAlliance study was based on statistics collated from the annual reports of nationaldepartments. There are two inherent problems with this data. First, the data for annualreports is often derived from PERSAL which includes information on both funded andunfunded vacancies. Second, some departments have indeed tried to ‘clean’ their datasetfor the purpose of their annual report (this has reduced the number of vacancies) whileothers have not. The lack of consistency in the way human resource information is dealtwith in annual reports undermines the credibility of such information.
7
Similarly, the use of funded vacancies as an indicator of capacity constraints is tenuousgiven the disjuncture between strategic planning and budgeting. The lack of institutionalcapacity to assess personnel requirements reliably means that personnel expenditure isoften cut by the Treasury without due consideration of the personnel requirements ofdepartments; it is also possible that many funded posts are defended for budgetingreasons but no needed or filled by the responsible department. This practice means thatthe use of funded vacancies as an indicator of capacity constraints may underestimate oroverestimate in the optimal size of the public sector.
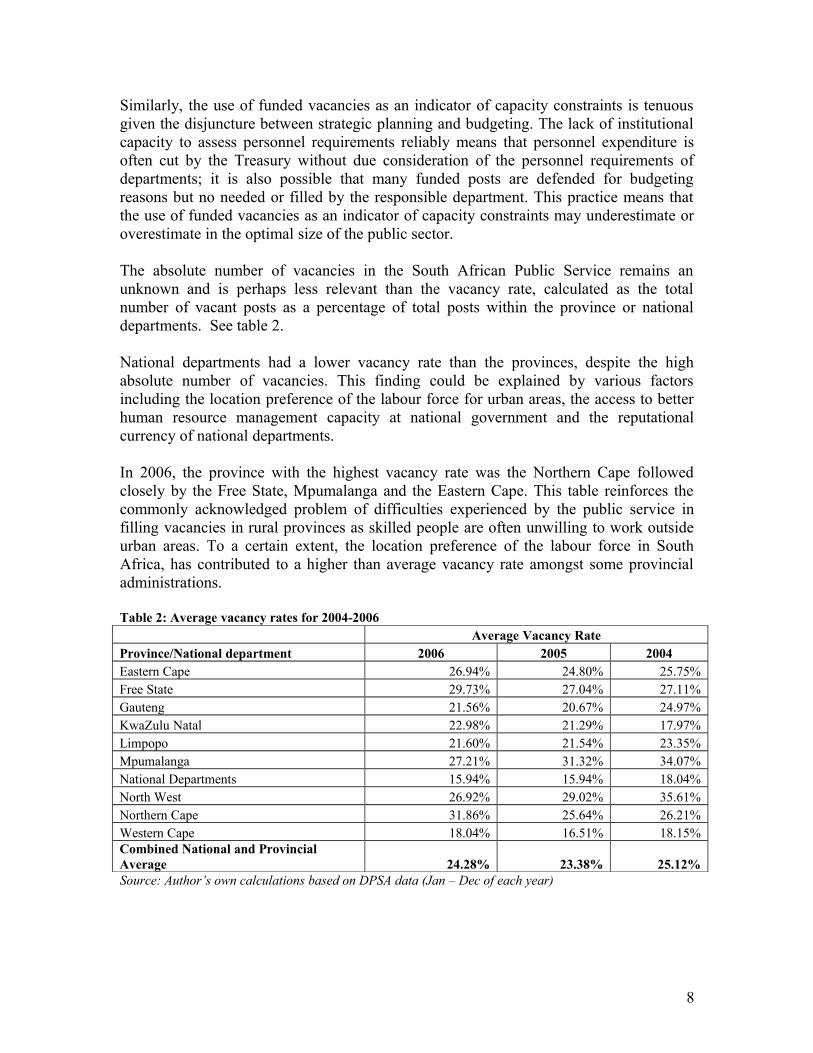
The absolute number of vacancies in the South African Public Service remains anunknown and is perhaps less relevant than the vacancy rate, calculated as the totalnumber of vacant posts as a percentage of total posts within the province or nationaldepartments. See table 2.
National departments had a lower vacancy rate than the provinces, despite the highabsolute number of vacancies. This finding could be explained by various factorsincluding the location preference of the labour force for urban areas, the access to betterhuman resource management capacity at national government and the reputationalcurrency of national departments.
In 2006, the province with the highest vacancy rate was the Northern Cape followedclosely by the Free State, Mpumalanga and the Eastern Cape. This table reinforces thecommonly acknowledged problem of difficulties experienced by the public service infilling vacancies in rural provinces as skilled people are often unwilling to work outsideurban areas. To a certain extent, the location preference of the labour force in SouthAfrica, has contributed to a higher than average vacancy rate amongst some provincialadministrations.
Table 2: Average vacancy rates for 2004-2006Average Vacancy Rate
Province/National department 2006 2005 2004Eastern Cape 26.94% 24.80% 25.75%Free State 29.73% 27.04% 27.11%Gauteng 21.56% 20.67% 24.97%KwaZulu Natal 22.98% 21.29% 17.97%Limpopo 21.60% 21.54% 23.35%Mpumalanga 27.21% 31.32% 34.07%National Departments 15.94% 15.94% 18.04%North West 26.92% 29.02% 35.61%Northern Cape 31.86% 25.64% 26.21%Western Cape 18.04% 16.51% 18.15%Combined National and Provincial Average 24.28% 23.38% 25.12%Source: Author’s own calculations based on DPSA data (Jan – Dec of each year)
8
On the whole, table 2 shows that except for the Western Cape, all other provinces have avacancy rate that exceeds 20 per cent. In simple terms, this means that one out of fivepositions in provincial governments are categorized as unfilled.
Perhaps of some encouragement is that fact that between 2004 and 2006, the combinedaverage national and provincial vacancy rate decreased. But whereas five provinces havemade some progress in reducing vacancies over this period, the other four have seen anapparent deterioration in capacity.
3.1.2 Vacancy by skill levels
Reviewing the vacancy rate by salary band helps to identify at which skill levels thehighest vacancy rates exist. The salary bands within the public sector are categorizedaccording to skills levels in the following manner:• Lower skilled (Levels 1 -2) • Skilled (Levels 3-5) • Highly Skilled Production (Levels 6-8) • Highly Skilled Supervision (Levels 9 -12)• Senior Management (Levels 13 -16)12
Table 3 shows that the highest vacancy rates occur within the senior management bandwith on average 35 per cent of all posts unfilled between levels 13 and 16. This is aworrying statistic as senior management personnel (level 13 upwards) provide strategicdirection and are directly accountable for service delivery in an organization.
The 59 per cent vacancy rate at deputy director general level (DDG, salary band 15) isparticularly disturbing. Six out of every ten deputy director general positions remainvacant. Most DDG positions would be funded and have been approved by the Ministerand National Treasury and the data therefore provides a fairly accurate description of thevacancy rate at this level of government..This data is confirmed by the DPSA which hasindicated that there is a high replacement rate at the DDG level13.
Regular turnover among senior management is likely to create instability within nationaland provincial government leading to poor oversight, performance management, policyimplementation and interruptions or discontinuous service delivery. For example, mostsenior position in the Department of Home Affairs are vacant and temporarily filled bypeople in an acting capacity. This situation has created a climate of ‘instability and lackof motivation’ within the department14. In addition, the cost of filling these positionsregularly is substantial.
Table 3 further indicates that the vacancy rate amongst lower skilled workers betweenBand 1 and 2 is on average 33 per cent. At first, this statistic seems almostcounterintuitive given high unemployment rates amongst lower skilled people in thecountry. However, it is important to recognize that this statistic could include asubstantial number of unfunded vacancies. Occupations falling within this band levelgenerally require the execution of routine tasks and include cleaners, messengers and
9
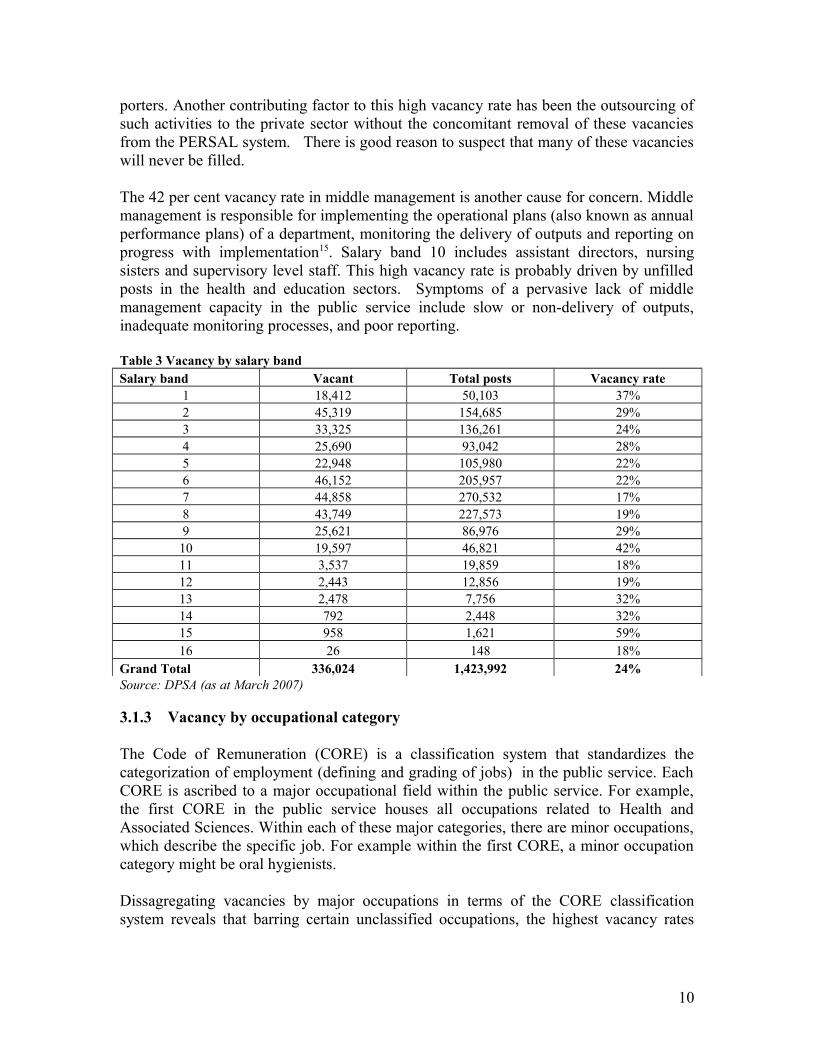
porters. Another contributing factor to this high vacancy rate has been the outsourcing ofsuch activities to the private sector without the concomitant removal of these vacanciesfrom the PERSAL system. There is good reason to suspect that many of these vacancieswill never be filled.
The 42 per cent vacancy rate in middle management is another cause for concern. Middlemanagement is responsible for implementing the operational plans (also known as annualperformance plans) of a department, monitoring the delivery of outputs and reporting onprogress with implementation15. Salary band 10 includes assistant directors, nursingsisters and supervisory level staff. This high vacancy rate is probably driven by unfilledposts in the health and education sectors. Symptoms of a pervasive lack of middlemanagement capacity in the public service include slow or non-delivery of outputs,inadequate monitoring processes, and poor reporting.
Table 3 Vacancy by salary bandSalary band Vacant Total posts Vacancy rate
1 18,412 50,103 37%2 45,319 154,685 29%3 33,325 136,261 24%4 25,690 93,042 28%5 22,948 105,980 22%6 46,152 205,957 22%7 44,858 270,532 17%8 43,749 227,573 19%9 25,621 86,976 29%10 19,597 46,821 42%11 3,537 19,859 18%12 2,443 12,856 19%13 2,478 7,756 32%14 792 2,448 32%15 958 1,621 59%16 26 148 18%
Grand Total 336,024 1,423,992 24%Source: DPSA (as at March 2007)
3.1.3 Vacancy by occupational category
The Code of Remuneration (CORE) is a classification system that standardizes thecategorization of employment (defining and grading of jobs) in the public service. EachCORE is ascribed to a major occupational field within the public service. For example,the first CORE in the public service houses all occupations related to Health andAssociated Sciences. Within each of these major categories, there are minor occupations,which describe the specific job. For example within the first CORE, a minor occupationcategory might be oral hygienists.
Dissagregating vacancies by major occupations in terms of the CORE classificationsystem reveals that barring certain unclassified occupations, the highest vacancy rates
10
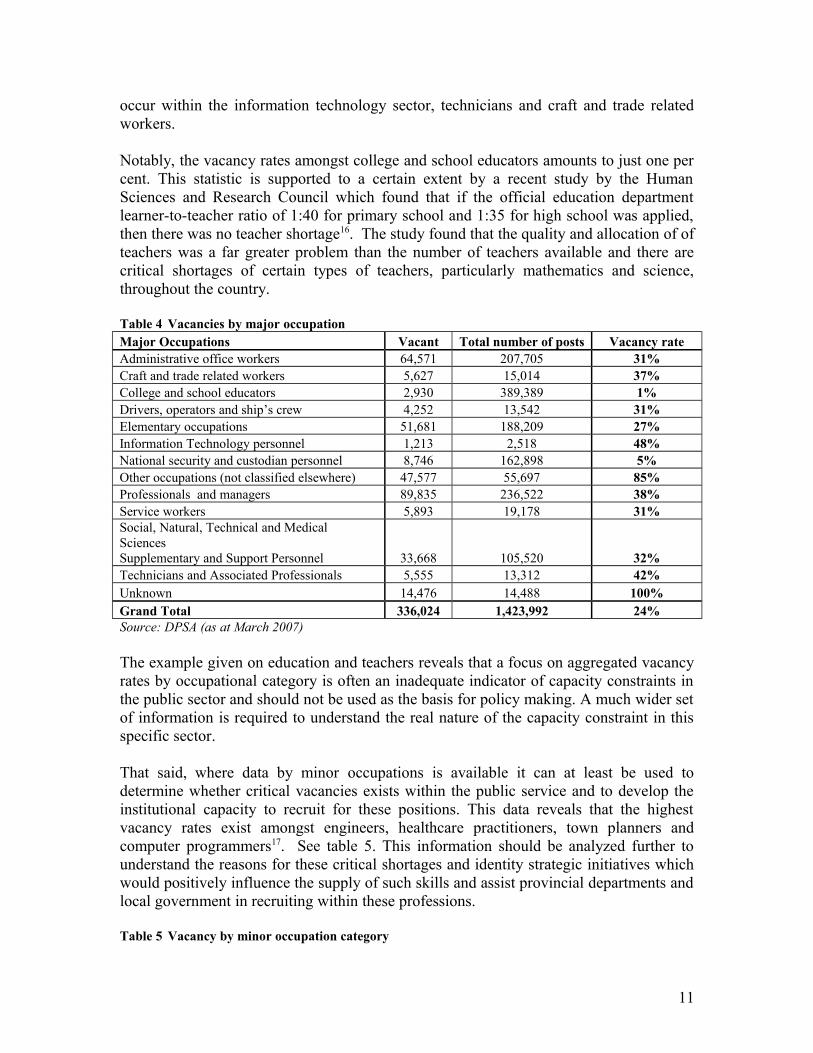
occur within the information technology sector, technicians and craft and trade relatedworkers.
Notably, the vacancy rates amongst college and school educators amounts to just one percent. This statistic is supported to a certain extent by a recent study by the HumanSciences and Research Council which found that if the official education departmentlearner-to-teacher ratio of 1:40 for primary school and 1:35 for high school was applied,then there was no teacher shortage16. The study found that the quality and allocation of ofteachers was a far greater problem than the number of teachers available and there arecritical shortages of certain types of teachers, particularly mathematics and science,throughout the country.
Table 4 Vacancies by major occupation Major Occupations Vacant Total number of posts Vacancy rateAdministrative office workers 64,571 207,705 31%Craft and trade related workers 5,627 15,014 37%College and school educators 2,930 389,389 1%Drivers, operators and ship’s crew 4,252 13,542 31%Elementary occupations 51,681 188,209 27%Information Technology personnel 1,213 2,518 48%National security and custodian personnel 8,746 162,898 5%Other occupations (not classified elsewhere) 47,577 55,697 85%Professionals and managers 89,835 236,522 38%Service workers 5,893 19,178 31%Social, Natural, Technical and Medical SciencesSupplementary and Support Personnel 33,668 105,520 32%Technicians and Associated Professionals 5,555 13,312 42%Unknown 14,476 14,488 100%Grand Total 336,024 1,423,992 24%Source: DPSA (as at March 2007)
The example given on education and teachers reveals that a focus on aggregated vacancyrates by occupational category is often an inadequate indicator of capacity constraints inthe public sector and should not be used as the basis for policy making. A much wider setof information is required to understand the real nature of the capacity constraint in thisspecific sector.
That said, where data by minor occupations is available it can at least be used todetermine whether critical vacancies exists within the public service and to develop theinstitutional capacity to recruit for these positions. This data reveals that the highestvacancy rates exist amongst engineers, healthcare practitioners, town planners andcomputer programmers17. See table 5. This information should be analyzed further tounderstand the reasons for these critical shortages and identity strategic initiatives whichwould positively influence the supply of such skills and assist provincial departments andlocal government in recruiting within these professions.
Table 5 Vacancy by minor occupation category
11
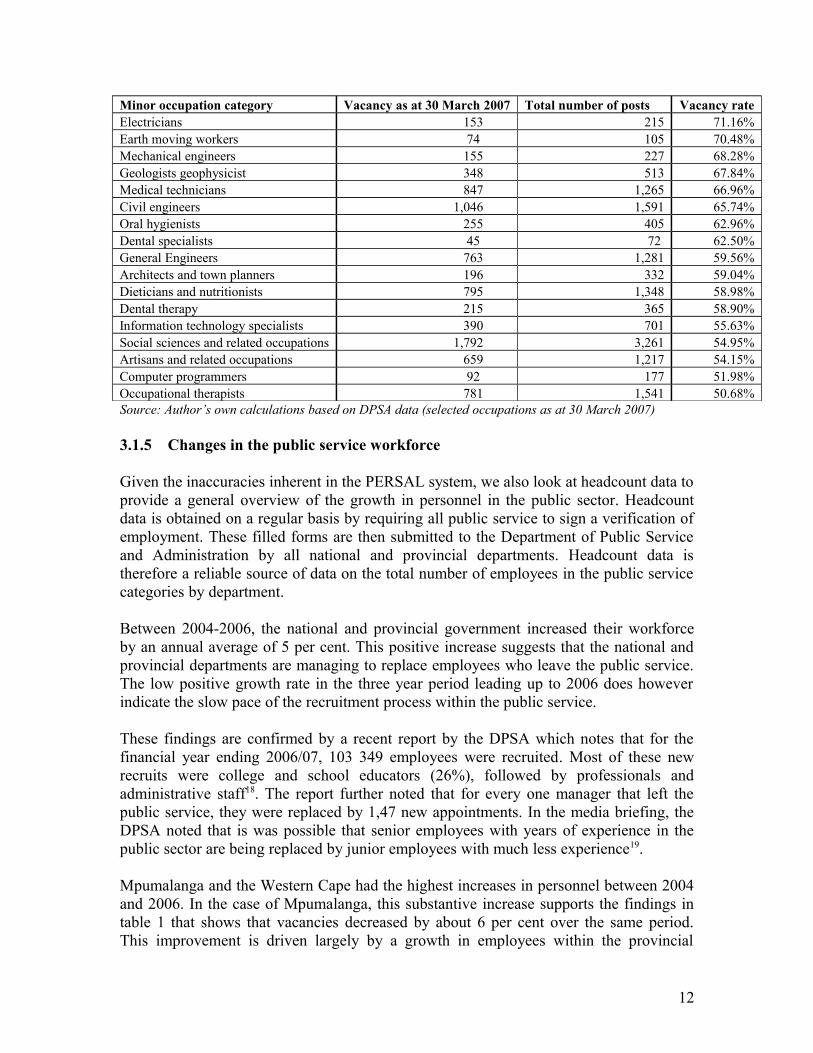
Minor occupation category Vacancy as at 30 March 2007 Total number of posts Vacancy rateElectricians 153 215 71.16%Earth moving workers 74 105 70.48%Mechanical engineers 155 227 68.28%Geologists geophysicist 348 513 67.84%Medical technicians 847 1,265 66.96%Civil engineers 1,046 1,591 65.74%Oral hygienists 255 405 62.96%Dental specialists 45 72 62.50%General Engineers 763 1,281 59.56%Architects and town planners 196 332 59.04%Dieticians and nutritionists 795 1,348 58.98%Dental therapy 215 365 58.90%Information technology specialists 390 701 55.63%Social sciences and related occupations 1,792 3,261 54.95%Artisans and related occupations 659 1,217 54.15%Computer programmers 92 177 51.98%Occupational therapists 781 1,541 50.68%Source: Author’s own calculations based on DPSA data (selected occupations as at 30 March 2007)
3.1.5 Changes in the public service workforce
Given the inaccuracies inherent in the PERSAL system, we also look at headcount data toprovide a general overview of the growth in personnel in the public sector. Headcountdata is obtained on a regular basis by requiring all public service to sign a verification ofemployment. These filled forms are then submitted to the Department of Public Serviceand Administration by all national and provincial departments. Headcount data istherefore a reliable source of data on the total number of employees in the public servicecategories by department.
Between 2004-2006, the national and provincial government increased their workforceby an annual average of 5 per cent. This positive increase suggests that the national andprovincial departments are managing to replace employees who leave the public service.The low positive growth rate in the three year period leading up to 2006 does howeverindicate the slow pace of the recruitment process within the public service.
These findings are confirmed by a recent report by the DPSA which notes that for thefinancial year ending 2006/07, 103 349 employees were recruited. Most of these newrecruits were college and school educators (26%), followed by professionals andadministrative staff18. The report further noted that for every one manager that left thepublic service, they were replaced by 1,47 new appointments. In the media briefing, theDPSA noted that is was possible that senior employees with years of experience in thepublic sector are being replaced by junior employees with much less experience19. Mpumalanga and the Western Cape had the highest increases in personnel between 2004and 2006. In the case of Mpumalanga, this substantive increase supports the findings intable 1 that shows that vacancies decreased by about 6 per cent over the same period.This improvement is driven largely by a growth in employees within the provincial
12
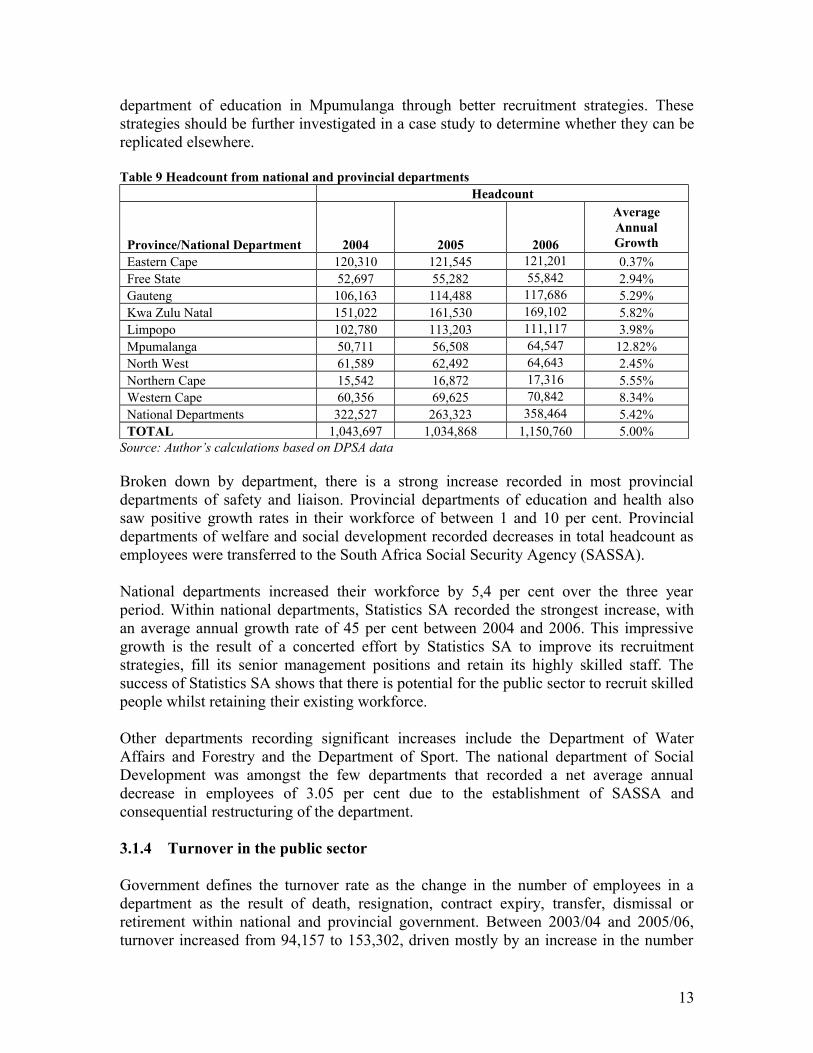
department of education in Mpumulanga through better recruitment strategies. Thesestrategies should be further investigated in a case study to determine whether they can bereplicated elsewhere.
Table 9 Headcount from national and provincial departmentsHeadcount
Province/National Department 2004 2005 2006
AverageAnnualGrowth
Eastern Cape 120,310 121,545 121,201 0.37%Free State 52,697 55,282 55,842 2.94%Gauteng 106,163 114,488 117,686 5.29%Kwa Zulu Natal 151,022 161,530 169,102 5.82%Limpopo 102,780 113,203 111,117 3.98%Mpumalanga 50,711 56,508 64,547 12.82%North West 61,589 62,492 64,643 2.45%Northern Cape 15,542 16,872 17,316 5.55%Western Cape 60,356 69,625 70,842 8.34%National Departments 322,527 263,323 358,464 5.42%TOTAL 1,043,697 1,034,868 1,150,760 5.00%
Source: Author’s calculations based on DPSA data
Broken down by department, there is a strong increase recorded in most provincialdepartments of safety and liaison. Provincial departments of education and health alsosaw positive growth rates in their workforce of between 1 and 10 per cent. Provincialdepartments of welfare and social development recorded decreases in total headcount asemployees were transferred to the South Africa Social Security Agency (SASSA).
National departments increased their workforce by 5,4 per cent over the three yearperiod. Within national departments, Statistics SA recorded the strongest increase, withan average annual growth rate of 45 per cent between 2004 and 2006. This impressivegrowth is the result of a concerted effort by Statistics SA to improve its recruitmentstrategies, fill its senior management positions and retain its highly skilled staff. Thesuccess of Statistics SA shows that there is potential for the public sector to recruit skilledpeople whilst retaining their existing workforce.
Other departments recording significant increases include the Department of WaterAffairs and Forestry and the Department of Sport. The national department of SocialDevelopment was amongst the few departments that recorded a net average annualdecrease in employees of 3.05 per cent due to the establishment of SASSA andconsequential restructuring of the department.
3.1.4 Turnover in the public sector
Government defines the turnover rate as the change in the number of employees in adepartment as the result of death, resignation, contract expiry, transfer, dismissal orretirement within national and provincial government. Between 2003/04 and 2005/06,turnover increased from 94,157 to 153,302, driven mostly by an increase in the number
13
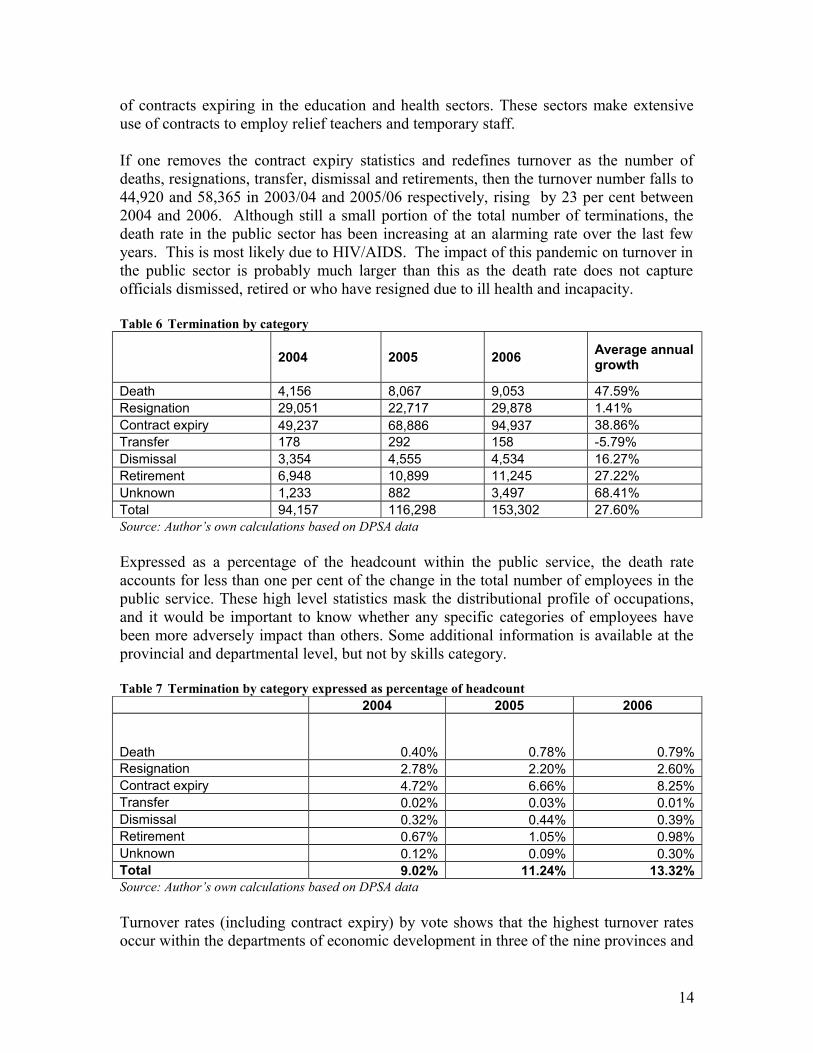
of contracts expiring in the education and health sectors. These sectors make extensiveuse of contracts to employ relief teachers and temporary staff.
If one removes the contract expiry statistics and redefines turnover as the number ofdeaths, resignations, transfer, dismissal and retirements, then the turnover number falls to44,920 and 58,365 in 2003/04 and 2005/06 respectively, rising by 23 per cent between2004 and 2006. Although still a small portion of the total number of terminations, thedeath rate in the public sector has been increasing at an alarming rate over the last fewyears. This is most likely due to HIV/AIDS. The impact of this pandemic on turnover inthe public sector is probably much larger than this as the death rate does not captureofficials dismissed, retired or who have resigned due to ill health and incapacity.
Table 6 Termination by category
2004 2005 2006Average annualgrowth
Death 4,156 8,067 9,053 47.59%Resignation 29,051 22,717 29,878 1.41%Contract expiry 49,237 68,886 94,937 38.86%Transfer 178 292 158 -5.79%Dismissal 3,354 4,555 4,534 16.27%Retirement 6,948 10,899 11,245 27.22%Unknown 1,233 882 3,497 68.41%Total 94,157 116,298 153,302 27.60%Source: Author’s own calculations based on DPSA data
Expressed as a percentage of the headcount within the public service, the death rateaccounts for less than one per cent of the change in the total number of employees in thepublic service. These high level statistics mask the distributional profile of occupations,and it would be important to know whether any specific categories of employees havebeen more adversely impact than others. Some additional information is available at theprovincial and departmental level, but not by skills category.
Table 7 Termination by category expressed as percentage of headcount2004 2005 2006
Death 0.40% 0.78% 0.79%Resignation 2.78% 2.20% 2.60%Contract expiry 4.72% 6.66% 8.25%Transfer 0.02% 0.03% 0.01%Dismissal 0.32% 0.44% 0.39%Retirement 0.67% 1.05% 0.98%Unknown 0.12% 0.09% 0.30%Total 9.02% 11.24% 13.32%Source: Author’s own calculations based on DPSA data
Turnover rates (including contract expiry) by vote shows that the highest turnover ratesoccur within the departments of economic development in three of the nine provinces and
14

are generally high in all provinces. The departments of economic development areresponsible for promoting local economic development and implementing industrialstrategy within provinces and the high turnover rates may impact on their capacity tocarry out this mandate. A possible reason for these high turnover rates is that the skills ofemployees in the departments of economic development are generally transferable and indemand within both the public and private sectors.
In five of the nine provinces, the department of health is included among the three highestdepartmental turnover rates. All five of these provinces have a strong rural componentand health professionals therefore qualify for a special rural allowance. The data confirmsthe need for special attention to healthcare workers in these provinces but also raises thequestion as to whether the additional allowance has had a positive impact to date. Clearly,more research on this subject is required.
Table 8 Turnover by VoteProvince/National Department
Votes with the highest turnover rates
Votes with the lowest turnover rates
Eastern Cape
Economic Affairs , Environment and Tourism (49 %)Health (8 %)Office of the Premier (8%)
Sports, Recreation, Art and Culture (2 %)Provincial Legislature (3%)Provincial Treasury (4%)
Free State
Sports, Arts, Culture, Sport and Tourism (31%)Premier's Office (15%)Education (10%)
Tourism, Environment and Economic Affairs (3%)Provincial Legislature (3%)Agriculture (5%)
Gauteng
Housing (27%)Gauteng Shared Services (14%)Agriculture, Conservation and Environment (14%)
Gauteng Provincial Treasury (0%)Gauteng Liquor Board (0%)Office of the Premier (3%)
KwaZulu Natal
Sports and Recreation (33%)Office of the Premier (17%)Health (11%)
Arts, Culture and Tourism (4%)Public Works (4%)
Limpopo
Sports, Arts and Culture (13 %)Local Government and Housing (13%)Health (9%)Transport (9%)
Safety, Security and Liaison (3 %)Legislature (3%)Education (4%)
Mpumalanga
Economic Development and Planning (10%)Office of the Premier (9%)Health and Social Services (8%)
Finance (2%)Social Services (4%)
15

North West
Provincial Legislature (13%)Economic Development and Tourism (12%)Education (9%)
Office of the Premier (4%)Social Development (4%)Transport, Roads and Community Safety (4%)
Northern Cape
Agriculture and Land Reform (13%)Housing and Local Government (13%)Health (12%)
Provincial Legislature (13%)Finance (13%)
Western Cape
Environmental Affairs and Development Planning (23%)Cultural Affairs and Sport (21%)Education (20%)Local Government and Housing (20%)
Provincial Legislature (10%)Transport and Public Works (12%)Agriculture (12%)Community Safety (12%)
National Departments
Justice and Constitutional Development (24%)Environmental Affairs and Tourism (20%)Education (20%)
Public Service Commission (5%)Trade and Industry (7%)Agriculture (7%)Foreign Affairs (7%)
Source: Author’s own calculations based on DPSA data (as at March 2007)
The table highlights the substantial variance in turnover rates between provincialdepartments suggesting that the capacity constraint problem cannot be seen as a generaland homogenous problem. More disaggregated information would be needed tounderstand the true nature of the skills shortage within provinces and nationaldepartments. 4. The nature of capacity constraints in local government
There is very little public information on the level of employment and vacancies in localgovernment and this makes analysis difficult, if not impossible. In researching this paper,we tried to access consolidated data from the Department of Provincial and LocalGovernment, but such information was not made available.
There have been numerous attempts to quantify the capacity constraints within particularsectors in local government, but these smaller studies can only provide insight into part ofthe greater problem.
For example, the engineering profession has recently conducted a survey throughout localgovernment and found that more than a third of all 231 local municipalities did not have asingle civil engineer, technologist or technician20. Practically, this means that in 77municipalities throughout South Africa, municipal roads and other basic infrastructureare probably not being constructed or maintained. The same study found that there weremore than 1 000 vacancies in local government for engineering practitioners.
16
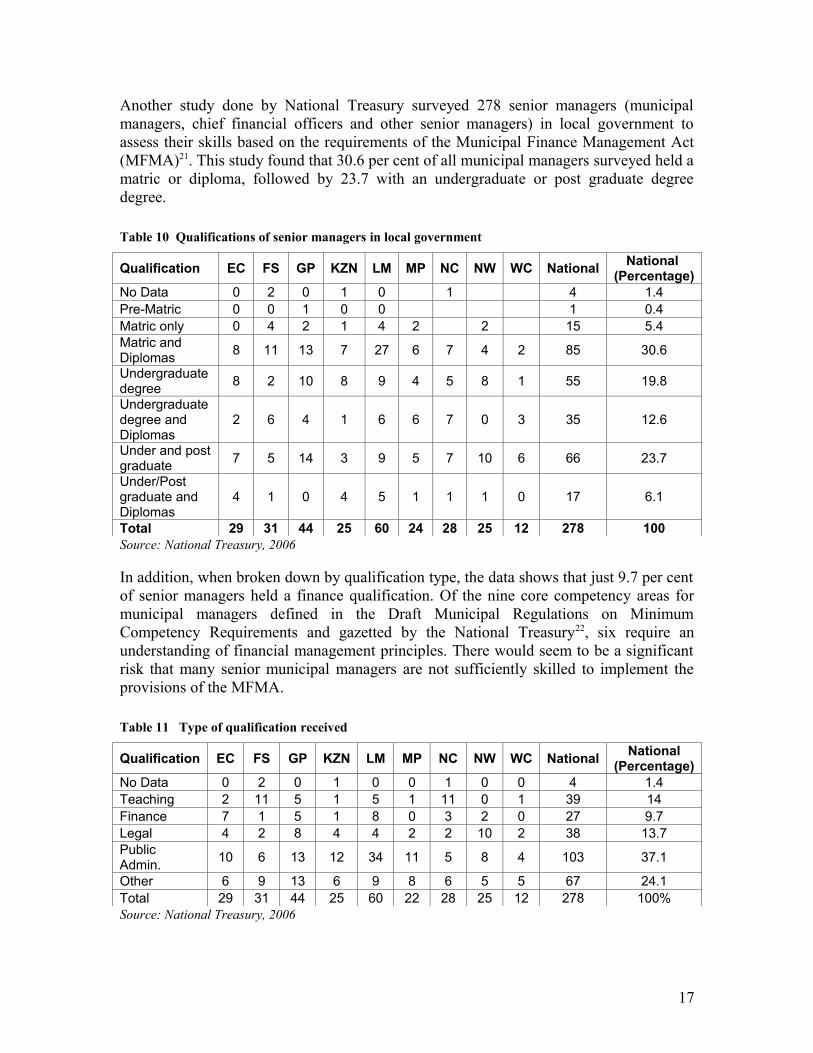
Another study done by National Treasury surveyed 278 senior managers (municipalmanagers, chief financial officers and other senior managers) in local government toassess their skills based on the requirements of the Municipal Finance Management Act(MFMA)21. This study found that 30.6 per cent of all municipal managers surveyed held amatric or diploma, followed by 23.7 with an undergraduate or post graduate degreedegree.
Table 10 Qualifications of senior managers in local government
Qualification EC FS GP KZN LM MP NC NW WC NationalNational
(Percentage)No Data 0 2 0 1 0 1 4 1.4Pre-Matric 0 0 1 0 0 1 0.4Matric only 0 4 2 1 4 2 2 15 5.4Matric and Diplomas
8 11 13 7 27 6 7 4 2 85 30.6
Undergraduatedegree
8 2 10 8 9 4 5 8 1 55 19.8
Undergraduatedegree and Diplomas
2 6 4 1 6 6 7 0 3 35 12.6
Under and postgraduate
7 5 14 3 9 5 7 10 6 66 23.7
Under/Post graduate and Diplomas
4 1 0 4 5 1 1 1 0 17 6.1
Total 29 31 44 25 60 24 28 25 12 278 100Source: National Treasury, 2006
In addition, when broken down by qualification type, the data shows that just 9.7 per centof senior managers held a finance qualification. Of the nine core competency areas formunicipal managers defined in the Draft Municipal Regulations on MinimumCompetency Requirements and gazetted by the National Treasury22, six require anunderstanding of financial management principles. There would seem to be a significantrisk that many senior municipal managers are not sufficiently skilled to implement theprovisions of the MFMA.
Table 11 Type of qualification received
Qualification EC FS GP KZN LM MP NC NW WC NationalNational
(Percentage)No Data 0 2 0 1 0 0 1 0 0 4 1.4Teaching 2 11 5 1 5 1 11 0 1 39 14Finance 7 1 5 1 8 0 3 2 0 27 9.7Legal 4 2 8 4 4 2 2 10 2 38 13.7Public Admin.
10 6 13 12 34 11 5 8 4 103 37.1
Other 6 9 13 6 9 8 6 5 5 67 24.1Total 29 31 44 25 60 22 28 25 12 278 100%Source: National Treasury, 2006
17
Arguably, the biggest problem within the public sector is the lack of detailed andcomprehensive information around skills shortages in local government. Moreover,without reliable information around these skills shortages, it becomes difficult to developtargeted medium to long term capacity building strategies for local government.
5. Other indicators of capacity constraints
The data presented in the previous sections shows some of the critical capacity shortagesby occupation, salary band and sphere of government. Here we highlight two of thestrategies used by departments to respond to staff shortages; these short-term solutionsare symptomatic of the depth and duration of capacity constraints within somegovernment departments.
5.2.1 Additional posts
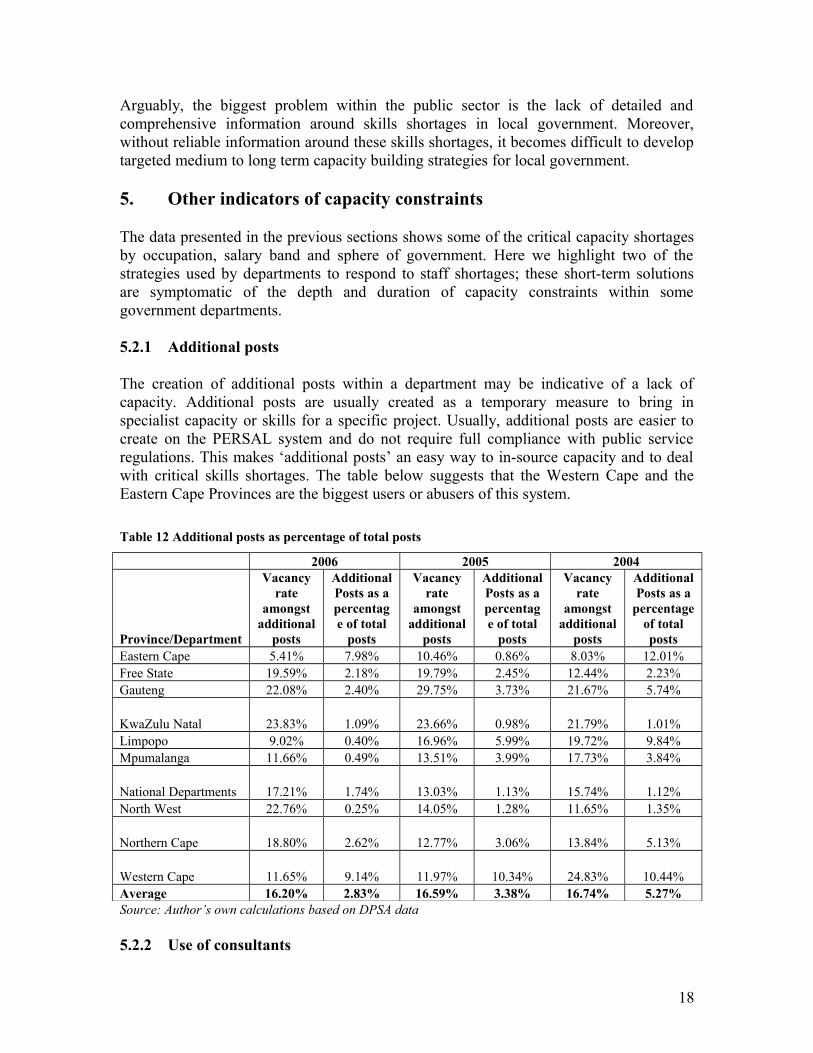
The creation of additional posts within a department may be indicative of a lack ofcapacity. Additional posts are usually created as a temporary measure to bring inspecialist capacity or skills for a specific project. Usually, additional posts are easier tocreate on the PERSAL system and do not require full compliance with public serviceregulations. This makes ‘additional posts’ an easy way to in-source capacity and to dealwith critical skills shortages. The table below suggests that the Western Cape and theEastern Cape Provinces are the biggest users or abusers of this system.
Table 12 Additional posts as percentage of total posts
2006 2005 2004
Province/Department
Vacancyrate
amongstadditional
posts
AdditionalPosts as apercentage of total
posts
Vacancyrate
amongstadditional
posts
AdditionalPosts as apercentage of total
posts
Vacancyrate
amongstadditional
posts
AdditionalPosts as a
percentageof totalposts
Eastern Cape 5.41% 7.98% 10.46% 0.86% 8.03% 12.01%Free State 19.59% 2.18% 19.79% 2.45% 12.44% 2.23%Gauteng 22.08% 2.40% 29.75% 3.73% 21.67% 5.74%
KwaZulu Natal 23.83% 1.09% 23.66% 0.98% 21.79% 1.01%Limpopo 9.02% 0.40% 16.96% 5.99% 19.72% 9.84%Mpumalanga 11.66% 0.49% 13.51% 3.99% 17.73% 3.84%
National Departments 17.21% 1.74% 13.03% 1.13% 15.74% 1.12%North West 22.76% 0.25% 14.05% 1.28% 11.65% 1.35%
Northern Cape 18.80% 2.62% 12.77% 3.06% 13.84% 5.13%
Western Cape 11.65% 9.14% 11.97% 10.34% 24.83% 10.44%Average 16.20% 2.83% 16.59% 3.38% 16.74% 5.27%Source: Author’s own calculations based on DPSA data
5.2.2 Use of consultants
18
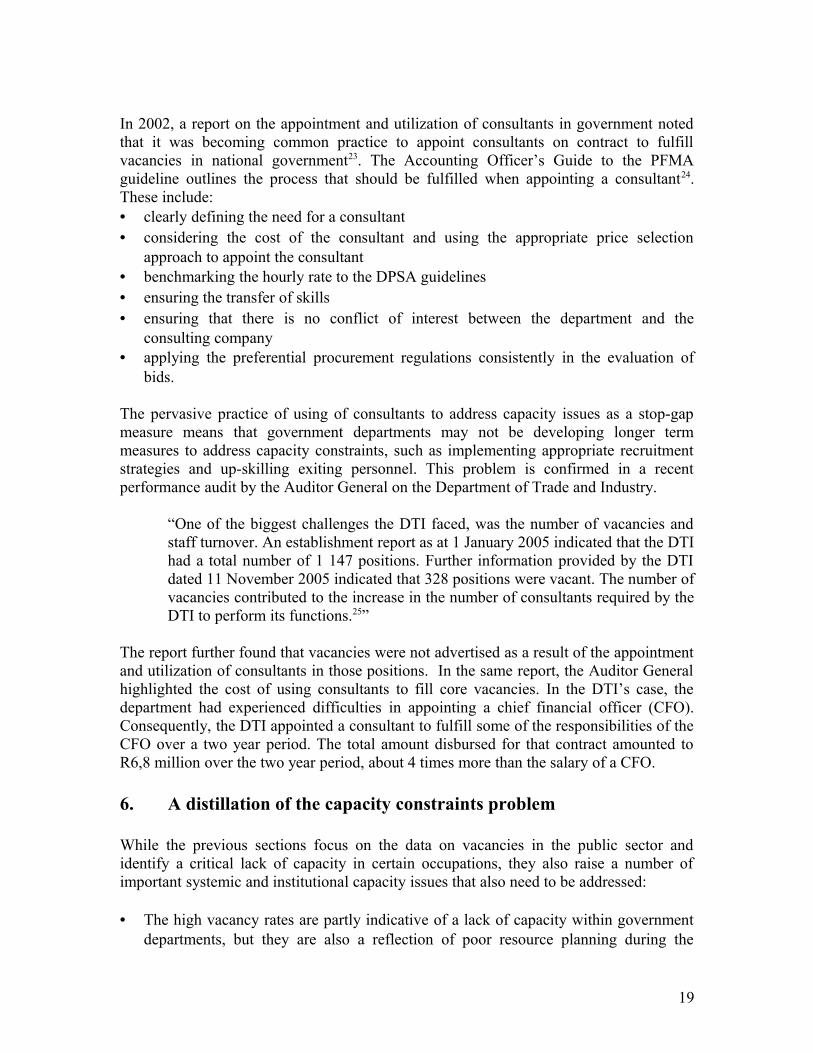
In 2002, a report on the appointment and utilization of consultants in government notedthat it was becoming common practice to appoint consultants on contract to fulfillvacancies in national government23. The Accounting Officer’s Guide to the PFMAguideline outlines the process that should be fulfilled when appointing a consultant24.These include:• clearly defining the need for a consultant• considering the cost of the consultant and using the appropriate price selection
approach to appoint the consultant• benchmarking the hourly rate to the DPSA guidelines• ensuring the transfer of skills • ensuring that there is no conflict of interest between the department and the
consulting company• applying the preferential procurement regulations consistently in the evaluation of
bids.
The pervasive practice of using of consultants to address capacity issues as a stop-gapmeasure means that government departments may not be developing longer termmeasures to address capacity constraints, such as implementing appropriate recruitmentstrategies and up-skilling exiting personnel. This problem is confirmed in a recentperformance audit by the Auditor General on the Department of Trade and Industry.
“One of the biggest challenges the DTI faced, was the number of vacancies andstaff turnover. An establishment report as at 1 January 2005 indicated that the DTIhad a total number of 1 147 positions. Further information provided by the DTIdated 11 November 2005 indicated that 328 positions were vacant. The number ofvacancies contributed to the increase in the number of consultants required by theDTI to perform its functions.25”
The report further found that vacancies were not advertised as a result of the appointmentand utilization of consultants in those positions. In the same report, the Auditor Generalhighlighted the cost of using consultants to fill core vacancies. In the DTI’s case, thedepartment had experienced difficulties in appointing a chief financial officer (CFO).Consequently, the DTI appointed a consultant to fulfill some of the responsibilities of theCFO over a two year period. The total amount disbursed for that contract amounted toR6,8 million over the two year period, about 4 times more than the salary of a CFO.
6. A distillation of the capacity constraints problem
While the previous sections focus on the data on vacancies in the public sector andidentify a critical lack of capacity in certain occupations, they also raise a number ofimportant systemic and institutional capacity issues that also need to be addressed:
• The high vacancy rates are partly indicative of a lack of capacity within governmentdepartments, but they are also a reflection of poor resource planning during the
19
strategic planning and budgeting process. It has become common cause fordepartments to motivate for new posts regardless of their actual needs or their abilityto find appropriate people to fill these posts. This in turn contributes towards inflatedand misaligned organizational structures.
• The unwillingness of departments to align their total posts on PERSAL to totalfunded posts indicates further complacency amongst departments (high vacancy ratesbeing perceived as a negotiating tool)26. Since the information on PERSAL is the onlymanagement information system available for human resource planning withinnational and provincial government, it is worrying that departments are notmaintaining and updating this source of information regularly to improve its accuracyand usefulness.
• The poor implementation of human resource management practices is cause forconcern. Human resource management has been relegated to the responsibility ofhuman resource practitioners within corporate services. Managers often do notparticipate in and support performance management, skills development andmentoring. A single-minded focus on adding and filling vacancies means thatresources are often misdirected towards recruitment (sometimes repeatedadvertisements and senior management time spent in interviews) rather than onimproving internal productivity.
• There is a serious lack of data on the extent of vacancies and skills shortages in localgovernment. Sector specific studies have been useful in identifying large gaps inspecific skills areas, such as engineering, and these partial studies suggest that a morecomprehensive assessment is probably required.
7. Possible causes of capacity constraints
The data and analysis presented in this paper is fraught with reliability problems. It doeshowever raise two main issues of concern for public sector planning and decisionmaking. Firstly, there are very large numbers of vacancies in particular sectors ofgovernment and this must impact adversely on service delivery; and secondly, existinghuman resource management and information systems are inadequate for describing andaddressing capacity constraints within Government. Clearly, more needs to be done tocorrectly specify the causes and find solutions to these problems.
In this section, we discuss three of the likely causes in a little more detail:• Skills mismatch amongst existing personnel• A lack of human resource management capacity • Ineffective supply chain pipeline
7.1 Lack of skills and/or skills mismatch amongst existing personnel
20

Although, much of focus on capacity constraints in the public sector is on quantitativeaspects, such as vacancies, turnover rates and changes in headcount, it is easy to overlookthe lack of skills or skills mismatches among existing personnel.
Currently, apart from the skills development plans of departments, there is no frameworkfor assessing the competency and capabilities of public sector employees. The PublicService Commission in its annual monitoring and evaluation study found that althoughmost departments have a skills development plan, the implementation of skillsdevelopment activities remains poor27.
It is beyond the scope of this study to assess the quality of the skills complement againstthe actual needs of the public sector, but there is ample anecdotal and sector-specificevidence to suggest than in many areas, skills levels are weak, inappropriate or poorlydistributed (see the discussion on mathematics teachers above). Focusing only on theavailable quantitative indicators of capacity is clearly not sufficient.
7.2 Lack of human resource management capacity
The expanded mandate and orientation of our public service in the post-apartheid periodmeans that managers and public sector employees require a different set of skills toperform their duties effectively. In reforming the public sector, human resourcemanagement capacity has become a critical enabling factor in building a unified andeffective public service28. Challenges exist throughout the human resource managementvalue chain from recruitment and selection through to training and development. The lackof good human resource management strategies and skills in the public sector contributeto and exacerbate the problem of capacity constraints and ultimately impact on servicedelivery.
7.2.1 Recruitment and Selection
An effective recruitment and selection policy is crucial in building a well resourced andskilled public sector. In a survey of 14 national and provincial departments, The PublicService Commission found that on average, these departments scored 0.82 out of 1 interms of having a recruitment policy that complied with Public Service Regulations 29.But the implementation of recruitment and selection activities were weak. In the samestudy, departments scored 0.21 out of 1 for their ability to fill vacant posts within anacceptable period of time30. Only 7 per cent of all departments surveyed in the 2007 stateof the public sector report managed to fill vacancies within the prescribed 90 dayperiod31.
This suggests that although departments have good recruitment and selection policies inplace, they are unable to implement these policies effectively. Moreover, the PublicService Commission noted that departments often failed to consider the skills andcompetences they require and detail such information clearly when advertising32.Thiscompromises the selection process and increases the probability that the post will not befilled, or worse, will be filled by an inappropriate candidate.
21
Another important factor impacting on recruitment is the conditions of employmentwithin the public service and local government. Undeniably, the conditions ofemployment influence the ability of the public sector to attract and retain employeeswhile at the same time influencing the productivity of existing personnel. As reviewingthe conditions of employment is beyond the scope of this paper, we suggest that furtherresearch be undertaken to further understand the link between conditions of employment,labour supply and productivity.
7.2.2 Performance Management
Poor performance management systems remain a cause for concern throughout the publicsector. Performance management systems are the link between individual performanceand organizational performance and productivity in the public sector and therefore crucialfor effective service delivery.
In 2006, the Public Service Commission found that performance agreements andperformance appraisal were not carried out in accordance with the Public ServiceRegulations33. In addition, the report also confirmed that management reports on humanresource management issues were irregular and inadequate.
7.2.3 Training and development
It is commonly acknowledged that there is little or no link between training andperformance in the public sector34. As a result, skills development within the publicservice and local government does not always address the actual skills needs ofemployees. Training is often ineffectual and does not result in the desired productivityimprovements. In addition, there is little or no monitoring of employee performance asconsequence of training. This often translates into the wasteful use of funds for trainingprogrammes that do not contribute to the technical competence of the employee or toimproved productivity.
This study has highlighted that the public sector is perhaps fixated with establishing newposts and filling vacancies. The building of capacity through training and developmenthas been lagging behind. The Public Service Commission found that skills developmenthad been done in an ad hoc manner35. Most departments had no systems and structures inplace to monitor the impact of training on service delivery.
The main impediment to training and development in the public service lies in the cultureof relegating training and development to an ad hoc function of human resourcemanagement rather than making it the central point of departure for career developmentand progression of public sector employees36. Training could certainly be used moreeffectively to reduce turnover and attract new entrants in the public sector.
Another factor that hinders skills development lies in the ability of departments to assessthe skills of their own employees on a regular basis and develop specific trainingprogrammes that would augment their technical competence37.
22
7.2.4 Retention and succession planning
Given the turnover and vacancy rates in the public sector, retention strategies andsuccession planning, are important tools that could be used to lessen the severity ofcapacity constraints. The Public Service Commission has identified the lack of retentionstrategies in the public sector and poor succession planning as a key area of concern,especially in areas of scarce skills38, and this study has highlighted the fact that vacancyrates among senior management are alarmingly high.
7.2.5 Ineffective education system
A recent study by Posel and Dias noted that increasing unemployment amongst graduatescould be partly explained by the education system39. The quality and appropriateness offormal training is not well matched to the needs of prospective employers. There is noreason to suspect that this problem is restricted to the private sector.
Government is aware of weaknesses in the education systems and through ASGISA, hasidentified four medium to long term strategic interventions:
• Building a strong foundation for public schooling (particularly increasing the passrates for mathematics and science)
• Focusing on priority skills within the tertiary sector (by improving access to fundingfor such qualifications and restructuring FET colleges)
• Initiating and improving work based training programmes and scarce skillsinitiatives
• Establishing a coordinating body to monitor the skills development in SouthAfrica40.
The successful implementation of these strategies should, over time, contribute to animprovement in the number and quality of skills available in the country. But given theneeds of the private sector are as great as those of government, it is not clear that thesegeneral interventions will have any immediate impact on capacity constraints in thepublic sector. More targeted interventions may be required to attract skilled graduates tothe public sector.
7.3 Legislative and regulatory framework
The legislative and regulatory framework can impact on every stage of the humanresource management value chain from recruitment to training and development.
In South Africa, affirmative action plays a crucial role in all recruitment and promotiondecisions and this can make the appointment process longer and more complex. Postscan remain vacant for longer than anticipated because of a lack of applicants fromtargeted groups. For example, recent reports suggest that it is difficult for ‘Indian doctors’
23
to be appointed in the Western Cape Department of Health, despite large numbers ofvacancies, because the Department’s affirmative action plan requires ‘African doctors’41.
Similarly, excessive or unclear immigration regulations raise barriers to entry forforeigners to gain employment in the public sector despite them being equipped withcritically-needed skills. For example, doctors from developed countries will “only beconsidered if no qualified South African has applied for the job, if the contract isrestricted to one employer and a maximum period of 3 years, if the doctors make awritten undertaking to return to their home country once the contract is completed, if theyshow professional competence (including fluency in English or one other officiallanguage of South Africa) and high ethical standards, and if they register with therelevant health council (Cleary and Thomas 2002).”42
8. Government Initiatives to Measure and Build Capacity
8.1 Joint Initiative on Priority Skills Acquisition (JIPSA)
Launched in March 2006 on the back of ASGISA, JIPSA is an initiative that aims tobring government, organized labour and business together to accelerate the developmentof priority skills within the country. In the short term, JIPSA aims to promote progress inthe acquisition of priority skills for the economy through a number of ‘quick winstrategies’. In the longer term, the initiative aims to remove bottlenecks in the educationsystem that prevent the development of priority skills.
JIPSA’s three point strategy is as follows:• To increase the rate of acquisition of the five high profile priority skills (engineering,
town planning, artisan skills, management and planning in health and education andmathematics and science competence).
• To obtain the commitment of key ‘project owners’ that will foster the development ofpriority skills.
• To focus research on specific labour market issues.
Given extreme shortages in many of these skills across both the private and publicsectors, it is not clear whether the public sector, in particular, will benefit from thesespecific initiatives.
8.2 Scarce skills list
In 2005, the Department of Labour (together with various other national departments)initiated a process to develop a list of scarce skills, which was released in September2006. The explanatory memorandum accompanying the scarce skills lists specifies thepurpose of the list as follows43:
• “For the Department of Labour and its statutory skills developmentintermediaries, the national list provides a set of indicators for skills developmentinterventions
24

• For the Department of Education and public education and training institutions,the national list provides a set of indicators for course development and careerguidance that should be provided to learners and communities, including schools,FET , Colleges, Universities, Universities of Technology and learners across theseinstitutions
• For the Department of Home Affairs, the national list provides a basis forestablishing the Work Permit Quota List and for evaluating employer-sponsoredapplications for work permits. The current draft work permit quota list reflects theadjustments made on the basis of this comparison.
• For the national government and current national initiatives such as JIPSA, thenational list begins to provide a platform for targeted interventions and thedevelopment of mechanisms to monitor and evaluate both the success and impactof measures aimed at redressing particular scarcities”.
The scarce skills list was compiled based on the five year sector skills plans of SETAs.These five year plans are in turn based on the skills development plans of organizationsfound within a specific sector. In the case of national and provincial government,PSETA’s five year sector skills plan would be a synthesis of the skills development plansof national and provincial departments.
It is encouraging that the government recognizes the need to raise the skills base in SouthAfrica through long-term interventions, such as education, and in the short-term throughimmigration. That said, policy makers need to be aware of the difficulties and dangers intrying to identify the specific skills needs of the economy in general and the public sectorin particular at any moment in time.
8.3 Skills assessment initiatives as part of the government programme of action.
The Governance and Administration Cluster is tasked with the responsibility of assessingthe capacity needs of Government. As part of their mandate, the cluster has initiated fourmajor subprogrammes aimed at assessing the skills shortage in the public sector. Theseinitiatives are summarised below.
8.3.1. The implementation of a public service skills database
The development of a public service skills database is intended to provide governmentwith a baseline account of the current skills levels and capabilities within all national andprovincial government. This database has been piloted at the Department of PublicService and Administration, Department of Justice and Department of Trade and Industryand will now be implemented through the rest of government.
The public service skills database will provide a snapshot of the current state of thepublic service in terms of skills and capabilities, at both an aggregate and departmentallevel. This should be of value in highlighting the main constraints and bottlenecks andrevealing the most problematic skills shortages and departments.
25
However, for this data to be useful for human resource planning and development, it mustbe accurate (note the shortcomings of the existing PERSAL-based data described above);it must be dynamic (show progress over time); and it must somehow be linked to thebudgeting, training, recruitment and retention plans of individual departments.
This paper argues that the process of building a skills database is a bottom-up process,not something that can be imposed by and managed at a central or higher levels ofgovernment. It is imperative that institutional capacity, systems and structure are builtwithin departments to perform skills assessments regularly and that this information isused by departments to develop a baseline against which their organizational skillsdevelopment strategies are monitored.
6.3.2 Development and utilization of an appropriate local government skills database
The concept of the local government database is similar to that of the public service skillsdatabase. Although, various stakeholders have conducted capacity assessments in localgovernment, these studies have been aimed at particular aspects of local government,such as financial managers and engineers. The local government database is the firstattempt to understand the skills capabilities of local government as a whole.
This paper supports the idea that an initial skills audit be undertaken by nationalgovernment to provide some idea on the extent of the skills shortages in the area of localgovernment. Without such an audit we have no idea as to the extent of the problem. Thisaudit should be designed to provide information on the disparities in skills betweenmunicipalities, the nature of skills shortages between urban and rural municipalities andan exposition of the minimum technical skills required for the delivery of basic services.
8.3.3 Implementation of competency based assessments
In March 2007, the DPSA made competency based assessments a mandatory part ofselection process for senior management positions. The competency based assessment arebased on a set of generic competencies (e.g. strategic leadership) that senior and middlemanagers in government need to demonstrate in order to fulfill their roles andresponsibilities effectively.
Competency based assessments can only be effective if used as a legitimate tool fordecision making during the selection process. However, the Public Service Commissionnotes that “reports of political office bearers sometimes deviating from therecommendations of the selection panel without fully recording reasons for suchdeviations, is of concern as it may be viewed as undue interference44.”
This is clearly of concern and is likely to be most prevalent at the senior managementlevel, possibly negating the role of competency tests. This should not be tolerated.Moreover, it is important to emphasise that objective competency tests be introduced atall levels of public service as soon as practically possible.
26
8.3.4 Implementation of the Public Service Human Resource Development (HRD) strategy
The implementation of a new public service human resource development strategy toaddress the shortcomings in the current human resource value chain is welcome. Whilststill at the draft stage, the HRD strategy recognizes that although substantial progress hasbeen made with developing human resource management policies and strategies,implementation at institutional remains poor. The draft HRD strategy focuses on bridgingthe gap between strategy and practical implementation by providing a step-by-stepimplementation guide for human resource practitioners.
Perhaps the biggest challenge in the implementation of the draft HRD strategy isresistance from within organizations. Currently, human resource management is seen as amechanistic line function within departments, usually housed within a wider corporateservices division, distinct from the technical and strategic management of the department.This needs to change. Human resource practitioners need to be equipped to provideongoing support to managers throughout the public sector and management needs tomake better use of human resource tools and functions.
9. Conclusion and recommendations
The analysis presented in this paper reveals large gaps in capacity across all departmentsand provinces; it also highlights substantial gaps in government systems and institutionsfor human resource planning and development. Government is certainly aware of theseshortcomings and a number of initiatives have been launched to deal with human,institutional and systems constraints across the public sector. What more, if anything,could be done?
9.1. Improving data accuracy and reliability
As ASGISA places increasing pressures on the public sector to deliver on basic servicesand infrastructure development, the need to understand the full extent of the capabilityand capacity of the public sector becomes more pressing. Currently, due to theunreliability and inaccuracy of data contained in PERSAL, the public sector has no realestimate of the extent of vacancies in national and provincial government. Although,funded vacancies can be easily determined from expenditure on personnel budgets, theextent to which both funded and unfunded vacancies are required for effective servicedelivery remains obscure.
The massive scale of the number of vacancies shown by existing data is evidence of toomuch fat in the current organizational structures of individual departments andgovernment as a whole. This makes it impossible to identify critical, real and bindingconstraints on delivery. Existing data and databases are therefore not particularly usefulfor human resource planning in the public sector.
27

Part of the solution lies in the need to improve the strategic and operational planningprocesses that produce credible resource estimates (including personnel estimates) withindepartments.
The rest of the solution lies in cleaning the data on PERSAL so that meaningfulinformation can be extracted and used in decision making and planning. Although, theDPSA has made attempts to get departments to load their funded organogram on thePERSAL system, there has been no real progress in removing inaccuracies in the system.
This paper recommends that the process of improving the accuracy of the PERSALdatabase be centralized and conducted by the DPSA. In addition, a human resourcemanagement module (as opposed to just a payroll system) should be rolled out to supportthe implementation of the HRD and to provide managers with critical and up-to-datemanagement information.
Urgent attention needs to be given to developing organizational and institutional capacityat local government to assess capacity constraints and report on skills shortages.
9.2 Undertaking regular skills audits within the public sector.
Once the public service and local government skills database is developed and a baselineestablished by department and municipalities, regular skills audits should be undertakento update the database and identify progress on skills development initiatives or resolveproblems in areas of skills shortages.
Information on the skills database should be made available to managers and humanresource practitioners to ensure that they are well equipped to effectively manage theiremployees.
9.3 Legislation and regulations that hinder the fulfillment of critical posts
Affirmative action is essential for redressing past inequalities and this is particularlyimportant within the public sector. Employment equity targets should inform allappointment and promotion decisions within government, but they need to beimplemented in cognizance of the general lack of skills across all sectors of the economyand the extremely high vacancy rates among certain skills categories in government.
9.4 The public sector as the employer of choice
Within middle and senior management levels, there is a clear need to attract and retainskilled and talented people. However, at these levels, the public sector often competeswith the private sector. Although, the obvious solution seems to be to pay employeesmore, there are other strategic interventions that the public service could undertake toposition itself as an employer of choice. Plans are already under way to develop dualstreams in the public sector – one for specialists/professionals and the other formanagements.
28
In the end, it is the public service’s ability to add value to the career path of its employeesand create opportunities for advancement that will determine whether it is able to attractand retain talent and skills.
9.5 Monitoring, evaluation and reporting
Inadequate monitoring, evaluation and reporting on human resource management issuesremains a problem within the public service. Though the Public Service Commission hasundertaken a number of useful monitoring and evaluation studies, these need to beinternalized and done at a departmental level. There is a clear need for seniormanagement to regularly monitor skills development, turnover and vacancies in order tomake operational decisions and reallocate resources where necessary.
Public reporting on statistics around vacancies, turnover and replacement factors shouldoccur regularly. The Department of Public Service and Administration should considermaking available a regular report detailing the state of human resource managementwithin the public sector. This would include both qualitative and quantitative informationon key human resource and capacity indicators as well as an indication of progress onsome of skills development initiatives listed above.
ENDNOTES
29
1 Constitution of the Republic of South Africa, Act 108 of 1998, Chapter 12 PERSAL is a human resource management system used by national and provincial government to manage salary
payments, leave etc. 3 The Presidency, State of the Nation 2007, http://www.gov.za 4 National Treasury, 2006. Local government budgets and review: 2001/02 -2007/08 p. 515 Author’s own calculations based on 2006 Mid year population estimates by Statistics South Africa6 A. Soko, Capacity Building for Infrastructure: Are we ready for 2010? Paper presented at the 25th Southern Africa
Transport Conference. 25th July 2006, p. 117 Mail and Guardian, Shortage Confusion and Mismatch Surplus. http://www.mg.co.za/articlePage.aspx?
articleid=246965&area=/insight/insight__economy__business/ 8 Democratic Alliance, Skills Vacancies – Developing Quality and Producing Quantity,
http://www.da.org.za/DA/Site/Eng/campaigns/DOCS/SkillsVacancies_Project_2006.doc 9 Parliamentary Monitoring Group. Governance and Administration Cluster: Implementation of Programme of Action,
15 November 2006. http://www.pmg.org.za/briefings.php?id=308 10 Vacant posts includes both funded and unfunded positions in the organogram. 11 Data received from the DPSA covered the period of a calendar year and thus cannot be directly compared to data in
annual reports which cover the period of a financial year. 12 Department of Public Service and Administration, 2007. Vacancies in the Public Sector. Briefing Note 13 H. Sterkfontein. Interview conducted for CDE, interview no 2. 14 Mail and Guardian, 2007, Can Home Affairs be saved? http://www.mg.co.za/articlePage.aspx?articleid=309665&area=/insight/insight__national/15 Department of Public Service and Administration, 1999. Introduction to the CORE and Occupational Classification
System. http://www.dpsa.gov.za/documents/core/intro.pdf 16 Business Day, No teacher shortage in SA, says Expert. http://www.businessday.co.za/Articles/TarkArticle.aspx?
ID=279734117 Based on data obtained from the Department of Public Service and Administration drawn down from Persal at minor
occupation level within the CORE framework. 18 Republic of South Africa, 2007, Governance and Administration Cluster Briefing.
http://www.info.gov.za/speeches/2007/07051412451001.htm. 19 Republic of South Africa, 2007, Governance and Administration Cluster Briefing.
http://www.info.gov.za/speeches/2007/07051412451001.htm. 20 Engineering news, 2006, Skills Shortages in Local Government http://www.engineeringnews.co.za/article.php?a_id=11023021 National Treasury, Minimum Competency Regulations, Presented to the Porftolio Committee on Provincial and LocalGovernment. 200622 National Treasury, Draft Municipal Regulation on Minimum Competency Requirements, pp 13. http://www.treasury.gov.za 23 Auditor General, 2002, Report on the appointment and utilization of consultants. http://www.agsa.co.za/Reports/Our
%20Reports/AG%20reports-National/Specialised%20audits/Performance/2002/Performance%20audit%20on
%20appointment%20and%20use%20of%20consultants%20at%20certain%20nat%20departs%20and%20prov
%20admins%20(RP%20122%202002).pdf p. 18. 24 National Treasury, 2004, The Accounting Officer’s Guide to the PFMA. P. 57. http://www.treasury.gov.za25 Auditor General, 2007, Performance audit of the Auditor General on consultants at the Department of Trade and
Industry p. 426 H. Sterkfontein, Interview conducted for CDE, interview no 1. 27 Public Service Commission, 2006, Second Consolidated Monitoring and Evaluation Report, p. 38
http://www.psc.gov.za28 Public Service Commission, State of the Public Service Report 2006. http://www.psc.gov.za
29 Public Service Commission, 2006, Second Consolidated Monitoring and Evaluation Report, p. 48. 30 Public Service Commission, 2006, Second Consolidated Monitoring and Evaluation Report, p. 48. 31 Public Service Commission, State of the Public Service Report 2007, p. 5532 Public Service Commission, State of the Public Service Report 2006, p. 53. 33 Public Service Commission, State of the Public Service Report 2006, p. 5334 Department of Public Service and Administration, 2006, Draft Human Resource Development Strategy, p. 535 Public Service Commission, 2006, Second Consolidated Monitoring and Evaluation Report, p. 48. 36 Public Service Commission, 2006, Second Consolidated Monitoring and Evaluation Report, p. 50.37 Service Commission, 2006, Second Consolidated Monitoring and Evaluation Report, p. 4838 Public Service Commission, State of the Public Service Report 2007, p. 6439 D. Posel and R. Dias, 2007, Unemployment, Education and Skills Constraints in Post Apartheid South Africa. DPRU
working paper 07/120. p.2740 The Presidency, 2006, Joint Initiative on Priority Skills Acquisition. p. 6 41 Sunday Times, 2007, Race Quotas Cripple Hospitals http://www.sundaytimes.co.za/News/Article.aspx?id=481544 42 M. Stern. 2005, The Determinants of Trade in Services and Implications for South Africa of Multilateral Service
Liberalisation” PhD Thesis. University of Sussex. 43 Department of Labour, 2006, Scarce Skills and JIPSA p. 64 – 65 44 Public Service Commission, State of the Public Service Report 2006, p. 53