Embed Size (px)
Citation preview

Capacity Constraints and New Hedge Fund Openings
Sugato Chakravarty Purdue University, IN 47906
Saikat Sovan Deb School of Accounting, Economics and Finance,
Deakin University, Australia [email protected]
Current Draft September 14 2015
1

Capacity Constraints and New Hedge Fund Openings
ABSTRACT
We provide empirical evidence that hedge funds’ capacity constraints may significantly
influence fund families’ decision to open new hedge funds. Hedge fund families face
diseconomies of scale because of non-scalability of investment strategies, as their existing
funds approach the critical size, fund families may prefer opening new hedge funds than
allowing existing funds to grow. We find, capacity constraints, both at fund family level and at
fund strategy level, significantly affect fund families’ new fund opening decisions. Fund
families’ propensity to open new funds increases with their capacity constraints; fund
families’s strategy choice for the new fund is affected by strategy level capacity constaints.
Our analysis also suggest that fund flows to the existing funds of families decrease following
new fund opening by the same family; opening of new fund is associated with subsequent
performance improvement of the existing funds within the families, and finally, funds that are
introduced by capacity constrainted families perform significantly worse than the funds
introduced by non capacity constrainted families.
2
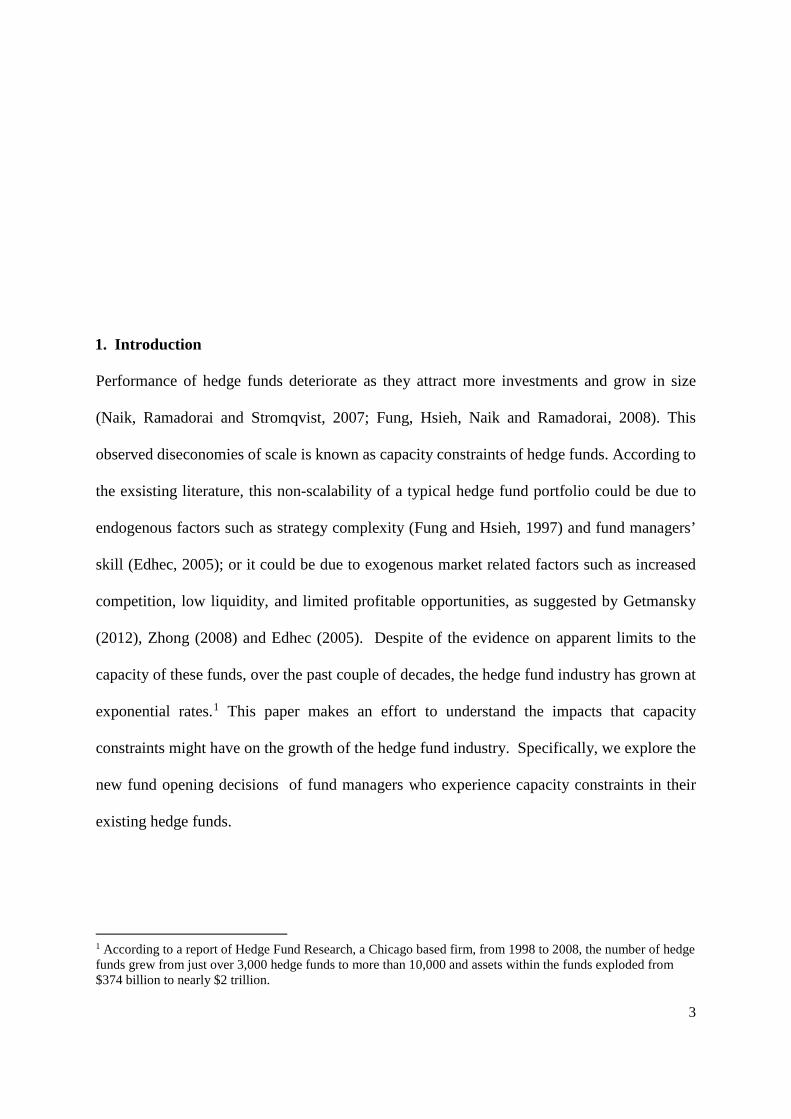
1. Introduction
Performance of hedge funds deteriorate as they attract more investments and grow in size
(Naik, Ramadorai and Stromqvist, 2007; Fung, Hsieh, Naik and Ramadorai, 2008). This
observed diseconomies of scale is known as capacity constraints of hedge funds. According to
the exsisting literature, this non-scalability of a typical hedge fund portfolio could be due to
endogenous factors such as strategy complexity (Fung and Hsieh, 1997) and fund managers’
skill (Edhec, 2005); or it could be due to exogenous market related factors such as increased
competition, low liquidity, and limited profitable opportunities, as suggested by Getmansky
(2012), Zhong (2008) and Edhec (2005). Despite of the evidence on apparent limits to the
capacity of these funds, over the past couple of decades, the hedge fund industry has grown at
exponential rates.1 This paper makes an effort to understand the impacts that capacity
constraints might have on the growth of the hedge fund industry. Specifically, we explore the
new fund opening decisions of fund managers who experience capacity constraints in their
existing hedge funds.
1 According to a report of Hedge Fund Research, a Chicago based firm, from 1998 to 2008, the number of hedge funds grew from just over 3,000 hedge funds to more than 10,000 and assets within the funds exploded from $374 billion to nearly $2 trillion.
3
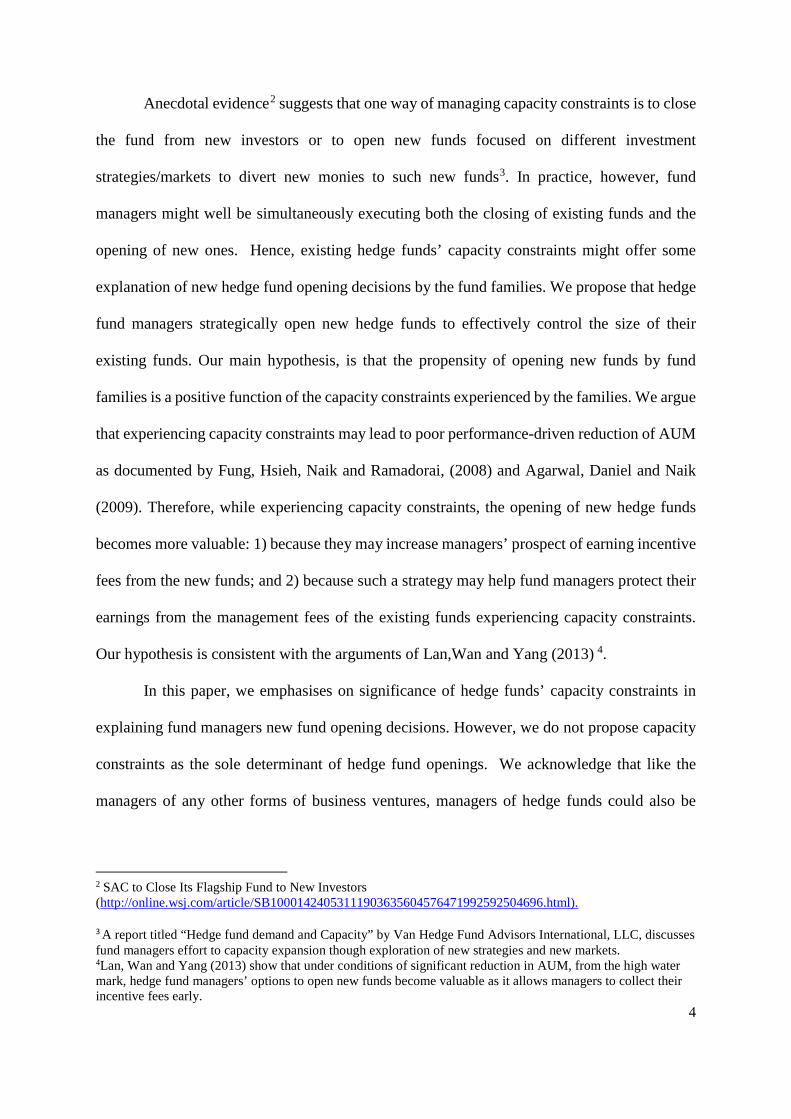
Anecdotal evidence2 suggests that one way of managing capacity constraints is to close
the fund from new investors or to open new funds focused on different investment
strategies/markets to divert new monies to such new funds3. In practice, however, fund
managers might well be simultaneously executing both the closing of existing funds and the
opening of new ones. Hence, existing hedge funds’ capacity constraints might offer some
explanation of new hedge fund opening decisions by the fund families. We propose that hedge
fund managers strategically open new hedge funds to effectively control the size of their
existing funds. Our main hypothesis, is that the propensity of opening new funds by fund
families is a positive function of the capacity constraints experienced by the families. We argue
that experiencing capacity constraints may lead to poor performance-driven reduction of AUM
as documented by Fung, Hsieh, Naik and Ramadorai, (2008) and Agarwal, Daniel and Naik
(2009). Therefore, while experiencing capacity constraints, the opening of new hedge funds
becomes more valuable: 1) because they may increase managers’ prospect of earning incentive
fees from the new funds; and 2) because such a strategy may help fund managers protect their
earnings from the management fees of the existing funds experiencing capacity constraints.
Our hypothesis is consistent with the arguments of Lan,Wan and Yang (2013) 4.
In this paper, we emphasises on significance of hedge funds’ capacity constraints in
explaining fund managers new fund opening decisions. However, we do not propose capacity
constraints as the sole determinant of hedge fund openings. We acknowledge that like the
managers of any other forms of business ventures, managers of hedge funds could also be
2 SAC to Close Its Flagship Fund to New Investors (http://online.wsj.com/article/SB10001424053111903635604576471992592504696.html). 3 A report titled “Hedge fund demand and Capacity” by Van Hedge Fund Advisors International, LLC, discusses fund managers effort to capacity expansion though exploration of new strategies and new markets. 4Lan, Wan and Yang (2013) show that under conditions of significant reduction in AUM, from the high water mark, hedge fund managers’ options to open new funds become valuable as it allows managers to collect their incentive fees early.
4
motivated to start a new product i.e. a new fund to gain more market share or to gather more
assets; success of the past could encourage them to open a new funds, or they could be just
responding to market conditions or investor demands while opening new funds. These
alternative motives of new fund openings are not mutually exclusive to our capacity
constraints based hypothesis.
We analyze influence of capacity constraints on fund families’ new fund opening
decisions in two stages. In the first stage we model fund families’ preferences of opening new
funds versus their choice to continue with the existing funds. In second stage, we investigate
fund families’ decision to specialize in existing investment strategies through the new funds
versus their decision to diversify into new investment strategies by opening new hedge funds.
We investigate the outcome of fund families’ strategic choice to open new funds by 1)
examining the impact of new fund introduction on fund flow and performance of the capacity
constrained pre-existing funds 2) comparing performance of the new funds introduced under
the influence of capacity constraints versus other newly opened hedge funds. Edhec (2005)
identified lack of managerial skills (manager’s constraint) and lack of investing opportunities
(market’s constraints) as two possible sources of capacity constraints. We investigate if
performance of new hedge funds differ between new funds introduced due to manager’s
constraints versus ones that were opened due to market’s constraints.
We analyze a sample of 9,050 funds, comprising of 3,195 funds of hedge funds (FOF)
and 5,855 hedge funds, within the Barclay Hedge Fund database, over the period of 1990 to
2007. We measure a hedge fund’s capacity based on excess fund size relative to the average
size of funds in a similar strategy category. Also, using bootstrap procedure, we create a second
capacity constraint measure based on the correlation between fund flow and fund performance.
5

We find that the probability of a new hedge fund opening is positively correlated to the
capacity constraints of the existing funds in the same fund family. Also, fund families’
decisions to diversify (i.e. investing in a strategy different from the strategy of their existing
hedge funds) while opening a new hedge fund is found to be positively associated with strategy
level capacity constraints of their existing funds and negatively associated to strategy level
capacity constraints of the newly introduced funds. An analysis of fund flows shows that to
some extent new funds may be successful in decreasing net fund flows to the existing funds of
the same family. There is also some evidence that post introduction of new hedge funds,
performance of the existing funds within the same family improves.
Finally, we find that funds that are opened by fund families experiencing capacity
constraints perform poorly compared to the new funds that are opened by families that did not
suffer from capacity issues at the time of their introduction. Empirical results shows funds that
are opened under the condition of family specific capacity constraints perform worst compared
to the other new funds
Understanding the influence of capacity constraints on fund managers’ decisions to
launch new funds offer new insight in understanding managerial decision making in the hedge
fund industry. Capacity constraints in hedge funds is often mentioned to discuss the possible
decline of abnormal return in a previously successful investment strategy (Naik, Ramadorai
and Stromqvist, 2007), on the other hand, successful new hedge funds heralds innovations in
the industry5; in this study we explore the connections between these two phases of hedge fund
life cycle. Our study contributes to the literature by identifying the influence of capacity
constraint on hedge fund managers’ new fund opening decisions. We show that the opening
6

of new funds could be a strategic decision made by a fund family to provide its managers relief
from capacity constraints, at least in the short run. On the other hand, we also show that such
new fund opening decisions might lead to poor fund performance in the future especially, if
the source of those constraints are fund family specific (e.g. poor managerial skills).
The paper is organized in five sections. The next section discusses the data, variables
and the methodology used in this study. Section three analyzes the empirical findings. We
provide robustness analyses in section four. Section five concludes the paper.
2. Data
2.1 Sample Description:
We employ the Barclay Hedge Fund Database (BHFD) for our study. BHFD is one of
the most comprehensive databases for hedge funds. It covers almost 12,000 hedge funds,
Commodity Trading Advisors (CTAs), Commodity Pool Operators (CPOs) and hedge fund
indices. BHFD provides monthly data on hedge fund returns net of all fees and charges, end of
the month assets under management, and other variables including fund domicile, year of
inception, parent investment company identifier, details of the fee structure and details of the
fund’s investment strategy.6 For the purpose of this study we use hedge fund data over a period
of 18 years (1990 to 2007). In our initial sample we have 5543 (3575) active (dead) hedge
funds from 3,380 investment companies. Figure 1 shows the distribution of fund domiciles in
the data set. The Cayman Islands are the most popular choice for fund domicile in our data
6 Existing hedge fund studies such as Aragon (2007), Fung, Hsieh, Naik, and Ramadorai (2008) find that the
performance estimates of hedge funds are sensitive to database choices and suggest a combined use of multiple
databases. However, given that performance measurement is not the main focus of our study, therefore our choice
of database should not have any specific implication for the findings of our study. Without implicating him in
any way, we thank William (Bill) Fung for his discussions with one of the authors on this point.
7

with 2,741 funds, followed by the USA with 2,635 hedge funds. Apart from the eight major
destinations for fund domicile described in Figure 1, our data also includes funds from 38 other
countries across the world. Since we use hedge fund data from various countries, and over a
seventeen (17) year period, we convert all reported fund AUMs in terms of 1990 US dollar
values.
------------------------------------------- Insert Figure 1 here ---------------------------------------
BHFD claims to report one main and two alternative investment strategies for each fund
although, for a majority of the funds, we found that the data on alternative strategies are not
available. Therefore we classify the funds based on their main investment strategy. To keep
our strategy classification consistent with the previous literature, following Ackermann et al.
(1999), Brown et al. (1999) and Brown et al. (2007), we classify all the funds in our sample in
10 different strategy classes. These strategy classes are: Emerging Market, Event Driven, Fund
of Hedge Funds, Global Macro, Long Only, Multi-strategy, Relative value, Sector Focused,
Short Bias, and Others. There are 60 funds for which strategy details are not available. We
exclude these funds form our final sample. Distribution of funds within different investment
strategies in our sample are provided in Figure 3.
------------------------------------------Insert Figure 3 here ----------------------------------------------
For 142 funds in our data, the date of inception is not available, as our study requires
identifying newly introduced funds and existing funds at any point of time, we exclude these
funds from the sample. We also remove 61 funds which do not have at least 12 continuous
observations of monthly returns. In the final count, we perform our analysis on a sample of
8855 funds. Table 1 provides a description of hedge fund families included in our sample. This
table shows that the number of hedge fund families has increased rapidly during the initial
years in our sample; from 1990 to 2002 the average year to year growth rate of number hedge
fund families is about 22%; however there is a steady decline in the number of fund families
8
in our sample from 2003 to 2007. In 2002, for example, our sample covers close to 1600 fund
families however the number came down to around 1200 by 2007. The average number of
funds per family is below 2 until 2001; it increases to 4.7 by 2007. This table also shows that
there is a high proportion (about 66% on average) of single fund families in our sample.
However this proportion has decreased over the time from about 78% in 1990 to about 34% in
2007. Consequently the concentration of families with single investment strategy is also quite
high (about 89% on average) in the sample. The average number of strategies per family
remains less than 1.5 through the entire sample period. Our sample also includes a greater
proportion of US fund families compared to non US fund families. Also note that the total
number of US fund families and non US fund families does not add up to the total number fund
families in the sample since several fund families (about 2% on an average across the sample
period) do not report the country of domicile for their hedge funds.
------------------------------------- Insert Table 1 here ---------------------------------------------------
A detailed description of new hedge fund openings across the entire sample period is
provided in Table 2. The table shows how many new funds were opened by fund families with
a single existing fund; how many were opened by fund families with multiple existing funds;
and how many were opened by fund families with multiple existing strategies. Overall, 4,634
new hedge funds were opened by the fund families covered in our sample. Out of these, about
35% hedge funds were opened by US hedge fund families.
----------------------------------Insert Table 2 here -------------------------------------------------------
Table 3 provides investment strategy wise break up of new fund introductions by fund
families over the sample period of this study. In our sample, Fund of Funds and Relative Value
were the two most popular strategies among the fund families for opening new hedge funds.
About 76% of all Event Driven funds, about 67% Sector Focused funds and 11 out of 12 Short
Bias hedge funds were opened by US fund families.
9
---------------------------------Insert Table 3 here -------------------------------------------------------
2.2. Capacity Constraints Variables
The degree of capacity constraint experienced by a fund is a latent variable. We propose
two proxies to measure and identify capacity constraints. To construct the first measure, we
assume that there is an optimal fund size beyond which fund performance turns negative with
incremental AUM growth. Hence a fund’s capacity constraint may be defined based on the
excess fund size, i.e. the difference between fund’s current size and its optimal size beyond
which it experiences negative economies of scale. We attempt to measure this excess fund size
variable. However, since a fund’s optimal size is not known, we use the average7 size of the
funds within a strategy class in a year as a proxy for the critical fund size for that year and
strategy class. To measure capacity constraints of a family, we use the largest excess fund size
within the family.8 The use largest excess size maybe justified as it captures the greatest
capacity related problem experienced by the family. Note that fund with largest excess size,
may not necessarily the largest fund with in the family, as a relatively small fund in Global
Macro strategy, could be much bigger in absolute size compared on a relatively large Sector
Focused fund. Hence a family might find it relatively more difficult to effectively invest new
money flow in a fund that is relatively large in comparison to the limited investable
7 As a robustness test we also use alternative excess size measures based on median size of
funds within a strategy.
8 As a robustness check we also use average excess size of the existing funds in the family as
an alternative proxy for fund families’ capacity constraint.
10

opportunities defined by the strategy. Therefore the excess fund size measure to capture fund
families’ capacity constraints is defined as:
]year tin jStrategy in Funds of AUM
year tin jStategy and iFamily in Funds of AUM[,
,_
Mean
MaxtitiAvgExSize
−
= (1)
In multivariate analysis the natural logarithm of excess size variables defined above is
used. Hence the excess size based fund families’ capacity constraint variable used in the
analyses is:
0 ,_ if ,_ln
0 ,_ if ,_ln,1
⟨
−=
⟩
=
tiAvgExSizetiAvgExSize
tiAvgExSizetiAvgExSizetiCC
(2)
We also identify strategy level capacity constraints within our sample. An investment
strategy is identified as capacity constrained when majority of the managers face capacity
constraints within that strategy. This strategy level capacity constraints are similar to what
Edhec (2005) identified as market’s capacity constraints. We measure strategy level capacity
constraint ( tSCC1 ) based on proportions of funds within a strategy that have negative CC1 for
that year.
Hedge funds’ capacity constraints refer to diseconomies of scale in funds investment
strategy therefore time series of correlations between fund size and performance may help us
identify funds that are experiencing capacity constraints. Our second measure of capacity
constraints is based on this idea. To operationalize this idea, we need to estimate yearly
correlations between funds’ sizes and their performances as we would like to create an annual
measure of capacity constraints. However, with the available monthly data of fund returns and
assets under management (most of the assets under management of the hedge funds in only
updated quarterly), it is difficult to reliably estimate size and significance of these annual
correlations. Therefore we employed a bootstrap procedure. We first converted the fund 11

returns and AUM to quarterly frequency for consistency and then estimated the correlations
between fund size and fund performance through the regression coefficient β in the Equation
3 given below. Due to the small sample issue mentioned earlier, we decided to perform
bootstrapped regressions in order to construct a reliable and reasonable confidence interval of
the estimated coefficients. Finally based on the sign and statistical significance of the estimated
β coefficients we identified the capacity constraints of the funds. Specifically, in order to
implement the bootstrap in each strategy, every year we grouped funds by their size quartiles.
The bootstrap samples are created with 10,000 replications. Finally using the bootstrapped
samples we estimate following the linear regression model (Equation 3) 10,000 times for each
fund size group within a year and strategy to construct the confidence intervals of the estimated
the regression coefficient β .
ttiti retMktsizefundret _ _ 1,, γβα ++= − (3)
Above mentioned regression model is used to estimate time series correlation between fund
size and performance. The dependent variable tiret , refers to the return of the hedge fund i for
period t, 1,_ −tisizefund is the past periods fund size (i.e. natural log of assets under
management) and tiretMkt ,_ is the return of hedge fund index for the period t. A negative and
significant β coefficient in Equation 3 would suggest negative return to scale or capacity
constraints experienced by the funds. In Figure 4, the estimated 5th and 95th percentile of the
β̂ s for each strategy classes are scatter plotted on y and x axes of the graphs respectively. The
observations in bottom left quadrant of the graphs shows the negative and significant β̂ s at
10% level of significance. An indicator variable (CC2) is created to identify funds’ capacity
constraints in a year based on the sign and significance of the estimated β coefficients:
12

Otherwise
icantlly SignifStatisticaCC ti
0 & 0 ˆ if 12 ,
=
⟨= β (4)
As indicated earlier, a fund family is identified as one experiencing capacity constraints if the
fund with largest excess size in that family is experiencing capacity constraints9.
A bootstrap procedure similar to one described earlier is followed to identify strategy
level capacity constraints. For strategy level proxy of capacity constraints, the yearly bootstrap
samples are drawn from all the funds within an investment strategy. Using these bootstrap
samples, a regression model similar to Equation (3) is estimated 10,000 times for each strategy
every year to identify the confidence interval of the estimated coefficients. A negative and
significant coefficient of the fund size variable in these strategy level regressions indicate
average diseconomies of scale experienced by the funds in the investment strategies. Following
a rule similar to Equation (4), we define an indicator variable tSCC2 .
2.3. Other Variables
Nanda, Wang and Zheng (2004) argue that there is a significant spillover effect from
better performing funds to the other funds of the fund family in terms of attracting more fund
flows. Gaspar et al. (2006) provides evidence of cross subsidization among same family funds.
Therefore size, fund flows and the performance of existing funds might significantly influence
the new fund introduction decision of the fund families. Khorana and Servaes (1999) and Evans
(2010) use family and strategy level size, fund flow and performance variables in explaining
new introduction of new funds. Goetzmann et al. (2003) emphasize the importance of fee
structures in explaining hedge fund performance and risk taking behaviour. According to Fung
and Hsieh (1999), hedge fund strategies along with their use of leverage are factors that
9 We carried out sensitivity analyses with alternative family capacity constraints definitions such as at least 1 fund in the family experiencing capacity constraints, average value of CC2 in a family greater than 0.5 etc. and found qualitatively similar results.
13

determine investors’ choice of hedge funds. Lan et. al. (2013) argued that the option to open a
new fund encourages fund managers to use greater leverage in their investment strategy.
Hence, following the existing literature, in our analysis, we use several control variables,
related to hedge funds, fund families, fund strategies and the market.
Khorana and Servaes (1999) suggest several motivations for introducing new managed
funds such as, economies of scale, fee earnings, competition, market demand etc. Though we
are primarily interested in exploring the influence of capacity constraints on new hedge fund
openings, we also control for following traditional motivations of new fund startups in our
analyses:
1) Capitalizing on past performance - As investors chase return, fund families may find
it easier to attract new investors when their existing funds are performing well, hence they
might introduce new funds following good the performance of their existing funds. Therefore
we control for previous year’s family performance (Family_Exreti,t-1) in our analysis.
2) Economies of Scale / Creating Empire – it could be argued that large fund families
enjoy certain level of economies of scale. They might benefit from lower per unit cost of doing
research and fund administration. Large fund families also enjoy greater investor support while
expanding or building their empire10. Hence family size could influence fund families new
fund opening decisions. Therefore we control for fund family size in our analyses; however,
disentangling family size variable from our size based-capacity constraint proxy (CC1) is
important, as larger fund families tend to have larger size funds, hence there is a high
correlation between total assets under management of the fund families and capacity constraint
proxy CC1 defined earlier. Hence, we create, a fund family size variable Rsd_Familysizei,t-1
10 http://www.bloomberg.com/bw/articles/2014-01-09/hedge-fund-bluecrest-borrows-to-bet-big-on-stocks 14
which is orthogonal to the excess fund size variable discussed in Equation 1. The residual fund
family size variable is define as follows:
titi eSFamilysizeRsd ,, ln_ ×= (5)
Where S takes the value -1 if tie , is negative otherwise S is +1; tie , is the residuals of the
following regression equation.
tietiAvgExsizebatiAUMFundfamily ,,_ ,_ ++= (6)
The Rsd_Familysizei,t-1 variable is used in our analysis to test importance family size in fund
families new hedge fund opening decisions.
3) Responding to market demand – Fund families may open new funds in response to
investor demands. In the context of mutual fund, Khorana and Servaes (1999) found that fund
families prefer opening new funds in larger size investment objectives. They also found some
evidence that families of bond funds prefer opening new funds in objectives that attracted larger
inflow in the past year. In the context of hedge funds, however, one could also argue, that if
capacity constraint is a concern, then fund managers might prefer taking the strategy less
explored and open new fund in a strategy that is not too crowded or too big in size. We include
variables related to the strategy size (i.e. natural logarithm of previous year’s total asset under
management within strategy or NStrategy_Sizet-1), previous year’s strategy excess return (i.e.
last year’s average return of all the funds in a strategy minus median return of all strategies or
NStrategy_Exrett-1), previous years fund flow to the strategy (i.e. last year’s total fund flow to
the strategy or NStrategy_Fundflowt-1 ) in our analyses.
4) Fee earnings - As Goetzmann et al. (2003) and Lan et. al. (2013) emphasize
importance of the hedge fund fee structure on fund managers risk taking behavior and
investment strategies. Motivation of earning higher fee income could also influence fund
managers to open new funds. In line with our argument on influence of capacity constraints on
15
new fund openings, it can be argued that fund managers who charge higher fee, especially
higher incentive fees, might be more sensitive to poor performance of their existing funds,
therefore high fee structure potentially could amplify the impact of capacity constraints on new
fund opening decisions. Hence we identify families that charge higher than median
management and incentive fees (i.e. High _Mgmt_Feei , High_Incentive_Feei, respectively), to
control for the influence of higher fees income on fund managers’ propensity to open new
funds.
Other variables used in multivariate analyses of new fund opening decisions are:
variables related to the investment strategy of the fund with largest excess size in the family
such as Strategy_Sizet-1(i.e. natural logarithm of previous year’s total asset under management
within the strategy of the fund with largest excess size in the family), Strategy_Exrett-1 (last
year’s average return of all the funds in the strategy of the fund with largest excess size in the
family minus median return of all strategies), Strategy_Fundflowt-1 (last year’s total fund flow
to the strategy of the fund with largest excess size in the family) and an indicator variable for
identifying if the funds with largest excess size uses leverage in its portfolio. MSCI hedge fund
index returns is used as a proxy for market returns. (Market_Rett-1). A detailed description of
the variables used is provided in Table A1 in Appendix 1.
Summary statistics of the variables used in this study are reported in Table 4. In our
sample, over the period 1990 through 2007, the median fund family size is about $28.22
million, although the largest fund family has about $32.35 billion invested in their portfolios.
This suggest existence of few very large fund families in our sample11. The annual average
excess return of all the fund families is about 2.02%. While this is small, it is not unexpected,
11 In robustness analysis, we excludes top 5% of the largest funds of our sample to check robustness of our main findings.
16
as the excess return is calculated based on industry median fund returns. Over the sample
period, average market return i.e. return on MSCI hedge fund index was 10.21%.
---------------------------------Insert Table 4 here -------------------------------------------------------
3. Analyses
3.1 Propensity of New Fund Opening
To explore our hypothesis we observe new fund openings by fund families over the
sample period. Empirically, we measure fund families’ capacity constraints using proxies such
as: i,tCC1 and i,tCC2 described in the previous section. Figure 3 plots the average number of
new hedge funds opened by fund families in different quintiles of i,tCC1 . Figure 3 also shows
average number of new funds opened in various quintiles of tiFamilysizeRsd ,_ over the
sample period. This figure indicate a trend that fund families with greater capacity constraints
(i.e. i,tCC1 ) opened more hedge funds, on average, compared to families in the lower quintiles
i,tCC1 . On the other hand no such trend is visible for average number of new fund opened in
different family size quintiles. Based on the second capacity constraint proxy, i,tCC2 , Figure 4
compares total number of new hedge funds opened by constrained fund families and non-
constrained fund families across the years. In 11 out of 15 years, group of the constrained
families opened more number of funds than the non-constrained families. These observable
trends support our basic hypothesis that capacity constraints motivate fund families to open
new hedge funds.
A pooled binary regression model is used to investigate the impact of capacity
constraints on the decision to open new funds by the fund families. The dependent variable in
17
this analysis is a binary variable representing the decision of the fund family i to open a new
hedge fund in the year t. In our empirical analysis, we use the following Probit model:
(7)
where ti,θ is the probability of a new fund opening by family i in year t. The dependent variable
takes the value 1 if the investment company i opened a new fund during period t; otherwise, it
takes the value 0. The variable tiCC , refers to the capacity constraint proxies i,tCC1 and i,tCC2
defined earlier. The variable kx is a vector of (k) control variables related to fund families, fund
strategies and other market characteristics. Table 5 reports estimated coefficients from the
Probit model described in Equation (7). To account for possible correlations within each fund
families new fund opening decisions across time, we cluster all the standard errors clustered
by fund families.
-------------------------------------- Insert Table 5 here ------------------------------------------------
Table 5 shows that capacity constraints variables have a positive and significant
coefficients in estimated Probit regressions. This evidence supports our hypothesis that the
probability of new fund opening is correlated to the capacity constraints experienced by the
fund families. Capacity constraints measures are significant predictors of new hedge fund
opening decision even in presence other traditional motivations of new fund introduction.
Family size variable, Rsd_Familysizet-1, is positive and significant that indicate that larger
hedge funds families do have higher probability of opening new hedge funds. This result agrees
with the findings of Khorana and Servaes (1999) – suggesting that larger fund families do enjoy
certain economies of scale or alternatively managers of larger fund families maybe motivated
( ) ∑++= −
k
kktiti xCCProbit1
1,1, βγαθ
18
to build larger empires. Control variable related to fund families past performance, Family
Exrett-1 has positive and significant coefficients in one of the models reported in Table 5,
suggesting hedge fund families with better past performance tend to open new funds more often
than other fund families. This evidence is in line with the existing findings in mutual fund
literature however the influence past performance is much weaker in our hedge fund sample.
In contrast to the finding of Khorana and Servaes (1999) we do find market demand for fund
managers’ skills significantly influence new fund opening decision in hedge fund industry.
Fund families seem to prefer opening new funds when investors show interest on their existing
funds in the past years, as past year’s fund flow to the family (Family_fundflowi,t-1) is positive
and significant in the Probit models described in Equation 7. Consistent to our expectation
based on existing literature - fee income is also found to be significant predictor of opening
new funds as High_Incentive_Feei, and High_Mgmt_Feei, are both positive and significant in
explaining fund families propensity of new fund opening. We also find Leveragei is positive
and significant in our models. This is consistent with the argument of Lan et.al. (2013) on
positive correlation between fund manager’s risk taking behavior and value of their option to
restart.
On the other hand, variables such as net fund flow to the strategy of the largest funds,
and the size of the largest funds strategy class are not significant in explaining new fund
opening decisions. Market return is also found to be insignificant in explaining the models
reported in Table 5. All the models reported in Table 5 are controlled for strategy and year
level fixed effects, all standard errors are clustered by fund families.
3.2 Diversification vs Specialization
In the previous section we discuss models describing fund families’ decision to open new
hedge funds when they experience capacity constraints. However the decision of whether or
19
not to start a new fund is only a part of the new fund introduction problem; the other part of
this decision involves identifying a strategy for the new hedge fund. Although there are a
number of investment strategies that fund managers may consider before making the final
strategy choice, the important decision that a manager needs to make in this process is whether
the fund family should specialize within its core competency (i.e. specialize in the strategy
category of its largest fund) or diversify by opening new funds in different strategy categories.12
The variables that might affect this decision are more likely to be related to the opportunities
available in the existing and potential strategy categories. The decision to diversify therefore
may depend on the strategy level capacity constraint of the existing funds as well as on the
capacity constraints of other strategies. Using the sample of fund families that open new funds,
we investigate this decision related diversification vs specialization in the context of the new
fund introduction by a fund family with following Ordered Probit regression model:
(8)
Fund families’ observable decisions to diversify or specialize (represented by yit) depends
on their unobservable needs and opportunities of diversification (y*it). In the Ordered Probit
model described in Equation (8), Φ refers to the cumulative normal distribution function,
1, −tiSCC and 1, −tiNSCC refer to the strategy level capacity constraint proxies for the strategy
of the existing fund and the strategy of the new fund opened by the family, these variables are
measured based on the strategy level capacity constraint measures discussed in Section 2.2.
12 We thank Philippe Schneider from the Alpha Strategies team at BlackRock for his email correspondence with the authors to clarify various aspects of fund managers’ new fund opening decisions.
<≤<≤
=
∑+++Φ= −−
*,1
1*,
*,
,
11,21,1,
2 0 1
0 0
ti
ti
ti
ti
k
kktititi
yifyifyif
y
xNSCCSCCy
δδ
βγγα
20
and is the vector of other control variables ( kx ) includes family characteristics, market return,
strategy characteristics of the largest funds and that of the new funds. Fund families decide to
specialize in their existing investment strategies (i.e. dependent variable yit takes the value 0)
when the value of the unobserved variable y*it is less than or equal to 0. If fund families feel a
greater need of diversification, say if the unobserved variable y*it is within the range of 0 to 1δ
then the families may partially diversify (i.e. dependent variable yit takes the value 1) by
introducing new hedge funds with in the same broader strategy category of their existing
fund13. Finally if the need for diversification and the opportunities available to achieve greater
diversification exceeds the value 1δ then the fund families may decide to open their new funds
in a strategy completely different from the investment strategy of their existing funds (i.e.
dependent variable yit takes the value 2).
We hypothesize that the need for diversification may positively correlate on the strategy
level capacity constraints experienced by the existing funds of the family i.e. 1, −tiSCC and the
opportunities for achieving greater diversification may negatively correlate to the strategy level
capacity constraints of the new funds i.e. 1, −tiNSCC . Therefore we expect that the fund
managers propensity to diversify while opening new hedge funds is a positive function of
1, −tiSCC and a negative function of 1, −tiNSCC .
In the ordered Probit regressions (Equation 8) estimated in the study, we use two alternative
measures of 1, −tiSCC and 1, −tiNSCC - as mentioned earlier in Section 2.2. The first set of
alternatives (i.e. 1,1 −tiSCC & 1,1 −tiNSCC ) are based on the excess fund size variable and the
13 Thus, for example, a family with merger arbitrage fund might open a new fund to invest in distressed firms though these two funds follow two distinct strategy subcategories however they belong to the same broader category of event driven investment strategy) and in that case yit takes the value 1. However if the need for diversification is even larger i.e. y*
it is greater than 1δ then fund families decide to introduce new funds an investment category completely different from the strategy of their existing funds (yit takes the value 2 in that case).
21
second set of alternatives (i.e. 1,2 −tiSCC & 1,2 −tiNSCC ) are based on the bootstrap procedure
discussed earlier. Table 6 reports the coefficients and their standard errors from the estimated
ordered Probit regressions described in Equation 8. All the standard errors are clustered by
fund families to control for the possible correlations within each fund families own decisions
across the time.
-------------------------------------- Insert Table 6 here ------------------------------------------------
The estimated coefficients of 1, −tiSCC ( 1, −tiNSCC ) variables reported in Table 6 are
significant and positive (negative) as expected. This evidence support our hypothesis that
strategy level capacity constraints influence fund families decisions to diversify while opening
new hedge funds. Consistent with our argument, hedge fund families with existing funds in
constrained strategies prefer greater diversification while opening new funds (i.e. positive and
significant 1,1 −tiSCC & 1,2 −tiSCC ). On the other hand, the strategy level capacity constraints of
the new funds are negatively correlated to fund families’ diversification decisions (i.e. negative
and significant 1,1 −tiNSCC & 1,2 −tiNSCC ). This is also consistent with our hypothesis because
when new funds are opened in response to strategy level capacity constraints, fund families’
diversification needs must be satisfied by their new fund strategies; therefore if need for
diversification is higher, strategy level capacity constraints should be lower in new funds.
The variables related past year’s family size and performance (i.e. Rsd_Familysizet-1 and
Family_Exrett-1 respectively) are also found to be significant. These results suggest that fund
families with larger size (Rsd_Familysizet-1) show greater preference towards diversification
and families with better past performance show lower preference for deviating from their
existing investment strategies when introducing a new fund.
22
Variables such as strategy level excess return and strategy level fund flows for the strategy
of the largest fund of the family (i.e. Strategy_Exrett-1 and Strategy_Fundflowt-1 respectively) are
included in the ordered Probit regressions along with similar variables for the strategy of the
newly opened fund (i.e. NStrategy_Exrett-1 and NStrategy_Fundflowt-1) . In significance of past
performance of the new strategy (NStrategy_Exrett-1) and insignificance of past fund flow to
the new strategy (NStrategy_Fundflowt-1) suggest that historical attractiveness as well as past
investor demand of the new strategies may not play a significant role in fund families decision
on diversification. However, past fund flow to the strategy of the largest fund of the family
(i.e. Strategy_Fundflowt-1) is negatively significant at 10% level in one of the models providing
weak evidence that fund families diversification decisions are to some extent motivated by the
over-crowded existing strategy. The results in Table 6 also show that the coefficients of
NStrategy_Sizet-1 or the size of the strategy of the newly opened fund is negative and highly
significant at 1% level in both of the models. This preference towards diversifying in smaller
strategy categories might indicate fund families preference to diversify in less explored or less
crowded strategies to enjoy the early movers’ benefit. The market return has negative
coefficient in these models which may suggest that fund families primarily search for
diversification opportunities in a down market, however these coefficients are significant at
10% level in only one of the models reported. All the models are controlled for strategy and
year fixed effects.
3.3 Fund Flows and New Fund Opening
Our capacity constraints hypothesis suggest that, while experiencing capacity
constraints in existing funds , fund families may open new hedge funds in order to divert new
fund flows from existing funds to the new funds. Therefore, we expect fund flows to the
existing funds to decrease after the introduction of new funds by the same fund family, as this
23

is one of the strategic intent behind the new fund introduction according to our hypothesis.
Therefore failing to find evidence related decrease in fund flows to the existing funds post new
fund opening will raise question about the usefulness of such a strategy to manage capacity
constraints. Therefore, we analyze the net fund flow of the largest existing fund in the fund
families. We calculate the net fund flow to the hedge funds following Sirri and Tufano (1998)
as:
(9)
(10)
where, tAUM is the end of the month asset under management and tR is the monthly
return of a hedge fund. Following previous literature (see, for instance, Sirri and Tufano,1998
; Fung, Hsieh, Naik and Ramadorai, 2007) we model fund flows based on past performance,
fund size and market conditions. In these models, we also include dummy variables to identify
pre-new fund introduction period as well as the post-new fund opening period. Our pooled
regression models to test H3 are as follows:
(11)
(12)
where NewFamFundPre _ ( NewFamFundPost _ ) is a dummy variable which takes the value
one if the fund family of hedge fund i introduced at least one new hedge fund within the next
(previous) one year i.e. within the period t to t+12 ( t-12 to t) months. Other independent
variables are represented by the vector iy . The control variables for this regression include
1
1
)1(
−
−
=
+−=
tt
t
tttt
AUMFlowFundDollar
RateFlowFund
RAUMAUMFlowFundDollar
tiiiti
titi
eycNewFamFundPostbNewFamFundPrebaFlowRateFund
,,2
,1,
_ _
+∑+
++=
tiuiyictiNewFamFundPostbtiNewFamFundPrebatiFlowFundDollar
,,_2 ,_1), ln(
+∑+
++=
24

abnormal fund performance (Alpha) estimated based on the seven (7) factor model proposed
by Fung and Hsieh (2004) (a detail discussion on estimation of Alpha is provided in next
section), fund size or natural logarithm of funds AUM, indicator variable for US domicile
funds, market return based on MSCI hedge fund index return, indicators for economic boom
and recession based on NBER’s economic cycle and dummy variables to control for strategy
fixed effects. A detailed description of those variables is provided in Table A2 of Appendix 1.
Table 7 reports the results of a pooled regression models described in (8) and (9). Model
1 and Model 2 use net fund flow and the natural logarithm of the dollar value of fund flows as
dependent variables. In these model, the coefficients of Pre_NewFund and Post_NewFund
dummies are both positive and significant. However, the value the coefficient of
Post_NewFund is smaller than that associated with Pre_NewFund which supports the
hypothesis that, fund flows to the existing fund decreases following a new fund opening. The
F tests reported in Table 7 show that the differences between the coefficients of these two
variables estimated in Model 1 and 2 are statistically significant at 5% and 1% level of
significance respectively. These results show that fund flow to the exciting funds significantly
decrease immediately after new fund introduction. Hence, this evidence support the basic
hypothesis of this paper.
-------------- Table 7 Here -----------------
3.4 Abnormal Return and New Fund Opening
Fund families are concerned about capacity constraints as constrained funds struggle to
earn superior returns. The fund managers may not be motivated to use the strategy of opening
new hedge funds to manage capacity constraints of their existing funds if performance of their
existing funds deteriorate after opening new funds. Hence impact of the new fund opening
25

decision on the performance of the existing funds of the family could help us understand the
consequences of the capacity constraint hypothesis. We calculate the abnormal fund
performance (Alpha) of the hedge funds, using the following the seven (7) factor model
proposed by Fung and Hsieh (2004). A similar factor model is also used by Fung et al. (2007).
(10)
fR is the monthly hedge fund return for fund f and month t. The set of factors comprises the
excess return on the S&P 500 index (SNPMRF); a small minus big factor (SCMLC) constructed
as the difference of the Wilshire small and large capitalization stock indices; the yield spread
of the US 10-year treasury bond rate over the three month T-bill rate, adjusted for the duration
of the ten year bond (BD10RET); and the change in the credit spread of the Moody's BAA bond
over the 10-year treasury bond, also appropriately adjusted for duration (BAAMTSY). The other
factors are based on primitive trend following strategies discussed by Fung and Hsieh (2001).
These are: excess returns on portfolios of look-back straddle options on currencies (PTFSFX),
commodities (PTFSCOM) and bonds (PTFSBD), which are constructed to replicate the
maximum possible returns to trend-following strategies on their respective underlying assets14.
We estimate the factor model for all the hedge funds using the first 60 months of their
return history. Based on the estimated parameters of the seven factor model, we calculate the
monthly alphas of the funds for rest of the sample period as follows:
(11)
14 The data on hedge fund risk factors used for estimation of the 7 factor model are collected from the
website of David A. Hsieh: http://faculty.fuqua.duke.edu/~dah7/DataLibrary/TF-FAC.xls
76
54321, PTFSCOMPTFSFX
PTFSBDBAAMTSYBD10RETSCMLCSNPMRFR
tt
ttttttfββ
βββββα
++
+++++=
) ˆˆ ˆ
ˆ ˆ ˆ ˆ(
7,6,5,
4,3,,21,,
PTFSCOMPTFSFXPTFSBD
BAAMTSYBD10RETSCMLCSNPMRFRAlpha
tititi
titititi,titi
βββ
ββββ
+++
+++−=
26
Where, ji,β̂ refers to the estimated parameters from Eq. (10) for hedge fund i.
Finally, we use the following pooled regression model to investigate the potential
impact of a new fund opening decision on the performance of the other funds in the same family
as:
(12)
where NewFamFundPre _ and NewFamFundPost _ are dummy variables as described
earlier, ky is a vector of (k) control variables. The control variables for this regression are
similar to the control variables of the fund flow regressions described in previous section. A
description of these control variables are provided in Table A2 of Appendix 1.
Table 7 reports the estimated coefficients of the pooled regression model described in
Eq. (12). We find that the post new fund dummy is positive and statistically significant,
however the dummy for pre new fund opening period is statistically insignificant. This
suggest that performance of the largest funds of the families improves post new fund opening
by their fund families. F test for linear coefficient restriction confirms the statistical
significance of the performance improvement of the existing funds at 1% level after the
opening of a new fund by the same fund family. This result supports the basic hypothesis and
indicates that the strategy of opening a new hedge fund in order to divert fund flows from
existing funds to newly introduced funds is an economically rewarding exercise for the fund
families, at least in short run.
------------- Table 8 Here ---------------
3.5 Capacity Constraints and Performance of New Funds
New fund opening decision as a response to the capacity constraints experienced in existing
funds suggests that this is mostly a reactive strategy which focuses mostly on managing optimal
∑+++= kktititi yNewFamFundPostNewFamFundPreAlpha θδδλ ,2,1, __
27

performance of existing funds than creatively identifying new investment opportunities for the
newly established ones. Hence performance of these newly introduced funds could suffer. This
is especially true for the fund families where the sources of capacity constraints are rooted in
managerial incompetence. Edhec (2005) identified two distinct sources of capacity constraints
- 1) manager’s capacity, 2) market’s capacity. Market’s capacity refers to unavailability of
enough profitable opportunities in a market. Capacity constraints due to market’s capacity
affects most of the funds in that strategy, hence this is similar to the strategy level capacity
constraint proxies we identified earlier. However it is difficult to identifying capacity
constraints due to managers’ lack of stock selection skill. Our family level capacity constraints
could be due to any one or both of the above reasons. However families that experience
capacity constraint when there is no strategy level capacity constraints for their existing funds,
could indicate capacity constraints due to managerial incompetence.
We compare performance of new hedge funds that are introduced when their fund family was
experiencing capacity constraints against a group of new hedge funds whose fund family didn’t
experience capacity constraints at the time of their inception. Table 8a, Panel A reports mean
value of raw returns and market adjusted returns of these two group of new hedge funds, after
one and three year of their inception. The results suggests funds that open under the condition
of family capacity constraint perform significantly poorly compared to the other new hedge
funds over first three years of their life.
The group of hedge funds that are opened under the condition of capacity constraints were
further divided into two groups based on the sources of the capacity constraints. Funds that are
opened when their family experienced capacity constraints, however there were no strategy
level capacity constraints, those funds were identified as funds opened due to manager’s
capacity constraints. On the other hand funds that were opened when there were capacity
constraints at both family as well as strategy level those funds are identified as funds opened
28

due to market’s capacity. New hedge funds that were opened by families’ when they didn’t
face any capacity constraints were classified as funds opened by choice. Panel B of Table 8a,
shows that performance of funds opened because of manager’s capacity constraints perform
significantly poorly compared to both funds opened by choice and funds opened due to
market’s capacity constraints. On the other hand, the performance differences between funds
opened by choice and due to market’s capacity constraints were not statistically in most of the
cases.
IV. Robustness Checks
A. Evidence from Strategy Sub Samples
The Probit model described in Equation (4) estimates the average sensitivity of the fund
families’ propensities to open new hedge funds with respect to their capacity constraints.
However, the extant literature (Getmansky, 2005; Teo, 2009) generally discusses hedge funds'
capacity constraints with respect to their specific investment strategies and the underlying
liquidity of the market where the fund invests. Therefore one may ask whether the results
obtained from the pooled sample is in general valid for all individual strategy classes. Hence,
we estimate the Probit model described in Equation (4) over the subsamples of each strategy
class of the largest funds of the families. In this analyses, we focus on six clearly identifiable
hedge fund strategies: Emerging Market (EM), Event Driven (ED), Global Macro (GM), Long
Only (LO), Relative Value (RV) and Sector Focused (SF). In this analysis we exclude Fund of
Funds and Multi Strategy funds. Due to the ‘mixed bag’ nature of these strategies it is difficult
to clearly identify the potential impact of the capacity constraints on these funds and on their
families. We also exclude funds with Short Bias due to insufficient number (only 12 new fund
openings) observations in this strategy category. 29

Table 9 reports the estimated coefficients of the capacity constraint proxies from the
Probit models described in Equation (4) estimated over subsamples of the strategies mentioned
above. All standard errors are clustered by fund families. The coefficients from the Probit
models estimated over the strategy sub samples are qualitatively similar to the coefficients
reported in Table 4. Except for the coefficient of CC1 for Sector specific funds and the
coefficients CC2 in the subsample of Global Macro and Long Only strategies (they have the
right sign but lack the statistical significance), all other coefficients of the capacity constraint
proxies are positive and significant. The insignificance of CC1 in Sector Focused funds is
mostly due to relatively smaller sample size, it should be noted that CC1 is statistically
significant for Sector Focused hedge funds for reduced forms of the current Probit model.15
Overall, these results provide further evidence that though the degrees of the influence of
capacity constraints on fund families’ propensity to open new hedge funds vary across
investment strategies however this effect is not restricted to any specific investment strategy as
such.
B. Evidence from Large and Small Fund Families
In our analysis, we argue that fund families decide to open new funds when their largest
funds experience a capacity constraint. However our sample includes small fund families (the
smallest one has about $100,000 asset under management) as well as very large fund families
(largest family has about $32 Bn asset under management); the average family size in the
sample is $192M but the upper quartile of family size is only about $106.75M, this indicates
15 The statistical insignificance of CC2 for Global Macro and Long Only strategies could be explained based on the distribution of the correlation between fund size and fund performance in these strategies reported in Figure 4. Compared to the other investment strategies, the bootstrapped procedure managed to identify relatively fewer cases of constrained hedge funds for these two investment strategies (i.e. less number of observations in bottom left quadrant of the graphs c & d in figure 4). This may be due to the fact that compared to other investment strategies these two are comparatively less restrictive and hence enjoy greater liquidity.
30
existence of few very large fund families. Therefore, to make sure that our results are not
driven by a few very large fund families, we remove the largest 5% of the fund families and
carried out the analysis reported in Table 5 with this new sample. The results of this test is
found to be qualitative not different what is reported in Table 5. Table 10 reports our findings
from this robustness analysis. This analysis assures that the impact of capacity constraints on
fund families’ new fund opening decisions is not confined only to the extremely large funds
only.
--------------- Table 9, 10 & Table 11 ---------------
D. Evidence from US and Non US Fund Families
In the past, non US / offshore hedge funds have attracted particular attention in hedge
fund research (see, for example, Brown, Goetzmann, and Ibbotson, 1999; Liang 1999 & 2000,
Liang and Park, 2008). The offshore hedge funds are typically registered in small islands off
the Caribbean, Europe and Asia Pacific. These funds operate in a very different regulatory and
institutional environment; they often enjoy different legal structure, tax advantages and face
lesser regulations compared to US hedge funds. Brown, Goetzmann, and Ibbotson (1999)
report a positive risk adjusted performance of offshore funds although they do not find any
differential managerial skills in these funds. They are generally riskier compared to onshore
funds (Liang, 1999) but provide similar returns relative to the US-based hedge funds.
According to Liang and Park (2008), onshore funds impose stricter liquidity restrictions on
investors compared to offshore funds due to tax and other legal differences. They also find that
offshore funds provide higher illiquidity premiums to their investors through a stronger
correlation between asset illiquidity and share illiquidity. Therefore, the regulatory and
institutional differences between US and non US domiciled funds may motivate their trading
style and portfolio choices. It may well be worthwhile investigating if capacity constraints are
31
important in new fund opening decisions of the non US fund families. To do so, we create sub
samples of the US and Non-US fund families. We find that the results are qualitatively similar
to our original results16, implying that the influence of capacity constraints on fund families’
decisions to open new hedge funds may well be a global phenomenon. Over all, we find that
all our robustness analyses provide strong support of our main findings.
V. Summary and Conclusions
The extant literature suggests that hedge funds experience capacity constraints and
provides evidence of a non-scalability of hedge funds’ investment strategies (Goetzmann,
Ingersoll and Ross ,2001; Fung, Hsieh, Naik and Ramadorai ,2007; Zhong, 2008; Teo, 2009).
In this paper, we argue that capacity constraints faced by hedge fund families might well
explain their decision to open new hedge funds. We argue that portfolio managers may find
that it difficult to actively manage large portfolios with complex investment strategies.
Therefore, for active funds, the returns should be a concave function of fund size.
Consequently, fund managers may restrict existing fund sizes to an optimal threshold level by
diverting new incoming funds from investors to a newly created hedge fund within the same
family. We also propose that capacity constraints at investment strategy level influence hedge
fund families’ choice of investment strategies for the new hedge funds.
We find strong empirical evidence supporting our hypotheses. Using hedge fund data
for a period of eighteen years (1990 through 2007) from the Barclay Hedge Fund Database, we
14 The results of this robustness test are qualitatively quite similar to the results of the original analysis.
We do not provide the detail results of this robustness test in the paper just to avoid repetitive reporting
of similar results. However these results are available upon request.
32

create two different measures of hedge funds’ capacity constraints. We find that fund families’
propensities to open new hedge funds are positively correlated to the capacity constraints they
experience in their largest funds. Also fund families’ decisions to open new funds in investment
strategies that are different from that of their largest funds are positively correlated to the
strategy level capacity constraints of the largest funds and negatively correlated to the newly
opened funds. Overall these findings indicate that capacity constraint both at the fund family
level as well as at the investment strategy level might influence fund managers decisions to
open new hedge funds.
We find evidence that fund inflows to the existing funds increase before the
introduction of new funds and they subsequently decrease following the opening of the new
hedge funds. This supports our basic argument about why capacity constraints may influence
new hedge fund opening decisions. Finally, we find that the performance of the existing funds
of the family increases following the opening of a new fund. Thus, the strategy of diverting
fund flows from existing funds to a new hedge fund helps fund families improve their
performance overall.
33
References
Ackermann, Carl, Robert McEnally, and David Ravenscraft, 1999, The performance of hedge funds: Risk, return and incentives, Journal of Finance, 54, 833-874. Agarwal, Vikas, and Narayan Y. Naik, 2000a, Multi-period performance persistence analysis of hedge funds, Journal of Financial and Quantitative Analysis, 53, 327-342.
Agarwal, Vikas, and Narayan Y. Naik, 2000b, Generalized style analysis of hedge funds. Journal of Asset Management, 1, 93-109.
Agarwal, Vikas, and Narayan Y. Naik, 2004, Risks and portfolio decisions involving hedge funds, Review of Financial Studies, 17, 63-98. Agarwal, Vikas, Naveen D. Daniel, and Narayan Y. Naik, 2009, Role of managerial incentives and discretion in hedge fund performance, Journal of Finance, 64, 2221-2256. Boyson, Nicole M., 2009, The impact of hedge fund family membership on performance and market share. Journal of Financial Transformation, 25, 123 – 129. Brown, Stephen J., and William N. Goetzmann, 2003, Hedge funds with style. Journal of Portfolio Management, 29, 101-112. Brown, Stephen J., Willam N. Goetzmann, and Roger G. Ibbotson, 1999, Offshore hedge funds: Survival and performance 1989-1995, Journal of Business 72, 91-117. Brown, Stephen J., William N. Goetzmann, and James Park, 2001, Careers and survival: Competition and risk in the hedge fund and CTA industry, Journal of Finance 56, 1869–1886. Chen, Joseph, Harrison G. Hong, Ming Huang, and Jeffrey D. Kubik, 2004, Does fund size erode mutual fund performance? The role of liquidity and organization, American Economic Review 94, 1276 – 1302. Edwards, Franklin R. and Mustafa O. Caglayan, 2001, Hedge fund performance and manager skill, Journal of Futures Markets 21, 1003-1028. Evans, Richard. B., 2010, Mutual fund incubation, Journal of Finance 65, 1581–1611. Fung, William and David Hsieh, 1997, Empirical characteristics of dynamic trading strategies: The case of hedge funds, Review of Financial Studies 10, 275-302. Fung, William and David Hsieh, 2000, Performance characteristics of hedge funds and CTA funds: Natural versus spurious biases, Journal of Financial and Quantitative Analysis 35, 291-307. Fung, William and David Hsieh, 2001, The risk in hedge fund strategies: Theory and evidence from trend followers, Review of Financial Studies 14, 313-341.
34

Fung, William, David Hsieh, Narayan Y. Naik, and Tarun Ramadorai, 2007, Hedge funds: Performance, risk and capital formation, Journal of Finance 63, 1777-1803. Gaspar, José Miguel, Massimo Massa and Pedro Matos, 2006, Favoritism in mutual funds families? Evidence on strategic cross-fund subsidization, Journal of Finance 61, 73-104. Getmansky, M., 2005, The life cycle of hedge fund: Fund flows, size, and performance, Working paper, Massachusetts Institute of Technology.
Goetzmann, William N., Brown, Stephen J. and Park, James M., 1997. Conditions for survival: Changing risk and the performance of hedge fund managers and CTAs, Yale School of Management Working Paper No. F-59.
Goetzmann, William, Ingersoll, Jonathan E., Ross, Stephen A., 2003, High-water marks and hedge fund management contracts. Journal of Finance 58, 1685-1717. Keim, Donald B., and Ananth. Madhavan, 1997, Transaction costs and investment style: An inter-exchange analysis of institutional equity trades, Journal of Financial Economics 46, 265-292.
Khorana, Ajay, and Henri Servaes, 1999, The determinants of mutual fund starts, The Review of Financial Studies 12, 1043-1074,
Loeb, Thomas F., 1983, Trading cost: The critical link between investment information and results, Financial Analysts Journal, May/June, 39-44.
Liang, Bing, 1999, On the performance of hedge funds, Financial Analysts Journal 55, 72-85. Liang, Bing, 2000, Hedge funds: The living and the dead, Journal of Financial and Quantitative Analysis 35, 09-326. Massa, Massimo, 2003, How do family strategies affect fund performance? When performance-maximization is not the only game in town, Journal of Financial Economics, 67, 249-305. Naik, Narayan Y., Tarun Ramadorai, and Maria Stromqvist, 2007, Capacity constraints and hedge fund strategy returns, European Financial Management 13, 239-256. Nanda, Vikram, Jay Wang, and Lu Zheng, 2004, Family values and the star phenomenon: Strategies of mutual fund families, Review of Financial Studies 17, 667-698. Perold, Andre F., 1988, The implementation shortfall: Paper versus reality. The Journal of Portfolio Management, 14, 4-9. Perold, Andre and Salomon, Robert S., 1991, The right amount of assets under management. Financial Analysts Journal 47, 31–39.
35

Tarun Ramadorai, 2012, Capacity constraints, investor information, and hedge fund returns’, Journal of Financial Economics, Forthcoming. Sirri, Erik R. and Peter Tufano, 1998, Costly search and mutual fund flows, Journal of Finance 53, 1589-1622. Teo, Melvyn, 2009, Does size matter in the hedge fund industry? Available at SSRN: http://ssrn.com/abstract=1331754 Zhong, Zhaodong, 2008, Why does hedge fund alpha decrease over time? Evidence from individual hedge funds, Available at SSRN: http://ssrn.com/abstract=1108817
36
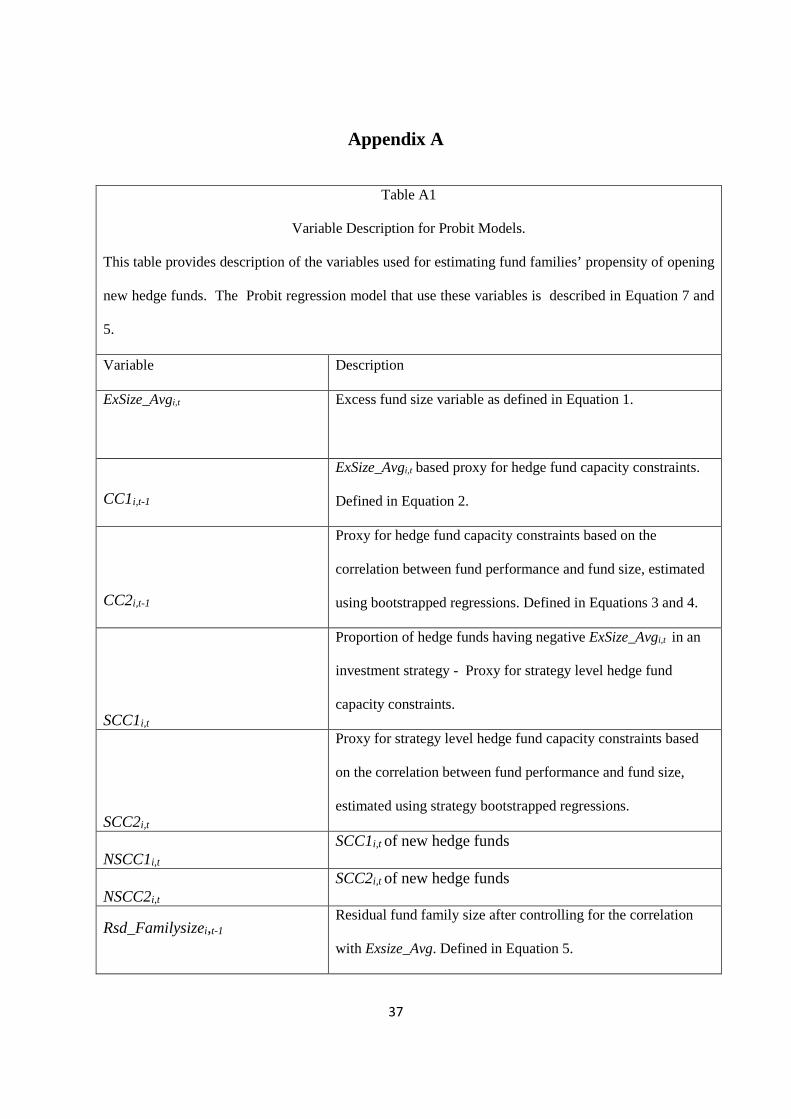
Appendix A
Table A1
Variable Description for Probit Models.
This table provides description of the variables used for estimating fund families’ propensity of opening
new hedge funds. The Probit regression model that use these variables is described in Equation 7 and
5.
Variable Description
ExSize_Avgi,t
Excess fund size variable as defined in Equation 1.
CC1i,t-1
ExSize_Avgi,t based proxy for hedge fund capacity constraints.
Defined in Equation 2.
CC2i,t-1
Proxy for hedge fund capacity constraints based on the
correlation between fund performance and fund size, estimated
using bootstrapped regressions. Defined in Equations 3 and 4.
SCC1i,t
Proportion of hedge funds having negative ExSize_Avgi,t in an
investment strategy - Proxy for strategy level hedge fund
capacity constraints.
SCC2i,t
Proxy for strategy level hedge fund capacity constraints based
on the correlation between fund performance and fund size,
estimated using strategy bootstrapped regressions.
NSCC1i,t SCC1i,t of new hedge funds
NSCC2i,t SCC2i,t of new hedge funds
Rsd_Familysizei,t-1
Residual fund family size after controlling for the correlation
with Exsize_Avg. Defined in Equation 5.
37
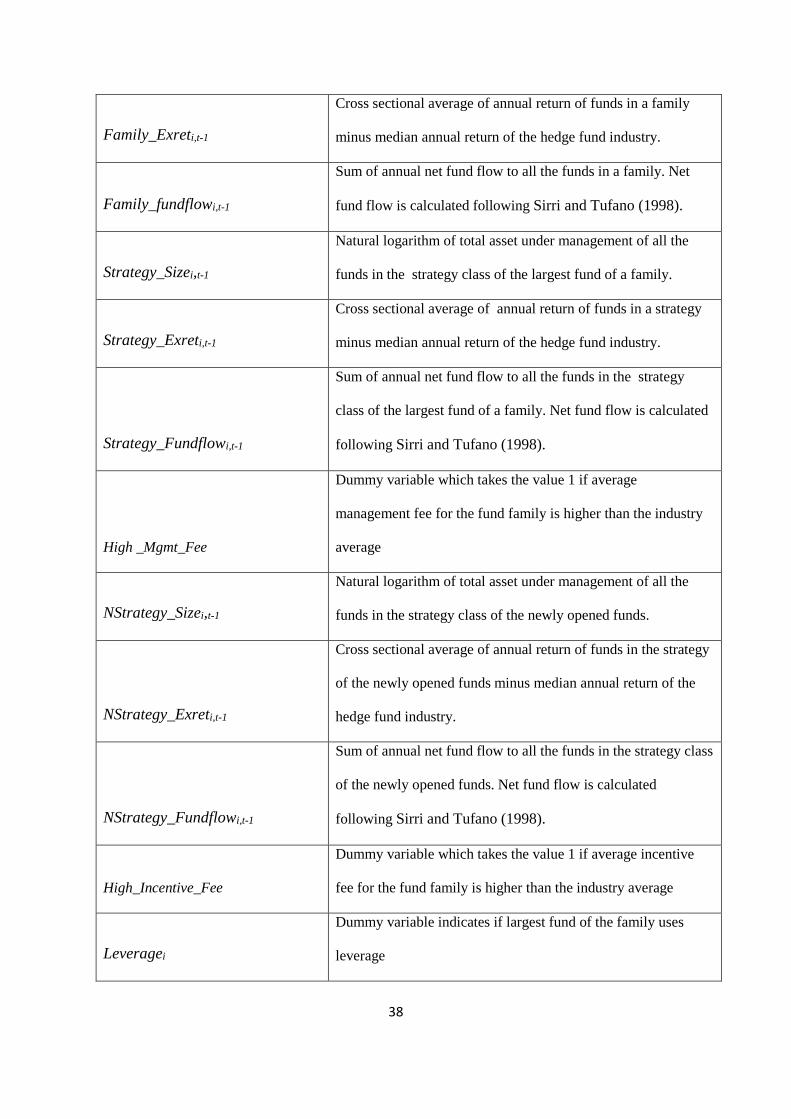
Family_Exreti,t-1
Cross sectional average of annual return of funds in a family
minus median annual return of the hedge fund industry.
Family_fundflowi,t-1
Sum of annual net fund flow to all the funds in a family. Net
fund flow is calculated following Sirri and Tufano (1998).
Strategy_Sizei,t-1
Natural logarithm of total asset under management of all the
funds in the strategy class of the largest fund of a family.
Strategy_Exreti,t-1
Cross sectional average of annual return of funds in a strategy
minus median annual return of the hedge fund industry.
Strategy_Fundflowi,t-1
Sum of annual net fund flow to all the funds in the strategy
class of the largest fund of a family. Net fund flow is calculated
following Sirri and Tufano (1998).
High _Mgmt_Fee
Dummy variable which takes the value 1 if average
management fee for the fund family is higher than the industry
average
NStrategy_Sizei,t-1
Natural logarithm of total asset under management of all the
funds in the strategy class of the newly opened funds.
NStrategy_Exreti,t-1
Cross sectional average of annual return of funds in the strategy
of the newly opened funds minus median annual return of the
hedge fund industry.
NStrategy_Fundflowi,t-1
Sum of annual net fund flow to all the funds in the strategy class
of the newly opened funds. Net fund flow is calculated
following Sirri and Tufano (1998).
High_Incentive_Fee
Dummy variable which takes the value 1 if average incentive
fee for the fund family is higher than the industry average
Leveragei
Dummy variable indicates if largest fund of the family uses
leverage
38
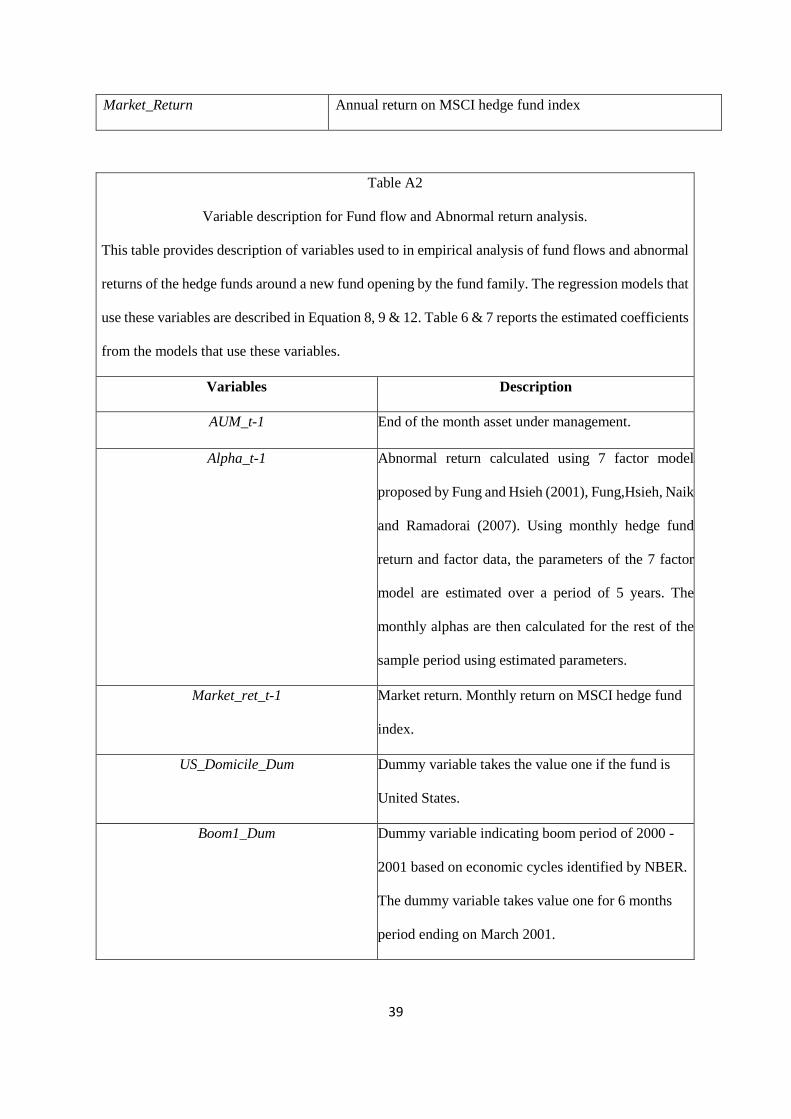
Market_Return Annual return on MSCI hedge fund index
Table A2
Variable description for Fund flow and Abnormal return analysis.
This table provides description of variables used to in empirical analysis of fund flows and abnormal
returns of the hedge funds around a new fund opening by the fund family. The regression models that
use these variables are described in Equation 8, 9 & 12. Table 6 & 7 reports the estimated coefficients
from the models that use these variables.
Variables Description
AUM_t-1 End of the month asset under management.
Alpha_t-1 Abnormal return calculated using 7 factor model
proposed by Fung and Hsieh (2001), Fung,Hsieh, Naik
and Ramadorai (2007). Using monthly hedge fund
return and factor data, the parameters of the 7 factor
model are estimated over a period of 5 years. The
monthly alphas are then calculated for the rest of the
sample period using estimated parameters.
Market_ret_t-1 Market return. Monthly return on MSCI hedge fund
index.
US_Domicile_Dum Dummy variable takes the value one if the fund is
United States.
Boom1_Dum Dummy variable indicating boom period of 2000 -
2001 based on economic cycles identified by NBER.
The dummy variable takes value one for 6 months
period ending on March 2001.
39
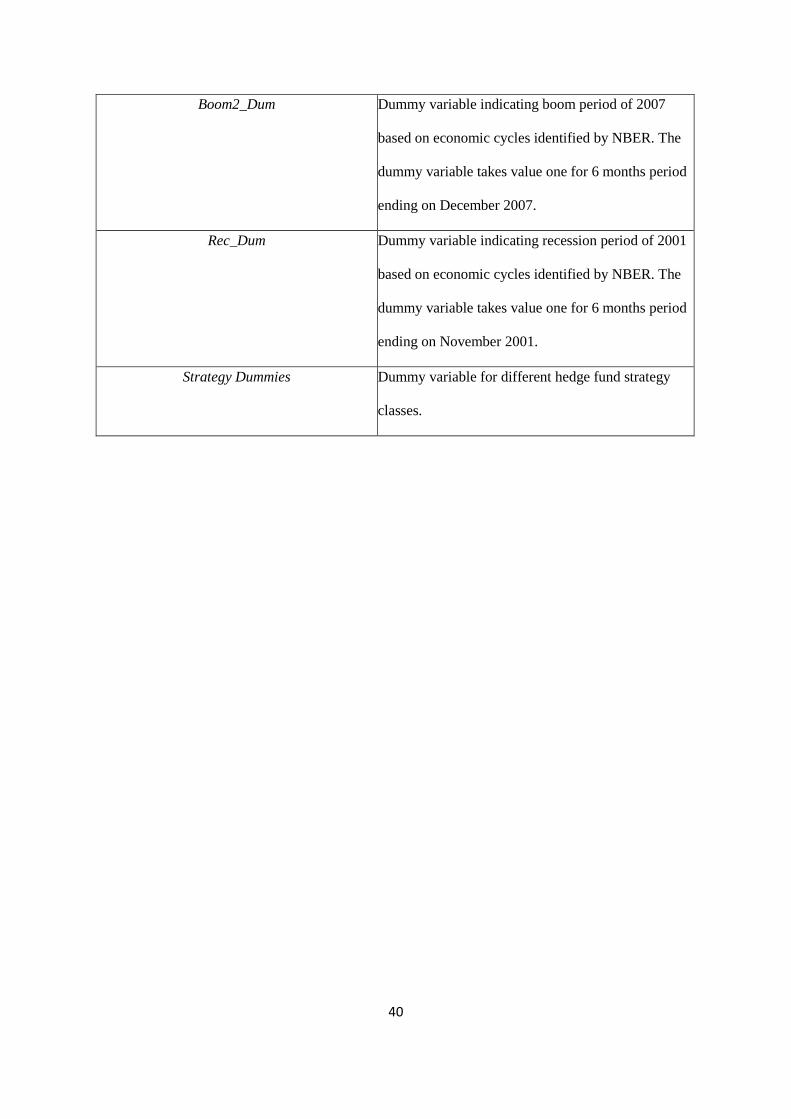
Boom2_Dum Dummy variable indicating boom period of 2007
based on economic cycles identified by NBER. The
dummy variable takes value one for 6 months period
ending on December 2007.
Rec_Dum Dummy variable indicating recession period of 2001
based on economic cycles identified by NBER. The
dummy variable takes value one for 6 months period
ending on November 2001.
Strategy Dummies Dummy variable for different hedge fund strategy
classes.
40
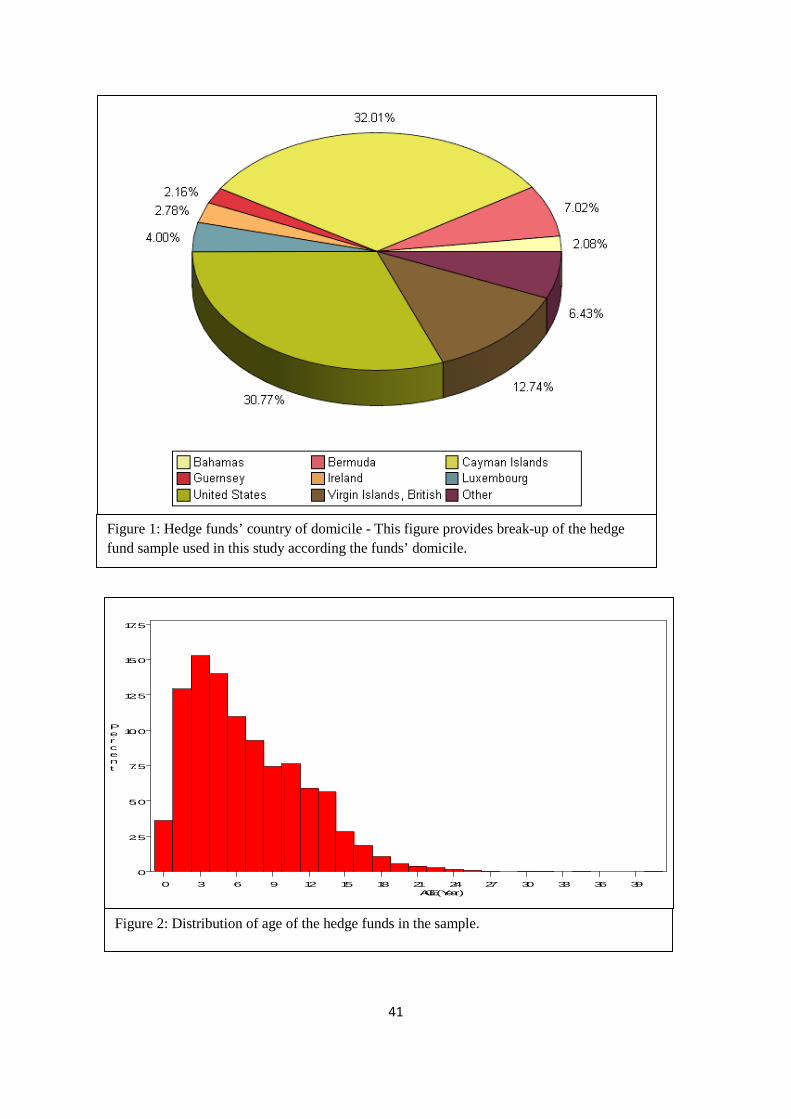
Figure 2: Distribution of age of the hedge funds in the sample.
0 3 6 9 12 15 18 21 24 27 30 33 36 39
0
2.5
5.0
7.5
10.0
12.5
15.0
17.5
Percent
AGE (Year)
Figure 1: Hedge funds’ country of domicile - This figure provides break-up of the hedge fund sample used in this study according the funds’ domicile.
41
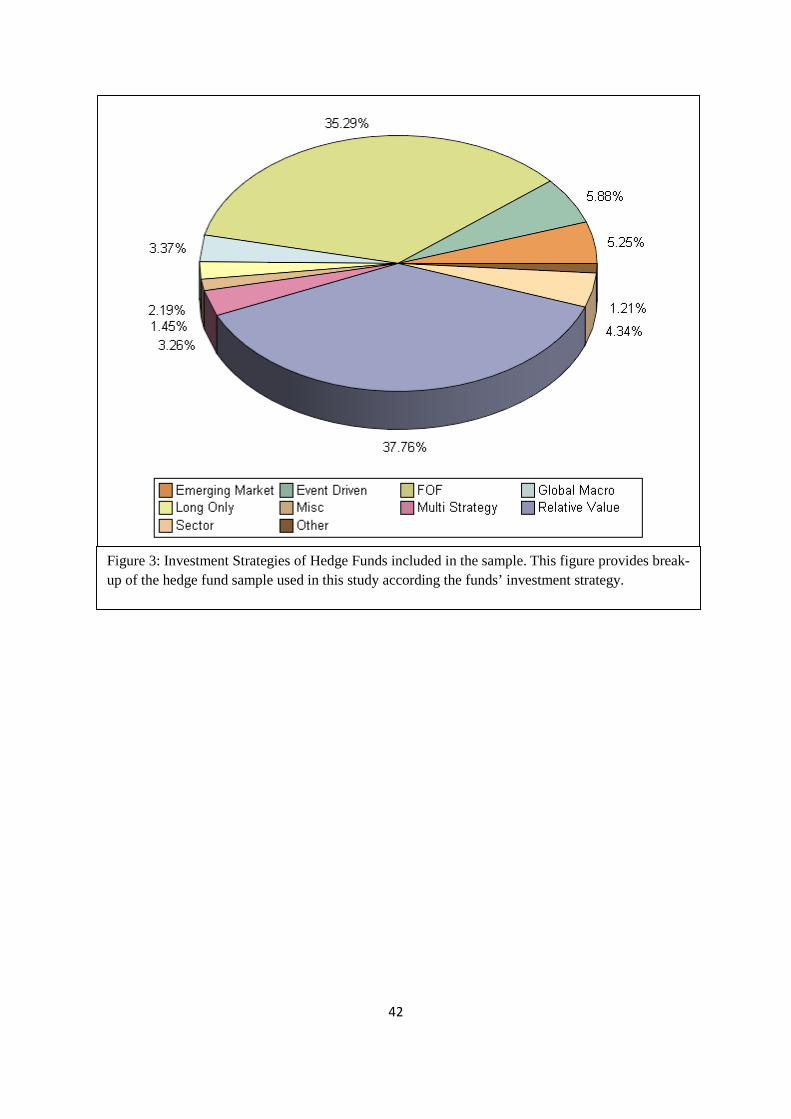
Figure 3: Investment Strategies of Hedge Funds included in the sample. This figure provides break-up of the hedge fund sample used in this study according the funds’ investment strategy.
42
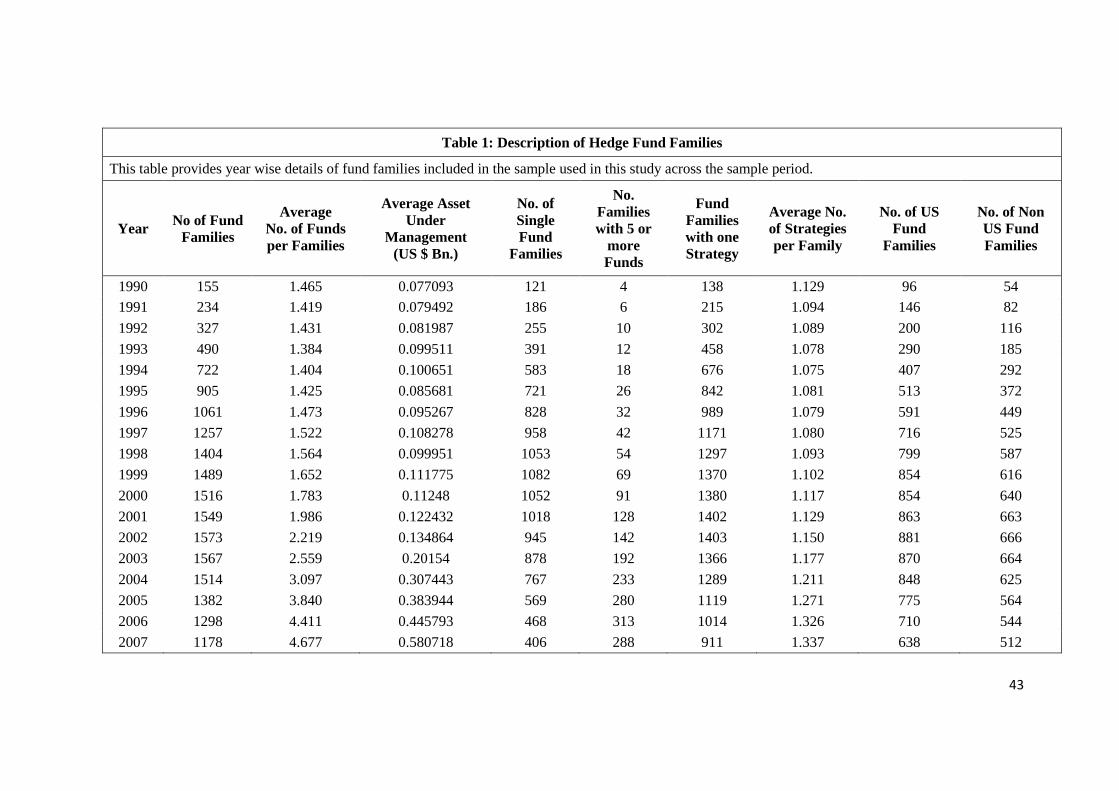
Table 1: Description of Hedge Fund Families
This table provides year wise details of fund families included in the sample used in this study across the sample period.
Year No of Fund Families
Average No. of Funds per Families
Average Asset Under
Management (US $ Bn.)
No. of Single Fund
Families
No. Families with 5 or
more Funds
Fund Families with one Strategy
Average No. of Strategies per Family
No. of US Fund
Families
No. of Non US Fund Families
1990 155 1.465 0.077093 121 4 138 1.129 96 54 1991 234 1.419 0.079492 186 6 215 1.094 146 82 1992 327 1.431 0.081987 255 10 302 1.089 200 116 1993 490 1.384 0.099511 391 12 458 1.078 290 185 1994 722 1.404 0.100651 583 18 676 1.075 407 292 1995 905 1.425 0.085681 721 26 842 1.081 513 372 1996 1061 1.473 0.095267 828 32 989 1.079 591 449 1997 1257 1.522 0.108278 958 42 1171 1.080 716 525 1998 1404 1.564 0.099951 1053 54 1297 1.093 799 587 1999 1489 1.652 0.111775 1082 69 1370 1.102 854 616 2000 1516 1.783 0.11248 1052 91 1380 1.117 854 640 2001 1549 1.986 0.122432 1018 128 1402 1.129 863 663 2002 1573 2.219 0.134864 945 142 1403 1.150 881 666 2003 1567 2.559 0.20154 878 192 1366 1.177 870 664 2004 1514 3.097 0.307443 767 233 1289 1.211 848 625 2005 1382 3.840 0.383944 569 280 1119 1.271 775 564 2006 1298 4.411 0.445793 468 313 1014 1.326 710 544 2007 1178 4.677 0.580718 406 288 911 1.337 638 512
43
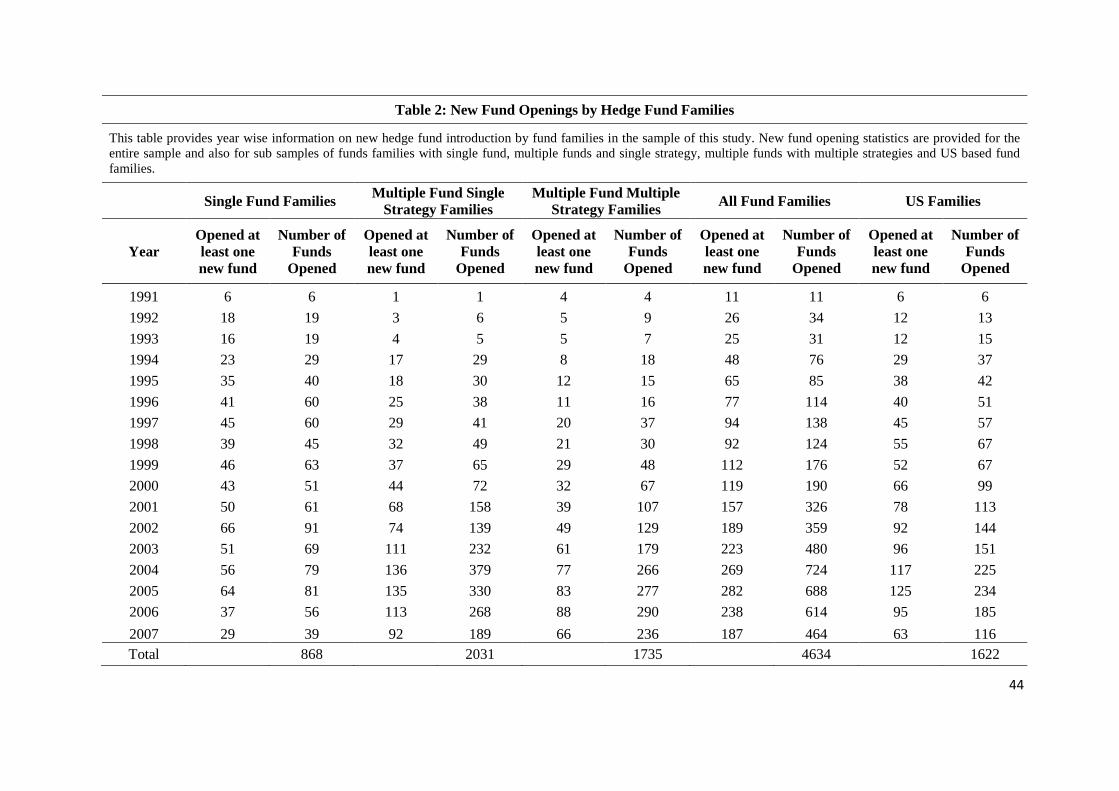
Table 2: New Fund Openings by Hedge Fund Families
This table provides year wise information on new hedge fund introduction by fund families in the sample of this study. New fund opening statistics are provided for the entire sample and also for sub samples of funds families with single fund, multiple funds and single strategy, multiple funds with multiple strategies and US based fund families.
Single Fund Families Multiple Fund Single Strategy Families
Multiple Fund Multiple Strategy Families All Fund Families US Families
Year Opened at least one new fund
Number of Funds
Opened
Opened at least one new fund
Number of Funds
Opened
Opened at least one new fund
Number of Funds
Opened
Opened at least one new fund
Number of Funds
Opened
Opened at least one new fund
Number of Funds
Opened
1991 6 6 1 1 4 4 11 11 6 6 1992 18 19 3 6 5 9 26 34 12 13 1993 16 19 4 5 5 7 25 31 12 15 1994 23 29 17 29 8 18 48 76 29 37 1995 35 40 18 30 12 15 65 85 38 42 1996 41 60 25 38 11 16 77 114 40 51 1997 45 60 29 41 20 37 94 138 45 57 1998 39 45 32 49 21 30 92 124 55 67 1999 46 63 37 65 29 48 112 176 52 67 2000 43 51 44 72 32 67 119 190 66 99 2001 50 61 68 158 39 107 157 326 78 113 2002 66 91 74 139 49 129 189 359 92 144 2003 51 69 111 232 61 179 223 480 96 151 2004 56 79 136 379 77 266 269 724 117 225 2005 64 81 135 330 83 277 282 688 125 234 2006 37 56 113 268 88 290 238 614 95 185 2007 29 39 92 189 66 236 187 464 63 116 Total 868 2031 1735 4634 1622
44
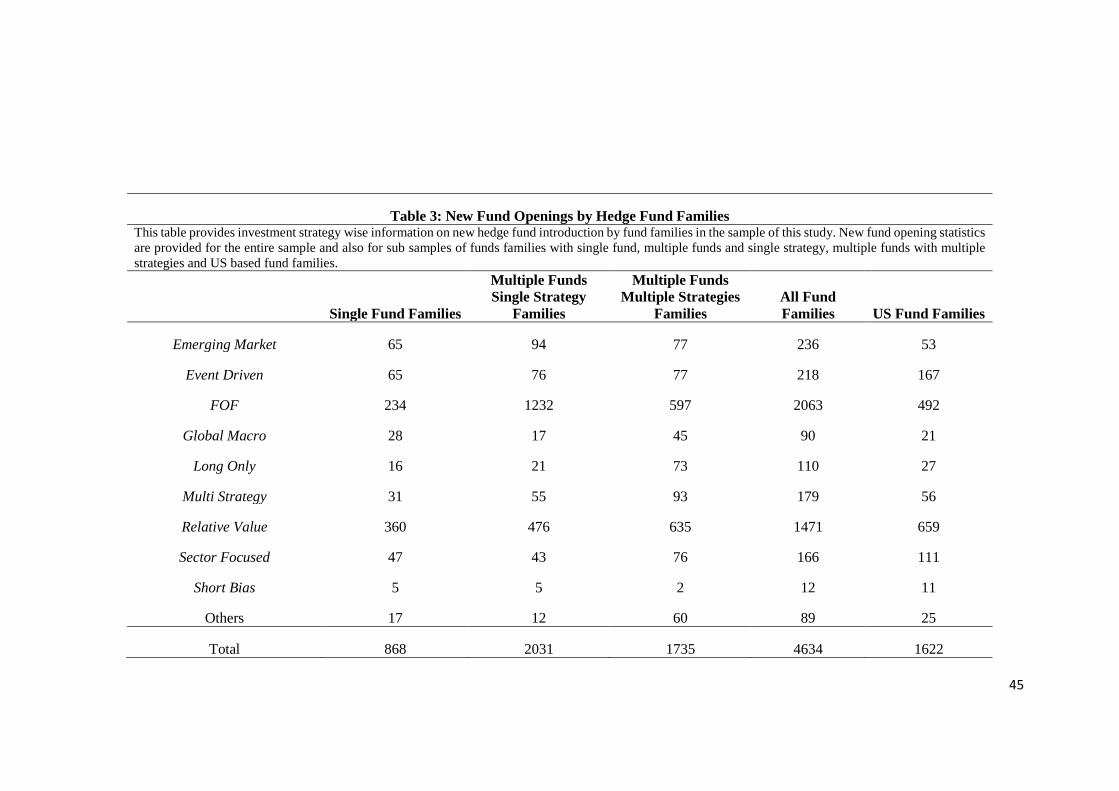
Table 3: New Fund Openings by Hedge Fund Families This table provides investment strategy wise information on new hedge fund introduction by fund families in the sample of this study. New fund opening statistics are provided for the entire sample and also for sub samples of funds families with single fund, multiple funds and single strategy, multiple funds with multiple strategies and US based fund families.
Single Fund Families
Multiple Funds Single Strategy
Families
Multiple Funds Multiple Strategies
Families All Fund Families US Fund Families
Emerging Market 65 94 77 236 53
Event Driven 65 76 77 218 167
FOF 234 1232 597 2063 492
Global Macro 28 17 45 90 21
Long Only 16 21 73 110 27
Multi Strategy 31 55 93 179 56
Relative Value 360 476 635 1471 659
Sector Focused 47 43 76 166 111
Short Bias 5 5 2 12 11
Others 17 12 60 89 25
Total 868 2031 1735 4634 1622
45
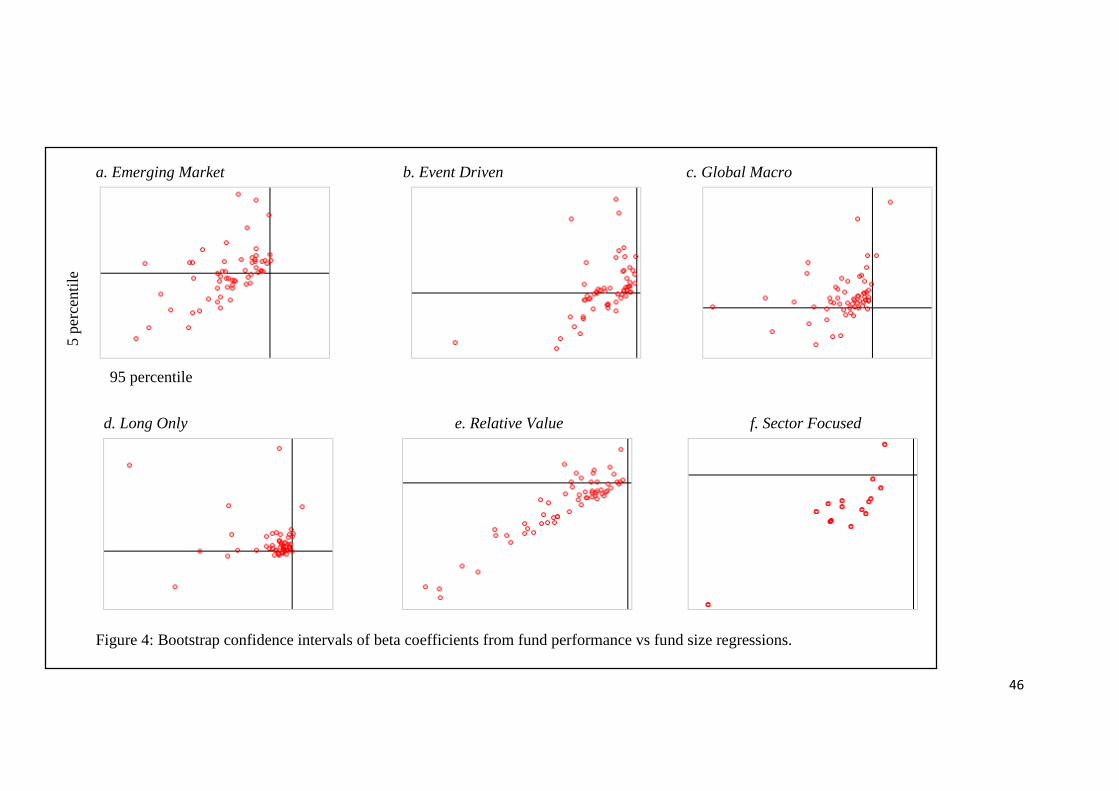
a. Emerging Market b. Event Driven c. Global Macro
d. Long Only e. Relative Value f. Sector Focused
Figure 4: Bootstrap confidence intervals of beta coefficients from fund performance vs fund size regressions.
5 pe
rcen
tile
95 percentile
46
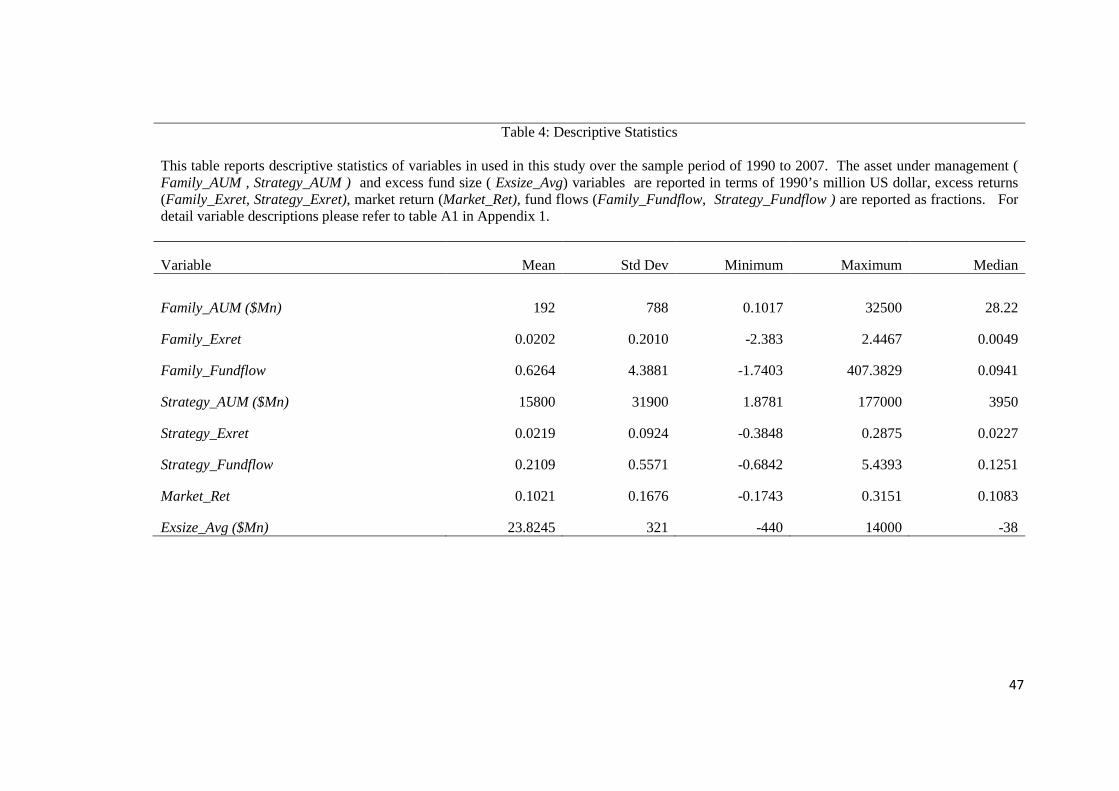
Table 4: Descriptive Statistics
This table reports descriptive statistics of variables in used in this study over the sample period of 1990 to 2007. The asset under management ( Family_AUM , Strategy_AUM ) and excess fund size ( Exsize_Avg) variables are reported in terms of 1990’s million US dollar, excess returns (Family_Exret, Strategy_Exret), market return (Market_Ret), fund flows (Family_Fundflow, Strategy_Fundflow ) are reported as fractions. For detail variable descriptions please refer to table A1 in Appendix 1.
Variable Mean Std Dev Minimum Maximum Median
Family_AUM ($Mn) 192 788 0.1017 32500 28.22
Family_Exret 0.0202 0.2010 -2.383 2.4467 0.0049
Family_Fundflow 0.6264 4.3881 -1.7403 407.3829 0.0941
Strategy_AUM ($Mn) 15800 31900 1.8781 177000 3950
Strategy_Exret 0.0219 0.0924 -0.3848 0.2875 0.0227
Strategy_Fundflow 0.2109 0.5571 -0.6842 5.4393 0.1251
Market_Ret 0.1021 0.1676 -0.1743 0.3151 0.1083
Exsize_Avg ($Mn) 23.8245 321 -440 14000 -38
47
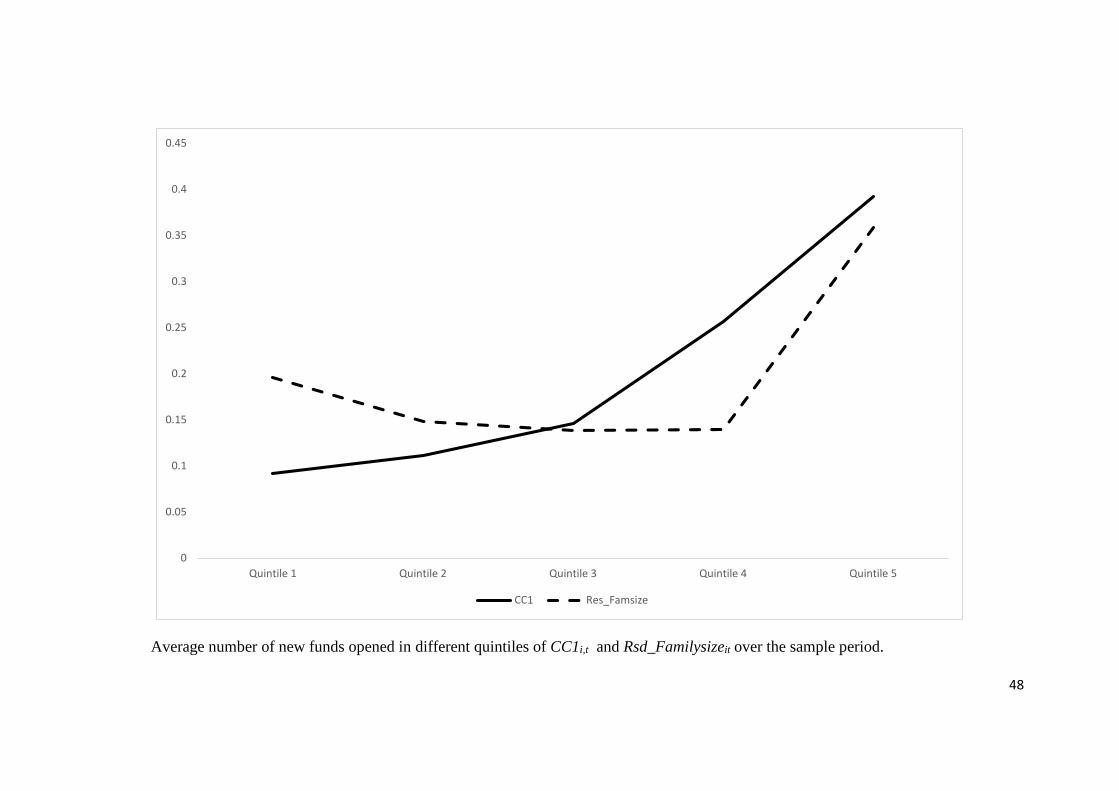
Average number of new funds opened in different quintiles of CC1i,t and Rsd_Familysizeit over the sample period.
0
0.05
0.1
0.15
0.2
0.25
0.3
0.35
0.4
0.45
Quintile 1 Quintile 2 Quintile 3 Quintile 4 Quintile 5
CC1 Res_Famsize
48
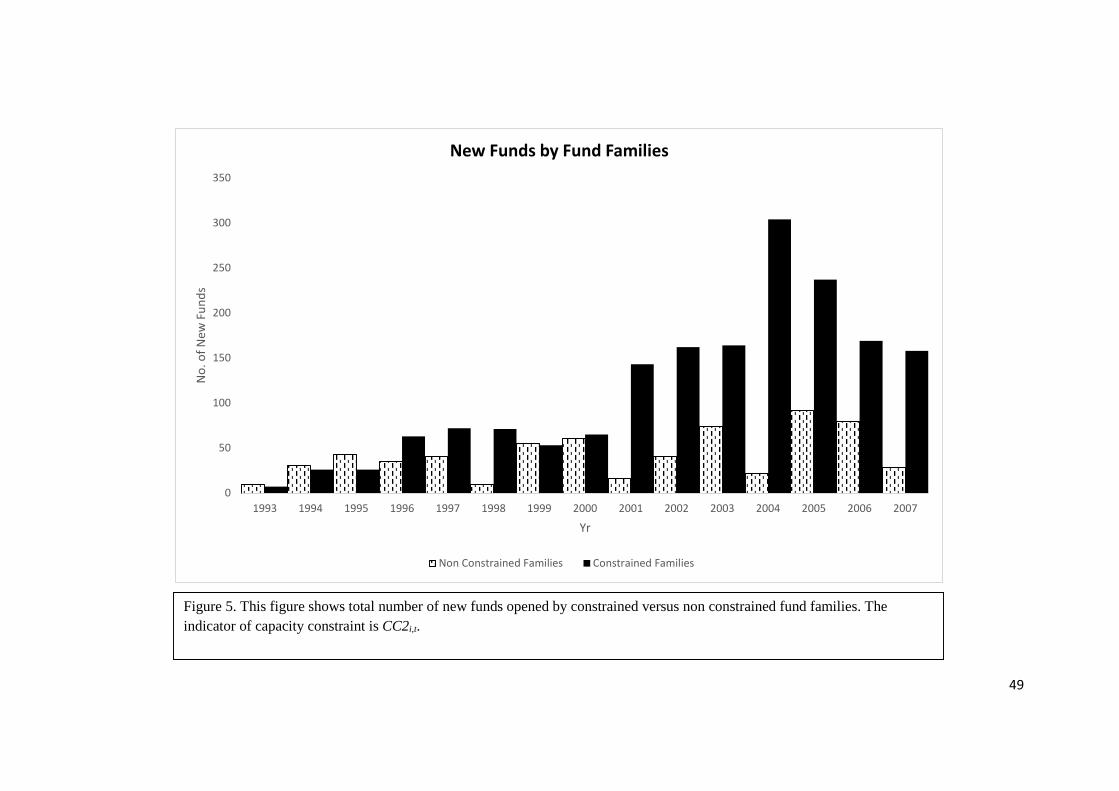
0
50
100
150
200
250
300
350
1993 1994 1995 1996 1997 1998 1999 2000 2001 2002 2003 2004 2005 2006 2007
No.
of N
ew F
unds
Yr
New Funds by Fund Families
Non Constrained Families Constrained Families
Figure 5. This figure shows total number of new funds opened by constrained versus non constrained fund families. The indicator of capacity constraint is CC2i,t.
49

Table 5 Propensity of New Fund Opening
This table reports estimated coefficients and robust standard errors from the Probit regression model described in Equation 7 of Section III. The sample of the study is drawn from hedge funds included in Barclay’s Global Hedge Fund database, over the sample period of 1990 to 2007. The dependent variable is a binary variable which reflects fund families’ decision to open new funds in any calendar year. The dependent variable takes the value 1 if fund families open a new hedge fund in a year, and it takes the value zero (0) otherwise. The proxies of fund families’ capacity constraints are CC1i,t and CC2i,t . The independent variables related to fund family are family’s past performance, fund flow and size i.e. Family_Exrett-1, Family_fundflowt-1, Rsd_Familysizei,t-1 respectively. The variables, High _Mgmt_Fee and High_Incentive_Fee respectively refer to dummy variables that identify the fund families charging management fees and incentive fees higher than industry median. Independent variables related to strategy class of the largest fund of the family are, natural logarithm of strategy category’s asset under management Strategy_Sizet-1, past excess return and fund flow to the strategy category i.e. Strategy_Exrett-1 and Strategy_Fundflowt-1 respectively. The dummy variable Leveragei identify use of leverage by the largest fund of the family. For detail description of variables please refer to Table A1 in Appendix 1. This table also provides the pseudo R2 s of the Probit models estimated. The standard errors are clustered by fund families. The 1%, 5% and 10% level of statistical significance of the coefficients are indicated using ***, ** and * respectively.
Estimate SE Estimate SE
CC1i,t-1 0.015*** 0.001
CC2i,t-1 0.193*** 0.046
Rsd_Familysizei,t-1 0.013*** 0.002 0.008*** 0.002
Family_Exreti,t-1 0.183** 0.093 0.107 0.095
Family_fundflowi,t-1 0.013** 0.006 0.015*** 0.005
High_Incentive_Feei 0.336*** 0.054 0.364*** 0.059
High _Mgmt_Feei 0.218*** 0.049 0.269*** 0.053 50
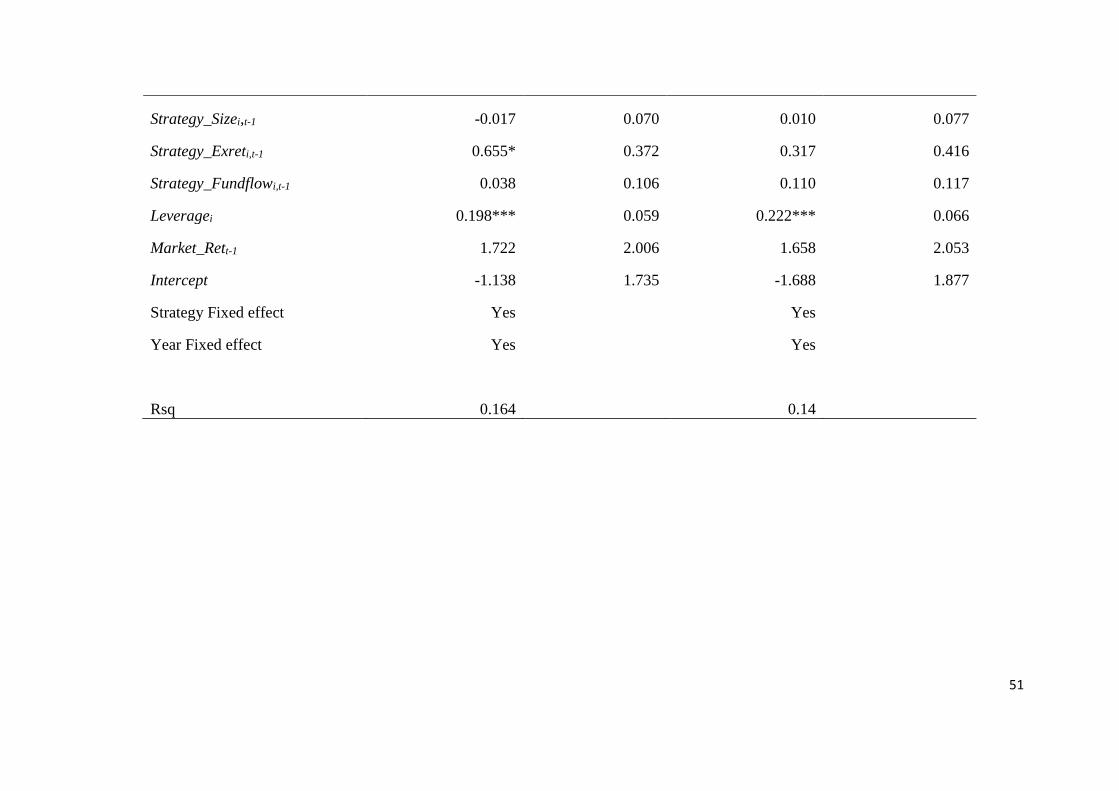
Strategy_Sizei,t-1 -0.017 0.070 0.010 0.077
Strategy_Exreti,t-1 0.655* 0.372 0.317 0.416
Strategy_Fundflowi,t-1 0.038 0.106 0.110 0.117
Leveragei 0.198*** 0.059 0.222*** 0.066
Market_Rett-1 1.722 2.006 1.658 2.053
Intercept -1.138 1.735 -1.688 1.877
Strategy Fixed effect Yes Yes
Year Fixed effect Yes Yes
Rsq 0.164 0.14
51

Table 6
Diversification Vs Specialisation This table reports estimated coefficients and robust standard errors from the Ordered Probit regression model described in Equation 8 of Section III. The dependent variable is an ordinal variable which reflects fund families’ decision to diversify or specialize while opening a new funds in any calendar year. The dependent variable takes the value 0 if fund families specialize, 1 if they partially diversify and 2 when they open the new fund in a strategy category different from the strategy of the largest fund of the family. The proxies of strategy level capacity constraints are SCC1i,t , SCC2i,t, (the excess fund size and boot strap regression based capacity constraint proxy for the strategy of the largest funds respectively), NSCC1i,t and NSCC2i,t (the excess fund size and boot strap regression based capacity constraint proxy for the strategy of the new funds respectively). The independent variables related to fund family are family’s past performance, fund flow and size i.e. (Family_Exret)t-1 , (Family_fundflow)t-1, Rsd_Familysizei,t respectively. Other independent variables are past excess return and fund flow to the strategy category of the largest fund and natural logarithm of the asset under management and past performance of the strategy category of the new fund i.e. Strategy_Exrett-1, Strategy_Fundflowt-
1, NStrategy_Sizet-1 and NStrategy_Exrett-1 respectively. The variable Market_Rett-1 refers to past performance of MSCI Hedge Fund Index. For detail description of variables please refer to Table A1 in Appendix 1. This table also provides the pseudo R2 s of the Probit models estimated. The standard errors are clustered by fund families. The 1%, 5% and 10% level of statistical significance of the coefficients are indicated using ***, ** and * respectively.
Estimate SE Estimate SE
SCC1i,t 3.873* 2.328
SCC2i,t 0.633*** 0.163
NSCC1i,t -4.677*** 1.736
NSCC2i,t -0.286* 0.159
Rsd_Familysize_Avgt-1 0.011*** 0.003 0.011*** 0.003
(Family_Exret)t-1 -0.602*** 0.227 -0.525** 0.253
Strategy_Exrett-1 -0.234 1.347 -0.331 1.339
52
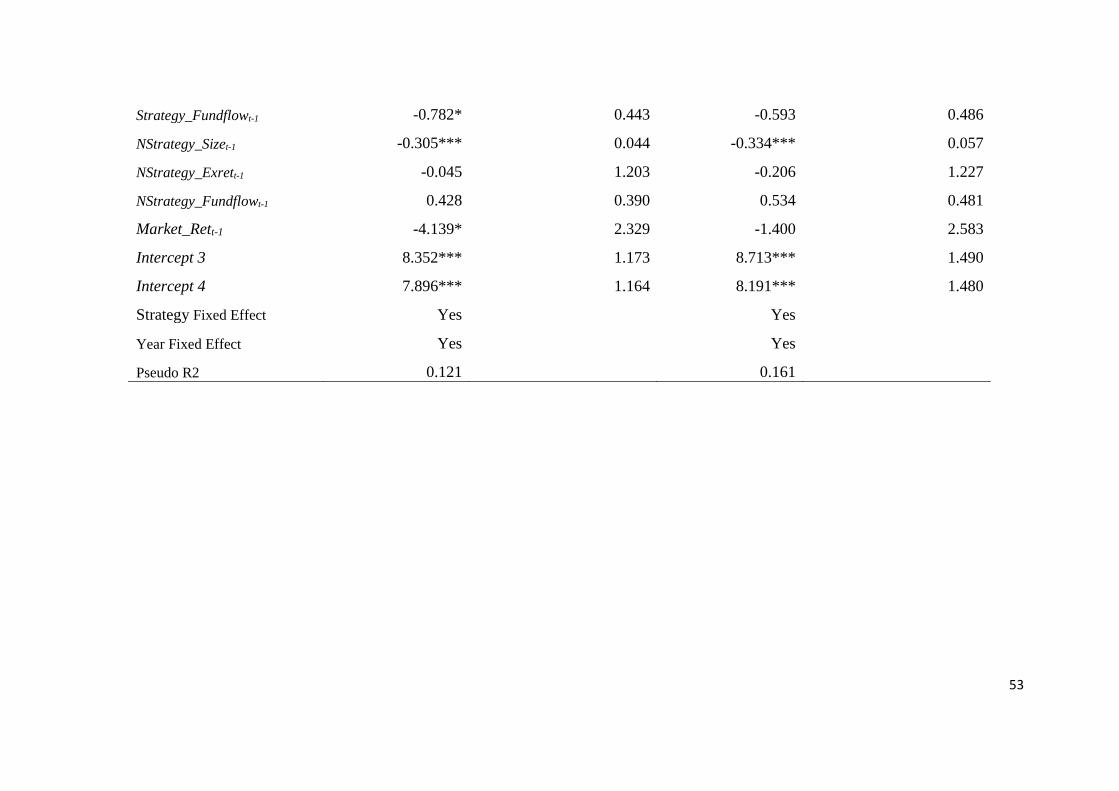
Strategy_Fundflowt-1 -0.782* 0.443 -0.593 0.486
NStrategy_Sizet-1 -0.305*** 0.044 -0.334*** 0.057
NStrategy_Exrett-1 -0.045 1.203 -0.206 1.227
NStrategy_Fundflowt-1 0.428 0.390 0.534 0.481
Market_Rett-1 -4.139* 2.329 -1.400 2.583
Intercept 3 8.352*** 1.173 8.713*** 1.490
Intercept 4 7.896*** 1.164 8.191*** 1.480
Strategy Fixed Effect Yes Yes
Year Fixed Effect Yes Yes
Pseudo R2 0.121 0.161
53
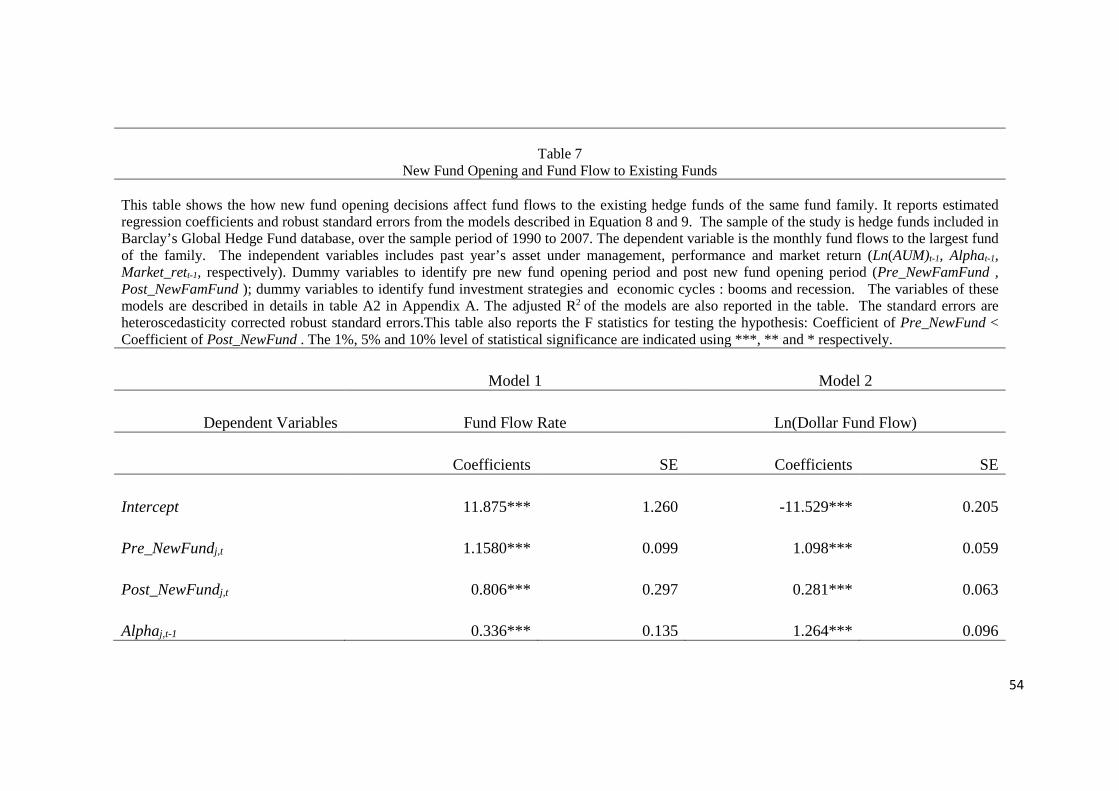
Table 7
New Fund Opening and Fund Flow to Existing Funds This table shows the how new fund opening decisions affect fund flows to the existing hedge funds of the same fund family. It reports estimated regression coefficients and robust standard errors from the models described in Equation 8 and 9. The sample of the study is hedge funds included in Barclay’s Global Hedge Fund database, over the sample period of 1990 to 2007. The dependent variable is the monthly fund flows to the largest fund of the family. The independent variables includes past year’s asset under management, performance and market return (Ln(AUM)t-1, Alphat-1, Market_rett-1, respectively). Dummy variables to identify pre new fund opening period and post new fund opening period (Pre_NewFamFund , Post_NewFamFund ); dummy variables to identify fund investment strategies and economic cycles : booms and recession. The variables of these models are described in details in table A2 in Appendix A. The adjusted R2 of the models are also reported in the table. The standard errors are heteroscedasticity corrected robust standard errors.This table also reports the F statistics for testing the hypothesis: Coefficient of Pre_NewFund < Coefficient of Post_NewFund . The 1%, 5% and 10% level of statistical significance are indicated using ***, ** and * respectively.
Model 1 Model 2
Dependent Variables Fund Flow Rate Ln(Dollar Fund Flow)
Coefficients SE Coefficients SE
Intercept 11.875*** 1.260 -11.529*** 0.205
Pre_NewFundj,t 1.1580*** 0.099 1.098*** 0.059
Post_NewFundj,t 0.806*** 0.297 0.281*** 0.063
Alphaj,t-1 0.336*** 0.135 1.264*** 0.096
54
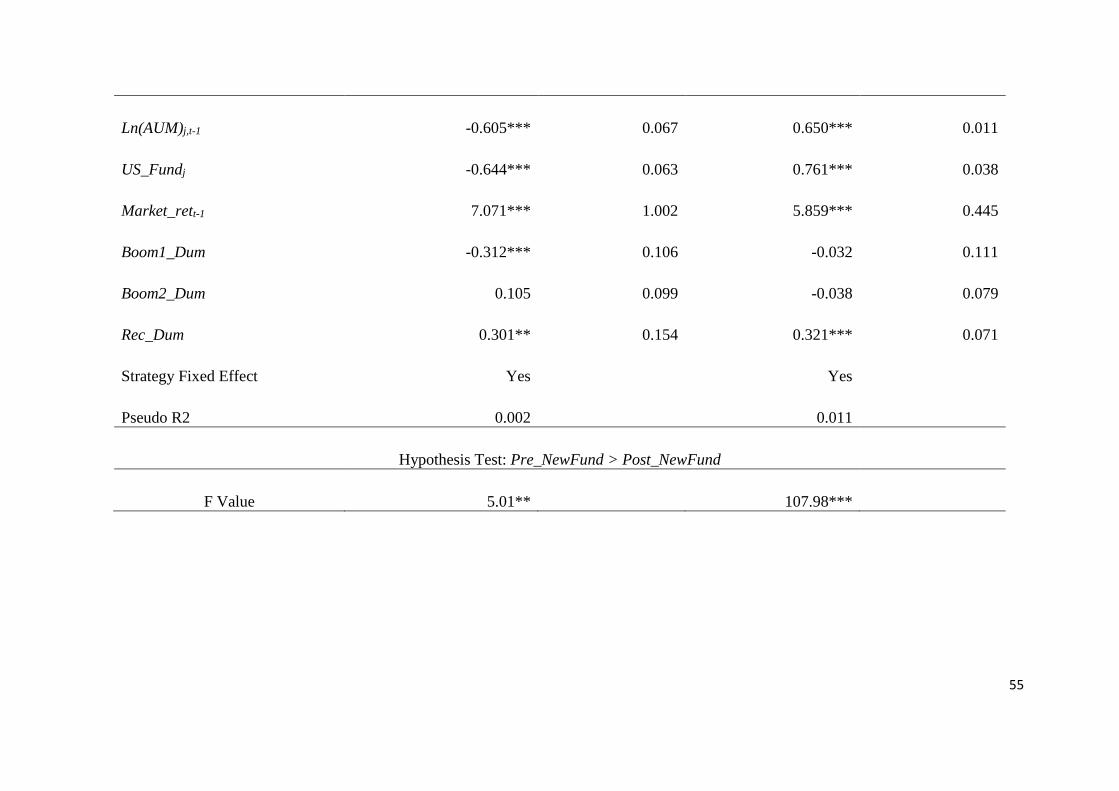
Ln(AUM)j,t-1 -0.605*** 0.067 0.650*** 0.011
US_Fundj -0.644*** 0.063 0.761*** 0.038
Market_rett-1 7.071*** 1.002 5.859*** 0.445
Boom1_Dum -0.312*** 0.106 -0.032 0.111
Boom2_Dum 0.105 0.099 -0.038 0.079
Rec_Dum 0.301** 0.154 0.321*** 0.071
Strategy Fixed Effect Yes Yes
Pseudo R2 0.002 0.011
Hypothesis Test: Pre_NewFund > Post_NewFund
F Value 5.01** 107.98***
55
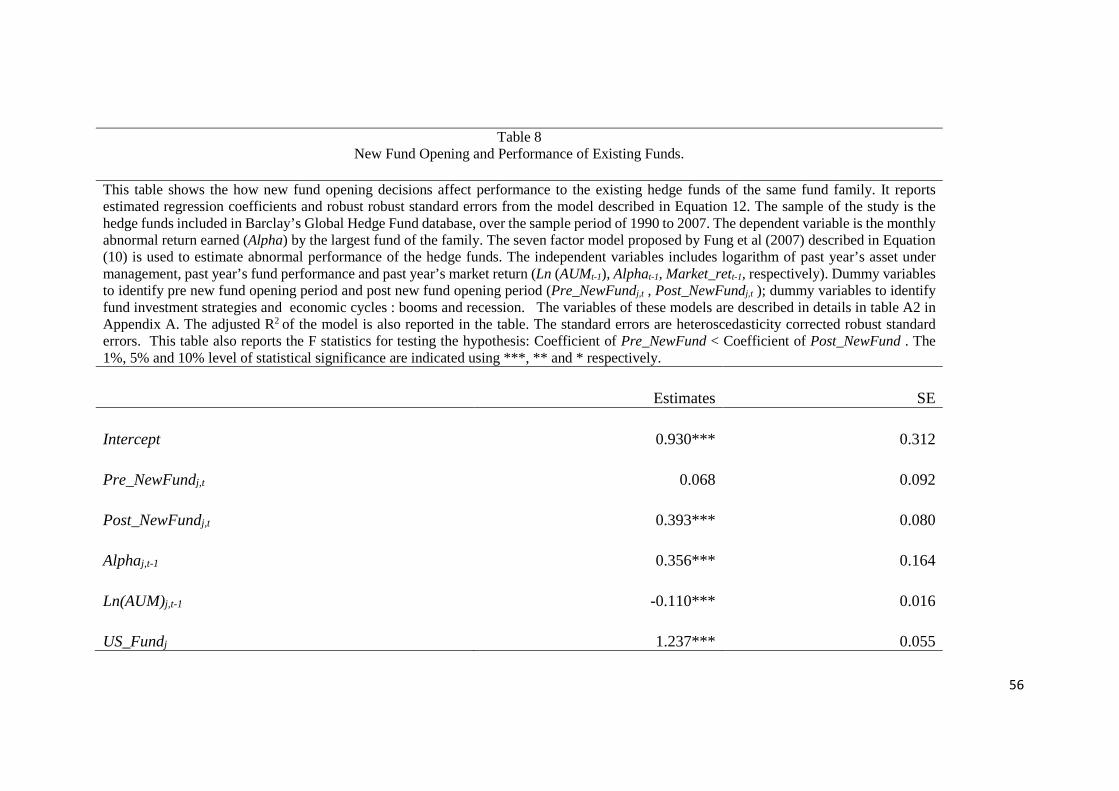
Table 8 New Fund Opening and Performance of Existing Funds.
This table shows the how new fund opening decisions affect performance to the existing hedge funds of the same fund family. It reports estimated regression coefficients and robust robust standard errors from the model described in Equation 12. The sample of the study is the hedge funds included in Barclay’s Global Hedge Fund database, over the sample period of 1990 to 2007. The dependent variable is the monthly abnormal return earned (Alpha) by the largest fund of the family. The seven factor model proposed by Fung et al (2007) described in Equation (10) is used to estimate abnormal performance of the hedge funds. The independent variables includes logarithm of past year’s asset under management, past year’s fund performance and past year’s market return (Ln (AUMt-1), Alphat-1, Market_rett-1, respectively). Dummy variables to identify pre new fund opening period and post new fund opening period (Pre_NewFundj,t , Post_NewFundj,t ); dummy variables to identify fund investment strategies and economic cycles : booms and recession. The variables of these models are described in details in table A2 in Appendix A. The adjusted R2 of the model is also reported in the table. The standard errors are heteroscedasticity corrected robust standard errors. This table also reports the F statistics for testing the hypothesis: Coefficient of Pre_NewFund < Coefficient of Post_NewFund . The 1%, 5% and 10% level of statistical significance are indicated using ***, ** and * respectively.
Estimates SE
Intercept 0.930*** 0.312
Pre_NewFundj,t 0.068 0.092
Post_NewFundj,t 0.393*** 0.080
Alphaj,t-1 0.356*** 0.164
Ln(AUM)j,t-1 -0.110*** 0.016
US_Fundj 1.237*** 0.055
56
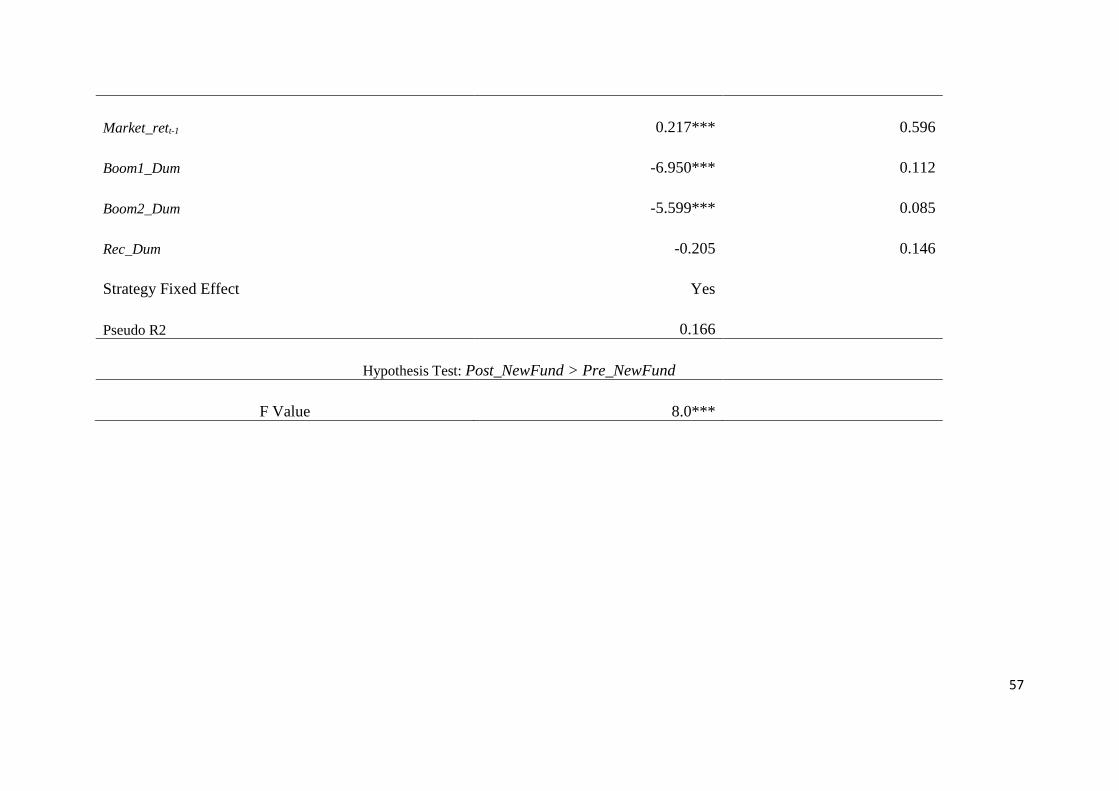
Market_rett-1 0.217*** 0.596
Boom1_Dum -6.950*** 0.112
Boom2_Dum -5.599*** 0.085
Rec_Dum -0.205 0.146
Strategy Fixed Effect Yes
Pseudo R2 0.166
Hypothesis Test: Post_NewFund > Pre_NewFund
F Value 8.0***
57
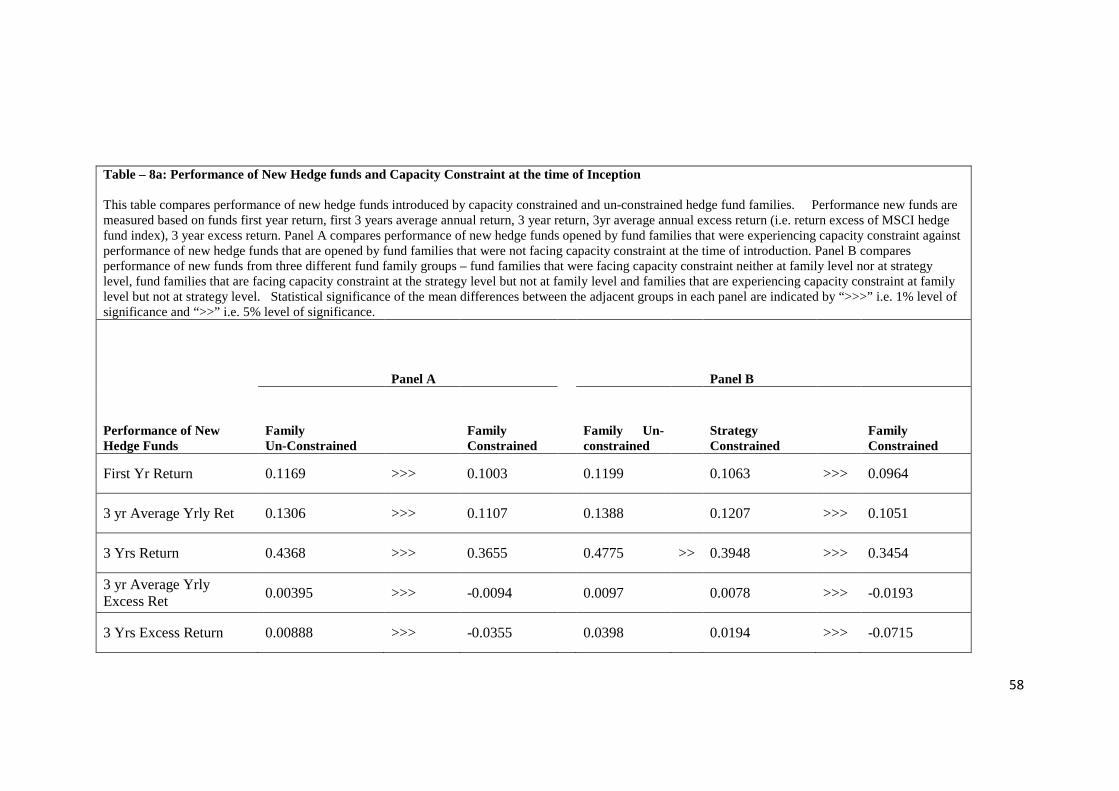
Table – 8a: Performance of New Hedge funds and Capacity Constraint at the time of Inception This table compares performance of new hedge funds introduced by capacity constrained and un-constrained hedge fund families. Performance new funds are measured based on funds first year return, first 3 years average annual return, 3 year return, 3yr average annual excess return (i.e. return excess of MSCI hedge fund index), 3 year excess return. Panel A compares performance of new hedge funds opened by fund families that were experiencing capacity constraint against performance of new hedge funds that are opened by fund families that were not facing capacity constraint at the time of introduction. Panel B compares performance of new funds from three different fund family groups – fund families that were facing capacity constraint neither at family level nor at strategy level, fund families that are facing capacity constraint at the strategy level but not at family level and families that are experiencing capacity constraint at family level but not at strategy level. Statistical significance of the mean differences between the adjacent groups in each panel are indicated by “>>>” i.e. 1% level of significance and “>>” i.e. 5% level of significance.
Panel A Panel B
Performance of New Hedge Funds
Family Un-Constrained
Family Constrained
Family Un- constrained
Strategy Constrained
Family Constrained
First Yr Return 0.1169 >>> 0.1003
0.1199 0.1063 >>> 0.0964
3 yr Average Yrly Ret 0.1306 >>> 0.1107
0.1388 0.1207 >>> 0.1051
3 Yrs Return 0.4368 >>> 0.3655
0.4775 >> 0.3948 >>> 0.3454
3 yr Average Yrly Excess Ret 0.00395 >>> -0.0094
0.0097 0.0078 >>> -0.0193
3 Yrs Excess Return 0.00888 >>> -0.0355
0.0398 0.0194 >>> -0.0715
58
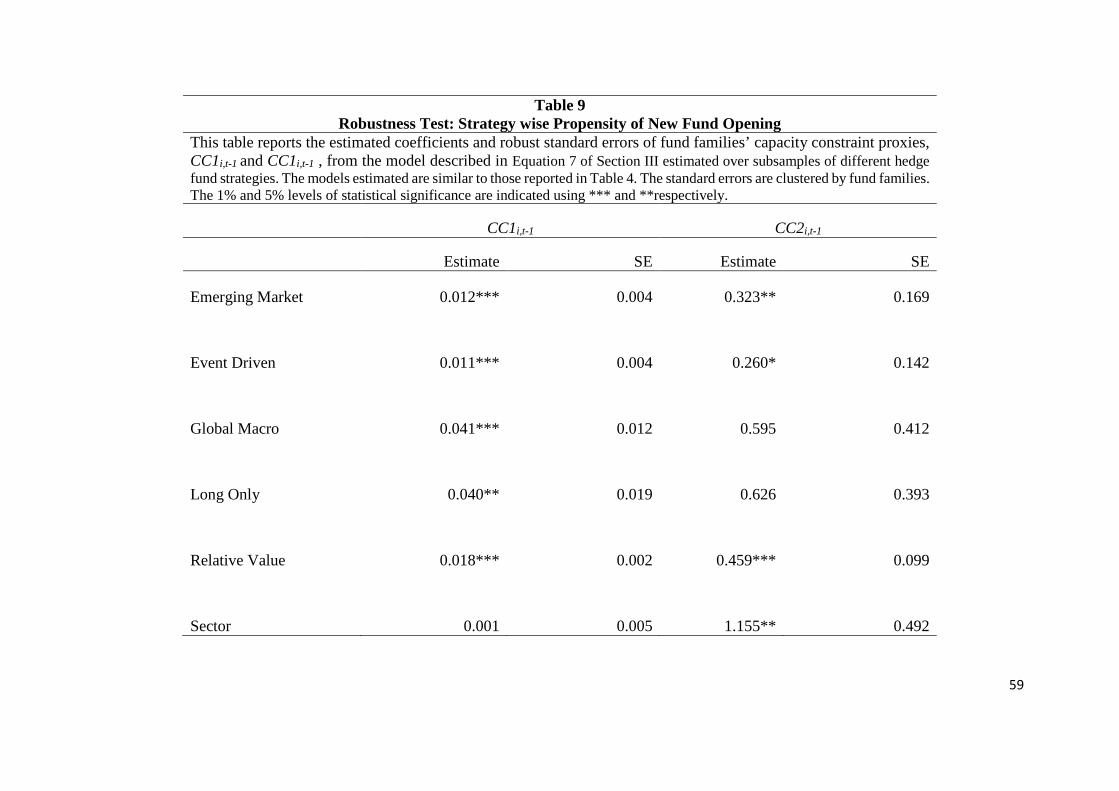
Table 9 Robustness Test: Strategy wise Propensity of New Fund Opening
This table reports the estimated coefficients and robust standard errors of fund families’ capacity constraint proxies, CC1i,t-1 and CC1i,t-1 , from the model described in Equation 7 of Section III estimated over subsamples of different hedge fund strategies. The models estimated are similar to those reported in Table 4. The standard errors are clustered by fund families. The 1% and 5% levels of statistical significance are indicated using *** and **respectively.
CC1i,t-1 CC2i,t-1
Estimate SE Estimate SE
Emerging Market 0.012*** 0.004 0.323** 0.169
Event Driven 0.011*** 0.004 0.260* 0.142
Global Macro 0.041*** 0.012 0.595 0.412
Long Only 0.040** 0.019 0.626 0.393
Relative Value 0.018*** 0.002 0.459*** 0.099
Sector 0.001 0.005 1.155** 0.492
59

60
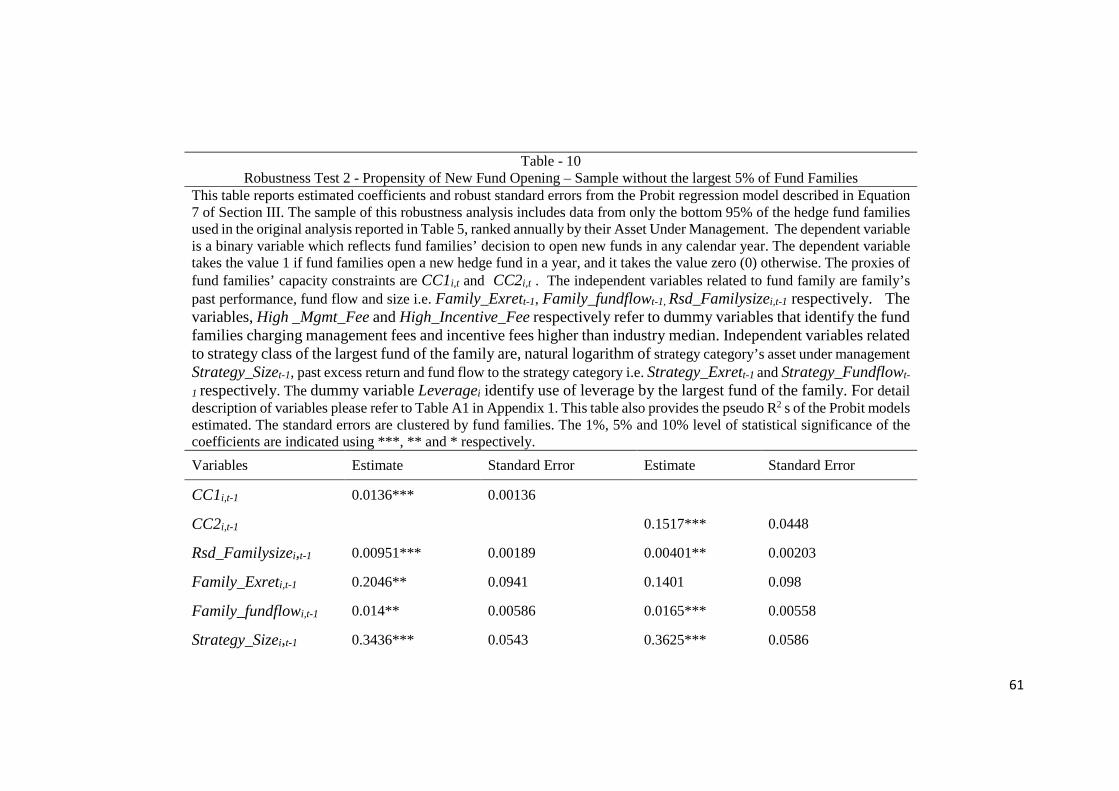
Table - 10 Robustness Test 2 - Propensity of New Fund Opening – Sample without the largest 5% of Fund Families
This table reports estimated coefficients and robust standard errors from the Probit regression model described in Equation 7 of Section III. The sample of this robustness analysis includes data from only the bottom 95% of the hedge fund families used in the original analysis reported in Table 5, ranked annually by their Asset Under Management. The dependent variable is a binary variable which reflects fund families’ decision to open new funds in any calendar year. The dependent variable takes the value 1 if fund families open a new hedge fund in a year, and it takes the value zero (0) otherwise. The proxies of fund families’ capacity constraints are CC1i,t and CC2i,t . The independent variables related to fund family are family’s past performance, fund flow and size i.e. Family_Exrett-1, Family_fundflowt-1, Rsd_Familysizei,t-1 respectively. The variables, High _Mgmt_Fee and High_Incentive_Fee respectively refer to dummy variables that identify the fund families charging management fees and incentive fees higher than industry median. Independent variables related to strategy class of the largest fund of the family are, natural logarithm of strategy category’s asset under management Strategy_Sizet-1, past excess return and fund flow to the strategy category i.e. Strategy_Exrett-1 and Strategy_Fundflowt-
1 respectively. The dummy variable Leveragei identify use of leverage by the largest fund of the family. For detail description of variables please refer to Table A1 in Appendix 1. This table also provides the pseudo R2 s of the Probit models estimated. The standard errors are clustered by fund families. The 1%, 5% and 10% level of statistical significance of the coefficients are indicated using ***, ** and * respectively. Variables Estimate Standard Error Estimate Standard Error
CC1i,t-1 0.0136*** 0.00136
CC2i,t-1 0.1517*** 0.0448
Rsd_Familysizei,t-1 0.00951*** 0.00189 0.00401** 0.00203
Family_Exreti,t-1 0.2046** 0.0941 0.1401 0.098
Family_fundflowi,t-1 0.014** 0.00586 0.0165*** 0.00558
Strategy_Sizei,t-1 0.3436*** 0.0543 0.3625*** 0.0586
61
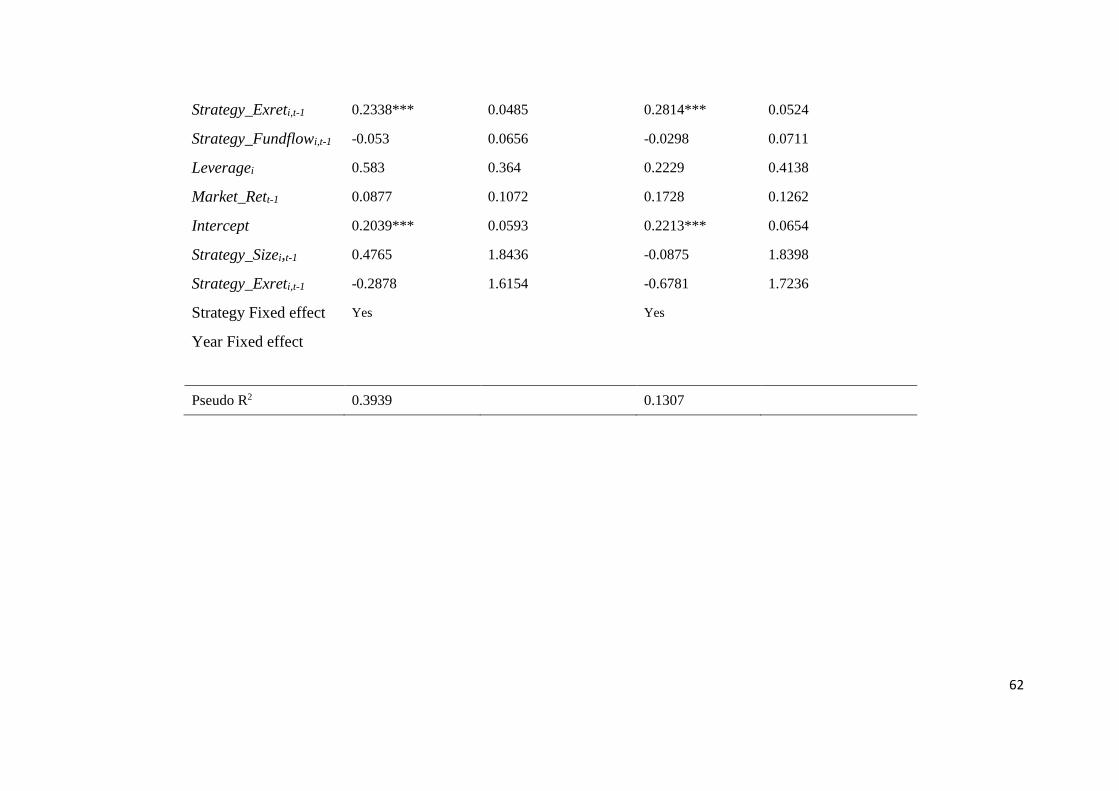
Strategy_Exreti,t-1 0.2338*** 0.0485 0.2814*** 0.0524
Strategy_Fundflowi,t-1 -0.053 0.0656 -0.0298 0.0711
Leveragei 0.583 0.364 0.2229 0.4138
Market_Rett-1 0.0877 0.1072 0.1728 0.1262
Intercept 0.2039*** 0.0593 0.2213*** 0.0654
Strategy_Sizei,t-1 0.4765 1.8436 -0.0875 1.8398
Strategy_Exreti,t-1 -0.2878 1.6154 -0.6781 1.7236
Strategy Fixed effect Yes Yes
Year Fixed effect
Pseudo R2 0.3939 0.1307
62
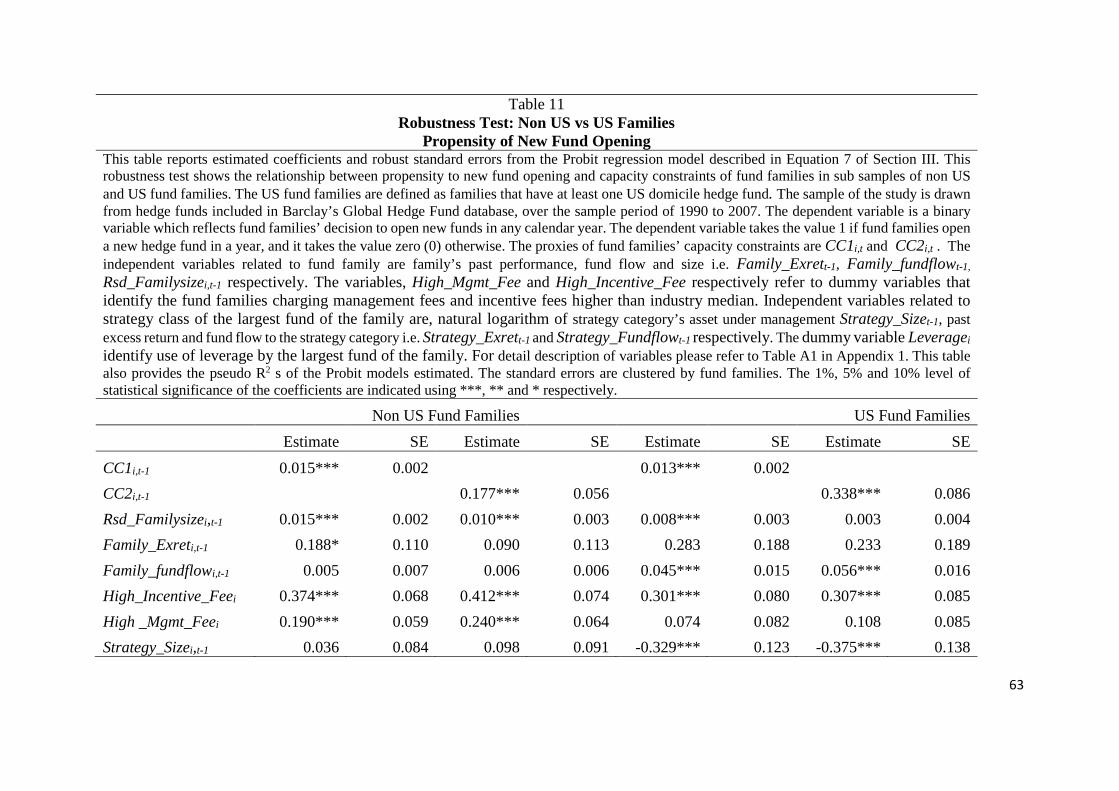
Table 11 Robustness Test: Non US vs US Families
Propensity of New Fund Opening This table reports estimated coefficients and robust standard errors from the Probit regression model described in Equation 7 of Section III. This robustness test shows the relationship between propensity to new fund opening and capacity constraints of fund families in sub samples of non US and US fund families. The US fund families are defined as families that have at least one US domicile hedge fund. The sample of the study is drawn from hedge funds included in Barclay’s Global Hedge Fund database, over the sample period of 1990 to 2007. The dependent variable is a binary variable which reflects fund families’ decision to open new funds in any calendar year. The dependent variable takes the value 1 if fund families open a new hedge fund in a year, and it takes the value zero (0) otherwise. The proxies of fund families’ capacity constraints are CC1i,t and CC2i,t . The independent variables related to fund family are family’s past performance, fund flow and size i.e. Family_Exrett-1, Family_fundflowt-1, Rsd_Familysizei,t-1 respectively. The variables, High_Mgmt_Fee and High_Incentive_Fee respectively refer to dummy variables that identify the fund families charging management fees and incentive fees higher than industry median. Independent variables related to strategy class of the largest fund of the family are, natural logarithm of strategy category’s asset under management Strategy_Sizet-1, past excess return and fund flow to the strategy category i.e. Strategy_Exrett-1 and Strategy_Fundflowt-1 respectively. The dummy variable Leveragei identify use of leverage by the largest fund of the family. For detail description of variables please refer to Table A1 in Appendix 1. This table also provides the pseudo R2 s of the Probit models estimated. The standard errors are clustered by fund families. The 1%, 5% and 10% level of statistical significance of the coefficients are indicated using ***, ** and * respectively.
Non US Fund Families US Fund Families Estimate SE Estimate SE Estimate SE Estimate SE
CC1i,t-1 0.015*** 0.002 0.013*** 0.002 CC2i,t-1 0.177*** 0.056 0.338*** 0.086 Rsd_Familysizei,t-1 0.015*** 0.002 0.010*** 0.003 0.008*** 0.003 0.003 0.004 Family_Exreti,t-1 0.188* 0.110 0.090 0.113 0.283 0.188 0.233 0.189 Family_fundflowi,t-1 0.005 0.007 0.006 0.006 0.045*** 0.015 0.056*** 0.016 High_Incentive_Feei 0.374*** 0.068 0.412*** 0.074 0.301*** 0.080 0.307*** 0.085 High _Mgmt_Feei 0.190*** 0.059 0.240*** 0.064 0.074 0.082 0.108 0.085 Strategy_Sizei,t-1 0.036 0.084 0.098 0.091 -0.329*** 0.123 -0.375*** 0.138
63
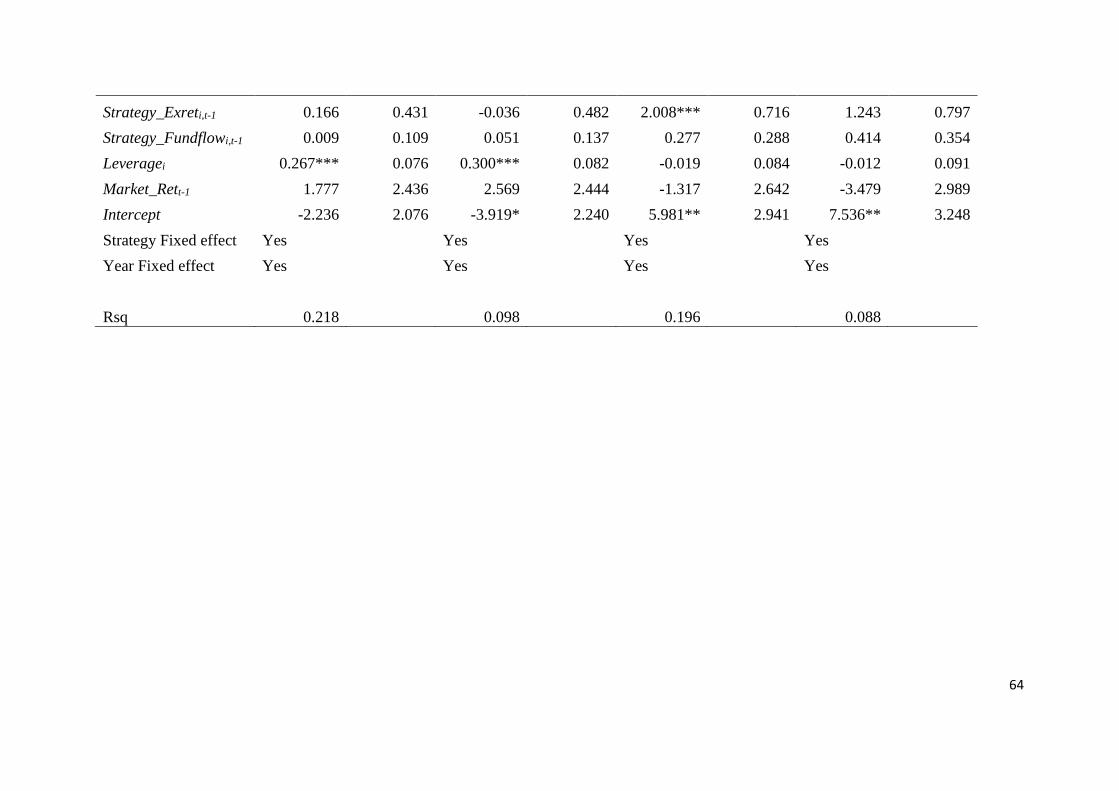
Strategy_Exreti,t-1 0.166 0.431 -0.036 0.482 2.008*** 0.716 1.243 0.797 Strategy_Fundflowi,t-1 0.009 0.109 0.051 0.137 0.277 0.288 0.414 0.354 Leveragei 0.267*** 0.076 0.300*** 0.082 -0.019 0.084 -0.012 0.091 Market_Rett-1 1.777 2.436 2.569 2.444 -1.317 2.642 -3.479 2.989 Intercept -2.236 2.076 -3.919* 2.240 5.981** 2.941 7.536** 3.248 Strategy Fixed effect Yes Yes Yes Yes Year Fixed effect Yes Yes Yes Yes
Rsq 0.218 0.098 0.196 0.088
64

65