Embed Size (px)
Citation preview

A National SurveyPublic Perceptions, Attitudes and Values on the Environment

AGENCY STATUS
The Environmental Protection Agency (EPA) is an independent public body established in July 1993 under the Environmental Protection Agency Act, 1992. Its sponsor in Government is the Department of the Environment, Heritage and Local Government.
The EPA is managed by a full time Executive Board consisting of a Director General and four Directors. Independence is assured through the selection procedures for the Director General and Directors and the freedom, as provided in the legislation, to act on its own initiative. The assignment, under the legislation, of direct responsibility for a wide range of functions underpins this independence. Under legislation, it is a specific offence to attempt to influence the Agency, or anyone acting on its behalf, in an improper manner.
The Agency is assisted by an Advisory Committee of twelve members, appointed by the Minister for the Environment, Heritage and Local Government.
RESPONSIBILITIES
The EPA has a wide range of statutory duties and powers under the Environmental Protection Act. In addition, the capacity of the EPA in relation to enforcement has been enhanced by powers contained in the Protection of the Environment Act 2003. The main responsibilities of the EPA include the following:
■ licensing large/complex industrial and other processes with significant polluting potential;
■ monitoring environmental quality, including the establishment of databases to which the public have access;
■ publishing periodic reports on the state of the environment;
■ promoting environmentally sound practices;
■ promoting and co-ordinating environmental research;
■ licensing all significant waste disposal and recovery activities, including landfills, and the preparation of a national hazardous waste management plan;
■ implementing a system of permitting for the control of VOC emissions resulting from the storage of significant quantities of petrol at terminals;
■ implementing and enforcing the GMO Regulations for the contained and deliberate release of GMOs into the environment;
■ preparing and implementing a national hydrometric programme;
■ drafting a National Allocation Plan for greenhouse gas emissions allowance trading; the establishment of a National Competent Authority for the issuing of trading permits and allowances to those covered by the scheme; the monitoring, overseeing and verification of emissions from participating companies; and the establishment of a National Emissions Trading Registry;
and, under the Office of Environmental Enforcement, established in 2003 and dedicated to the implementation and enforcement of environmental legislation in Ireland:
■ improving overall compliance with environmental protection legislation in Ireland;
■ raising awareness about the importance of enforcement of environmental protection legislation in Ireland;
■ enforcing IPPC licences and Waste licences issued by the EPA;
■ auditing and reporting on the performance of local authorities in the discharge of their environmental protection functions, including:
■ enforcement in respect of breaches of waste permits,
■ taking action in relation to illegal dumping,
■ implementation of waste collection permits, and
■ enforcement of producer responsibility initiatives (for example, in the area of packaging waste);
■ taking action against local authorities that are not discharging their environmental protection functions in an adequate manner;
■ prosecuting, or assisting local authorities to prosecute, significant breaches of environmental protection legislation, in a timely manner; and
■ assisting local authorities to improve their environmental protection performance on a case by case basis, through the establishment of an enforcement network to promote information exchange and best practice, and by the provision of appropriate guidance.
Environmental Protection Agency

Public Perceptions, Attitudes and Values on the Environment - A National Survey
Strategic Policy Research Unit
ENVIRONMENTAL PROTECTION AGENCYAn Ghníomhaireacht um Chaomhnú Comhsaoil
PO Box 3000, Johnstown Castle, Co. Wexford, Ireland
Telephone: +353 53 916 0600 Fax: +353 53 916 0699
Email: [email protected] Website: www.epa.ie
Lo Call 1890 33 55 99

© Environmental Protection Agency 2006
Although every effort has been made to ensure the accuracy of the material contained in this
publication, complete accuracy cannot be guaranteed. Neither the Environmental Protection
Agency nor the author accepts any responsibility whatsoever for loss or damage occasioned,
or claimed to have been occasioned, in part or in full as a consequence of any person acting or
refraining from acting, as a result of a matter contained in this publication. All or part of this
publication may be reproduced without further permission, provided the source is acknowledged.
Public Perceptions, Attitudes and Values on the Environment - A National Survey
Published by the Environmental Protection Agency, Ireland
ISBN: 1-84095-187-7 04/06/300
Price: €10

Public Perceptions, Attitudes and Values on the Environment A National Survey 3
1. Introduction ............................................................................................................................................. 4
Research Methodology .......................................................................................................................... 4
Key Findings ............................................................................................................................................... 5
2. Methodology ............................................................................................................................................. 6
3. General Environmental Awareness .............................................................................................. 7
Hazardous Waste ...................................................................................................................................... 8
4. Householders’ Waste Management Practices ........................................................................ 9
Household Waste Management Activities .................................................................................... 9
Summary .....................................................................................................................................................11
5. Drinking Water - Householders’ Perspective .......................................................................13
Drinking Water Customers .................................................................................................................13
Quality of Service ...................................................................................................................................14
The Water that Households drink ...................................................................................................15
Drinking Water Monitoring ................................................................................................................17
Summary .....................................................................................................................................................17
6. Water Quality in Recreational Water Bodies .......................................................................18
Amenity Use of Water Bodies ..........................................................................................................18
Public’s Rating of Water Quality at Local Sites .......................................................................18
Summary .....................................................................................................................................................19
7. The Value of a clean Environment .............................................................................................20
Methodology .............................................................................................................................................20
Environmental Protection Services ................................................................................................20
Level of Concern - Illegal Waste Activity ...................................................................................21
Demand for Greater Environmental Enforcement ...................................................................22
Who Should Pay? ....................................................................................................................................22
The Value of a Clean Environment .................................................................................................23
Summary .....................................................................................................................................................24
Contents

Public Perceptions, Attitudes and Values on the Environment A National Survey 4
1. Introduction
This work was commissioned by the EPA to investigate a range of environmental matters in
relation to the household sector. Both new information on household waste management
practices and information on householders’ experiences with environment-related services were
collected for the purpose of improving our understanding of householders experiences and
attitudes and also to better inform public policy.
The purpose of this survey research project included
n To collect information on public attitudes to the environment
n To value aspects of environmental protection
n To provide information on experiences with drinking water
n To provide information on household waste management practices
The research focuses on providing new information across a range of environmental issues
related to EPA work. The research focused on the household sector and provides a better
understanding of the household sector’s practices and attitudes to environment related issues,
information that can inform the development of environmental policy.
Research Methodology
The research project was undertaken with the assistance of a consultant survey research
company, Milliard Brown IMS, to help in the preparation of the questionnaire and administer
the survey. Data analysis and reporting were undertaken within the EPA.
The research strategy was to address a range of topics (e.g. littering, attitudes, waste management
practices, drinking water, etc) but given the budget constraints and surveying guidelines it was
not feasible to undertake in-depth research on each of the topics addressed. Accordingly, while
the analysis provides new insights it also raises many unresolved questions.

Public Perceptions, Attitudes and Values on the Environment A National Survey 5
Key Findings
n Almost half of Irish adults consider waste management the most important environmental
issue facing Ireland today.
n One-in-ten adults admitted to burning their household waste, while 15% believe backyard
burning of household waste is acceptable.
n 1% of adults admitted to illegally dumping their household waste.
n Many householders are dissatisfi ed with the quality of their drinking water supply
encountering problems with taste, odour, discolouration, and contamination, often on a
continuous basis.
n Only half of households drink tap water without any further fi ltration/purifi cation system.
One fi fth of households rely on bottled water within their homes.
n Just 5% of adults rely on either the EPA or local authorities for information on the quality
of surface waters. The majority of people primarily assess surface water quality by visual
inspection.
n The adult population strongly favours increasing the level of environmental protection
through recruitment of additional enforcement staff, viewing additional expenditures on
enforcement in the range €235-320 million worthwhile and value for money.
The remainder of this report provides more detailed information on these key fi ndings plus
information on a range of other issues examined in the survey.

Public Perceptions, Attitudes and Values on the Environment A National Survey 6
2. Methodology
The relevant information was collected by a survey of the adult population, which was
conducted in May-June 2005. Professional survey/market research company Milliard Brown IMS
administered the survey on behalf of the EPA. Milliard Brown IMS also contributed to the
questionnaire design and conducted two short pilot surveys to assist in the development of the
fi nalised questionnaire.
Survey interviews were conducted by telephone. Milliard Brown IMS undertook the sampling
for the survey and used a random digit dialling procedure and a survey quota system on key
characteristics (region, gender, age and social class) to ensure a representative sample of the
adult population was surveyed. In total 1,500 adults were interviewed from an initial effective
total sample of almost 5,500 telephone numbers giving a response rate of just over 27%. All
age and gender categories are well represented in the interviewed sample though females and
older age cohorts are slightly overrepresented compared to the census statistics.
Table 2.1: Survey Statistics
No. %
Effective Total Sample 5,495 100%
Refusal on Principal 1,978 36%
Refusal - Busy, etc 1,818 33%
Terminated interview 50 9%
Barriers to conducting interview (e.g. age, language) 149 2.7%
Successful 1,500 27.3%
Table 2.2: Adults Surveyed in comparison to actual adult population
Age (Years) Survey Sample (%) Census 2002 (%)
18-24 10 18.0
25-64 73 67.1
65+ 17 14.8
Total 100 100
Gender
Male 42 49.1
Female 58 50.9

Public Perceptions, Attitudes and Values on the Environment A National Survey 7
3. General Environmental Awareness
To gauge the level of public concern for the different environmental problems that we face today
respondents were initially asked what they believed was the most important environmental issue
facing Ireland today. The responses are represented in the fi gure below. What is most striking
is that the majority of adults, 56%, consider that waste management is the most important
environmental issue facing Ireland today. This high level of concern obviously refl ects the
public's concern from the surge in illegal dumping in recent years, the rising cost of household
waste collection, and diffi culties with planning for waste management infrastructure. Other
pressing environment problems, such as those relating to water and air pollution, do not
generate nearly the same level of public concern.
Other
Air Quality
GlobalWarming
Factory Emissions
Sellafield
Cars/Traffic
Roads
Water Pollution
Agriculture
Planning & Green Spaces
Waste Management
Issues
56%
9%
8%4%
6%2%
3%
4%
6%
1%
1%
Waste, LitterRecyclingIllegal DumpingLandfillsIncinerationBin Charges
Figure 3.1: The most important environmental issued facing Ireland today

Public Perceptions, Attitudes and Values on the Environment A National Survey 8
Table 3.1: Proportion that deem certain household products as hazardous on disposal
%
Car batteries .......................................................................................................................................................... 98
Appliance batteries ............................................................................................................................................ 89
Varnish ..................................................................................................................................................................... 86
Water based emulsion paint .......................................................................................................................... 47
Cooking oil ............................................................................................................................................................. 63
Bleach ...................................................................................................................................................................... 86
Motor oil from cars ............................................................................................................................................ 96
Weed killer & pesticides .................................................................................................................................. 96
Prescription medicines ..................................................................................................................................... 88
Fridges ...................................................................................................................................................................... 93
Hazardous Waste
Hazardous waste poses a major problem for waste management. Many of the most hazardous
wastes are concentrated at a few sources, which facilitate regulatory management and control.
However, hazardous waste contained within the household waste stream poses special logistical
problems for waste management. The survey was used to gauge the household sector's ability
to identify potentially hazardous wastes within the household and the results indicate that
people are generally very good at identifying wastes that potentially involve special disposal
procedures, or may in fact be hazardous waste.
The survey asked whether respondents deemed the waste from common household items to be
hazardous. Items such as water based emulsion paint is not hazardous and therefore does not
require special disposal, however, many of the items listed above are either hazardous or merit
careful management at disposal, e.g. fridges. It is reassuring that the public is quite profi cient
at identifying items that require special management at disposal.

Public Perceptions, Attitudes and Values on the Environment A National Survey 9
4. Householders’ Waste Management Practices
The most comprehensive statistics on household waste management come from the EPA’s National
Waste Reports. The latest statistics for 2004 show that the public generates 430kg of household
waste per person, which is unsustainably high. The report also shows that households have
been continually improving their recycling performance. Household waste stream recycling
stood at 4.3% in 1995, had risen to 5.6% by 2001, and stood at 19.5% in 2004. What the
National Waste Database does not report is the proportion of households that engage in good
and bad waste management activities; this chapter sheds some light on this.
Household Waste Management Activities
Though the survey elicited information on interviewees’ personal waste management activities,
because of the collective nature of household waste management activity, the responses refl ect
the entire household’s behaviour.
Recycling:
The survey found that most adults (96%) now recycle, though it does not tell how much people
recycle. However, the fact that nearly all adults undertake some recycling is an important base
upon which to further increase total national household waste recycling rate of 19.5%.
Composting:
Over half of adults say they compost either food or gardening waste. In many cases the
composting only involves garden waste (e.g. grass and hedge clippings); for others it will
include municipal waste composting via ‘brown’ waste collection. These issues aside, that half
of all adults engage in some type of composting activity is a good base upon which to increase
the level of home composting.
Illegal Waste Activities:
Households’ behaviour with respect to illegal waste activities is less than satisfactory. Survey
interviewees were asked whether they engaged in various illegal activities, such as burning
household waste, with the responses interpreted as underestimates of the full extent of the
illegal activity because the statistics represent only people that actually admit engaging in
the illegal activity.
Prior to reporting statistics it is important to put the fi gures in context. Nationally, 23% of
households are not served by a waste collection service and it is estimated that ‘uncollected’
household waste totals some 227,000 tonnes. Not all of these households can be assumed
to dispose of their waste in an unauthorised manner, as some households without service
personally transport waste to landfi lls.

Public Perceptions, Attitudes and Values on the Environment A National Survey 10
Burning Household Waste:
Backyard burning possibly accounts for the greatest proportion of illegal disposal of household
waste. The EPA survey found that 1-in-10 adults admitted to burning household waste though
the actual fi gure is likely to be higher. Most adults (80%) are aware that backyard burning
has environmental and health risks, with half specifi cally aware that backyard burning is
the greatest source of dioxins in Ireland. Twenty-seven local authorities have indicated that
backyard burning is a signifi cant problem in their functional area.
Backyard burning is a greater problem in less densely populated areas with 15% of rural dwellers
and 11% of village dwellers burning their household rubbish. The problem also exits in urban areas
though to a much lesser extent with approximately 1-in-25 burning their household rubbish.
Two issues that are especially worrying in the context of backyard burning is that 15% of
adults believe backyard burning is an acceptable method of waste disposal; and half of those
that admitted to burning did so in the knowledge of the public health implications due to the
associated release of dioxins. Therefore, while the greater majority accept that backyard burning
is both unacceptable and unsafe, a signifi cant minority still persist in the activity. Public
education and awareness campaigns are unlikely to be suffi cient to improve circumstances
considerably.
Figure 4.1: Backyard burning by dwelling location
0
4
8
12
16
20
RuralVillageTownSurburbiaCity
15%
11%
7%
4%4%

Public Perceptions, Attitudes and Values on the Environment A National Survey 11
Illegal dumping/fly tipping:
Like backyard burning, fl y tipping is a serious problem. The survey found that 1% of adults
admitted to dumping household waste. As dumping is considered less socially acceptable than
burning it is likely that 1% signifi cantly underestimates the actual number of people engaging
in this activity. Casual observance would also suggest that fl y tipping is a major problem.
Illegal use of street bins:
The dramatic increase in waste collection charges in recent years has been one of the
contributory factors for the increase in illegal waste disposal activities that exist at present.
Disposal of household waste in public waste paper bins is one consequence that, while not
conspicuous, appears now to be relatively common occurrence. About 5% of adults admit to
disposing household waste in business skips or public litter bins.
Hazardous Liquids Disposal:
Another inconspicuous illegal waste activity is the disposal of waste household liquids, such as
oils, paints, or chemicals into sewers and rainwater drains. About 2% of adults admitted to such
activity. The disposal of waste liquids of this nature, some of which are potentially hazardous,
can cause damage to water courses and also impact on the effi cient operation of wastewater
treatment facilities.
Summary
As a nation we have made dramatic improvements in environmentally conscious household
waste disposal. Recycling has increased from very low levels to a current situation where 19.5%
of household waste is recycled and 96% of adults claim to undertake some recycling activities.
Home composting has also increased considerably in recent years.
However, on the negative side the level of household waste generation is high and unsustainable.
At present almost 430kg of household waste is generated per person with just 19.5% recycled.
The rest is either landfi lled or disposed of illegally. A substantial minority of people admit to
illegally disposing their waste and it is unlikely that awareness campaigns will dissuade all of
them from such activities, especially when we know that many of the people burning household
waste are aware of the harmful environmental and health consequences.

Public Perceptions, Attitudes and Values on the Environment A National Survey 12
Table 4.1: Proportion of adults engaging in various waste management practices
Activity % of adults*
Compost food/garden waste 54
Purchase more environment sensitive products 65
Recycle 96
Dispose Household Waste in skips and public bins 5
Dump waste illegally 1
Dispose Hazardous waste in drains/sewers 2
Burn household rubbish 9
Table 4.2: Attitudes to Backyard Burning
% of adults
Backyard burning acceptable 15
Table 4.3: Perceived Dangers associated with Backyard Burning
% of adults*
Fire risk 47
Human health risk - breathing etc 57
Environment health risk - incl. Dioxins 82
Upset neighbours 2
* Percentages sum to greater than 100 as respondents indicated multiple reasons.

Public Perceptions, Attitudes and Values on the Environment A National Survey 13
While the EPA report on drinking water quality for 2003 concluded that the quality of drinking
water in Ireland is generally satisfactory with an overall compliance with standards of 96.1%,
the EPA’s survey fi nds that customer satisfaction levels are not so high.
Drinking Water Customers
The distribution of adults by drinking water source (e.g. public, group, private well) interviewed
in the EPA survey broadly matches the actual distribution of drinking water supplies, which
enables us to use the survey results as an indication of drinking water customer satisfaction.
The EPA survey results conveys customer experience and satisfaction with drinking water
supplies whereas EPA reports on drinking water quality relate to compliance with drinking water
standards and not customer satisfaction.
5. Drinking Water - Householders’ Perspective
An estimated 1,700,000 m3 of drinking water is produced per day by public and group water
schemes. The supply of such a large volume of drinking water compliant with the drinking water
standards is a major challenge.
0
10
20
30
40
50
60
70
80
90
100 Not known
Private Well
Group Water Scheme
Local Authority Supply
SurveyEPA’s Drinking Water Report 2003
Figure 5.1: Source of Drinking Water Supply

Public Perceptions, Attitudes and Values on the Environment A National Survey 14
Quality of Service
In the survey people were asked whether they had experienced problems with their drinking
water supplies in the prior twelve months. Customer satisfaction varied substantially across
supply sources, with the people using private wells being the most satisfi ed.
Public water supplies encountered signifi cant problems with discolouration and sediment, with 30%
(40% for group schemes) claiming that they experience discoloured drinking water supplies. Roughly
15% of households with discoloured drinking water experienced the problem on a continuous basis.
Discolouration and sediment were also the most problematic issues for private well sources.
Problems with taste and odour are also common problems for households with public or group
scheme supplies. Approximately 20% of households experienced a bad odour and 30% a bad taste
from their public or group water supply in the previous 12 months. Almost half of households
with poor tasting drinking water experienced the problem on a continuous basis.
Approximately 8% of households claimed to have had bacterial contamination of their drinking
water in the prior 12 months. The 8% refers to households rather than water supplies with
roughly one quarter of these (i.e. 2%) said that the contamination was continuous.
Most of the problems encountered by households with their drinking water supplies are
manageable. However, a signifi cant minority of customers appear to receive a poor quality
service on a continuous basis. One quarter of all households claim to have experienced bad
tasting drinking water in the previous 12 months, with roughly half of these experiencing
the problem on an on-going basis. Others experienced problems with discolouration, poor
mains pressure, sediment and bacterial contamination on an on-going basis. While occasional
problems are to be expected poor service on regular basis is not satisfactory.
Source
Problem Private Well Group Water Local All Supplies Scheme Authority
Low Mains 8 35 33 29
Discolouration 16 40 30 29
Odour 6 20 18 16
Sediment 13 24 20 19
Hard 40 39 33 34
Bacteria 5 16 7 8
Taste 9 32 28 26
Table 5.1: Proportion of adults experiencing drinking water problems in previous 12 months, by water source (%)

Public Perceptions, Attitudes and Values on the Environment A National Survey 15
Table 5.2: Frequency of water problem arising during past 12 months, all supplies
% Frequency
Problem Only Isolated Incidents Arose Continuous Incidents Intermittently Problem or Occasionally
Low Mains 24 44 32
Discolouration 35 48 15
Odour 21 50 27
Sediment 27 40 32
Hard Water 7 12 79
Bacteria 36 31 23
Taste 15 37 46
The Water that Households Drink
Twenty-fi ve years ago bottled water was relatively uncommon in Ireland whereas in 2003 the
bottled water market stood at 119 million litres with prospects for continued strong growth.
Some of this bottled water is consumed in the home even though there is a free alternative
available: tap water. The survey was used to establish the extent to which bottled water is
consumed in the home and understand why tap water is avoided.
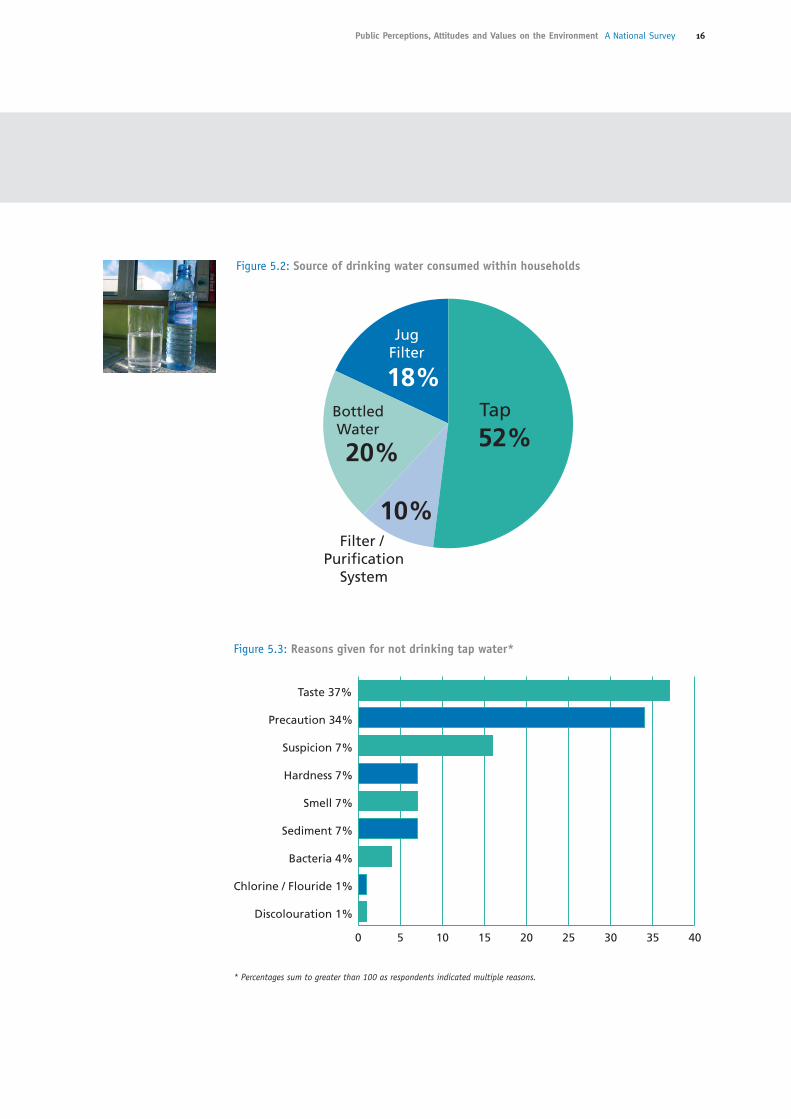
The survey results indicate that roughly half of adults drink tap water, almost 30% use fi lter and
purifi cation systems on their tap water, while 20% drink bottled water in their homes.
The most common reason why tap water is avoided is because of its taste. A further third
of adults do so for precautionary reasons, whereas 16% suspect that the water is actually
contaminated.
Households’ dissatisfaction with drinking water supplies is refl ected in the fact that they make
very large expenditures to avoid drinking unfi ltered tap water. The survey found that on average
such households spend €182 per annum on fi ltration systems or bottled water. When aggregated
to refl ect the number of households nationwide that spend money on providing drinking water
other than tap water in the home, the total national expenditure is estimated at €76 million
per annum.
Public Perceptions, Attitudes and Values on the Environment A National Survey 16
Figure 5.2: Source of drinking water consumed within households
Filter / Purification
System
BottledWater
JugFilter
Tap
52%
18%
20%
10%
Figure 5.3: Reasons given for not drinking tap water*
0 5 10 15 20 25 30 35 40
Discolouration 1%
Chlorine / Flouride 1%
Bacteria 4%
Sediment 7%
Smell 7%
Hardness 7%
Suspicion 7%
Precaution 34%
Taste 37%
* Percentages sum to greater than 100 as respondents indicated multiple reasons.

Public Perceptions, Attitudes and Values on the Environment A National Survey 17
Drinking Water Monitoring
One possible reason for the high level of distrust or suspicion of drinking water quality is a
lack of awareness by the public of the extensive drinking water quality monitoring programmes.
Nationwide, only 17% of adults were aware that their drinking water supply was monitored
in the previous 12 months and of those only half were aware of the results of the monitoring
analysis. An increased level of awareness of on-going water quality monitoring may help dispel
the high level of distrust of drinking water supplies, however, quality monitoring does not
specifi cally cover taste or odour.
Summary
In 2003 most drinking water supplies in Ireland were considered satisfactory and compliant
with the drinking water quality standards. However, a signifi cant minority of householders are
unhappy with their drinking water supplies. As a result of normal maintenance of drinking water
supply systems one might expect occasional disruptions to drinking water supplies, resulting
in low mains pressure, or temporary discolouration of supplies, etc. However, the survey results
indicated that for a substantial number of people problems of this nature occur on a regular
basis, which is less than satisfactory. In general there is a relatively high level of distrust of
drinking water supplies, which results in many households using their own resources to provide
alternative water supplies.
Table 5.3: Awareness of drinking water quality monitoring by region
Region Awareness of Knowledge of monitoring(%) monitoring results(%)
Border 23 7
Midland 14 11
West 32 17
Mid-East 16 9
Dublin 6 2
Mid-West 28 16
South-East 25 13
South-West 15 10
All Regions 17 9

Public Perceptions, Attitudes and Values on the Environment A National Survey 18
6. Water Quality in Recreational Water Bodies
The EPA and Local Authorities undertake an extensive monitoring programme of water quality
in inland rivers and lakes. The assessment for 2001-2003 was that water quality in our rivers is
considered to be generally of satisfactory quality with 69% having an unpolluted status and just
0.6% in a seriously polluted state, whereas 82% of lakes are considered to be of satisfactory
water quality. Monitoring of bathing waters, estuaries, and coastal waters is also undertaken.
This EPA survey establishes the level of public awareness of water quality monitoring programmes
and also the extent to which recreational water users avail of information on water quality.
Amenity Use of Water Bodies
Survey research undertaken by the Marine Institute reported that almost 1.5 million persons
aged 16 years and above engaged in some type of water based leisure activity in the year 2003
representing 49% of the population aged 16 years and above. The EPA’s survey focused on a
wider group; that of adults aged 18 years and above who were either recreational water users
or were knowledgeable about water bodies in their locality. Some 80% of adults fall into this
category.
Public’s Rating of Water Quality at Local Sites
Survey respondents were asked to rate the water quality at locations they were familiar with and
subsequently were asked on what information they based their assessments. This information
provides a crude indication of the public’s perception of water quality and the extent to which
the public relies on scientifi c assessments to inform their views.
Respondents were asked to rank water quality based on a four-point scale from very good
quality with no pollution to very poor quality with serious pollution. Responses are tabulated
below. A majority of adults (67%) believe that waters were at worst only slightly polluted,
though there is no benchmark from which to compare the public’s perception and actual water
quality status.
The survey fi nding of most concern is that the primary information source for the public’s
assessments of water quality may often be inaccurate. The majority of people rely on their
own visual inspections to assess water quality status. If people are to rely solely on visual
inspections they will often draw inaccurate conclusions mistaking turbid water for pollution
and assuming clear water is unpolluted. Just 5% relied directly on EPA or local authority
information, whereas 11% relied on local media reports that are most likely based on offi cial
monitoring reports.

Public Perceptions, Attitudes and Values on the Environment A National Survey 19
Summary
A large proportion of the population utilise water bodies for recreational purposes. From a
public health and safety perspective it is important that such users are aware of water quality
status. The survey suggests that people rely to a very large extent on visual inspections to
assess water quality, which may in many instances be a poor indicator of quality. Whereas a
small minority rely on information provided by local authorities or the EPA, who actually assess
water quality.
Table 6.1: Survey Respondents’ Rating of Water Quality at best known/used sites
Personal Rating of Water Quality %
Very good quality with no pollution 28
Moderate quality with only slight pollution 39
Poor quality with moderate pollution 19
Very poor quality with serious pollution 11
Don’t Know 3
Total 100
Table 6.2: Source Information for Respondents’ Rating of Water Quality
Reason % of respondents *
Own Visual Inspection 73
Local Knowledge 22
Own Experience - from fi shing/boating etc. 13
Blue Flag Status 13
Local Media Reporting 11
Information from the LA or EPA 5
Other 10
* Percentages sum to greater than 100 as respondents indicated multiple reasons.

Public Perceptions, Attitudes and Values on the Environment A National Survey 20
Methodology
The analysis in the chapter is based on a survey of the general adult public, which asked
respondents a series of questions relating to litter, illegal dumping and remediation of illegal
dumpsites.
The questionnaire used a well-established survey methodology to elicit information on
preferences for environmental services, e.g. environment protection, and the extent to which
such services are value for money. The survey questionnaire outlined the full policy context
as well as the implications of respondent’s choices so that responses would provide a realistic
assessment of the public’s preferences for greater environmental enforcement and a cleaner
environment.
Whether related to the environment, public services (health, education, etc), or to private
goods, all must be paid for. In the context of a survey it is easy to say that you want more of a
good or service and that the government should provide it. This fact is refl ected in the survey
when 90% of respondents said that they favoured the recruitment of additional litter wardens.
However, when informed that the recruitment would require additional public expenditure,
support for the proposal fell to 77%, and further fell to 67% when respondents were told that
extra taxes would be needed to fund the recruitment. As this shows, the survey questions were
designed to ensure that respondents understood the full context and implications for both
public expenditure and its impact on their private resources.
Environmental Protection Services
The survey examined three issues: increased litter law enforcement; increased enforcement
to prevent (large-scale) illegal dumping; and remediation of illegal dump sites. To avoid
overburdening respondents with too many questions and scenarios, respondents were
questioned about only two of the three issues, either litter and remediation, or illegal dumping
and remediation. The purpose of the survey analysis was to ascertain:
7. The Value of a Clean Environment
Everybody would like a clean environment. Such a preference shows that the environment has
worth or value, however large or small. This chapter looks at environmental protection, and
in particular assesses the general public’s opinion on a series of environmental enforcement
actions and the extent to which the public believes such enforcement is value for money.

Public Perceptions, Attitudes and Values on the Environment A National Survey 21
n the public’s awareness of the specifi c environmental problems
n whether the public is satisfi ed with current management of the problem
n the publics’ opinion on increased level of environmental protection
n the extent to which expenditure on increased environmental protection, through enforcement
or remediation, is considered worthwhile and value for money.
n the extent to which views on these three environmental protection proposals differ across
various segments of the population, thus providing a greater understanding of public
opinion.
Three scenarios, all related to illegal waste, were used to gain the broadest understanding of
the public’s attitudes to environmental protection measures. Under all three situations the
public benefi ts from increased environmental protection and improved environmental quality.
One scenario relates to prevention of small-scale environmental pollution - littering. The second
relates to prevention of large-scale environmental pollution - commercial-scale illegal dumping.
The third scenario relates to environmental pollution cleanup - remediation of illegal dumpsites.
The scenarios allow a range of opinions and attitudes related to illegal waste activity to be
examined.
Level of Concern - Illegal Waste Activity
The survey results show that the problem of illegal waste activity is not just a concern of small
group of affected interests but causes serious anxiety to the greater majority of the adult
population.
n 93% agree litter is a widespread problem
n 89% agree that illegal waste activity is major environmental problem
n 86% aware of environmental/health threats posed by illegal dumpsites
One could consider that litter and commercial scale illegal dumping are the two extremes of the
spectrum of illegal waste activities implying that 9-in-10 adults consider illegal waste activity
to be a major and widespread problem in Ireland today.
Public Perceptions, Attitudes and Values on the Environment A National Survey 22
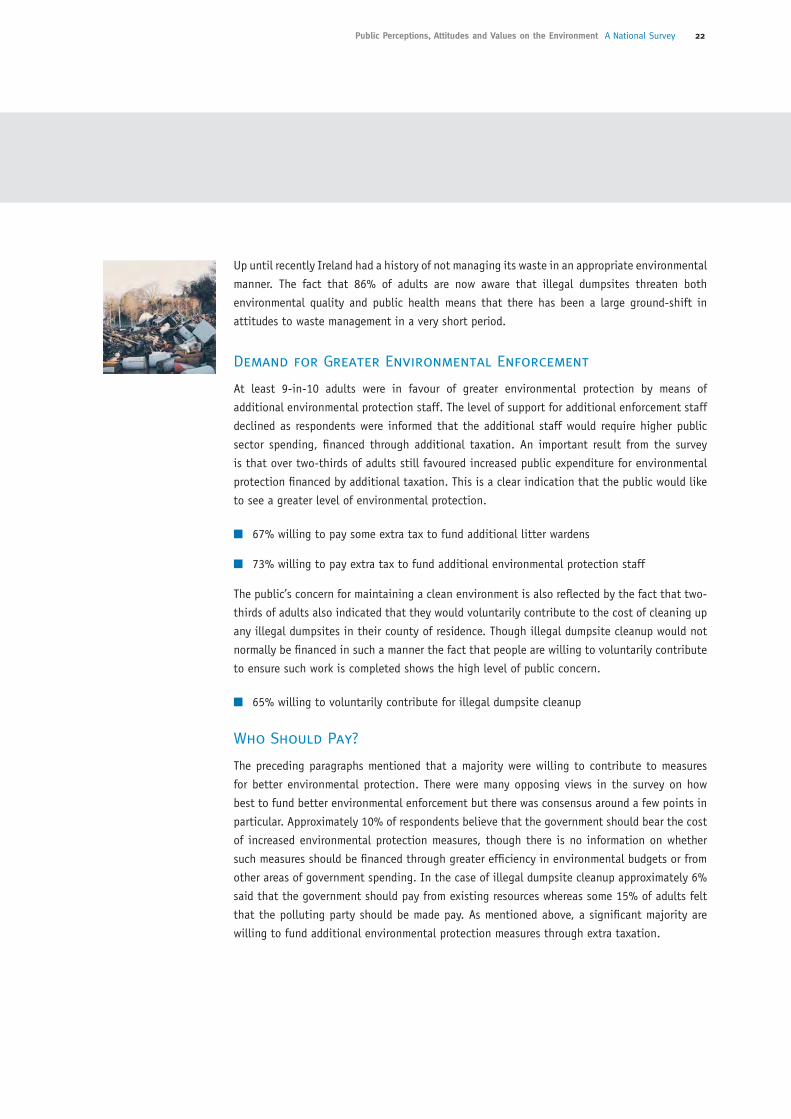
Up until recently Ireland had a history of not managing its waste in an appropriate environmental
manner. The fact that 86% of adults are now aware that illegal dumpsites threaten both
environmental quality and public health means that there has been a large ground-shift in
attitudes to waste management in a very short period.
Demand for Greater Environmental Enforcement
At least 9-in-10 adults were in favour of greater environmental protection by means of
additional environmental protection staff. The level of support for additional enforcement staff
declined as respondents were informed that the additional staff would require higher public
sector spending, fi nanced through additional taxation. An important result from the survey
is that over two-thirds of adults still favoured increased public expenditure for environmental
protection fi nanced by additional taxation. This is a clear indication that the public would like
to see a greater level of environmental protection.
n 67% willing to pay some extra tax to fund additional litter wardens
n 73% willing to pay extra tax to fund additional environmental protection staff
The public’s concern for maintaining a clean environment is also refl ected by the fact that two-
thirds of adults also indicated that they would voluntarily contribute to the cost of cleaning up
any illegal dumpsites in their county of residence. Though illegal dumpsite cleanup would not
normally be fi nanced in such a manner the fact that people are willing to voluntarily contribute
to ensure such work is completed shows the high level of public concern.
n 65% willing to voluntarily contribute for illegal dumpsite cleanup
Who Should Pay?
The preceding paragraphs mentioned that a majority were willing to contribute to measures
for better environmental protection. There were many opposing views in the survey on how
best to fund better environmental enforcement but there was consensus around a few points in
particular. Approximately 10% of respondents believe that the government should bear the cost
of increased environmental protection measures, though there is no information on whether
such measures should be fi nanced through greater effi ciency in environmental budgets or from
other areas of government spending. In the case of illegal dumpsite cleanup approximately 6%
said that the government should pay from existing resources whereas some 15% of adults felt
that the polluting party should be made pay. As mentioned above, a signifi cant majority are
willing to fund additional environmental protection measures through extra taxation.

Public Perceptions, Attitudes and Values on the Environment A National Survey 23
The Value of a Clean Environment
The survey examined the idea of the value of a clean environment by examining how worthwhile
or valuable the public considers greater levels of environmental enforcement or illegal dumpsite
remediation. If the public both favours greater environmental protection, and is willing to pay
(e.g. via increased taxes) for that greater level of environmental protection then we can directly
infer that the enforcement actions and the consequent benefi ts (i.e. cleaner environment) are
considered worthwhile and value for money.
When we examined the results from the two survey scenarios on littering and larger scale
illegal dumping we found that, while the public was concerned with both types of illegal waste
activity, large scale illegal dumping was of greater concern. In terms of the value of a clean
environment and value for money we found that on average people were willing to pay for
greater enforcement; €84 per person per year for litter enforcement and €114 for enforcement
of larger scale dumping activity. These fi gures represent how much a clean environment,
achieved through greater enforcement, is worth to the public.
How much a cleaner environment is worth to people obviously varies by personal circumstances.
For example, people in counties of Wicklow, Kildare, and Meath were willing to pay up to €70
more than elsewhere for greater enforcement to prevent illegal dumping, which in part refl ects
the instances of illegal dumpsites in these counties. People with a university education were
willing to pay on average €90 more to ensure greater enforcement. In the case of litter law
enforcement, people that lived in rural areas or towns were willing to pay €25 per person more
compared to people living in the larger cities or suburbs. This may refl ect the better street
cleaning services in urban areas. In general men were willing to pay €25-35 more for greater
enforcement than women. Income obviously is an important factor in whether people can afford
to pay for greater enforcement with people on incomes higher than €45,000 on average willing
to pay, on average, €50 more than others.
A very signifi cant fi nding of the analysis was that the people who believed that their individual
actions could make a real difference to the environment were willing to pay €50-70 for increased
environmental enforcement. Overall in the survey some 83% of respondents believe that their
personal actions could make a real difference.
When these fi gures are summed across the adult population the aggregate willingness to pay is
between €235-319 million. What this estimate represents is how much a clean environment is
worth to the public. This estimate does not imply that the cost of additional enforcement staff
is €235-319 million. From a cost benefi t analysis perspective the cost of increasing the level of
enforcement for waste management activities is likely to be signifi cantly less that the benefi ts
derived from providing such a service.

Public Perceptions, Attitudes and Values on the Environment A National Survey 24
Summary
The survey shows that the public is very aware of the issue of illegal waste activity in Ireland
today. A survey methodology asking the public what they would be willing to pay to fund
increased levels of environmental enforcement and therefore improve environmental quality
was used to infer whether additional public expenditure on environmental enforcement is
considered worthwhile and value for money. The analysis shows that the anticipated benefi ts
from a greater level of environmental protection are likely to be greater than the cost of
provision of additional enforcement.
Table 7.1: Survey Responses
Description Metric Litter Large Scale Dumping
Illegal Dump Site
Remediation
Agree issue is a widespread problem
% adults 93% 89% 86%
In favour of additional enforcement
% adults 90% 77% NA
Environmental Service discussed in the survey
Additional enforcement, litter wardens
Add itional enforcement
staff - illegal dumping
Illegal dumpsite clean-up
In favour of increased public expenditure on enforcement
% adults 77% 82% NA
In favour of increased public expenditure incorporating additional personal tax to fund increased enforcement
% adults 67% 73% NA
Willing to make voluntary contribution to dumpsite clean up
% adults NA NA 65%
Survey sample size No. 819 681 1500
Average willingness to pay per adult
€ €84 €114 €117
Adult population willingness to pay
€ million €235 €319 €210

STÁDAS NA GNÍOMHAIREACHTA
Is comhlacht poiblí neamhspleách í an Ghníomhaireacht um Chaomhnú Comhshaoil (EPA) a bunaíodh i mí Iúil 1993 faoin Acht fán nGníomhaireacht um Chaomhnú Comhshaoil, 1992. Ó thaobh an Rialtais, is í an Roinn Comhshaoil agus Rialtais Áitiúil a dhéanann urraíocht uirthi.
Déanann Bord Feidhmeach lánaimseartha comhdhéanta d’Ard-Stiúrthóir agus ceathrar Stiúrthóirí bainistíocht ar an EPA. Cinntítear neamhspleáchas trí nósanna imeachta roghnaithe i gcás an Ard-Stiúrthóra agus na Stiúrthóirí agus an tsaoirse, de réir mar a sholáthraítear sa reachtaíocht, gníomhú as a stuaim féin. Tá an sannadh, faoin reachtaíocht, maidir le freagracht dhíreach as réimse leathan feidhmeanna mar bhonn taca ag an neamhspleáchas sin. Faoin reachtaíocht, is cion sainiúil é iarracht a dhéanamh tionchar a imirt ar an Ghníomhaireacht, nó ar aon duine a bhíonn ag gníomhú thar ceann na Gníomhaireachta, ar bhealach míchuí.
Cuidíonn Coiste Comhairleach ar a bhfuil dhá chomhalta déag arna gceapadh ag an Aire Comhshaoil, Oidhreachta agus Rialtais Áitiúil leis an nGníomhaireacht.
FREAGRACHTAÍ
Tá réimse leathan dualgas agus cumhachtaí reachtúla ag an EPA faoin Acht fán nGníomhaireacht um Chaomhnú Comhshaoil. Chomh maith leis sin, tá curtha le hacmhainn an EPA maidir le forfheidhmiú le cumhachtaí san Acht um Chaomhnú an Chomhshaoil 2003. Áirítear orthu seo a leanas príomhfhreagrachtaí an EPA:
■ ceadúnú a dhéanamh ar phróisis thionsclaíocha mhóra/choimpléascacha a bhféadfadh cumas truaillithe suntasach a bheith ag baint leo;
■ monatóireacht ar chaighdeán comhshaoil, lena n-áirítear bunachair shonraí a bhunú ar a mbeidh rochtain ag an bpobal;
■ tuarascálacha tréimhsiúla maidir le staid an chomhshaoil a fhoilsiú;
■ sárchleachtais comhshaoil a chur chun cinn;
■ taighde comhshaoil a chur chun cinn agus a chomhordú;
■ gníomhaíochtaí diúscartha dramhaíola agus aisghabhála suntasacha, lena n-áirítear láithreacha líonta talún a cheadúnú agus plean bainistíochta guaisdramhaíola náisiúnta a ullmhú;
■ córas a chur i bhfeidhm a cheadaíonn rialú astaithe VOC a bhíonn mar thoradh ar scaoileadh GMOanna isteach sa chomhshaol in aon turas;
■ rialacháin GMO a chur i bhfeidhm agus a
fhorfheidhmiú ó thaobh GMOanna a choinneáil agus a scaoileadh amach sa chomhshaol in aon turas;
■ clár hidriméadrach náisiúnta a ullmhú agus a chur i bhfeidhm;
■ dréacht a chur le chéile de Phlean Leithroinnte Náisiúnta do thrádáil liúntas astaithe gáis ceaptha teasa; Údarás Inniúla Náisiúnta a bhunú le ceadanna trádála agus liúntais a eisiúint orthu siúd atá clúdaithe ag an scéim; monatóireacht, léargas, agus fíorú maidir le hastuithe ó chuideachtaí rannpháirteacha; agus Clár Trádála Astuithe Náisiúnta a bhunú;
agus, faoin Oifig Forfheidhmiúcháin Comhshaoil, a bunaíodh i 2003 agus atá tiomanta as reachtaíocht comhshaoil a chur i bhfeidhm agus a fhorfheidhmiú in Éirinn;
■ feabhas a chur ar chomhlíonadh reachtaíocht cosanta comhshaoil in Éirinn;
■ feasacht a ardú maidir leis an tábhacht a bhaineann le forfheidhmiú i gcás reachtaíochta cosanta comhshaoil in Éirinn;
■ ceadúnais IPPC agus ceadúnais Dramhaíola a eisíonn an EPA a fhorfheidhmiú;
■ iniúchadh agus tuairisciú ar fheidhmíocht údarás áitiúil maidir lena bhfeidhmeanna cosanta comhshaoil a chur ar bun, lena n-áirítear:
■ forfheidhmiú maidir le ceadúnais dramhaíola a sháraítear;
■ gníomh maidir le dumpáil mhídhleathach;
■ ceadanna bailithe dramhaíola a chur i bhfeidhm, agus
■ tionscnaimh a bheidh mar fhreagracht ar an táirgeoir a fhorfheidhmiú (mar shampla, sa réimse a bhaineann le dramhaíl pacáiste);
■ gníomh in aghaidh údarás áitiúil nach bhfuil ag comhlíonadh a gcuid feidhmeanna cosanta comhshaoil ar bhealach cuí;
■ an dlí a chur nó cuidiú le húdaráis áitiúla an dlí a chur ó thaobh sháraithe suntasacha reachtaíochta cosanta comhshaoil ar bhealach caoithiúil; agus
■ cuidiú le húdaráis áitiúla a gcuid feidhmíocht cosanta comhshaoil a fheabhsú ar bhonn cás ar chás, trí ghréasán forfheidhmithe a bhunú le malartú eolais a chur chun cinn chomh maith le sárchleachtas, agus trí threoir chuí a sholáthar.
An Ghníomhaireacht um Chaomhnú Comhshaoil

HeadquartersPO Box 3000, Johnstown Castle Estate County Wexford, IrelandBosca Poist 3000, Eastát Chaisleán Bhaile Sheáin Contae Loch Garman, Éire
T: +353 53 916 0600F: +353 53 916 0699
Regional InspectorateMcCumiskey House, RichviewClonskeagh Road, Dublin 14, IrelandCigireacht Réigiúnach, Teach Mhic ChumascaighDea-Radharc, Bóthar Cluain SceachBaile Átha Cliath 14, Éire
T: +353 1 268 0100F: +353 1 268 0199
Regional InspectorateInniscarra, County Cork, IrelandCigireacht Réigiúnach, Inis CaraContae Chorcaí, Éire
T: +353 21 487 5540F: +353 21 487 5545
Regional InspectorateJohn Moore Road, CastlebarCounty Mayo, IrelandCigireacht Réigiúnach, Bóthar Sheán de MórdhaCaisleán an Bharraigh, Contae Mhaigh Eo, Éire
T: +353 94 904 8400F: +353 94 902 1934
Regional InspectorateButts Green, Kilkenny, IrelandCigireacht Réigiúnach, Faiche an BhúitCill Chainnigh, Éire
T: +353 56 772 2329F: +353 56 776 5085
Regional InspectorateThe Glen, Monaghan, IrelandCigireacht Réigiúnach, An GleannMuineachán, Éire
T: +353 47 77600F: +353 47 84987
E: [email protected] W: www.epa.ieLo Call: 1890 33 55 99
Printed on an environmentally friendly paper stock