Embed Size (px)
Citation preview

Public Libraries Survey Fiscal Year 2007
June2009

USER NOTE
The Institute of Museum and Library Services program report “Public Libraries Survey Fiscal Year 2007” contains corrections for errors in the state of Ohio. The Ohio errors related to Local Government Revenue and State Government Revenue. Revenue that actually came from local sources was incorrectly reported as coming from state sources; revenue that actually came from the state was incorrectly reported as coming from local sources. Notification was received after the report was posted on the web and printing was underway. The report and data files are now corrected. These corrections affect Tables 16, 16A, 17, 17A, 18, 18A, A8, and A9. Ohio’s corrected total state operating revenues are $457.3 million and its corrected total local operating revenues are $202.8 million.
Project Teams
Institute of Museum and Library Services (IMLS), Office of Policy, Planning, Research, and Communications Mamie Bittner C. Arturo Manjarrez Everett Henderson Kim A. Miller U.S. Census Bureau Terri Craig Suzanne Dorinski Michael Freeman Natasha Isaac Jennifer Keng Loretta McKenzie Patricia O’Shea Cynthia Ramsey Cindy Sheckells
Institute of Museum and Library Services Dr. Anne-Imelda M. Radice, Director The Institute of Museum and Library Services is the primary source of federal support for the nation’s 123,000 libraries and 17,500 museums. The Institute's mission is to create strong libraries and museums that connect people to information and ideas. The Institute works at the national level and in coordination with state and local organizations to sustain heritage, culture, and knowledge; enhance learning and innovation; and support professional development. To learn more about the Institute, please visit www.imls.gov. Contact Information Institute of Museum and Library Services 1800 M Street NW, 9th Floor Washington, DC 20036-5802 202-653-IMLS (4657) www.imls.gov Please direct questions about library statistics to [email protected]. Published: June 2009 This publication is only available online at www.imls.gov/statistics. Citation Henderson, E., Miller, K., Craig, T., Dorinski, S., Freeman, M., Isaac, N., Keng, J., McKenzie, L., O’Shea, P., Ramsey, C., Sheckells, C. (2009). Public Libraries Survey: Fiscal Year 2007 (IMLS-2009–PLS-02). Institute of Museum and Library Services. Washington, DC Cover Design: Ellen Arnold Pictured: Top: Exterior view of the Public Library of Charlotte & Mecklenburg County’s Joe & Joan Martin
Center in Charlotte, NC. Photo courtesy of the Public Library of Charlotte & Mecklenburg County.
Bottom: Patrons peruse the library’s periodicals at the Johnson County Library in Shawnee Mission, KS. Photo courtesy of the Johnson County Library.
ii

Acknowledgments Many individuals made important contributions to this report. The Institute of Museum and Library Services (IMLS) is grateful for their dedication. Following is the list of those individuals (alphabetical by group): U.S. Census Bureau staff: Terri Craig, Suzanne Dorinski, Michael Freeman, Natasha Isaac, Jennifer Keng, Loretta McKenzie, Patricia O’Shea, Cynthia Ramsey, and Cindy Sheckells. IMLS would like to extend a special thank you to members of the survey advisory groups for their help in managing the survey process. The former Public Library Statistics Steering (PLS) Committee and the current Library Statistics Working Group (LSWG) are a vital part of the survey team. Their time and effort has helped make this report a more valuable resource to the library community and the public. Members of the former PLS Steering Committee: Ira Bray, State Data Coordinator, California State Library Dianne Carty, State Data Coordinator, Massachusetts Board of Library Commissioners Denise Davis, Director, ALA Office for Research and Statistics Kathleen “Kit” Keller, former State Data Coordinator, Nebraska Library Commission Keith Curry Lance, RSL Research Group and former PLS Steering Committee Member Aileen “Libby” Law, PLS Steering Committee Secretary and former South Carolina State Data Coordinator Suzanne Miller, State Librarian and Director, Minnesota State Library Services Frank Nelson, State Data Coordinator, Idaho Commission for Libraries Timothy Owens, State Data Coordinator, State Library of North Carolina Alan Zimmerman, former State Data Coordinator, Wisconsin Department of Public Instruction Members of the current LSWG: Dr. John Carlo Bertot, Professor and Director, Center for Library Innovation, University of Maryland Hulen Bivins, State Data Coordinator, Alabama Public Library Service Howard Boksenbaum, Chief of Library Services, Rhode Island Department of Administration Ira Bray, State Data Coordinator, California State Library Dianne Carty, State Data Coordinator, Massachusetts Board of Library Commissioners Denise Davis, Director, ALA Office for Research and Statistics Martha Kyrillidou, Director of Statistics and Service Quality, Association of Research Libraries Suzanne Miller, State Librarian and Director, Minnesota State Library Services Frank Nelson, State Data Coordinator, Idaho Commission for Libraries Wayne Onkst, State Librarian and Commissioner, Kentucky Department for Libraries and Archives Timothy Owens, State Data Coordinator, State Library of North Carolina Peggy D. Rudd, Director and Librarian, Texas State Library and Archives Commission Dr. Carol Tenopir, Chancellor’s Professor, School of Information Sciences, University of Tennessee Chris Walker, Director of Research and Assessment, Local Initiative Support Corporation Jan Walsh, State Librarian, Washington State Library Division IMLS also extends sincere gratitude to the State Data Coordinators and other State Library Agency staff who provided the data for this report. Their diligent efforts result in a national data resource with an exceptionally high response rate, year after year.
iii
iv
Contents Acknowledgments..................................................................................................................................... iii List of Tables ............................................................................................................................................. v Introduction .............................................................................................................................................. 1 Findings .................................................................................................................................................... 4 References .............................................................................................................................................. 17 Tables ...................................................................................................................................................... 19 Appendix A—Public Library State Ranking Tables.................................................................................. 143 Appendix B—Technical Notes ................................................................................................................. 157
Appendix C—Survey Instrument.............................................................................................................. 165
v
List of Tables Table Page Number of Public Libraries and Population of Legal Service Area
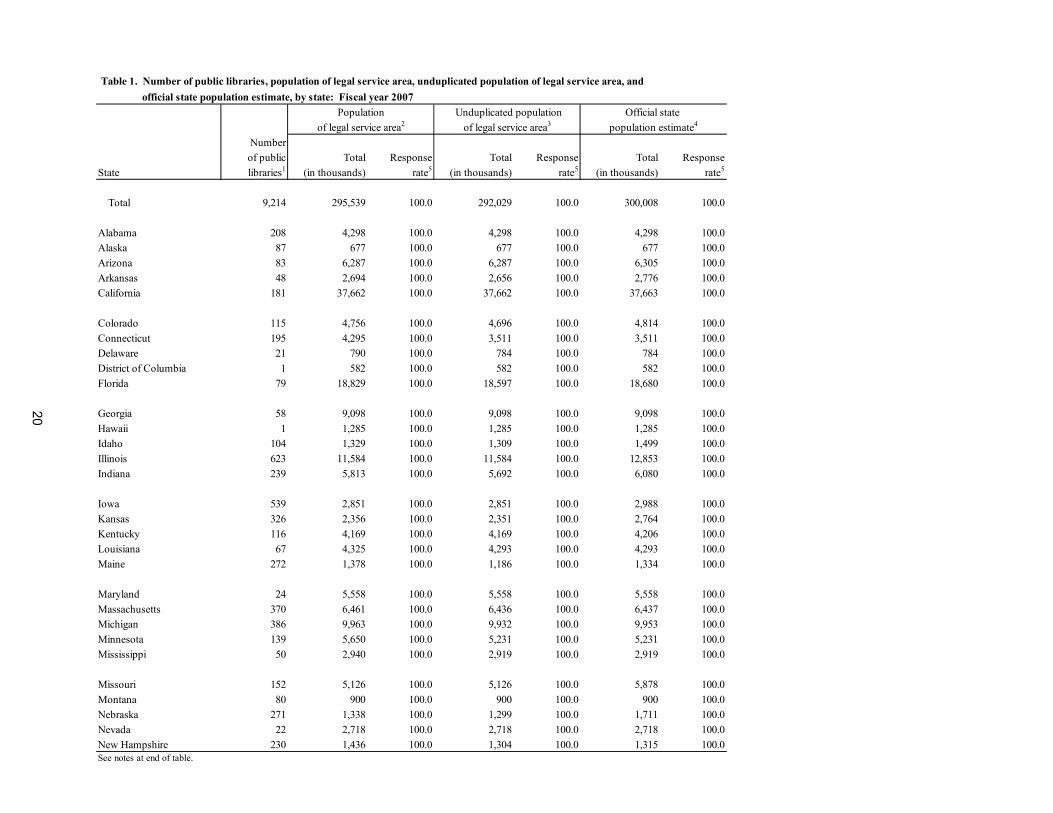
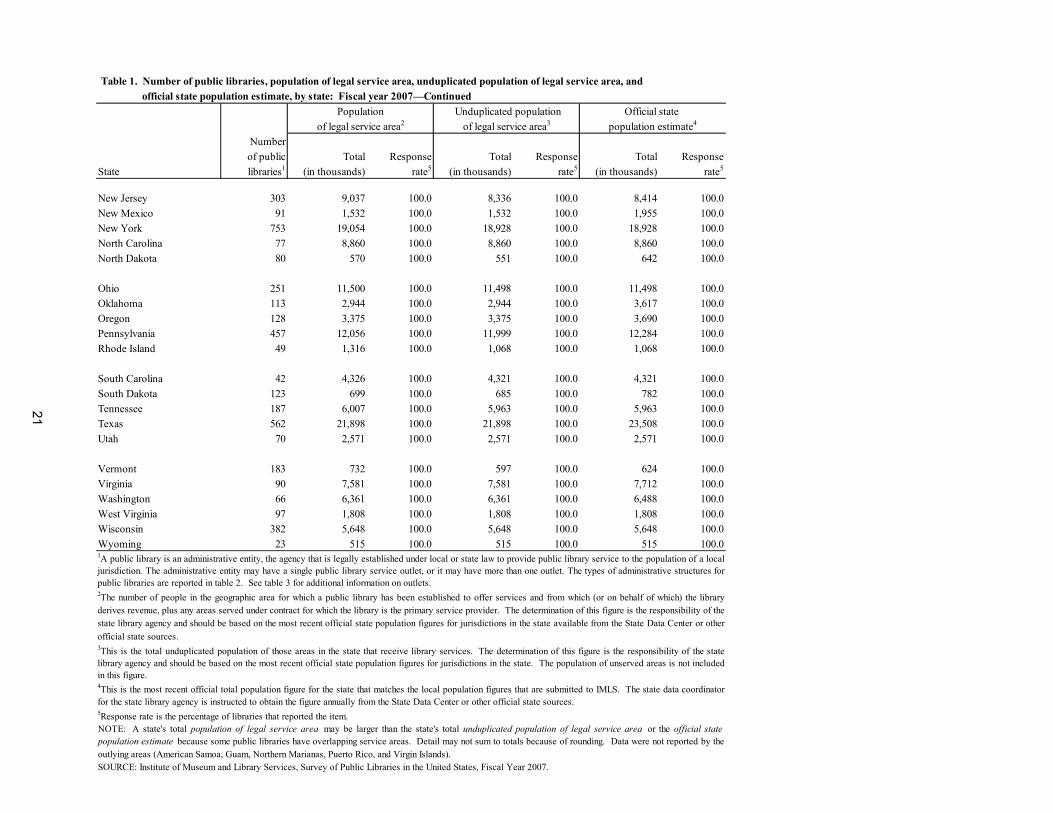
1 Number of public libraries, population of legal service area, unduplicated population of
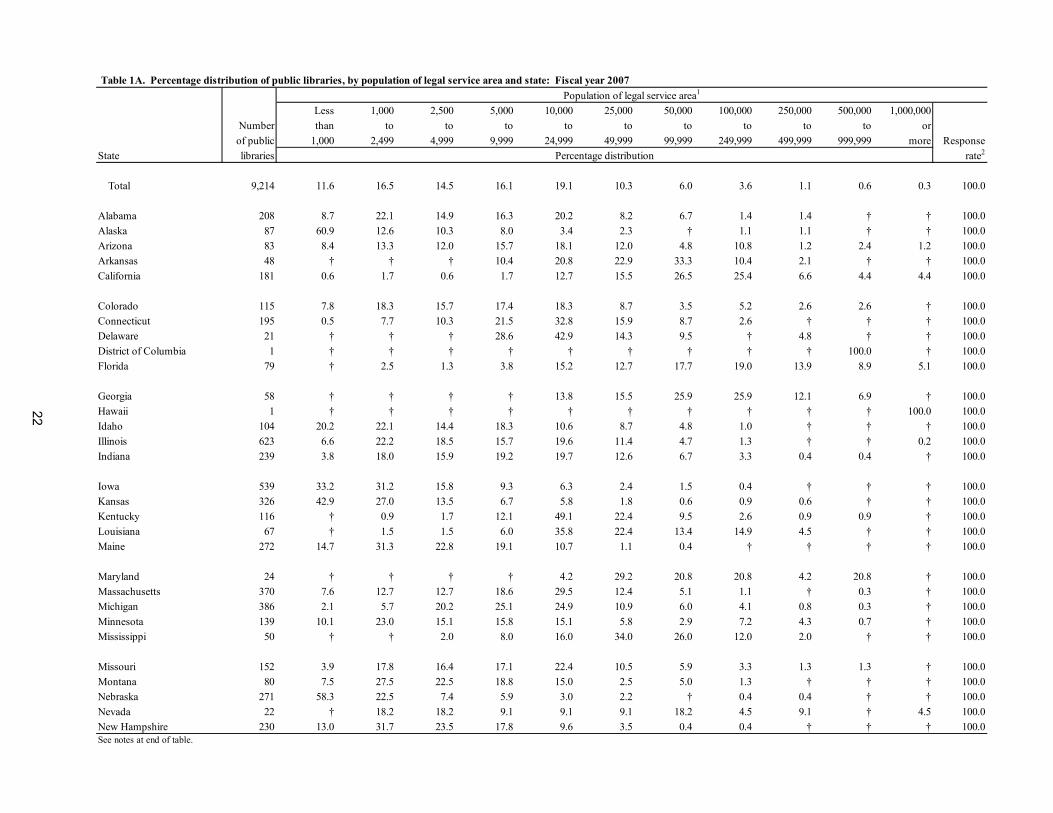
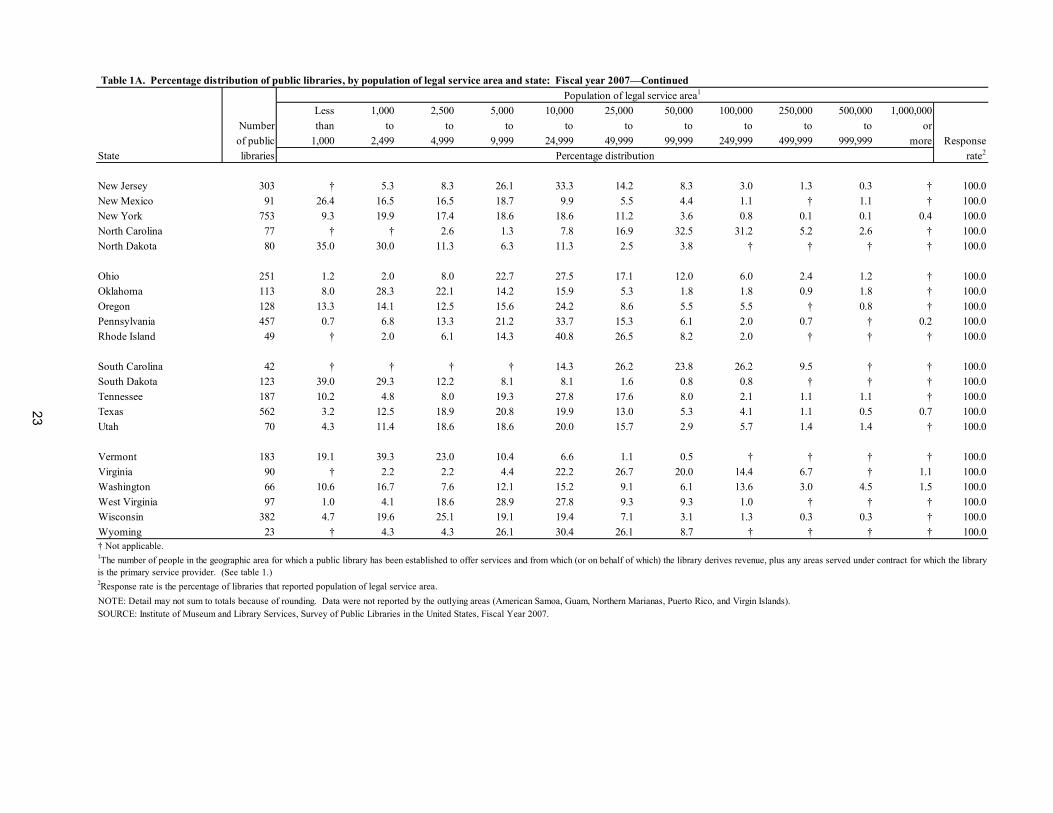
legal service area, and official state population estimate, by state: Fiscal year 2007................ 20 1A Percentage distribution of public libraries, by population of legal service area and state:
Fiscal year 2007 .......................................................................................................................... 22 1B Percentage distribution of population of legal service area of public libraries, by state:
Fiscal year 2007 .......................................................................................................................... 24 Administrative Structure, Service Outlets, and Hours 2 Percentage distribution of public libraries, by type of administrative structure and state:
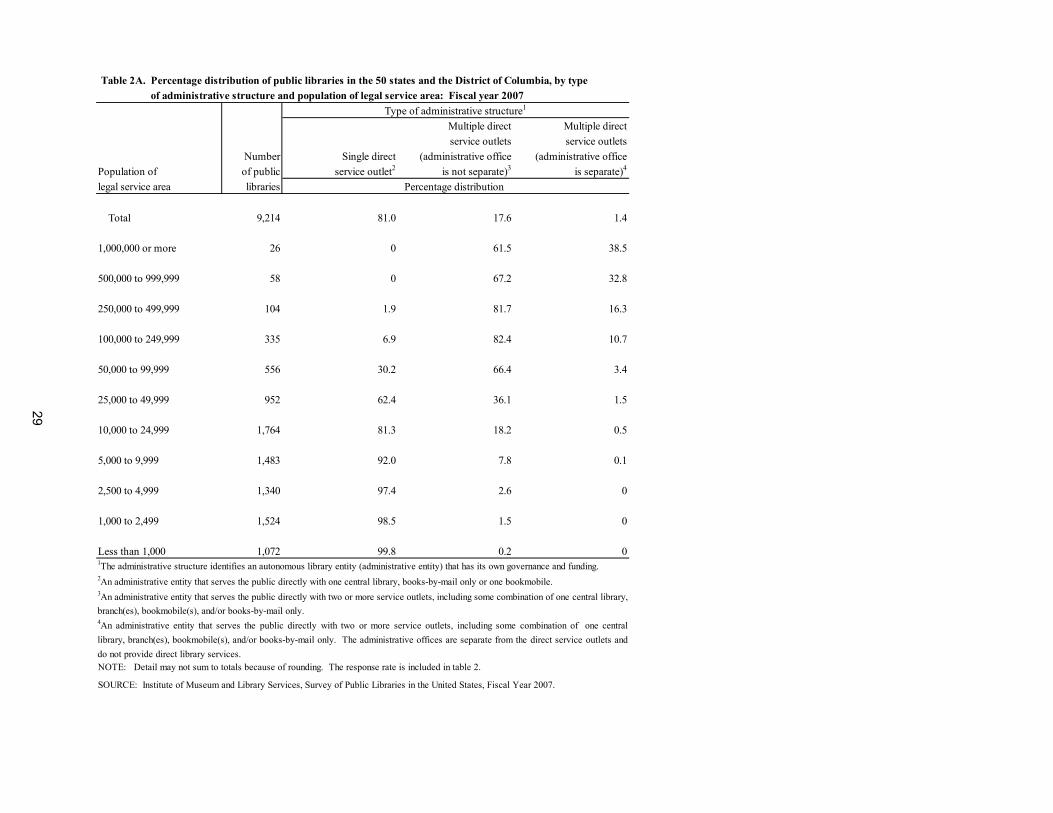
Fiscal year 2007 .......................................................................................................................... 26 2A Percentage distribution of public libraries in the 50 states and the District of Columbia,
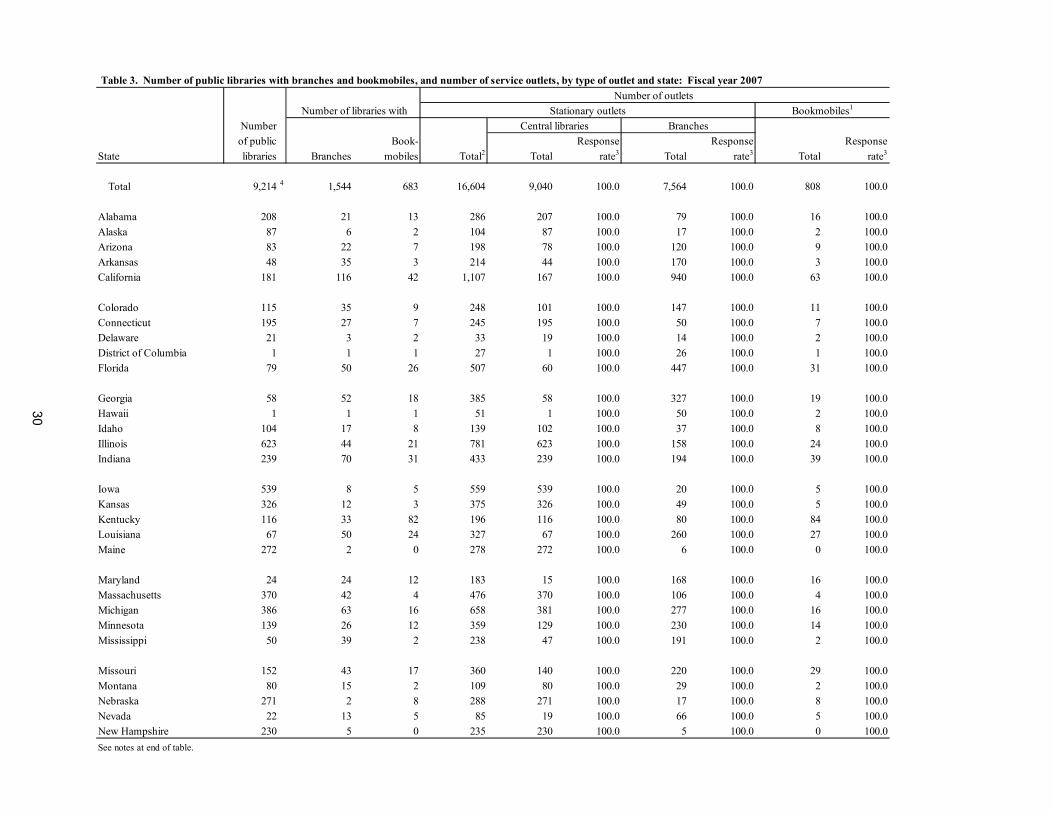
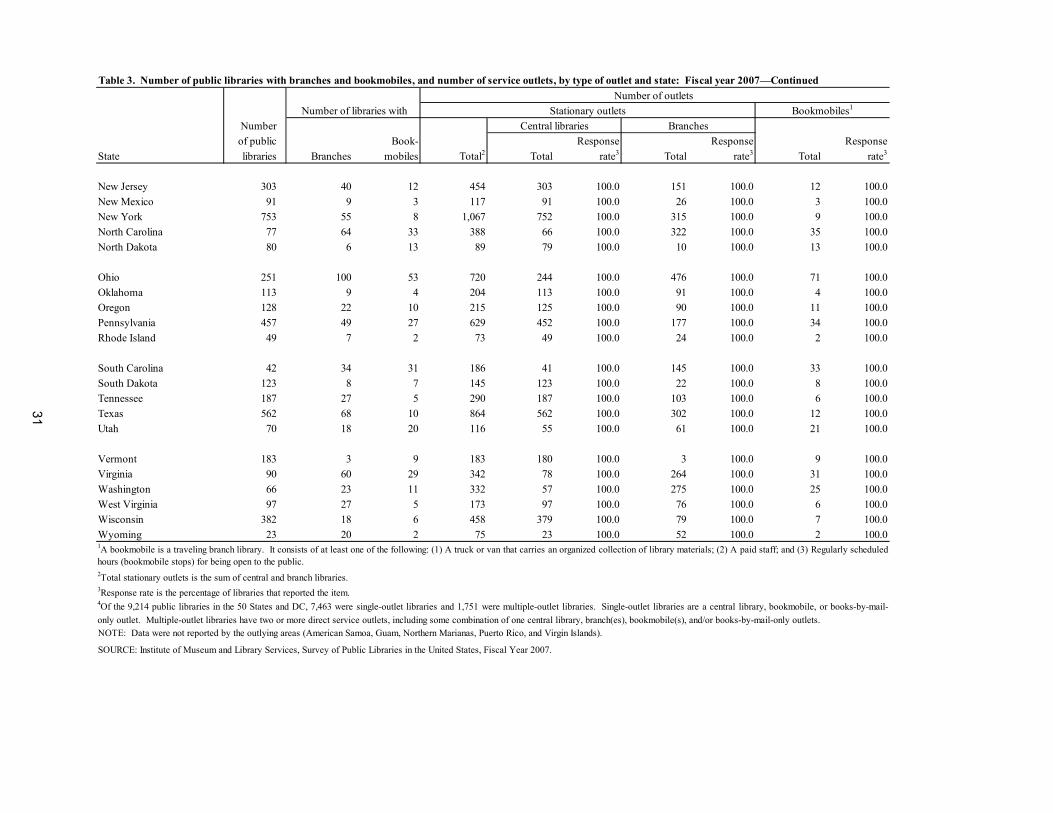
by type of administrative structure and population of legal service area: Fiscal year 2007 ....... 29 3 Number of public libraries with branches and bookmobiles, and number of service outlets,
by type of outlet and state: Fiscal year 2007.............................................................................. 30 3A Number of public libraries in the 50 states and the District of Columbia, with branches and
bookmobiles, and number of service outlets, by type of outlet and population of legal service area: Fiscal year 2007................................................................................................................. 33
4 Percentage distribution of public libraries, by average number of weekly public service
hours per outlet and state: Fiscal year 2007 .............................................................................. 34
4A Percentage distribution of public libraries in the 50 states and the District of Columbia, by average number of weekly public service hours per outlet and population of legal service area: Fiscal year 2007................................................................................................................ 37
Legal Basis, Geographic Service Area, and Interlibrary Relationship 5 Percentage distribution of public libraries, by type of legal basis and state:
Fiscal year 2007 .......................................................................................................................... 38 5A Percentage distribution of public libraries in the 50 states and the District of Columbia,
by type of legal basis and population of legal service area: Fiscal year 2007............................ 41 6 Percentage distribution of public libraries, by type of geographic service area and state:
Fiscal year 2007 .......................................................................................................................... 42 6A Percentage distribution of public libraries in the 50 states and the District of Columbia,
by type of geographic service area and population of legal service area: Fiscal year 2007 ...... 45
7 Percentage distribution of public libraries, by type of interlibrary relationship and state: Fiscal year 2007 .......................................................................................................................... 46
vi
Table Page 7A Percentage distribution of public libraries in the 50 states and the District of Columbia,
by type of interlibrary relationship and population of legal service area: Fiscal year 2007 ........ 49
Library Services 8 Number of public library services and library services per capita or per 1,000 population,
by type of service and state: Fiscal year 2007 ........................................................................... 50 8A Number of public library services and library services per capita or per 1,000 population in the
50 states and the District of Columbia, by type of service and population of legal service area: Fiscal year 2007 .......................................................................................................................... 53
9 Circulation of children’s materials, total and children’s programs, and total and children’s program attendance in public libraries, by state: Fiscal year 2007 ............................................ 54 9A Circulation of children’s materials, total and children’s programs, and total and children’s program attendance in public libraries in the 50 states and the District of Columbia, by type of service and population of legal service area: Fiscal year 2007............................................. 57 10 Number of public-use Internet computers in public libraries and uses of Internet computers
per year, by state: Fiscal year 2007 ........................................................................................... 58 10A Number of public-use Internet computers in public libraries and uses of Internet
computers per year in the 50 states and the District of Columbia, by population of legal service area: Fiscal year 2007........................................................................................... 61
Collections 11 Number of public library materials and library materials per capita or per 1,000 population,
by type of material and state: Fiscal year 2007.......................................................................... 62 11A Number of public library materials and library materials per capita or per 1,000 population
in the 50 states and the District of Columbia, by type of material and population of legal service area: Fiscal year 2007............................................................................................ 65
12 Percentage distribution of public libraries, by size of print materials collection and state:
Fiscal year 2007 .......................................................................................................................... 66 12A Percentage distribution of public libraries in the 50 states and the District of Columbia,
by size of print materials collection and population of legal service area: Fiscal year 2007 ...... 69
13 Total, average, and median number of electronic materials in public libraries, by type of material and state: Fiscal year 2007 .......................................................................................... 70
13A Total, average, and median number of electronic materials in public libraries in the
50 states and the District of Columbia, by type of material and population of legal service area: Fiscal year 2007.............................................................................................................. 73
vii
Table Page Staff 14 Number of paid full-time-equivalent (FTE) staff in public libraries, by type of position;
percentage of total librarians and total staff with “ALA-MLS” degrees; and number of public libraries with “ALA-MLS” librarians, by state: Fiscal year 2007........................................ 74
14A Number of paid full-time-equivalent (FTE) staff in public libraries, by type of position; percentage of total librarians and total staff with “ALA-MLS” degrees; and number of public libraries with “ALA-MLS” librarians in the 50 states and the District of Columbia, by population of legal service area: Fiscal year 2007...................................................................................... 77 15 Percentage distribution of public libraries, by number of paid full-time-equivalent (FTE)
staff and state: Fiscal year 2007 ................................................................................................ 78 15A Percentage distribution of public libraries in the 50 states and the District of Columbia, by number of paid full-time-equivalent (FTE) staff and population of legal service area:
Fiscal year 2007 .......................................................................................................................... 81 Operating Revenue 16 Total operating revenue of public libraries and percentage distribution of revenue, by
source of revenue and state: Fiscal year 2007 .......................................................................... 82 16A Total operating revenue of public libraries and percentage distribution of revenue in the 50 states and the District of Columbia, by source of revenue and population of legal service area: Fiscal year 2007................................................................................................................ 85 17 Total per capita operating revenue of public libraries, by source of revenue and state:
Fiscal year 2007 .......................................................................................................................... 86 17A Total per capita operating revenue of public libraries in the 50 states and the District of Columbia, by source of revenue and population of legal service area: Fiscal year 2007 .......... 89 18 Percentage distribution of public libraries, by per capita operating revenue from local
sources and state: Fiscal year 2007........................................................................................... 90 18A Percentage distribution of public libraries in the 50 states and the District of Columbia, by
per capita operating revenue from local sources and population of legal service area: Fiscal year 2007 .......................................................................................................................... 93
Operating Expenditures 19 Total operating expenditures of public libraries and percentage distribution of expenditures,
by type of expenditure and state: Fiscal year 2007.................................................................... 94 19A Total operating expenditures of public libraries in the 50 states and the District of Columbia
and percentage distribution of expenditures, by type of expenditure and population of legal service area: Fiscal year 2007........................................................................................... 97
20 Total per capita operating expenditures of public libraries, by type of expenditure and state:
Fiscal year 2007 .......................................................................................................................... 98
viii
Table Page 20A Total per capita operating expenditures of public libraries in the 50 states and the District of
Columbia, by type of expenditure and population of legal service area: Fiscal year 2007....... 101 21 Total collection expenditures of public libraries and percentage distribution of expenditures,
by type of expenditure and state: Fiscal year 2007.................................................................. 102 21A Total collection expenditures of public libraries in the 50 states and the District of Columbia and percentage distribution of expenditures, by type of expenditure and population of legal
service area: Fiscal year 2007 ................................................................................................. 105 22 Percentage distribution of public libraries, by total operating expenditures and state:
Fiscal year 2007 ........................................................................................................................ 106 22A Percentage distribution of public libraries in the 50 states and the District of Columbia, by total operating expenditures and population of legal service area: Fiscal year 2007............... 109 23 Percentage distribution of public libraries, by total per capita operating expenditures
and state: Fiscal year 2007 ....................................................................................................... 110 23A Percentage distribution of public libraries in the 50 states and the District of Columbia, by total per capita operating expenditures and population of legal service area: Fiscal year 2007 .......................................................................................................................... 113 Capital Revenue and Expenditures 24 Total capital revenue of public libraries and percentage distribution of revenue, by source of
revenue and state: Fiscal year 2007 .......................................................................................... 114 24A Total capital revenue of public libraries and percentage distribution of revenue in the 50 states and the District of Columbia, by source of revenue and population of legal service area:
Fiscal year 2007 .......................................................................................................................... 117 25 Total capital revenue of public libraries and percentage distribution of public libraries by total
capital revenue category and state: Fiscal year 2007 ................................................................ 118
25A Total capital revenue of public libraries in the 50 states and the District of Columbia and percentage distribution of public libraries, by total capital revenue category and population of legal service area: Fiscal year 2007........................................................................................... 121
26 Total capital expenditures of public libraries and percentage distribution of public libraries
by total capital expenditures category and state: Fiscal year 2007............................................ 122 26A Total capital expenditures of public libraries in the 50 states and the District of Columbia and
percentage distribution of public libraries by total capital expenditures and population of legal service area: Fiscal year 2007 ................................................................................................... 125
Square Footage of Service Outlets 27 Number and square footage of single-outlet public libraries, by state: Fiscal year 2007 ........... 126 27A Number and square footage of single-outlet public libraries in the 50 states and the District of
Columbia, by population of legal service area: Fiscal year 2007 ............................................... 129
ix
Table Page 28 Number and square footage of multiple-outlet public libraries, by type of outlet and state: Fiscal year 2007 .......................................................................................................................... 130 28A Number and square footage of multiple-outlet public libraries in the 50 states and the District of Columbia, by type of outlet and population of legal service area: Fiscal year 2007............... 133 29 Number and square footage of central outlets of public libraries, by population of legal service area and state: Fiscal year 2007 ................................................................................................ 134 30 Number and square footage of branch outlets of public libraries, by population of legal service area and state: Fiscal year 2007 ................................................................................................ 138
Appendix A – Public Library State Ranking Tables
A1 Number of library visits and reference transactions of public libraries per capita, by state: Fiscal year 2007 ........................................................................................................................... 145
A2 Number of circulation transactions of public libraries per capita and interlibrary loans received
per 1,000 population, by state: Fiscal year 2007......................................................................... 146 A3 Average number of public-use Internet computers of public libraries per stationary outlet and
number per 5,000 population, by state: Fiscal year 2007 ........................................................... 147 A4 Number of print materials of public libraries per capita and audio materials per 1,000 population, by state: Fiscal year 2007......................................................................................... 148 A5 Number of video materials and current print serial subscriptions of public libraries per
1,000 population, by state: Fiscal year 2007............................................................................... 149 A6 Number of paid full-time-equivalent (FTE) staff and paid FTE librarians of public libraries
per 25,000 population, by state: Fiscal year 2007....................................................................... 150 A7 Number of paid full-time-equivalent (FTE) librarians with “ALA-MLS” and other paid FTE staff of public libraries per 25,000 population, by state: Fiscal year 2007........................................... 151 A8 Total and state operating revenue of public libraries per capita, by state: Fiscal year 2007......... 152 A9 Local and other operating revenue of public libraries per capita, by state: Fiscal year 2007........ 153 A10 Total operating expenditures and collection expenditures of public libraries per capita, by state: Fiscal year 2007 ............................................................................................................................. 154 A11 Total staff expenditures and salaries and wages expenditures of public libraries per capita,
by state: Fiscal year 2007 ............................................................................................................. 155
Appendix B – Technical Notes Tables B-1 Reporting periods of public libraries: Fiscal year 2007................................................................. 157 B-2 States with public libraries with overlapping service areas: Fiscal year 2007.............................. 159
1
Introduction The Public Libraries Survey (PLS) is a voluntary survey conducted annually by the Institute of Museum and Library Services (IMLS). IMLS collects these data under the mandate in the Museum and Library Services Act of 2003 as stated in SEC. 210. The U.S. Census Bureau is the data collection agent for IMLS. The Fiscal Year (FY) 2007 survey is the 20th in the series. Survey Purpose and Data Items Included in This Report The PLS provides a national census of public libraries and their public service outlets (see Key Library Terminology below). These data are useful to federal, state, and local policymakers; library and public policy researchers; and the public, journalists, and others. This report provides summary information about public libraries in the 50 states and the District of Columbia for state FY 2007.1 It covers service measures such as number of uses of electronic resources, number of Internet terminals used by the general public, reference transactions, interlibrary loans, circulation, library visits, children’s program attendance, and circulation of children’s materials. It also includes information about size of collection, staffing, operating revenue and expenditures, type of legal basis, and number and type of public library service outlets. This report is based on the final data file. The PLS is designed as a universe survey. The survey frame consists of 9,217 public libraries (9,214 public libraries in the 50 states and the District of Columbia and 3 public libraries in the outlying areas of Guam, the Northern Mariana Islands, and the Virgin Islands), as identified by state library agencies. (Public libraries in two outlying areas, American Samoa and Puerto Rico, are not included in the survey frame because their state library agencies have never responded to the request for participation in the survey.) A total of 8,994 of the 9,217 public libraries in the survey frame responded to the FY 2007 PLS (with no outlying areas responding), for a unit response rate of 97.6 percent. Item response rates are included in the tables in this report.2 The data were submitted over the Internet via a web-based reporting system. (See Data Collection in Appendix B for more information.) Organization of This Report This report includes the following major sections:
• Introduction o Survey Purpose and Data Items Included in this Report o Congressional Authorization o Key Library Terminology o Types of Tables Included in this Report o History of the Public Libraries Survey
• Findings from the FY 2007 data collection • Tables (including State Ranking Tables in Appendix A)
• Technical Notes (Appendix B)
• Survey Questionnaire (Appendix C)
1The fiscal year reporting period varies among states and among local jurisdictions in some states. Please see Reporting Period in Appendix B for more information. 2No outlying areas responded to the FY 2007 survey, so they are not included in the tables of this report. The item response rates in the Total line of the tables do not include the outlying areas.
2
Congressional Authorization Two separate laws cover the protection of the confidentiality of individually identifiable information collected by the Institute of Museum and Library Services - the Privacy Act of 1974 and the E-Government Act of 2002. The Guidelines for Ensuring and Maximizing the Quality, Objectivity, Utility, and Integrity of Information Disseminated by the Institute of Museum and Library Services are prepared under the Treasury and General Government Appropriations Act for Fiscal Year 2001, Section 515(b). IMLS will fulfill the congressional mandate in the Museum and Library Services Act of 2003 as stated in section 210. Analysis of Impact of Museum and Library Services:
‘From amounts described in sections 214(c) and 275(b), the Director shall carry out and publish analyses of the impact of…library services. Such analyses— (1) shall be conducted in ongoing consultation with—
(A) State library administrative agencies; (B) State, regional, and national library…organizations; and (C) other relevant agencies and organizations;
(2) shall identify national needs for, and trends of…library services provided with funds made available under subtitles B and C…
IMLS library survey activities will be designed to address high-priority library data needs; provide consistent, reliable, complete, and accurate indicators of the status and trends of state and public libraries; and report timely, useful, and high-quality data to the U.S. Congress, the States, other education policymakers, practitioners, data users, and the general public. Key Library Terminology3
• Public library. A public library is an entity that is established under state enabling laws or regulations to serve a community, district, or region, and that provides at least the following: (1) an organized collection of printed or other library materials, or a combination thereof; (2) paid staff; (3) an established schedule in which services of the staff are available to the public; (4) the facilities necessary to support such a collection, staff, and schedule; and (5) that is supported in whole or in part with public funds.
• Administrative entity. An administrative entity is the agency that is legally established under local or
state law to provide public library service to the population of a local jurisdiction. The administrative entity may have a single public library service outlet, or it may have more than one public library service outlet. (Note: In this report, the term public library means an administrative entity.)
• Public library service outlet. Public libraries can have one or more outlets that provide direct
service to the public. The three types of public library service outlets included in this report are central library outlets, branch library outlets, and bookmobile outlets. Information on a fourth type of outlet, books-by-mail-only outlets, was collected but omitted from this report because these outlets are not open to the public. The four outlet types are defined in Appendix C in item 709 of the definitions. Table 3 reports data concerning public library service outlets.
3More detailed definitions of the terms used in this report can be found in the survey questionnaire in Appendix C.
3
Types of Tables Included in This Report
There are 72 tables in this report: Tables 1 through 1B provide overview data, by state, about the number of public libraries and population of legal service area. Tables 2 through 28 are in sets of 2 each. The base table in each set (Tables 2 through 28) displays data for the nation as a whole and for each of the 50 states and the District of Columbia. The “A” table in each set displays the same data by 11 ranges of population of legal service area. Tables 27 through 30 include data about square footage. Appendix A includes 11 tables of state rankings. Appendix B includes 2 tables that expand on the technical notes. History of the Public Libraries Survey In 1985, the National Center for Education Statistics (NCES) and the American Library Association (ALA) conducted a pilot project in 15 states to assess the feasibility of a federal-state cooperative program for the collection of public library data. The project was jointly funded by NCES and the U.S. Department of Education's former Library Programs (LP) office. In 1987, the project’s final report recommended the development of a nationwide data collection system. The Hawkins-Stafford Elementary and Secondary School Improvement Amendments of 1988 (P.L. 100-297) charged NCES with developing a voluntary Federal-State Cooperative System (FSCS) for the annual collection of public library data.4 To carry out this mandate, a task force was formed by NCES and the National Commission on Libraries and Information Science (NCLIS), and the FSCS was established in 1988. The first survey report in this series, Public Libraries in 50 States and the District of Columbia: 1989, which included data from 8,699 public libraries in 50 states and the District of Columbia, was released by NCES in 1991. A data file and survey report have been released annually since then. The states have always submitted their data electronically, via customized personal computer survey software through FY 2004, and via a web-based application beginning in FY 2005. On October 1, 2007 the survey was transferred from NCES to IMLS. The FY 2006 survey was collected by NCES and released by IMLS. The FY 2007 survey is the first PLS data collection and release by IMLS.
4This was superseded by the National Education Statistics Act of 1994 (P.L. 103-382) and, more recently, by the Education Sciences Reform Act of 2002.
4
Findings Preface The following section provides highlights of the fiscal year 2007 Public Library Survey, comparing key elements from fiscal year 2007 to the previous fiscal year when appropriate. Information on longer-term trends (7-10 years) is provided for select data elements. Most of the statistics presented in the long-term trend charts appear in per capita form; this was done because per capita metrics control for population growth and allow for standardized comparisons of change over time. In each line graph that reports dollar amounts over time, inflation was accounted for using a GDP deflator.5 Number of Public Libraries and Population of Legal Service Area
• There were 9,2146 public libraries (administrative entities)7 in the 50 states and the District of Columbia in fiscal year (FY) 2007 (Table 1), slightly up from the 9,208 that there were in FY 2006. Public libraries are widely distributed across the United States; 98 percent of counties have at least one administrative entity or library outlet.
• Public library service areas encompass 97 percent8 of the total population of the states and the
District of Columbia in FY 2007, either in legally established geographic service areas or in areas under contract. This was the same percentage of the nation’s population that was served during the prior fiscal year.
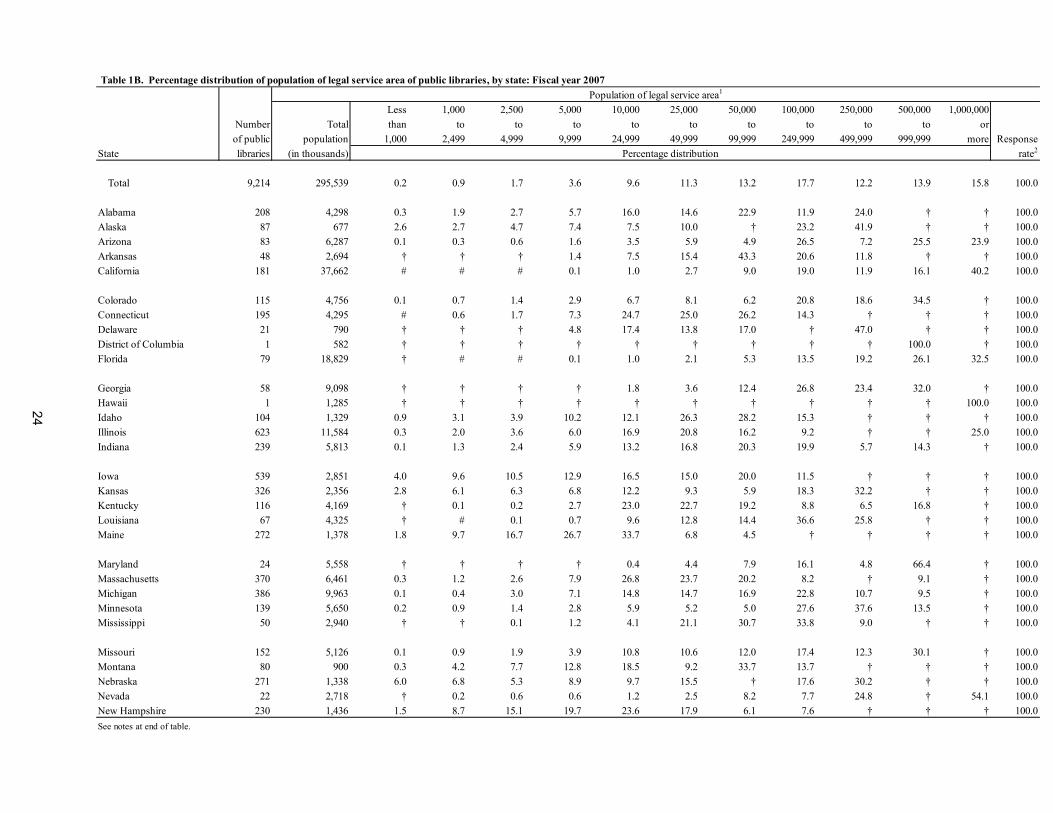
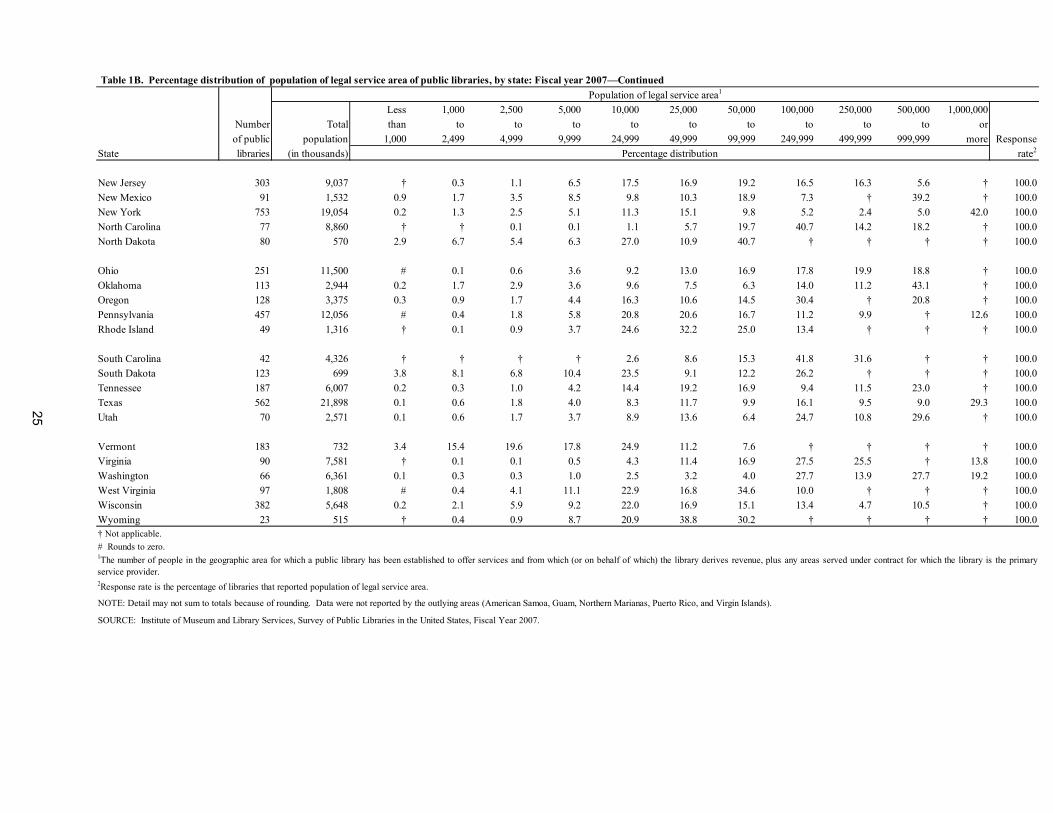
• Twelve percent of the public libraries served 73 percent of the population of legally served areas
in the United States during FY 2007; each of these public libraries had a legal service area population of 50,000 or more (derived from Tables 1A and 1B).
Service Outlets
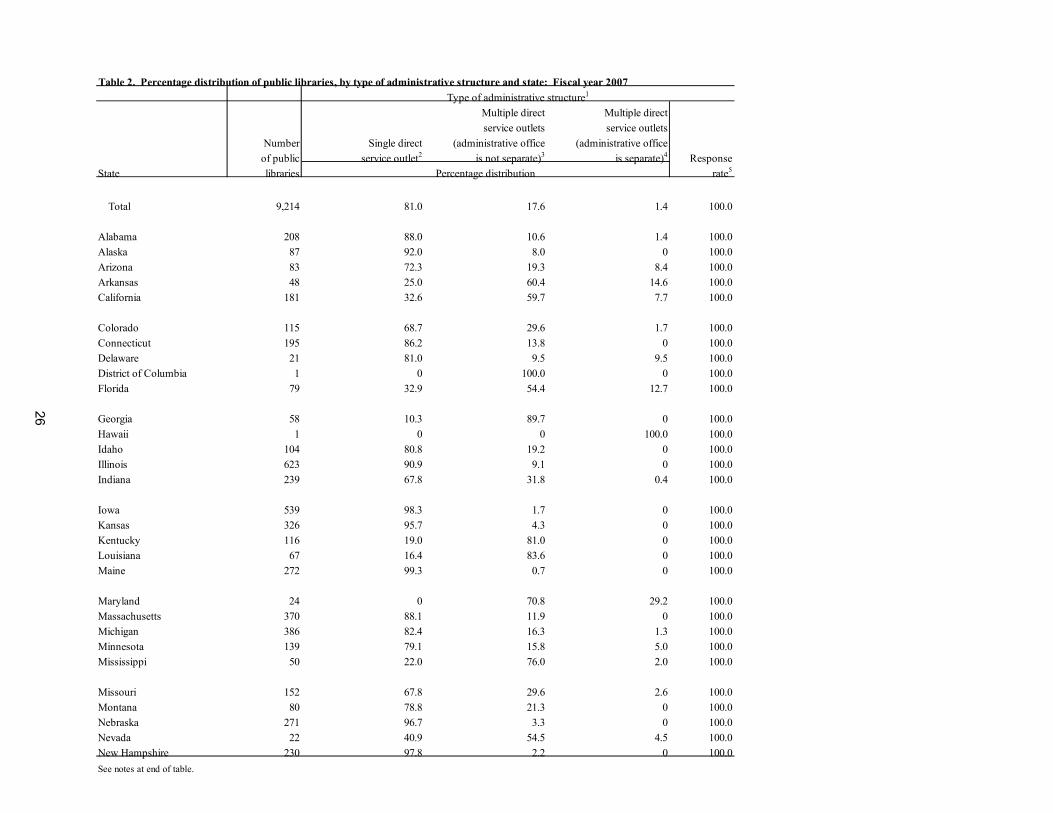
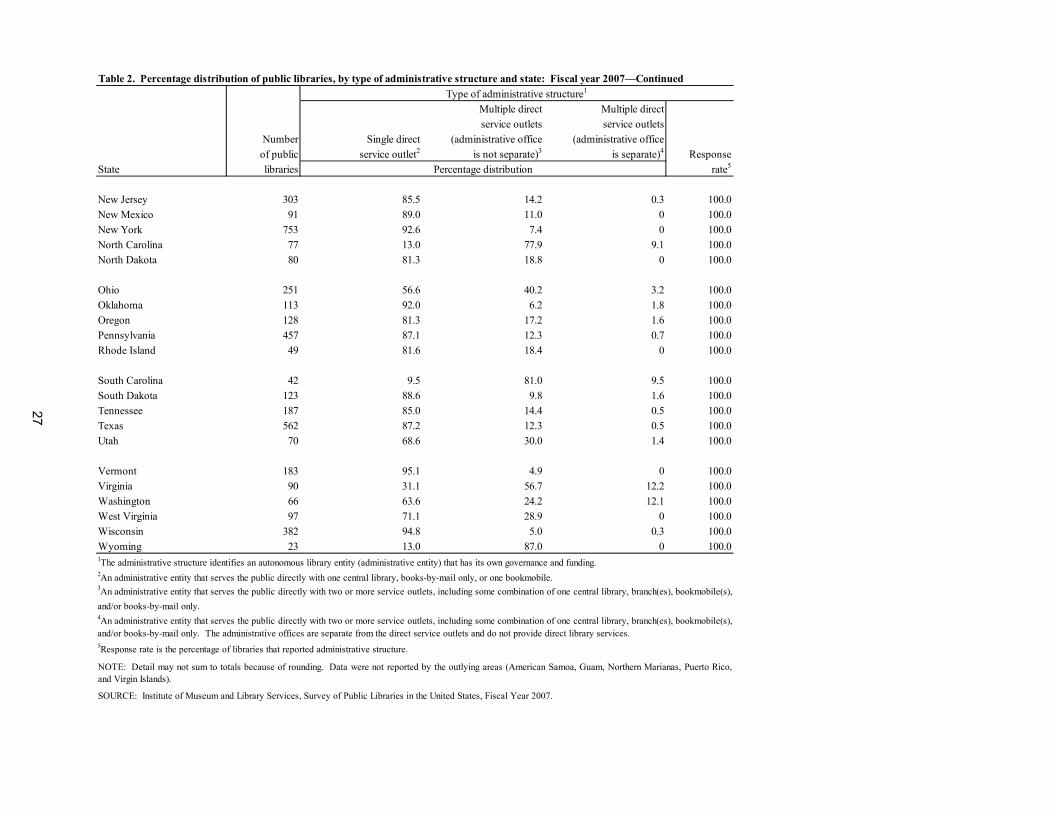
• In FY 2007, 81 percent of public libraries had one single direct-service outlet (an outlet that provides service directly to the public) (Table 2). Nineteen percent had more than one direct-service outlet. Both of these percentages are equal to their FY 2006 levels. Types of direct-service outlets include central library outlets, branch library outlets, and bookmobile outlets.
• A total of 1,544 public libraries (17 percent) had one or more branch library outlets, with a total of
7,564 branch outlets (Table 3). The total number of central library outlets was 9,040. The total number of stationary outlets (central library outlets and branch library outlets) was 16,604. Nine percent of public libraries had one or more bookmobile outlets, with a total of 808 bookmobiles.
• Ten percent of public libraries had an average number of weekly public service hours per outlet of
less than 20 hours, 38 percent had weekly public service hours per outlet of 20-39 hours, and 52 percent had weekly public service hours per outlet of 40 hours or more (Table 4).
5 http://www.measuringworth.com/uscompare/ 6 Of the 9,214 public libraries, 7,463 were single-outlet libraries and 1,751 were multiple-outlet libraries. 7 See the glossary (Appendix C) for definitions of the terms used in this report. 8 This percentage was derived by dividing the total unduplicated population of legal service areas for the 50 states and the District of Columbia by the sum of their official state total population estimates. The estimates were obtained from the State Data Center or other official state sources (Table 1). The percentage is based on unrounded data. (Also see Data File, Public Use: Public Libraries Survey: Fiscal Year 2007).
5
Legal Basis and Interlibrary Relationships
• The majority of public libraries (85 percent) are public agencies connected to some form of local government. In FY 2007, 53 percent of public libraries were part of a municipal government, 15 percent were separate government units known as library districts, 10 percent were part of a county/parish, 3 percent had multijurisdictional legal basis under an intergovernmental agreement, 2 percent were part of a school district, 1 percent were part of a city/county, and 2 percent reported their legal basis as “other”.9 Fifteen percent of public libraries were operated by nonprofit associations/agencies; this means that they were privately controlled, but met the legal definition of a public library in the states in which they were located (Table 5).
• Though the majority of public libraries report single jurisdictions, many belong to broader service
networks. Seventy-five percent of public libraries were members of a federation or cooperative service, while 23 percent were not. One percent served as the headquarters of a federation or cooperative service (Table 7).10
9 This and other percentage totals in the report may not sum to 100 percent because of rounding. 10 Libraries that identify themselves as the headquarters of a federation or cooperative service are not included in the count of members of a federation or cooperative service.
Library Services Total Circulation, Interlibrary Loans, Reference Transactions, and Library Visits
6.4
6.5
6.6
6.7
6.8
6.9
7.0
7.1
7.2
7.3
7.4
7.5
1998 1999 2000 2001 2002 2003 2004 2005 2006 2007
Per C
apita
Circulatio
n
Fiscal Year
Figure 1: Per Capita Circulation in Public Libraries in the US,FY1998‐FY2007
Source: Public Library Survey, FY1998‐FY2007, Institute of Museum and Library Services /National Center for Education Statistics
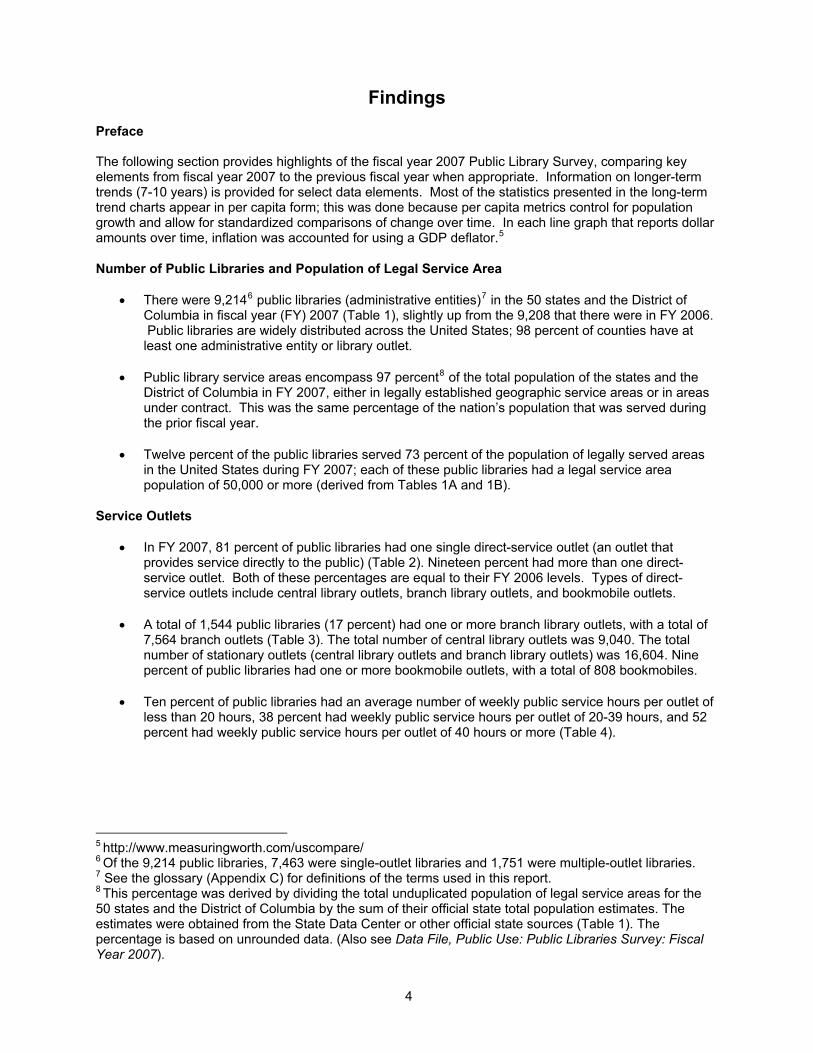
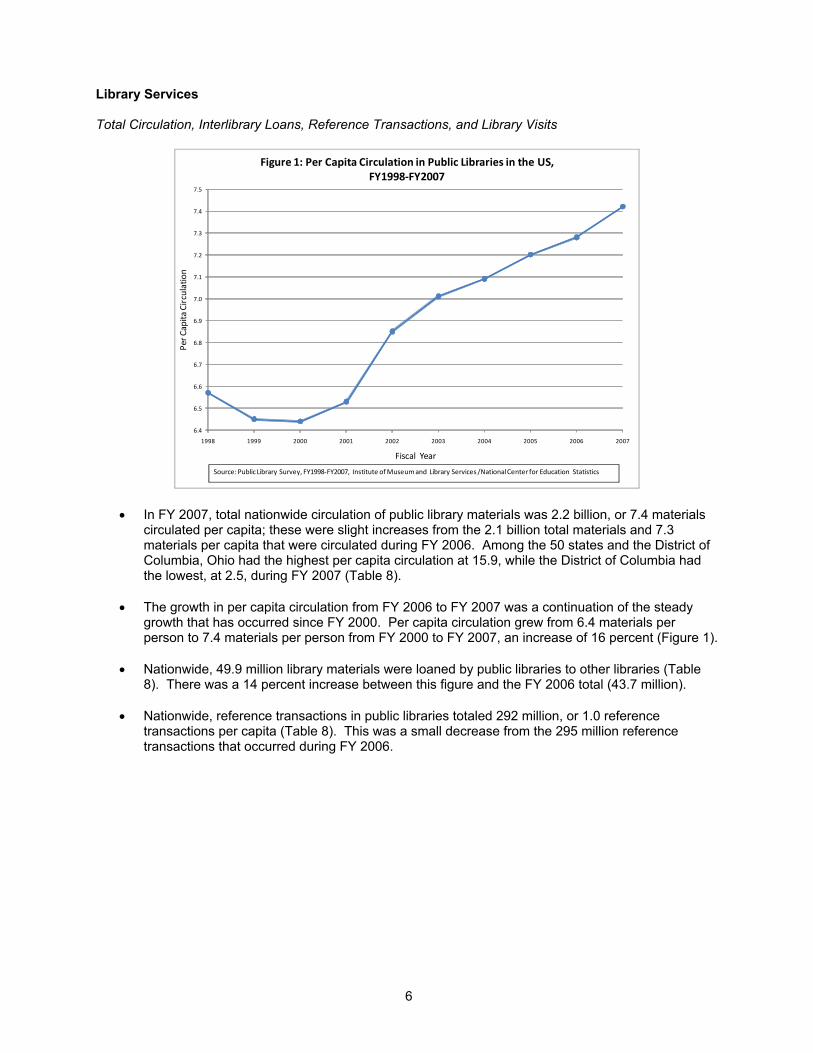
• In FY 2007, total nationwide circulation of public library materials was 2.2 billion, or 7.4 materials circulated per capita; these were slight increases from the 2.1 billion total materials and 7.3 materials per capita that were circulated during FY 2006. Among the 50 states and the District of Columbia, Ohio had the highest per capita circulation at 15.9, while the District of Columbia had the lowest, at 2.5, during FY 2007 (Table 8).
• The growth in per capita circulation from FY 2006 to FY 2007 was a continuation of the steady growth that has occurred since FY 2000. Per capita circulation grew from 6.4 materials per person to 7.4 materials per person from FY 2000 to FY 2007, an increase of 16 percent (Figure 1).
• Nationwide, 49.9 million library materials were loaned by public libraries to other libraries (Table
8). There was a 14 percent increase between this figure and the FY 2006 total (43.7 million).
• Nationwide, reference transactions in public libraries totaled 292 million, or 1.0 reference transactions per capita (Table 8). This was a small decrease from the 295 million reference transactions that occurred during FY 2006.
6
4.2
4.3
4.4
4.5
4.6
4.7
4.8
4.9
5.0
1998 1999 2000 2001 2002 2003 2004 2005 2006 2007
Per C
apita
Visits
Fiscal Year
Figure 2: Per Capita Visits to Public Libraries in the US, FY1998‐FY2007
Source:Public Library Survey, FY1998‐FY2007, Institute of Museum and Library Services /National Center for Education Statistics
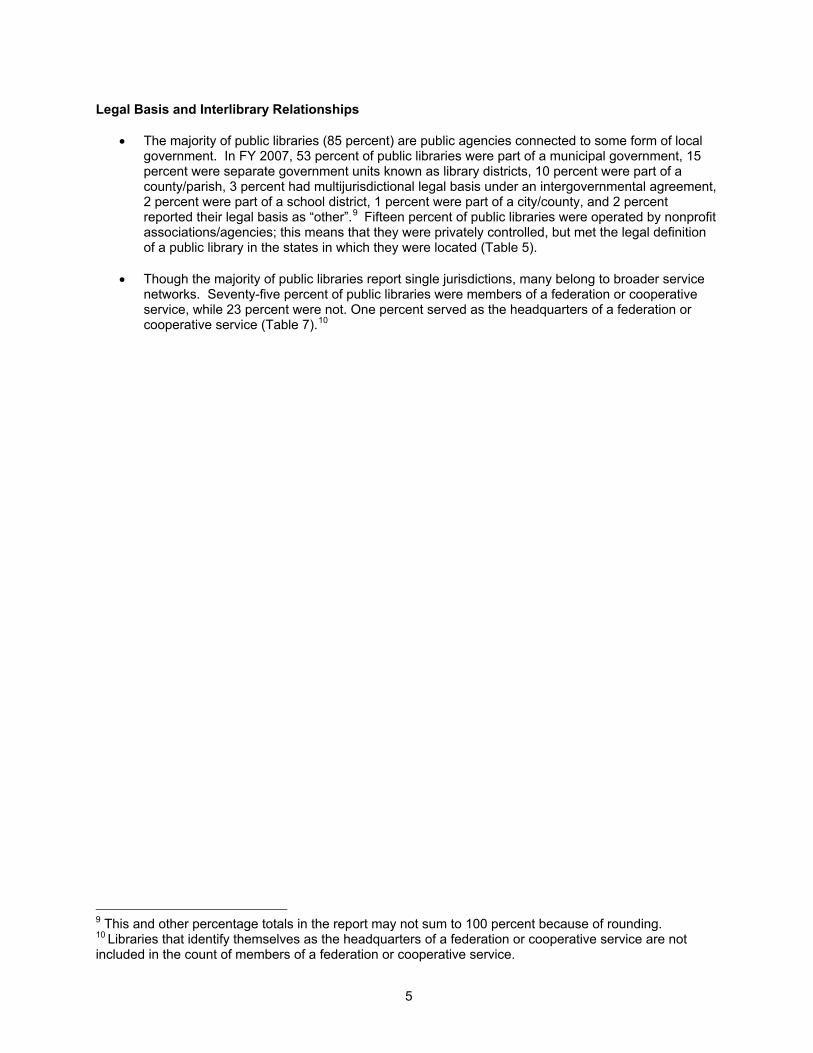
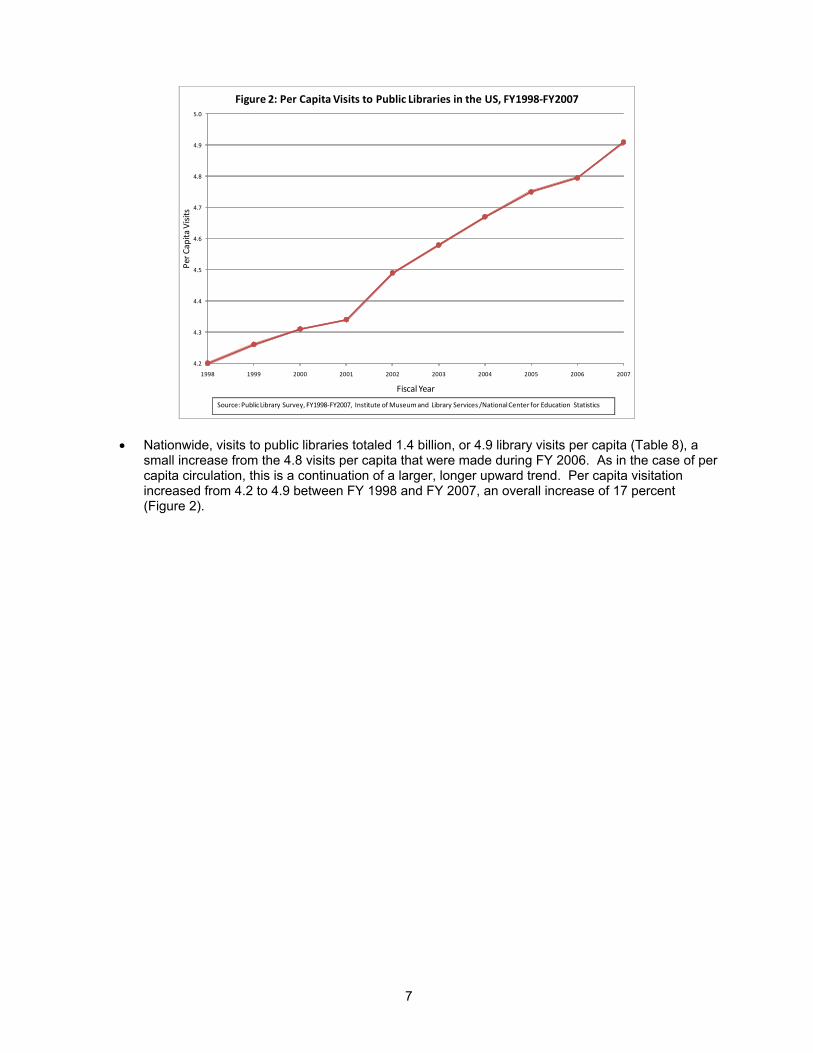
• Nationwide, visits to public libraries totaled 1.4 billion, or 4.9 library visits per capita (Table 8), a small increase from the 4.8 visits per capita that were made during FY 2006. As in the case of per capita circulation, this is a continuation of a larger, longer upward trend. Per capita visitation increased from 4.2 to 4.9 between FY 1998 and FY 2007, an overall increase of 17 percent (Figure 2).
7
8
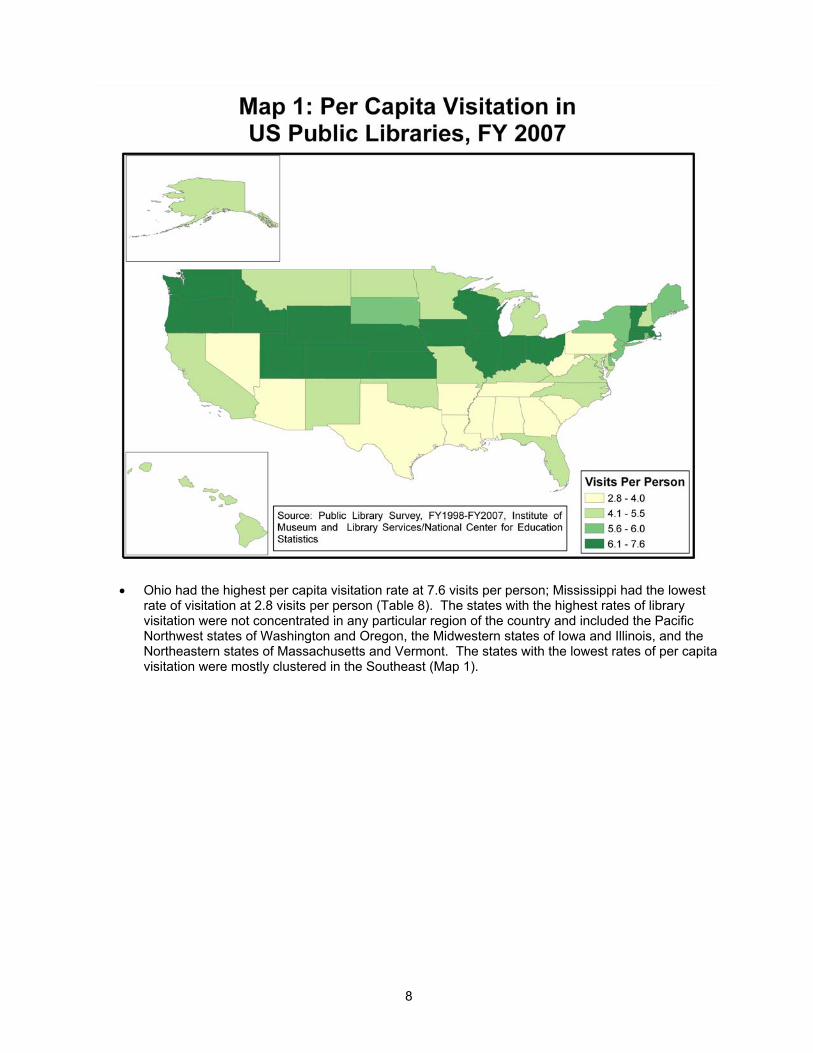
• Ohio had the highest per capita visitation rate at 7.6 visits per person; Mississippi had the lowest
rate of visitation at 2.8 visits per person (Table 8). The states with the highest rates of library visitation were not concentrated in any particular region of the country and included the Pacific Northwest states of Washington and Oregon, the Midwestern states of Iowa and Illinois, and the Northeastern states of Massachusetts and Vermont. The states with the lowest rates of per capita visitation were mostly clustered in the Southeast (Map 1).
Children’s Services
• Nationwide circulation of children’s materials was 739.7 million, or 34 percent of total circulation during FY 2007. While the absolute number increased from 728.1 million the prior year, the percentage of total circulation that children’s circulation comprised was basically unchanged from its FY 2006 level of 35 percent. Attendance at children’s programs was 59.0 million in FY 2007, up from 57.6 million the prior year (Table 9).
Electronic Services
1.75
2.00
2.25
2.50
2.75
3.00
3.25
3.50
3.75
2000 2001 2002 2003 2004 2005 2006 2007
PCs Per 5,00
0 Peop
le
Fiscal Year
Figure 3: Number of Internet PCs in Public Libraries Per 5,000 People, FY2000‐FY2007
Source: Public Library Survey, FY2000‐FY2007, Institute of Museum and Library Services /National Center for Education Statistics
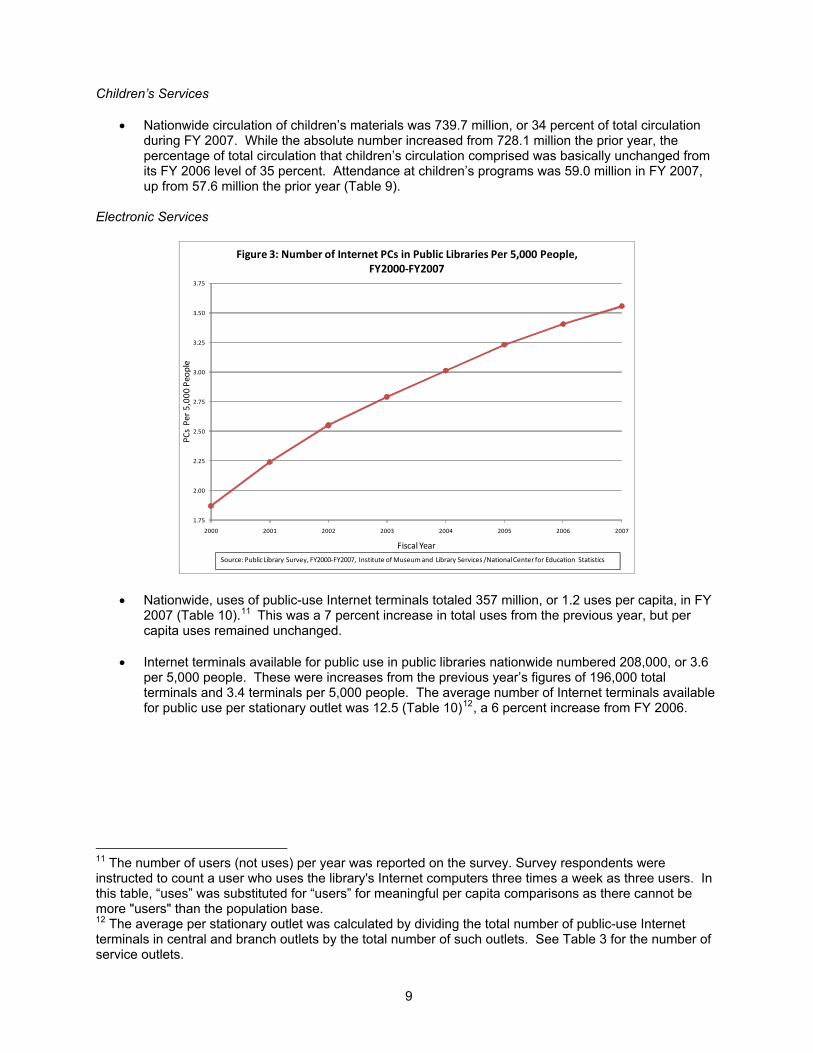
• Nationwide, uses of public-use Internet terminals totaled 357 million, or 1.2 uses per capita, in FY 2007 (Table 10).11 This was a 7 percent increase in total uses from the previous year, but per capita uses remained unchanged.
• Internet terminals available for public use in public libraries nationwide numbered 208,000, or 3.6 per 5,000 people. These were increases from the previous year’s figures of 196,000 total terminals and 3.4 terminals per 5,000 people. The average number of Internet terminals available for public use per stationary outlet was 12.5 (Table 10)12, a 6 percent increase from FY 2006.
11 The number of users (not uses) per year was reported on the survey. Survey respondents were instructed to count a user who uses the library's Internet computers three times a week as three users. In this table, “uses” was substituted for “users” for meaningful per capita comparisons as there cannot be more "users" than the population base.
9
12 The average per stationary outlet was calculated by dividing the total number of public-use Internet terminals in central and branch outlets by the total number of such outlets. See Table 3 for the number of service outlets.
10
• The increase in the number of Internet PCs per 5,000 people from FY 2006 to FY 2007 continued the longer term trend of providing more Internet terminals for library patrons. The number of Internet PCs per 5,000 people grew from 1.9 in FY 2000 to 3.6 in FY 2007, an increase of 89 percent (Figure 3).
Collections
• Nationwide, public libraries had 812.5 million print materials in their collections, or 2.8 volumes per capita, in FY 2007. This was a slight increase from the nationwide total of 807.2 million print materials in FY 2006, but the number of volumes per capita remained the same. By state, the number of print materials per capita ranged from 1.5 in Arizona to 5.5 in Maine (Table 11) during FY 2007.
• Public libraries nationwide had 45.9 million audio materials in FY 2007, an 8 percent increase from
the previous year. They held 46.3 million video materials in FY 2007, an increase of 6 percent over the previous fiscal year (Table 11).
Staffing
9.0
9.5
10.0
10.5
11.0
11.5
12.0
12.5
13.0
1998 1999 2000 2001 2002 2003 2004 2005 2006 2007
Staff Per 25,00
0 Peop
le
Fiscal Year
Figure 4: Paid Staff in Public Libraries per 25,000 People, FY1998‐FY2007
Source:Public Library Survey, FY1998‐FY2007, Institute of Museum and Library Services /National Center for Education Statistics
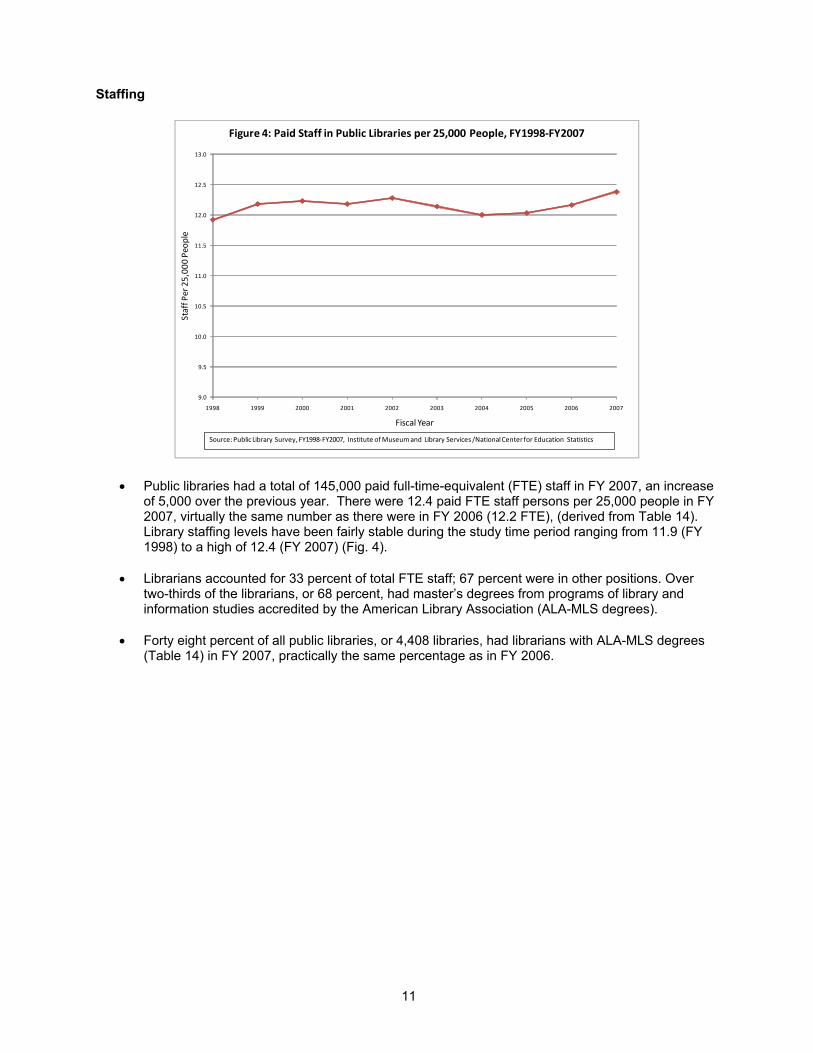
• Public libraries had a total of 145,000 paid full-time-equivalent (FTE) staff in FY 2007, an increase of 5,000 over the previous year. There were 12.4 paid FTE staff persons per 25,000 people in FY 2007, virtually the same number as there were in FY 2006 (12.2 FTE), (derived from Table 14). Library staffing levels have been fairly stable during the study time period ranging from 11.9 (FY 1998) to a high of 12.4 (FY 2007) (Fig. 4).
• Librarians accounted for 33 percent of total FTE staff; 67 percent were in other positions. Over
two-thirds of the librarians, or 68 percent, had master’s degrees from programs of library and information studies accredited by the American Library Association (ALA-MLS degrees).
• Forty eight percent of all public libraries, or 4,408 libraries, had librarians with ALA-MLS degrees
(Table 14) in FY 2007, practically the same percentage as in FY 2006.
11
12
Operating Revenue and Expenditures Operating Revenue
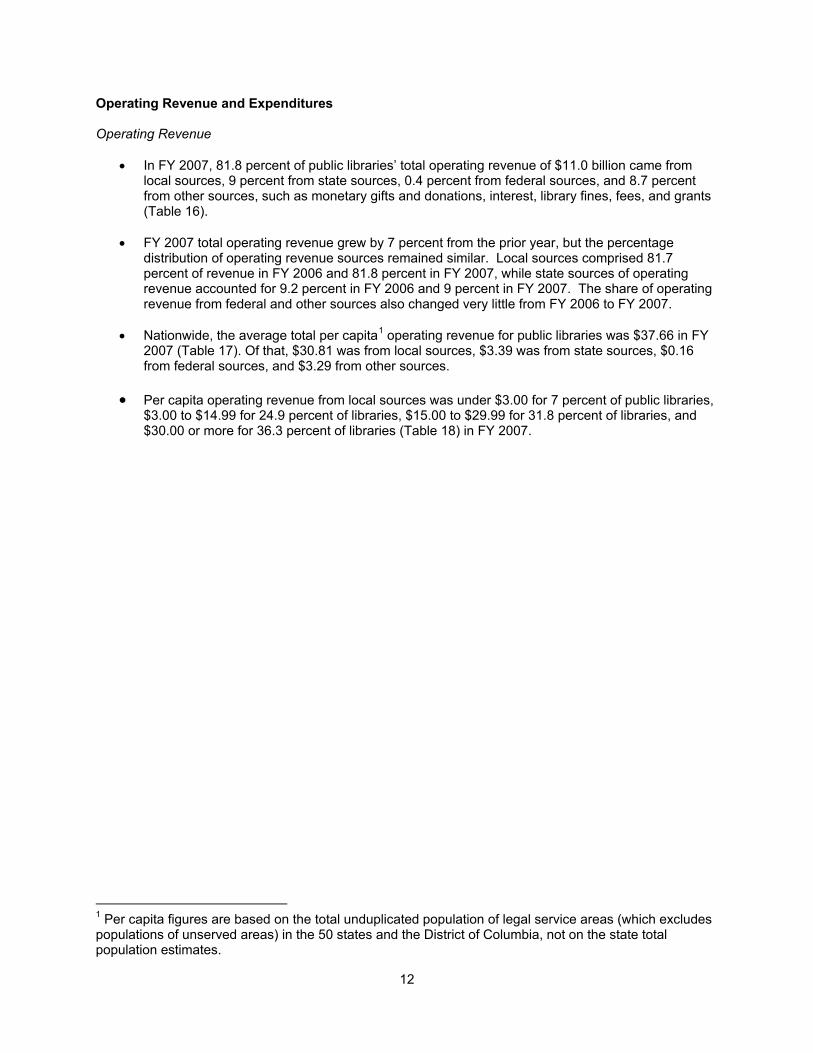
• In FY 2007, 81.8 percent of public libraries’ total operating revenue of $11.0 billion came from local sources, 9 percent from state sources, 0.4 percent from federal sources, and 8.7 percent from other sources, such as monetary gifts and donations, interest, library fines, fees, and grants (Table 16).
• FY 2007 total operating revenue grew by 7 percent from the prior year, but the percentage
distribution of operating revenue sources remained similar. Local sources comprised 81.7 percent of revenue in FY 2006 and 81.8 percent in FY 2007, while state sources of operating revenue accounted for 9.2 percent in FY 2006 and 9 percent in FY 2007. The share of operating revenue from federal and other sources also changed very little from FY 2006 to FY 2007.
• Nationwide, the average total per capita1
operating revenue for public libraries was $37.66 in FY 2007 (Table 17). Of that, $30.81 was from local sources, $3.39 was from state sources, $0.16 from federal sources, and $3.29 from other sources.
• Per capita operating revenue from local sources was under $3.00 for 7 percent of public libraries, $3.00 to $14.99 for 24.9 percent of libraries, $15.00 to $29.99 for 31.8 percent of libraries, and $30.00 or more for 36.3 percent of libraries (Table 18) in FY 2007.
1 Per capita figures are based on the total unduplicated population of legal service areas (which excludes populations of unserved areas) in the 50 states and the District of Columbia, not on the state total population estimates.
13
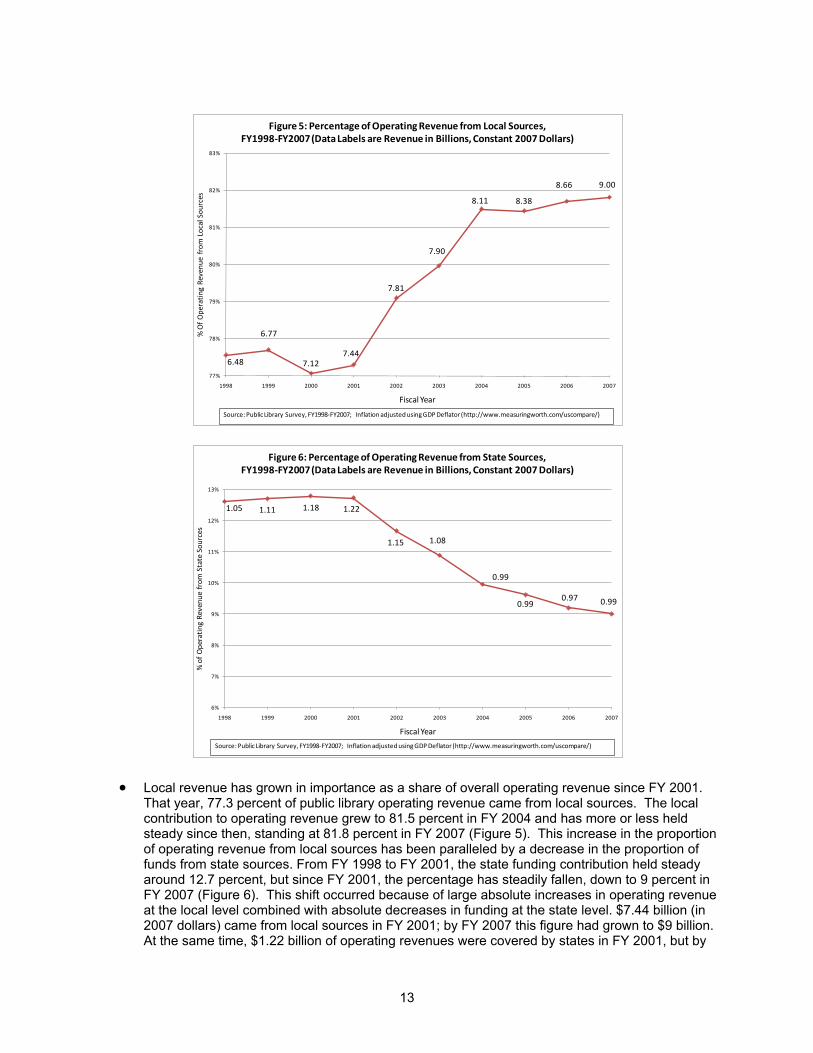
• Local revenue has grown in importance as a share of overall operating revenue since FY 2001. That year, 77.3 percent of public library operating revenue came from local sources. The local contribution to operating revenue grew to 81.5 percent in FY 2004 and has more or less held steady since then, standing at 81.8 percent in FY 2007 (Figure 5). This increase in the proportion of operating revenue from local sources has been paralleled by a decrease in the proportion of funds from state sources. From FY 1998 to FY 2001, the state funding contribution held steady around 12.7 percent, but since FY 2001, the percentage has steadily fallen, down to 9 percent in FY 2007 (Figure 6). This shift occurred because of large absolute increases in operating revenue at the local level combined with absolute decreases in funding at the state level. $7.44 billion (in 2007 dollars) came from local sources in FY 2001; by FY 2007 this figure had grown to $9 billion. At the same time, $1.22 billion of operating revenues were covered by states in FY 2001, but by
6.48
6.77
7.127.44
7.81
7.90
8.11 8.38
8.66 9.00
77%
78%
79%
80%
81%
82%
83%
1998 1999 2000 2001 2002 2003 2004 2005 2006 2007
% O
f O
pera
ting
Rev
enue
fro
m L
ocal
Sou
rces
Fiscal Year
Figure 5: Percentage of Operating Revenue from Local Sources, FY1998-FY2007 (Data Labels are Revenue in Billions, Constant 2007 Dollars)
Source: Public Library Survey, FY1998-FY2007; Inflation adjusted using GDP Deflator (http://www.measuringworth.com/uscompare/)
1.05 1.11 1.18 1.22
1.15 1.08
0.99
0.990.97 0.99
6%
7%
8%
9%
10%
11%
12%
13%
1998 1999 2000 2001 2002 2003 2004 2005 2006 2007
% o
f O
pera
ting
Rev
enue
fro
m S
tate
Sou
rces
Fiscal Year
Figure 6: Percentage of Operating Revenue from State Sources, FY1998-FY2007 (Data Labels are Revenue in Billions, Constant 2007 Dollars)
Source: Public Library Survey, FY1998-FY2007; Inflation adjusted using GDP Deflator (http://www.measuringworth.com/uscompare/)

14
FY 2007, this figure had decreased to $991 million (Figures 5 and 6). Operating revenue from federal sources (0.6 percent in FY 2001, 0.4 percent in FY 2007) and ‘other’ sources (9.4 percent in FY 2001, 8.7 percent in FY 2007) remained comparatively flat over the same time period.
Operating Expenditures
$29
$30
$31
$32
$33
$34
$35
1998 1999 2000 2001 2002 2003 2004 2005 2006 2007
Per C
apita Operating
Expenditures ($)
Fiscal Year
Figure 7: Per Capita Operating Expenditures in US Public Libraries, FY1998‐FY2007 (in Constant 2007 Dollars)
Source:Public Library Survey, FY1998‐FY2007; Inflation adjusted using GDP Deflator (http://www.measuringworth.com/uscompare/)
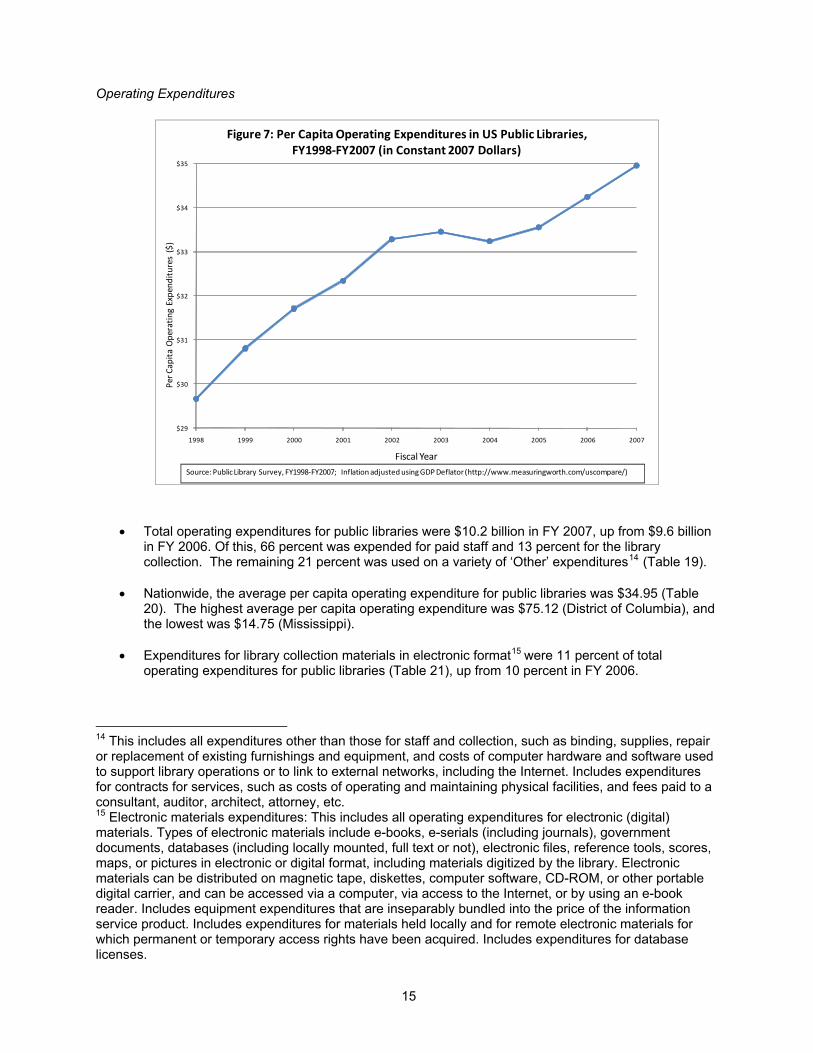
• Total operating expenditures for public libraries were $10.2 billion in FY 2007, up from $9.6 billion in FY 2006. Of this, 66 percent was expended for paid staff and 13 percent for the library collection. The remaining 21 percent was used on a variety of ‘Other’ expenditures14 (Table 19).
• Nationwide, the average per capita operating expenditure for public libraries was $34.95 (Table
20). The highest average per capita operating expenditure was $75.12 (District of Columbia), and the lowest was $14.75 (Mississippi).
• Expenditures for library collection materials in electronic format15 were 11 percent of total
operating expenditures for public libraries (Table 21), up from 10 percent in FY 2006.
14 This includes all expenditures other than those for staff and collection, such as binding, supplies, repair or replacement of existing furnishings and equipment, and costs of computer hardware and software used to support library operations or to link to external networks, including the Internet. Includes expenditures for contracts for services, such as costs of operating and maintaining physical facilities, and fees paid to a consultant, auditor, architect, attorney, etc.
15
15 Electronic materials expenditures: This includes all operating expenditures for electronic (digital) materials. Types of electronic materials include e-books, e-serials (including journals), government documents, databases (including locally mounted, full text or not), electronic files, reference tools, scores, maps, or pictures in electronic or digital format, including materials digitized by the library. Electronic materials can be distributed on magnetic tape, diskettes, computer software, CD-ROM, or other portable digital carrier, and can be accessed via a computer, via access to the Internet, or by using an e-book reader. Includes equipment expenditures that are inseparably bundled into the price of the information service product. Includes expenditures for materials held locally and for remote electronic materials for which permanent or temporary access rights have been acquired. Includes expenditures for database licenses.
16
• Twenty five percent of public libraries had operating expenditures of less than $50,000, 42 percent expended $50,000 to $399,999, and 34 percent expended $400,000 or more (Table 22). • Per capita operating expenditures have trended upwards since FY 1998, rising from $29.66 that year to their FY 2007 level of $34.95, an increase of 18 percent (Figure 7 – these figures have been adjusted for inflation and are in 2007 dollars). Summary Remarks The Public Library Survey data presented here suggests that demand for public library services is increasing over time; per person visitation and circulation have both steadily risen during the last 10 years for which data are available. Information technology resources for the public have increased steadily over the same period. The data also highlights some significant changes in key areas of library administration. Per person operating costs increased by 18 percent from FY 1998 to FY 2007. The share of operating revenues from local sources increased from 77.3 percent to 81.8 percent from FY 2001 to FY 2007. At the same time, the share of operating revenue from state sources decreased from 12.7 percent to 9 percent. The FY 2007 operating revenue figures were reported before the full budgetary impact of the recent economic downturn was felt by states and localities. IMLS reports will continue to document these trends during subsequent fiscal years.

17
References
Podolsky, A. (1991). Public Libraries in 50 States and the District of Columbia: 1989 (NCES 91-343). U.S. Department of Education, Institute of Education Sciences. Washington, DC: National Center for Education Statistics.
Institute of Museum and Library Services, Survey of Public Libraries in the United States, Fiscal Year 2006 Data files, available at http://harvester.census.gov/imls/data/pls/index.asp.
.

18
(Page is intentionally blank.)

Tables
19
20
official state population estimate, by state: Fiscal year 2007Population Unduplicated population Official state
of legal service area2 of legal service area3 population estimate4
Numberof public Total Response Total Response Total Response
State libraries1 (in thousands) rate5 (in thousands) rate5 (in thousands) rate5
Total 9,214 295,539 100.0 292,029 100.0 300,008 100.0
Alabama 208 4,298 100.0 4,298 100.0 4,298 100.0Alaska 87 677 100.0 677 100.0 677 100.0Arizona 83 6,287 100.0 6,287 100.0 6,305 100.0Arkansas 48 2,694 100.0 2,656 100.0 2,776 100.0California 181 37,662 100.0 37,662 100.0 37,663 100.0
Colorado 115 4,756 100.0 4,696 100.0 4,814 100.0Connecticut 195 4,295 100.0 3,511 100.0 3,511 100.0Delaware 21 790 100.0 784 100.0 784 100.0District of Columbia 1 582 100.0 582 100.0 582 100.0Florida 79 18,829 100.0 18,597 100.0 18,680 100.0
Georgia 58 9,098 100.0 9,098 100.0 9,098 100.0Hawaii 1 1,285 100.0 1,285 100.0 1,285 100.0Idaho 104 1,329 100.0 1,309 100.0 1,499 100.0Illinois 623 11,584 100.0 11,584 100.0 12,853 100.0Indiana 239 5,813 100.0 5,692 100.0 6,080 100.0
Iowa 539 2,851 100.0 2,851 100.0 2,988 100.0Kansas 326 2,356 100.0 2,351 100.0 2,764 100.0Kentucky 116 4,169 100.0 4,169 100.0 4,206 100.0Louisiana 67 4,325 100.0 4,293 100.0 4,293 100.0Maine 272 1,378 100.0 1,186 100.0 1,334 100.0
Maryland 24 5,558 100.0 5,558 100.0 5,558 100.0Massachusetts 370 6,461 100.0 6,436 100.0 6,437 100.0Michigan 386 9,963 100.0 9,932 100.0 9,953 100.0Minnesota 139 5,650 100.0 5,231 100.0 5,231 100.0Mississippi 50 2,940 100.0 2,919 100.0 2,919 100.0
Missouri 152 5,126 100.0 5,126 100.0 5,878 100.0Montana 80 900 100.0 900 100.0 900 100.0Nebraska 271 1,338 100.0 1,299 100.0 1,711 100.0Nevada 22 2,718 100.0 2,718 100.0 2,718 100.0New Hampshire 230 1,436 100.0 1,304 100.0 1,315 100.0See notes at end of table.
Table 1. Number of public libraries, population of legal service area, unduplicated population of legal service area, and
21
Table 1. Number of public libraries, population of legal service area, unduplicated population of legal service area, and official state population estimate, by state: Fiscal year 2007—Continued
Population Unduplicated population Official state of legal service area2 of legal service area3 population estimate4
Numberof public Total Response Total Response Total Response
State libraries1 (in thousands) rate5 (in thousands) rate5 (in thousands) rate5
New Jersey 303 9,037 100.0 8,336 100.0 8,414 100.0New Mexico 91 1,532 100.0 1,532 100.0 1,955 100.0New York 753 19,054 100.0 18,928 100.0 18,928 100.0North Carolina 77 8,860 100.0 8,860 100.0 8,860 100.0North Dakota 80 570 100.0 551 100.0 642 100.0
Ohio 251 11,500 100.0 11,498 100.0 11,498 100.0Oklahoma 113 2,944 100.0 2,944 100.0 3,617 100.0Oregon 128 3,375 100.0 3,375 100.0 3,690 100.0Pennsylvania 457 12,056 100.0 11,999 100.0 12,284 100.0Rhode Island 49 1,316 100.0 1,068 100.0 1,068 100.0
South Carolina 42 4,326 100.0 4,321 100.0 4,321 100.0South Dakota 123 699 100.0 685 100.0 782 100.0Tennessee 187 6,007 100.0 5,963 100.0 5,963 100.0Texas 562 21,898 100.0 21,898 100.0 23,508 100.0Utah 70 2,571 100.0 2,571 100.0 2,571 100.0
Vermont 183 732 100.0 597 100.0 624 100.0Virginia 90 7,581 100.0 7,581 100.0 7,712 100.0Washington 66 6,361 100.0 6,361 100.0 6,488 100.0West Virginia 97 1,808 100.0 1,808 100.0 1,808 100.0Wisconsin 382 5,648 100.0 5,648 100.0 5,648 100.0Wyoming 23 515 100.0 515 100.0 515 100.0
NOTE: A state's total population of legal service area may be larger than the state's total unduplicated population of legal service area or the official statepopulation estimate because some public libraries have overlapping service areas. Detail may not sum to totals because of rounding. Data were not reported by theoutlying areas (American Samoa, Guam, Northern Marianas, Puerto Rico, and Virgin Islands).SOURCE: Institute of Museum and Library Services, Survey of Public Libraries in the United States, Fiscal Year 2007.
1A public library is an administrative entity, the agency that is legally established under local or state law to provide public library service to the population of a localjurisdiction. The administrative entity may have a single public library service outlet, or it may have more than one outlet. The types of administrative structures forpublic libraries are reported in table 2. See table 3 for additional information on outlets.2The number of people in the geographic area for which a public library has been established to offer services and from which (or on behalf of which) the libraryderives revenue, plus any areas served under contract for which the library is the primary service provider. The determination of this figure is the responsibility of the state library agency and should be based on the most recent official state population figures for jurisdictions in the state available from the State Data Center or otherofficial state sources.
4This is the most recent official total population figure for the state that matches the local population figures that are submitted to IMLS. The state data coordinatorfor the state library agency is instructed to obtain the figure annually from the State Data Center or other official state sources.
3This is the total unduplicated population of those areas in the state that receive library services. The determination of this figure is the responsibility of the statelibrary agency and should be based on the most recent official state population figures for jurisdictions in the state. The population of unserved areas is not includedin this figure.
5Response rate is the percentage of libraries that reported the item.
22
Population of legal service area1
Less 1,000 2,500 5,000 10,000 25,000 50,000 100,000 250,000 500,000 1,000,000Number than to to to to to to to to to or
of public 1,000 2,499 4,999 9,999 24,999 49,999 99,999 249,999 499,999 999,999 more ResponseState libraries Percentage distribution rate2
Total 9,214 11.6 16.5 14.5 16.1 19.1 10.3 6.0 3.6 1.1 0.6 0.3 100.0
Alabama 208 8.7 22.1 14.9 16.3 20.2 8.2 6.7 1.4 1.4 † † 100.0Alaska 87 60.9 12.6 10.3 8.0 3.4 2.3 † 1.1 1.1 † † 100.0Arizona 83 8.4 13.3 12.0 15.7 18.1 12.0 4.8 10.8 1.2 2.4 1.2 100.0Arkansas 48 † † † 10.4 20.8 22.9 33.3 10.4 2.1 † † 100.0California 181 0.6 1.7 0.6 1.7 12.7 15.5 26.5 25.4 6.6 4.4 4.4 100.0
Colorado 115 7.8 18.3 15.7 17.4 18.3 8.7 3.5 5.2 2.6 2.6 † 100.0Connecticut 195 0.5 7.7 10.3 21.5 32.8 15.9 8.7 2.6 † † † 100.0Delaware 21 † † † 28.6 42.9 14.3 9.5 † 4.8 † † 100.0District of Columbia 1 † † † † † † † † † 100.0 † 100.0Florida 79 † 2.5 1.3 3.8 15.2 12.7 17.7 19.0 13.9 8.9 5.1 100.0
Georgia 58 † † † † 13.8 15.5 25.9 25.9 12.1 6.9 † 100.0Hawaii 1 † † † † † † † † † † 100.0 100.0Idaho 104 20.2 22.1 14.4 18.3 10.6 8.7 4.8 1.0 † † † 100.0Illinois 623 6.6 22.2 18.5 15.7 19.6 11.4 4.7 1.3 † † 0.2 100.0Indiana 239 3.8 18.0 15.9 19.2 19.7 12.6 6.7 3.3 0.4 0.4 † 100.0
Iowa 539 33.2 31.2 15.8 9.3 6.3 2.4 1.5 0.4 † † † 100.0Kansas 326 42.9 27.0 13.5 6.7 5.8 1.8 0.6 0.9 0.6 † † 100.0Kentucky 116 † 0.9 1.7 12.1 49.1 22.4 9.5 2.6 0.9 0.9 † 100.0Louisiana 67 † 1.5 1.5 6.0 35.8 22.4 13.4 14.9 4.5 † † 100.0Maine 272 14.7 31.3 22.8 19.1 10.7 1.1 0.4 † † † † 100.0
Maryland 24 † † † † 4.2 29.2 20.8 20.8 4.2 20.8 † 100.0Massachusetts 370 7.6 12.7 12.7 18.6 29.5 12.4 5.1 1.1 † 0.3 † 100.0Michigan 386 2.1 5.7 20.2 25.1 24.9 10.9 6.0 4.1 0.8 0.3 † 100.0Minnesota 139 10.1 23.0 15.1 15.8 15.1 5.8 2.9 7.2 4.3 0.7 † 100.0Mississippi 50 † † 2.0 8.0 16.0 34.0 26.0 12.0 2.0 † † 100.0
Missouri 152 3.9 17.8 16.4 17.1 22.4 10.5 5.9 3.3 1.3 1.3 † 100.0Montana 80 7.5 27.5 22.5 18.8 15.0 2.5 5.0 1.3 † † † 100.0Nebraska 271 58.3 22.5 7.4 5.9 3.0 2.2 † 0.4 0.4 † † 100.0Nevada 22 † 18.2 18.2 9.1 9.1 9.1 18.2 4.5 9.1 † 4.5 100.0New Hampshire 230 13.0 31.7 23.5 17.8 9.6 3.5 0.4 0.4 † † † 100.0
Table 1A. Percentage distribution of public libraries, by population of legal service area and state: Fiscal year 2007
See notes at end of table.
Population of legal service area1
Less 1,000 2,500 5,000 10,000 25,000 50,000 100,000 250,000 500,000 1,000,000Number than to to to to to to to to to or
of public 1,000 2,499 4,999 9,999 24,999 49,999 99,999 249,999 499,999 999,999 more ResponseState libraries Percentage distribution rate2
New Jersey 303 † 5.3 8.3 26.1 33.3 14.2 8.3 3.0 1.3 0.3 † 100.0New Mexico 91 26.4 16.5 16.5 18.7 9.9 5.5 4.4 1.1 † 1.1 † 100.0New York 753 9.3 19.9 17.4 18.6 18.6 11.2 3.6 0.8 0.1 0.1 0.4 100.0North Carolina 77 † † 2.6 1.3 7.8 16.9 32.5 31.2 5.2 2.6 † 100.0North Dakota 80 35.0 30.0 11.3 6.3 11.3 2.5 3.8 † † † † 100.0
Ohio 251 1.2 2.0 8.0 22.7 27.5 17.1 12.0 6.0 2.4 1.2 † 100.0Oklahoma 113 8.0 28.3 22.1 14.2 15.9 5.3 1.8 1.8 0.9 1.8 † 100.0Oregon 128 13.3 14.1 12.5 15.6 24.2 8.6 5.5 5.5 † 0.8 † 100.0Pennsylvania 457 0.7 6.8 13.3 21.2 33.7 15.3 6.1 2.0 0.7 † 0.2 100.0Rhode Island 49 † 2.0 6.1 14.3 40.8 26.5 8.2 2.0 † † † 100.0
South Carolina 42 † † † † 14.3 26.2 23.8 26.2 9.5 † † 100.0South Dakota 123 39.0 29.3 12.2 8.1 8.1 1.6 0.8 0.8 † † † 100.0Tennessee 187 10.2 4.8 8.0 19.3 27.8 17.6 8.0 2.1 1.1 1.1 † 100.0Texas 562 3.2 12.5 18.9 20.8 19.9 13.0 5.3 4.1 1.1 0.5 0.7 100.0Utah 70 4.3 11.4 18.6 18.6 20.0 15.7 2.9 5.7 1.4 1.4 † 100.0
Vermont 183 19.1 39.3 23.0 10.4 6.6 1.1 0.5 † † † † 100.0Virginia 90 † 2.2 2.2 4.4 22.2 26.7 20.0 14.4 6.7 † 1.1 100.0Washington 66 10.6 16.7 7.6 12.1 15.2 9.1 6.1 13.6 3.0 4.5 1.5 100.0West Virginia 97 1.0 4.1 18.6 28.9 27.8 9.3 9.3 1.0 † † † 100.0Wisconsin 382 4.7 19.6 25.1 19.1 19.4 7.1 3.1 1.3 0.3 0.3 † 100.0Wyoming 23 † 4.3 4.3 26.1 30.4 26.1 8.7 † † † † 100.0
NOTE: Detail may not sum to totals because of rounding. Data were not reported by the outlying areas (American Samoa, Guam, Northern Marianas, Puerto Rico, and Virgin Islands).
Table 1A. Percentage distribution of public libraries, by population of legal service area and state: Fiscal year 2007—Continued
SOURCE: Institute of Museum and Library Services, Survey of Public Libraries in the United States, Fiscal Year 2007.
† Not applicable.1The number of people in the geographic area for which a public library has been established to offer services and from which (or on behalf of which) the library derives revenue, plus any areas served under contract for which the libraryis the primary service provider. (See table 1.)2Response rate is the percentage of libraries that reported population of legal service area.
23
Population of legal service area1
Less 1,000 2,500 5,000 10,000 25,000 50,000 100,000 250,000 500,000 1,000,000Number Total than to to to to to to to to to or
of public population 1,000 2,499 4,999 9,999 24,999 49,999 99,999 249,999 499,999 999,999 more ResponseState libraries (in thousands) Percentage distribution rate2
Total 9,214 295,539 0.2 0.9 1.7 3.6 9.6 11.3 13.2 17.7 12.2 13.9 15.8 100.0
Alabama 208 4,298 0.3 1.9 2.7 5.7 16.0 14.6 22.9 11.9 24.0 † † 100.0Alaska 87 677 2.6 2.7 4.7 7.4 7.5 10.0 † 23.2 41.9 † † 100.0Arizona 83 6,287 0.1 0.3 0.6 1.6 3.5 5.9 4.9 26.5 7.2 25.5 23.9 100.0Arkansas 48 2,694 † † † 1.4 7.5 15.4 43.3 20.6 11.8 † † 100.0California 181 37,662 # # # 0.1 1.0 2.7 9.0 19.0 11.9 16.1 40.2 100.0
Colorado 115 4,756 0.1 0.7 1.4 2.9 6.7 8.1 6.2 20.8 18.6 34.5 † 100.0Connecticut 195 4,295 # 0.6 1.7 7.3 24.7 25.0 26.2 14.3 † † † 100.0Delaware 21 790 † † † 4.8 17.4 13.8 17.0 † 47.0 † † 100.0District of Columbia 1 582 † † † † † † † † † 100.0 † 100.0Florida 79 18,829 † # # 0.1 1.0 2.1 5.3 13.5 19.2 26.1 32.5 100.0
Georgia 58 9,098 † † † † 1.8 3.6 12.4 26.8 23.4 32.0 † 100.0Hawaii 1 1,285 † † † † † † † † † † 100.0 100.0Idaho 104 1,329 0.9 3.1 3.9 10.2 12.1 26.3 28.2 15.3 † † † 100.0Illinois 623 11,584 0.3 2.0 3.6 6.0 16.9 20.8 16.2 9.2 † † 25.0 100.0Indiana 239 5,813 0.1 1.3 2.4 5.9 13.2 16.8 20.3 19.9 5.7 14.3 † 100.0
Iowa 539 2,851 4.0 9.6 10.5 12.9 16.5 15.0 20.0 11.5 † † † 100.0Kansas 326 2,356 2.8 6.1 6.3 6.8 12.2 9.3 5.9 18.3 32.2 † † 100.0Kentucky 116 4,169 † 0.1 0.2 2.7 23.0 22.7 19.2 8.8 6.5 16.8 † 100.0Louisiana 67 4,325 † # 0.1 0.7 9.6 12.8 14.4 36.6 25.8 † † 100.0Maine 272 1,378 1.8 9.7 16.7 26.7 33.7 6.8 4.5 † † † † 100.0
Maryland 24 5,558 † † † † 0.4 4.4 7.9 16.1 4.8 66.4 † 100.0Massachusetts 370 6,461 0.3 1.2 2.6 7.9 26.8 23.7 20.2 8.2 † 9.1 † 100.0Michigan 386 9,963 0.1 0.4 3.0 7.1 14.8 14.7 16.9 22.8 10.7 9.5 † 100.0Minnesota 139 5,650 0.2 0.9 1.4 2.8 5.9 5.2 5.0 27.6 37.6 13.5 † 100.0Mississippi 50 2,940 † † 0.1 1.2 4.1 21.1 30.7 33.8 9.0 † † 100.0
Missouri 152 5,126 0.1 0.9 1.9 3.9 10.8 10.6 12.0 17.4 12.3 30.1 † 100.0Montana 80 900 0.3 4.2 7.7 12.8 18.5 9.2 33.7 13.7 † † † 100.0Nebraska 271 1,338 6.0 6.8 5.3 8.9 9.7 15.5 † 17.6 30.2 † † 100.0Nevada 22 2,718 † 0.2 0.6 0.6 1.2 2.5 8.2 7.7 24.8 † 54.1 100.0New Hampshire 230 1,436 1.5 8.7 15.1 19.7 23.6 17.9 6.1 7.6 † † † 100.0See notes at end of table.
Table 1B. Percentage distribution of population of legal service area of public libraries, by state: Fiscal year 2007
24
Population of legal service area1
Less 1,000 2,500 5,000 10,000 25,000 50,000 100,000 250,000 500,000 1,000,000Number Total than to to to to to to to to to or
of public population 1,000 2,499 4,999 9,999 24,999 49,999 99,999 249,999 499,999 999,999 more ResponseState libraries (in thousands) Percentage distribution rate2
New Jersey 303 9,037 † 0.3 1.1 6.5 17.5 16.9 19.2 16.5 16.3 5.6 † 100.0New Mexico 91 1,532 0.9 1.7 3.5 8.5 9.8 10.3 18.9 7.3 † 39.2 † 100.0New York 753 19,054 0.2 1.3 2.5 5.1 11.3 15.1 9.8 5.2 2.4 5.0 42.0 100.0North Carolina 77 8,860 † † 0.1 0.1 1.1 5.7 19.7 40.7 14.2 18.2 † 100.0North Dakota 80 570 2.9 6.7 5.4 6.3 27.0 10.9 40.7 † † † † 100.0
Ohio 251 11,500 # 0.1 0.6 3.6 9.2 13.0 16.9 17.8 19.9 18.8 † 100.0Oklahoma 113 2,944 0.2 1.7 2.9 3.6 9.6 7.5 6.3 14.0 11.2 43.1 † 100.0Oregon 128 3,375 0.3 0.9 1.7 4.4 16.3 10.6 14.5 30.4 † 20.8 † 100.0Pennsylvania 457 12,056 # 0.4 1.8 5.8 20.8 20.6 16.7 11.2 9.9 † 12.6 100.0Rhode Island 49 1,316 † 0.1 0.9 3.7 24.6 32.2 25.0 13.4 † † † 100.0
South Carolina 42 4,326 † † † † 2.6 8.6 15.3 41.8 31.6 † † 100.0South Dakota 123 699 3.8 8.1 6.8 10.4 23.5 9.1 12.2 26.2 † † † 100.0Tennessee 187 6,007 0.2 0.3 1.0 4.2 14.4 19.2 16.9 9.4 11.5 23.0 † 100.0Texas 562 21,898 0.1 0.6 1.8 4.0 8.3 11.7 9.9 16.1 9.5 9.0 29.3 100.0Utah 70 2,571 0.1 0.6 1.7 3.7 8.9 13.6 6.4 24.7 10.8 29.6 † 100.0
Vermont 183 732 3.4 15.4 19.6 17.8 24.9 11.2 7.6 † † † † 100.0Virginia 90 7,581 † 0.1 0.1 0.5 4.3 11.4 16.9 27.5 25.5 † 13.8 100.0Washington 66 6,361 0.1 0.3 0.3 1.0 2.5 3.2 4.0 27.7 13.9 27.7 19.2 100.0West Virginia 97 1,808 # 0.4 4.1 11.1 22.9 16.8 34.6 10.0 † † † 100.0Wisconsin 382 5,648 0.2 2.1 5.9 9.2 22.0 16.9 15.1 13.4 4.7 10.5 † 100.0Wyoming 23 515 † 0.4 0.9 8.7 20.9 38.8 30.2 † † † † 100.0
SOURCE: Institute of Museum and Library Services, Survey of Public Libraries in the United States, Fiscal Year 2007.
Table 1B. Percentage distribution of population of legal service area of public libraries, by state: Fiscal year 2007—Continued
† Not applicable.# Rounds to zero.1The number of people in the geographic area for which a public library has been established to offer services and from which (or on behalf of which) the library derives revenue, plus any areas served under contract for which the library is the primaryservice provider.
NOTE: Detail may not sum to totals because of rounding. Data were not reported by the outlying areas (American Samoa, Guam, Northern Marianas, Puerto Rico, and Virgin Islands).
2Response rate is the percentage of libraries that reported population of legal service area.
25
26
Type of administrative structure1
Multiple direct Multiple directservice outlets service outlets
Number Single direct (administrative office (administrative officeof public service outlet2 is not separate)3 is separate)4 Response
State libraries rate5
Total 9,214 81.0 17.6 1.4 100.0
Alabama 208 88.0 10.6 1.4 100.0Alaska 87 92.0 8.0 0 100.0Arizona 83 72.3 19.3 8.4 100.0Arkansas 48 25.0 60.4 14.6 100.0California 181 32.6 59.7 7.7 100.0
Colorado 115 68.7 29.6 1.7 100.0Connecticut 195 86.2 13.8 0 100.0Delaware 21 81.0 9.5 9.5 100.0District of Columbia 1 0 100.0 0 100.0Florida 79 32.9 54.4 12.7 100.0
Georgia 58 10.3 89.7 0 100.0Hawaii 1 0 0 100.0 100.0Idaho 104 80.8 19.2 0 100.0Illinois 623 90.9 9.1 0 100.0Indiana 239 67.8 31.8 0.4 100.0
Iowa 539 98.3 1.7 0 100.0Kansas 326 95.7 4.3 0 100.0Kentucky 116 19.0 81.0 0 100.0Louisiana 67 16.4 83.6 0 100.0Maine 272 99.3 0.7 0 100.0
Maryland 24 0 70.8 29.2 100.0Massachusetts 370 88.1 11.9 0 100.0Michigan 386 82.4 16.3 1.3 100.0Minnesota 139 79.1 15.8 5.0 100.0Mississippi 50 22.0 76.0 2.0 100.0
Missouri 152 67.8 29.6 2.6 100.0Montana 80 78.8 21.3 0 100.0Nebraska 271 96.7 3.3 0 100.0Nevada 22 40.9 54.5 4.5 100.0New Hampshire 230 97.8 2.2 0 100.0See notes at end of table.
Table 2. Percentage distribution of public libraries, by type of administrative structure and state: Fiscal year 2007
Percentage distribution
Type of administrative structure1
Multiple direct Multiple directservice outlets service outlets
Number Single direct (administrative office (administrative officeof public service outlet2 is not separate)3 is separate)4 Response
State libraries rate5
New Jersey 303 85.5 14.2 0.3 100.0New Mexico 91 89.0 11.0 0 100.0New York 753 92.6 7.4 0 100.0North Carolina 77 13.0 77.9 9.1 100.0North Dakota 80 81.3 18.8 0 100.0
Ohio 251 56.6 40.2 3.2 100.0Oklahoma 113 92.0 6.2 1.8 100.0Oregon 128 81.3 17.2 1.6 100.0Pennsylvania 457 87.1 12.3 0.7 100.0Rhode Island 49 81.6 18.4 0 100.0
South Carolina 42 9.5 81.0 9.5 100.0South Dakota 123 88.6 9.8 1.6 100.0Tennessee 187 85.0 14.4 0.5 100.0Texas 562 87.2 12.3 0.5 100.0Utah 70 68.6 30.0 1.4 100.0
Vermont 183 95.1 4.9 0 100.0Virginia 90 31.1 56.7 12.2 100.0Washington 66 63.6 24.2 12.1 100.0West Virginia 97 71.1 28.9 0 100.0Wisconsin 382 94.8 5.0 0.3 100.0Wyoming 23 13.0 87.0 0 100.0
Table 2. Percentage distribution of public libraries, by type of administrative structure and state: Fiscal year 2007—Continued
NOTE: Detail may not sum to totals because of rounding. Data were not reported by the outlying areas (American Samoa, Guam, Northern Marianas, Puerto Rico,and Virgin Islands).
1The administrative structure identifies an autonomous library entity (administrative entity) that has its own governance and funding.
Percentage distribution
SOURCE: Institute of Museum and Library Services, Survey of Public Libraries in the United States, Fiscal Year 2007.
5Response rate is the percentage of libraries that reported administrative structure.
4An administrative entity that serves the public directly with two or more service outlets, including some combination of one central library, branch(es), bookmobile(s),and/or books-by-mail only. The administrative offices are separate from the direct service outlets and do not provide direct library services.
3An administrative entity that serves the public directly with two or more service outlets, including some combination of one central library, branch(es), bookmobile(s),and/or books-by-mail only.
2An administrative entity that serves the public directly with one central library, books-by-mail only, or one bookmobile.
27

28
(Page is intentionally blank.)
Type of administrative structure1
Multiple direct Multiple directservice outlets service outlets
Number Single direct (administrative office (administrative officePopulation of of public service outlet2 is not separate)3 is separate)4
legal service area libraries
Total 9,214 81.0 17.6 1.4
1,000,000 or more 26 0 61.5 38.5 500,000 to 999,999 58 0 67.2 32.8 250,000 to 499,999 104 1.9 81.7 16.3 100,000 to 249,999 335 6.9 82.4 10.7 50,000 to 99,999 556 30.2 66.4 3.4 25,000 to 49,999 952 62.4 36.1 1.5 10,000 to 24,999 1,764 81.3 18.2 0.5 5,000 to 9,999 1,483 92.0 7.8 0.1 2,500 to 4,999 1,340 97.4 2.6 0 1,000 to 2,499 1,524 98.5 1.5 0 Less than 1,000 1,072 99.8 0.2 0
Percentage distribution
Table 2A. Percentage distribution of public libraries in the 50 states and the District of Columbia, by type
NOTE: Detail may not sum to totals because of rounding. The response rate is included in table 2.
SOURCE: Institute of Museum and Library Services, Survey of Public Libraries in the United States, Fiscal Year 2007.
1The administrative structure identifies an autonomous library entity (administrative entity) that has its own governance and funding.
Table 2A. of administrative structure and population of legal service area: Fiscal year 2007
4An administrative entity that serves the public directly with two or more service outlets, including some combination of one centrallibrary, branch(es), bookmobile(s), and/or books-by-mail only. The administrative offices are separate from the direct service outlets anddo not provide direct library services.
3An administrative entity that serves the public directly with two or more service outlets, including some combination of one central library,branch(es), bookmobile(s), and/or books-by-mail only.
2An administrative entity that serves the public directly with one central library, books-by-mail only or one bookmobile.
29
30
Number of outlets Stationary outlets Bookmobiles1
Number Central libraries Branchesof public Book- Response Response Response
State libraries Branches mobiles Total rate3 Total rate3 Total rate3
Total 9,214 4 1,544 683 16,604 9,040 100.0 7,564 100.0 808 100.0
Alabama 208 21 13 286 207 100.0 79 100.0 16 100.0Alaska 87 6 2 104 87 100.0 17 100.0 2 100.0Arizona 83 22 7 198 78 100.0 120 100.0 9 100.0Arkansas 48 35 3 214 44 100.0 170 100.0 3 100.0California 181 116 42 1,107 167 100.0 940 100.0 63 100.0
Colorado 115 35 9 248 101 100.0 147 100.0 11 100.0Connecticut 195 27 7 245 195 100.0 50 100.0 7 100.0Delaware 21 3 2 33 19 100.0 14 100.0 2 100.0District of Columbia 1 1 1 27 1 100.0 26 100.0 1 100.0Florida 79 50 26 507 60 100.0 447 100.0 31 100.0
Georgia 58 52 18 385 58 100.0 327 100.0 19 100.0Hawaii 1 1 1 51 1 100.0 50 100.0 2 100.0Idaho 104 17 8 139 102 100.0 37 100.0 8 100.0Illinois 623 44 21 781 623 100.0 158 100.0 24 100.0Indiana 239 70 31 433 239 100.0 194 100.0 39 100.0
Iowa 539 8 5 559 539 100.0 20 100.0 5 100.0Kansas 326 12 3 375 326 100.0 49 100.0 5 100.0Kentucky 116 33 82 196 116 100.0 80 100.0 84 100.0Louisiana 67 50 24 327 67 100.0 260 100.0 27 100.0Maine 272 2 0 278 272 100.0 6 100.0 0 100.0
Maryland 24 24 12 183 15 100.0 168 100.0 16 100.0Massachusetts 370 42 4 476 370 100.0 106 100.0 4 100.0Michigan 386 63 16 658 381 100.0 277 100.0 16 100.0Minnesota 139 26 12 359 129 100.0 230 100.0 14 100.0Mississippi 50 39 2 238 47 100.0 191 100.0 2 100.0
Missouri 152 43 17 360 140 100.0 220 100.0 29 100.0Montana 80 15 2 109 80 100.0 29 100.0 2 100.0Nebraska 271 2 8 288 271 100.0 17 100.0 8 100.0Nevada 22 13 5 85 19 100.0 66 100.0 5 100.0New Hampshire 230 5 0 235 230 100.0 5 100.0 0 100.0See notes at end of table.
Table 3. Number of public libraries with branches and bookmobiles, and number of service outlets, by type of outlet and state: Fiscal year 2007
Number of libraries with
Total2
Number of outlets Stationary outlets Bookmobiles1
Number Central libraries Branchesof public Book- Response Response Response
State libraries Branches mobiles Total rate3 Total rate3 Total rate3
New Jersey 303 40 12 454 303 100.0 151 100.0 12 100.0New Mexico 91 9 3 117 91 100.0 26 100.0 3 100.0New York 753 55 8 1,067 752 100.0 315 100.0 9 100.0North Carolina 77 64 33 388 66 100.0 322 100.0 35 100.0North Dakota 80 6 13 89 79 100.0 10 100.0 13 100.0
Ohio 251 100 53 720 244 100.0 476 100.0 71 100.0Oklahoma 113 9 4 204 113 100.0 91 100.0 4 100.0Oregon 128 22 10 215 125 100.0 90 100.0 11 100.0Pennsylvania 457 49 27 629 452 100.0 177 100.0 34 100.0Rhode Island 49 7 2 73 49 100.0 24 100.0 2 100.0
South Carolina 42 34 31 186 41 100.0 145 100.0 33 100.0South Dakota 123 8 7 145 123 100.0 22 100.0 8 100.0Tennessee 187 27 5 290 187 100.0 103 100.0 6 100.0Texas 562 68 10 864 562 100.0 302 100.0 12 100.0Utah 70 18 20 116 55 100.0 61 100.0 21 100.0
Vermont 183 3 9 183 180 100.0 3 100.0 9 100.0Virginia 90 60 29 342 78 100.0 264 100.0 31 100.0Washington 66 23 11 332 57 100.0 275 100.0 25 100.0West Virginia 97 27 5 173 97 100.0 76 100.0 6 100.0Wisconsin 382 18 6 458 379 100.0 79 100.0 7 100.0Wyoming 23 20 2 75 23 100.0 52 100.0 2 100.0
4Of the 9,214 public libraries in the 50 States and DC, 7,463 were single-outlet libraries and 1,751 were multiple-outlet libraries. Single-outlet libraries are a central library, bookmobile, or books-by-mail-only outlet. Multiple-outlet libraries have two or more direct service outlets, including some combination of one central library, branch(es), bookmobile(s), and/or books-by-mail-only outlets.NOTE: Data were not reported by the outlying areas (American Samoa, Guam, Northern Marianas, Puerto Rico, and Virgin Islands).
SOURCE: Institute of Museum and Library Services, Survey of Public Libraries in the United States, Fiscal Year 2007.
Table 3. Number of public libraries with branches and bookmobiles, and number of service outlets, by type of outlet and state: Fiscal year 2007—Continued
Total2
Number of libraries with
2Total stationary outlets is the sum of central and branch libraries. 3Response rate is the percentage of libraries that reported the item.
1A bookmobile is a traveling branch library. It consists of at least one of the following: (1) A truck or van that carries an organized collection of library materials; (2) A paid staff; and (3) Regularly scheduledhours (bookmobile stops) for being open to the public.
31

32
(Page is intentionally blank.)
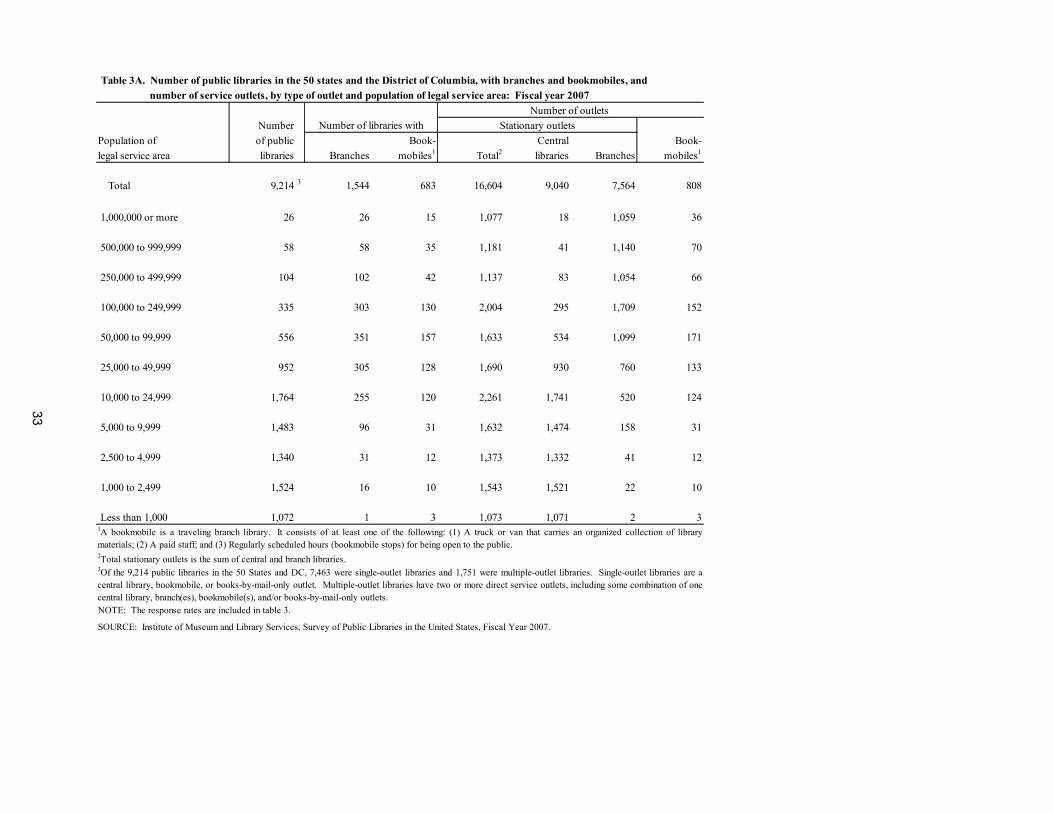
Table 3A. Number of public libraries in the 50 states and the District of Columbia, with branches and bookmobiles, and number of service outlets, by type of outlet and population of legal service area: Fiscal year 2007
Number of outlets Number Stationary outlets
Population of of public Book- Central Book-legal service area libraries Branches mobiles1 Total2 libraries Branches mobiles1
Total 9,214 3 1,544 683 16,604 9,040 7,564 808
1,000,000 or more 26 26 15 1,077 18 1,059 36 500,000 to 999,999 58 58 35 1,181 41 1,140 70 250,000 to 499,999 104 102 42 1,137 83 1,054 66 100,000 to 249,999 335 303 130 2,004 295 1,709 152 50,000 to 99,999 556 351 157 1,633 534 1,099 171 25,000 to 49,999 952 305 128 1,690 930 760 133 10,000 to 24,999 1,764 255 120 2,261 1,741 520 124 5,000 to 9,999 1,483 96 31 1,632 1,474 158 31 2,500 to 4,999 1,340 31 12 1,373 1,332 41 12 1,000 to 2,499 1,524 16 10 1,543 1,521 22 10 Less than 1,000 1,072 1 3 1,073 1,071 2 3
Number of libraries with
3Of the 9,214 public libraries in the 50 States and DC, 7,463 were single-outlet libraries and 1,751 were multiple-outlet libraries. Single-outlet libraries are acentral library, bookmobile, or books-by-mail-only outlet. Multiple-outlet libraries have two or more direct service outlets, including some combination of onecentral library, branch(es), bookmobile(s), and/or books-by-mail-only outlets.
SOURCE: Institute of Museum and Library Services, Survey of Public Libraries in the United States, Fiscal Year 2007.
1A bookmobile is a traveling branch library. It consists of at least one of the following: (1) A truck or van that carries an organized collection of librarymaterials; (2) A paid staff; and (3) Regularly scheduled hours (bookmobile stops) for being open to the public.
NOTE: The response rates are included in table 3.
2Total stationary outlets is the sum of central and branch libraries.
33
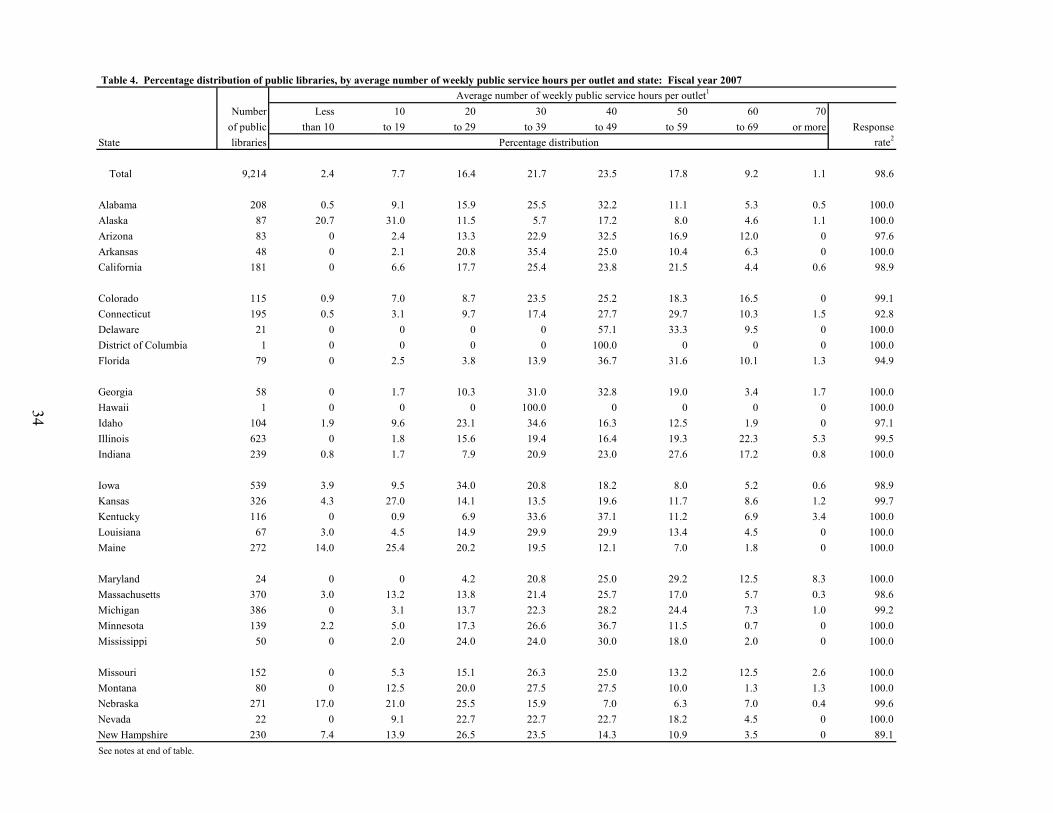
34
Table 4. Percentage distribution of public libraries, by average number of weekly public service hours per outlet and state: Fiscal year 2007Average number of weekly public service hours per outlet1
Number Less 10 20 30 40 50 60 70of public than 10 to 19 to 29 to 39 to 49 to 59 to 69 or more Response
State libraries Percentage distribution rate2
Total 9,214 2.4 7.7 16.4 21.7 23.5 17.8 9.2 1.1 98.6
Alabama 208 0.5 9.1 15.9 25.5 32.2 11.1 5.3 0.5 100.0Alaska 87 20.7 31.0 11.5 5.7 17.2 8.0 4.6 1.1 100.0Arizona 83 0 2.4 13.3 22.9 32.5 16.9 12.0 0 97.6Arkansas 48 0 2.1 20.8 35.4 25.0 10.4 6.3 0 100.0California 181 0 6.6 17.7 25.4 23.8 21.5 4.4 0.6 98.9
Colorado 115 0.9 7.0 8.7 23.5 25.2 18.3 16.5 0 99.1Connecticut 195 0.5 3.1 9.7 17.4 27.7 29.7 10.3 1.5 92.8Delaware 21 0 0 0 0 57.1 33.3 9.5 0 100.0District of Columbia 1 0 0 0 0 100.0 0 0 0 100.0Florida 79 0 2.5 3.8 13.9 36.7 31.6 10.1 1.3 94.9
Georgia 58 0 1.7 10.3 31.0 32.8 19.0 3.4 1.7 100.0Hawaii 1 0 0 0 100.0 0 0 0 0 100.0Idaho 104 1.9 9.6 23.1 34.6 16.3 12.5 1.9 0 97.1Illinois 623 0 1.8 15.6 19.4 16.4 19.3 22.3 5.3 99.5Indiana 239 0.8 1.7 7.9 20.9 23.0 27.6 17.2 0.8 100.0
Iowa 539 3.9 9.5 34.0 20.8 18.2 8.0 5.2 0.6 98.9Kansas 326 4.3 27.0 14.1 13.5 19.6 11.7 8.6 1.2 99.7Kentucky 116 0 0.9 6.9 33.6 37.1 11.2 6.9 3.4 100.0Louisiana 67 3.0 4.5 14.9 29.9 29.9 13.4 4.5 0 100.0Maine 272 14.0 25.4 20.2 19.5 12.1 7.0 1.8 0 100.0
Maryland 24 0 0 4.2 20.8 25.0 29.2 12.5 8.3 100.0Massachusetts 370 3.0 13.2 13.8 21.4 25.7 17.0 5.7 0.3 98.6Michigan 386 0 3.1 13.7 22.3 28.2 24.4 7.3 1.0 99.2Minnesota 139 2.2 5.0 17.3 26.6 36.7 11.5 0.7 0 100.0Mississippi 50 0 2.0 24.0 24.0 30.0 18.0 2.0 0 100.0
Missouri 152 0 5.3 15.1 26.3 25.0 13.2 12.5 2.6 100.0Montana 80 0 12.5 20.0 27.5 27.5 10.0 1.3 1.3 100.0Nebraska 271 17.0 21.0 25.5 15.9 7.0 6.3 7.0 0.4 99.6Nevada 22 0 9.1 22.7 22.7 22.7 18.2 4.5 0 100.0New Hampshire 230 7.4 13.9 26.5 23.5 14.3 10.9 3.5 0 89.1See notes at end of table.
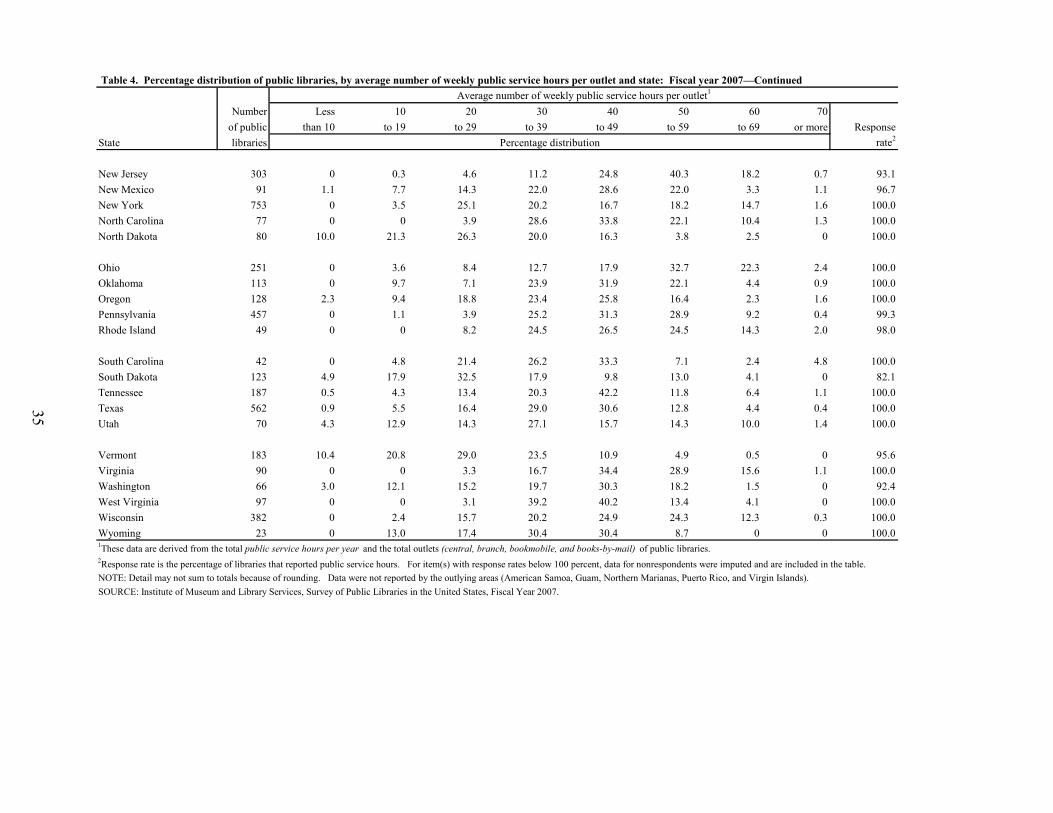
35
Average number of weekly public service hours per outlet1
Number Less 10 20 30 40 50 60 70of public than 10 to 19 to 29 to 39 to 49 to 59 to 69 or more Response
State libraries Percentage distribution rate2
New Jersey 303 0 0.3 4.6 11.2 24.8 40.3 18.2 0.7 93.1New Mexico 91 1.1 7.7 14.3 22.0 28.6 22.0 3.3 1.1 96.7New York 753 0 3.5 25.1 20.2 16.7 18.2 14.7 1.6 100.0North Carolina 77 0 0 3.9 28.6 33.8 22.1 10.4 1.3 100.0North Dakota 80 10.0 21.3 26.3 20.0 16.3 3.8 2.5 0 100.0
Ohio 251 0 3.6 8.4 12.7 17.9 32.7 22.3 2.4 100.0Oklahoma 113 0 9.7 7.1 23.9 31.9 22.1 4.4 0.9 100.0Oregon 128 2.3 9.4 18.8 23.4 25.8 16.4 2.3 1.6 100.0Pennsylvania 457 0 1.1 3.9 25.2 31.3 28.9 9.2 0.4 99.3Rhode Island 49 0 0 8.2 24.5 26.5 24.5 14.3 2.0 98.0
South Carolina 42 0 4.8 21.4 26.2 33.3 7.1 2.4 4.8 100.0South Dakota 123 4.9 17.9 32.5 17.9 9.8 13.0 4.1 0 82.1Tennessee 187 0.5 4.3 13.4 20.3 42.2 11.8 6.4 1.1 100.0Texas 562 0.9 5.5 16.4 29.0 30.6 12.8 4.4 0.4 100.0Utah 70 4.3 12.9 14.3 27.1 15.7 14.3 10.0 1.4 100.0
Vermont 183 10.4 20.8 29.0 23.5 10.9 4.9 0.5 0 95.6Virginia 90 0 0 3.3 16.7 34.4 28.9 15.6 1.1 100.0Washington 66 3.0 12.1 15.2 19.7 30.3 18.2 1.5 0 92.4West Virginia 97 0 0 3.1 39.2 40.2 13.4 4.1 0 100.0Wisconsin 382 0 2.4 15.7 20.2 24.9 24.3 12.3 0.3 100.0Wyoming 23 0 13.0 17.4 30.4 30.4 8.7 0 0 100.0
Table 4. Percentage distribution of public libraries, by average number of weekly public service hours per outlet and state: Fiscal year 2007—Continued
2Response rate is the percentage of libraries that reported public service hours. For item(s) with response rates below 100 percent, data for nonrespondents were imputed and are included in the table.
1These data are derived from the total public service hours per year and the total outlets (central, branch, bookmobile, and books-by-mail) of public libraries.
NOTE: Detail may not sum to totals because of rounding. Data were not reported by the outlying areas (American Samoa, Guam, Northern Marianas, Puerto Rico, and Virgin Islands).SOURCE: Institute of Museum and Library Services, Survey of Public Libraries in the United States, Fiscal Year 2007.

36
(Page is intentionally blank.)
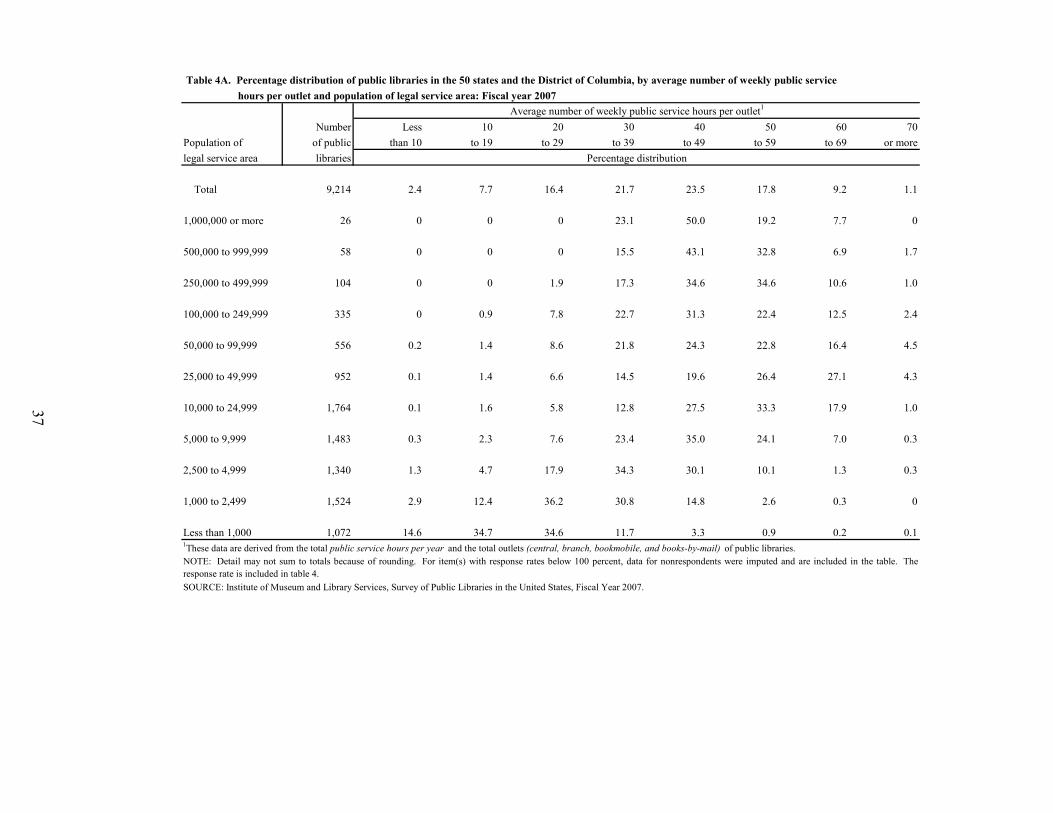
37
hours per outlet and population of legal service area: Fiscal year 2007Average number of weekly public service hours per outlet1
Number Less 10 20 30 40 50 60 70Population of of public than 10 to 19 to 29 to 39 to 49 to 59 to 69 or morelegal service area libraries Percentage distribution
Total 9,214 2.4 7.7 16.4 21.7 23.5 17.8 9.2 1.1
1,000,000 or more 26 0 0 0 23.1 50.0 19.2 7.7 0 500,000 to 999,999 58 0 0 0 15.5 43.1 32.8 6.9 1.7 250,000 to 499,999 104 0 0 1.9 17.3 34.6 34.6 10.6 1.0 100,000 to 249,999 335 0 0.9 7.8 22.7 31.3 22.4 12.5 2.4 50,000 to 99,999 556 0.2 1.4 8.6 21.8 24.3 22.8 16.4 4.5 25,000 to 49,999 952 0.1 1.4 6.6 14.5 19.6 26.4 27.1 4.3 10,000 to 24,999 1,764 0.1 1.6 5.8 12.8 27.5 33.3 17.9 1.0 5,000 to 9,999 1,483 0.3 2.3 7.6 23.4 35.0 24.1 7.0 0.3 2,500 to 4,999 1,340 1.3 4.7 17.9 34.3 30.1 10.1 1.3 0.3 1,000 to 2,499 1,524 2.9 12.4 36.2 30.8 14.8 2.6 0.3 0
Less than 1,000 1,072 14.6 34.7 34.6 11.7 3.3 0.9 0.2 0.11These data are derived from the total public service hours per year and the total outlets (central, branch, bookmobile, and books-by-mail) of public libraries. NOTE: Detail may not sum to totals because of rounding. For item(s) with response rates below 100 percent, data for nonrespondents were imputed and are included in the table. Theresponse rate is included in table 4. SOURCE: Institute of Museum and Library Services, Survey of Public Libraries in the United States, Fiscal Year 2007.
Table 4A. Percentage distribution of public libraries in the 50 states and the District of Columbia, by average number of weekly public service
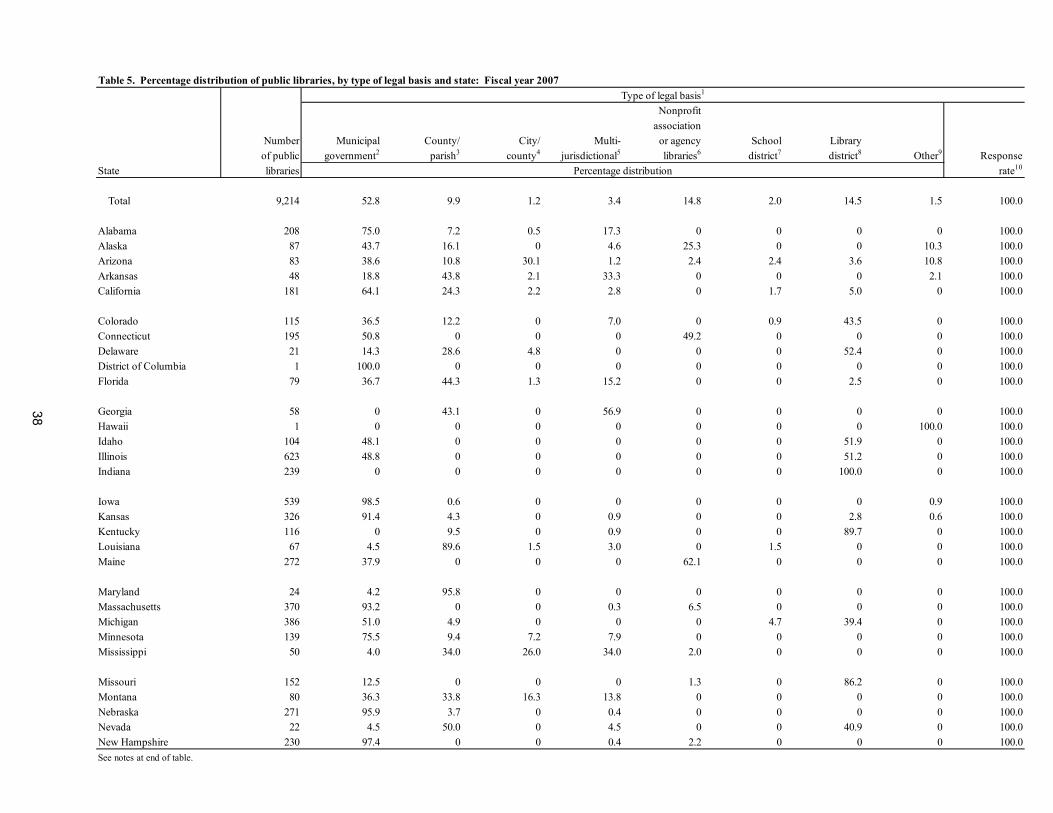
38
Type of legal basis1
Nonprofitassociation
Number Municipal County/ City/ Multi- or agency School Library of public government2 parish3 county4 jurisdictional5 libraries6 district7 district8 Other9 ResponseState libraries Percentage distribution rate10
Total 9,214 52.8 9.9 1.2 3.4 14.8 2.0 14.5 1.5 100.0
Alabama 208 75.0 7.2 0.5 17.3 0 0 0 0 100.0Alaska 87 43.7 16.1 0 4.6 25.3 0 0 10.3 100.0Arizona 83 38.6 10.8 30.1 1.2 2.4 2.4 3.6 10.8 100.0Arkansas 48 18.8 43.8 2.1 33.3 0 0 0 2.1 100.0California 181 64.1 24.3 2.2 2.8 0 1.7 5.0 0 100.0
Colorado 115 36.5 12.2 0 7.0 0 0.9 43.5 0 100.0Connecticut 195 50.8 0 0 0 49.2 0 0 0 100.0Delaware 21 14.3 28.6 4.8 0 0 0 52.4 0 100.0District of Columbia 1 100.0 0 0 0 0 0 0 0 100.0Florida 79 36.7 44.3 1.3 15.2 0 0 2.5 0 100.0
Georgia 58 0 43.1 0 56.9 0 0 0 0 100.0Hawaii 1 0 0 0 0 0 0 0 100.0 100.0Idaho 104 48.1 0 0 0 0 0 51.9 0 100.0Illinois 623 48.8 0 0 0 0 0 51.2 0 100.0Indiana 239 0 0 0 0 0 0 100.0 0 100.0
Iowa 539 98.5 0.6 0 0 0 0 0 0.9 100.0Kansas 326 91.4 4.3 0 0.9 0 0 2.8 0.6 100.0Kentucky 116 0 9.5 0 0.9 0 0 89.7 0 100.0Louisiana 67 4.5 89.6 1.5 3.0 0 1.5 0 0 100.0Maine 272 37.9 0 0 0 62.1 0 0 0 100.0
Maryland 24 4.2 95.8 0 0 0 0 0 0 100.0Massachusetts 370 93.2 0 0 0.3 6.5 0 0 0 100.0Michigan 386 51.0 4.9 0 0 0 4.7 39.4 0 100.0Minnesota 139 75.5 9.4 7.2 7.9 0 0 0 0 100.0Mississippi 50 4.0 34.0 26.0 34.0 2.0 0 0 0 100.0
Missouri 152 12.5 0 0 0 1.3 0 86.2 0 100.0Montana 80 36.3 33.8 16.3 13.8 0 0 0 0 100.0Nebraska 271 95.9 3.7 0 0.4 0 0 0 0 100.0Nevada 22 4.5 50.0 0 4.5 0 0 40.9 0 100.0New Hampshire 230 97.4 0 0 0.4 2.2 0 0 0 100.0See notes at end of table.
Table 5. Percentage distribution of public libraries, by type of legal basis and state: Fiscal year 2007
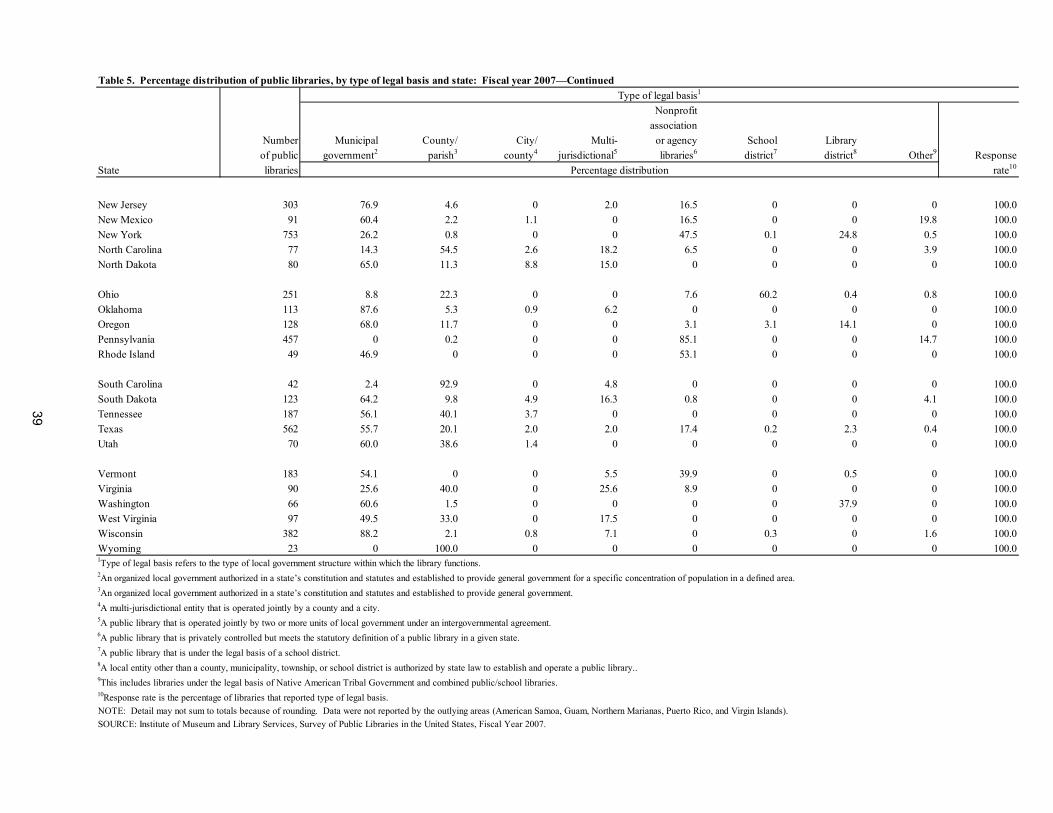
Type of legal basis1
Nonprofitassociation
Number Municipal County/ City/ Multi- or agency School Library of public government2 parish3 county4 jurisdictional5 libraries6 district7 district8 Other9 ResponseState libraries Percentage distribution rate10
New Jersey 303 76.9 4.6 0 2.0 16.5 0 0 0 100.0New Mexico 91 60.4 2.2 1.1 0 16.5 0 0 19.8 100.0New York 753 26.2 0.8 0 0 47.5 0.1 24.8 0.5 100.0North Carolina 77 14.3 54.5 2.6 18.2 6.5 0 0 3.9 100.0North Dakota 80 65.0 11.3 8.8 15.0 0 0 0 0 100.0
Ohio 251 8.8 22.3 0 0 7.6 60.2 0.4 0.8 100.0Oklahoma 113 87.6 5.3 0.9 6.2 0 0 0 0 100.0Oregon 128 68.0 11.7 0 0 3.1 3.1 14.1 0 100.0Pennsylvania 457 0 0.2 0 0 85.1 0 0 14.7 100.0Rhode Island 49 46.9 0 0 0 53.1 0 0 0 100.0
South Carolina 42 2.4 92.9 0 4.8 0 0 0 0 100.0South Dakota 123 64.2 9.8 4.9 16.3 0.8 0 0 4.1 100.0Tennessee 187 56.1 40.1 3.7 0 0 0 0 0 100.0Texas 562 55.7 20.1 2.0 2.0 17.4 0.2 2.3 0.4 100.0Utah 70 60.0 38.6 1.4 0 0 0 0 0 100.0
Vermont 183 54.1 0 0 5.5 39.9 0 0.5 0 100.0Virginia 90 25.6 40.0 0 25.6 8.9 0 0 0 100.0Washington 66 60.6 1.5 0 0 0 0 37.9 0 100.0West Virginia 97 49.5 33.0 0 17.5 0 0 0 0 100.0Wisconsin 382 88.2 2.1 0.8 7.1 0 0.3 0 1.6 100.0Wyoming 23 0 100.0 0 0 0 0 0 0 100.0
SOURCE: Institute of Museum and Library Services, Survey of Public Libraries in the United States, Fiscal Year 2007.NOTE: Detail may not sum to totals because of rounding. Data were not reported by the outlying areas (American Samoa, Guam, Northern Marianas, Puerto Rico, and Virgin Islands).
6A public library that is privately controlled but meets the statutory definition of a public library in a given state.7A public library that is under the legal basis of a school district. 8A local entity other than a county, municipality, township, or school district is authorized by state law to establish and operate a public library..9This includes libraries under the legal basis of Native American Tribal Government and combined public/school libraries.10Response rate is the percentage of libraries that reported type of legal basis.
Table 5. Percentage distribution of public libraries, by type of legal basis and state: Fiscal year 2007—Continued
1Type of legal basis refers to the type of local government structure within which the library functions.
5A public library that is operated jointly by two or more units of local government under an intergovernmental agreement.
4A multi-jurisdictional entity that is operated jointly by a county and a city.
3An organized local government authorized in a state’s constitution and statutes and established to provide general government.
2An organized local government authorized in a state’s constitution and statutes and established to provide general government for a specific concentration of population in a defined area.
39

40
(Page is intentionally blank.)
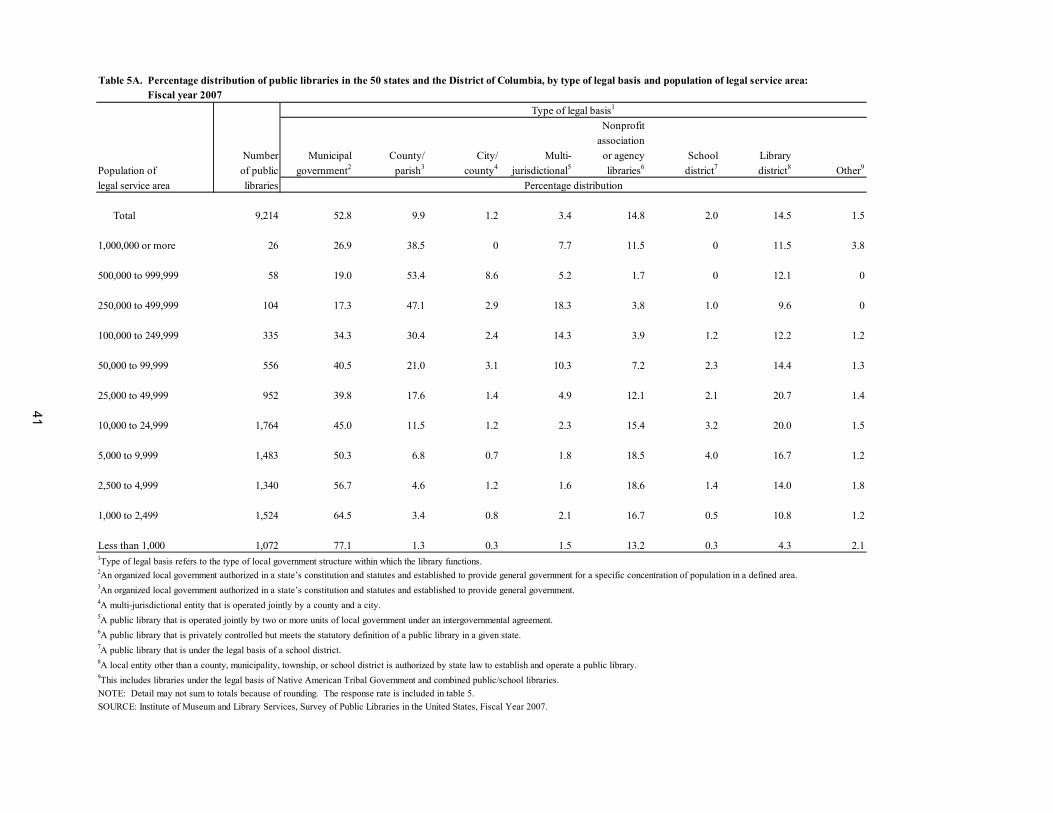
Table 5A. Fiscal year 2007Type of legal basis1
Nonprofitassociation
Number Municipal County/ City/ Multi- or agency School LibraryPopulation of of public government2 parish3 county4 jurisdictional5 libraries6 district7 district8 Other9
legal service area libraries Percentage distribution
Total 9,214 52.8 9.9 1.2 3.4 14.8 2.0 14.5 1.5
1,000,000 or more 26 26.9 38.5 0 7.7 11.5 0 11.5 3.8 500,000 to 999,999 58 19.0 53.4 8.6 5.2 1.7 0 12.1 0 250,000 to 499,999 104 17.3 47.1 2.9 18.3 3.8 1.0 9.6 0 100,000 to 249,999 335 34.3 30.4 2.4 14.3 3.9 1.2 12.2 1.2 50,000 to 99,999 556 40.5 21.0 3.1 10.3 7.2 2.3 14.4 1.3 25,000 to 49,999 952 39.8 17.6 1.4 4.9 12.1 2.1 20.7 1.4 10,000 to 24,999 1,764 45.0 11.5 1.2 2.3 15.4 3.2 20.0 1.5 5,000 to 9,999 1,483 50.3 6.8 0.7 1.8 18.5 4.0 16.7 1.2 2,500 to 4,999 1,340 56.7 4.6 1.2 1.6 18.6 1.4 14.0 1.8 1,000 to 2,499 1,524 64.5 3.4 0.8 2.1 16.7 0.5 10.8 1.2 Less than 1,000 1,072 77.1 1.3 0.3 1.5 13.2 0.3 4.3 2.1
9This includes libraries under the legal basis of Native American Tribal Government and combined public/school libraries.
8A local entity other than a county, municipality, township, or school district is authorized by state law to establish and operate a public library.
NOTE: Detail may not sum to totals because of rounding. The response rate is included in table 5.SOURCE: Institute of Museum and Library Services, Survey of Public Libraries in the United States, Fiscal Year 2007.
Table 5A. Percentage distribution of public libraries in the 50 states and the District of Columbia, by type of legal basis and population of legal service area:
1Type of legal basis refers to the type of local government structure within which the library functions. 2An organized local government authorized in a state’s constitution and statutes and established to provide general government for a specific concentration of population in a defined area.3An organized local government authorized in a state’s constitution and statutes and established to provide general government.4A multi-jurisdictional entity that is operated jointly by a county and a city. 5A public library that is operated jointly by two or more units of local government under an intergovernmental agreement.6A public library that is privately controlled but meets the statutory definition of a public library in a given state.7A public library that is under the legal basis of a school district.
41
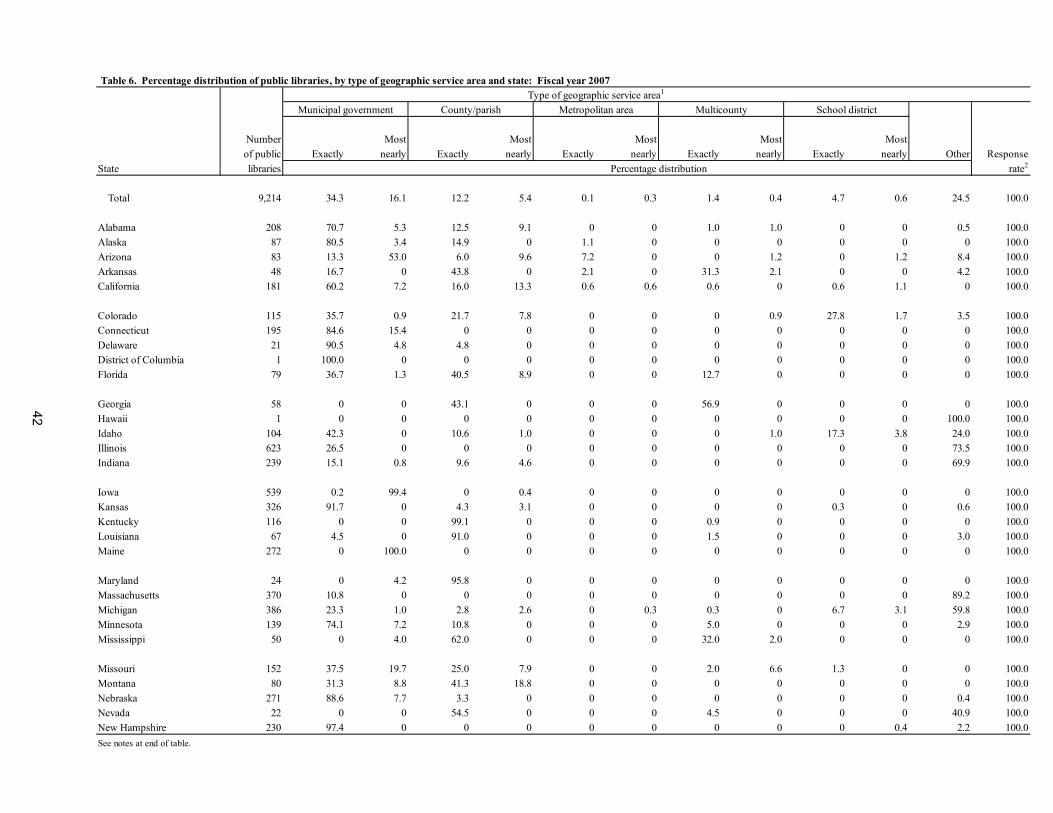
Type of geographic service area1 Municipal government County/parish Metropolitan area Multicounty School district
Number Most Most Most Most Most of public Exactly nearly Exactly nearly Exactly nearly Exactly nearly Exactly nearly Other ResponseState libraries Percentage distribution rate2
Total 9,214 34.3 16.1 12.2 5.4 0.1 0.3 1.4 0.4 4.7 0.6 24.5 100.0
Alabama 208 70.7 5.3 12.5 9.1 0 0 1.0 1.0 0 0 0.5 100.0Alaska 87 80.5 3.4 14.9 0 1.1 0 0 0 0 0 0 100.0Arizona 83 13.3 53.0 6.0 9.6 7.2 0 0 1.2 0 1.2 8.4 100.0Arkansas 48 16.7 0 43.8 0 2.1 0 31.3 2.1 0 0 4.2 100.0California 181 60.2 7.2 16.0 13.3 0.6 0.6 0.6 0 0.6 1.1 0 100.0
Colorado 115 35.7 0.9 21.7 7.8 0 0 0 0.9 27.8 1.7 3.5 100.0Connecticut 195 84.6 15.4 0 0 0 0 0 0 0 0 0 100.0Delaware 21 90.5 4.8 4.8 0 0 0 0 0 0 0 0 100.0District of Columbia 1 100.0 0 0 0 0 0 0 0 0 0 0 100.0Florida 79 36.7 1.3 40.5 8.9 0 0 12.7 0 0 0 0 100.0
Georgia 58 0 0 43.1 0 0 0 56.9 0 0 0 0 100.0Hawaii 1 0 0 0 0 0 0 0 0 0 0 100.0 100.0Idaho 104 42.3 0 10.6 1.0 0 0 0 1.0 17.3 3.8 24.0 100.0Illinois 623 26.5 0 0 0 0 0 0 0 0 0 73.5 100.0Indiana 239 15.1 0.8 9.6 4.6 0 0 0 0 0 0 69.9 100.0
Iowa 539 0.2 99.4 0 0.4 0 0 0 0 0 0 0 100.0Kansas 326 91.7 0 4.3 3.1 0 0 0 0 0.3 0 0.6 100.0Kentucky 116 0 0 99.1 0 0 0 0.9 0 0 0 0 100.0Louisiana 67 4.5 0 91.0 0 0 0 1.5 0 0 0 3.0 100.0Maine 272 0 100.0 0 0 0 0 0 0 0 0 0 100.0
Maryland 24 0 4.2 95.8 0 0 0 0 0 0 0 0 100.0Massachusetts 370 10.8 0 0 0 0 0 0 0 0 0 89.2 100.0Michigan 386 23.3 1.0 2.8 2.6 0 0.3 0.3 0 6.7 3.1 59.8 100.0Minnesota 139 74.1 7.2 10.8 0 0 0 5.0 0 0 0 2.9 100.0Mississippi 50 0 4.0 62.0 0 0 0 32.0 2.0 0 0 0 100.0
Missouri 152 37.5 19.7 25.0 7.9 0 0 2.0 6.6 1.3 0 0 100.0Montana 80 31.3 8.8 41.3 18.8 0 0 0 0 0 0 0 100.0Nebraska 271 88.6 7.7 3.3 0 0 0 0 0 0 0 0.4 100.0Nevada 22 0 0 54.5 0 0 0 4.5 0 0 0 40.9 100.0New Hampshire 230 97.4 0 0 0 0 0 0 0 0 0.4 2.2 100.0See notes at end of table.
Table 6. Percentage distribution of public libraries, by type of geographic service area and state: Fiscal year 2007
42
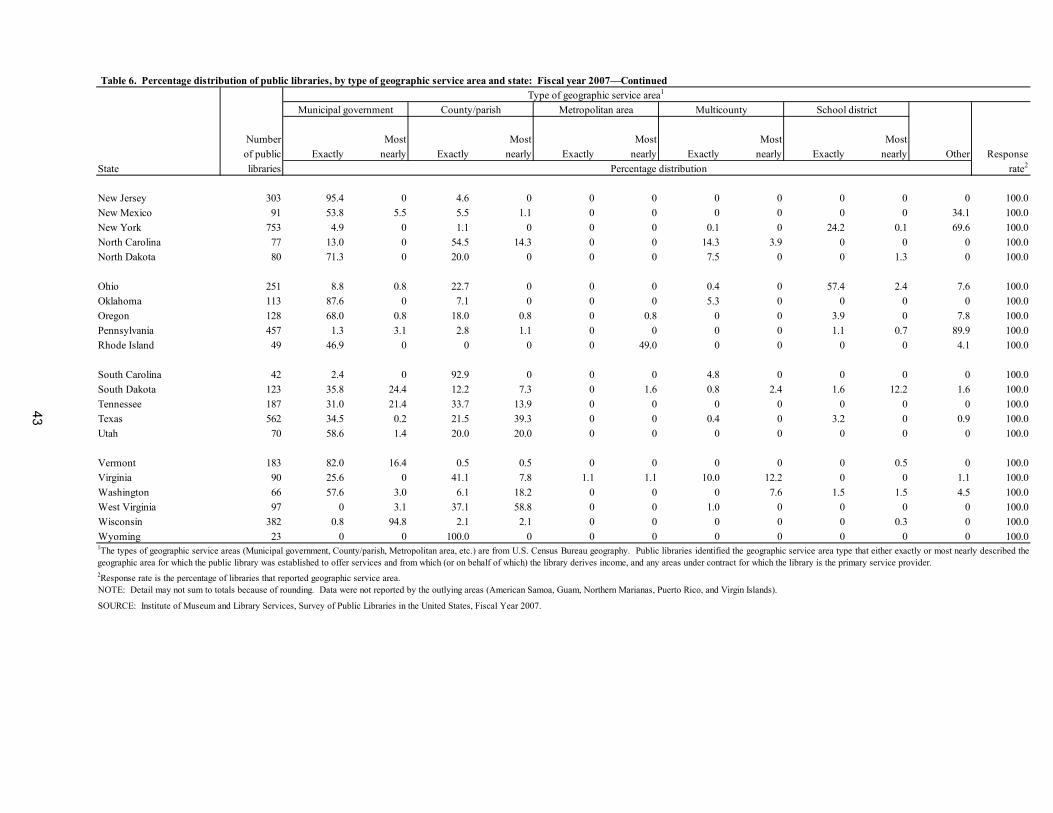
Type of geographic service area1 Municipal government County/parish Metropolitan area Multicounty School district
Number Most Most Most Most Most of public Exactly nearly Exactly nearly Exactly nearly Exactly nearly Exactly nearly Other ResponseState libraries Percentage distribution rate2
New Jersey 303 95.4 0 4.6 0 0 0 0 0 0 0 0 100.0New Mexico 91 53.8 5.5 5.5 1.1 0 0 0 0 0 0 34.1 100.0New York 753 4.9 0 1.1 0 0 0 0.1 0 24.2 0.1 69.6 100.0North Carolina 77 13.0 0 54.5 14.3 0 0 14.3 3.9 0 0 0 100.0North Dakota 80 71.3 0 20.0 0 0 0 7.5 0 0 1.3 0 100.0
Ohio 251 8.8 0.8 22.7 0 0 0 0.4 0 57.4 2.4 7.6 100.0Oklahoma 113 87.6 0 7.1 0 0 0 5.3 0 0 0 0 100.0Oregon 128 68.0 0.8 18.0 0.8 0 0.8 0 0 3.9 0 7.8 100.0Pennsylvania 457 1.3 3.1 2.8 1.1 0 0 0 0 1.1 0.7 89.9 100.0Rhode Island 49 46.9 0 0 0 0 49.0 0 0 0 0 4.1 100.0
South Carolina 42 2.4 0 92.9 0 0 0 4.8 0 0 0 0 100.0South Dakota 123 35.8 24.4 12.2 7.3 0 1.6 0.8 2.4 1.6 12.2 1.6 100.0Tennessee 187 31.0 21.4 33.7 13.9 0 0 0 0 0 0 0 100.0Texas 562 34.5 0.2 21.5 39.3 0 0 0.4 0 3.2 0 0.9 100.0Utah 70 58.6 1.4 20.0 20.0 0 0 0 0 0 0 0 100.0
Vermont 183 82.0 16.4 0.5 0.5 0 0 0 0 0 0.5 0 100.0Virginia 90 25.6 0 41.1 7.8 1.1 1.1 10.0 12.2 0 0 1.1 100.0Washington 66 57.6 3.0 6.1 18.2 0 0 0 7.6 1.5 1.5 4.5 100.0West Virginia 97 0 3.1 37.1 58.8 0 0 1.0 0 0 0 0 100.0Wisconsin 382 0.8 94.8 2.1 2.1 0 0 0 0 0 0.3 0 100.0Wyoming 23 0 0 100.0 0 0 0 0 0 0 0 0 100.0
NOTE: Detail may not sum to totals because of rounding. Data were not reported by the outlying areas (American Samoa, Guam, Northern Marianas, Puerto Rico, and Virgin Islands).
SOURCE: Institute of Museum and Library Services, Survey of Public Libraries in the United States, Fiscal Year 2007.
Table 6. Percentage distribution of public libraries, by type of geographic service area and state: Fiscal year 2007—Continued
1The types of geographic service areas (Municipal government, County/parish, Metropolitan area, etc.) are from U.S. Census Bureau geography. Public libraries identified the geographic service area type that either exactly or most nearly described thegeographic area for which the public library was established to offer services and from which (or on behalf of which) the library derives income, and any areas under contract for which the library is the primary service provider. 2Response rate is the percentage of libraries that reported geographic service area.
43

44
(Page is intentionally blank.)
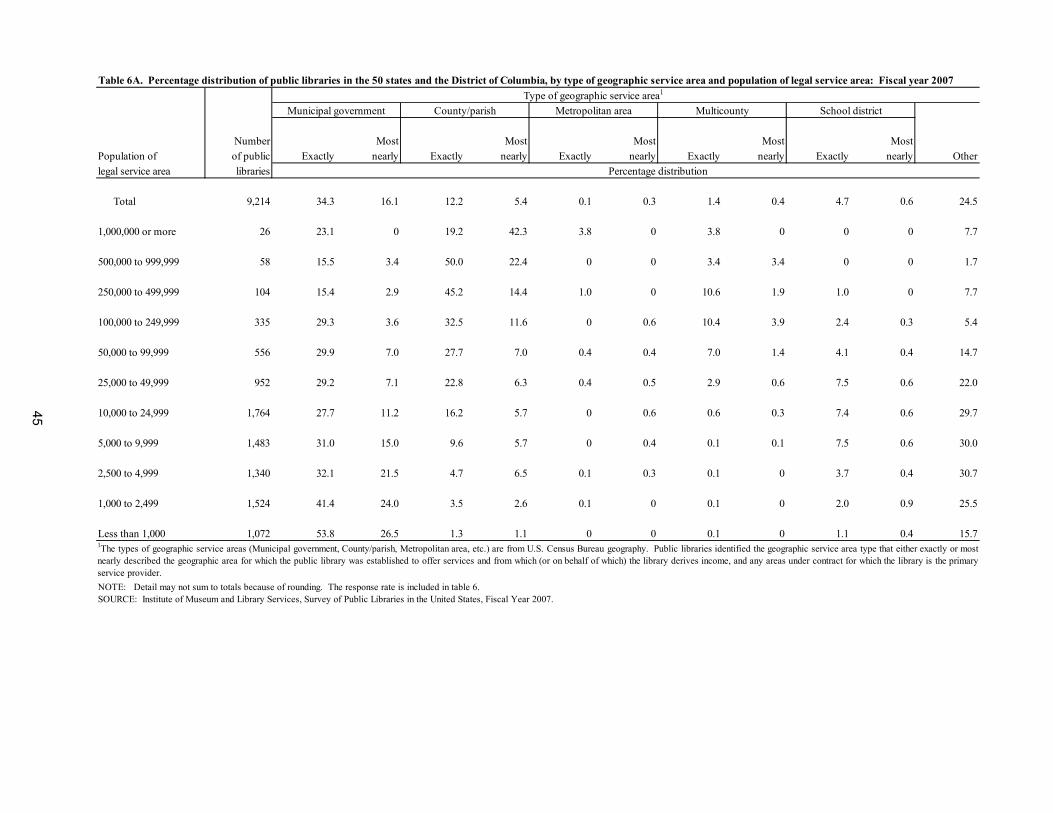
Type of geographic service area1 Municipal government County/parish Metropolitan area Multicounty School district
Number Most Most Most Most MostPopulation of of public Exactly nearly Exactly nearly Exactly nearly Exactly nearly Exactly nearly Otherlegal service area libraries Percentage distribution
Total 9,214 34.3 16.1 12.2 5.4 0.1 0.3 1.4 0.4 4.7 0.6 24.5
1,000,000 or more 26 23.1 0 19.2 42.3 3.8 0 3.8 0 0 0 7.7 500,000 to 999,999 58 15.5 3.4 50.0 22.4 0 0 3.4 3.4 0 0 1.7 250,000 to 499,999 104 15.4 2.9 45.2 14.4 1.0 0 10.6 1.9 1.0 0 7.7 100,000 to 249,999 335 29.3 3.6 32.5 11.6 0 0.6 10.4 3.9 2.4 0.3 5.4 50,000 to 99,999 556 29.9 7.0 27.7 7.0 0.4 0.4 7.0 1.4 4.1 0.4 14.7 25,000 to 49,999 952 29.2 7.1 22.8 6.3 0.4 0.5 2.9 0.6 7.5 0.6 22.0 10,000 to 24,999 1,764 27.7 11.2 16.2 5.7 0 0.6 0.6 0.3 7.4 0.6 29.7 5,000 to 9,999 1,483 31.0 15.0 9.6 5.7 0 0.4 0.1 0.1 7.5 0.6 30.0 2,500 to 4,999 1,340 32.1 21.5 4.7 6.5 0.1 0.3 0.1 0 3.7 0.4 30.7 1,000 to 2,499 1,524 41.4 24.0 3.5 2.6 0.1 0 0.1 0 2.0 0.9 25.5 Less than 1,000 1,072 53.8 26.5 1.3 1.1 0 0 0.1 0 1.1 0.4 15.7
NOTE: Detail may not sum to totals because of rounding. The response rate is included in table 6.
1The types of geographic service areas (Municipal government, County/parish, Metropolitan area, etc.) are from U.S. Census Bureau geography. Public libraries identified the geographic service area type that either exactly or mostnearly described the geographic area for which the public library was established to offer services and from which (or on behalf of which) the library derives income, and any areas under contract for which the library is the primaryservice provider.
SOURCE: Institute of Museum and Library Services, Survey of Public Libraries in the United States, Fiscal Year 2007.
Table 6A. Percentage distribution of public libraries in the 50 states and the District of Columbia, by type of geographic service area and population of legal service area: Fiscal year 2007
45
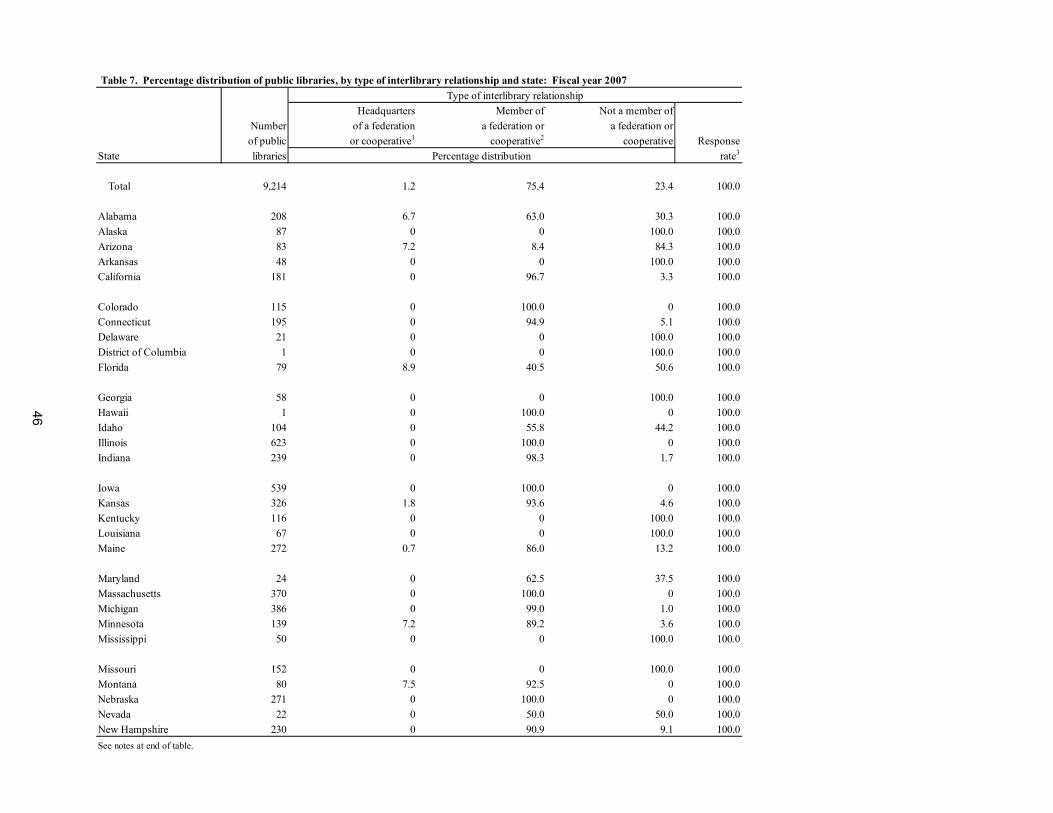
Type of interlibrary relationshipHeadquarters Member of Not a member of
Number of a federation a federation or a federation orof public or cooperative1 cooperative2 cooperative Response
State libraries Percentage distribution rate3
Total 9,214 1.2 75.4 23.4 100.0
Alabama 208 6.7 63.0 30.3 100.0Alaska 87 0 0 100.0 100.0Arizona 83 7.2 8.4 84.3 100.0Arkansas 48 0 0 100.0 100.0California 181 0 96.7 3.3 100.0
Colorado 115 0 100.0 0 100.0Connecticut 195 0 94.9 5.1 100.0Delaware 21 0 0 100.0 100.0District of Columbia 1 0 0 100.0 100.0Florida 79 8.9 40.5 50.6 100.0
Georgia 58 0 0 100.0 100.0Hawaii 1 0 100.0 0 100.0Idaho 104 0 55.8 44.2 100.0Illinois 623 0 100.0 0 100.0Indiana 239 0 98.3 1.7 100.0
Iowa 539 0 100.0 0 100.0Kansas 326 1.8 93.6 4.6 100.0Kentucky 116 0 0 100.0 100.0Louisiana 67 0 0 100.0 100.0Maine 272 0.7 86.0 13.2 100.0
Maryland 24 0 62.5 37.5 100.0Massachusetts 370 0 100.0 0 100.0Michigan 386 0 99.0 1.0 100.0Minnesota 139 7.2 89.2 3.6 100.0Mississippi 50 0 0 100.0 100.0
Missouri 152 0 0 100.0 100.0Montana 80 7.5 92.5 0 100.0Nebraska 271 0 100.0 0 100.0Nevada 22 0 50.0 50.0 100.0New Hampshire 230 0 90.9 9.1 100.0See notes at end of table.
Table 7. Percentage distribution of public libraries, by type of interlibrary relationship and state: Fiscal year 2007
46
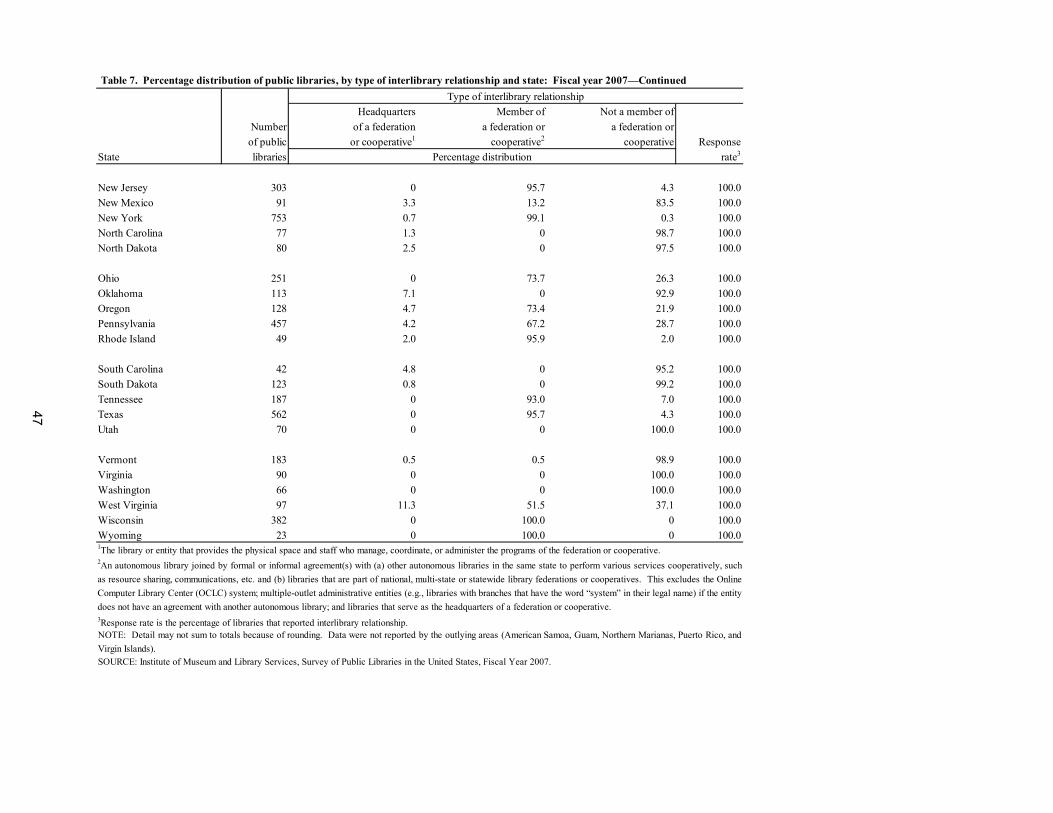
Type of interlibrary relationshipHeadquarters Member of Not a member of
Number of a federation a federation or a federation orof public or cooperative1 cooperative2 cooperative Response
State libraries Percentage distribution rate3
New Jersey 303 0 95.7 4.3 100.0New Mexico 91 3.3 13.2 83.5 100.0New York 753 0.7 99.1 0.3 100.0North Carolina 77 1.3 0 98.7 100.0North Dakota 80 2.5 0 97.5 100.0
Ohio 251 0 73.7 26.3 100.0Oklahoma 113 7.1 0 92.9 100.0Oregon 128 4.7 73.4 21.9 100.0Pennsylvania 457 4.2 67.2 28.7 100.0Rhode Island 49 2.0 95.9 2.0 100.0
South Carolina 42 4.8 0 95.2 100.0South Dakota 123 0.8 0 99.2 100.0Tennessee 187 0 93.0 7.0 100.0Texas 562 0 95.7 4.3 100.0Utah 70 0 0 100.0 100.0
Vermont 183 0.5 0.5 98.9 100.0Virginia 90 0 0 100.0 100.0Washington 66 0 0 100.0 100.0West Virginia 97 11.3 51.5 37.1 100.0Wisconsin 382 0 100.0 0 100.0Wyoming 23 0 100.0 0 100.0
Table 7. Percentage distribution of public libraries, by type of interlibrary relationship and state: Fiscal year 2007—Continued
SOURCE: Institute of Museum and Library Services, Survey of Public Libraries in the United States, Fiscal Year 2007.
NOTE: Detail may not sum to totals because of rounding. Data were not reported by the outlying areas (American Samoa, Guam, Northern Marianas, Puerto Rico, andVirgin Islands).
1The library or entity that provides the physical space and staff who manage, coordinate, or administer the programs of the federation or cooperative.2An autonomous library joined by formal or informal agreement(s) with (a) other autonomous libraries in the same state to perform various services cooperatively, suchas resource sharing, communications, etc. and (b) libraries that are part of national, multi-state or statewide library federations or cooperatives. This excludes the OnlineComputer Library Center (OCLC) system; multiple-outlet administrative entities (e.g., libraries with branches that have the word “system” in their legal name) if the entity does not have an agreement with another autonomous library; and libraries that serve as the headquarters of a federation or cooperative.3Response rate is the percentage of libraries that reported interlibrary relationship.
47

48
(Page is intentionally blank.)
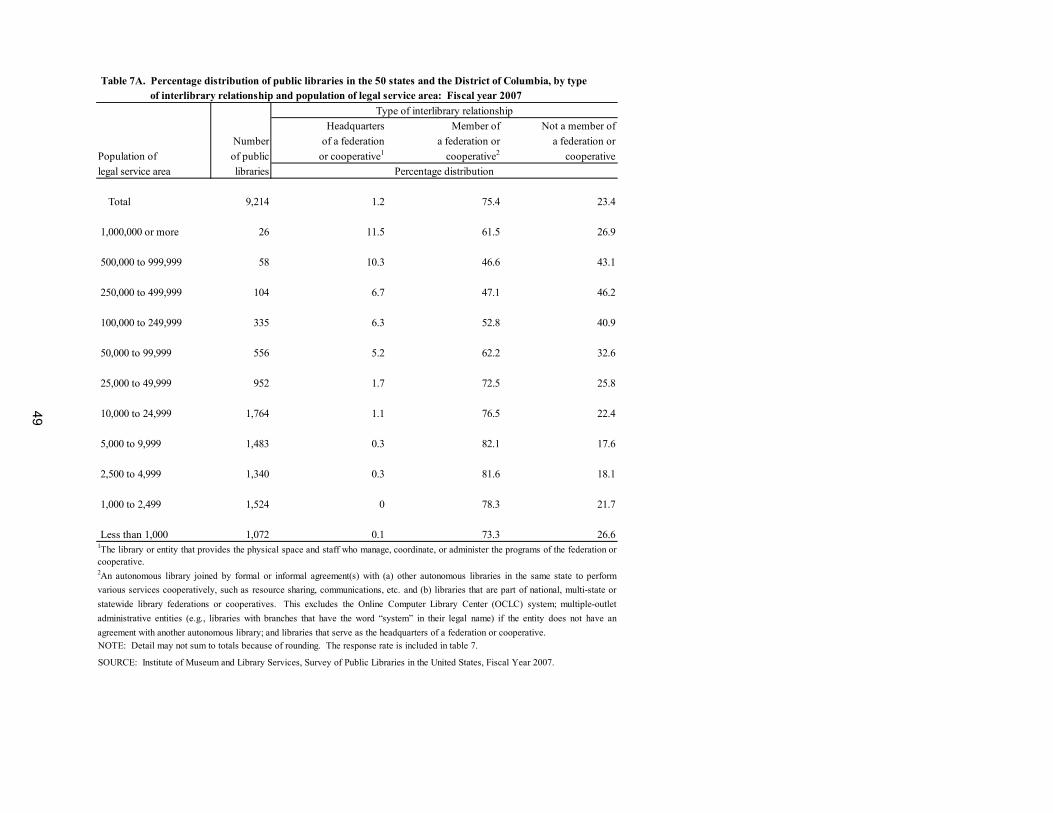
of interlibrary relationship and population of legal service area: Fiscal year 2007Type of interlibrary relationship
Headquarters Member of Not a member ofNumber of a federation a federation or a federation or
Population of of public or cooperative1 cooperative2 cooperativelegal service area libraries Percentage distribution
Total 9,214 1.2 75.4 23.4 1,000,000 or more 26 11.5 61.5 26.9 500,000 to 999,999 58 10.3 46.6 43.1 250,000 to 499,999 104 6.7 47.1 46.2 100,000 to 249,999 335 6.3 52.8 40.9 50,000 to 99,999 556 5.2 62.2 32.6 25,000 to 49,999 952 1.7 72.5 25.8 10,000 to 24,999 1,764 1.1 76.5 22.4 5,000 to 9,999 1,483 0.3 82.1 17.6 2,500 to 4,999 1,340 0.3 81.6 18.1 1,000 to 2,499 1,524 0 78.3 21.7 Less than 1,000 1,072 0.1 73.3 26.6
Table 7A. Percentage distribution of public libraries in the 50 states and the District of Columbia, by type
NOTE: Detail may not sum to totals because of rounding. The response rate is included in table 7.
SOURCE: Institute of Museum and Library Services, Survey of Public Libraries in the United States, Fiscal Year 2007.
2An autonomous library joined by formal or informal agreement(s) with (a) other autonomous libraries in the same state to performvarious services cooperatively, such as resource sharing, communications, etc. and (b) libraries that are part of national, multi-state orstatewide library federations or cooperatives. This excludes the Online Computer Library Center (OCLC) system; multiple-outletadministrative entities (e.g., libraries with branches that have the word “system” in their legal name) if the entity does not have anagreement with another autonomous library; and libraries that serve as the headquarters of a federation or cooperative.
1The library or entity that provides the physical space and staff who manage, coordinate, or administer the programs of the federation orcooperative.
49
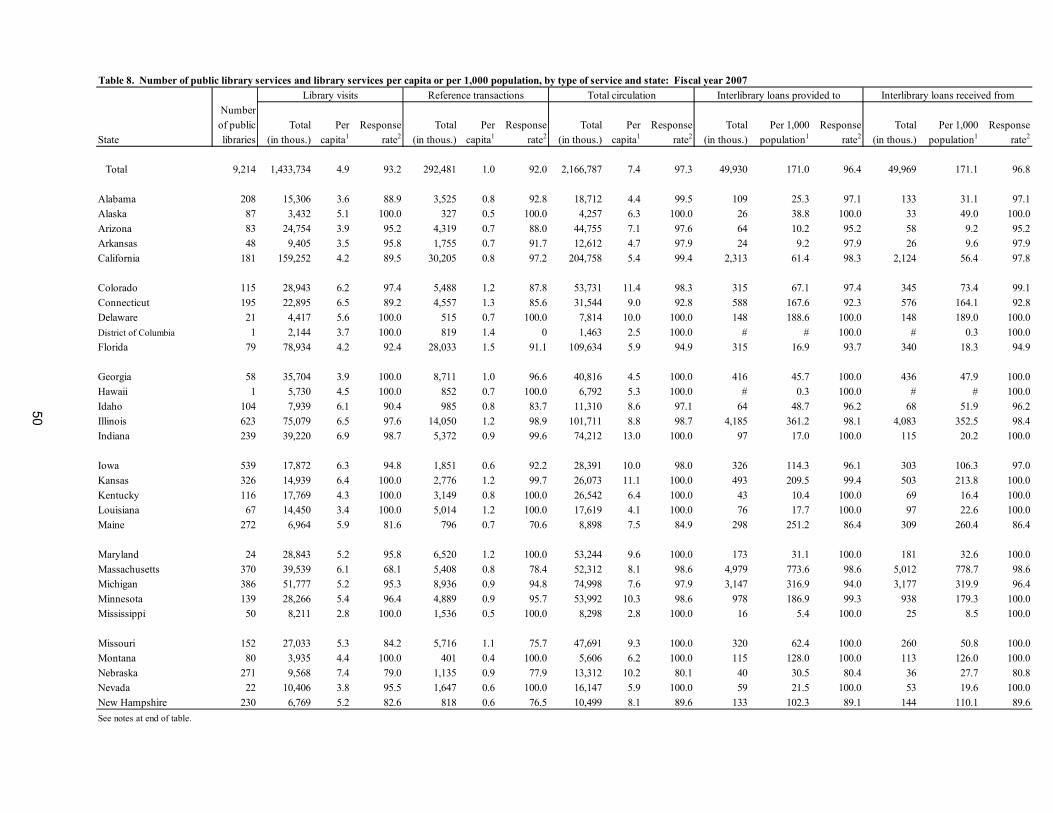
Library visits Reference transactions Total circulation Interlibrary loans provided to Interlibrary loans received fromNumberof public Total Per Response Total Per Response Total Per Response Total Per 1,000 Response Total Per 1,000 Response
State libraries (in thous.) capita1 rate2 (in thous.) capita1 rate2 (in thous.) capita1 rate2 (in thous.) population1 rate2 (in thous.) population1 rate2
Total 9,214 1,433,734 4.9 93.2 292,481 1.0 92.0 2,166,787 7.4 97.3 49,930 171.0 96.4 49,969 171.1 96.8
Alabama 208 15,306 3.6 88.9 3,525 0.8 92.8 18,712 4.4 99.5 109 25.3 97.1 133 31.1 97.1Alaska 87 3,432 5.1 100.0 327 0.5 100.0 4,257 6.3 100.0 26 38.8 100.0 33 49.0 100.0Arizona 83 24,754 3.9 95.2 4,319 0.7 88.0 44,755 7.1 97.6 64 10.2 95.2 58 9.2 95.2Arkansas 48 9,405 3.5 95.8 1,755 0.7 91.7 12,612 4.7 97.9 24 9.2 97.9 26 9.6 97.9California 181 159,252 4.2 89.5 30,205 0.8 97.2 204,758 5.4 99.4 2,313 61.4 98.3 2,124 56.4 97.8
Colorado 115 28,943 6.2 97.4 5,488 1.2 87.8 53,731 11.4 98.3 315 67.1 97.4 345 73.4 99.1Connecticut 195 22,895 6.5 89.2 4,557 1.3 85.6 31,544 9.0 92.8 588 167.6 92.3 576 164.1 92.8Delaware 21 4,417 5.6 100.0 515 0.7 100.0 7,814 10.0 100.0 148 188.6 100.0 148 189.0 100.0District of Columbia 1 2,144 3.7 100.0 819 1.4 0 1,463 2.5 100.0 # # 100.0 # 0.3 100.0Florida 79 78,934 4.2 92.4 28,033 1.5 91.1 109,634 5.9 94.9 315 16.9 93.7 340 18.3 94.9
Georgia 58 35,704 3.9 100.0 8,711 1.0 96.6 40,816 4.5 100.0 416 45.7 100.0 436 47.9 100.0Hawaii 1 5,730 4.5 100.0 852 0.7 100.0 6,792 5.3 100.0 # 0.3 100.0 # # 100.0Idaho 104 7,939 6.1 90.4 985 0.8 83.7 11,310 8.6 97.1 64 48.7 96.2 68 51.9 96.2Illinois 623 75,079 6.5 97.6 14,050 1.2 98.9 101,711 8.8 98.7 4,185 361.2 98.1 4,083 352.5 98.4Indiana 239 39,220 6.9 98.7 5,372 0.9 99.6 74,212 13.0 100.0 97 17.0 100.0 115 20.2 100.0
Iowa 539 17,872 6.3 94.8 1,851 0.6 92.2 28,391 10.0 98.0 326 114.3 96.1 303 106.3 97.0Kansas 326 14,939 6.4 100.0 2,776 1.2 99.7 26,073 11.1 100.0 493 209.5 99.4 503 213.8 100.0Kentucky 116 17,769 4.3 100.0 3,149 0.8 100.0 26,542 6.4 100.0 43 10.4 100.0 69 16.4 100.0Louisiana 67 14,450 3.4 100.0 5,014 1.2 100.0 17,619 4.1 100.0 76 17.7 100.0 97 22.6 100.0Maine 272 6,964 5.9 81.6 796 0.7 70.6 8,898 7.5 84.9 298 251.2 86.4 309 260.4 86.4
Maryland 24 28,843 5.2 95.8 6,520 1.2 100.0 53,244 9.6 100.0 173 31.1 100.0 181 32.6 100.0Massachusetts 370 39,539 6.1 68.1 5,408 0.8 78.4 52,312 8.1 98.6 4,979 773.6 98.6 5,012 778.7 98.6Michigan 386 51,777 5.2 95.3 8,936 0.9 94.8 74,998 7.6 97.9 3,147 316.9 94.0 3,177 319.9 96.4Minnesota 139 28,266 5.4 96.4 4,889 0.9 95.7 53,992 10.3 98.6 978 186.9 99.3 938 179.3 100.0Mississippi 50 8,211 2.8 100.0 1,536 0.5 100.0 8,298 2.8 100.0 16 5.4 100.0 25 8.5 100.0
Missouri 152 27,033 5.3 84.2 5,716 1.1 75.7 47,691 9.3 100.0 320 62.4 100.0 260 50.8 100.0Montana 80 3,935 4.4 100.0 401 0.4 100.0 5,606 6.2 100.0 115 128.0 100.0 113 126.0 100.0Nebraska 271 9,568 7.4 79.0 1,135 0.9 77.9 13,312 10.2 80.1 40 30.5 80.4 36 27.7 80.8Nevada 22 10,406 3.8 95.5 1,647 0.6 100.0 16,147 5.9 100.0 59 21.5 100.0 53 19.6 100.0New Hampshire 230 6,769 5.2 82.6 818 0.6 76.5 10,499 8.1 89.6 133 102.3 89.1 144 110.1 89.6See notes at end of table.
Table 8. Number of public library services and library services per capita or per 1,000 population, by type of service and state: Fiscal year 2007
50
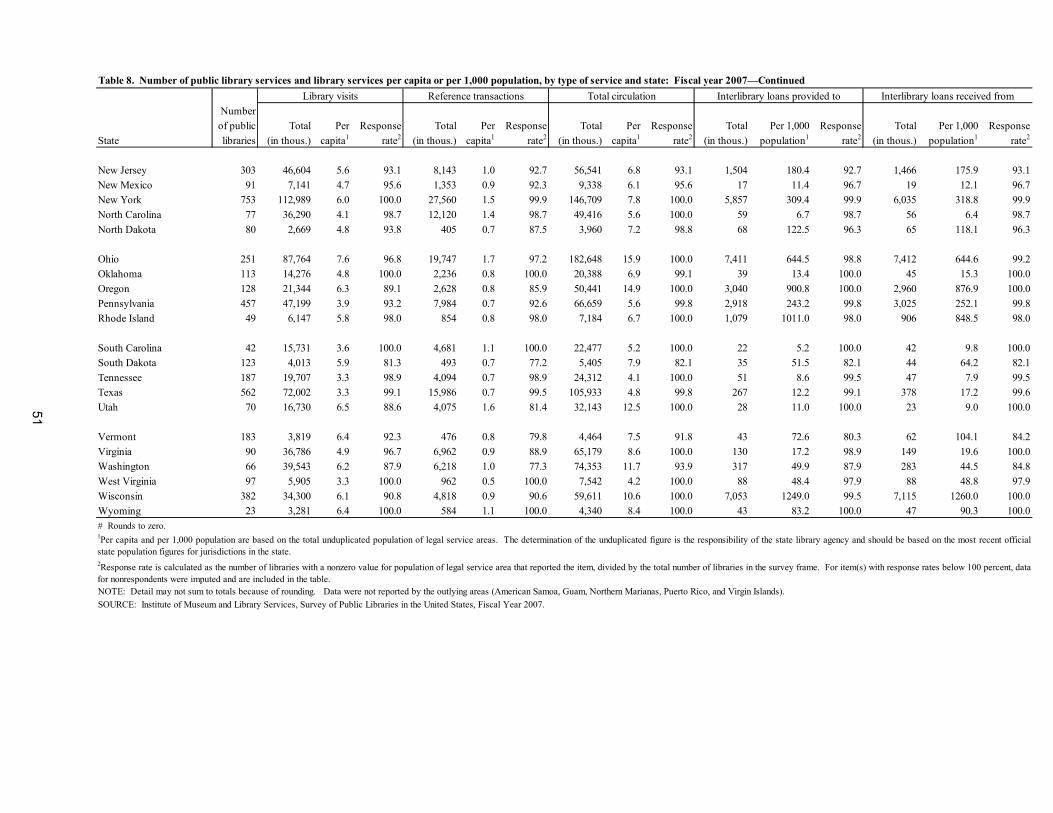
Table 8. Number of public library services and library services per capita or per 1,000 population, by type of service and state: Fiscal year 2007—ContinuedLibrary visits Reference transactions Total circulation Interlibrary loans provided to Interlibrary loans received from
Numberof public Total Per Response Total Per Response Total Per Response Total Per 1,000 Response Total Per 1,000 Response
State libraries (in thous.) capita1 rate2 (in thous.) capita1 rate2 (in thous.) capita1 rate2 (in thous.) population1 rate2 (in thous.) population1 rate2
New Jersey 303 46,604 5.6 93.1 8,143 1.0 92.7 56,541 6.8 93.1 1,504 180.4 92.7 1,466 175.9 93.1New Mexico 91 7,141 4.7 95.6 1,353 0.9 92.3 9,338 6.1 95.6 17 11.4 96.7 19 12.1 96.7New York 753 112,989 6.0 100.0 27,560 1.5 99.9 146,709 7.8 100.0 5,857 309.4 99.9 6,035 318.8 99.9North Carolina 77 36,290 4.1 98.7 12,120 1.4 98.7 49,416 5.6 100.0 59 6.7 98.7 56 6.4 98.7North Dakota 80 2,669 4.8 93.8 405 0.7 87.5 3,960 7.2 98.8 68 122.5 96.3 65 118.1 96.3
Ohio 251 87,764 7.6 96.8 19,747 1.7 97.2 182,648 15.9 100.0 7,411 644.5 98.8 7,412 644.6 99.2Oklahoma 113 14,276 4.8 100.0 2,236 0.8 100.0 20,388 6.9 99.1 39 13.4 100.0 45 15.3 100.0Oregon 128 21,344 6.3 89.1 2,628 0.8 85.9 50,441 14.9 100.0 3,040 900.8 100.0 2,960 876.9 100.0Pennsylvania 457 47,199 3.9 93.2 7,984 0.7 92.6 66,659 5.6 99.8 2,918 243.2 99.8 3,025 252.1 99.8Rhode Island 49 6,147 5.8 98.0 854 0.8 98.0 7,184 6.7 100.0 1,079 1011.0 98.0 906 848.5 98.0
South Carolina 42 15,731 3.6 100.0 4,681 1.1 100.0 22,477 5.2 100.0 22 5.2 100.0 42 9.8 100.0South Dakota 123 4,013 5.9 81.3 493 0.7 77.2 5,405 7.9 82.1 35 51.5 82.1 44 64.2 82.1Tennessee 187 19,707 3.3 98.9 4,094 0.7 98.9 24,312 4.1 100.0 51 8.6 99.5 47 7.9 99.5Texas 562 72,002 3.3 99.1 15,986 0.7 99.5 105,933 4.8 99.8 267 12.2 99.1 378 17.2 99.6Utah 70 16,730 6.5 88.6 4,075 1.6 81.4 32,143 12.5 100.0 28 11.0 100.0 23 9.0 100.0
Vermont 183 3,819 6.4 92.3 476 0.8 79.8 4,464 7.5 91.8 43 72.6 80.3 62 104.1 84.2Virginia 90 36,786 4.9 96.7 6,962 0.9 88.9 65,179 8.6 100.0 130 17.2 98.9 149 19.6 100.0Washington 66 39,543 6.2 87.9 6,218 1.0 77.3 74,353 11.7 93.9 317 49.9 87.9 283 44.5 84.8West Virginia 97 5,905 3.3 100.0 962 0.5 100.0 7,542 4.2 100.0 88 48.4 97.9 88 48.8 97.9Wisconsin 382 34,300 6.1 90.8 4,818 0.9 90.6 59,611 10.6 100.0 7,053 1249.0 99.5 7,115 1260.0 100.0Wyoming 23 3,281 6.4 100.0 584 1.1 100.0 4,340 8.4 100.0 43 83.2 100.0 47 90.3 100.0
NOTE: Detail may not sum to totals because of rounding. Data were not reported by the outlying areas (American Samoa, Guam, Northern Marianas, Puerto Rico, and Virgin Islands).SOURCE: Institute of Museum and Library Services, Survey of Public Libraries in the United States, Fiscal Year 2007.
1Per capita and per 1,000 population are based on the total unduplicated population of legal service areas. The determination of the unduplicated figure is the responsibility of the state library agency and should be based on the most recent officialstate population figures for jurisdictions in the state.
# Rounds to zero.
2Response rate is calculated as the number of libraries with a nonzero value for population of legal service area that reported the item, divided by the total number of libraries in the survey frame. For item(s) with response rates below 100 percent, data for nonrespondents were imputed and are included in the table.
51

52
(Page is intentionally blank.)
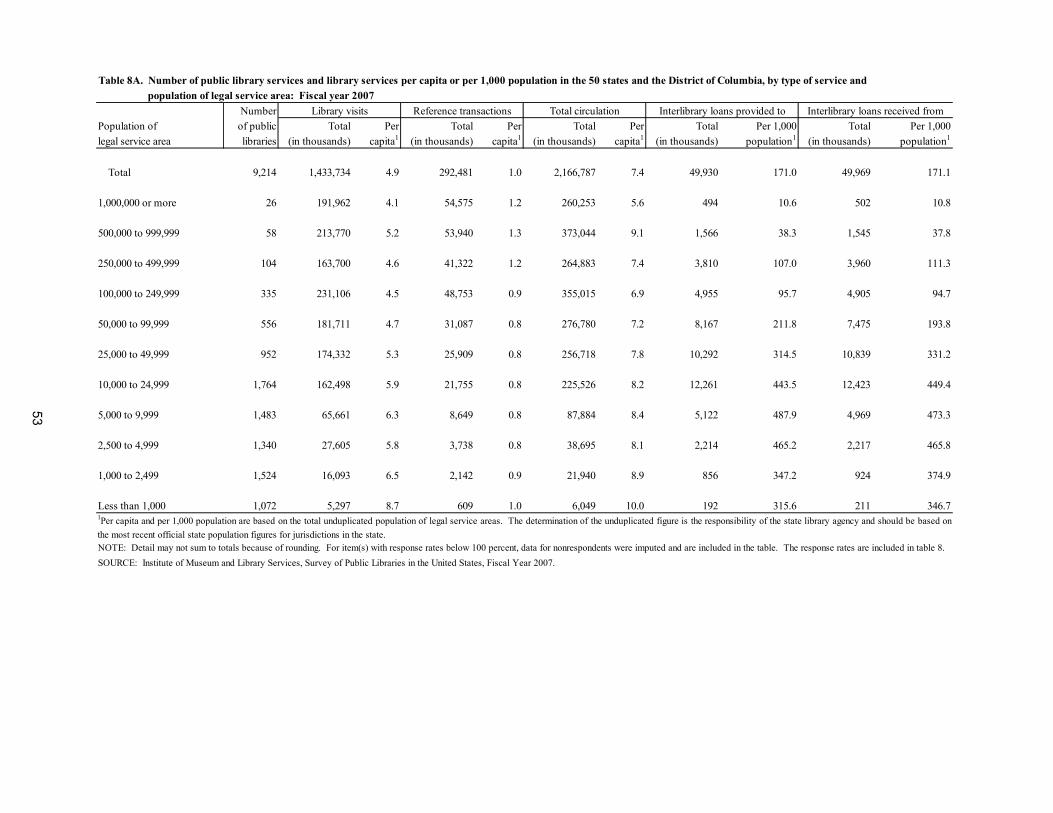
population of legal service area: Fiscal year 2007Number Library visits Reference transactions Total circulation Interlibrary loans provided to Interlibrary loans received from
Population of of public Total Per Total Per Total Per Total Per 1,000 Total Per 1,000legal service area libraries (in thousands) capita1 (in thousands) capita1 (in thousands) capita1 (in thousands) population1 (in thousands) population1
Total 9,214 1,433,734 4.9 292,481 1.0 2,166,787 7.4 49,930 171.0 49,969 171.1
1,000,000 or more 26 191,962 4.1 54,575 1.2 260,253 5.6 494 10.6 502 10.8 500,000 to 999,999 58 213,770 5.2 53,940 1.3 373,044 9.1 1,566 38.3 1,545 37.8 250,000 to 499,999 104 163,700 4.6 41,322 1.2 264,883 7.4 3,810 107.0 3,960 111.3 100,000 to 249,999 335 231,106 4.5 48,753 0.9 355,015 6.9 4,955 95.7 4,905 94.7 50,000 to 99,999 556 181,711 4.7 31,087 0.8 276,780 7.2 8,167 211.8 7,475 193.8 25,000 to 49,999 952 174,332 5.3 25,909 0.8 256,718 7.8 10,292 314.5 10,839 331.2 10,000 to 24,999 1,764 162,498 5.9 21,755 0.8 225,526 8.2 12,261 443.5 12,423 449.4 5,000 to 9,999 1,483 65,661 6.3 8,649 0.8 87,884 8.4 5,122 487.9 4,969 473.3 2,500 to 4,999 1,340 27,605 5.8 3,738 0.8 38,695 8.1 2,214 465.2 2,217 465.8 1,000 to 2,499 1,524 16,093 6.5 2,142 0.9 21,940 8.9 856 347.2 924 374.9 Less than 1,000 1,072 5,297 8.7 609 1.0 6,049 10.0 192 315.6 211 346.7
SOURCE: Institute of Museum and Library Services, Survey of Public Libraries in the United States, Fiscal Year 2007.
Table 8A. Number of public library services and library services per capita or per 1,000 population in the 50 states and the District of Columbia, by type of service and
1Per capita and per 1,000 population are based on the total unduplicated population of legal service areas. The determination of the unduplicated figure is the responsibility of the state library agency and should be based onthe most recent official state population figures for jurisdictions in the state. NOTE: Detail may not sum to totals because of rounding. For item(s) with response rates below 100 percent, data for nonrespondents were imputed and are included in the table. The response rates are included in table 8.
53
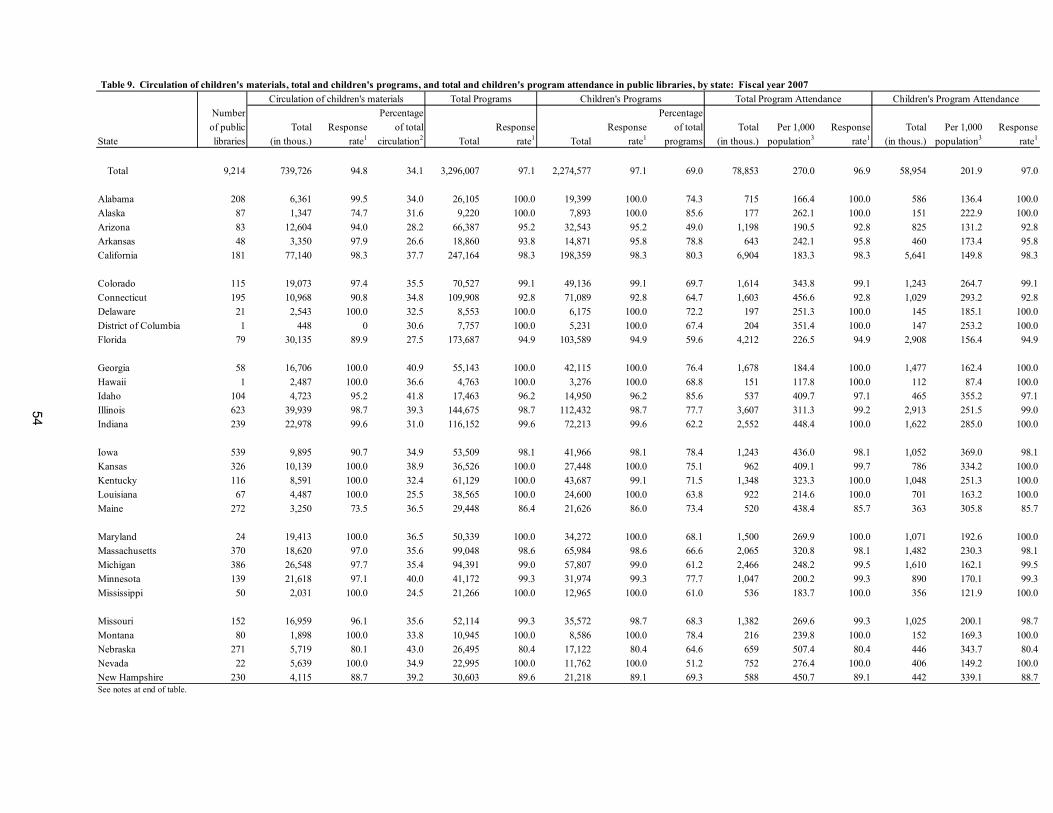
Circulation of children's materialsNumber Percentage Percentageof public Total Response of total Response Response of total Total Per 1,000 Response Total Per 1,000 Response
State libraries (in thous.) rate1 circulation2 Total rate1 Total rate1 programs (in thous.) population3 rate1 (in thous.) population3 rate1
Total 9,214 739,726 94.8 34.1 3,296,007 97.1 2,274,577 97.1 69.0 78,853 270.0 96.9 58,954 201.9 97.0
Alabama 208 6,361 99.5 34.0 26,105 100.0 19,399 100.0 74.3 715 166.4 100.0 586 136.4 100.0Alaska 87 1,347 74.7 31.6 9,220 100.0 7,893 100.0 85.6 177 262.1 100.0 151 222.9 100.0Arizona 83 12,604 94.0 28.2 66,387 95.2 32,543 95.2 49.0 1,198 190.5 92.8 825 131.2 92.8Arkansas 48 3,350 97.9 26.6 18,860 93.8 14,871 95.8 78.8 643 242.1 95.8 460 173.4 95.8California 181 77,140 98.3 37.7 247,164 98.3 198,359 98.3 80.3 6,904 183.3 98.3 5,641 149.8 98.3
Colorado 115 19,073 97.4 35.5 70,527 99.1 49,136 99.1 69.7 1,614 343.8 99.1 1,243 264.7 99.1Connecticut 195 10,968 90.8 34.8 109,908 92.8 71,089 92.8 64.7 1,603 456.6 92.8 1,029 293.2 92.8Delaware 21 2,543 100.0 32.5 8,553 100.0 6,175 100.0 72.2 197 251.3 100.0 145 185.1 100.0District of Columbia 1 448 0 30.6 7,757 100.0 5,231 100.0 67.4 204 351.4 100.0 147 253.2 100.0Florida 79 30,135 89.9 27.5 173,687 94.9 103,589 94.9 59.6 4,212 226.5 94.9 2,908 156.4 94.9
Georgia 58 16,706 100.0 40.9 55,143 100.0 42,115 100.0 76.4 1,678 184.4 100.0 1,477 162.4 100.0Hawaii 1 2,487 100.0 36.6 4,763 100.0 3,276 100.0 68.8 151 117.8 100.0 112 87.4 100.0Idaho 104 4,723 95.2 41.8 17,463 96.2 14,950 96.2 85.6 537 409.7 97.1 465 355.2 97.1Illinois 623 39,939 98.7 39.3 144,675 98.7 112,432 98.7 77.7 3,607 311.3 99.2 2,913 251.5 99.0Indiana 239 22,978 99.6 31.0 116,152 99.6 72,213 99.6 62.2 2,552 448.4 100.0 1,622 285.0 100.0
Iowa 539 9,895 90.7 34.9 53,509 98.1 41,966 98.1 78.4 1,243 436.0 98.1 1,052 369.0 98.1Kansas 326 10,139 100.0 38.9 36,526 100.0 27,448 100.0 75.1 962 409.1 99.7 786 334.2 100.0Kentucky 116 8,591 100.0 32.4 61,129 100.0 43,687 99.1 71.5 1,348 323.3 100.0 1,048 251.3 100.0Louisiana 67 4,487 100.0 25.5 38,565 100.0 24,600 100.0 63.8 922 214.6 100.0 701 163.2 100.0Maine 272 3,250 73.5 36.5 29,448 86.4 21,626 86.0 73.4 520 438.4 85.7 363 305.8 85.7
Maryland 24 19,413 100.0 36.5 50,339 100.0 34,272 100.0 68.1 1,500 269.9 100.0 1,071 192.6 100.0Massachusetts 370 18,620 97.0 35.6 99,048 98.6 65,984 98.6 66.6 2,065 320.8 98.1 1,482 230.3 98.1Michigan 386 26,548 97.7 35.4 94,391 99.0 57,807 99.0 61.2 2,466 248.2 99.5 1,610 162.1 99.5Minnesota 139 21,618 97.1 40.0 41,172 99.3 31,974 99.3 77.7 1,047 200.2 99.3 890 170.1 99.3Mississippi 50 2,031 100.0 24.5 21,266 100.0 12,965 100.0 61.0 536 183.7 100.0 356 121.9 100.0
Missouri 152 16,959 96.1 35.6 52,114 99.3 35,572 98.7 68.3 1,382 269.6 99.3 1,025 200.1 98.7Montana 80 1,898 100.0 33.8 10,945 100.0 8,586 100.0 78.4 216 239.8 100.0 152 169.3 100.0Nebraska 271 5,719 80.1 43.0 26,495 80.4 17,122 80.4 64.6 659 507.4 80.4 446 343.7 80.4Nevada 22 5,639 100.0 34.9 22,995 100.0 11,762 100.0 51.2 752 276.4 100.0 406 149.2 100.0New Hampshire 230 4,115 88.7 39.2 30,603 89.6 21,218 89.1 69.3 588 450.7 89.1 442 339.1 88.7
Table 9. Circulation of children's materials, total and children's programs, and total and children's program attendance in public libraries, by state: Fiscal year 2007
See notes at end of table.
Total Programs Total Program Attendance Children's Program AttendanceChildren's Programs
54
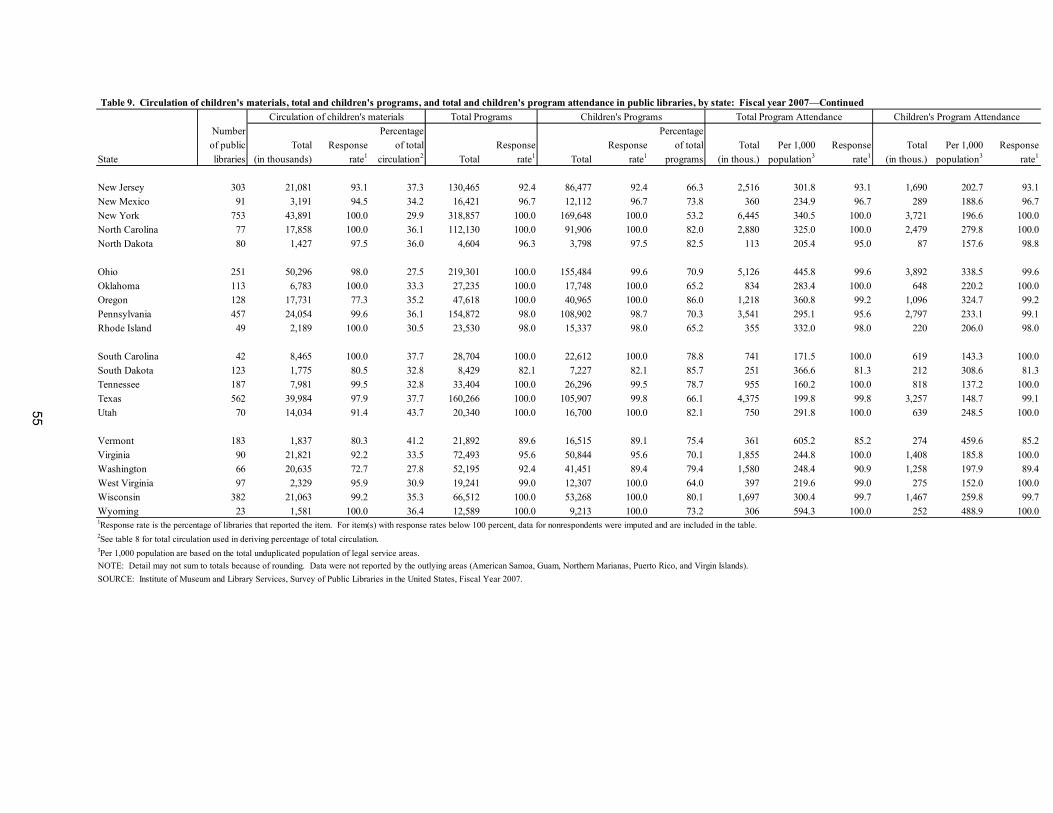
55
Circulation of children's materialsNumber Percentage Percentageof public Total Response of total Response Response of total Total Per 1,000 Response Total Per 1,000 Response
State libraries (in thousands) rate1 circulation2 Total rate1 Total rate1 programs (in thous.) population3 rate1 (in thous.) population3 rate1
New Jersey 303 21,081 93.1 37.3 130,465 92.4 86,477 92.4 66.3 2,516 301.8 93.1 1,690 202.7 93.1New Mexico 91 3,191 94.5 34.2 16,421 96.7 12,112 96.7 73.8 360 234.9 96.7 289 188.6 96.7New York 753 43,891 100.0 29.9 318,857 100.0 169,648 100.0 53.2 6,445 340.5 100.0 3,721 196.6 100.0North Carolina 77 17,858 100.0 36.1 112,130 100.0 91,906 100.0 82.0 2,880 325.0 100.0 2,479 279.8 100.0North Dakota 80 1,427 97.5 36.0 4,604 96.3 3,798 97.5 82.5 113 205.4 95.0 87 157.6 98.8
Ohio 251 50,296 98.0 27.5 219,301 100.0 155,484 99.6 70.9 5,126 445.8 99.6 3,892 338.5 99.6Oklahoma 113 6,783 100.0 33.3 27,235 100.0 17,748 100.0 65.2 834 283.4 100.0 648 220.2 100.0Oregon 128 17,731 77.3 35.2 47,618 100.0 40,965 100.0 86.0 1,218 360.8 99.2 1,096 324.7 99.2Pennsylvania 457 24,054 99.6 36.1 154,872 98.0 108,902 98.7 70.3 3,541 295.1 95.6 2,797 233.1 99.1Rhode Island 49 2,189 100.0 30.5 23,530 98.0 15,337 98.0 65.2 355 332.0 98.0 220 206.0 98.0
South Carolina 42 8,465 100.0 37.7 28,704 100.0 22,612 100.0 78.8 741 171.5 100.0 619 143.3 100.0South Dakota 123 1,775 80.5 32.8 8,429 82.1 7,227 82.1 85.7 251 366.6 81.3 212 308.6 81.3Tennessee 187 7,981 99.5 32.8 33,404 100.0 26,296 99.5 78.7 955 160.2 100.0 818 137.2 100.0Texas 562 39,984 97.9 37.7 160,266 100.0 105,907 99.8 66.1 4,375 199.8 99.8 3,257 148.7 99.1Utah 70 14,034 91.4 43.7 20,340 100.0 16,700 100.0 82.1 750 291.8 100.0 639 248.5 100.0
Vermont 183 1,837 80.3 41.2 21,892 89.6 16,515 89.1 75.4 361 605.2 85.2 274 459.6 85.2Virginia 90 21,821 92.2 33.5 72,493 95.6 50,844 95.6 70.1 1,855 244.8 100.0 1,408 185.8 100.0Washington 66 20,635 72.7 27.8 52,195 92.4 41,451 89.4 79.4 1,580 248.4 90.9 1,258 197.9 89.4West Virginia 97 2,329 95.9 30.9 19,241 99.0 12,307 100.0 64.0 397 219.6 99.0 275 152.0 100.0Wisconsin 382 21,063 99.2 35.3 66,512 100.0 53,268 100.0 80.1 1,697 300.4 99.7 1,467 259.8 99.7Wyoming 23 1,581 100.0 36.4 12,589 100.0 9,213 100.0 73.2 306 594.3 100.0 252 488.9 100.0
2See table 8 for total circulation used in deriving percentage of total circulation.3Per 1,000 population are based on the total unduplicated population of legal service areas.
1Response rate is the percentage of libraries that reported the item. For item(s) with response rates below 100 percent, data for nonrespondents were imputed and are included in the table.
NOTE: Detail may not sum to totals because of rounding. Data were not reported by the outlying areas (American Samoa, Guam, Northern Marianas, Puerto Rico, and Virgin Islands).SOURCE: Institute of Museum and Library Services, Survey of Public Libraries in the United States, Fiscal Year 2007.
Table 9. Circulation of children's materials, total and children's programs, and total and children's program attendance in public libraries, by state: Fiscal year 2007—ContinuedTotal Programs Children's Programs Total Program Attendance Children's Program Attendance

56
(Page is intentionally blank.)
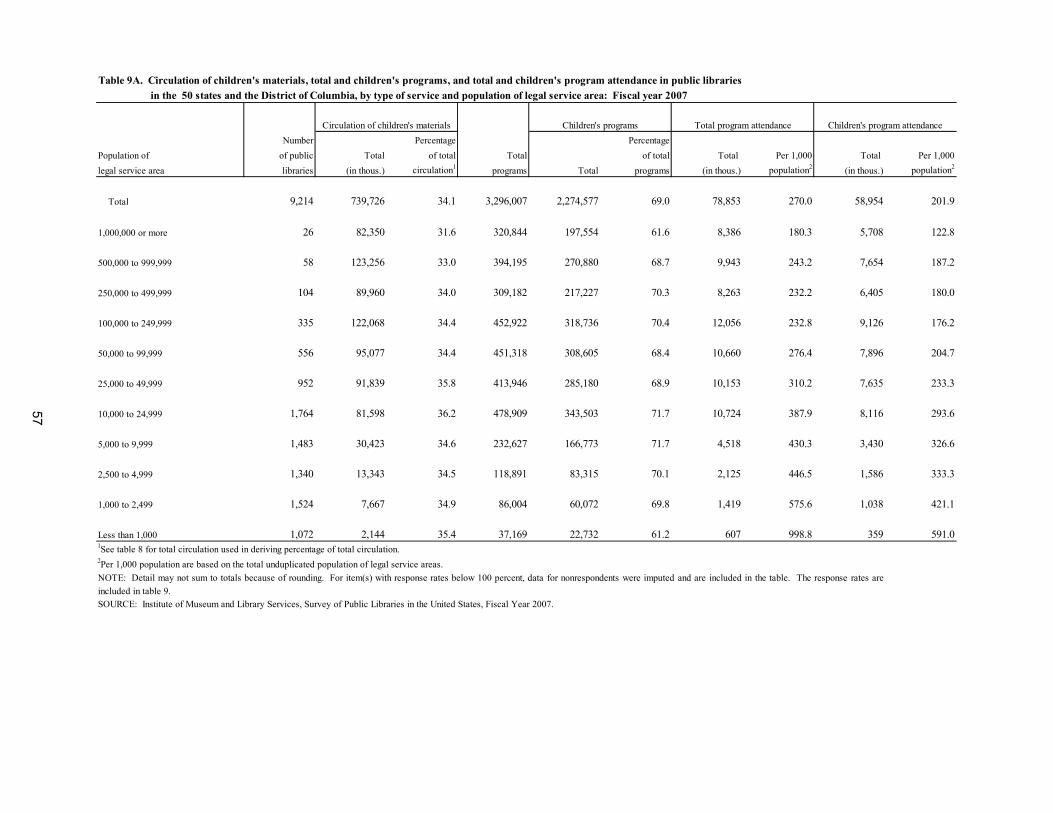
Number Percentage PercentagePopulation of of public Total of total Total of total Total Per 1,000 Total Per 1,000legal service area libraries (in thous.) circulation1 programs Total programs (in thous.) population2 (in thous.) population2
Total 9,214 739,726 34.1 3,296,007 2,274,577 69.0 78,853 270.0 58,954 201.9
1,000,000 or more 26 82,350 31.6 320,844 197,554 61.6 8,386 180.3 5,708 122.8
500,000 to 999,999 58 123,256 33.0 394,195 270,880 68.7 9,943 243.2 7,654 187.2
250,000 to 499,999 104 89,960 34.0 309,182 217,227 70.3 8,263 232.2 6,405 180.0 100,000 to 249,999 335 122,068 34.4 452,922 318,736 70.4 12,056 232.8 9,126 176.2
50,000 to 99,999 556 95,077 34.4 451,318 308,605 68.4 10,660 276.4 7,896 204.7
25,000 to 49,999 952 91,839 35.8 413,946 285,180 68.9 10,153 310.2 7,635 233.3 10,000 to 24,999 1,764 81,598 36.2 478,909 343,503 71.7 10,724 387.9 8,116 293.6
5,000 to 9,999 1,483 30,423 34.6 232,627 166,773 71.7 4,518 430.3 3,430 326.6
2,500 to 4,999 1,340 13,343 34.5 118,891 83,315 70.1 2,125 446.5 1,586 333.3 1,000 to 2,499 1,524 7,667 34.9 86,004 60,072 69.8 1,419 575.6 1,038 421.1
Less than 1,000 1,072 2,144 35.4 37,169 22,732 61.2 607 998.8 359 591.0
NOTE: Detail may not sum to totals because of rounding. For item(s) with response rates below 100 percent, data for nonrespondents were imputed and are included in the table. The response rates areincluded in table 9.SOURCE: Institute of Museum and Library Services, Survey of Public Libraries in the United States, Fiscal Year 2007.
Table 9A. Circulation of children's materials, total and children's programs, and total and children's program attendance in public librariesTable 9A. in the 50 states and the District of Columbia, by type of service and population of legal service area: Fiscal year 2007
Circulation of children's materials Children's program attendance
2Per 1,000 population are based on the total unduplicated population of legal service areas.
1See table 8 for total circulation used in deriving percentage of total circulation.
Children's programs Total program attendance
57
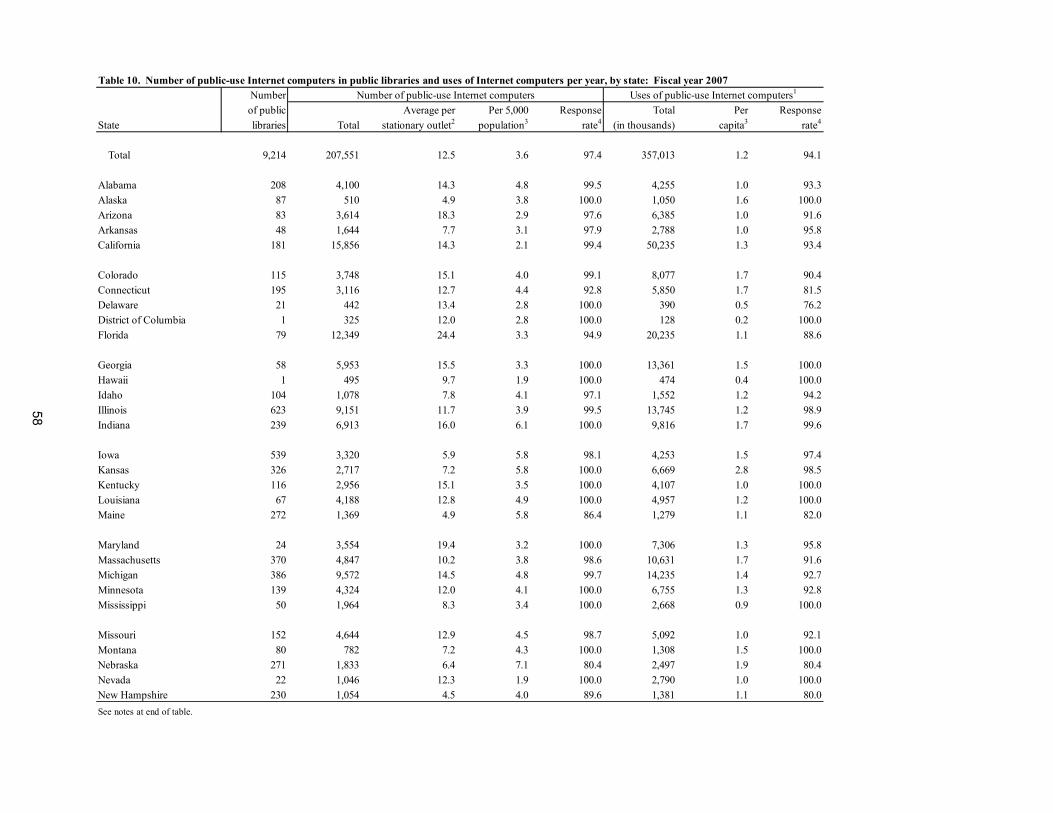
Numberof public Average per Per 5,000 Response Total Per Response
State libraries Total stationary outlet2 population3 rate4 (in thousands) capita3 rate4
Total 9,214 207,551 12.5 3.6 97.4 357,013 1.2 94.1
Alabama 208 4,100 14.3 4.8 99.5 4,255 1.0 93.3Alaska 87 510 4.9 3.8 100.0 1,050 1.6 100.0Arizona 83 3,614 18.3 2.9 97.6 6,385 1.0 91.6Arkansas 48 1,644 7.7 3.1 97.9 2,788 1.0 95.8California 181 15,856 14.3 2.1 99.4 50,235 1.3 93.4
Colorado 115 3,748 15.1 4.0 99.1 8,077 1.7 90.4Connecticut 195 3,116 12.7 4.4 92.8 5,850 1.7 81.5Delaware 21 442 13.4 2.8 100.0 390 0.5 76.2District of Columbia 1 325 12.0 2.8 100.0 128 0.2 100.0Florida 79 12,349 24.4 3.3 94.9 20,235 1.1 88.6
Georgia 58 5,953 15.5 3.3 100.0 13,361 1.5 100.0Hawaii 1 495 9.7 1.9 100.0 474 0.4 100.0Idaho 104 1,078 7.8 4.1 97.1 1,552 1.2 94.2Illinois 623 9,151 11.7 3.9 99.5 13,745 1.2 98.9Indiana 239 6,913 16.0 6.1 100.0 9,816 1.7 99.6
Iowa 539 3,320 5.9 5.8 98.1 4,253 1.5 97.4Kansas 326 2,717 7.2 5.8 100.0 6,669 2.8 98.5Kentucky 116 2,956 15.1 3.5 100.0 4,107 1.0 100.0Louisiana 67 4,188 12.8 4.9 100.0 4,957 1.2 100.0Maine 272 1,369 4.9 5.8 86.4 1,279 1.1 82.0
Maryland 24 3,554 19.4 3.2 100.0 7,306 1.3 95.8Massachusetts 370 4,847 10.2 3.8 98.6 10,631 1.7 91.6Michigan 386 9,572 14.5 4.8 99.7 14,235 1.4 92.7Minnesota 139 4,324 12.0 4.1 100.0 6,755 1.3 92.8Mississippi 50 1,964 8.3 3.4 100.0 2,668 0.9 100.0
Missouri 152 4,644 12.9 4.5 98.7 5,092 1.0 92.1Montana 80 782 7.2 4.3 100.0 1,308 1.5 100.0Nebraska 271 1,833 6.4 7.1 80.4 2,497 1.9 80.4Nevada 22 1,046 12.3 1.9 100.0 2,790 1.0 100.0New Hampshire 230 1,054 4.5 4.0 89.6 1,381 1.1 80.0See notes at end of table.
Table 10. Number of public-use Internet computers in public libraries and uses of Internet computers per year, by state: Fiscal year 2007Number of public-use Internet computers Uses of public-use Internet computers1
58
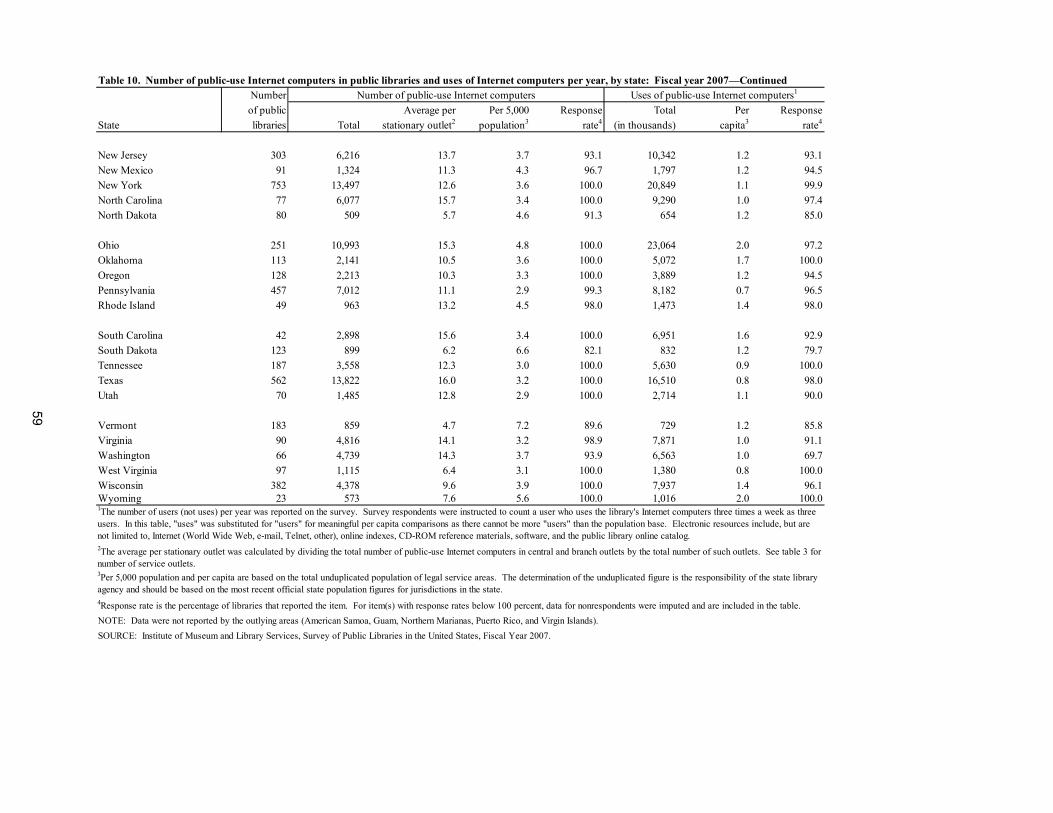
Table 10. Number of public-use Internet computers in public libraries and uses of Internet computers per year, by state: Fiscal year 2007—Continued Numberof public Average per Per 5,000 Response Total Per Response
State libraries Total stationary outlet2 population3 rate4 (in thousands) capita3 rate4
New Jersey 303 6,216 13.7 3.7 93.1 10,342 1.2 93.1New Mexico 91 1,324 11.3 4.3 96.7 1,797 1.2 94.5New York 753 13,497 12.6 3.6 100.0 20,849 1.1 99.9North Carolina 77 6,077 15.7 3.4 100.0 9,290 1.0 97.4North Dakota 80 509 5.7 4.6 91.3 654 1.2 85.0
Ohio 251 10,993 15.3 4.8 100.0 23,064 2.0 97.2Oklahoma 113 2,141 10.5 3.6 100.0 5,072 1.7 100.0Oregon 128 2,213 10.3 3.3 100.0 3,889 1.2 94.5Pennsylvania 457 7,012 11.1 2.9 99.3 8,182 0.7 96.5Rhode Island 49 963 13.2 4.5 98.0 1,473 1.4 98.0
South Carolina 42 2,898 15.6 3.4 100.0 6,951 1.6 92.9South Dakota 123 899 6.2 6.6 82.1 832 1.2 79.7Tennessee 187 3,558 12.3 3.0 100.0 5,630 0.9 100.0Texas 562 13,822 16.0 3.2 100.0 16,510 0.8 98.0Utah 70 1,485 12.8 2.9 100.0 2,714 1.1 90.0
Vermont 183 859 4.7 7.2 89.6 729 1.2 85.8Virginia 90 4,816 14.1 3.2 98.9 7,871 1.0 91.1Washington 66 4,739 14.3 3.7 93.9 6,563 1.0 69.7West Virginia 97 1,115 6.4 3.1 100.0 1,380 0.8 100.0Wisconsin 382 4,378 9.6 3.9 100.0 7,937 1.4 96.1Wyoming 23 573 7.6 5.6 100.0 1,016 2.0 100.0
3Per 5,000 population and per capita are based on the total unduplicated population of legal service areas. The determination of the unduplicated figure is the responsibility of the state library agency and should be based on the most recent official state population figures for jurisdictions in the state.
2The average per stationary outlet was calculated by dividing the total number of public-use Internet computers in central and branch outlets by the total number of such outlets. See table 3 for number of service outlets.
NOTE: Data were not reported by the outlying areas (American Samoa, Guam, Northern Marianas, Puerto Rico, and Virgin Islands).SOURCE: Institute of Museum and Library Services, Survey of Public Libraries in the United States, Fiscal Year 2007.
4Response rate is the percentage of libraries that reported the item. For item(s) with response rates below 100 percent, data for nonrespondents were imputed and are included in the table.
1The number of users (not uses) per year was reported on the survey. Survey respondents were instructed to count a user who uses the library's Internet computers three times a week as three users. In this table, "uses" was substituted for "users" for meaningful per capita comparisons as there cannot be more "users" than the population base. Electronic resources include, but are not limited to, Internet (World Wide Web, e-mail, Telnet, other), online indexes, CD-ROM reference materials, software, and the public library online catalog.
Number of public-use Internet computers Uses of public-use Internet computers1
59

60
(Page is intentionally blank.)
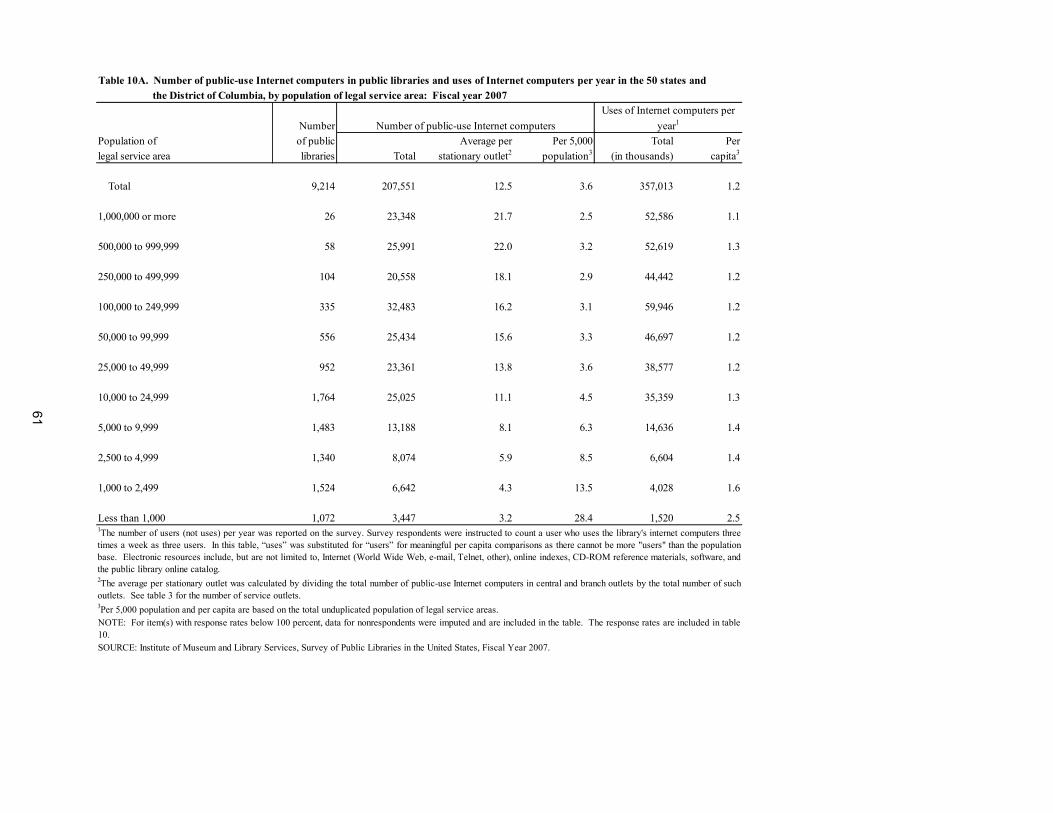
the District of Columbia, by population of legal service area: Fiscal year 2007
NumberPopulation of of public Average per Per 5,000 Total Perlegal service area libraries Total stationary outlet2 population3 (in thousands) capita3
Total 9,214 207,551 12.5 3.6 357,013 1.2
1,000,000 or more 26 23,348 21.7 2.5 52,586 1.1
500,000 to 999,999 58 25,991 22.0 3.2 52,619 1.3
250,000 to 499,999 104 20,558 18.1 2.9 44,442 1.2
100,000 to 249,999 335 32,483 16.2 3.1 59,946 1.2
50,000 to 99,999 556 25,434 15.6 3.3 46,697 1.2
25,000 to 49,999 952 23,361 13.8 3.6 38,577 1.2
10,000 to 24,999 1,764 25,025 11.1 4.5 35,359 1.3
5,000 to 9,999 1,483 13,188 8.1 6.3 14,636 1.4
2,500 to 4,999 1,340 8,074 5.9 8.5 6,604 1.4
1,000 to 2,499 1,524 6,642 4.3 13.5 4,028 1.6
Less than 1,000 1,072 3,447 3.2 28.4 1,520 2.5
Table 10A. Number of public-use Internet computers in public libraries and uses of Internet computers per year in the 50 states and
1The number of users (not uses) per year was reported on the survey. Survey respondents were instructed to count a user who uses the library's internet computers threetimes a week as three users. In this table, “uses” was substituted for “users” for meaningful per capita comparisons as there cannot be more "users" than the populationbase. Electronic resources include, but are not limited to, Internet (World Wide Web, e-mail, Telnet, other), online indexes, CD-ROM reference materials, software, andthe public library online catalog.2The average per stationary outlet was calculated by dividing the total number of public-use Internet computers in central and branch outlets by the total number of suchoutlets. See table 3 for the number of service outlets.
SOURCE: Institute of Museum and Library Services, Survey of Public Libraries in the United States, Fiscal Year 2007.
3Per 5,000 population and per capita are based on the total unduplicated population of legal service areas. NOTE: For item(s) with response rates below 100 percent, data for nonrespondents were imputed and are included in the table. The response rates are included in table10.
Number of public-use Internet computersUses of Internet computers per
year1
61
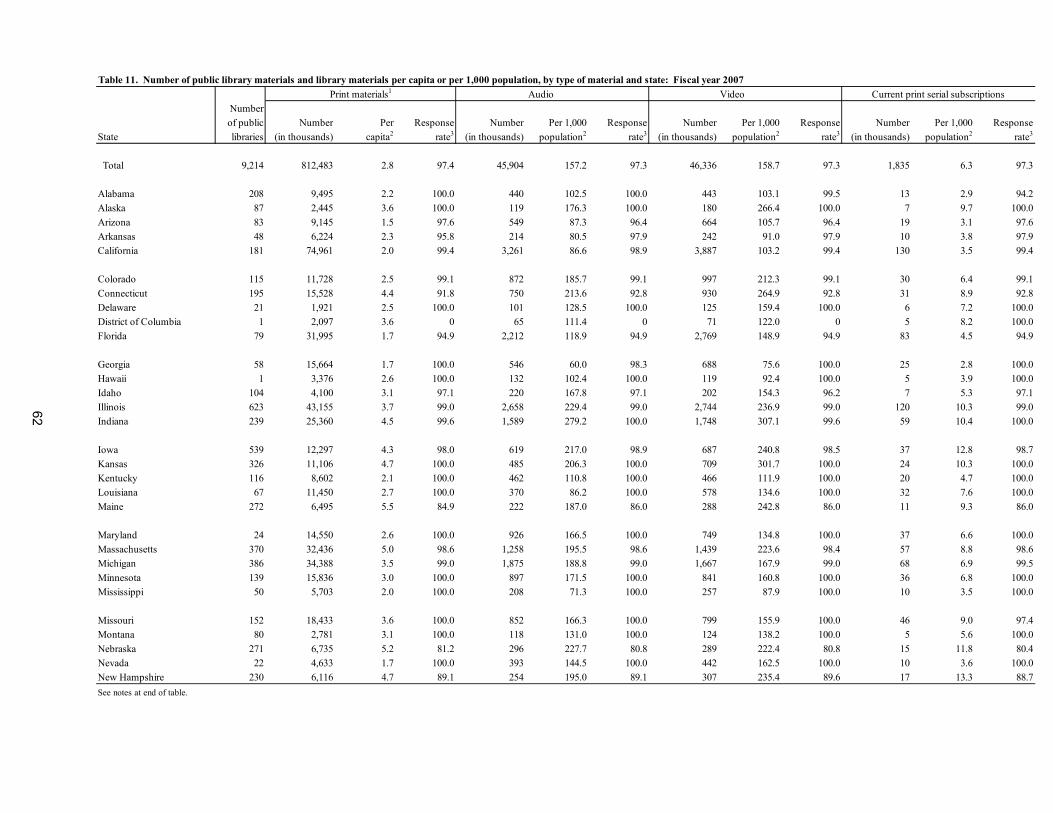
Print materials1 Audio VideoNumberof public Number Per Response Number Per 1,000 Response Number Per 1,000 Response Number Per 1,000 Response
State libraries (in thousands) capita2 rate3 (in thousands) population2 rate3 (in thousands) population2 rate3 (in thousands) population2 rate3
Total 9,214 812,483 2.8 97.4 45,904 157.2 97.3 46,336 158.7 97.3 1,835 6.3 97.3
Alabama 208 9,495 2.2 100.0 440 102.5 100.0 443 103.1 99.5 13 2.9 94.2Alaska 87 2,445 3.6 100.0 119 176.3 100.0 180 266.4 100.0 7 9.7 100.0Arizona 83 9,145 1.5 97.6 549 87.3 96.4 664 105.7 96.4 19 3.1 97.6Arkansas 48 6,224 2.3 95.8 214 80.5 97.9 242 91.0 97.9 10 3.8 97.9California 181 74,961 2.0 99.4 3,261 86.6 98.9 3,887 103.2 99.4 130 3.5 99.4
Colorado 115 11,728 2.5 99.1 872 185.7 99.1 997 212.3 99.1 30 6.4 99.1Connecticut 195 15,528 4.4 91.8 750 213.6 92.8 930 264.9 92.8 31 8.9 92.8Delaware 21 1,921 2.5 100.0 101 128.5 100.0 125 159.4 100.0 6 7.2 100.0District of Columbia 1 2,097 3.6 0 65 111.4 0 71 122.0 0 5 8.2 100.0Florida 79 31,995 1.7 94.9 2,212 118.9 94.9 2,769 148.9 94.9 83 4.5 94.9
Georgia 58 15,664 1.7 100.0 546 60.0 98.3 688 75.6 100.0 25 2.8 100.0Hawaii 1 3,376 2.6 100.0 132 102.4 100.0 119 92.4 100.0 5 3.9 100.0Idaho 104 4,100 3.1 97.1 220 167.8 97.1 202 154.3 96.2 7 5.3 97.1Illinois 623 43,155 3.7 99.0 2,658 229.4 99.0 2,744 236.9 99.0 120 10.3 99.0Indiana 239 25,360 4.5 99.6 1,589 279.2 100.0 1,748 307.1 99.6 59 10.4 100.0
Iowa 539 12,297 4.3 98.0 619 217.0 98.9 687 240.8 98.5 37 12.8 98.7Kansas 326 11,106 4.7 100.0 485 206.3 100.0 709 301.7 100.0 24 10.3 100.0Kentucky 116 8,602 2.1 100.0 462 110.8 100.0 466 111.9 100.0 20 4.7 100.0Louisiana 67 11,450 2.7 100.0 370 86.2 100.0 578 134.6 100.0 32 7.6 100.0Maine 272 6,495 5.5 84.9 222 187.0 86.0 288 242.8 86.0 11 9.3 86.0
Maryland 24 14,550 2.6 100.0 926 166.5 100.0 749 134.8 100.0 37 6.6 100.0Massachusetts 370 32,436 5.0 98.6 1,258 195.5 98.6 1,439 223.6 98.4 57 8.8 98.6Michigan 386 34,388 3.5 99.0 1,875 188.8 99.0 1,667 167.9 99.0 68 6.9 99.5Minnesota 139 15,836 3.0 100.0 897 171.5 100.0 841 160.8 100.0 36 6.8 100.0Mississippi 50 5,703 2.0 100.0 208 71.3 100.0 257 87.9 100.0 10 3.5 100.0
Missouri 152 18,433 3.6 100.0 852 166.3 100.0 799 155.9 100.0 46 9.0 97.4Montana 80 2,781 3.1 100.0 118 131.0 100.0 124 138.2 100.0 5 5.6 100.0Nebraska 271 6,735 5.2 81.2 296 227.7 80.8 289 222.4 80.8 15 11.8 80.4Nevada 22 4,633 1.7 100.0 393 144.5 100.0 442 162.5 100.0 10 3.6 100.0New Hampshire 230 6,116 4.7 89.1 254 195.0 89.1 307 235.4 89.6 17 13.3 88.7See notes at end of table.
Table 11. Number of public library materials and library materials per capita or per 1,000 population, by type of material and state: Fiscal year 2007Current print serial subscriptions
62
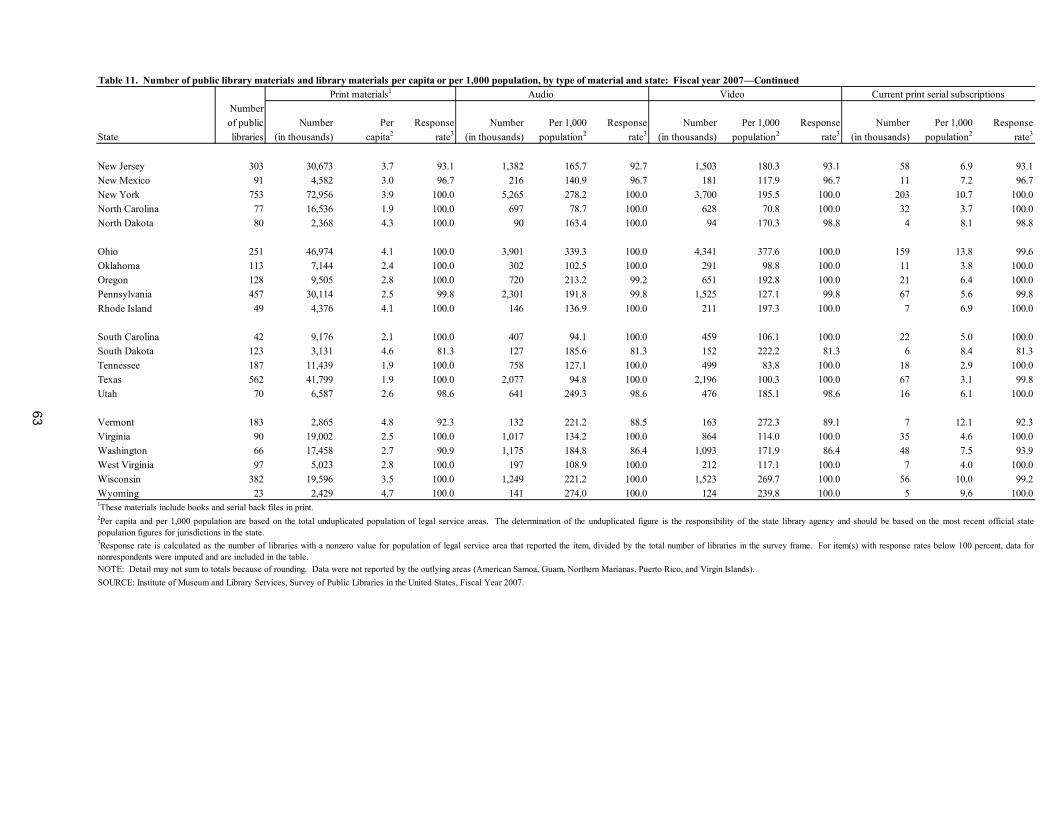
Table 11. Number of public library materials and library materials per capita or per 1,000 population, by type of material and state: Fiscal year 2007—ContinuedPrint materials1 Audio Video
Numberof public Number Per Response Number Per 1,000 Response Number Per 1,000 Response Number Per 1,000 Response
State libraries (in thousands) capita2 rate3 (in thousands) population2 rate3 (in thousands) population2 rate3 (in thousands) population2 rate3
New Jersey 303 30,673 3.7 93.1 1,382 165.7 92.7 1,503 180.3 93.1 58 6.9 93.1New Mexico 91 4,582 3.0 96.7 216 140.9 96.7 181 117.9 96.7 11 7.2 96.7New York 753 72,956 3.9 100.0 5,265 278.2 100.0 3,700 195.5 100.0 203 10.7 100.0North Carolina 77 16,536 1.9 100.0 697 78.7 100.0 628 70.8 100.0 32 3.7 100.0North Dakota 80 2,368 4.3 100.0 90 163.4 100.0 94 170.3 98.8 4 8.1 98.8
Ohio 251 46,974 4.1 100.0 3,901 339.3 100.0 4,341 377.6 100.0 159 13.8 99.6Oklahoma 113 7,144 2.4 100.0 302 102.5 100.0 291 98.8 100.0 11 3.8 100.0Oregon 128 9,505 2.8 100.0 720 213.2 99.2 651 192.8 100.0 21 6.4 100.0Pennsylvania 457 30,114 2.5 99.8 2,301 191.8 99.8 1,525 127.1 99.8 67 5.6 99.8Rhode Island 49 4,376 4.1 100.0 146 136.9 100.0 211 197.3 100.0 7 6.9 100.0
South Carolina 42 9,176 2.1 100.0 407 94.1 100.0 459 106.1 100.0 22 5.0 100.0South Dakota 123 3,131 4.6 81.3 127 185.6 81.3 152 222.2 81.3 6 8.4 81.3Tennessee 187 11,439 1.9 100.0 758 127.1 100.0 499 83.8 100.0 18 2.9 100.0Texas 562 41,799 1.9 100.0 2,077 94.8 100.0 2,196 100.3 100.0 67 3.1 99.8Utah 70 6,587 2.6 98.6 641 249.3 98.6 476 185.1 98.6 16 6.1 100.0
Vermont 183 2,865 4.8 92.3 132 221.2 88.5 163 272.3 89.1 7 12.1 92.3Virginia 90 19,002 2.5 100.0 1,017 134.2 100.0 864 114.0 100.0 35 4.6 100.0Washington 66 17,458 2.7 90.9 1,175 184.8 86.4 1,093 171.9 86.4 48 7.5 93.9West Virginia 97 5,023 2.8 100.0 197 108.9 100.0 212 117.1 100.0 7 4.0 100.0Wisconsin 382 19,596 3.5 100.0 1,249 221.2 100.0 1,523 269.7 100.0 56 10.0 99.2Wyoming 23 2,429 4.7 100.0 141 274.0 100.0 124 239.8 100.0 5 9.6 100.0
2Per capita and per 1,000 population are based on the total unduplicated population of legal service areas. The determination of the unduplicated figure is the responsibility of the state library agency and should be based on the most recent official statepopulation figures for jurisdictions in the state.
SOURCE: Institute of Museum and Library Services, Survey of Public Libraries in the United States, Fiscal Year 2007.NOTE: Detail may not sum to totals because of rounding. Data were not reported by the outlying areas (American Samoa, Guam, Northern Marianas, Puerto Rico, and Virgin Islands).
3Response rate is calculated as the number of libraries with a nonzero value for population of legal service area that reported the item, divided by the total number of libraries in the survey frame. For item(s) with response rates below 100 percent, data fornonrespondents were imputed and are included in the table.
1These materials include books and serial back files in print.
Current print serial subscriptions
63

64
(Page is intentionally blank.)
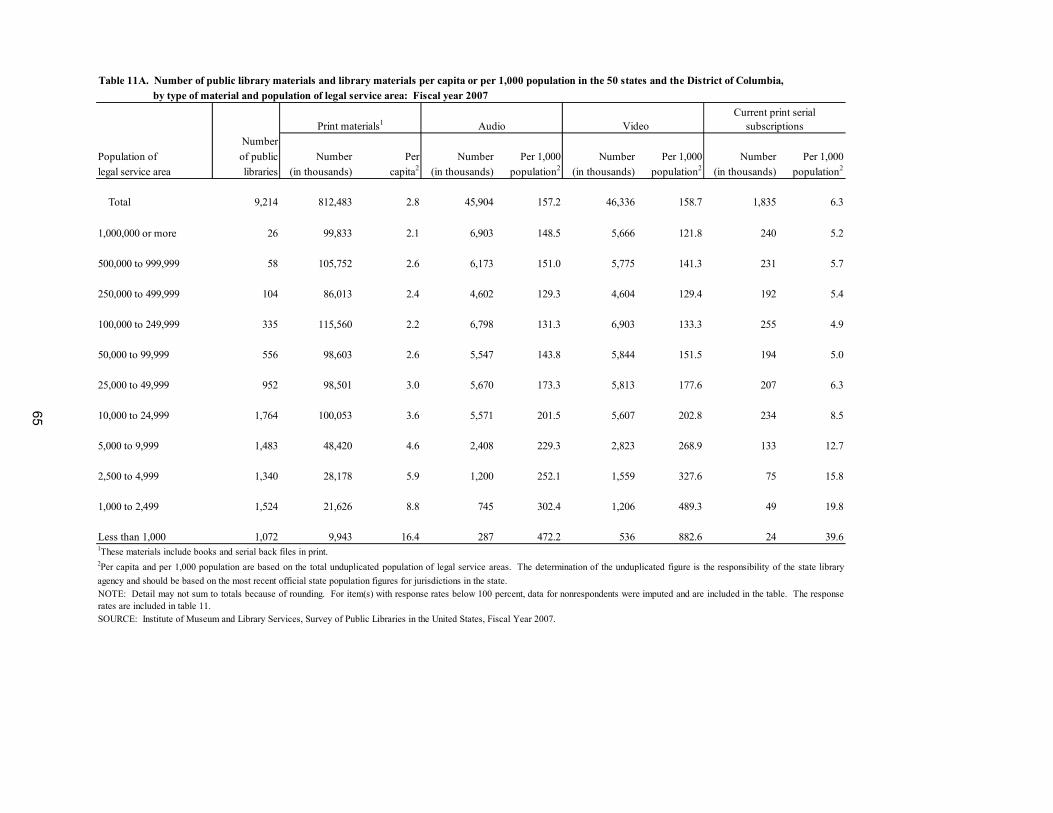
65
by type of material and population of legal service area: Fiscal year 2007
Print materials1 Audio VideoNumber
Population of of public Number Per Number Per 1,000 Number Per 1,000 Number Per 1,000legal service area libraries (in thousands) capita2 (in thousands) population2 (in thousands) population2 (in thousands) population2
Total 9,214 812,483 2.8 45,904 157.2 46,336 158.7 1,835 6.3
1,000,000 or more 26 99,833 2.1 6,903 148.5 5,666 121.8 240 5.2 500,000 to 999,999 58 105,752 2.6 6,173 151.0 5,775 141.3 231 5.7 250,000 to 499,999 104 86,013 2.4 4,602 129.3 4,604 129.4 192 5.4 100,000 to 249,999 335 115,560 2.2 6,798 131.3 6,903 133.3 255 4.9 50,000 to 99,999 556 98,603 2.6 5,547 143.8 5,844 151.5 194 5.0 25,000 to 49,999 952 98,501 3.0 5,670 173.3 5,813 177.6 207 6.3 10,000 to 24,999 1,764 100,053 3.6 5,571 201.5 5,607 202.8 234 8.5 5,000 to 9,999 1,483 48,420 4.6 2,408 229.3 2,823 268.9 133 12.7 2,500 to 4,999 1,340 28,178 5.9 1,200 252.1 1,559 327.6 75 15.8 1,000 to 2,499 1,524 21,626 8.8 745 302.4 1,206 489.3 49 19.8 Less than 1,000 1,072 9,943 16.4 287 472.2 536 882.6 24 39.6
Current print serial subscriptions
Table 11A. Number of public library materials and library materials per capita or per 1,000 population in the 50 states and the District of Columbia,
NOTE: Detail may not sum to totals because of rounding. For item(s) with response rates below 100 percent, data for nonrespondents were imputed and are included in the table. The responserates are included in table 11.SOURCE: Institute of Museum and Library Services, Survey of Public Libraries in the United States, Fiscal Year 2007.
1These materials include books and serial back files in print.2Per capita and per 1,000 population are based on the total unduplicated population of legal service areas. The determination of the unduplicated figure is the responsibility of the state libraryagency and should be based on the most recent official state population figures for jurisdictions in the state.
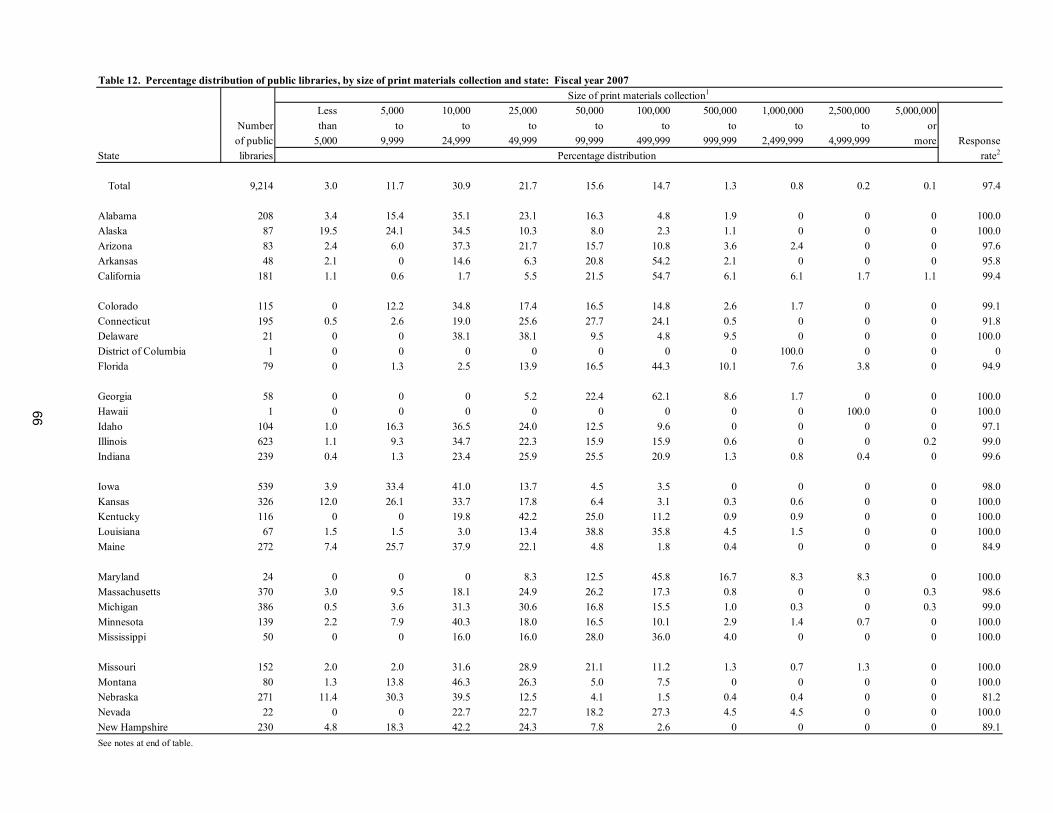
Size of print materials collection1
Less 5,000 10,000 25,000 50,000 100,000 500,000 1,000,000 2,500,000 5,000,000Number than to to to to to to to to orof public 5,000 9,999 24,999 49,999 99,999 499,999 999,999 2,499,999 4,999,999 more Response
State libraries Percentage distribution rate2
Total 9,214 3.0 11.7 30.9 21.7 15.6 14.7 1.3 0.8 0.2 0.1 97.4
Alabama 208 3.4 15.4 35.1 23.1 16.3 4.8 1.9 0 0 0 100.0Alaska 87 19.5 24.1 34.5 10.3 8.0 2.3 1.1 0 0 0 100.0Arizona 83 2.4 6.0 37.3 21.7 15.7 10.8 3.6 2.4 0 0 97.6Arkansas 48 2.1 0 14.6 6.3 20.8 54.2 2.1 0 0 0 95.8California 181 1.1 0.6 1.7 5.5 21.5 54.7 6.1 6.1 1.7 1.1 99.4
Colorado 115 0 12.2 34.8 17.4 16.5 14.8 2.6 1.7 0 0 99.1Connecticut 195 0.5 2.6 19.0 25.6 27.7 24.1 0.5 0 0 0 91.8Delaware 21 0 0 38.1 38.1 9.5 4.8 9.5 0 0 0 100.0District of Columbia 1 0 0 0 0 0 0 0 100.0 0 0 0Florida 79 0 1.3 2.5 13.9 16.5 44.3 10.1 7.6 3.8 0 94.9
Georgia 58 0 0 0 5.2 22.4 62.1 8.6 1.7 0 0 100.0Hawaii 1 0 0 0 0 0 0 0 0 100.0 0 100.0Idaho 104 1.0 16.3 36.5 24.0 12.5 9.6 0 0 0 0 97.1Illinois 623 1.1 9.3 34.7 22.3 15.9 15.9 0.6 0 0 0.2 99.0Indiana 239 0.4 1.3 23.4 25.9 25.5 20.9 1.3 0.8 0.4 0 99.6
Iowa 539 3.9 33.4 41.0 13.7 4.5 3.5 0 0 0 0 98.0Kansas 326 12.0 26.1 33.7 17.8 6.4 3.1 0.3 0.6 0 0 100.0Kentucky 116 0 0 19.8 42.2 25.0 11.2 0.9 0.9 0 0 100.0Louisiana 67 1.5 1.5 3.0 13.4 38.8 35.8 4.5 1.5 0 0 100.0Maine 272 7.4 25.7 37.9 22.1 4.8 1.8 0.4 0 0 0 84.9
Maryland 24 0 0 0 8.3 12.5 45.8 16.7 8.3 8.3 0 100.0Massachusetts 370 3.0 9.5 18.1 24.9 26.2 17.3 0.8 0 0 0.3 98.6Michigan 386 0.5 3.6 31.3 30.6 16.8 15.5 1.0 0.3 0 0.3 99.0Minnesota 139 2.2 7.9 40.3 18.0 16.5 10.1 2.9 1.4 0.7 0 100.0Mississippi 50 0 0 16.0 16.0 28.0 36.0 4.0 0 0 0 100.0
Missouri 152 2.0 2.0 31.6 28.9 21.1 11.2 1.3 0.7 1.3 0 100.0Montana 80 1.3 13.8 46.3 26.3 5.0 7.5 0 0 0 0 100.0Nebraska 271 11.4 30.3 39.5 12.5 4.1 1.5 0.4 0.4 0 0 81.2Nevada 22 0 0 22.7 22.7 18.2 27.3 4.5 4.5 0 0 100.0New Hampshire 230 4.8 18.3 42.2 24.3 7.8 2.6 0 0 0 0 89.1See notes at end of table.
Table 12. Percentage distribution of public libraries, by size of print materials collection and state: Fiscal year 2007
66
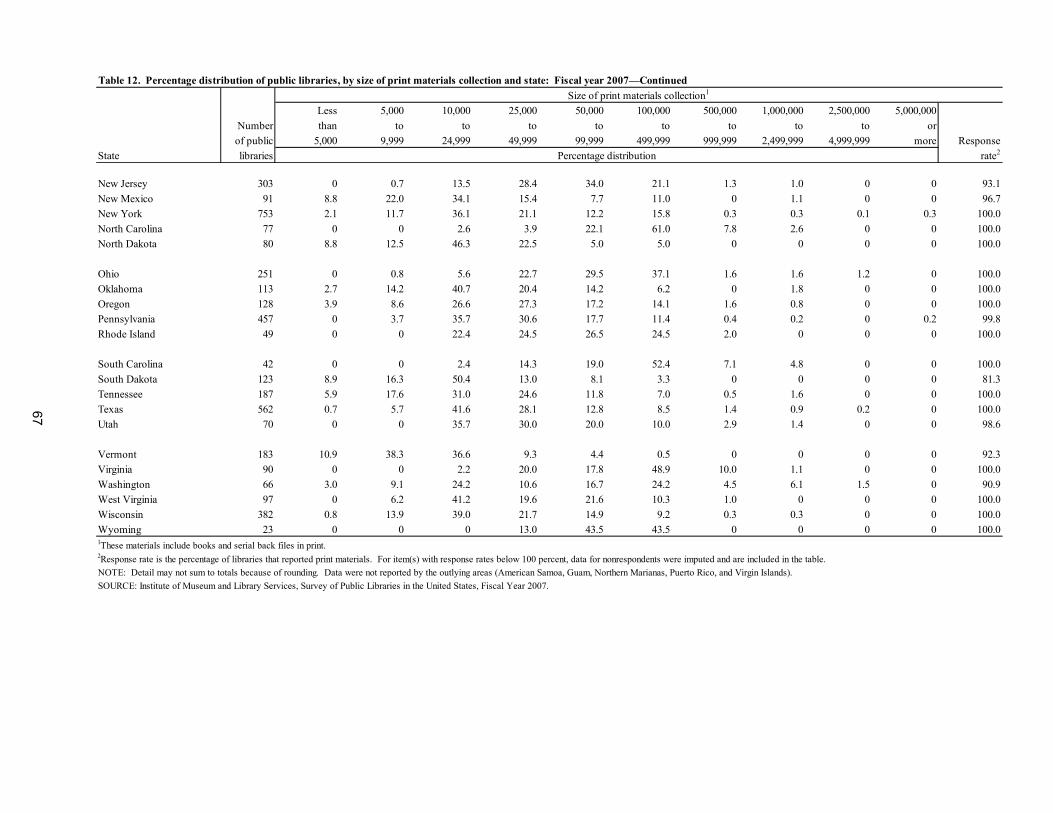
Size of print materials collection1
Less 5,000 10,000 25,000 50,000 100,000 500,000 1,000,000 2,500,000 5,000,000Number than to to to to to to to to orof public 5,000 9,999 24,999 49,999 99,999 499,999 999,999 2,499,999 4,999,999 more Response
State libraries Percentage distribution rate2
New Jersey 303 0 0.7 13.5 28.4 34.0 21.1 1.3 1.0 0 0 93.1New Mexico 91 8.8 22.0 34.1 15.4 7.7 11.0 0 1.1 0 0 96.7New York 753 2.1 11.7 36.1 21.1 12.2 15.8 0.3 0.3 0.1 0.3 100.0North Carolina 77 0 0 2.6 3.9 22.1 61.0 7.8 2.6 0 0 100.0North Dakota 80 8.8 12.5 46.3 22.5 5.0 5.0 0 0 0 0 100.0
Ohio 251 0 0.8 5.6 22.7 29.5 37.1 1.6 1.6 1.2 0 100.0Oklahoma 113 2.7 14.2 40.7 20.4 14.2 6.2 0 1.8 0 0 100.0Oregon 128 3.9 8.6 26.6 27.3 17.2 14.1 1.6 0.8 0 0 100.0Pennsylvania 457 0 3.7 35.7 30.6 17.7 11.4 0.4 0.2 0 0.2 99.8Rhode Island 49 0 0 22.4 24.5 26.5 24.5 2.0 0 0 0 100.0
South Carolina 42 0 0 2.4 14.3 19.0 52.4 7.1 4.8 0 0 100.0South Dakota 123 8.9 16.3 50.4 13.0 8.1 3.3 0 0 0 0 81.3Tennessee 187 5.9 17.6 31.0 24.6 11.8 7.0 0.5 1.6 0 0 100.0Texas 562 0.7 5.7 41.6 28.1 12.8 8.5 1.4 0.9 0.2 0 100.0Utah 70 0 0 35.7 30.0 20.0 10.0 2.9 1.4 0 0 98.6
Vermont 183 10.9 38.3 36.6 9.3 4.4 0.5 0 0 0 0 92.3Virginia 90 0 0 2.2 20.0 17.8 48.9 10.0 1.1 0 0 100.0Washington 66 3.0 9.1 24.2 10.6 16.7 24.2 4.5 6.1 1.5 0 90.9West Virginia 97 0 6.2 41.2 19.6 21.6 10.3 1.0 0 0 0 100.0Wisconsin 382 0.8 13.9 39.0 21.7 14.9 9.2 0.3 0.3 0 0 100.0Wyoming 23 0 0 0 13.0 43.5 43.5 0 0 0 0 100.0
NOTE: Detail may not sum to totals because of rounding. Data were not reported by the outlying areas (American Samoa, Guam, Northern Marianas, Puerto Rico, and Virgin Islands).SOURCE: Institute of Museum and Library Services, Survey of Public Libraries in the United States, Fiscal Year 2007.
Table 12. Percentage distribution of public libraries, by size of print materials collection and state: Fiscal year 2007—Continued
1These materials include books and serial back files in print.2Response rate is the percentage of libraries that reported print materials. For item(s) with response rates below 100 percent, data for nonrespondents were imputed and are included in the table.
67

68
(Page is intentionally blank.)
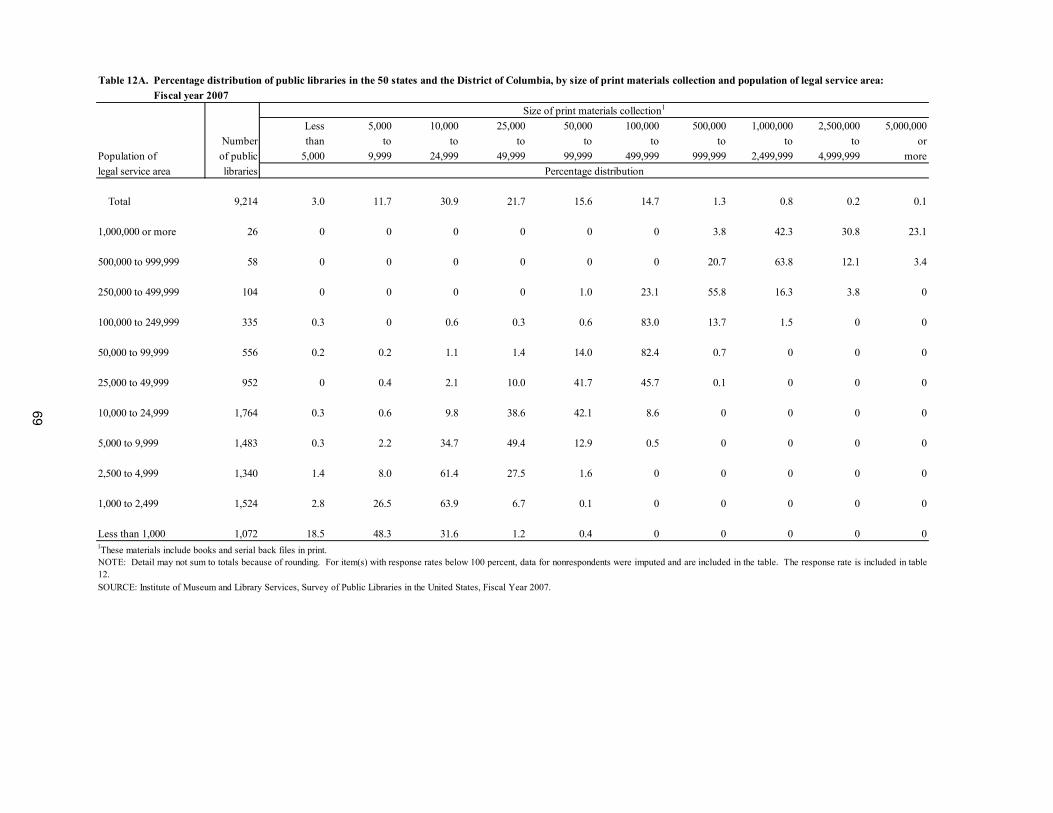
Size of print materials collection1
Less 5,000 10,000 25,000 50,000 100,000 500,000 1,000,000 2,500,000 5,000,000Number than to to to to to to to to or
Population of of public 5,000 9,999 24,999 49,999 99,999 499,999 999,999 2,499,999 4,999,999 morelegal service area libraries Percentage distribution
Total 9,214 3.0 11.7 30.9 21.7 15.6 14.7 1.3 0.8 0.2 0.1
1,000,000 or more 26 0 0 0 0 0 0 3.8 42.3 30.8 23.1 500,000 to 999,999 58 0 0 0 0 0 0 20.7 63.8 12.1 3.4 250,000 to 499,999 104 0 0 0 0 1.0 23.1 55.8 16.3 3.8 0 100,000 to 249,999 335 0.3 0 0.6 0.3 0.6 83.0 13.7 1.5 0 0 50,000 to 99,999 556 0.2 0.2 1.1 1.4 14.0 82.4 0.7 0 0 0 25,000 to 49,999 952 0 0.4 2.1 10.0 41.7 45.7 0.1 0 0 0 10,000 to 24,999 1,764 0.3 0.6 9.8 38.6 42.1 8.6 0 0 0 0 5,000 to 9,999 1,483 0.3 2.2 34.7 49.4 12.9 0.5 0 0 0 0 2,500 to 4,999 1,340 1.4 8.0 61.4 27.5 1.6 0 0 0 0 0 1,000 to 2,499 1,524 2.8 26.5 63.9 6.7 0.1 0 0 0 0 0 Less than 1,000 1,072 18.5 48.3 31.6 1.2 0.4 0 0 0 0 0
Table 12A. Percentage distribution of public libraries in the 50 states and the District of Columbia, by size of print materials collection and population of legal service area:
NOTE: Detail may not sum to totals because of rounding. For item(s) with response rates below 100 percent, data for nonrespondents were imputed and are included in the table. The response rate is included in table12. SOURCE: Institute of Museum and Library Services, Survey of Public Libraries in the United States, Fiscal Year 2007.
Table 12A. Fiscal year 2007
1These materials include books and serial back files in print.
69
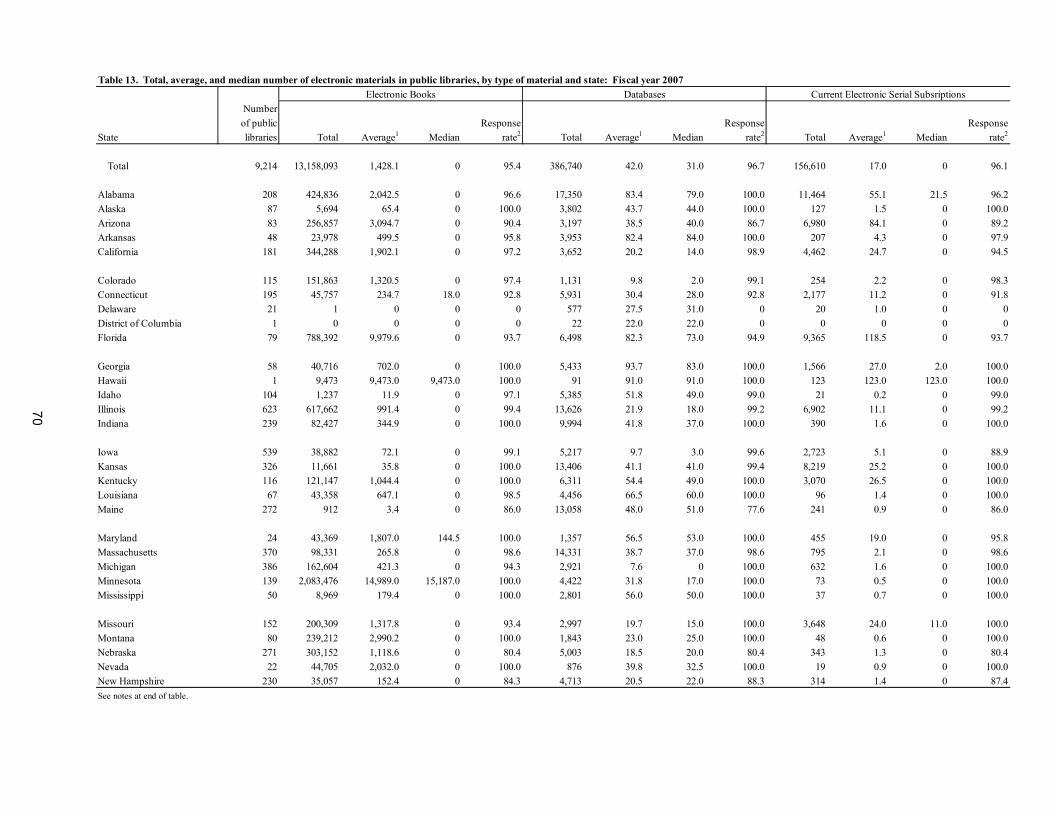
Numberof public Response Response Response
State libraries Total Average1 Median rate2 Total Average1 Median rate2 Total Average1 Median rate2
Total 9,214 13,158,093 1,428.1 0 95.4 386,740 42.0 31.0 96.7 156,610 17.0 0 96.1
Alabama 208 424,836 2,042.5 0 96.6 17,350 83.4 79.0 100.0 11,464 55.1 21.5 96.2Alaska 87 5,694 65.4 0 100.0 3,802 43.7 44.0 100.0 127 1.5 0 100.0Arizona 83 256,857 3,094.7 0 90.4 3,197 38.5 40.0 86.7 6,980 84.1 0 89.2Arkansas 48 23,978 499.5 0 95.8 3,953 82.4 84.0 100.0 207 4.3 0 97.9California 181 344,288 1,902.1 0 97.2 3,652 20.2 14.0 98.9 4,462 24.7 0 94.5
Colorado 115 151,863 1,320.5 0 97.4 1,131 9.8 2.0 99.1 254 2.2 0 98.3Connecticut 195 45,757 234.7 18.0 92.8 5,931 30.4 28.0 92.8 2,177 11.2 0 91.8Delaware 21 1 0 0 0 577 27.5 31.0 0 20 1.0 0 0District of Columbia 1 0 0 0 0 22 22.0 22.0 0 0 0 0 0Florida 79 788,392 9,979.6 0 93.7 6,498 82.3 73.0 94.9 9,365 118.5 0 93.7
Georgia 58 40,716 702.0 0 100.0 5,433 93.7 83.0 100.0 1,566 27.0 2.0 100.0Hawaii 1 9,473 9,473.0 9,473.0 100.0 91 91.0 91.0 100.0 123 123.0 123.0 100.0Idaho 104 1,237 11.9 0 97.1 5,385 51.8 49.0 99.0 21 0.2 0 99.0Illinois 623 617,662 991.4 0 99.4 13,626 21.9 18.0 99.2 6,902 11.1 0 99.2Indiana 239 82,427 344.9 0 100.0 9,994 41.8 37.0 100.0 390 1.6 0 100.0
Iowa 539 38,882 72.1 0 99.1 5,217 9.7 3.0 99.6 2,723 5.1 0 88.9Kansas 326 11,661 35.8 0 100.0 13,406 41.1 41.0 99.4 8,219 25.2 0 100.0Kentucky 116 121,147 1,044.4 0 100.0 6,311 54.4 49.0 100.0 3,070 26.5 0 100.0Louisiana 67 43,358 647.1 0 98.5 4,456 66.5 60.0 100.0 96 1.4 0 100.0Maine 272 912 3.4 0 86.0 13,058 48.0 51.0 77.6 241 0.9 0 86.0
Maryland 24 43,369 1,807.0 144.5 100.0 1,357 56.5 53.0 100.0 455 19.0 0 95.8Massachusetts 370 98,331 265.8 0 98.6 14,331 38.7 37.0 98.6 795 2.1 0 98.6Michigan 386 162,604 421.3 0 94.3 2,921 7.6 0 100.0 632 1.6 0 100.0Minnesota 139 2,083,476 14,989.0 15,187.0 100.0 4,422 31.8 17.0 100.0 73 0.5 0 100.0Mississippi 50 8,969 179.4 0 100.0 2,801 56.0 50.0 100.0 37 0.7 0 100.0
Missouri 152 200,309 1,317.8 0 93.4 2,997 19.7 15.0 100.0 3,648 24.0 11.0 100.0Montana 80 239,212 2,990.2 0 100.0 1,843 23.0 25.0 100.0 48 0.6 0 100.0Nebraska 271 303,152 1,118.6 0 80.4 5,003 18.5 20.0 80.4 343 1.3 0 80.4Nevada 22 44,705 2,032.0 0 100.0 876 39.8 32.5 100.0 19 0.9 0 100.0New Hampshire 230 35,057 152.4 0 84.3 4,713 20.5 22.0 88.3 314 1.4 0 87.4See notes at end of table.
Table 13. Total, average, and median number of electronic materials in public libraries, by type of material and state: Fiscal year 2007Electronic Books Databases Current Electronic Serial Subsriptions
70
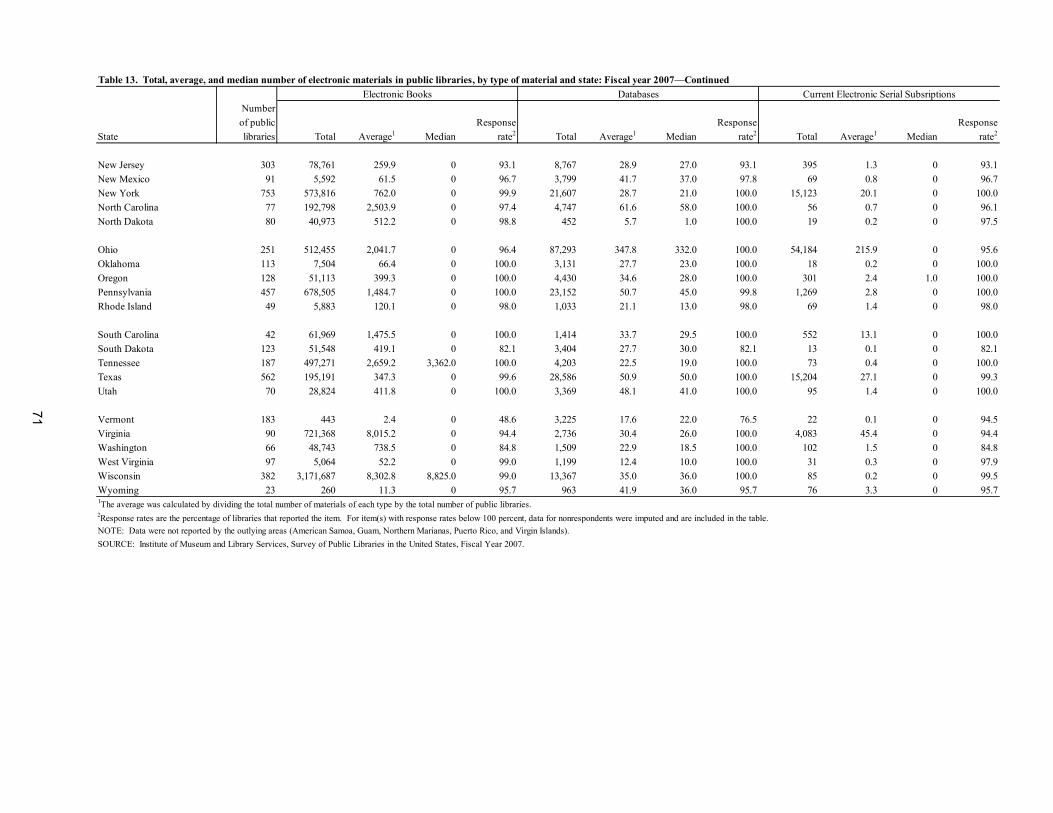
Numberof public Response Response Response
State libraries Total Average1 Median rate2 Total Average1 Median rate2 Total Average1 Median rate2
New Jersey 303 78,761 259.9 0 93.1 8,767 28.9 27.0 93.1 395 1.3 0 93.1New Mexico 91 5,592 61.5 0 96.7 3,799 41.7 37.0 97.8 69 0.8 0 96.7New York 753 573,816 762.0 0 99.9 21,607 28.7 21.0 100.0 15,123 20.1 0 100.0North Carolina 77 192,798 2,503.9 0 97.4 4,747 61.6 58.0 100.0 56 0.7 0 96.1North Dakota 80 40,973 512.2 0 98.8 452 5.7 1.0 100.0 19 0.2 0 97.5
Ohio 251 512,455 2,041.7 0 96.4 87,293 347.8 332.0 100.0 54,184 215.9 0 95.6Oklahoma 113 7,504 66.4 0 100.0 3,131 27.7 23.0 100.0 18 0.2 0 100.0Oregon 128 51,113 399.3 0 100.0 4,430 34.6 28.0 100.0 301 2.4 1.0 100.0Pennsylvania 457 678,505 1,484.7 0 100.0 23,152 50.7 45.0 99.8 1,269 2.8 0 100.0Rhode Island 49 5,883 120.1 0 98.0 1,033 21.1 13.0 98.0 69 1.4 0 98.0
South Carolina 42 61,969 1,475.5 0 100.0 1,414 33.7 29.5 100.0 552 13.1 0 100.0South Dakota 123 51,548 419.1 0 82.1 3,404 27.7 30.0 82.1 13 0.1 0 82.1Tennessee 187 497,271 2,659.2 3,362.0 100.0 4,203 22.5 19.0 100.0 73 0.4 0 100.0Texas 562 195,191 347.3 0 99.6 28,586 50.9 50.0 100.0 15,204 27.1 0 99.3Utah 70 28,824 411.8 0 100.0 3,369 48.1 41.0 100.0 95 1.4 0 100.0
Vermont 183 443 2.4 0 48.6 3,225 17.6 22.0 76.5 22 0.1 0 94.5Virginia 90 721,368 8,015.2 0 94.4 2,736 30.4 26.0 100.0 4,083 45.4 0 94.4Washington 66 48,743 738.5 0 84.8 1,509 22.9 18.5 100.0 102 1.5 0 84.8West Virginia 97 5,064 52.2 0 99.0 1,199 12.4 10.0 100.0 31 0.3 0 97.9Wisconsin 382 3,171,687 8,302.8 8,825.0 99.0 13,367 35.0 36.0 100.0 85 0.2 0 99.5Wyoming 23 260 11.3 0 95.7 963 41.9 36.0 95.7 76 3.3 0 95.71The average was calculated by dividing the total number of materials of each type by the total number of public libraries.
SOURCE: Institute of Museum and Library Services, Survey of Public Libraries in the United States, Fiscal Year 2007.NOTE: Data were not reported by the outlying areas (American Samoa, Guam, Northern Marianas, Puerto Rico, and Virgin Islands).
2Response rates are the percentage of libraries that reported the item. For item(s) with response rates below 100 percent, data for nonrespondents were imputed and are included in the table.
Table 13. Total, average, and median number of electronic materials in public libraries, by type of material and state: Fiscal year 2007—ContinuedElectronic Books Databases Current Electronic Serial Subsriptions
71

72
(Page is intentionally blank.)
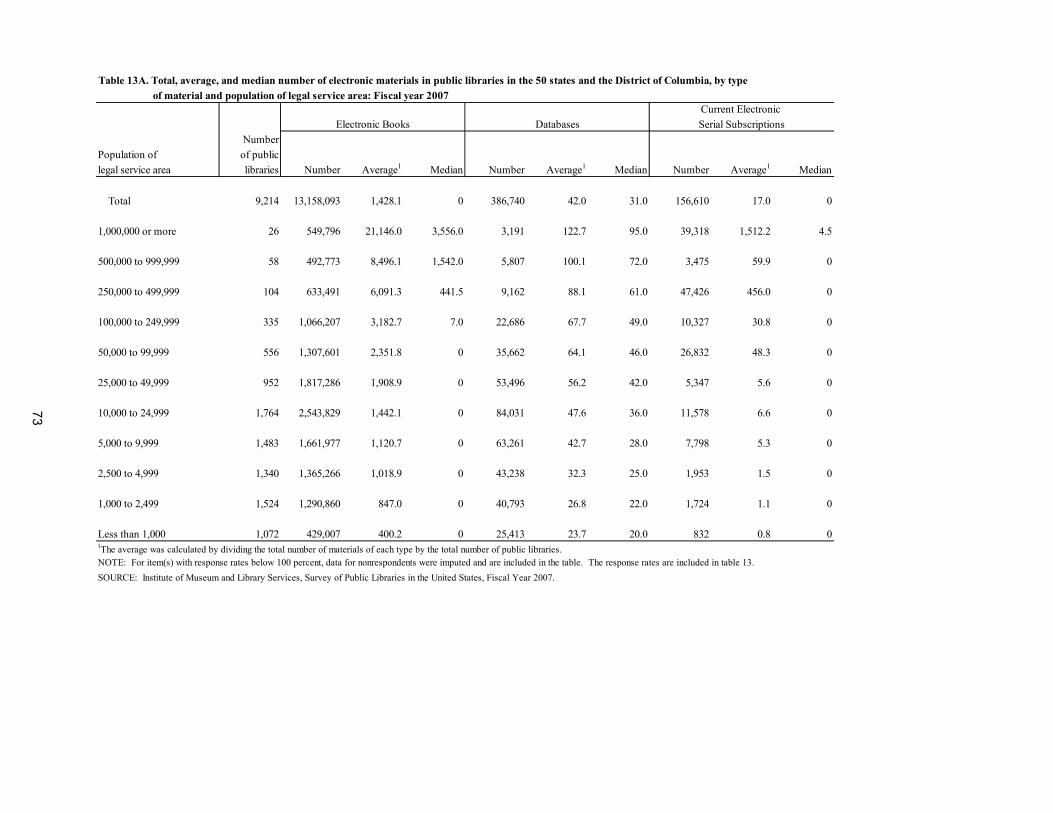
of material and population of legal service area: Fiscal year 2007
NumberPopulation of of publiclegal service area libraries Number Average1 Median Number Average1 Median Number Average1 Median
Total 9,214 13,158,093 1,428.1 0 386,740 42.0 31.0 156,610 17.0 0
1,000,000 or more 26 549,796 21,146.0 3,556.0 3,191 122.7 95.0 39,318 1,512.2 4.5 500,000 to 999,999 58 492,773 8,496.1 1,542.0 5,807 100.1 72.0 3,475 59.9 0 250,000 to 499,999 104 633,491 6,091.3 441.5 9,162 88.1 61.0 47,426 456.0 0 100,000 to 249,999 335 1,066,207 3,182.7 7.0 22,686 67.7 49.0 10,327 30.8 0 50,000 to 99,999 556 1,307,601 2,351.8 0 35,662 64.1 46.0 26,832 48.3 0 25,000 to 49,999 952 1,817,286 1,908.9 0 53,496 56.2 42.0 5,347 5.6 0 10,000 to 24,999 1,764 2,543,829 1,442.1 0 84,031 47.6 36.0 11,578 6.6 0 5,000 to 9,999 1,483 1,661,977 1,120.7 0 63,261 42.7 28.0 7,798 5.3 0 2,500 to 4,999 1,340 1,365,266 1,018.9 0 43,238 32.3 25.0 1,953 1.5 0 1,000 to 2,499 1,524 1,290,860 847.0 0 40,793 26.8 22.0 1,724 1.1 0
Less than 1,000 1,072 429,007 400.2 0 25,413 23.7 20.0 832 0.8 01The average was calculated by dividing the total number of materials of each type by the total number of public libraries.
Table 13A. Total, average, and median number of electronic materials in public libraries in the 50 states and the District of Columbia, by type
Current Electronic Electronic Books Databases Serial Subscriptions
SOURCE: Institute of Museum and Library Services, Survey of Public Libraries in the United States, Fiscal Year 2007.NOTE: For item(s) with response rates below 100 percent, data for nonrespondents were imputed and are included in the table. The response rates are included in table 13.
73
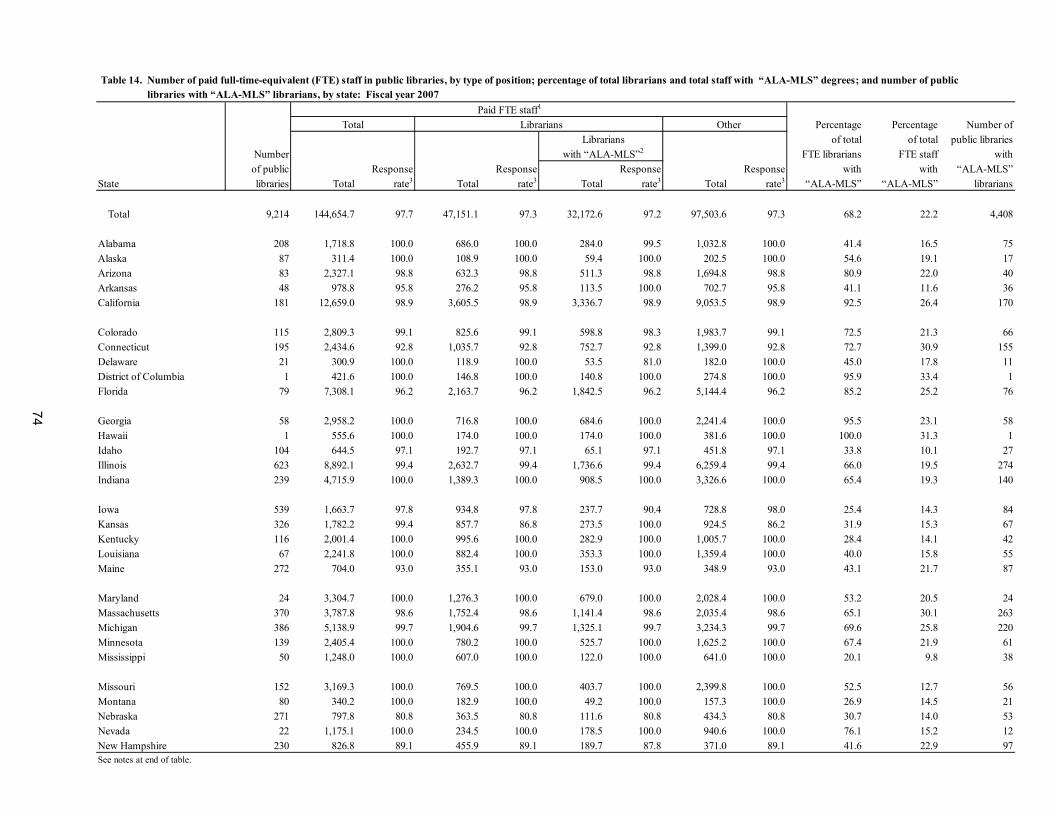
74
Table 14. libraries with “ALA-MLS” librarians, by state: Fiscal year 2007Paid FTE staff1
Total Librarians Other Percentage Percentage Number of Librarians of total of total public libraries
Number with “ALA-MLS”2 FTE librarians FTE staff withof public Response Response Response Response with with “ALA-MLS”
State libraries Total rate3 Total rate3 Total rate3 Total rate3 “ALA-MLS” “ALA-MLS” librarians
Total 9,214 144,654.7 97.7 47,151.1 97.3 32,172.6 97.2 97,503.6 97.3 68.2 22.2 4,408
Alabama 208 1,718.8 100.0 686.0 100.0 284.0 99.5 1,032.8 100.0 41.4 16.5 75Alaska 87 311.4 100.0 108.9 100.0 59.4 100.0 202.5 100.0 54.6 19.1 17Arizona 83 2,327.1 98.8 632.3 98.8 511.3 98.8 1,694.8 98.8 80.9 22.0 40Arkansas 48 978.8 95.8 276.2 95.8 113.5 100.0 702.7 95.8 41.1 11.6 36California 181 12,659.0 98.9 3,605.5 98.9 3,336.7 98.9 9,053.5 98.9 92.5 26.4 170
Colorado 115 2,809.3 99.1 825.6 99.1 598.8 98.3 1,983.7 99.1 72.5 21.3 66Connecticut 195 2,434.6 92.8 1,035.7 92.8 752.7 92.8 1,399.0 92.8 72.7 30.9 155Delaware 21 300.9 100.0 118.9 100.0 53.5 81.0 182.0 100.0 45.0 17.8 11District of Columbia 1 421.6 100.0 146.8 100.0 140.8 100.0 274.8 100.0 95.9 33.4 1Florida 79 7,308.1 96.2 2,163.7 96.2 1,842.5 96.2 5,144.4 96.2 85.2 25.2 76
Georgia 58 2,958.2 100.0 716.8 100.0 684.6 100.0 2,241.4 100.0 95.5 23.1 58Hawaii 1 555.6 100.0 174.0 100.0 174.0 100.0 381.6 100.0 100.0 31.3 1Idaho 104 644.5 97.1 192.7 97.1 65.1 97.1 451.8 97.1 33.8 10.1 27Illinois 623 8,892.1 99.4 2,632.7 99.4 1,736.6 99.4 6,259.4 99.4 66.0 19.5 274Indiana 239 4,715.9 100.0 1,389.3 100.0 908.5 100.0 3,326.6 100.0 65.4 19.3 140
Iowa 539 1,663.7 97.8 934.8 97.8 237.7 90.4 728.8 98.0 25.4 14.3 84Kansas 326 1,782.2 99.4 857.7 86.8 273.5 100.0 924.5 86.2 31.9 15.3 67Kentucky 116 2,001.4 100.0 995.6 100.0 282.9 100.0 1,005.7 100.0 28.4 14.1 42Louisiana 67 2,241.8 100.0 882.4 100.0 353.3 100.0 1,359.4 100.0 40.0 15.8 55Maine 272 704.0 93.0 355.1 93.0 153.0 93.0 348.9 93.0 43.1 21.7 87
Maryland 24 3,304.7 100.0 1,276.3 100.0 679.0 100.0 2,028.4 100.0 53.2 20.5 24Massachusetts 370 3,787.8 98.6 1,752.4 98.6 1,141.4 98.6 2,035.4 98.6 65.1 30.1 263Michigan 386 5,138.9 99.7 1,904.6 99.7 1,325.1 99.7 3,234.3 99.7 69.6 25.8 220Minnesota 139 2,405.4 100.0 780.2 100.0 525.7 100.0 1,625.2 100.0 67.4 21.9 61Mississippi 50 1,248.0 100.0 607.0 100.0 122.0 100.0 641.0 100.0 20.1 9.8 38
Missouri 152 3,169.3 100.0 769.5 100.0 403.7 100.0 2,399.8 100.0 52.5 12.7 56Montana 80 340.2 100.0 182.9 100.0 49.2 100.0 157.3 100.0 26.9 14.5 21Nebraska 271 797.8 80.8 363.5 80.8 111.6 80.8 434.3 80.8 30.7 14.0 53Nevada 22 1,175.1 100.0 234.5 100.0 178.5 100.0 940.6 100.0 76.1 15.2 12New Hampshire 230 826.8 89.1 455.9 89.1 189.7 87.8 371.0 89.1 41.6 22.9 97See notes at end of table.
Table 14. Number of paid full-time-equivalent (FTE) staff in public libraries, by type of position; percentage of total librarians and total staff with “ALA-MLS” degrees; and number of public
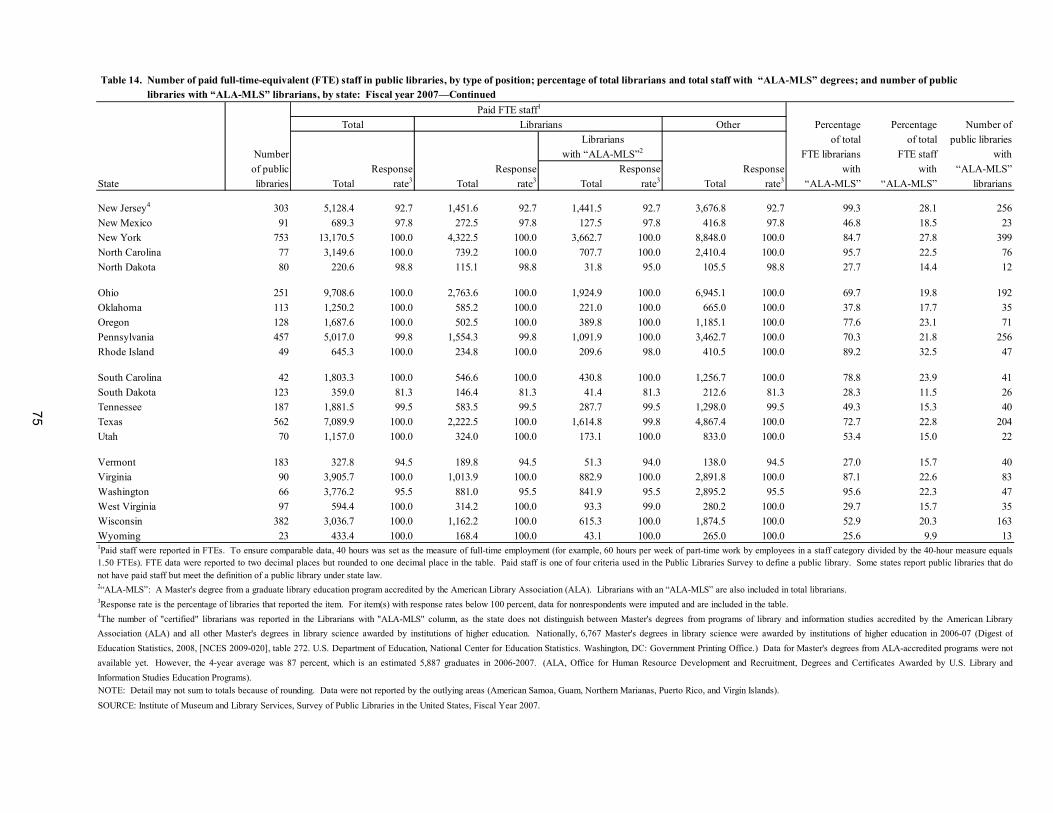
Table 14. libraries with “ALA-MLS” librarians, by state: Fiscal year 2007—Continued Paid FTE staff1
Total Librarians Other Percentage Percentage Number of Librarians of total of total public libraries
Number with “ALA-MLS”2 FTE librarians FTE staff withof public Response Response Response Response with with “ALA-MLS”
State libraries Total rate3 Total rate3 Total rate3 Total rate3 “ALA-MLS” “ALA-MLS” librarians
New Jersey4 303 5,128.4 92.7 1,451.6 92.7 1,441.5 92.7 3,676.8 92.7 99.3 28.1 256New Mexico 91 689.3 97.8 272.5 97.8 127.5 97.8 416.8 97.8 46.8 18.5 23New York 753 13,170.5 100.0 4,322.5 100.0 3,662.7 100.0 8,848.0 100.0 84.7 27.8 399North Carolina 77 3,149.6 100.0 739.2 100.0 707.7 100.0 2,410.4 100.0 95.7 22.5 76North Dakota 80 220.6 98.8 115.1 98.8 31.8 95.0 105.5 98.8 27.7 14.4 12
Ohio 251 9,708.6 100.0 2,763.6 100.0 1,924.9 100.0 6,945.1 100.0 69.7 19.8 192Oklahoma 113 1,250.2 100.0 585.2 100.0 221.0 100.0 665.0 100.0 37.8 17.7 35Oregon 128 1,687.6 100.0 502.5 100.0 389.8 100.0 1,185.1 100.0 77.6 23.1 71Pennsylvania 457 5,017.0 99.8 1,554.3 99.8 1,091.9 100.0 3,462.7 100.0 70.3 21.8 256Rhode Island 49 645.3 100.0 234.8 100.0 209.6 98.0 410.5 100.0 89.2 32.5 47
South Carolina 42 1,803.3 100.0 546.6 100.0 430.8 100.0 1,256.7 100.0 78.8 23.9 41South Dakota 123 359.0 81.3 146.4 81.3 41.4 81.3 212.6 81.3 28.3 11.5 26Tennessee 187 1,881.5 99.5 583.5 99.5 287.7 99.5 1,298.0 99.5 49.3 15.3 40Texas 562 7,089.9 100.0 2,222.5 100.0 1,614.8 99.8 4,867.4 100.0 72.7 22.8 204Utah 70 1,157.0 100.0 324.0 100.0 173.1 100.0 833.0 100.0 53.4 15.0 22
Vermont 183 327.8 94.5 189.8 94.5 51.3 94.0 138.0 94.5 27.0 15.7 40Virginia 90 3,905.7 100.0 1,013.9 100.0 882.9 100.0 2,891.8 100.0 87.1 22.6 83Washington 66 3,776.2 95.5 881.0 95.5 841.9 95.5 2,895.2 95.5 95.6 22.3 47West Virginia 97 594.4 100.0 314.2 100.0 93.3 99.0 280.2 100.0 29.7 15.7 35Wisconsin 382 3,036.7 100.0 1,162.2 100.0 615.3 100.0 1,874.5 100.0 52.9 20.3 163Wyoming 23 433.4 100.0 168.4 100.0 43.1 100.0 265.0 100.0 25.6 9.9 13
Table 14. Number of paid full-time-equivalent (FTE) staff in public libraries, by type of position; percentage of total librarians and total staff with “ALA-MLS” degrees; and number of public
NOTE: Detail may not sum to totals because of rounding. Data were not reported by the outlying areas (American Samoa, Guam, Northern Marianas, Puerto Rico, and Virgin Islands).SOURCE: Institute of Museum and Library Services, Survey of Public Libraries in the United States, Fiscal Year 2007.
1Paid staff were reported in FTEs. To ensure comparable data, 40 hours was set as the measure of full-time employment (for example, 60 hours per week of part-time work by employees in a staff category divided by the 40-hour measure equals1.50 FTEs). FTE data were reported to two decimal places but rounded to one decimal place in the table. Paid staff is one of four criteria used in the Public Libraries Survey to define a public library. Some states report public libraries that donot have paid staff but meet the definition of a public library under state law.
3Response rate is the percentage of libraries that reported the item. For item(s) with response rates below 100 percent, data for nonrespondents were imputed and are included in the table. 4The number of "certified" librarians was reported in the Librarians with "ALA-MLS" column, as the state does not distinguish between Master's degrees from programs of library and information studies accredited by the American LibraryAssociation (ALA) and all other Master's degrees in library science awarded by institutions of higher education. Nationally, 6,767 Master's degrees in library science were awarded by institutions of higher education in 2006-07 (Digest ofEducation Statistics, 2008, [NCES 2009-020], table 272. U.S. Department of Education, National Center for Education Statistics. Washington, DC: Government Printing Office.) Data for Master's degrees from ALA-accredited programs were notavailable yet. However, the 4-year average was 87 percent, which is an estimated 5,887 graduates in 2006-2007. (ALA, Office for Human Resource Development and Recruitment, Degrees and Certificates Awarded by U.S. Library andInformation Studies Education Programs).
2“ALA-MLS”: A Master's degree from a graduate library education program accredited by the American Library Association (ALA). Librarians with an “ALA-MLS” are also included in total librarians.
75

76
(Page is intentionally blank.)
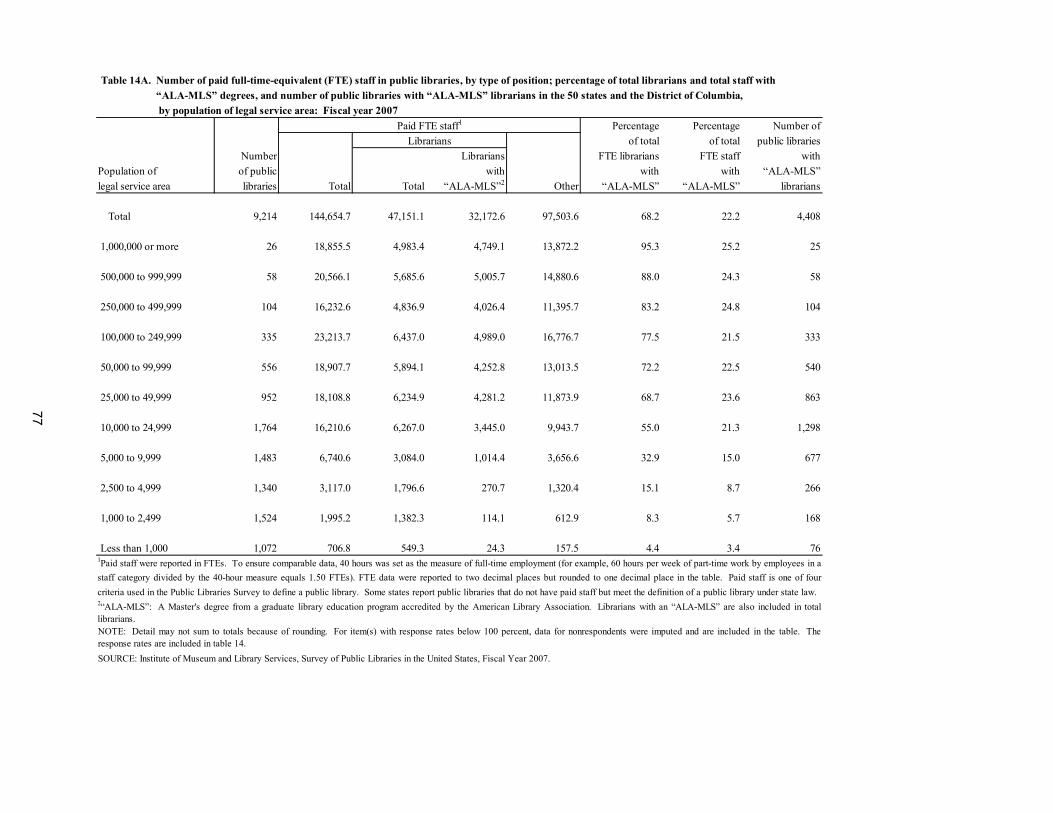
Paid FTE staff1 Percentage Percentage Number ofLibrarians of total of total public libraries
Number Librarians FTE librarians FTE staff withPopulation of of public with with with “ALA-MLS”legal service area libraries Total “ALA-MLS”2 Other “ALA-MLS” “ALA-MLS” librarians
Total 9,214 144,654.7 47,151.1 32,172.6 97,503.6 68.2 22.2 4,408 1,000,000 or more 26 18,855.5 4,983.4 4,749.1 13,872.2 95.3 25.2 25 500,000 to 999,999 58 20,566.1 5,685.6 5,005.7 14,880.6 88.0 24.3 58 250,000 to 499,999 104 16,232.6 4,836.9 4,026.4 11,395.7 83.2 24.8 104 100,000 to 249,999 335 23,213.7 6,437.0 4,989.0 16,776.7 77.5 21.5 333 50,000 to 99,999 556 18,907.7 5,894.1 4,252.8 13,013.5 72.2 22.5 540 25,000 to 49,999 952 18,108.8 6,234.9 4,281.2 11,873.9 68.7 23.6 863 10,000 to 24,999 1,764 16,210.6 6,267.0 3,445.0 9,943.7 55.0 21.3 1,298 5,000 to 9,999 1,483 6,740.6 3,084.0 1,014.4 3,656.6 32.9 15.0 677 2,500 to 4,999 1,340 3,117.0 1,796.6 270.7 1,320.4 15.1 8.7 266 1,000 to 2,499 1,524 1,995.2 1,382.3 114.1 612.9 8.3 5.7 168 Less than 1,000 1,072 706.8 549.3 24.3 157.5 4.4 3.4 76
SOURCE: Institute of Museum and Library Services, Survey of Public Libraries in the United States, Fiscal Year 2007.
Total
2“ALA-MLS”: A Master's degree from a graduate library education program accredited by the American Library Association. Librarians with an “ALA-MLS” are also included in totallibrarians.
Table 14A. Number of paid full-time-equivalent (FTE) staff in public libraries, by type of position; percentage of total librarians and total staff with Table 14A. “ALA-MLS” degrees, and number of public libraries with “ALA-MLS” librarians in the 50 states and the District of Columbia, Table 14A. by population of legal service area: Fiscal year 2007
NOTE: Detail may not sum to totals because of rounding. For item(s) with response rates below 100 percent, data for nonrespondents were imputed and are included in the table. Theresponse rates are included in table 14.
1Paid staff were reported in FTEs. To ensure comparable data, 40 hours was set as the measure of full-time employment (for example, 60 hours per week of part-time work by employees in astaff category divided by the 40-hour measure equals 1.50 FTEs). FTE data were reported to two decimal places but rounded to one decimal place in the table. Paid staff is one of fourcriteria used in the Public Libraries Survey to define a public library. Some states report public libraries that do not have paid staff but meet the definition of a public library under state law.
77
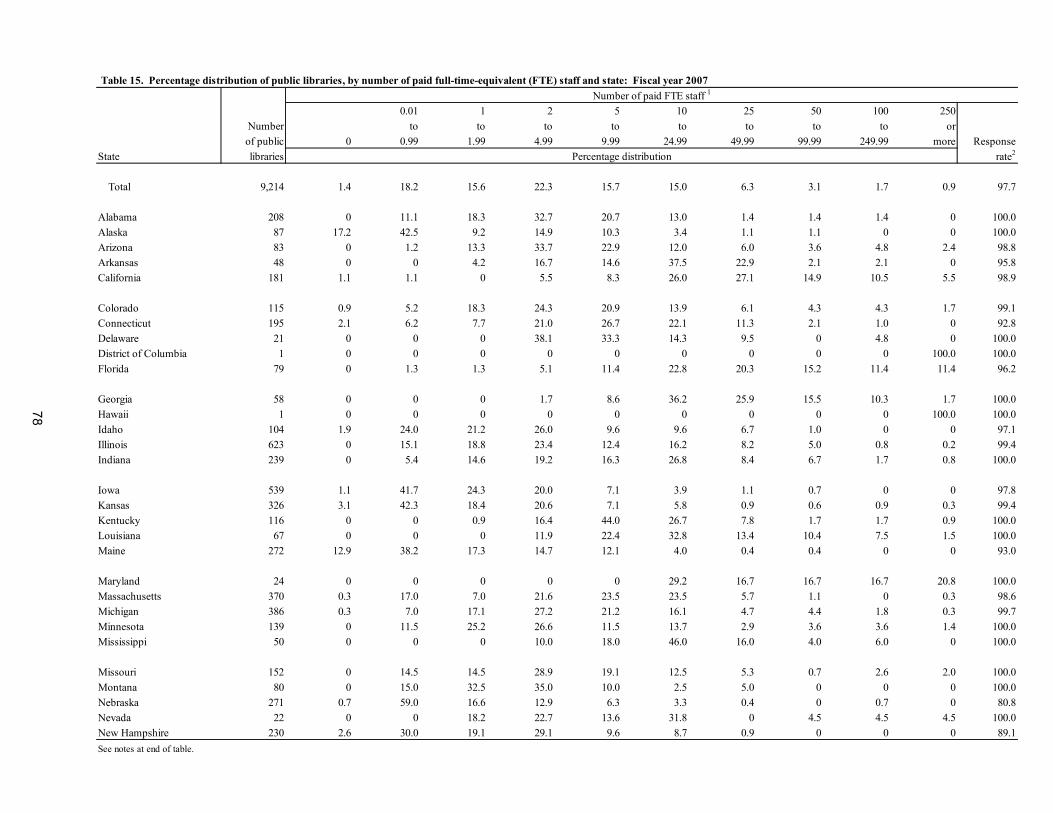
78
Number of paid FTE staff 1
0.01 1 2 5 10 25 50 100 250Number to to to to to to to to orof public 0 0.99 1.99 4.99 9.99 24.99 49.99 99.99 249.99 more Response
State libraries Percentage distribution rate2
Total 9,214 1.4 18.2 15.6 22.3 15.7 15.0 6.3 3.1 1.7 0.9 97.7
Alabama 208 0 11.1 18.3 32.7 20.7 13.0 1.4 1.4 1.4 0 100.0Alaska 87 17.2 42.5 9.2 14.9 10.3 3.4 1.1 1.1 0 0 100.0Arizona 83 0 1.2 13.3 33.7 22.9 12.0 6.0 3.6 4.8 2.4 98.8Arkansas 48 0 0 4.2 16.7 14.6 37.5 22.9 2.1 2.1 0 95.8California 181 1.1 1.1 0 5.5 8.3 26.0 27.1 14.9 10.5 5.5 98.9
Colorado 115 0.9 5.2 18.3 24.3 20.9 13.9 6.1 4.3 4.3 1.7 99.1Connecticut 195 2.1 6.2 7.7 21.0 26.7 22.1 11.3 2.1 1.0 0 92.8Delaware 21 0 0 0 38.1 33.3 14.3 9.5 0 4.8 0 100.0District of Columbia 1 0 0 0 0 0 0 0 0 0 100.0 100.0Florida 79 0 1.3 1.3 5.1 11.4 22.8 20.3 15.2 11.4 11.4 96.2
Georgia 58 0 0 0 1.7 8.6 36.2 25.9 15.5 10.3 1.7 100.0Hawaii 1 0 0 0 0 0 0 0 0 0 100.0 100.0Idaho 104 1.9 24.0 21.2 26.0 9.6 9.6 6.7 1.0 0 0 97.1Illinois 623 0 15.1 18.8 23.4 12.4 16.2 8.2 5.0 0.8 0.2 99.4Indiana 239 0 5.4 14.6 19.2 16.3 26.8 8.4 6.7 1.7 0.8 100.0
Iowa 539 1.1 41.7 24.3 20.0 7.1 3.9 1.1 0.7 0 0 97.8Kansas 326 3.1 42.3 18.4 20.6 7.1 5.8 0.9 0.6 0.9 0.3 99.4Kentucky 116 0 0 0.9 16.4 44.0 26.7 7.8 1.7 1.7 0.9 100.0Louisiana 67 0 0 0 11.9 22.4 32.8 13.4 10.4 7.5 1.5 100.0Maine 272 12.9 38.2 17.3 14.7 12.1 4.0 0.4 0.4 0 0 93.0
Maryland 24 0 0 0 0 0 29.2 16.7 16.7 16.7 20.8 100.0Massachusetts 370 0.3 17.0 7.0 21.6 23.5 23.5 5.7 1.1 0 0.3 98.6Michigan 386 0.3 7.0 17.1 27.2 21.2 16.1 4.7 4.4 1.8 0.3 99.7Minnesota 139 0 11.5 25.2 26.6 11.5 13.7 2.9 3.6 3.6 1.4 100.0Mississippi 50 0 0 0 10.0 18.0 46.0 16.0 4.0 6.0 0 100.0
Missouri 152 0 14.5 14.5 28.9 19.1 12.5 5.3 0.7 2.6 2.0 100.0Montana 80 0 15.0 32.5 35.0 10.0 2.5 5.0 0 0 0 100.0Nebraska 271 0.7 59.0 16.6 12.9 6.3 3.3 0.4 0 0.7 0 80.8Nevada 22 0 0 18.2 22.7 13.6 31.8 0 4.5 4.5 4.5 100.0New Hampshire 230 2.6 30.0 19.1 29.1 9.6 8.7 0.9 0 0 0 89.1See notes at end of table.
Table 15. Percentage distribution of public libraries, by number of paid full-time-equivalent (FTE) staff and state: Fiscal year 2007
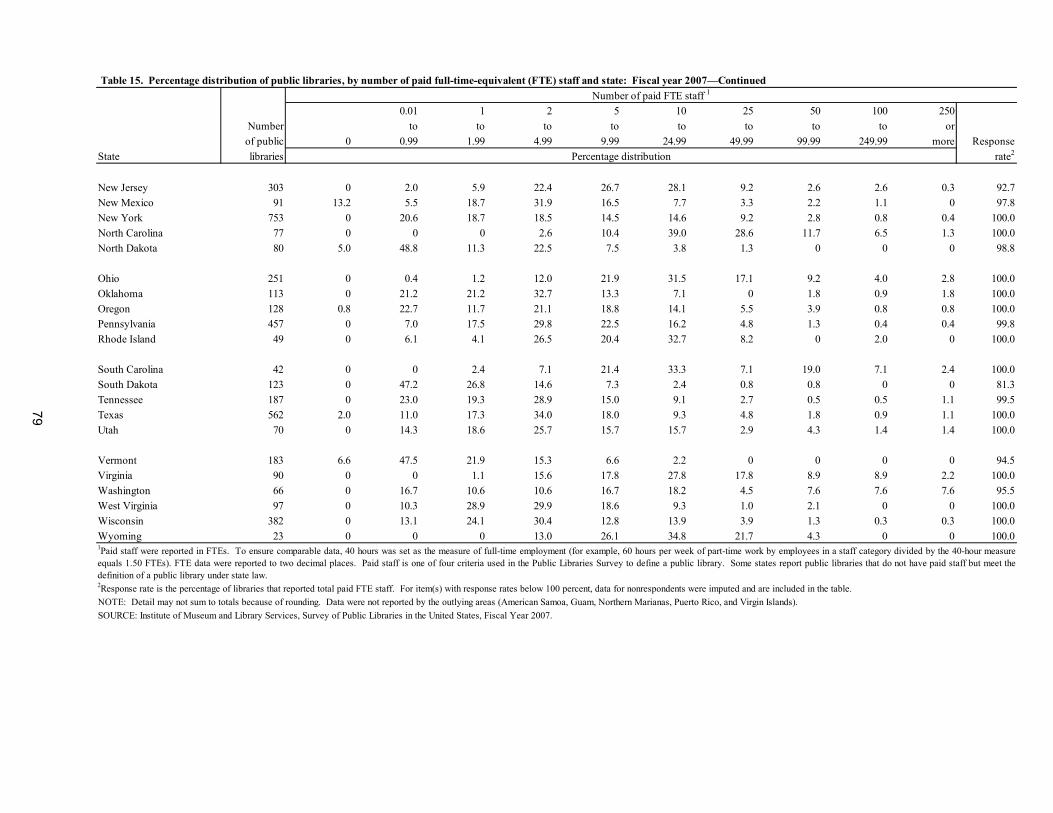
Number of paid FTE staff 1
0.01 1 2 5 10 25 50 100 250Number to to to to to to to to orof public 0 0.99 1.99 4.99 9.99 24.99 49.99 99.99 249.99 more Response
State libraries Percentage distribution rate2
New Jersey 303 0 2.0 5.9 22.4 26.7 28.1 9.2 2.6 2.6 0.3 92.7New Mexico 91 13.2 5.5 18.7 31.9 16.5 7.7 3.3 2.2 1.1 0 97.8New York 753 0 20.6 18.7 18.5 14.5 14.6 9.2 2.8 0.8 0.4 100.0North Carolina 77 0 0 0 2.6 10.4 39.0 28.6 11.7 6.5 1.3 100.0North Dakota 80 5.0 48.8 11.3 22.5 7.5 3.8 1.3 0 0 0 98.8
Ohio 251 0 0.4 1.2 12.0 21.9 31.5 17.1 9.2 4.0 2.8 100.0Oklahoma 113 0 21.2 21.2 32.7 13.3 7.1 0 1.8 0.9 1.8 100.0Oregon 128 0.8 22.7 11.7 21.1 18.8 14.1 5.5 3.9 0.8 0.8 100.0Pennsylvania 457 0 7.0 17.5 29.8 22.5 16.2 4.8 1.3 0.4 0.4 99.8Rhode Island 49 0 6.1 4.1 26.5 20.4 32.7 8.2 0 2.0 0 100.0
South Carolina 42 0 0 2.4 7.1 21.4 33.3 7.1 19.0 7.1 2.4 100.0South Dakota 123 0 47.2 26.8 14.6 7.3 2.4 0.8 0.8 0 0 81.3Tennessee 187 0 23.0 19.3 28.9 15.0 9.1 2.7 0.5 0.5 1.1 99.5Texas 562 2.0 11.0 17.3 34.0 18.0 9.3 4.8 1.8 0.9 1.1 100.0Utah 70 0 14.3 18.6 25.7 15.7 15.7 2.9 4.3 1.4 1.4 100.0
Vermont 183 6.6 47.5 21.9 15.3 6.6 2.2 0 0 0 0 94.5Virginia 90 0 0 1.1 15.6 17.8 27.8 17.8 8.9 8.9 2.2 100.0Washington 66 0 16.7 10.6 10.6 16.7 18.2 4.5 7.6 7.6 7.6 95.5West Virginia 97 0 10.3 28.9 29.9 18.6 9.3 1.0 2.1 0 0 100.0Wisconsin 382 0 13.1 24.1 30.4 12.8 13.9 3.9 1.3 0.3 0.3 100.0Wyoming 23 0 0 0 13.0 26.1 34.8 21.7 4.3 0 0 100.0
Table 15. Percentage distribution of public libraries, by number of paid full-time-equivalent (FTE) staff and state: Fiscal year 2007—Continued
SOURCE: Institute of Museum and Library Services, Survey of Public Libraries in the United States, Fiscal Year 2007.NOTE: Detail may not sum to totals because of rounding. Data were not reported by the outlying areas (American Samoa, Guam, Northern Marianas, Puerto Rico, and Virgin Islands).
1Paid staff were reported in FTEs. To ensure comparable data, 40 hours was set as the measure of full-time employment (for example, 60 hours per week of part-time work by employees in a staff category divided by the 40-hour measureequals 1.50 FTEs). FTE data were reported to two decimal places. Paid staff is one of four criteria used in the Public Libraries Survey to define a public library. Some states report public libraries that do not have paid staff but meet thedefinition of a public library under state law.2Response rate is the percentage of libraries that reported total paid FTE staff. For item(s) with response rates below 100 percent, data for nonrespondents were imputed and are included in the table.
79

80
(Page is intentionally blank.)
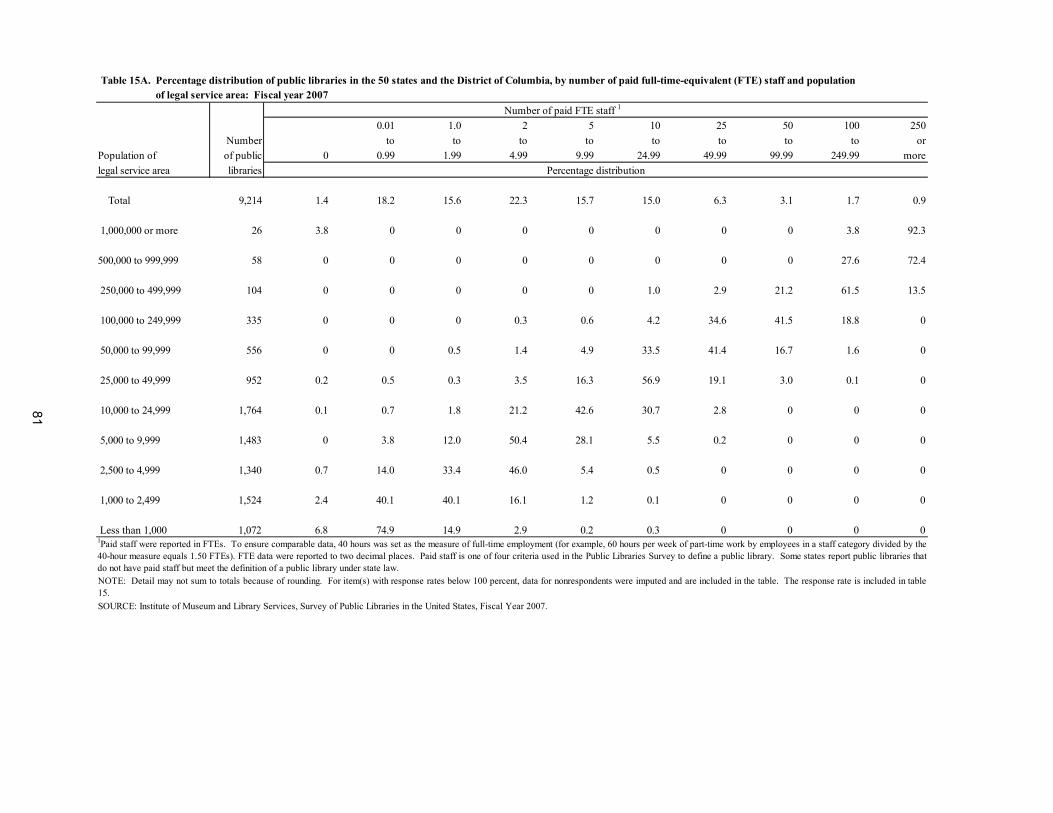
Table 15A. of legal service area: Fiscal year 2007Number of paid FTE staff 1
0.01 1.0 2 5 10 25 50 100 250Number to to to to to to to to or
Population of of public 0 0.99 1.99 4.99 9.99 24.99 49.99 99.99 249.99 morelegal service area libraries Percentage distribution
Total 9,214 1.4 18.2 15.6 22.3 15.7 15.0 6.3 3.1 1.7 0.9 1,000,000 or more 26 3.8 0 0 0 0 0 0 0 3.8 92.3 500,000 to 999,999 58 0 0 0 0 0 0 0 0 27.6 72.4 250,000 to 499,999 104 0 0 0 0 0 1.0 2.9 21.2 61.5 13.5 100,000 to 249,999 335 0 0 0 0.3 0.6 4.2 34.6 41.5 18.8 0 50,000 to 99,999 556 0 0 0.5 1.4 4.9 33.5 41.4 16.7 1.6 0 25,000 to 49,999 952 0.2 0.5 0.3 3.5 16.3 56.9 19.1 3.0 0.1 0 10,000 to 24,999 1,764 0.1 0.7 1.8 21.2 42.6 30.7 2.8 0 0 0 5,000 to 9,999 1,483 0 3.8 12.0 50.4 28.1 5.5 0.2 0 0 0 2,500 to 4,999 1,340 0.7 14.0 33.4 46.0 5.4 0.5 0 0 0 0 1,000 to 2,499 1,524 2.4 40.1 40.1 16.1 1.2 0.1 0 0 0 0 Less than 1,000 1,072 6.8 74.9 14.9 2.9 0.2 0.3 0 0 0 0
NOTE: Detail may not sum to totals because of rounding. For item(s) with response rates below 100 percent, data for nonrespondents were imputed and are included in the table. The response rate is included in table15.
1Paid staff were reported in FTEs. To ensure comparable data, 40 hours was set as the measure of full-time employment (for example, 60 hours per week of part-time work by employees in a staff category divided by the 40-hour measure equals 1.50 FTEs). FTE data were reported to two decimal places. Paid staff is one of four criteria used in the Public Libraries Survey to define a public library. Some states report public libraries thatdo not have paid staff but meet the definition of a public library under state law.
SOURCE: Institute of Museum and Library Services, Survey of Public Libraries in the United States, Fiscal Year 2007.
Table 15A. Percentage distribution of public libraries in the 50 states and the District of Columbia, by number of paid full-time-equivalent (FTE) staff and population
81
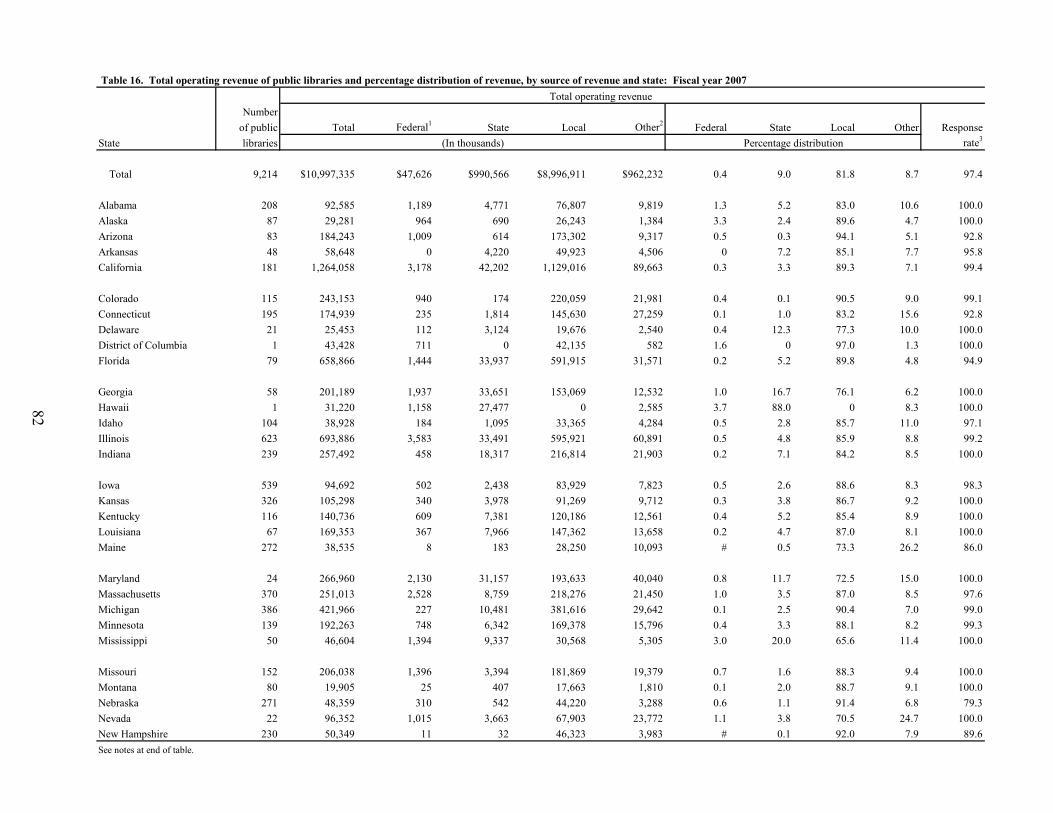
82
Total operating revenueNumber
of public Total Federal1 State Local Other2 Federal State Local Other ResponseState libraries (In thousands) Percentage distribution rate3
Total 9,214 $10,997,335 $47,626 $990,566 $8,996,911 $962,232 0.4 9.0 81.8 8.7 97.4
Alabama 208 92,585 1,189 4,771 76,807 9,819 1.3 5.2 83.0 10.6 100.0Alaska 87 29,281 964 690 26,243 1,384 3.3 2.4 89.6 4.7 100.0Arizona 83 184,243 1,009 614 173,302 9,317 0.5 0.3 94.1 5.1 92.8Arkansas 48 58,648 0 4,220 49,923 4,506 0 7.2 85.1 7.7 95.8California 181 1,264,058 3,178 42,202 1,129,016 89,663 0.3 3.3 89.3 7.1 99.4
Colorado 115 243,153 940 174 220,059 21,981 0.4 0.1 90.5 9.0 99.1Connecticut 195 174,939 235 1,814 145,630 27,259 0.1 1.0 83.2 15.6 92.8Delaware 21 25,453 112 3,124 19,676 2,540 0.4 12.3 77.3 10.0 100.0District of Columbia 1 43,428 711 0 42,135 582 1.6 0 97.0 1.3 100.0Florida 79 658,866 1,444 33,937 591,915 31,571 0.2 5.2 89.8 4.8 94.9
Georgia 58 201,189 1,937 33,651 153,069 12,532 1.0 16.7 76.1 6.2 100.0Hawaii 1 31,220 1,158 27,477 0 2,585 3.7 88.0 0 8.3 100.0Idaho 104 38,928 184 1,095 33,365 4,284 0.5 2.8 85.7 11.0 97.1Illinois 623 693,886 3,583 33,491 595,921 60,891 0.5 4.8 85.9 8.8 99.2Indiana 239 257,492 458 18,317 216,814 21,903 0.2 7.1 84.2 8.5 100.0
Iowa 539 94,692 502 2,438 83,929 7,823 0.5 2.6 88.6 8.3 98.3Kansas 326 105,298 340 3,978 91,269 9,712 0.3 3.8 86.7 9.2 100.0Kentucky 116 140,736 609 7,381 120,186 12,561 0.4 5.2 85.4 8.9 100.0Louisiana 67 169,353 367 7,966 147,362 13,658 0.2 4.7 87.0 8.1 100.0Maine 272 38,535 8 183 28,250 10,093 # 0.5 73.3 26.2 86.0
Maryland 24 266,960 2,130 31,157 193,633 40,040 0.8 11.7 72.5 15.0 100.0Massachusetts 370 251,013 2,528 8,759 218,276 21,450 1.0 3.5 87.0 8.5 97.6Michigan 386 421,966 227 10,481 381,616 29,642 0.1 2.5 90.4 7.0 99.0Minnesota 139 192,263 748 6,342 169,378 15,796 0.4 3.3 88.1 8.2 99.3Mississippi 50 46,604 1,394 9,337 30,568 5,305 3.0 20.0 65.6 11.4 100.0
Missouri 152 206,038 1,396 3,394 181,869 19,379 0.7 1.6 88.3 9.4 100.0Montana 80 19,905 25 407 17,663 1,810 0.1 2.0 88.7 9.1 100.0Nebraska 271 48,359 310 542 44,220 3,288 0.6 1.1 91.4 6.8 79.3Nevada 22 96,352 1,015 3,663 67,903 23,772 1.1 3.8 70.5 24.7 100.0New Hampshire 230 50,349 11 32 46,323 3,983 # 0.1 92.0 7.9 89.6See notes at end of table.
Table 16. Total operating revenue of public libraries and percentage distribution of revenue, by source of revenue and state: Fiscal year 2007
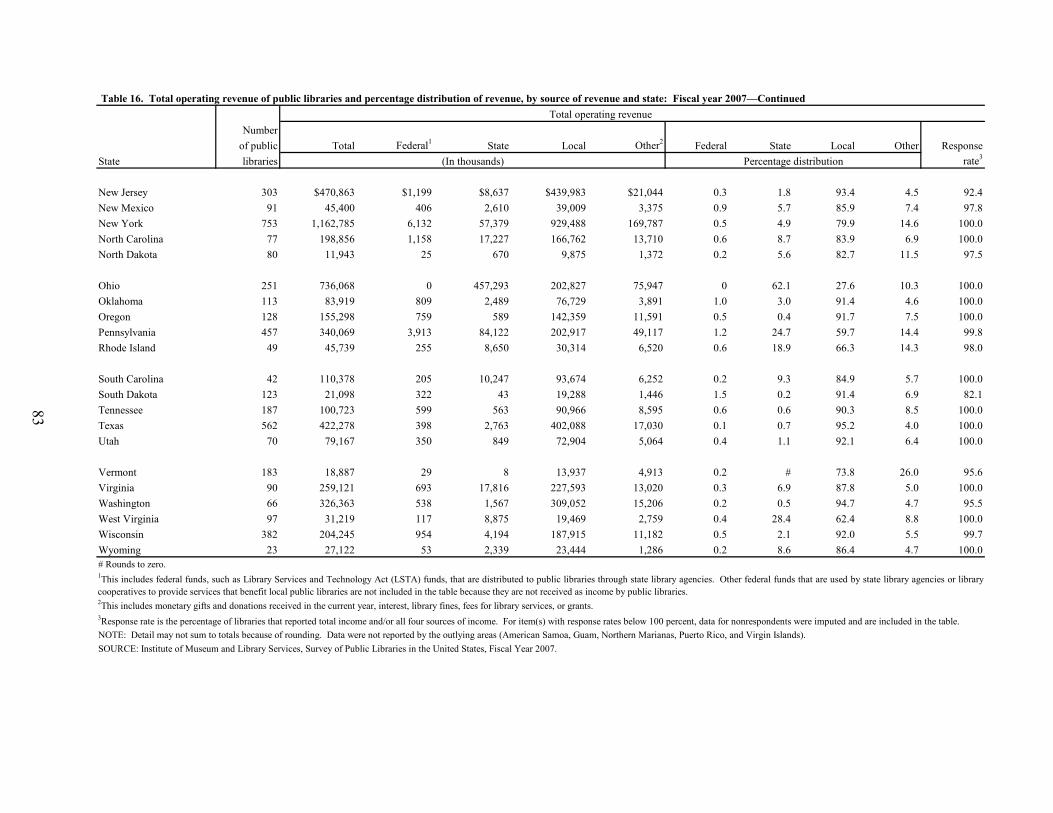
83
Total operating revenue Number
of public Total Federal1 State Local Other2 Federal State Local Other ResponseState libraries (In thousands) Percentage distribution rate3
New Jersey 303 $470,863 $1,199 $8,637 $439,983 $21,044 0.3 1.8 93.4 4.5 92.4New Mexico 91 45,400 406 2,610 39,009 3,375 0.9 5.7 85.9 7.4 97.8New York 753 1,162,785 6,132 57,379 929,488 169,787 0.5 4.9 79.9 14.6 100.0North Carolina 77 198,856 1,158 17,227 166,762 13,710 0.6 8.7 83.9 6.9 100.0North Dakota 80 11,943 25 670 9,875 1,372 0.2 5.6 82.7 11.5 97.5
Ohio 251 736,068 0 457,293 202,827 75,947 0 62.1 27.6 10.3 100.0Oklahoma 113 83,919 809 2,489 76,729 3,891 1.0 3.0 91.4 4.6 100.0Oregon 128 155,298 759 589 142,359 11,591 0.5 0.4 91.7 7.5 100.0Pennsylvania 457 340,069 3,913 84,122 202,917 49,117 1.2 24.7 59.7 14.4 99.8Rhode Island 49 45,739 255 8,650 30,314 6,520 0.6 18.9 66.3 14.3 98.0
South Carolina 42 110,378 205 10,247 93,674 6,252 0.2 9.3 84.9 5.7 100.0South Dakota 123 21,098 322 43 19,288 1,446 1.5 0.2 91.4 6.9 82.1Tennessee 187 100,723 599 563 90,966 8,595 0.6 0.6 90.3 8.5 100.0Texas 562 422,278 398 2,763 402,088 17,030 0.1 0.7 95.2 4.0 100.0Utah 70 79,167 350 849 72,904 5,064 0.4 1.1 92.1 6.4 100.0
Vermont 183 18,887 29 8 13,937 4,913 0.2 # 73.8 26.0 95.6Virginia 90 259,121 693 17,816 227,593 13,020 0.3 6.9 87.8 5.0 100.0Washington 66 326,363 538 1,567 309,052 15,206 0.2 0.5 94.7 4.7 95.5West Virginia 97 31,219 117 8,875 19,469 2,759 0.4 28.4 62.4 8.8 100.0Wisconsin 382 204,245 954 4,194 187,915 11,182 0.5 2.1 92.0 5.5 99.7Wyoming 23 27,122 53 2,339 23,444 1,286 0.2 8.6 86.4 4.7 100.0# Rounds to zero.1This includes federal funds, such as Library Services and Technology Act (LSTA) funds, that are distributed to public libraries through state library agencies. Other federal funds that are used by state library agencies or librarycooperatives to provide services that benefit local public libraries are not included in the table because they are not received as income by public libraries.
NOTE: Detail may not sum to totals because of rounding. Data were not reported by the outlying areas (American Samoa, Guam, Northern Marianas, Puerto Rico, and Virgin Islands).SOURCE: Institute of Museum and Library Services, Survey of Public Libraries in the United States, Fiscal Year 2007.
2This includes monetary gifts and donations received in the current year, interest, library fines, fees for library services, or grants.3Response rate is the percentage of libraries that reported total income and/or all four sources of income. For item(s) with response rates below 100 percent, data for nonrespondents were imputed and are included in the table.
Table 16. Total operating revenue of public libraries and percentage distribution of revenue, by source of revenue and state: Fiscal year 2007—Continued

84
(Page is intentionally blank.)
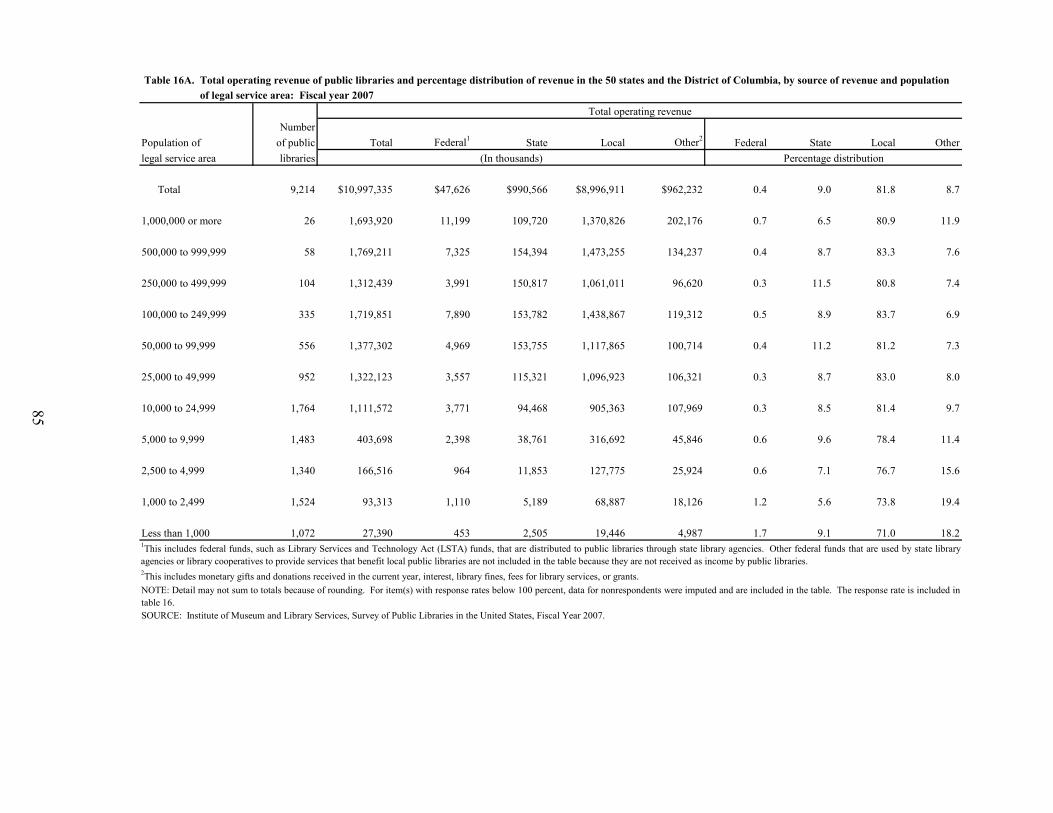
85
Table 16A. of legal service area: Fiscal year 2007Total operating revenue
NumberPopulation of of public Total Federal1 State Local Other2 Federal State Local Otherlegal service area libraries (In thousands) Percentage distribution
Total 9,214 $10,997,335 $47,626 $990,566 $8,996,911 $962,232 0.4 9.0 81.8 8.7 1,000,000 or more 26 1,693,920 11,199 109,720 1,370,826 202,176 0.7 6.5 80.9 11.9 500,000 to 999,999 58 1,769,211 7,325 154,394 1,473,255 134,237 0.4 8.7 83.3 7.6 250,000 to 499,999 104 1,312,439 3,991 150,817 1,061,011 96,620 0.3 11.5 80.8 7.4 100,000 to 249,999 335 1,719,851 7,890 153,782 1,438,867 119,312 0.5 8.9 83.7 6.9 50,000 to 99,999 556 1,377,302 4,969 153,755 1,117,865 100,714 0.4 11.2 81.2 7.3 25,000 to 49,999 952 1,322,123 3,557 115,321 1,096,923 106,321 0.3 8.7 83.0 8.0 10,000 to 24,999 1,764 1,111,572 3,771 94,468 905,363 107,969 0.3 8.5 81.4 9.7 5,000 to 9,999 1,483 403,698 2,398 38,761 316,692 45,846 0.6 9.6 78.4 11.4 2,500 to 4,999 1,340 166,516 964 11,853 127,775 25,924 0.6 7.1 76.7 15.6 1,000 to 2,499 1,524 93,313 1,110 5,189 68,887 18,126 1.2 5.6 73.8 19.4 Less than 1,000 1,072 27,390 453 2,505 19,446 4,987 1.7 9.1 71.0 18.2
SOURCE: Institute of Museum and Library Services, Survey of Public Libraries in the United States, Fiscal Year 2007.
Table 16A. Total operating revenue of public libraries and percentage distribution of revenue in the 50 states and the District of Columbia, by source of revenue and population
1This includes federal funds, such as Library Services and Technology Act (LSTA) funds, that are distributed to public libraries through state library agencies. Other federal funds that are used by state libraryagencies or library cooperatives to provide services that benefit local public libraries are not included in the table because they are not received as income by public libraries.2This includes monetary gifts and donations received in the current year, interest, library fines, fees for library services, or grants.NOTE: Detail may not sum to totals because of rounding. For item(s) with response rates below 100 percent, data for nonrespondents were imputed and are included in the table. The response rate is included intable 16.
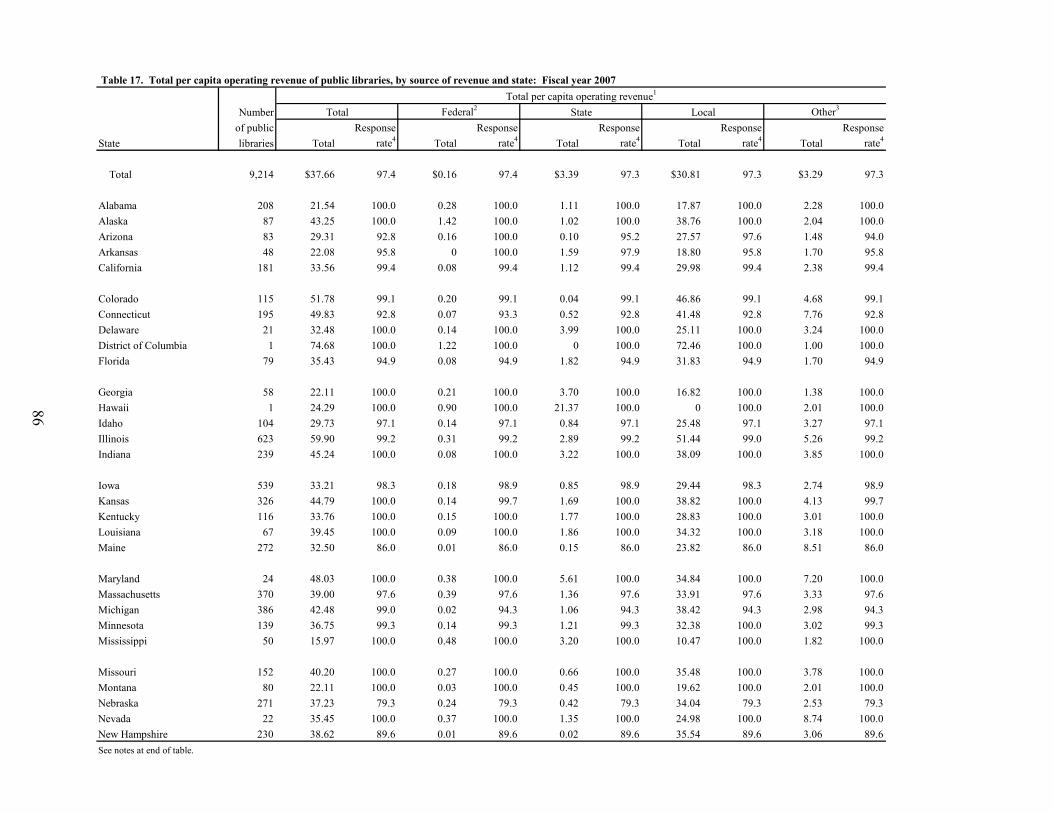
86
Total per capita operating revenue1
Number Total Federal2 State Local Other3
of public Response Response Response Response ResponseState libraries Total rate4 Total rate4 Total rate4 Total rate4 Total rate4
Total 9,214 $37.66 97.4 $0.16 97.4 $3.39 97.3 $30.81 97.3 $3.29 97.3
Alabama 208 21.54 100.0 0.28 100.0 1.11 100.0 17.87 100.0 2.28 100.0Alaska 87 43.25 100.0 1.42 100.0 1.02 100.0 38.76 100.0 2.04 100.0Arizona 83 29.31 92.8 0.16 100.0 0.10 95.2 27.57 97.6 1.48 94.0Arkansas 48 22.08 95.8 0 100.0 1.59 97.9 18.80 95.8 1.70 95.8California 181 33.56 99.4 0.08 99.4 1.12 99.4 29.98 99.4 2.38 99.4
Colorado 115 51.78 99.1 0.20 99.1 0.04 99.1 46.86 99.1 4.68 99.1Connecticut 195 49.83 92.8 0.07 93.3 0.52 92.8 41.48 92.8 7.76 92.8Delaware 21 32.48 100.0 0.14 100.0 3.99 100.0 25.11 100.0 3.24 100.0District of Columbia 1 74.68 100.0 1.22 100.0 0 100.0 72.46 100.0 1.00 100.0Florida 79 35.43 94.9 0.08 94.9 1.82 94.9 31.83 94.9 1.70 94.9
Georgia 58 22.11 100.0 0.21 100.0 3.70 100.0 16.82 100.0 1.38 100.0Hawaii 1 24.29 100.0 0.90 100.0 21.37 100.0 0 100.0 2.01 100.0Idaho 104 29.73 97.1 0.14 97.1 0.84 97.1 25.48 97.1 3.27 97.1Illinois 623 59.90 99.2 0.31 99.2 2.89 99.2 51.44 99.0 5.26 99.2Indiana 239 45.24 100.0 0.08 100.0 3.22 100.0 38.09 100.0 3.85 100.0
Iowa 539 33.21 98.3 0.18 98.9 0.85 98.9 29.44 98.3 2.74 98.9Kansas 326 44.79 100.0 0.14 99.7 1.69 100.0 38.82 100.0 4.13 99.7Kentucky 116 33.76 100.0 0.15 100.0 1.77 100.0 28.83 100.0 3.01 100.0Louisiana 67 39.45 100.0 0.09 100.0 1.86 100.0 34.32 100.0 3.18 100.0Maine 272 32.50 86.0 0.01 86.0 0.15 86.0 23.82 86.0 8.51 86.0
Maryland 24 48.03 100.0 0.38 100.0 5.61 100.0 34.84 100.0 7.20 100.0Massachusetts 370 39.00 97.6 0.39 97.6 1.36 97.6 33.91 97.6 3.33 97.6Michigan 386 42.48 99.0 0.02 94.3 1.06 94.3 38.42 94.3 2.98 94.3Minnesota 139 36.75 99.3 0.14 99.3 1.21 99.3 32.38 100.0 3.02 99.3Mississippi 50 15.97 100.0 0.48 100.0 3.20 100.0 10.47 100.0 1.82 100.0
Missouri 152 40.20 100.0 0.27 100.0 0.66 100.0 35.48 100.0 3.78 100.0Montana 80 22.11 100.0 0.03 100.0 0.45 100.0 19.62 100.0 2.01 100.0Nebraska 271 37.23 79.3 0.24 79.3 0.42 79.3 34.04 79.3 2.53 79.3Nevada 22 35.45 100.0 0.37 100.0 1.35 100.0 24.98 100.0 8.74 100.0New Hampshire 230 38.62 89.6 0.01 89.6 0.02 89.6 35.54 89.6 3.06 89.6See notes at end of table.
Table 17. Total per capita operating revenue of public libraries, by source of revenue and state: Fiscal year 2007
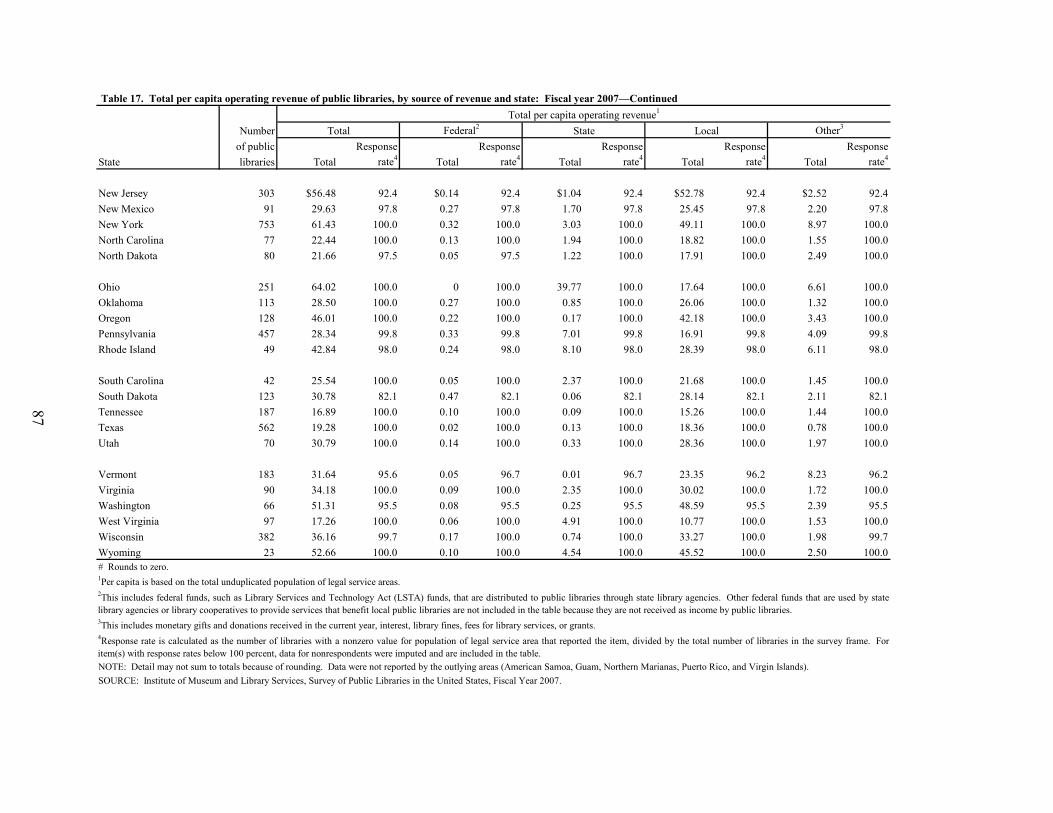
87
Table 17. Total per capita operating revenue of public libraries, by source of revenue and state: Fiscal year 2007—Continued
Total per capita operating revenue1
Number Total Federal2 State Local Other3
of public Response Response Response Response ResponseState libraries Total rate4 Total rate4 Total rate4 Total rate4 Total rate4
New Jersey 303 $56.48 92.4 $0.14 92.4 $1.04 92.4 $52.78 92.4 $2.52 92.4New Mexico 91 29.63 97.8 0.27 97.8 1.70 97.8 25.45 97.8 2.20 97.8New York 753 61.43 100.0 0.32 100.0 3.03 100.0 49.11 100.0 8.97 100.0North Carolina 77 22.44 100.0 0.13 100.0 1.94 100.0 18.82 100.0 1.55 100.0North Dakota 80 21.66 97.5 0.05 97.5 1.22 100.0 17.91 100.0 2.49 100.0
Ohio 251 64.02 100.0 0 100.0 39.77 100.0 17.64 100.0 6.61 100.0Oklahoma 113 28.50 100.0 0.27 100.0 0.85 100.0 26.06 100.0 1.32 100.0Oregon 128 46.01 100.0 0.22 100.0 0.17 100.0 42.18 100.0 3.43 100.0Pennsylvania 457 28.34 99.8 0.33 99.8 7.01 99.8 16.91 99.8 4.09 99.8Rhode Island 49 42.84 98.0 0.24 98.0 8.10 98.0 28.39 98.0 6.11 98.0
South Carolina 42 25.54 100.0 0.05 100.0 2.37 100.0 21.68 100.0 1.45 100.0South Dakota 123 30.78 82.1 0.47 82.1 0.06 82.1 28.14 82.1 2.11 82.1Tennessee 187 16.89 100.0 0.10 100.0 0.09 100.0 15.26 100.0 1.44 100.0Texas 562 19.28 100.0 0.02 100.0 0.13 100.0 18.36 100.0 0.78 100.0Utah 70 30.79 100.0 0.14 100.0 0.33 100.0 28.36 100.0 1.97 100.0
Vermont 183 31.64 95.6 0.05 96.7 0.01 96.7 23.35 96.2 8.23 96.2Virginia 90 34.18 100.0 0.09 100.0 2.35 100.0 30.02 100.0 1.72 100.0Washington 66 51.31 95.5 0.08 95.5 0.25 95.5 48.59 95.5 2.39 95.5West Virginia 97 17.26 100.0 0.06 100.0 4.91 100.0 10.77 100.0 1.53 100.0Wisconsin 382 36.16 99.7 0.17 100.0 0.74 100.0 33.27 100.0 1.98 99.7Wyoming 23 52.66 100.0 0.10 100.0 4.54 100.0 45.52 100.0 2.50 100.0
NOTE: Detail may not sum to totals because of rounding. Data were not reported by the outlying areas (American Samoa, Guam, Northern Marianas, Puerto Rico, and Virgin Islands).SOURCE: Institute of Museum and Library Services, Survey of Public Libraries in the United States, Fiscal Year 2007.
# Rounds to zero.1Per capita is based on the total unduplicated population of legal service areas.
3This includes monetary gifts and donations received in the current year, interest, library fines, fees for library services, or grants.
2This includes federal funds, such as Library Services and Technology Act (LSTA) funds, that are distributed to public libraries through state library agencies. Other federal funds that are used by statelibrary agencies or library cooperatives to provide services that benefit local public libraries are not included in the table because they are not received as income by public libraries.
4Response rate is calculated as the number of libraries with a nonzero value for population of legal service area that reported the item, divided by the total number of libraries in the survey frame. Foritem(s) with response rates below 100 percent, data for nonrespondents were imputed and are included in the table.

88
(Page is intentionally blank.)
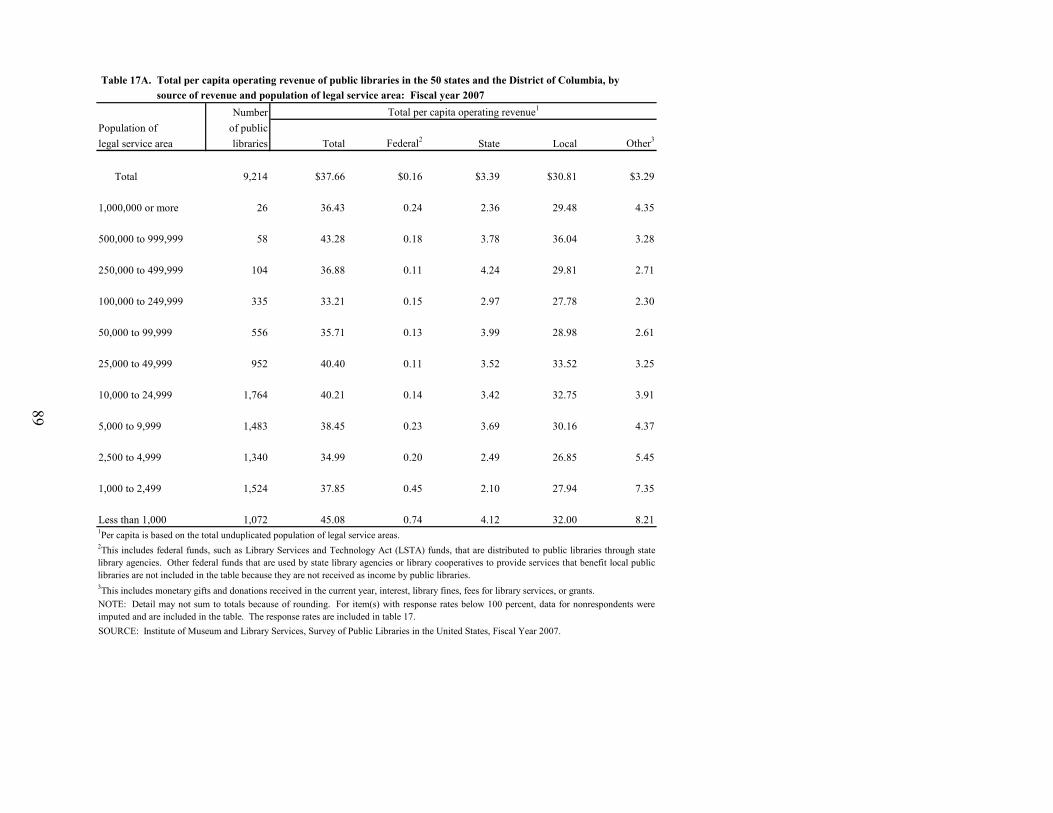
89
Table 17A. source of revenue and population of legal service area: Fiscal year 2007Number Total per capita operating revenue1
Population of of publiclegal service area libraries Total Federal2 State Local Other3
Total 9,214 $37.66 $0.16 $3.39 $30.81 $3.29
1,000,000 or more 26 36.43 0.24 2.36 29.48 4.35 500,000 to 999,999 58 43.28 0.18 3.78 36.04 3.28 250,000 to 499,999 104 36.88 0.11 4.24 29.81 2.71 100,000 to 249,999 335 33.21 0.15 2.97 27.78 2.30 50,000 to 99,999 556 35.71 0.13 3.99 28.98 2.61 25,000 to 49,999 952 40.40 0.11 3.52 33.52 3.25 10,000 to 24,999 1,764 40.21 0.14 3.42 32.75 3.91 5,000 to 9,999 1,483 38.45 0.23 3.69 30.16 4.37 2,500 to 4,999 1,340 34.99 0.20 2.49 26.85 5.45 1,000 to 2,499 1,524 37.85 0.45 2.10 27.94 7.35 Less than 1,000 1,072 45.08 0.74 4.12 32.00 8.21
NOTE: Detail may not sum to totals because of rounding. For item(s) with response rates below 100 percent, data for nonrespondents wereimputed and are included in the table. The response rates are included in table 17.SOURCE: Institute of Museum and Library Services, Survey of Public Libraries in the United States, Fiscal Year 2007.
Table 17A. Total per capita operating revenue of public libraries in the 50 states and the District of Columbia, by
1Per capita is based on the total unduplicated population of legal service areas. 2This includes federal funds, such as Library Services and Technology Act (LSTA) funds, that are distributed to public libraries through statelibrary agencies. Other federal funds that are used by state library agencies or library cooperatives to provide services that benefit local publiclibraries are not included in the table because they are not received as income by public libraries.3This includes monetary gifts and donations received in the current year, interest, library fines, fees for library services, or grants.
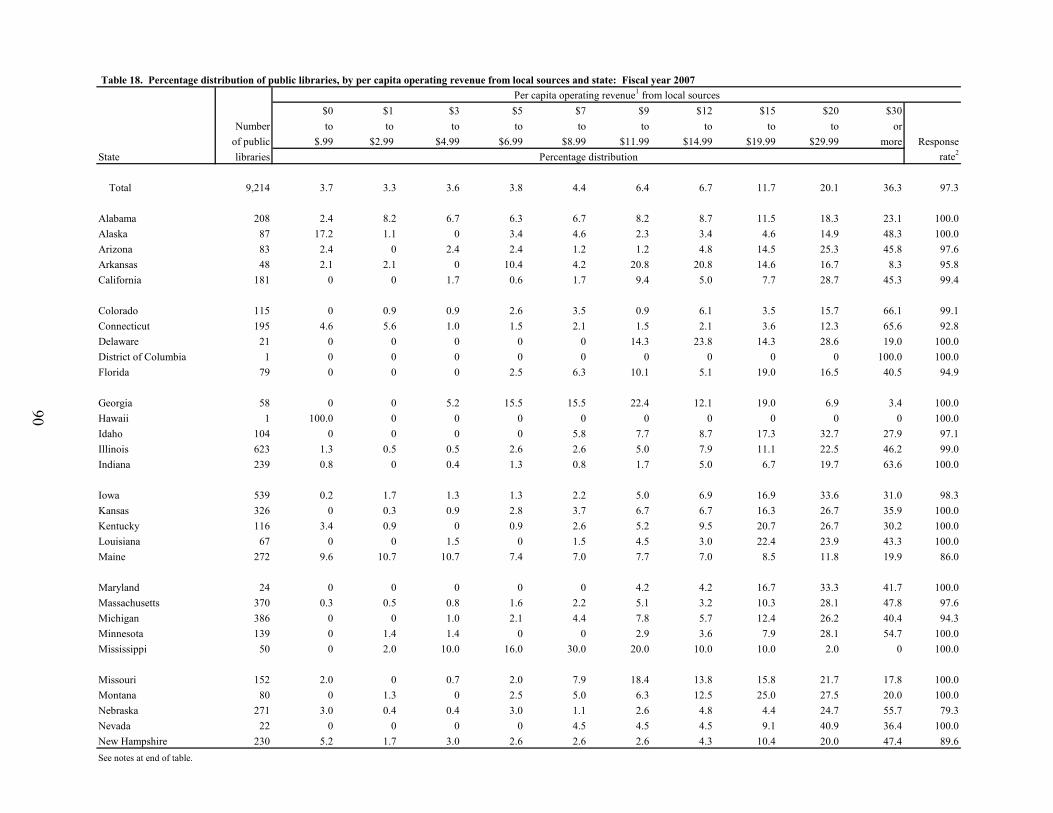
90
Per capita operating revenue1 from local sources$0 $1 $3 $5 $7 $9 $12 $15 $20 $30
Number to to to to to to to to to orof public $.99 $2.99 $4.99 $6.99 $8.99 $11.99 $14.99 $19.99 $29.99 more Response
State libraries Percentage distribution rate2
Total 9,214 3.7 3.3 3.6 3.8 4.4 6.4 6.7 11.7 20.1 36.3 97.3
Alabama 208 2.4 8.2 6.7 6.3 6.7 8.2 8.7 11.5 18.3 23.1 100.0Alaska 87 17.2 1.1 0 3.4 4.6 2.3 3.4 4.6 14.9 48.3 100.0Arizona 83 2.4 0 2.4 2.4 1.2 1.2 4.8 14.5 25.3 45.8 97.6Arkansas 48 2.1 2.1 0 10.4 4.2 20.8 20.8 14.6 16.7 8.3 95.8California 181 0 0 1.7 0.6 1.7 9.4 5.0 7.7 28.7 45.3 99.4
Colorado 115 0 0.9 0.9 2.6 3.5 0.9 6.1 3.5 15.7 66.1 99.1Connecticut 195 4.6 5.6 1.0 1.5 2.1 1.5 2.1 3.6 12.3 65.6 92.8Delaware 21 0 0 0 0 0 14.3 23.8 14.3 28.6 19.0 100.0District of Columbia 1 0 0 0 0 0 0 0 0 0 100.0 100.0Florida 79 0 0 0 2.5 6.3 10.1 5.1 19.0 16.5 40.5 94.9
Georgia 58 0 0 5.2 15.5 15.5 22.4 12.1 19.0 6.9 3.4 100.0Hawaii 1 100.0 0 0 0 0 0 0 0 0 0 100.0Idaho 104 0 0 0 0 5.8 7.7 8.7 17.3 32.7 27.9 97.1Illinois 623 1.3 0.5 0.5 2.6 2.6 5.0 7.9 11.1 22.5 46.2 99.0Indiana 239 0.8 0 0.4 1.3 0.8 1.7 5.0 6.7 19.7 63.6 100.0
Iowa 539 0.2 1.7 1.3 1.3 2.2 5.0 6.9 16.9 33.6 31.0 98.3Kansas 326 0 0.3 0.9 2.8 3.7 6.7 6.7 16.3 26.7 35.9 100.0Kentucky 116 3.4 0.9 0 0.9 2.6 5.2 9.5 20.7 26.7 30.2 100.0Louisiana 67 0 0 1.5 0 1.5 4.5 3.0 22.4 23.9 43.3 100.0Maine 272 9.6 10.7 10.7 7.4 7.0 7.7 7.0 8.5 11.8 19.9 86.0
Maryland 24 0 0 0 0 0 4.2 4.2 16.7 33.3 41.7 100.0Massachusetts 370 0.3 0.5 0.8 1.6 2.2 5.1 3.2 10.3 28.1 47.8 97.6Michigan 386 0 0 1.0 2.1 4.4 7.8 5.7 12.4 26.2 40.4 94.3Minnesota 139 0 1.4 1.4 0 0 2.9 3.6 7.9 28.1 54.7 100.0Mississippi 50 0 2.0 10.0 16.0 30.0 20.0 10.0 10.0 2.0 0 100.0
Missouri 152 2.0 0 0.7 2.0 7.9 18.4 13.8 15.8 21.7 17.8 100.0Montana 80 0 1.3 0 2.5 5.0 6.3 12.5 25.0 27.5 20.0 100.0Nebraska 271 3.0 0.4 0.4 3.0 1.1 2.6 4.8 4.4 24.7 55.7 79.3Nevada 22 0 0 0 0 4.5 4.5 4.5 9.1 40.9 36.4 100.0New Hampshire 230 5.2 1.7 3.0 2.6 2.6 2.6 4.3 10.4 20.0 47.4 89.6See notes at end of table.
Table 18. Percentage distribution of public libraries, by per capita operating revenue from local sources and state: Fiscal year 2007
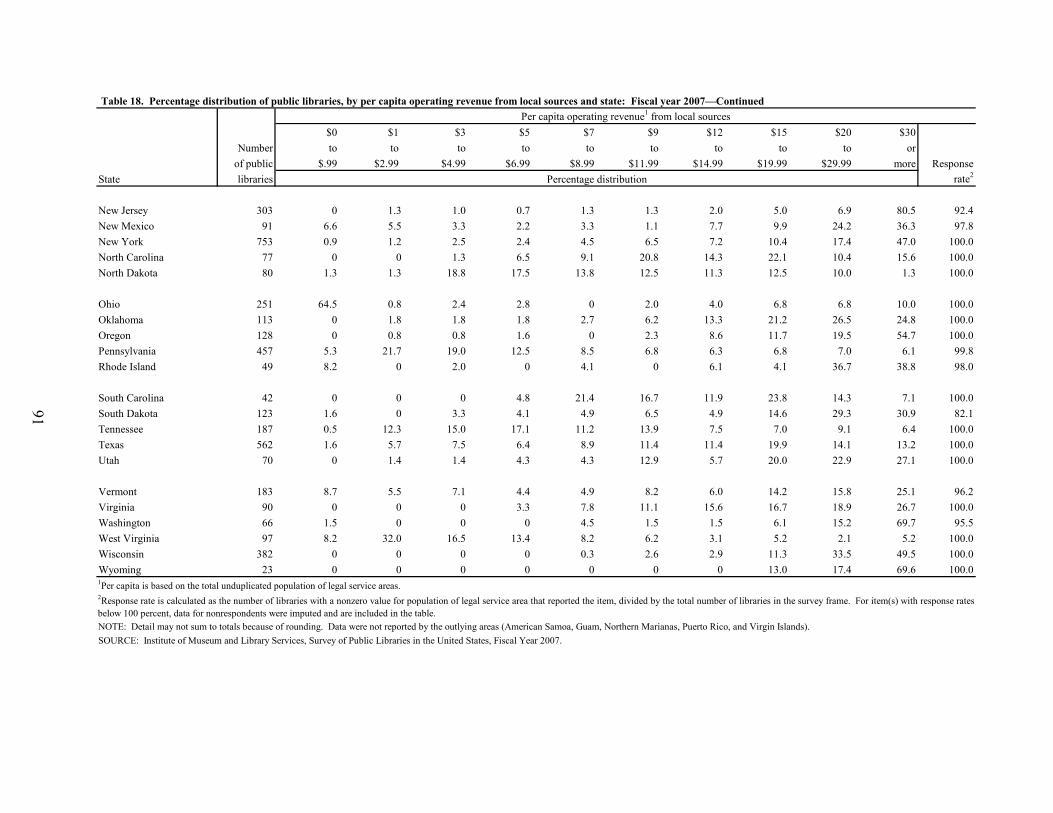
91
Per capita operating revenue1 from local sources$0 $1 $3 $5 $7 $9 $12 $15 $20 $30
Number to to to to to to to to to orof public $.99 $2.99 $4.99 $6.99 $8.99 $11.99 $14.99 $19.99 $29.99 more Response
State libraries Percentage distribution rate2
New Jersey 303 0 1.3 1.0 0.7 1.3 1.3 2.0 5.0 6.9 80.5 92.4New Mexico 91 6.6 5.5 3.3 2.2 3.3 1.1 7.7 9.9 24.2 36.3 97.8New York 753 0.9 1.2 2.5 2.4 4.5 6.5 7.2 10.4 17.4 47.0 100.0North Carolina 77 0 0 1.3 6.5 9.1 20.8 14.3 22.1 10.4 15.6 100.0North Dakota 80 1.3 1.3 18.8 17.5 13.8 12.5 11.3 12.5 10.0 1.3 100.0
Ohio 251 64.5 0.8 2.4 2.8 0 2.0 4.0 6.8 6.8 10.0 100.0Oklahoma 113 0 1.8 1.8 1.8 2.7 6.2 13.3 21.2 26.5 24.8 100.0Oregon 128 0 0.8 0.8 1.6 0 2.3 8.6 11.7 19.5 54.7 100.0Pennsylvania 457 5.3 21.7 19.0 12.5 8.5 6.8 6.3 6.8 7.0 6.1 99.8Rhode Island 49 8.2 0 2.0 0 4.1 0 6.1 4.1 36.7 38.8 98.0
South Carolina 42 0 0 0 4.8 21.4 16.7 11.9 23.8 14.3 7.1 100.0South Dakota 123 1.6 0 3.3 4.1 4.9 6.5 4.9 14.6 29.3 30.9 82.1Tennessee 187 0.5 12.3 15.0 17.1 11.2 13.9 7.5 7.0 9.1 6.4 100.0Texas 562 1.6 5.7 7.5 6.4 8.9 11.4 11.4 19.9 14.1 13.2 100.0Utah 70 0 1.4 1.4 4.3 4.3 12.9 5.7 20.0 22.9 27.1 100.0
Vermont 183 8.7 5.5 7.1 4.4 4.9 8.2 6.0 14.2 15.8 25.1 96.2Virginia 90 0 0 0 3.3 7.8 11.1 15.6 16.7 18.9 26.7 100.0Washington 66 1.5 0 0 0 4.5 1.5 1.5 6.1 15.2 69.7 95.5West Virginia 97 8.2 32.0 16.5 13.4 8.2 6.2 3.1 5.2 2.1 5.2 100.0Wisconsin 382 0 0 0 0 0.3 2.6 2.9 11.3 33.5 49.5 100.0Wyoming 23 0 0 0 0 0 0 0 13.0 17.4 69.6 100.0
SOURCE: Institute of Museum and Library Services, Survey of Public Libraries in the United States, Fiscal Year 2007.NOTE: Detail may not sum to totals because of rounding. Data were not reported by the outlying areas (American Samoa, Guam, Northern Marianas, Puerto Rico, and Virgin Islands).
Table 18. Percentage distribution of public libraries, by per capita operating revenue from local sources and state: Fiscal year 2007—Continued
1Per capita is based on the total unduplicated population of legal service areas. 2Response rate is calculated as the number of libraries with a nonzero value for population of legal service area that reported the item, divided by the total number of libraries in the survey frame. For item(s) with response ratesbelow 100 percent, data for nonrespondents were imputed and are included in the table.

92
(Page is intentionally blank.)
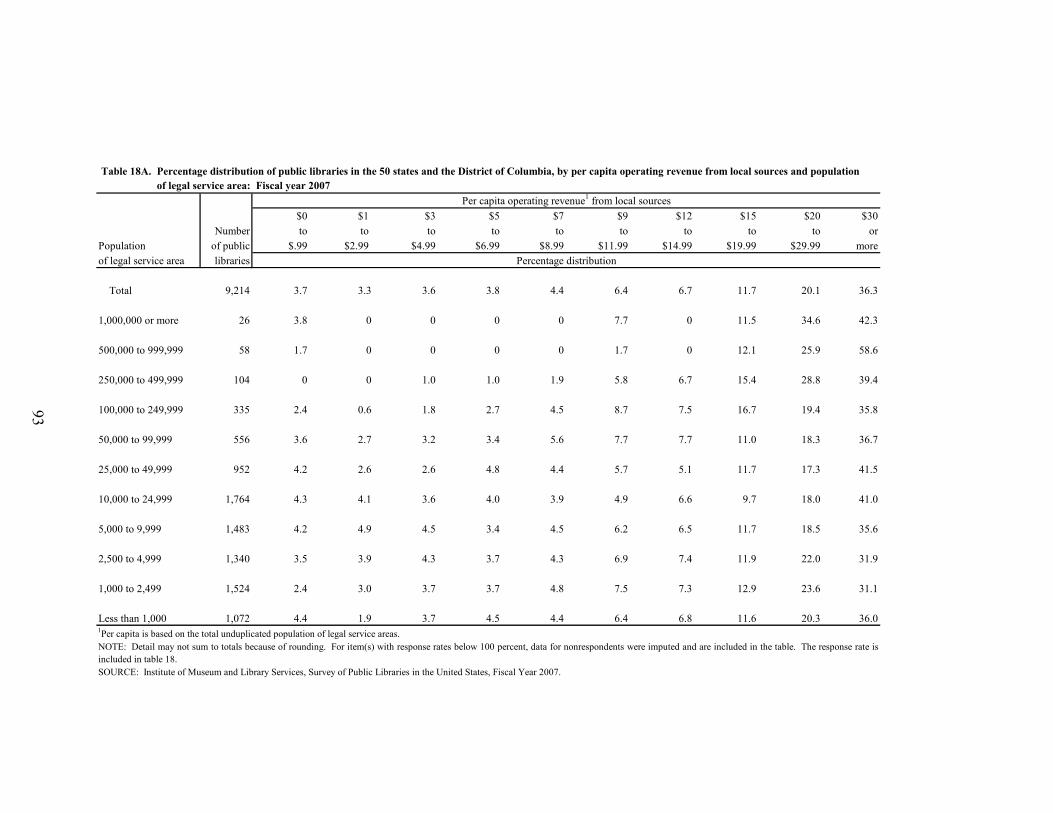
93
Table 18A. of legal service area: Fiscal year 2007Per capita operating revenue1 from local sources
$0 $1 $3 $5 $7 $9 $12 $15 $20 $30Number to to to to to to to to to or
Population of public $.99 $2.99 $4.99 $6.99 $8.99 $11.99 $14.99 $19.99 $29.99 moreof legal service area libraries Percentage distribution
Total 9,214 3.7 3.3 3.6 3.8 4.4 6.4 6.7 11.7 20.1 36.3 1,000,000 or more 26 3.8 0 0 0 0 7.7 0 11.5 34.6 42.3 500,000 to 999,999 58 1.7 0 0 0 0 1.7 0 12.1 25.9 58.6 250,000 to 499,999 104 0 0 1.0 1.0 1.9 5.8 6.7 15.4 28.8 39.4 100,000 to 249,999 335 2.4 0.6 1.8 2.7 4.5 8.7 7.5 16.7 19.4 35.8 50,000 to 99,999 556 3.6 2.7 3.2 3.4 5.6 7.7 7.7 11.0 18.3 36.7 25,000 to 49,999 952 4.2 2.6 2.6 4.8 4.4 5.7 5.1 11.7 17.3 41.5 10,000 to 24,999 1,764 4.3 4.1 3.6 4.0 3.9 4.9 6.6 9.7 18.0 41.0 5,000 to 9,999 1,483 4.2 4.9 4.5 3.4 4.5 6.2 6.5 11.7 18.5 35.6 2,500 to 4,999 1,340 3.5 3.9 4.3 3.7 4.3 6.9 7.4 11.9 22.0 31.9 1,000 to 2,499 1,524 2.4 3.0 3.7 3.7 4.8 7.5 7.3 12.9 23.6 31.1 Less than 1,000 1,072 4.4 1.9 3.7 4.5 4.4 6.4 6.8 11.6 20.3 36.0
NOTE: Detail may not sum to totals because of rounding. For item(s) with response rates below 100 percent, data for nonrespondents were imputed and are included in the table. The response rate isincluded in table 18.SOURCE: Institute of Museum and Library Services, Survey of Public Libraries in the United States, Fiscal Year 2007.
Table 18A. Percentage distribution of public libraries in the 50 states and the District of Columbia, by per capita operating revenue from local sources and population
1Per capita is based on the total unduplicated population of legal service areas.
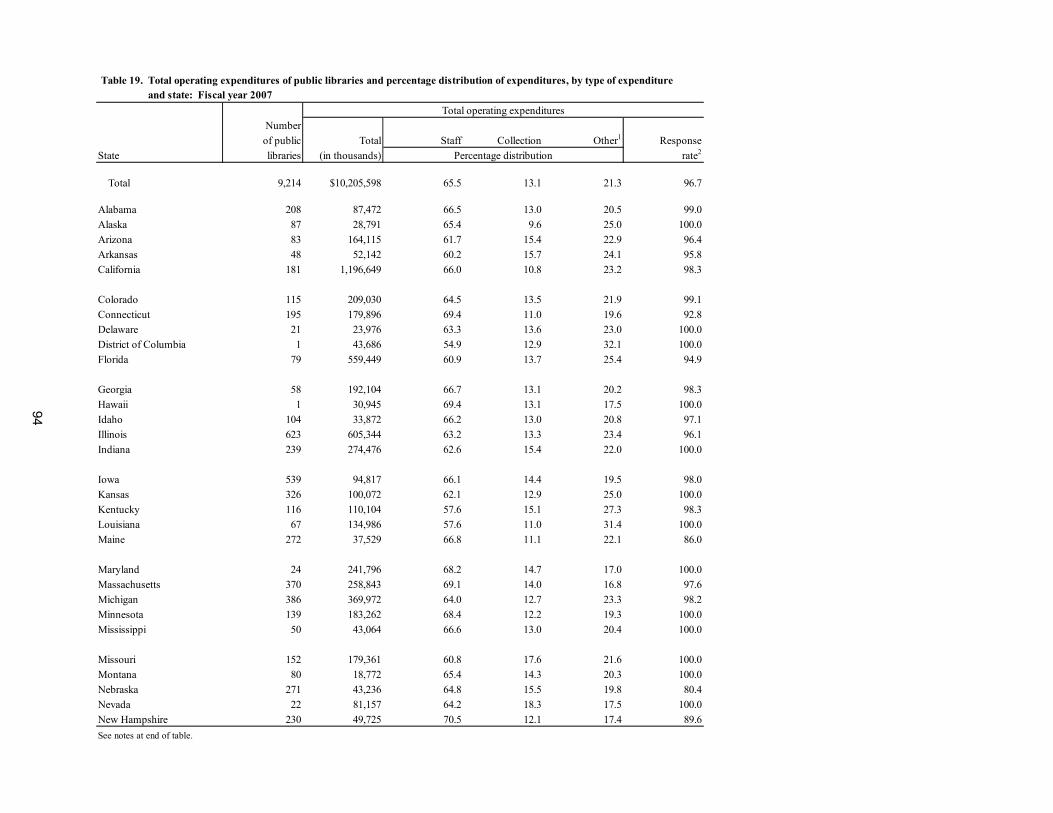
Table 19. Total operating expenditures of public libraries and percentage distribution of expenditures, by type of expenditure Table 19. and state: Fiscal year 2007
Total operating expendituresNumber
of public Total Staff Collection Other1 ResponseState libraries (in thousands) Percentage distribution rate2
Total 9,214 $10,205,598 65.5 13.1 21.3 96.7
Alabama 208 87,472 66.5 13.0 20.5 99.0Alaska 87 28,791 65.4 9.6 25.0 100.0Arizona 83 164,115 61.7 15.4 22.9 96.4Arkansas 48 52,142 60.2 15.7 24.1 95.8California 181 1,196,649 66.0 10.8 23.2 98.3
Colorado 115 209,030 64.5 13.5 21.9 99.1Connecticut 195 179,896 69.4 11.0 19.6 92.8Delaware 21 23,976 63.3 13.6 23.0 100.0District of Columbia 1 43,686 54.9 12.9 32.1 100.0Florida 79 559,449 60.9 13.7 25.4 94.9
Georgia 58 192,104 66.7 13.1 20.2 98.3Hawaii 1 30,945 69.4 13.1 17.5 100.0Idaho 104 33,872 66.2 13.0 20.8 97.1Illinois 623 605,344 63.2 13.3 23.4 96.1Indiana 239 274,476 62.6 15.4 22.0 100.0
Iowa 539 94,817 66.1 14.4 19.5 98.0Kansas 326 100,072 62.1 12.9 25.0 100.0Kentucky 116 110,104 57.6 15.1 27.3 98.3Louisiana 67 134,986 57.6 11.0 31.4 100.0Maine 272 37,529 66.8 11.1 22.1 86.0
Maryland 24 241,796 68.2 14.7 17.0 100.0Massachusetts 370 258,843 69.1 14.0 16.8 97.6Michigan 386 369,972 64.0 12.7 23.3 98.2Minnesota 139 183,262 68.4 12.2 19.3 100.0Mississippi 50 43,064 66.6 13.0 20.4 100.0
Missouri 152 179,361 60.8 17.6 21.6 100.0Montana 80 18,772 65.4 14.3 20.3 100.0Nebraska 271 43,236 64.8 15.5 19.8 80.4Nevada 22 81,157 64.2 18.3 17.5 100.0New Hampshire 230 49,725 70.5 12.1 17.4 89.6See notes at end of table.
94
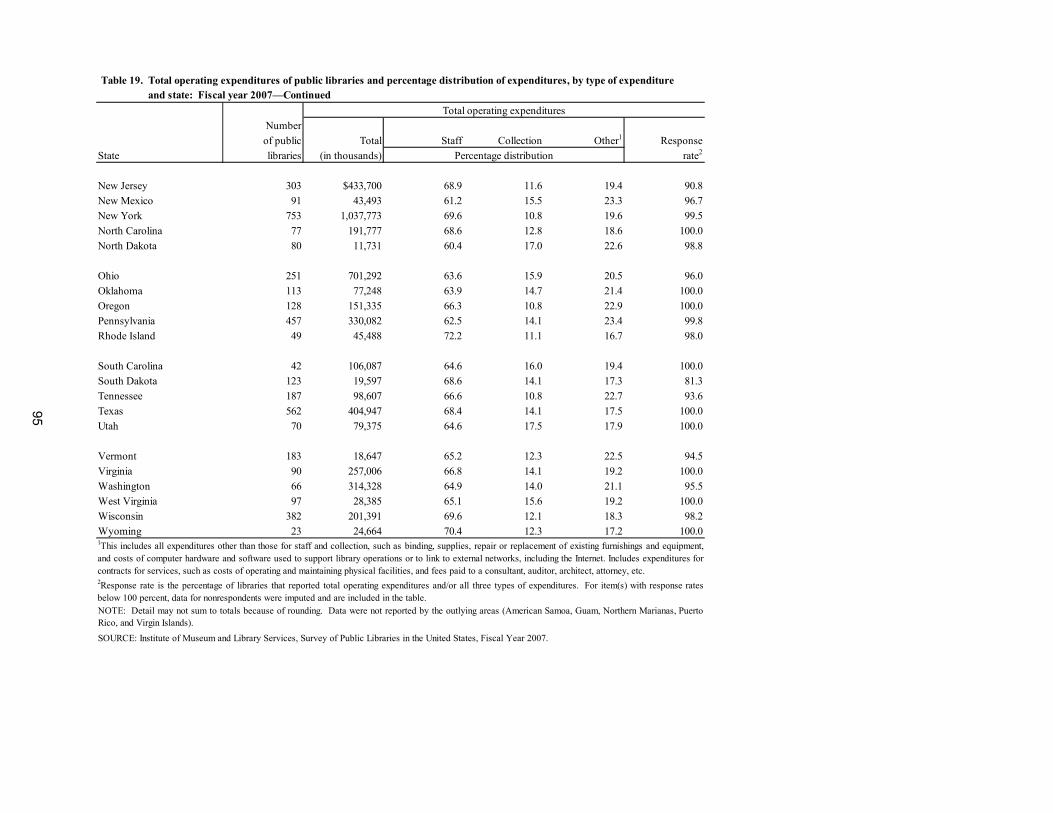
Table 19. and state: Fiscal year 2007—ContinuedTotal operating expenditures
Number of public Total Staff Collection Other1 ResponseState libraries (in thousands) Percentage distribution rate2
New Jersey 303 $433,700 68.9 11.6 19.4 90.8New Mexico 91 43,493 61.2 15.5 23.3 96.7New York 753 1,037,773 69.6 10.8 19.6 99.5North Carolina 77 191,777 68.6 12.8 18.6 100.0North Dakota 80 11,731 60.4 17.0 22.6 98.8
Ohio 251 701,292 63.6 15.9 20.5 96.0Oklahoma 113 77,248 63.9 14.7 21.4 100.0Oregon 128 151,335 66.3 10.8 22.9 100.0Pennsylvania 457 330,082 62.5 14.1 23.4 99.8Rhode Island 49 45,488 72.2 11.1 16.7 98.0
South Carolina 42 106,087 64.6 16.0 19.4 100.0South Dakota 123 19,597 68.6 14.1 17.3 81.3Tennessee 187 98,607 66.6 10.8 22.7 93.6Texas 562 404,947 68.4 14.1 17.5 100.0Utah 70 79,375 64.6 17.5 17.9 100.0
Vermont 183 18,647 65.2 12.3 22.5 94.5Virginia 90 257,006 66.8 14.1 19.2 100.0Washington 66 314,328 64.9 14.0 21.1 95.5West Virginia 97 28,385 65.1 15.6 19.2 100.0Wisconsin 382 201,391 69.6 12.1 18.3 98.2Wyoming 23 24,664 70.4 12.3 17.2 100.0
Table 19. Total operating expenditures of public libraries and percentage distribution of expenditures, by type of expenditure
SOURCE: Institute of Museum and Library Services, Survey of Public Libraries in the United States, Fiscal Year 2007.
1This includes all expenditures other than those for staff and collection, such as binding, supplies, repair or replacement of existing furnishings and equipment,and costs of computer hardware and software used to support library operations or to link to external networks, including the Internet. Includes expenditures forcontracts for services, such as costs of operating and maintaining physical facilities, and fees paid to a consultant, auditor, architect, attorney, etc.
NOTE: Detail may not sum to totals because of rounding. Data were not reported by the outlying areas (American Samoa, Guam, Northern Marianas, PuertoRico, and Virgin Islands).
2Response rate is the percentage of libraries that reported total operating expenditures and/or all three types of expenditures. For item(s) with response ratesbelow 100 percent, data for nonrespondents were imputed and are included in the table.
95

96
(Page is intentionally blank.)
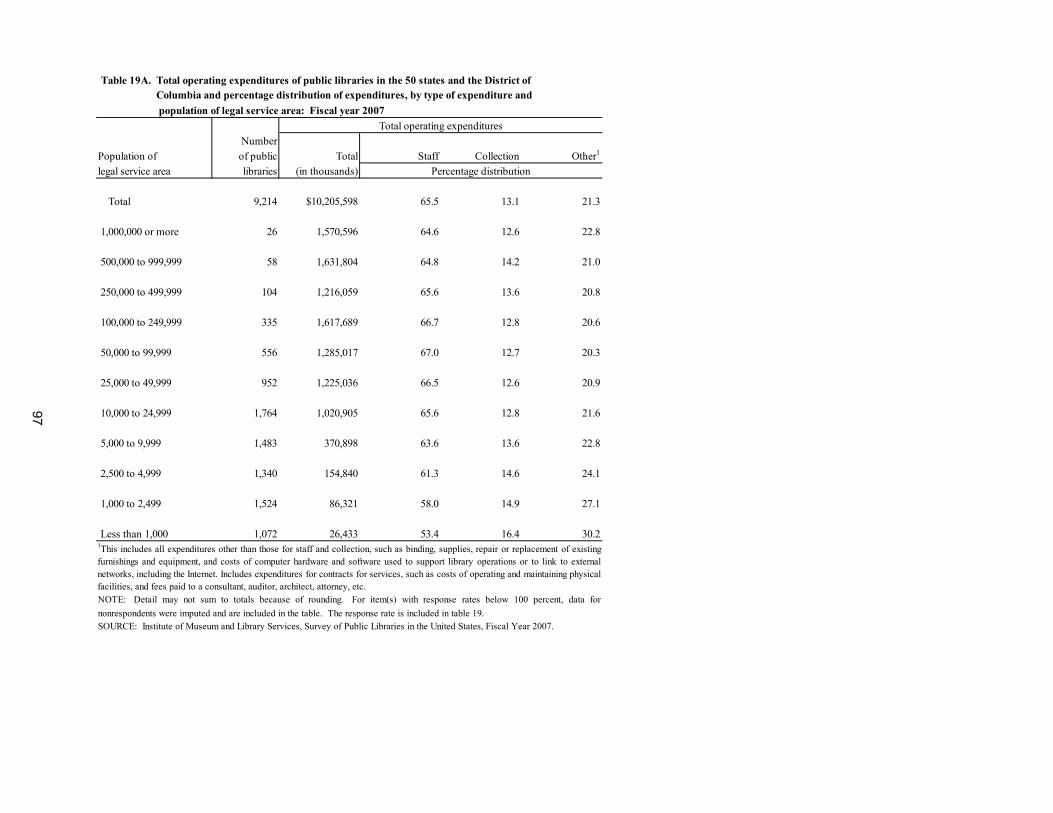
Table 19A. Total operating expenditures of public libraries in the 50 states and the District of Table 19A. Columbia and percentage distribution of expenditures, by type of expenditure and
Total operating expendituresNumber
Population of of public Total Staff Collection Other1
legal service area libraries (in thousands) Percentage distribution
Total 9,214 $10,205,598 65.5 13.1 21.3 1,000,000 or more 26 1,570,596 64.6 12.6 22.8 500,000 to 999,999 58 1,631,804 64.8 14.2 21.0 250,000 to 499,999 104 1,216,059 65.6 13.6 20.8 100,000 to 249,999 335 1,617,689 66.7 12.8 20.6 50,000 to 99,999 556 1,285,017 67.0 12.7 20.3 25,000 to 49,999 952 1,225,036 66.5 12.6 20.9 10,000 to 24,999 1,764 1,020,905 65.6 12.8 21.6 5,000 to 9,999 1,483 370,898 63.6 13.6 22.8 2,500 to 4,999 1,340 154,840 61.3 14.6 24.1 1,000 to 2,499 1,524 86,321 58.0 14.9 27.1 Less than 1,000 1,072 26,433 53.4 16.4 30.21This includes all expenditures other than those for staff and collection, such as binding, supplies, repair or replacement of existingfurnishings and equipment, and costs of computer hardware and software used to support library operations or to link to externalnetworks, including the Internet. Includes expenditures for contracts for services, such as costs of operating and maintaining physicalfacilities, and fees paid to a consultant, auditor, architect, attorney, etc.NOTE: Detail may not sum to totals because of rounding. For item(s) with response rates below 100 percent, data fornonrespondents were imputed and are included in the table. The response rate is included in table 19.SOURCE: Institute of Museum and Library Services, Survey of Public Libraries in the United States, Fiscal Year 2007.
Table 19A. population of legal service area: Fiscal year 2007
97
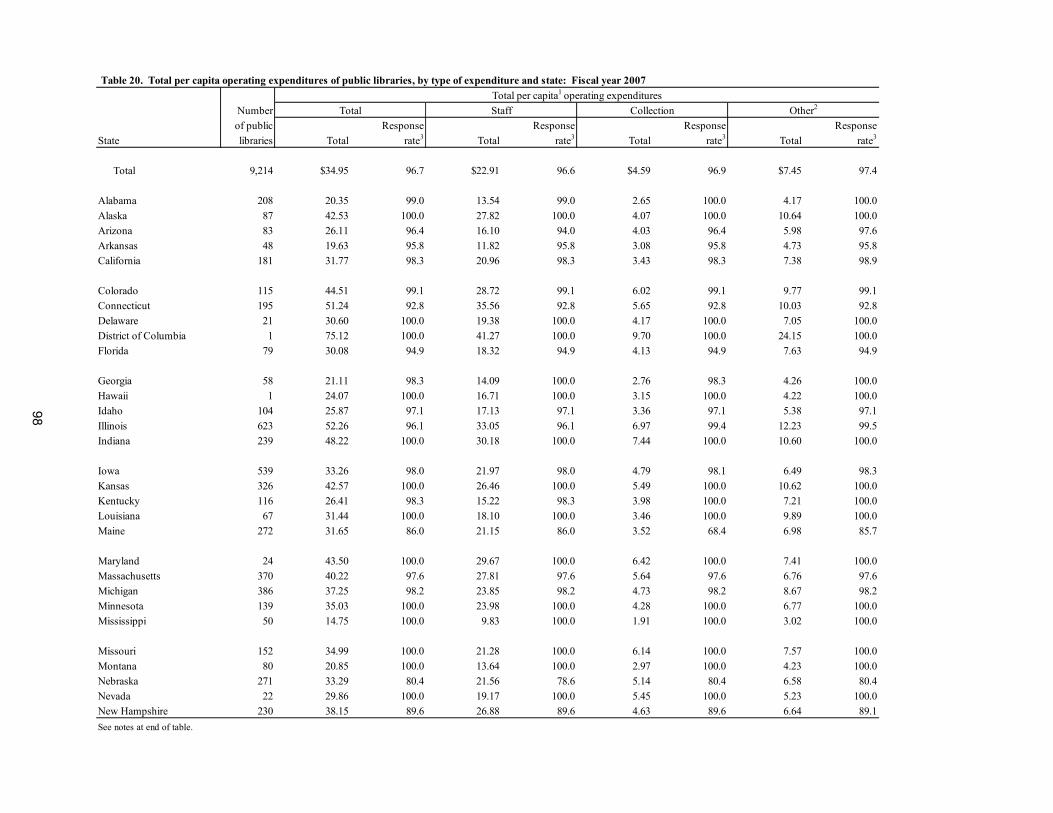
Table 20. Total per capita operating expenditures of public libraries, by type of expenditure and state: Fiscal year 2007Total per capita1 operating expenditures
Number Total Staff Collection Other2
of public Response Response Response ResponseState libraries Total rate3 Total rate3 Total rate3 Total rate3
Total 9,214 $34.95 96.7 $22.91 96.6 $4.59 96.9 $7.45 97.4
Alabama 208 20.35 99.0 13.54 99.0 2.65 100.0 4.17 100.0Alaska 87 42.53 100.0 27.82 100.0 4.07 100.0 10.64 100.0Arizona 83 26.11 96.4 16.10 94.0 4.03 96.4 5.98 97.6Arkansas 48 19.63 95.8 11.82 95.8 3.08 95.8 4.73 95.8California 181 31.77 98.3 20.96 98.3 3.43 98.3 7.38 98.9
Colorado 115 44.51 99.1 28.72 99.1 6.02 99.1 9.77 99.1Connecticut 195 51.24 92.8 35.56 92.8 5.65 92.8 10.03 92.8Delaware 21 30.60 100.0 19.38 100.0 4.17 100.0 7.05 100.0District of Columbia 1 75.12 100.0 41.27 100.0 9.70 100.0 24.15 100.0Florida 79 30.08 94.9 18.32 94.9 4.13 94.9 7.63 94.9
Georgia 58 21.11 98.3 14.09 100.0 2.76 98.3 4.26 100.0Hawaii 1 24.07 100.0 16.71 100.0 3.15 100.0 4.22 100.0Idaho 104 25.87 97.1 17.13 97.1 3.36 97.1 5.38 97.1Illinois 623 52.26 96.1 33.05 96.1 6.97 99.4 12.23 99.5Indiana 239 48.22 100.0 30.18 100.0 7.44 100.0 10.60 100.0
Iowa 539 33.26 98.0 21.97 98.0 4.79 98.1 6.49 98.3Kansas 326 42.57 100.0 26.46 100.0 5.49 100.0 10.62 100.0Kentucky 116 26.41 98.3 15.22 98.3 3.98 100.0 7.21 100.0Louisiana 67 31.44 100.0 18.10 100.0 3.46 100.0 9.89 100.0Maine 272 31.65 86.0 21.15 86.0 3.52 68.4 6.98 85.7
Maryland 24 43.50 100.0 29.67 100.0 6.42 100.0 7.41 100.0Massachusetts 370 40.22 97.6 27.81 97.6 5.64 97.6 6.76 97.6Michigan 386 37.25 98.2 23.85 98.2 4.73 98.2 8.67 98.2Minnesota 139 35.03 100.0 23.98 100.0 4.28 100.0 6.77 100.0Mississippi 50 14.75 100.0 9.83 100.0 1.91 100.0 3.02 100.0
Missouri 152 34.99 100.0 21.28 100.0 6.14 100.0 7.57 100.0Montana 80 20.85 100.0 13.64 100.0 2.97 100.0 4.23 100.0Nebraska 271 33.29 80.4 21.56 78.6 5.14 80.4 6.58 80.4Nevada 22 29.86 100.0 19.17 100.0 5.45 100.0 5.23 100.0New Hampshire 230 38.15 89.6 26.88 89.6 4.63 89.6 6.64 89.1See notes at end of table.
98
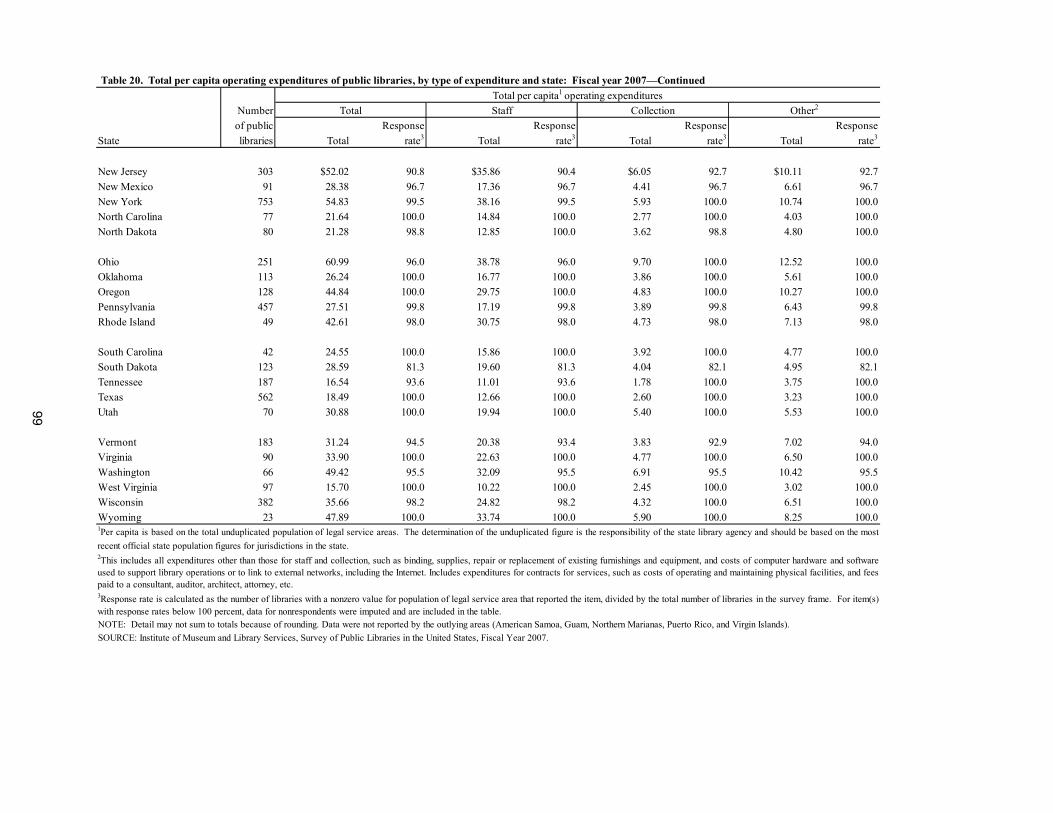
Table 20. Total per capita operating expenditures of public libraries, by type of expenditure and state: Fiscal year 2007—ContinuedTotal per capita1 operating expenditures
Number Total Staff Collection Other2
of public Response Response Response ResponseState libraries Total rate3 Total rate3 Total rate3 Total rate3
New Jersey 303 $52.02 90.8 $35.86 90.4 $6.05 92.7 $10.11 92.7New Mexico 91 28.38 96.7 17.36 96.7 4.41 96.7 6.61 96.7New York 753 54.83 99.5 38.16 99.5 5.93 100.0 10.74 100.0North Carolina 77 21.64 100.0 14.84 100.0 2.77 100.0 4.03 100.0North Dakota 80 21.28 98.8 12.85 100.0 3.62 98.8 4.80 100.0
Ohio 251 60.99 96.0 38.78 96.0 9.70 100.0 12.52 100.0Oklahoma 113 26.24 100.0 16.77 100.0 3.86 100.0 5.61 100.0Oregon 128 44.84 100.0 29.75 100.0 4.83 100.0 10.27 100.0Pennsylvania 457 27.51 99.8 17.19 99.8 3.89 99.8 6.43 99.8Rhode Island 49 42.61 98.0 30.75 98.0 4.73 98.0 7.13 98.0
South Carolina 42 24.55 100.0 15.86 100.0 3.92 100.0 4.77 100.0South Dakota 123 28.59 81.3 19.60 81.3 4.04 82.1 4.95 82.1Tennessee 187 16.54 93.6 11.01 93.6 1.78 100.0 3.75 100.0Texas 562 18.49 100.0 12.66 100.0 2.60 100.0 3.23 100.0Utah 70 30.88 100.0 19.94 100.0 5.40 100.0 5.53 100.0
Vermont 183 31.24 94.5 20.38 93.4 3.83 92.9 7.02 94.0Virginia 90 33.90 100.0 22.63 100.0 4.77 100.0 6.50 100.0Washington 66 49.42 95.5 32.09 95.5 6.91 95.5 10.42 95.5West Virginia 97 15.70 100.0 10.22 100.0 2.45 100.0 3.02 100.0Wisconsin 382 35.66 98.2 24.82 98.2 4.32 100.0 6.51 100.0Wyoming 23 47.89 100.0 33.74 100.0 5.90 100.0 8.25 100.0
NOTE: Detail may not sum to totals because of rounding. Data were not reported by the outlying areas (American Samoa, Guam, Northern Marianas, Puerto Rico, and Virgin Islands).SOURCE: Institute of Museum and Library Services, Survey of Public Libraries in the United States, Fiscal Year 2007.
1Per capita is based on the total unduplicated population of legal service areas. The determination of the unduplicated figure is the responsibility of the state library agency and should be based on the mostrecent official state population figures for jurisdictions in the state. 2This includes all expenditures other than those for staff and collection, such as binding, supplies, repair or replacement of existing furnishings and equipment, and costs of computer hardware and softwareused to support library operations or to link to external networks, including the Internet. Includes expenditures for contracts for services, such as costs of operating and maintaining physical facilities, and feespaid to a consultant, auditor, architect, attorney, etc. 3Response rate is calculated as the number of libraries with a nonzero value for population of legal service area that reported the item, divided by the total number of libraries in the survey frame. For item(s)with response rates below 100 percent, data for nonrespondents were imputed and are included in the table.
99

100
(Page is intentionally blank.)
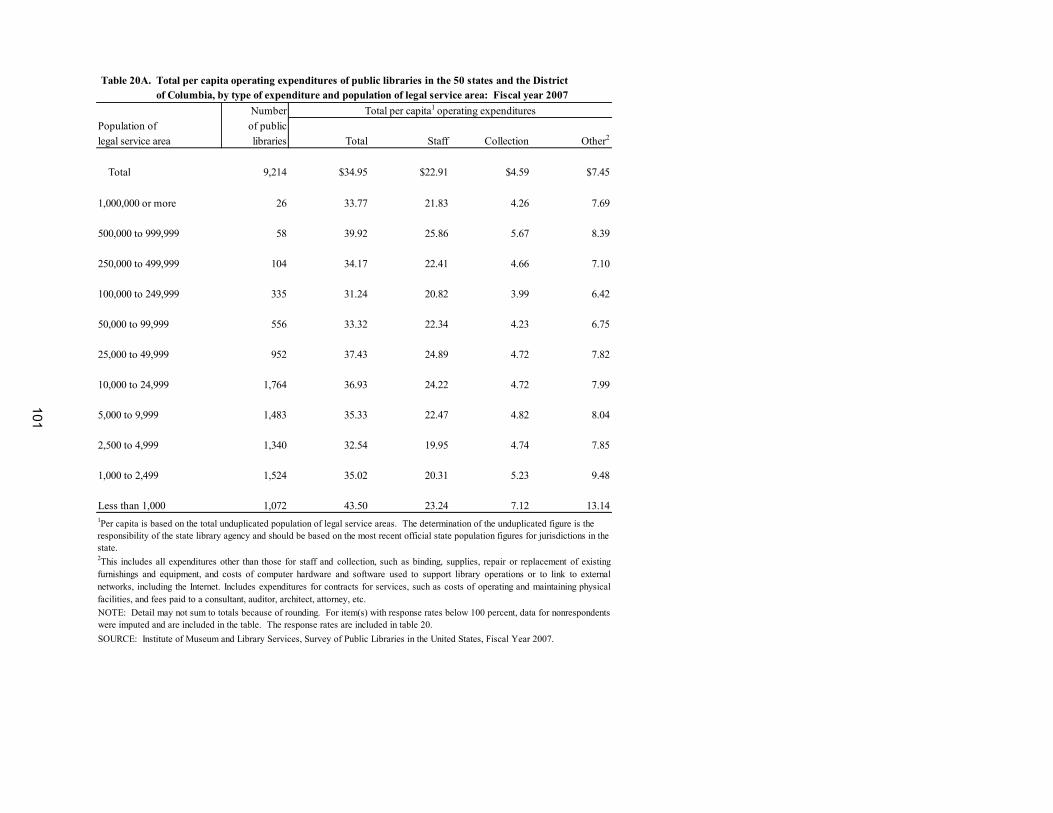
Table 20A. of Columbia, by type of expenditure and population of legal service area: Fiscal year 2007Number Total per capita1 operating expenditures
Population of of publiclegal service area libraries Total Staff Collection Other2
Total 9,214 $34.95 $22.91 $4.59 $7.45
1,000,000 or more 26 33.77 21.83 4.26 7.69 500,000 to 999,999 58 39.92 25.86 5.67 8.39 250,000 to 499,999 104 34.17 22.41 4.66 7.10 100,000 to 249,999 335 31.24 20.82 3.99 6.42 50,000 to 99,999 556 33.32 22.34 4.23 6.75 25,000 to 49,999 952 37.43 24.89 4.72 7.82 10,000 to 24,999 1,764 36.93 24.22 4.72 7.99 5,000 to 9,999 1,483 35.33 22.47 4.82 8.04 2,500 to 4,999 1,340 32.54 19.95 4.74 7.85 1,000 to 2,499 1,524 35.02 20.31 5.23 9.48 Less than 1,000 1,072 43.50 23.24 7.12 13.14
Table 20A. Total per capita operating expenditures of public libraries in the 50 states and the District
2This includes all expenditures other than those for staff and collection, such as binding, supplies, repair or replacement of existingfurnishings and equipment, and costs of computer hardware and software used to support library operations or to link to externalnetworks, including the Internet. Includes expenditures for contracts for services, such as costs of operating and maintaining physicalfacilities, and fees paid to a consultant, auditor, architect, attorney, etc.NOTE: Detail may not sum to totals because of rounding. For item(s) with response rates below 100 percent, data for nonrespondents were imputed and are included in the table. The response rates are included in table 20.SOURCE: Institute of Museum and Library Services, Survey of Public Libraries in the United States, Fiscal Year 2007.
1Per capita is based on the total unduplicated population of legal service areas. The determination of the unduplicated figure is the responsibility of the state library agency and should be based on the most recent official state population figures for jurisdictions in the state.
101
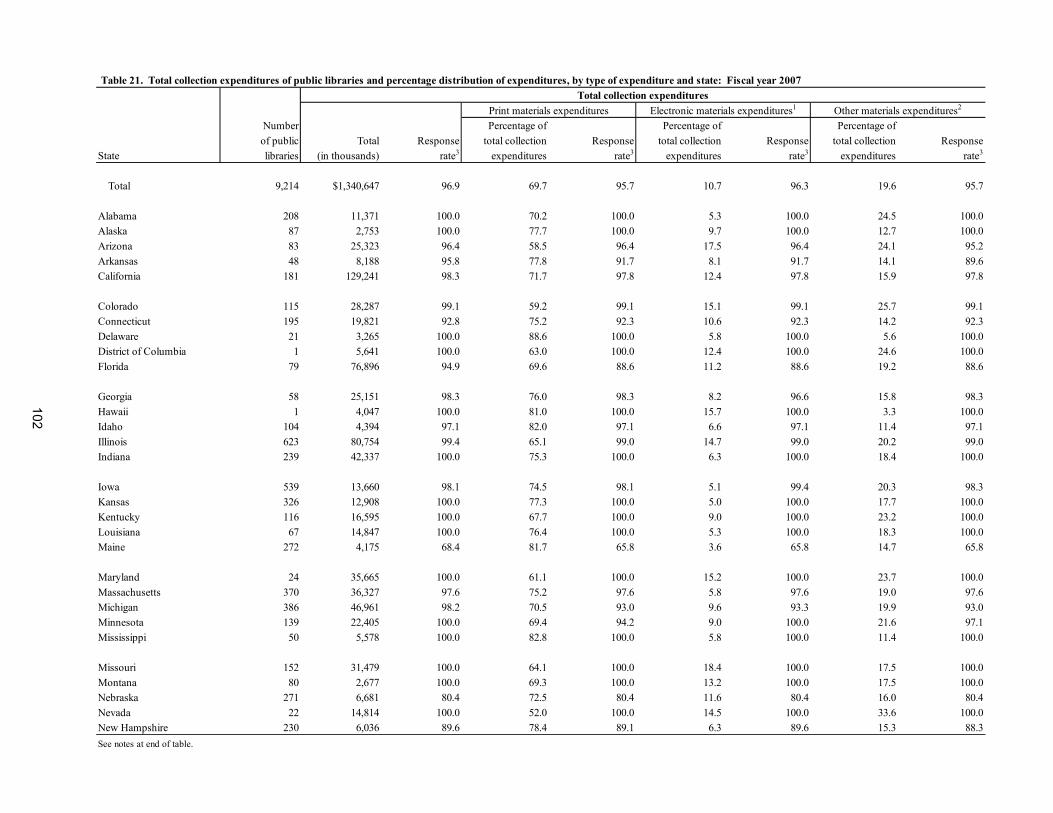
Table 21. Total collection expenditures of public libraries and percentage distribution of expenditures, by type of expenditure and state: Fiscal year 2007
Number Percentage of Percentage of Percentage of of public Total Response total collection Response total collection Response total collection ResponseState libraries (in thousands) rate3 expenditures rate3 expenditures rate3 expenditures rate3
Total 9,214 $1,340,647 96.9 69.7 95.7 10.7 96.3 19.6 95.7
Alabama 208 11,371 100.0 70.2 100.0 5.3 100.0 24.5 100.0Alaska 87 2,753 100.0 77.7 100.0 9.7 100.0 12.7 100.0Arizona 83 25,323 96.4 58.5 96.4 17.5 96.4 24.1 95.2Arkansas 48 8,188 95.8 77.8 91.7 8.1 91.7 14.1 89.6California 181 129,241 98.3 71.7 97.8 12.4 97.8 15.9 97.8
Colorado 115 28,287 99.1 59.2 99.1 15.1 99.1 25.7 99.1Connecticut 195 19,821 92.8 75.2 92.3 10.6 92.3 14.2 92.3Delaware 21 3,265 100.0 88.6 100.0 5.8 100.0 5.6 100.0District of Columbia 1 5,641 100.0 63.0 100.0 12.4 100.0 24.6 100.0Florida 79 76,896 94.9 69.6 88.6 11.2 88.6 19.2 88.6
Georgia 58 25,151 98.3 76.0 98.3 8.2 96.6 15.8 98.3Hawaii 1 4,047 100.0 81.0 100.0 15.7 100.0 3.3 100.0Idaho 104 4,394 97.1 82.0 97.1 6.6 97.1 11.4 97.1Illinois 623 80,754 99.4 65.1 99.0 14.7 99.0 20.2 99.0Indiana 239 42,337 100.0 75.3 100.0 6.3 100.0 18.4 100.0
Iowa 539 13,660 98.1 74.5 98.1 5.1 99.4 20.3 98.3Kansas 326 12,908 100.0 77.3 100.0 5.0 100.0 17.7 100.0Kentucky 116 16,595 100.0 67.7 100.0 9.0 100.0 23.2 100.0Louisiana 67 14,847 100.0 76.4 100.0 5.3 100.0 18.3 100.0Maine 272 4,175 68.4 81.7 65.8 3.6 65.8 14.7 65.8
Maryland 24 35,665 100.0 61.1 100.0 15.2 100.0 23.7 100.0Massachusetts 370 36,327 97.6 75.2 97.6 5.8 97.6 19.0 97.6Michigan 386 46,961 98.2 70.5 93.0 9.6 93.3 19.9 93.0Minnesota 139 22,405 100.0 69.4 94.2 9.0 100.0 21.6 97.1Mississippi 50 5,578 100.0 82.8 100.0 5.8 100.0 11.4 100.0
Missouri 152 31,479 100.0 64.1 100.0 18.4 100.0 17.5 100.0Montana 80 2,677 100.0 69.3 100.0 13.2 100.0 17.5 100.0Nebraska 271 6,681 80.4 72.5 80.4 11.6 80.4 16.0 80.4Nevada 22 14,814 100.0 52.0 100.0 14.5 100.0 33.6 100.0New Hampshire 230 6,036 89.6 78.4 89.1 6.3 89.6 15.3 88.3See notes at end of table.
Total collection expendituresOther materials expenditures2Print materials expenditures Electronic materials expenditures1
102
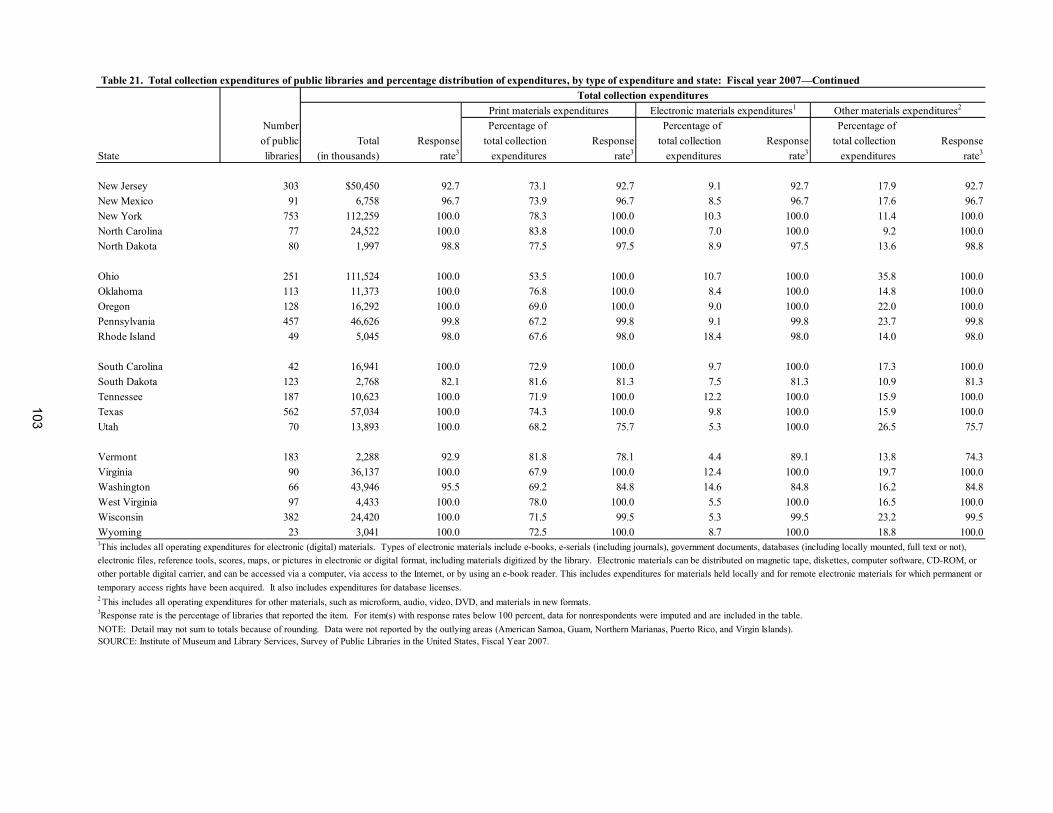
Table 21. Total collection expenditures of public libraries and percentage distribution of expenditures, by type of expenditure and state: Fiscal year 2007—Continued
Number Percentage of Percentage of Percentage of of public Total Response total collection Response total collection Response total collection ResponseState libraries (in thousands) rate3 expenditures rate3 expenditures rate3 expenditures rate3
New Jersey 303 $50,450 92.7 73.1 92.7 9.1 92.7 17.9 92.7New Mexico 91 6,758 96.7 73.9 96.7 8.5 96.7 17.6 96.7New York 753 112,259 100.0 78.3 100.0 10.3 100.0 11.4 100.0North Carolina 77 24,522 100.0 83.8 100.0 7.0 100.0 9.2 100.0North Dakota 80 1,997 98.8 77.5 97.5 8.9 97.5 13.6 98.8
Ohio 251 111,524 100.0 53.5 100.0 10.7 100.0 35.8 100.0Oklahoma 113 11,373 100.0 76.8 100.0 8.4 100.0 14.8 100.0Oregon 128 16,292 100.0 69.0 100.0 9.0 100.0 22.0 100.0Pennsylvania 457 46,626 99.8 67.2 99.8 9.1 99.8 23.7 99.8Rhode Island 49 5,045 98.0 67.6 98.0 18.4 98.0 14.0 98.0
South Carolina 42 16,941 100.0 72.9 100.0 9.7 100.0 17.3 100.0South Dakota 123 2,768 82.1 81.6 81.3 7.5 81.3 10.9 81.3Tennessee 187 10,623 100.0 71.9 100.0 12.2 100.0 15.9 100.0Texas 562 57,034 100.0 74.3 100.0 9.8 100.0 15.9 100.0Utah 70 13,893 100.0 68.2 75.7 5.3 100.0 26.5 75.7
Vermont 183 2,288 92.9 81.8 78.1 4.4 89.1 13.8 74.3Virginia 90 36,137 100.0 67.9 100.0 12.4 100.0 19.7 100.0Washington 66 43,946 95.5 69.2 84.8 14.6 84.8 16.2 84.8West Virginia 97 4,433 100.0 78.0 100.0 5.5 100.0 16.5 100.0Wisconsin 382 24,420 100.0 71.5 99.5 5.3 99.5 23.2 99.5Wyoming 23 3,041 100.0 72.5 100.0 8.7 100.0 18.8 100.0
Total collection expenditures
2 This includes all operating expenditures for other materials, such as microform, audio, video, DVD, and materials in new formats.
1This includes all operating expenditures for electronic (digital) materials. Types of electronic materials include e-books, e-serials (including journals), government documents, databases (including locally mounted, full text or not), electronic files, reference tools, scores, maps, or pictures in electronic or digital format, including materials digitized by the library. Electronic materials can be distributed on magnetic tape, diskettes, computer software, CD-ROM, or other portable digital carrier, and can be accessed via a computer, via access to the Internet, or by using an e-book reader. This includes expenditures for materials held locally and for remote electronic materials for which permanent or temporary access rights have been acquired. It also includes expenditures for database licenses.
Other materials expenditures2Print materials expenditures Electronic materials expenditures1
NOTE: Detail may not sum to totals because of rounding. Data were not reported by the outlying areas (American Samoa, Guam, Northern Marianas, Puerto Rico, and Virgin Islands).SOURCE: Institute of Museum and Library Services, Survey of Public Libraries in the United States, Fiscal Year 2007.
3Response rate is the percentage of libraries that reported the item. For item(s) with response rates below 100 percent, data for nonrespondents were imputed and are included in the table.
103

104
(Page is intentionally blank.)
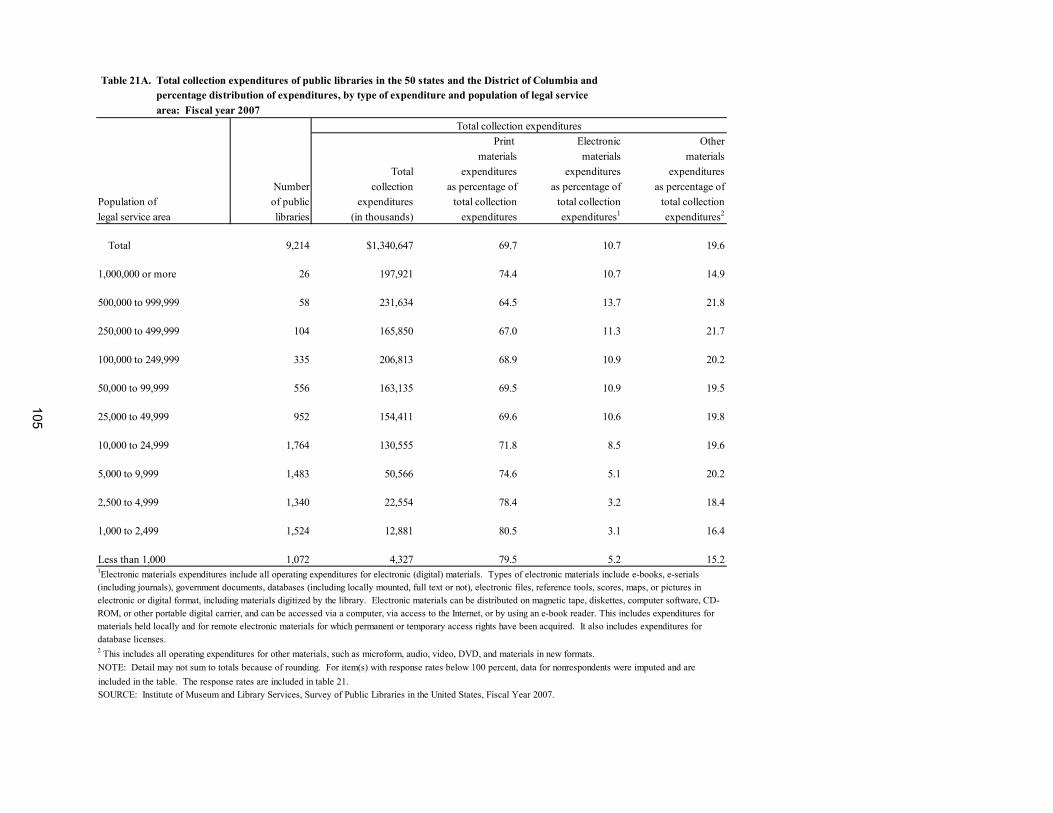
Table 21A. Total collection expenditures of public libraries in the 50 states and the District of Columbia and Table 21A. percentage distribution of expenditures, by type of expenditure and population of legal service Table 21A. area: Fiscal year 2007
Print Electronic Othermaterials materials materials
Total expenditures expenditures expendituresNumber collection as percentage of as percentage of as percentage of
Population of of public expenditures total collection total collection total collectionlegal service area libraries (in thousands) expenditures expenditures1 expenditures2
Total 9,214 $1,340,647 69.7 10.7 19.6
1,000,000 or more 26 197,921 74.4 10.7 14.9 500,000 to 999,999 58 231,634 64.5 13.7 21.8 250,000 to 499,999 104 165,850 67.0 11.3 21.7 100,000 to 249,999 335 206,813 68.9 10.9 20.2 50,000 to 99,999 556 163,135 69.5 10.9 19.5 25,000 to 49,999 952 154,411 69.6 10.6 19.8 10,000 to 24,999 1,764 130,555 71.8 8.5 19.6 5,000 to 9,999 1,483 50,566 74.6 5.1 20.2 2,500 to 4,999 1,340 22,554 78.4 3.2 18.4 1,000 to 2,499 1,524 12,881 80.5 3.1 16.4
Less than 1,000 1,072 4,327 79.5 5.2 15.2
NOTE: Detail may not sum to totals because of rounding. For item(s) with response rates below 100 percent, data for nonrespondents were imputed and are included in the table. The response rates are included in table 21.SOURCE: Institute of Museum and Library Services, Survey of Public Libraries in the United States, Fiscal Year 2007.
Total collection expenditures
2 This includes all operating expenditures for other materials, such as microform, audio, video, DVD, and materials in new formats.
1Electronic materials expenditures include all operating expenditures for electronic (digital) materials. Types of electronic materials include e-books, e-serials (including journals), government documents, databases (including locally mounted, full text or not), electronic files, reference tools, scores, maps, or pictures in electronic or digital format, including materials digitized by the library. Electronic materials can be distributed on magnetic tape, diskettes, computer software, CD-ROM, or other portable digital carrier, and can be accessed via a computer, via access to the Internet, or by using an e-book reader. This includes expenditures for materials held locally and for remote electronic materials for which permanent or temporary access rights have been acquired. It also includes expenditures for database licenses.
105
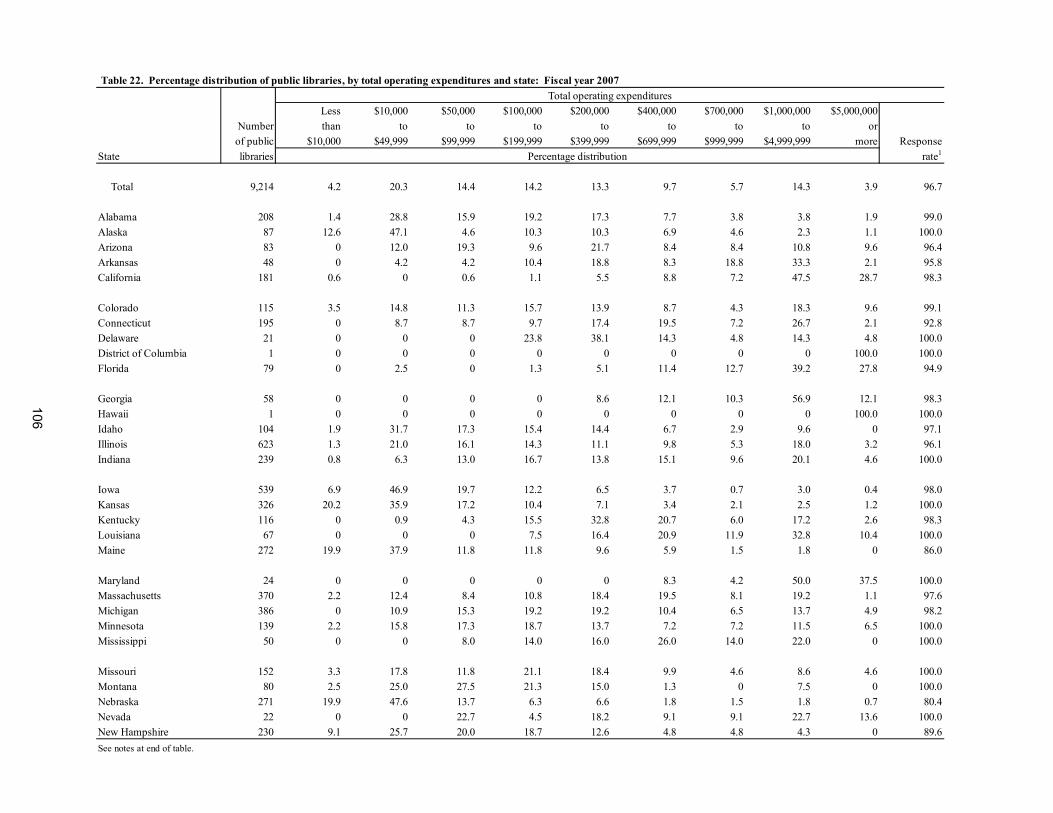
106
Table 22. Percentage distribution of public libraries, by total operating expenditures and state: Fiscal year 2007Total operating expenditures
Less $10,000 $50,000 $100,000 $200,000 $400,000 $700,000 $1,000,000 $5,000,000Number than to to to to to to to or
of public $10,000 $49,999 $99,999 $199,999 $399,999 $699,999 $999,999 $4,999,999 more ResponseState libraries Percentage distribution rate1
Total 9,214 4.2 20.3 14.4 14.2 13.3 9.7 5.7 14.3 3.9 96.7
Alabama 208 1.4 28.8 15.9 19.2 17.3 7.7 3.8 3.8 1.9 99.0Alaska 87 12.6 47.1 4.6 10.3 10.3 6.9 4.6 2.3 1.1 100.0Arizona 83 0 12.0 19.3 9.6 21.7 8.4 8.4 10.8 9.6 96.4Arkansas 48 0 4.2 4.2 10.4 18.8 8.3 18.8 33.3 2.1 95.8California 181 0.6 0 0.6 1.1 5.5 8.8 7.2 47.5 28.7 98.3
Colorado 115 3.5 14.8 11.3 15.7 13.9 8.7 4.3 18.3 9.6 99.1Connecticut 195 0 8.7 8.7 9.7 17.4 19.5 7.2 26.7 2.1 92.8Delaware 21 0 0 0 23.8 38.1 14.3 4.8 14.3 4.8 100.0District of Columbia 1 0 0 0 0 0 0 0 0 100.0 100.0Florida 79 0 2.5 0 1.3 5.1 11.4 12.7 39.2 27.8 94.9
Georgia 58 0 0 0 0 8.6 12.1 10.3 56.9 12.1 98.3Hawaii 1 0 0 0 0 0 0 0 0 100.0 100.0Idaho 104 1.9 31.7 17.3 15.4 14.4 6.7 2.9 9.6 0 97.1Illinois 623 1.3 21.0 16.1 14.3 11.1 9.8 5.3 18.0 3.2 96.1Indiana 239 0.8 6.3 13.0 16.7 13.8 15.1 9.6 20.1 4.6 100.0
Iowa 539 6.9 46.9 19.7 12.2 6.5 3.7 0.7 3.0 0.4 98.0Kansas 326 20.2 35.9 17.2 10.4 7.1 3.4 2.1 2.5 1.2 100.0Kentucky 116 0 0.9 4.3 15.5 32.8 20.7 6.0 17.2 2.6 98.3Louisiana 67 0 0 0 7.5 16.4 20.9 11.9 32.8 10.4 100.0Maine 272 19.9 37.9 11.8 11.8 9.6 5.9 1.5 1.8 0 86.0
Maryland 24 0 0 0 0 0 8.3 4.2 50.0 37.5 100.0Massachusetts 370 2.2 12.4 8.4 10.8 18.4 19.5 8.1 19.2 1.1 97.6Michigan 386 0 10.9 15.3 19.2 19.2 10.4 6.5 13.7 4.9 98.2Minnesota 139 2.2 15.8 17.3 18.7 13.7 7.2 7.2 11.5 6.5 100.0Mississippi 50 0 0 8.0 14.0 16.0 26.0 14.0 22.0 0 100.0
Missouri 152 3.3 17.8 11.8 21.1 18.4 9.9 4.6 8.6 4.6 100.0Montana 80 2.5 25.0 27.5 21.3 15.0 1.3 0 7.5 0 100.0Nebraska 271 19.9 47.6 13.7 6.3 6.6 1.8 1.5 1.8 0.7 80.4Nevada 22 0 0 22.7 4.5 18.2 9.1 9.1 22.7 13.6 100.0New Hampshire 230 9.1 25.7 20.0 18.7 12.6 4.8 4.8 4.3 0 89.6See notes at end of table.
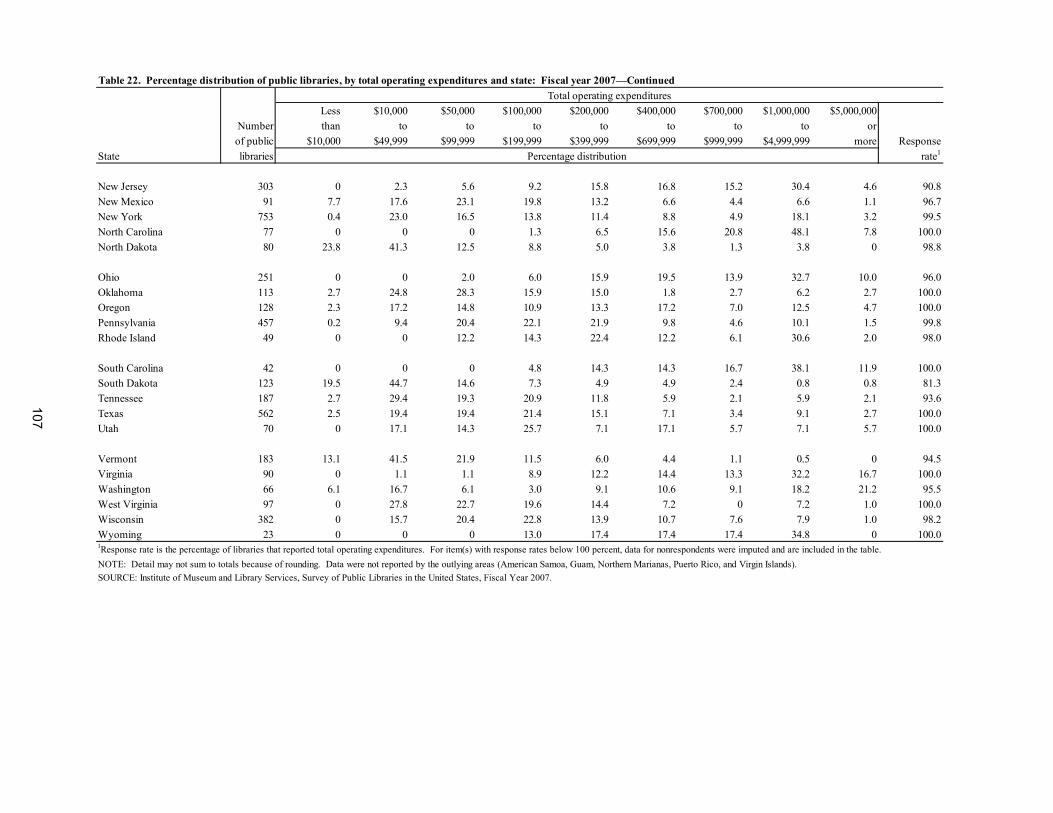
Table 22. Percentage distribution of public libraries, by total operating expenditures and state: Fiscal year 2007—ContinuedTotal operating expenditures
Less $10,000 $50,000 $100,000 $200,000 $400,000 $700,000 $1,000,000 $5,000,000Number than to to to to to to to or
of public $10,000 $49,999 $99,999 $199,999 $399,999 $699,999 $999,999 $4,999,999 more ResponseState libraries Percentage distribution rate1
New Jersey 303 0 2.3 5.6 9.2 15.8 16.8 15.2 30.4 4.6 90.8New Mexico 91 7.7 17.6 23.1 19.8 13.2 6.6 4.4 6.6 1.1 96.7New York 753 0.4 23.0 16.5 13.8 11.4 8.8 4.9 18.1 3.2 99.5North Carolina 77 0 0 0 1.3 6.5 15.6 20.8 48.1 7.8 100.0North Dakota 80 23.8 41.3 12.5 8.8 5.0 3.8 1.3 3.8 0 98.8
Ohio 251 0 0 2.0 6.0 15.9 19.5 13.9 32.7 10.0 96.0Oklahoma 113 2.7 24.8 28.3 15.9 15.0 1.8 2.7 6.2 2.7 100.0Oregon 128 2.3 17.2 14.8 10.9 13.3 17.2 7.0 12.5 4.7 100.0Pennsylvania 457 0.2 9.4 20.4 22.1 21.9 9.8 4.6 10.1 1.5 99.8Rhode Island 49 0 0 12.2 14.3 22.4 12.2 6.1 30.6 2.0 98.0
South Carolina 42 0 0 0 4.8 14.3 14.3 16.7 38.1 11.9 100.0South Dakota 123 19.5 44.7 14.6 7.3 4.9 4.9 2.4 0.8 0.8 81.3Tennessee 187 2.7 29.4 19.3 20.9 11.8 5.9 2.1 5.9 2.1 93.6Texas 562 2.5 19.4 19.4 21.4 15.1 7.1 3.4 9.1 2.7 100.0Utah 70 0 17.1 14.3 25.7 7.1 17.1 5.7 7.1 5.7 100.0
Vermont 183 13.1 41.5 21.9 11.5 6.0 4.4 1.1 0.5 0 94.5Virginia 90 0 1.1 1.1 8.9 12.2 14.4 13.3 32.2 16.7 100.0Washington 66 6.1 16.7 6.1 3.0 9.1 10.6 9.1 18.2 21.2 95.5West Virginia 97 0 27.8 22.7 19.6 14.4 7.2 0 7.2 1.0 100.0Wisconsin 382 0 15.7 20.4 22.8 13.9 10.7 7.6 7.9 1.0 98.2Wyoming 23 0 0 0 13.0 17.4 17.4 17.4 34.8 0 100.0
NOTE: Detail may not sum to totals because of rounding. Data were not reported by the outlying areas (American Samoa, Guam, Northern Marianas, Puerto Rico, and Virgin Islands).SOURCE: Institute of Museum and Library Services, Survey of Public Libraries in the United States, Fiscal Year 2007.
1Response rate is the percentage of libraries that reported total operating expenditures. For item(s) with response rates below 100 percent, data for nonrespondents were imputed and are included in the table.
107

108
(Page is intentionally blank.)
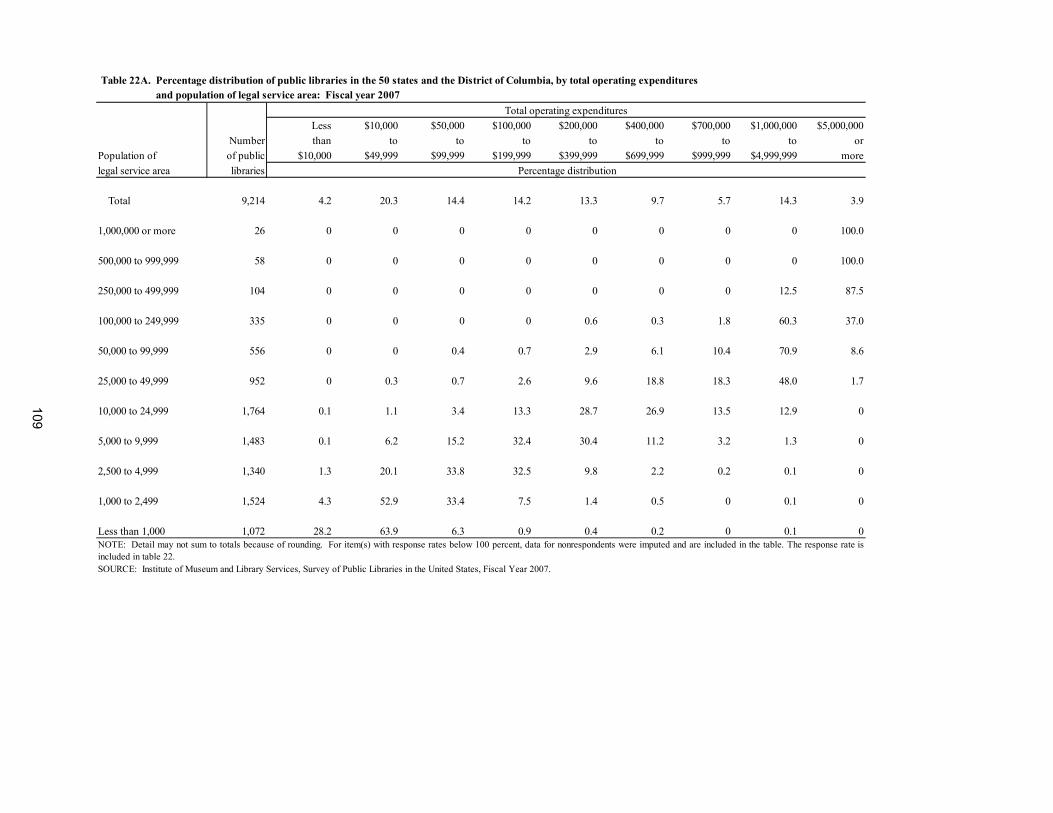
Table 22A. and population of legal service area: Fiscal year 2007Total operating expenditures
Less $10,000 $50,000 $100,000 $200,000 $400,000 $700,000 $1,000,000 $5,000,000Number than to to to to to to to or
Population of of public $10,000 $49,999 $99,999 $199,999 $399,999 $699,999 $999,999 $4,999,999 morelegal service area libraries Percentage distribution
Total 9,214 4.2 20.3 14.4 14.2 13.3 9.7 5.7 14.3 3.9 1,000,000 or more 26 0 0 0 0 0 0 0 0 100.0 500,000 to 999,999 58 0 0 0 0 0 0 0 0 100.0 250,000 to 499,999 104 0 0 0 0 0 0 0 12.5 87.5 100,000 to 249,999 335 0 0 0 0 0.6 0.3 1.8 60.3 37.0 50,000 to 99,999 556 0 0 0.4 0.7 2.9 6.1 10.4 70.9 8.6 25,000 to 49,999 952 0 0.3 0.7 2.6 9.6 18.8 18.3 48.0 1.7 10,000 to 24,999 1,764 0.1 1.1 3.4 13.3 28.7 26.9 13.5 12.9 0 5,000 to 9,999 1,483 0.1 6.2 15.2 32.4 30.4 11.2 3.2 1.3 0 2,500 to 4,999 1,340 1.3 20.1 33.8 32.5 9.8 2.2 0.2 0.1 0 1,000 to 2,499 1,524 4.3 52.9 33.4 7.5 1.4 0.5 0 0.1 0 Less than 1,000 1,072 28.2 63.9 6.3 0.9 0.4 0.2 0 0.1 0NOTE: Detail may not sum to totals because of rounding. For item(s) with response rates below 100 percent, data for nonrespondents were imputed and are included in the table. The response rate isincluded in table 22.SOURCE: Institute of Museum and Library Services, Survey of Public Libraries in the United States, Fiscal Year 2007.
Table 22A. Percentage distribution of public libraries in the 50 states and the District of Columbia, by total operating expenditures
109
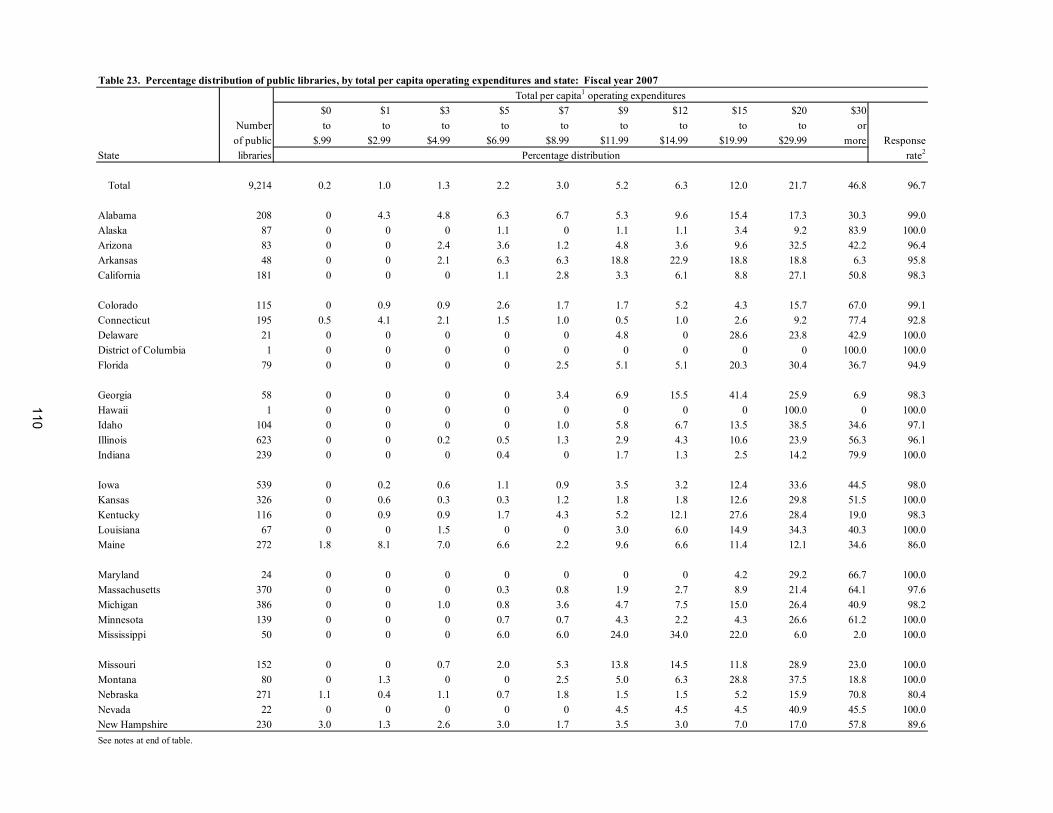
Table 23. Percentage distribution of public libraries, by total per capita operating expenditures and state: Fiscal year 2007Total per capita1 operating expenditures
$0 $1 $3 $5 $7 $9 $12 $15 $20 $30Number to to to to to to to to to or
of public $.99 $2.99 $4.99 $6.99 $8.99 $11.99 $14.99 $19.99 $29.99 more ResponseState libraries Percentage distribution rate2
Total 9,214 0.2 1.0 1.3 2.2 3.0 5.2 6.3 12.0 21.7 46.8 96.7
Alabama 208 0 4.3 4.8 6.3 6.7 5.3 9.6 15.4 17.3 30.3 99.0Alaska 87 0 0 0 1.1 0 1.1 1.1 3.4 9.2 83.9 100.0Arizona 83 0 0 2.4 3.6 1.2 4.8 3.6 9.6 32.5 42.2 96.4Arkansas 48 0 0 2.1 6.3 6.3 18.8 22.9 18.8 18.8 6.3 95.8California 181 0 0 0 1.1 2.8 3.3 6.1 8.8 27.1 50.8 98.3
Colorado 115 0 0.9 0.9 2.6 1.7 1.7 5.2 4.3 15.7 67.0 99.1Connecticut 195 0.5 4.1 2.1 1.5 1.0 0.5 1.0 2.6 9.2 77.4 92.8Delaware 21 0 0 0 0 0 4.8 0 28.6 23.8 42.9 100.0District of Columbia 1 0 0 0 0 0 0 0 0 0 100.0 100.0Florida 79 0 0 0 0 2.5 5.1 5.1 20.3 30.4 36.7 94.9
Georgia 58 0 0 0 0 3.4 6.9 15.5 41.4 25.9 6.9 98.3Hawaii 1 0 0 0 0 0 0 0 0 100.0 0 100.0Idaho 104 0 0 0 0 1.0 5.8 6.7 13.5 38.5 34.6 97.1Illinois 623 0 0 0.2 0.5 1.3 2.9 4.3 10.6 23.9 56.3 96.1Indiana 239 0 0 0 0.4 0 1.7 1.3 2.5 14.2 79.9 100.0
Iowa 539 0 0.2 0.6 1.1 0.9 3.5 3.2 12.4 33.6 44.5 98.0Kansas 326 0 0.6 0.3 0.3 1.2 1.8 1.8 12.6 29.8 51.5 100.0Kentucky 116 0 0.9 0.9 1.7 4.3 5.2 12.1 27.6 28.4 19.0 98.3Louisiana 67 0 0 1.5 0 0 3.0 6.0 14.9 34.3 40.3 100.0Maine 272 1.8 8.1 7.0 6.6 2.2 9.6 6.6 11.4 12.1 34.6 86.0
Maryland 24 0 0 0 0 0 0 0 4.2 29.2 66.7 100.0Massachusetts 370 0 0 0 0.3 0.8 1.9 2.7 8.9 21.4 64.1 97.6Michigan 386 0 0 1.0 0.8 3.6 4.7 7.5 15.0 26.4 40.9 98.2Minnesota 139 0 0 0 0.7 0.7 4.3 2.2 4.3 26.6 61.2 100.0Mississippi 50 0 0 0 6.0 6.0 24.0 34.0 22.0 6.0 2.0 100.0
Missouri 152 0 0 0.7 2.0 5.3 13.8 14.5 11.8 28.9 23.0 100.0Montana 80 0 1.3 0 0 2.5 5.0 6.3 28.8 37.5 18.8 100.0Nebraska 271 1.1 0.4 1.1 0.7 1.8 1.5 1.5 5.2 15.9 70.8 80.4Nevada 22 0 0 0 0 0 4.5 4.5 4.5 40.9 45.5 100.0New Hampshire 230 3.0 1.3 2.6 3.0 1.7 3.5 3.0 7.0 17.0 57.8 89.6See notes at end of table.
110
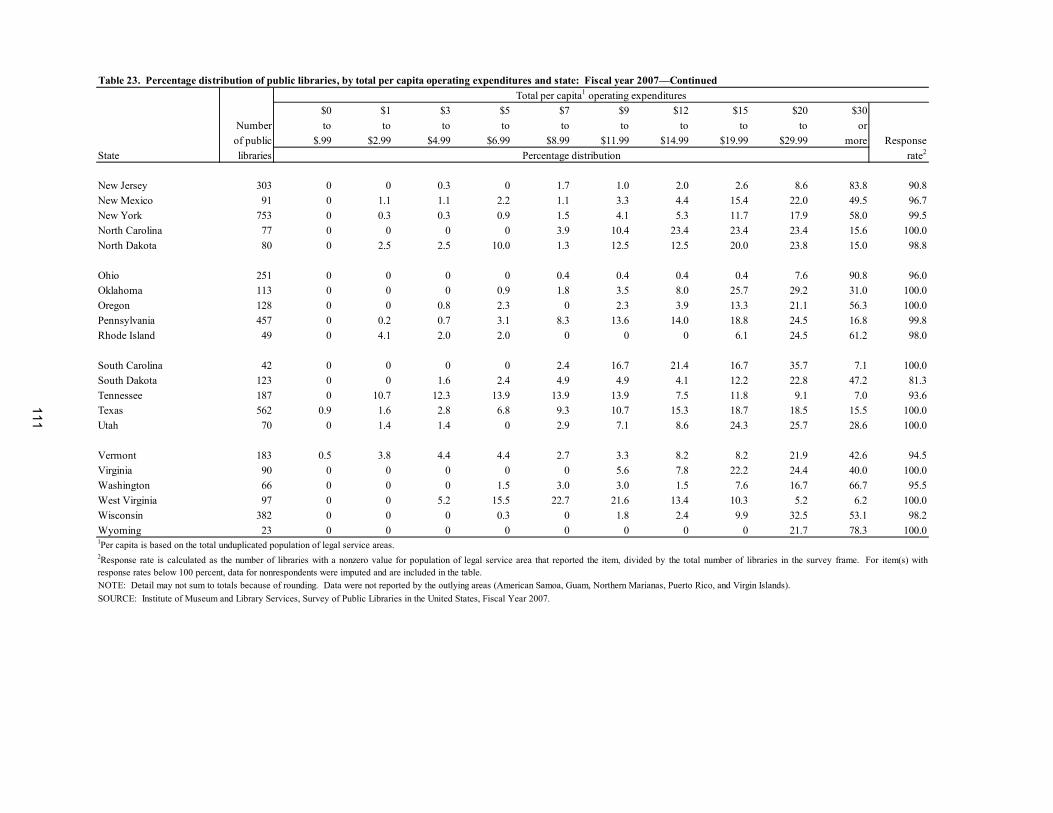
Table 23. Percentage distribution of public libraries, by total per capita operating expenditures and state: Fiscal year 2007—ContinuedTotal per capita1 operating expenditures
$0 $1 $3 $5 $7 $9 $12 $15 $20 $30Number to to to to to to to to to or
of public $.99 $2.99 $4.99 $6.99 $8.99 $11.99 $14.99 $19.99 $29.99 more ResponseState libraries Percentage distribution rate2
New Jersey 303 0 0 0.3 0 1.7 1.0 2.0 2.6 8.6 83.8 90.8New Mexico 91 0 1.1 1.1 2.2 1.1 3.3 4.4 15.4 22.0 49.5 96.7New York 753 0 0.3 0.3 0.9 1.5 4.1 5.3 11.7 17.9 58.0 99.5North Carolina 77 0 0 0 0 3.9 10.4 23.4 23.4 23.4 15.6 100.0North Dakota 80 0 2.5 2.5 10.0 1.3 12.5 12.5 20.0 23.8 15.0 98.8
Ohio 251 0 0 0 0 0.4 0.4 0.4 0.4 7.6 90.8 96.0Oklahoma 113 0 0 0 0.9 1.8 3.5 8.0 25.7 29.2 31.0 100.0Oregon 128 0 0 0.8 2.3 0 2.3 3.9 13.3 21.1 56.3 100.0Pennsylvania 457 0 0.2 0.7 3.1 8.3 13.6 14.0 18.8 24.5 16.8 99.8Rhode Island 49 0 4.1 2.0 2.0 0 0 0 6.1 24.5 61.2 98.0
South Carolina 42 0 0 0 0 2.4 16.7 21.4 16.7 35.7 7.1 100.0South Dakota 123 0 0 1.6 2.4 4.9 4.9 4.1 12.2 22.8 47.2 81.3Tennessee 187 0 10.7 12.3 13.9 13.9 13.9 7.5 11.8 9.1 7.0 93.6Texas 562 0.9 1.6 2.8 6.8 9.3 10.7 15.3 18.7 18.5 15.5 100.0Utah 70 0 1.4 1.4 0 2.9 7.1 8.6 24.3 25.7 28.6 100.0
Vermont 183 0.5 3.8 4.4 4.4 2.7 3.3 8.2 8.2 21.9 42.6 94.5Virginia 90 0 0 0 0 0 5.6 7.8 22.2 24.4 40.0 100.0Washington 66 0 0 0 1.5 3.0 3.0 1.5 7.6 16.7 66.7 95.5West Virginia 97 0 0 5.2 15.5 22.7 21.6 13.4 10.3 5.2 6.2 100.0Wisconsin 382 0 0 0 0.3 0 1.8 2.4 9.9 32.5 53.1 98.2Wyoming 23 0 0 0 0 0 0 0 0 21.7 78.3 100.0
NOTE: Detail may not sum to totals because of rounding. Data were not reported by the outlying areas (American Samoa, Guam, Northern Marianas, Puerto Rico, and Virgin Islands).SOURCE: Institute of Museum and Library Services, Survey of Public Libraries in the United States, Fiscal Year 2007.
1Per capita is based on the total unduplicated population of legal service areas. 2Response rate is calculated as the number of libraries with a nonzero value for population of legal service area that reported the item, divided by the total number of libraries in the survey frame. For item(s) withresponse rates below 100 percent, data for nonrespondents were imputed and are included in the table.
111

112
(Page is intentionally blank.)
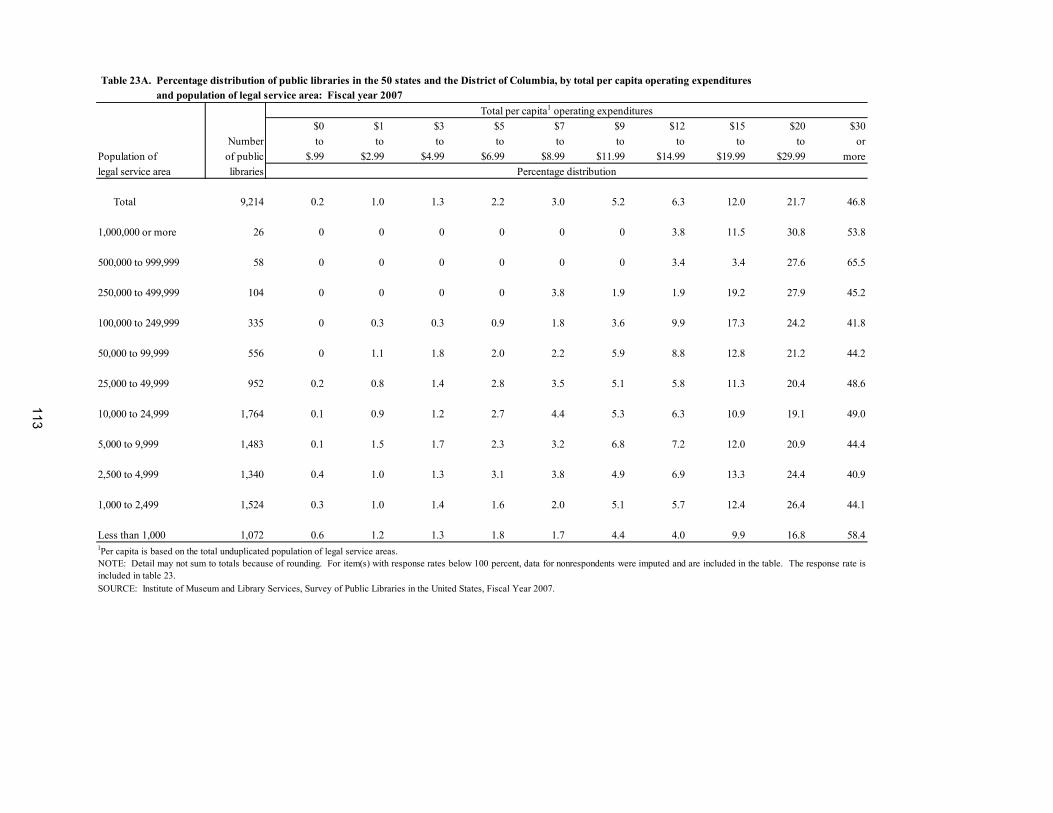
Table 23A. and population of legal service area: Fiscal year 2007Total per capita1 operating expenditures
$0 $1 $3 $5 $7 $9 $12 $15 $20 $30Number to to to to to to to to to or
Population of of public $.99 $2.99 $4.99 $6.99 $8.99 $11.99 $14.99 $19.99 $29.99 morelegal service area libraries Percentage distribution
Total 9,214 0.2 1.0 1.3 2.2 3.0 5.2 6.3 12.0 21.7 46.8
1,000,000 or more 26 0 0 0 0 0 0 3.8 11.5 30.8 53.8 500,000 to 999,999 58 0 0 0 0 0 0 3.4 3.4 27.6 65.5 250,000 to 499,999 104 0 0 0 0 3.8 1.9 1.9 19.2 27.9 45.2 100,000 to 249,999 335 0 0.3 0.3 0.9 1.8 3.6 9.9 17.3 24.2 41.8 50,000 to 99,999 556 0 1.1 1.8 2.0 2.2 5.9 8.8 12.8 21.2 44.2 25,000 to 49,999 952 0.2 0.8 1.4 2.8 3.5 5.1 5.8 11.3 20.4 48.6 10,000 to 24,999 1,764 0.1 0.9 1.2 2.7 4.4 5.3 6.3 10.9 19.1 49.0 5,000 to 9,999 1,483 0.1 1.5 1.7 2.3 3.2 6.8 7.2 12.0 20.9 44.4 2,500 to 4,999 1,340 0.4 1.0 1.3 3.1 3.8 4.9 6.9 13.3 24.4 40.9 1,000 to 2,499 1,524 0.3 1.0 1.4 1.6 2.0 5.1 5.7 12.4 26.4 44.1 Less than 1,000 1,072 0.6 1.2 1.3 1.8 1.7 4.4 4.0 9.9 16.8 58.4
NOTE: Detail may not sum to totals because of rounding. For item(s) with response rates below 100 percent, data for nonrespondents were imputed and are included in the table. The response rate isincluded in table 23.SOURCE: Institute of Museum and Library Services, Survey of Public Libraries in the United States, Fiscal Year 2007.
Table 23A. Percentage distribution of public libraries in the 50 states and the District of Columbia, by total per capita operating expenditures
1Per capita is based on the total unduplicated population of legal service areas.
113
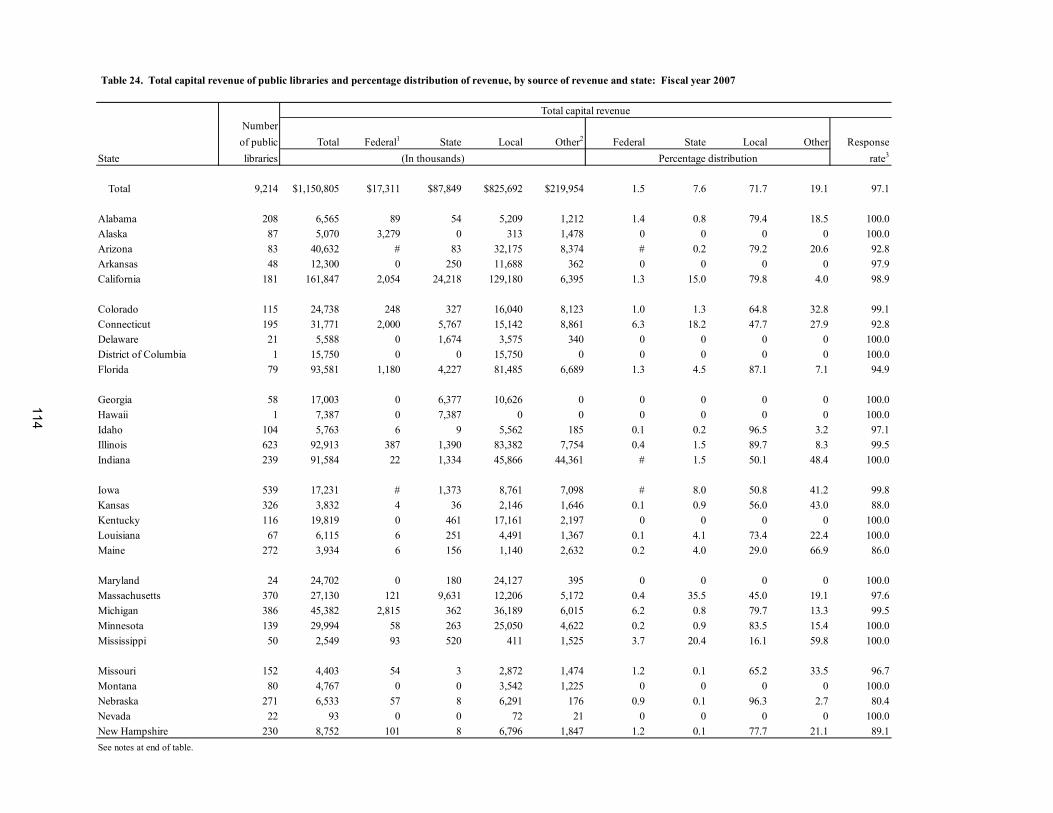
Numberof public Total Federal1 State Local Other2 Federal State Local Other Response
State libraries (In thousands) Percentage distribution rate3
Total 9,214 $1,150,805 $17,311 $87,849 $825,692 $219,954 1.5 7.6 71.7 19.1 97.1
Alabama 208 6,565 89 54 5,209 1,212 1.4 0.8 79.4 18.5 100.0Alaska 87 5,070 3,279 0 313 1,478 0 0 0 0 100.0Arizona 83 40,632 # 83 32,175 8,374 # 0.2 79.2 20.6 92.8Arkansas 48 12,300 0 250 11,688 362 0 0 0 0 97.9California 181 161,847 2,054 24,218 129,180 6,395 1.3 15.0 79.8 4.0 98.9
Colorado 115 24,738 248 327 16,040 8,123 1.0 1.3 64.8 32.8 99.1Connecticut 195 31,771 2,000 5,767 15,142 8,861 6.3 18.2 47.7 27.9 92.8Delaware 21 5,588 0 1,674 3,575 340 0 0 0 0 100.0District of Columbia 1 15,750 0 0 15,750 0 0 0 0 0 100.0Florida 79 93,581 1,180 4,227 81,485 6,689 1.3 4.5 87.1 7.1 94.9
Georgia 58 17,003 0 6,377 10,626 0 0 0 0 0 100.0Hawaii 1 7,387 0 7,387 0 0 0 0 0 0 100.0Idaho 104 5,763 6 9 5,562 185 0.1 0.2 96.5 3.2 97.1Illinois 623 92,913 387 1,390 83,382 7,754 0.4 1.5 89.7 8.3 99.5Indiana 239 91,584 22 1,334 45,866 44,361 # 1.5 50.1 48.4 100.0
Iowa 539 17,231 # 1,373 8,761 7,098 # 8.0 50.8 41.2 99.8Kansas 326 3,832 4 36 2,146 1,646 0.1 0.9 56.0 43.0 88.0Kentucky 116 19,819 0 461 17,161 2,197 0 0 0 0 100.0Louisiana 67 6,115 6 251 4,491 1,367 0.1 4.1 73.4 22.4 100.0Maine 272 3,934 6 156 1,140 2,632 0.2 4.0 29.0 66.9 86.0
Maryland 24 24,702 0 180 24,127 395 0 0 0 0 100.0Massachusetts 370 27,130 121 9,631 12,206 5,172 0.4 35.5 45.0 19.1 97.6Michigan 386 45,382 2,815 362 36,189 6,015 6.2 0.8 79.7 13.3 99.5Minnesota 139 29,994 58 263 25,050 4,622 0.2 0.9 83.5 15.4 100.0Mississippi 50 2,549 93 520 411 1,525 3.7 20.4 16.1 59.8 100.0
Missouri 152 4,403 54 3 2,872 1,474 1.2 0.1 65.2 33.5 96.7Montana 80 4,767 0 0 3,542 1,225 0 0 0 0 100.0Nebraska 271 6,533 57 8 6,291 176 0.9 0.1 96.3 2.7 80.4Nevada 22 93 0 0 72 21 0 0 0 0 100.0New Hampshire 230 8,752 101 8 6,796 1,847 1.2 0.1 77.7 21.1 89.1See notes at end of table.
Table 24. Total capital revenue of public libraries and percentage distribution of revenue, by source of revenue and state: Fiscal year 2007
Total capital revenue
114
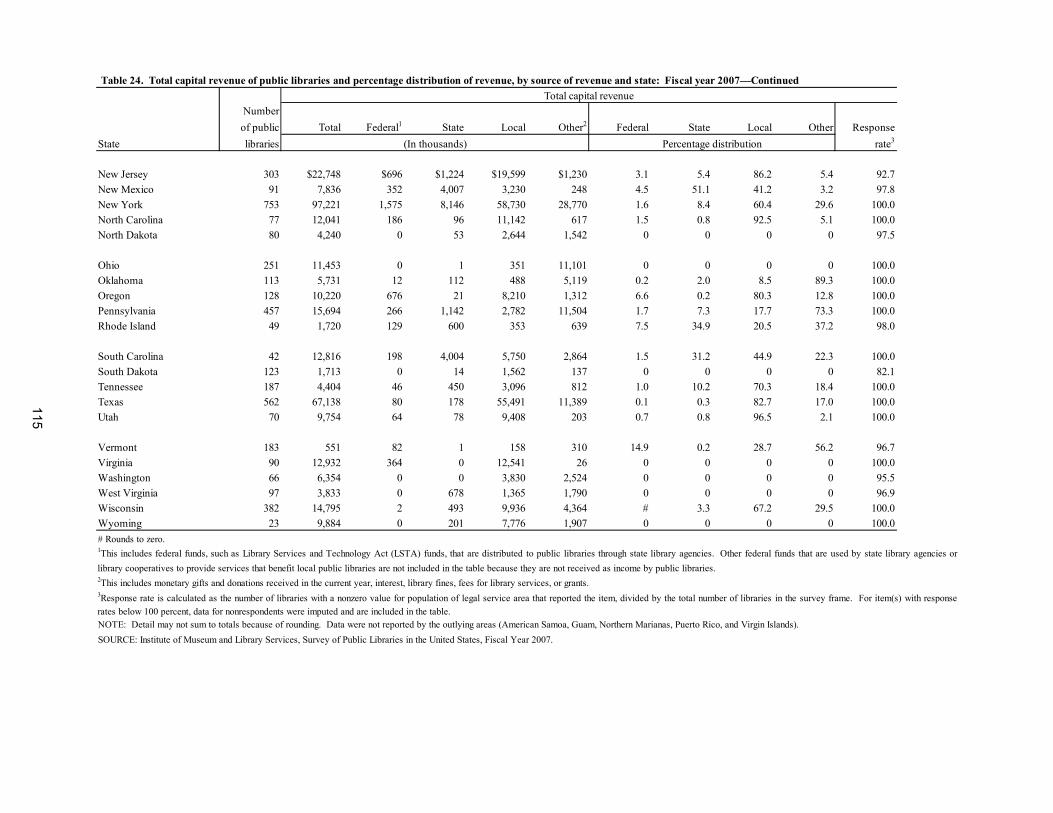
Numberof public Total Federal1 State Local Other2 Federal State Local Other Response
State libraries (In thousands) Percentage distribution rate3
New Jersey 303 $22,748 $696 $1,224 $19,599 $1,230 3.1 5.4 86.2 5.4 92.7New Mexico 91 7,836 352 4,007 3,230 248 4.5 51.1 41.2 3.2 97.8New York 753 97,221 1,575 8,146 58,730 28,770 1.6 8.4 60.4 29.6 100.0North Carolina 77 12,041 186 96 11,142 617 1.5 0.8 92.5 5.1 100.0North Dakota 80 4,240 0 53 2,644 1,542 0 0 0 0 97.5
Ohio 251 11,453 0 1 351 11,101 0 0 0 0 100.0Oklahoma 113 5,731 12 112 488 5,119 0.2 2.0 8.5 89.3 100.0Oregon 128 10,220 676 21 8,210 1,312 6.6 0.2 80.3 12.8 100.0Pennsylvania 457 15,694 266 1,142 2,782 11,504 1.7 7.3 17.7 73.3 100.0Rhode Island 49 1,720 129 600 353 639 7.5 34.9 20.5 37.2 98.0
South Carolina 42 12,816 198 4,004 5,750 2,864 1.5 31.2 44.9 22.3 100.0South Dakota 123 1,713 0 14 1,562 137 0 0 0 0 82.1Tennessee 187 4,404 46 450 3,096 812 1.0 10.2 70.3 18.4 100.0Texas 562 67,138 80 178 55,491 11,389 0.1 0.3 82.7 17.0 100.0Utah 70 9,754 64 78 9,408 203 0.7 0.8 96.5 2.1 100.0
Vermont 183 551 82 1 158 310 14.9 0.2 28.7 56.2 96.7Virginia 90 12,932 364 0 12,541 26 0 0 0 0 100.0Washington 66 6,354 0 0 3,830 2,524 0 0 0 0 95.5West Virginia 97 3,833 0 678 1,365 1,790 0 0 0 0 96.9Wisconsin 382 14,795 2 493 9,936 4,364 # 3.3 67.2 29.5 100.0Wyoming 23 9,884 0 201 7,776 1,907 0 0 0 0 100.0
3Response rate is calculated as the number of libraries with a nonzero value for population of legal service area that reported the item, divided by the total number of libraries in the survey frame. For item(s) with responserates below 100 percent, data for nonrespondents were imputed and are included in the table. NOTE: Detail may not sum to totals because of rounding. Data were not reported by the outlying areas (American Samoa, Guam, Northern Marianas, Puerto Rico, and Virgin Islands).SOURCE: Institute of Museum and Library Services, Survey of Public Libraries in the United States, Fiscal Year 2007.
Table 24. Total capital revenue of public libraries and percentage distribution of revenue, by source of revenue and state: Fiscal year 2007—ContinuedTotal capital revenue
# Rounds to zero.1This includes federal funds, such as Library Services and Technology Act (LSTA) funds, that are distributed to public libraries through state library agencies. Other federal funds that are used by state library agencies orlibrary cooperatives to provide services that benefit local public libraries are not included in the table because they are not received as income by public libraries.2This includes monetary gifts and donations received in the current year, interest, library fines, fees for library services, or grants.
115

116
(Page is intentionally blank.)
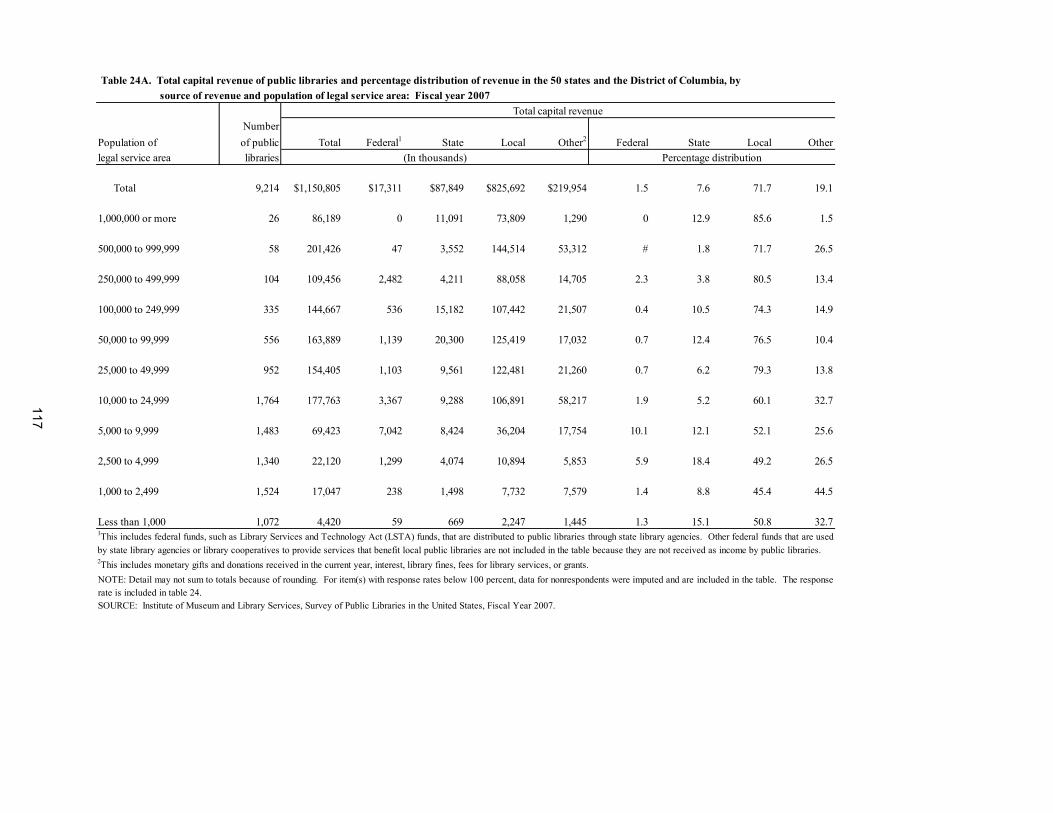
source of revenue and population of legal service area: Fiscal year 2007
NumberPopulation of of public Total Federal1 State Local Other2 Federal State Local Otherlegal service area libraries (In thousands) Percentage distribution
Total 9,214 $1,150,805 $17,311 $87,849 $825,692 $219,954 1.5 7.6 71.7 19.1 1,000,000 or more 26 86,189 0 11,091 73,809 1,290 0 12.9 85.6 1.5 500,000 to 999,999 58 201,426 47 3,552 144,514 53,312 # 1.8 71.7 26.5 250,000 to 499,999 104 109,456 2,482 4,211 88,058 14,705 2.3 3.8 80.5 13.4 100,000 to 249,999 335 144,667 536 15,182 107,442 21,507 0.4 10.5 74.3 14.9 50,000 to 99,999 556 163,889 1,139 20,300 125,419 17,032 0.7 12.4 76.5 10.4 25,000 to 49,999 952 154,405 1,103 9,561 122,481 21,260 0.7 6.2 79.3 13.8 10,000 to 24,999 1,764 177,763 3,367 9,288 106,891 58,217 1.9 5.2 60.1 32.7 5,000 to 9,999 1,483 69,423 7,042 8,424 36,204 17,754 10.1 12.1 52.1 25.6 2,500 to 4,999 1,340 22,120 1,299 4,074 10,894 5,853 5.9 18.4 49.2 26.5 1,000 to 2,499 1,524 17,047 238 1,498 7,732 7,579 1.4 8.8 45.4 44.5 Less than 1,000 1,072 4,420 59 669 2,247 1,445 1.3 15.1 50.8 32.7
2This includes monetary gifts and donations received in the current year, interest, library fines, fees for library services, or grants.NOTE: Detail may not sum to totals because of rounding. For item(s) with response rates below 100 percent, data for nonrespondents were imputed and are included in the table. The responserate is included in table 24.SOURCE: Institute of Museum and Library Services, Survey of Public Libraries in the United States, Fiscal Year 2007.
Table 24A. Total capital revenue of public libraries and percentage distribution of revenue in the 50 states and the District of Columbia, by
Total capital revenue
1This includes federal funds, such as Library Services and Technology Act (LSTA) funds, that are distributed to public libraries through state library agencies. Other federal funds that are usedby state library agencies or library cooperatives to provide services that benefit local public libraries are not included in the table because they are not received as income by public libraries.
117
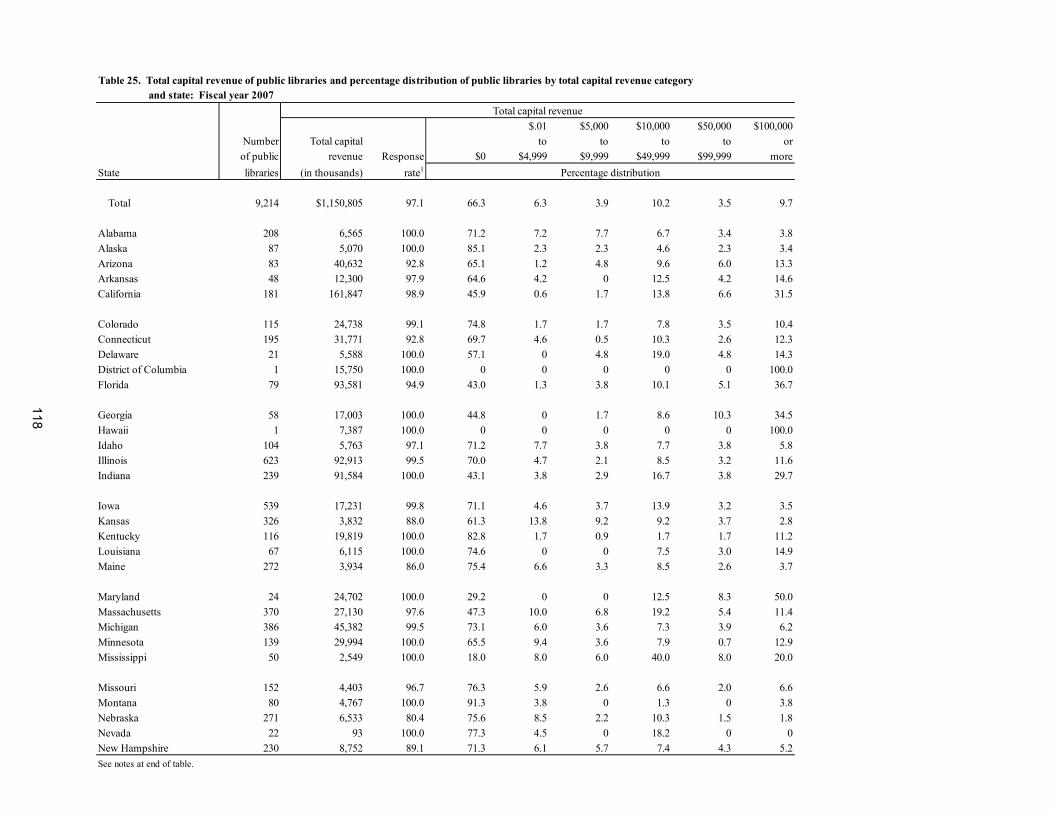
118
Table 25. Total capital revenue of public libraries and percentage distribution of public libraries by total capital revenue category Table 24. and state: Fiscal year 2007
Total capital revenue$.01 $5,000 $10,000 $50,000 $100,000
Number Total capital to to to to or of public revenue Response $0 $4,999 $9,999 $49,999 $99,999 moreState libraries (in thousands) rate1 Percentage distribution
Total 9,214 $1,150,805 97.1 66.3 6.3 3.9 10.2 3.5 9.7
Alabama 208 6,565 100.0 71.2 7.2 7.7 6.7 3.4 3.8Alaska 87 5,070 100.0 85.1 2.3 2.3 4.6 2.3 3.4Arizona 83 40,632 92.8 65.1 1.2 4.8 9.6 6.0 13.3Arkansas 48 12,300 97.9 64.6 4.2 0 12.5 4.2 14.6California 181 161,847 98.9 45.9 0.6 1.7 13.8 6.6 31.5
Colorado 115 24,738 99.1 74.8 1.7 1.7 7.8 3.5 10.4Connecticut 195 31,771 92.8 69.7 4.6 0.5 10.3 2.6 12.3Delaware 21 5,588 100.0 57.1 0 4.8 19.0 4.8 14.3District of Columbia 1 15,750 100.0 0 0 0 0 0 100.0Florida 79 93,581 94.9 43.0 1.3 3.8 10.1 5.1 36.7
Georgia 58 17,003 100.0 44.8 0 1.7 8.6 10.3 34.5Hawaii 1 7,387 100.0 0 0 0 0 0 100.0Idaho 104 5,763 97.1 71.2 7.7 3.8 7.7 3.8 5.8Illinois 623 92,913 99.5 70.0 4.7 2.1 8.5 3.2 11.6Indiana 239 91,584 100.0 43.1 3.8 2.9 16.7 3.8 29.7
Iowa 539 17,231 99.8 71.1 4.6 3.7 13.9 3.2 3.5Kansas 326 3,832 88.0 61.3 13.8 9.2 9.2 3.7 2.8Kentucky 116 19,819 100.0 82.8 1.7 0.9 1.7 1.7 11.2Louisiana 67 6,115 100.0 74.6 0 0 7.5 3.0 14.9Maine 272 3,934 86.0 75.4 6.6 3.3 8.5 2.6 3.7
Maryland 24 24,702 100.0 29.2 0 0 12.5 8.3 50.0Massachusetts 370 27,130 97.6 47.3 10.0 6.8 19.2 5.4 11.4Michigan 386 45,382 99.5 73.1 6.0 3.6 7.3 3.9 6.2Minnesota 139 29,994 100.0 65.5 9.4 3.6 7.9 0.7 12.9Mississippi 50 2,549 100.0 18.0 8.0 6.0 40.0 8.0 20.0
Missouri 152 4,403 96.7 76.3 5.9 2.6 6.6 2.0 6.6Montana 80 4,767 100.0 91.3 3.8 0 1.3 0 3.8Nebraska 271 6,533 80.4 75.6 8.5 2.2 10.3 1.5 1.8Nevada 22 93 100.0 77.3 4.5 0 18.2 0 0New Hampshire 230 8,752 89.1 71.3 6.1 5.7 7.4 4.3 5.2See notes at end of table.
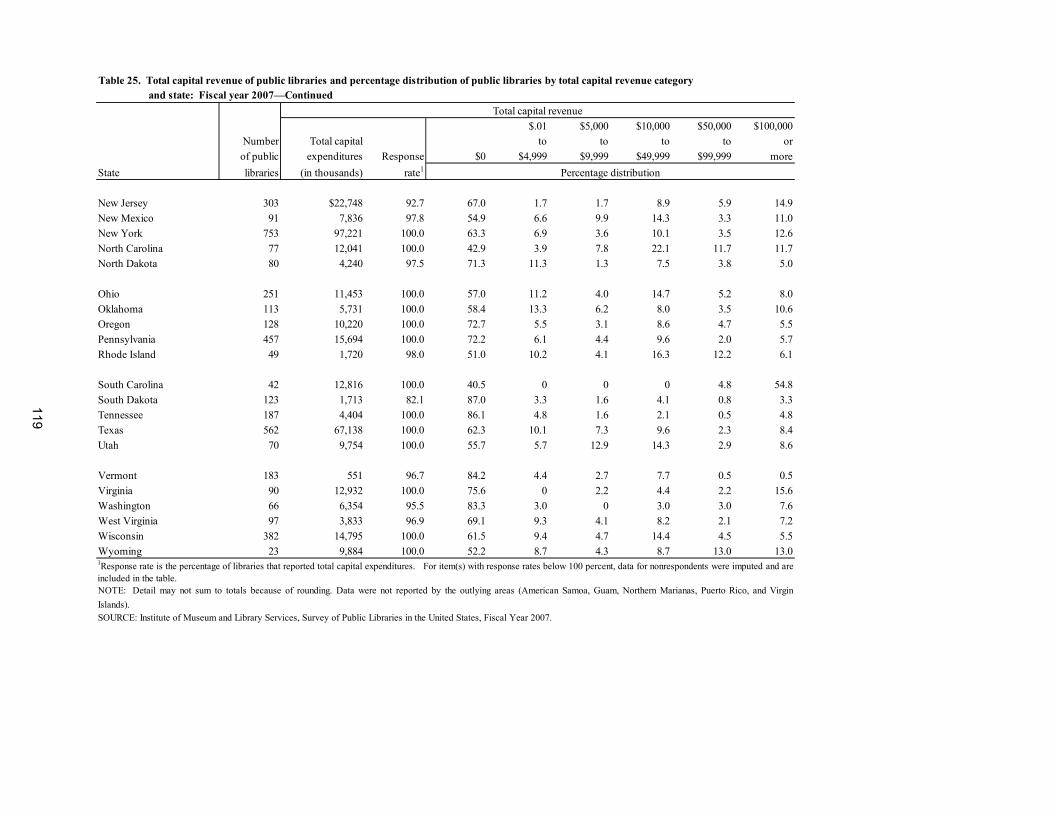
Table 25. Total capital revenue of public libraries and percentage distribution of public libraries by total capital revenue category Table 24. and state: Fiscal year 2007—Continued
Total capital revenue$.01 $5,000 $10,000 $50,000 $100,000
Number Total capital to to to to or of public expenditures Response $0 $4,999 $9,999 $49,999 $99,999 moreState libraries (in thousands) rate1 Percentage distribution
New Jersey 303 $22,748 92.7 67.0 1.7 1.7 8.9 5.9 14.9New Mexico 91 7,836 97.8 54.9 6.6 9.9 14.3 3.3 11.0New York 753 97,221 100.0 63.3 6.9 3.6 10.1 3.5 12.6North Carolina 77 12,041 100.0 42.9 3.9 7.8 22.1 11.7 11.7North Dakota 80 4,240 97.5 71.3 11.3 1.3 7.5 3.8 5.0
Ohio 251 11,453 100.0 57.0 11.2 4.0 14.7 5.2 8.0Oklahoma 113 5,731 100.0 58.4 13.3 6.2 8.0 3.5 10.6Oregon 128 10,220 100.0 72.7 5.5 3.1 8.6 4.7 5.5Pennsylvania 457 15,694 100.0 72.2 6.1 4.4 9.6 2.0 5.7Rhode Island 49 1,720 98.0 51.0 10.2 4.1 16.3 12.2 6.1
South Carolina 42 12,816 100.0 40.5 0 0 0 4.8 54.8South Dakota 123 1,713 82.1 87.0 3.3 1.6 4.1 0.8 3.3Tennessee 187 4,404 100.0 86.1 4.8 1.6 2.1 0.5 4.8Texas 562 67,138 100.0 62.3 10.1 7.3 9.6 2.3 8.4Utah 70 9,754 100.0 55.7 5.7 12.9 14.3 2.9 8.6
Vermont 183 551 96.7 84.2 4.4 2.7 7.7 0.5 0.5Virginia 90 12,932 100.0 75.6 0 2.2 4.4 2.2 15.6Washington 66 6,354 95.5 83.3 3.0 0 3.0 3.0 7.6West Virginia 97 3,833 96.9 69.1 9.3 4.1 8.2 2.1 7.2Wisconsin 382 14,795 100.0 61.5 9.4 4.7 14.4 4.5 5.5Wyoming 23 9,884 100.0 52.2 8.7 4.3 8.7 13.0 13.01Response rate is the percentage of libraries that reported total capital expenditures. For item(s) with response rates below 100 percent, data for nonrespondents were imputed and areincluded in the table. NOTE: Detail may not sum to totals because of rounding. Data were not reported by the outlying areas (American Samoa, Guam, Northern Marianas, Puerto Rico, and VirginIslands).SOURCE: Institute of Museum and Library Services, Survey of Public Libraries in the United States, Fiscal Year 2007.
119

120
(Page is intentionally blank.)
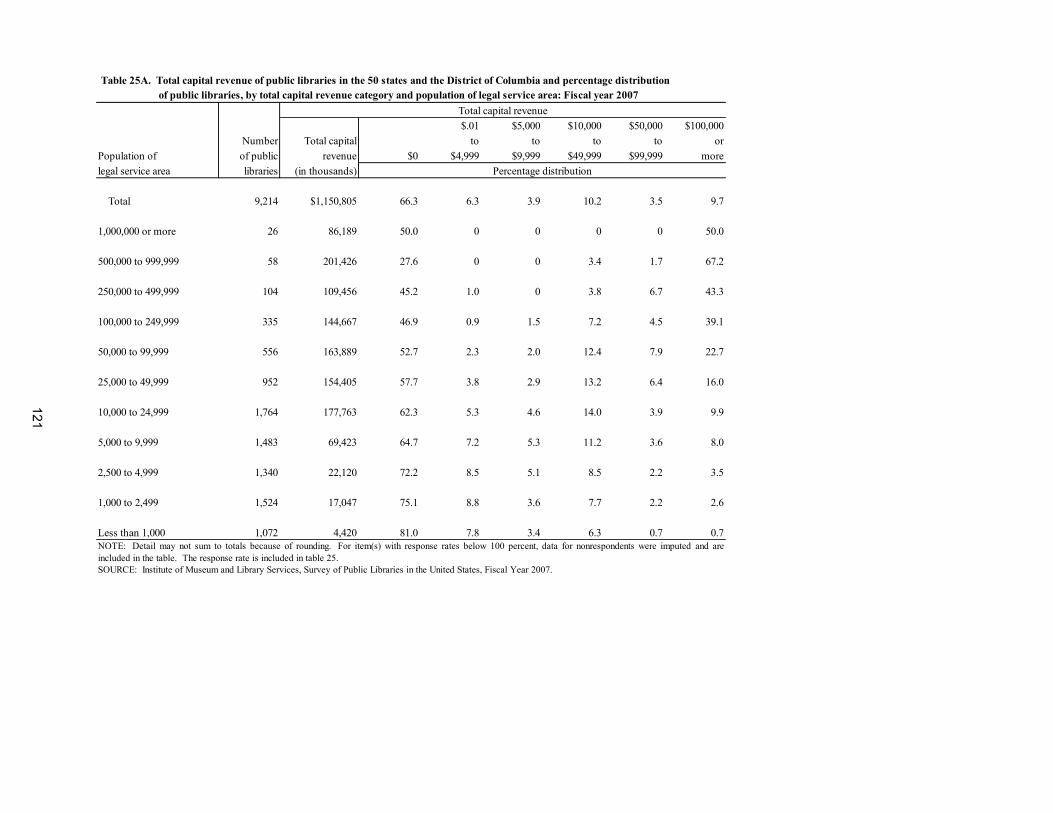
Table 24A. of public libraries, by total capital revenue category and population of legal service area: Fiscal year 2007
$.01 $5,000 $10,000 $50,000 $100,000Number Total capital to to to to or
Population of of public revenue $0 $4,999 $9,999 $49,999 $99,999 morelegal service area libraries (in thousands) Percentage distribution
Total 9,214 $1,150,805 66.3 6.3 3.9 10.2 3.5 9.7
1,000,000 or more 26 86,189 50.0 0 0 0 0 50.0 500,000 to 999,999 58 201,426 27.6 0 0 3.4 1.7 67.2 250,000 to 499,999 104 109,456 45.2 1.0 0 3.8 6.7 43.3 100,000 to 249,999 335 144,667 46.9 0.9 1.5 7.2 4.5 39.1 50,000 to 99,999 556 163,889 52.7 2.3 2.0 12.4 7.9 22.7 25,000 to 49,999 952 154,405 57.7 3.8 2.9 13.2 6.4 16.0 10,000 to 24,999 1,764 177,763 62.3 5.3 4.6 14.0 3.9 9.9 5,000 to 9,999 1,483 69,423 64.7 7.2 5.3 11.2 3.6 8.0 2,500 to 4,999 1,340 22,120 72.2 8.5 5.1 8.5 2.2 3.5 1,000 to 2,499 1,524 17,047 75.1 8.8 3.6 7.7 2.2 2.6 Less than 1,000 1,072 4,420 81.0 7.8 3.4 6.3 0.7 0.7
Table 25A. Total capital revenue of public libraries in the 50 states and the District of Columbia and percentage distribution
NOTE: Detail may not sum to totals because of rounding. For item(s) with response rates below 100 percent, data for nonrespondents were imputed and areincluded in the table. The response rate is included in table 25.SOURCE: Institute of Museum and Library Services, Survey of Public Libraries in the United States, Fiscal Year 2007.
Total capital revenue
121
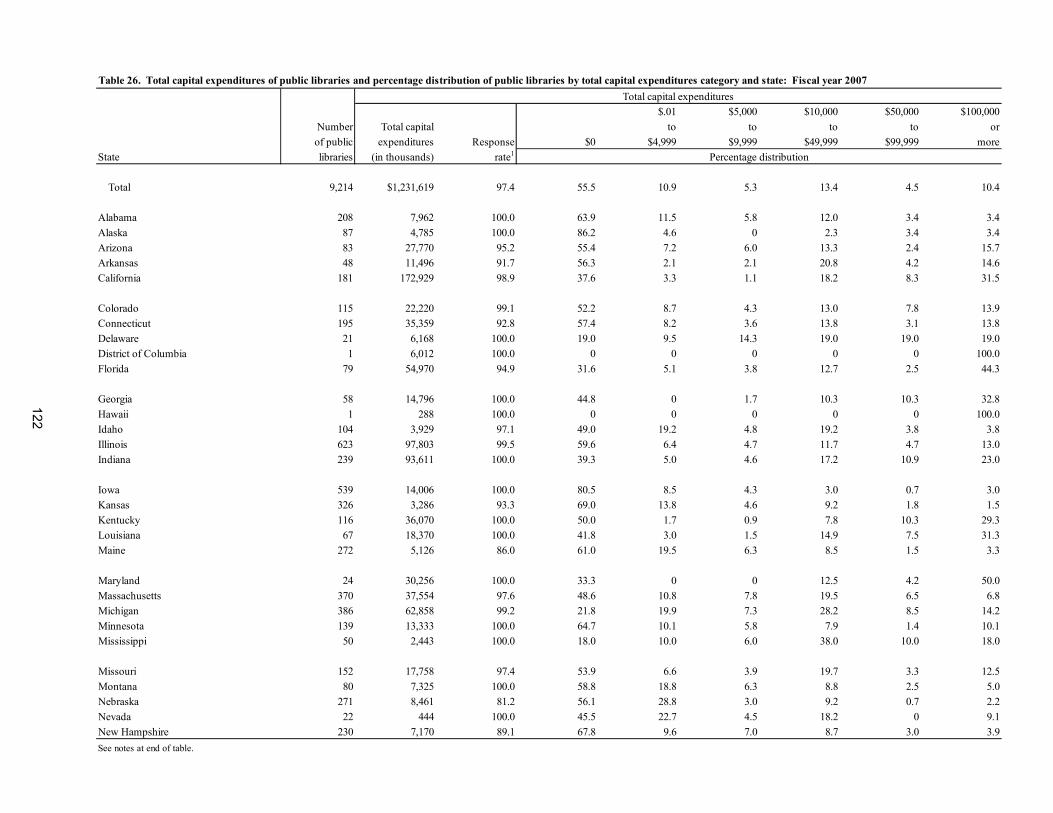
122
Total capital expenditures$.01 $5,000 $10,000 $50,000 $100,000
Number Total capital to to to to or of public expenditures Response $0 $4,999 $9,999 $49,999 $99,999 moreState libraries (in thousands) rate1 Percentage distribution
Total 9,214 $1,231,619 97.4 55.5 10.9 5.3 13.4 4.5 10.4
Alabama 208 7,962 100.0 63.9 11.5 5.8 12.0 3.4 3.4Alaska 87 4,785 100.0 86.2 4.6 0 2.3 3.4 3.4Arizona 83 27,770 95.2 55.4 7.2 6.0 13.3 2.4 15.7Arkansas 48 11,496 91.7 56.3 2.1 2.1 20.8 4.2 14.6California 181 172,929 98.9 37.6 3.3 1.1 18.2 8.3 31.5
Colorado 115 22,220 99.1 52.2 8.7 4.3 13.0 7.8 13.9Connecticut 195 35,359 92.8 57.4 8.2 3.6 13.8 3.1 13.8Delaware 21 6,168 100.0 19.0 9.5 14.3 19.0 19.0 19.0District of Columbia 1 6,012 100.0 0 0 0 0 0 100.0Florida 79 54,970 94.9 31.6 5.1 3.8 12.7 2.5 44.3
Georgia 58 14,796 100.0 44.8 0 1.7 10.3 10.3 32.8Hawaii 1 288 100.0 0 0 0 0 0 100.0Idaho 104 3,929 97.1 49.0 19.2 4.8 19.2 3.8 3.8Illinois 623 97,803 99.5 59.6 6.4 4.7 11.7 4.7 13.0Indiana 239 93,611 100.0 39.3 5.0 4.6 17.2 10.9 23.0
Iowa 539 14,006 100.0 80.5 8.5 4.3 3.0 0.7 3.0Kansas 326 3,286 93.3 69.0 13.8 4.6 9.2 1.8 1.5Kentucky 116 36,070 100.0 50.0 1.7 0.9 7.8 10.3 29.3Louisiana 67 18,370 100.0 41.8 3.0 1.5 14.9 7.5 31.3Maine 272 5,126 86.0 61.0 19.5 6.3 8.5 1.5 3.3
Maryland 24 30,256 100.0 33.3 0 0 12.5 4.2 50.0Massachusetts 370 37,554 97.6 48.6 10.8 7.8 19.5 6.5 6.8Michigan 386 62,858 99.2 21.8 19.9 7.3 28.2 8.5 14.2Minnesota 139 13,333 100.0 64.7 10.1 5.8 7.9 1.4 10.1Mississippi 50 2,443 100.0 18.0 10.0 6.0 38.0 10.0 18.0
Missouri 152 17,758 97.4 53.9 6.6 3.9 19.7 3.3 12.5Montana 80 7,325 100.0 58.8 18.8 6.3 8.8 2.5 5.0Nebraska 271 8,461 81.2 56.1 28.8 3.0 9.2 0.7 2.2Nevada 22 444 100.0 45.5 22.7 4.5 18.2 0 9.1New Hampshire 230 7,170 89.1 67.8 9.6 7.0 8.7 3.0 3.9See notes at end of table.
Table 26. Total capital expenditures of public libraries and percentage distribution of public libraries by total capital expenditures category and state: Fiscal year 2007
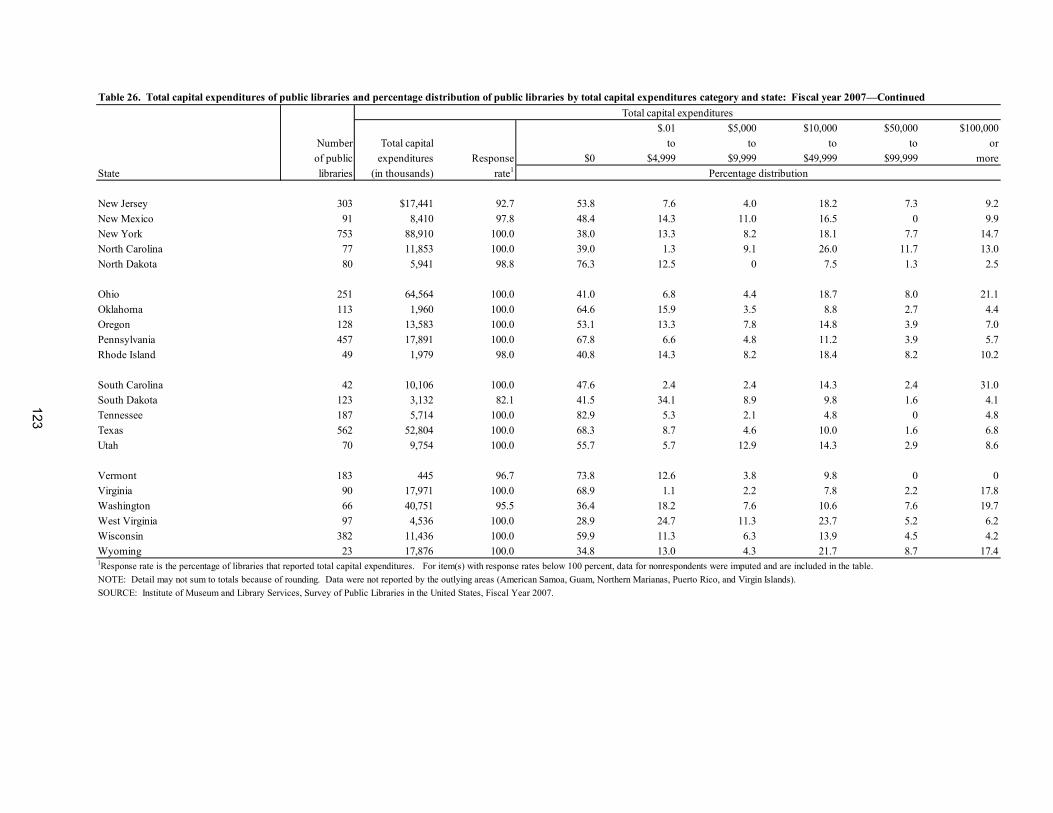
Total capital expenditures$.01 $5,000 $10,000 $50,000 $100,000
Number Total capital to to to to or of public expenditures Response $0 $4,999 $9,999 $49,999 $99,999 moreState libraries (in thousands) rate1 Percentage distribution
New Jersey 303 $17,441 92.7 53.8 7.6 4.0 18.2 7.3 9.2New Mexico 91 8,410 97.8 48.4 14.3 11.0 16.5 0 9.9New York 753 88,910 100.0 38.0 13.3 8.2 18.1 7.7 14.7North Carolina 77 11,853 100.0 39.0 1.3 9.1 26.0 11.7 13.0North Dakota 80 5,941 98.8 76.3 12.5 0 7.5 1.3 2.5
Ohio 251 64,564 100.0 41.0 6.8 4.4 18.7 8.0 21.1Oklahoma 113 1,960 100.0 64.6 15.9 3.5 8.8 2.7 4.4Oregon 128 13,583 100.0 53.1 13.3 7.8 14.8 3.9 7.0Pennsylvania 457 17,891 100.0 67.8 6.6 4.8 11.2 3.9 5.7Rhode Island 49 1,979 98.0 40.8 14.3 8.2 18.4 8.2 10.2
South Carolina 42 10,106 100.0 47.6 2.4 2.4 14.3 2.4 31.0South Dakota 123 3,132 82.1 41.5 34.1 8.9 9.8 1.6 4.1Tennessee 187 5,714 100.0 82.9 5.3 2.1 4.8 0 4.8Texas 562 52,804 100.0 68.3 8.7 4.6 10.0 1.6 6.8Utah 70 9,754 100.0 55.7 5.7 12.9 14.3 2.9 8.6
Vermont 183 445 96.7 73.8 12.6 3.8 9.8 0 0Virginia 90 17,971 100.0 68.9 1.1 2.2 7.8 2.2 17.8Washington 66 40,751 95.5 36.4 18.2 7.6 10.6 7.6 19.7West Virginia 97 4,536 100.0 28.9 24.7 11.3 23.7 5.2 6.2Wisconsin 382 11,436 100.0 59.9 11.3 6.3 13.9 4.5 4.2Wyoming 23 17,876 100.0 34.8 13.0 4.3 21.7 8.7 17.4
NOTE: Detail may not sum to totals because of rounding. Data were not reported by the outlying areas (American Samoa, Guam, Northern Marianas, Puerto Rico, and Virgin Islands).SOURCE: Institute of Museum and Library Services, Survey of Public Libraries in the United States, Fiscal Year 2007.
Table 26. Total capital expenditures of public libraries and percentage distribution of public libraries by total capital expenditures category and state: Fiscal year 2007—Continued
1Response rate is the percentage of libraries that reported total capital expenditures. For item(s) with response rates below 100 percent, data for nonrespondents were imputed and are included in the table.
123

124
(Page is intentionally blank.)
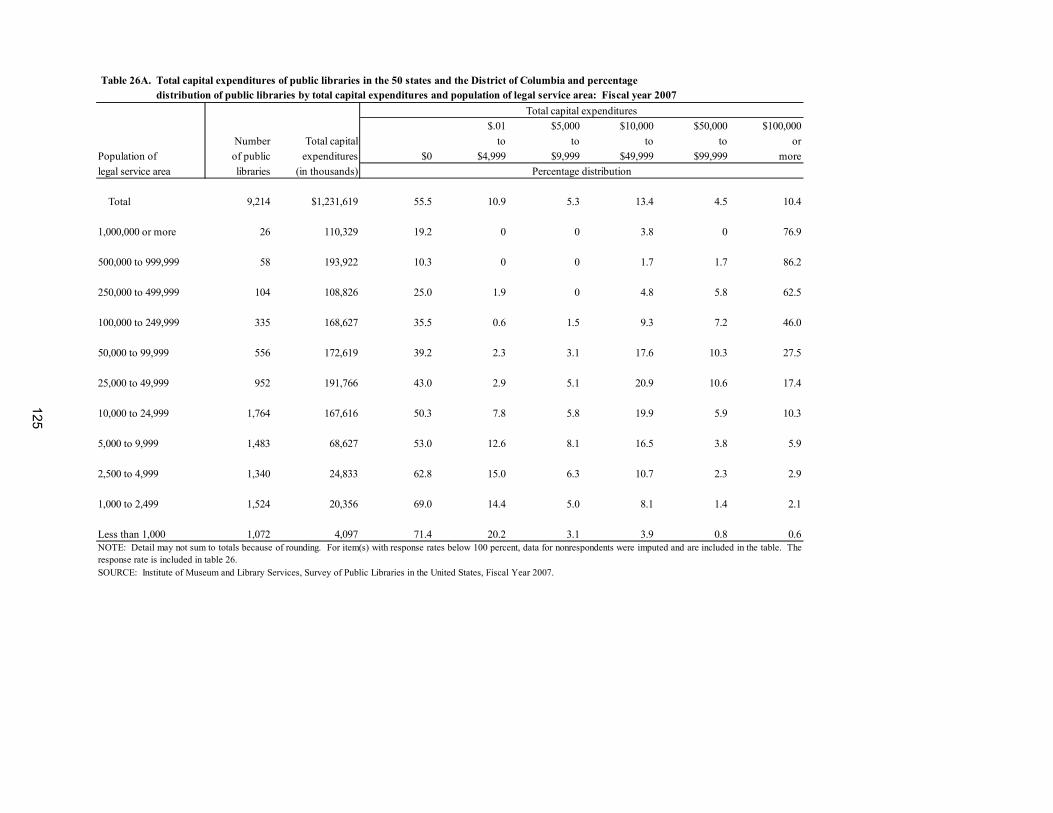
125
Table 25A. distribution of public libraries by total capital expenditures and population of legal service area: Fiscal year 2007Total capital expenditures
$.01 $5,000 $10,000 $50,000 $100,000Number Total capital to to to to or
Population of of public expenditures $0 $4,999 $9,999 $49,999 $99,999 morelegal service area libraries (in thousands) Percentage distribution
Total 9,214 $1,231,619 55.5 10.9 5.3 13.4 4.5 10.4
1,000,000 or more 26 110,329 19.2 0 0 3.8 0 76.9 500,000 to 999,999 58 193,922 10.3 0 0 1.7 1.7 86.2 250,000 to 499,999 104 108,826 25.0 1.9 0 4.8 5.8 62.5 100,000 to 249,999 335 168,627 35.5 0.6 1.5 9.3 7.2 46.0 50,000 to 99,999 556 172,619 39.2 2.3 3.1 17.6 10.3 27.5 25,000 to 49,999 952 191,766 43.0 2.9 5.1 20.9 10.6 17.4 10,000 to 24,999 1,764 167,616 50.3 7.8 5.8 19.9 5.9 10.3 5,000 to 9,999 1,483 68,627 53.0 12.6 8.1 16.5 3.8 5.9 2,500 to 4,999 1,340 24,833 62.8 15.0 6.3 10.7 2.3 2.9 1,000 to 2,499 1,524 20,356 69.0 14.4 5.0 8.1 1.4 2.1 Less than 1,000 1,072 4,097 71.4 20.2 3.1 3.9 0.8 0.6
Table 26A. Total capital expenditures of public libraries in the 50 states and the District of Columbia and percentage
NOTE: Detail may not sum to totals because of rounding. For item(s) with response rates below 100 percent, data for nonrespondents were imputed and are included in the table. Theresponse rate is included in table 26. SOURCE: Institute of Museum and Library Services, Survey of Public Libraries in the United States, Fiscal Year 2007.
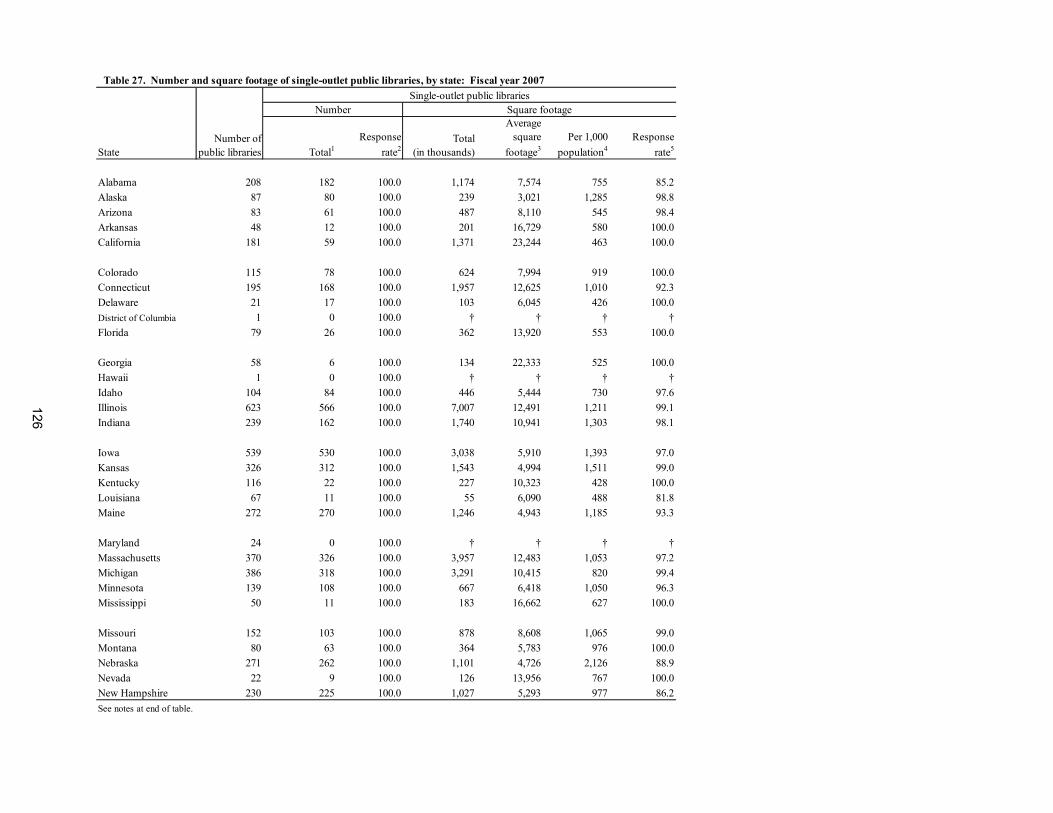
State Total1Response
rate2Total
(in thousands)
Average square
footage3Per 1,000
population4Response
rate5
Alabama 208 182 100.0 1,174 7,574 755 85.2Alaska 87 80 100.0 239 3,021 1,285 98.8Arizona 83 61 100.0 487 8,110 545 98.4Arkansas 48 12 100.0 201 16,729 580 100.0California 181 59 100.0 1,371 23,244 463 100.0
Colorado 115 78 100.0 624 7,994 919 100.0Connecticut 195 168 100.0 1,957 12,625 1,010 92.3Delaware 21 17 100.0 103 6,045 426 100.0District of Columbia 1 0 100.0 † † † †Florida 79 26 100.0 362 13,920 553 100.0
Georgia 58 6 100.0 134 22,333 525 100.0Hawaii 1 0 100.0 † † † †Idaho 104 84 100.0 446 5,444 730 97.6Illinois 623 566 100.0 7,007 12,491 1,211 99.1Indiana 239 162 100.0 1,740 10,941 1,303 98.1
Iowa 539 530 100.0 3,038 5,910 1,393 97.0Kansas 326 312 100.0 1,543 4,994 1,511 99.0Kentucky 116 22 100.0 227 10,323 428 100.0Louisiana 67 11 100.0 55 6,090 488 81.8Maine 272 270 100.0 1,246 4,943 1,185 93.3
Maryland 24 0 100.0 † † † †Massachusetts 370 326 100.0 3,957 12,483 1,053 97.2Michigan 386 318 100.0 3,291 10,415 820 99.4Minnesota 139 108 100.0 667 6,418 1,050 96.3Mississippi 50 11 100.0 183 16,662 627 100.0
Missouri 152 103 100.0 878 8,608 1,065 99.0Montana 80 63 100.0 364 5,783 976 100.0Nebraska 271 262 100.0 1,101 4,726 2,126 88.9Nevada 22 9 100.0 126 13,956 767 100.0New Hampshire 230 225 100.0 1,027 5,293 977 86.2See notes at end of table.
Table 27. Number and square footage of single-outlet public libraries, by state: Fiscal year 2007
Number of public libraries
Single-outlet public librariesNumber Square footage
126
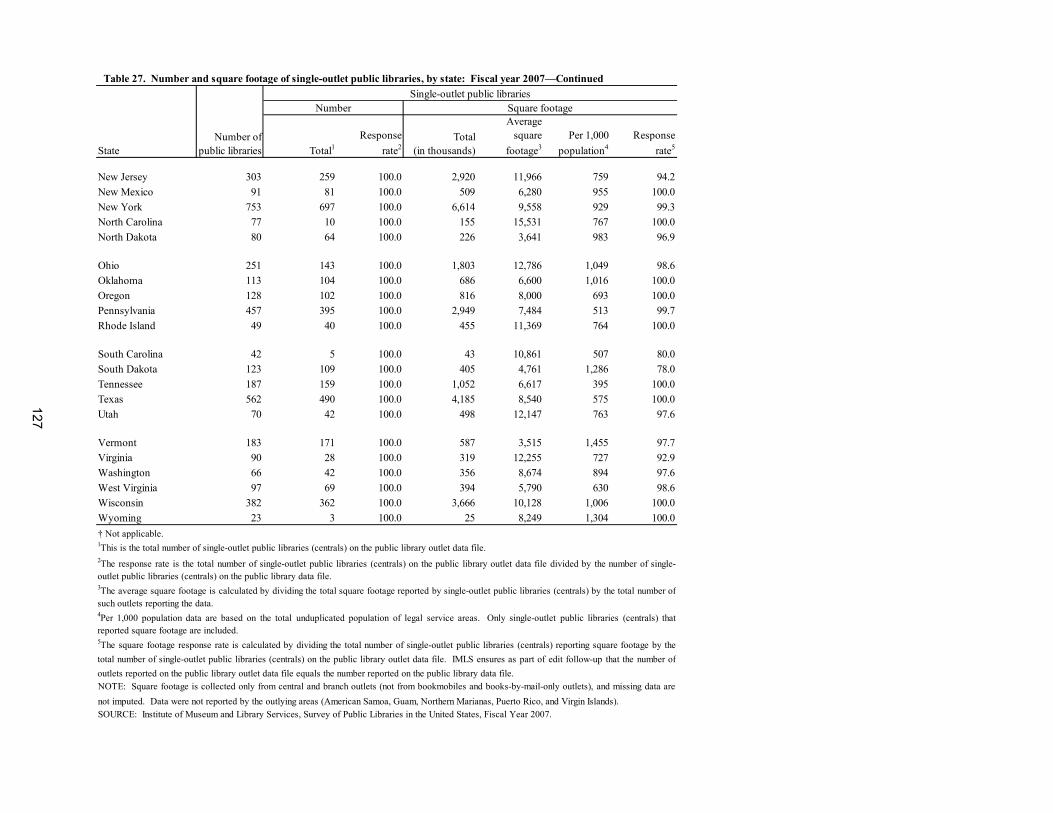
Table 27. Number and square footage of single-outlet public libraries, by state: Fiscal year 2007—Continued
State Total1Response
rate2Total
(in thousands)
Average square
footage3Per 1,000
population4Response
rate5
New Jersey 303 259 100.0 2,920 11,966 759 94.2New Mexico 91 81 100.0 509 6,280 955 100.0New York 753 697 100.0 6,614 9,558 929 99.3North Carolina 77 10 100.0 155 15,531 767 100.0North Dakota 80 64 100.0 226 3,641 983 96.9
Ohio 251 143 100.0 1,803 12,786 1,049 98.6Oklahoma 113 104 100.0 686 6,600 1,016 100.0Oregon 128 102 100.0 816 8,000 693 100.0Pennsylvania 457 395 100.0 2,949 7,484 513 99.7Rhode Island 49 40 100.0 455 11,369 764 100.0
South Carolina 42 5 100.0 43 10,861 507 80.0South Dakota 123 109 100.0 405 4,761 1,286 78.0Tennessee 187 159 100.0 1,052 6,617 395 100.0Texas 562 490 100.0 4,185 8,540 575 100.0Utah 70 42 100.0 498 12,147 763 97.6
Vermont 183 171 100.0 587 3,515 1,455 97.7Virginia 90 28 100.0 319 12,255 727 92.9Washington 66 42 100.0 356 8,674 894 97.6West Virginia 97 69 100.0 394 5,790 630 98.6Wisconsin 382 362 100.0 3,666 10,128 1,006 100.0Wyoming 23 3 100.0 25 8,249 1,304 100.0
5The square footage response rate is calculated by dividing the total number of single-outlet public libraries (centrals) reporting square footage by thetotal number of single-outlet public libraries (centrals) on the public library outlet data file. IMLS ensures as part of edit follow-up that the number ofoutlets reported on the public library outlet data file equals the number reported on the public library data file.
SOURCE: Institute of Museum and Library Services, Survey of Public Libraries in the United States, Fiscal Year 2007.
1This is the total number of single-outlet public libraries (centrals) on the public library outlet data file.2The response rate is the total number of single-outlet public libraries (centrals) on the public library outlet data file divided by the number of single-outlet public libraries (centrals) on the public library data file.3The average square footage is calculated by dividing the total square footage reported by single-outlet public libraries (centrals) by the total number ofsuch outlets reporting the data. 4Per 1,000 population data are based on the total unduplicated population of legal service areas. Only single-outlet public libraries (centrals) thatreported square footage are included.
NOTE: Square footage is collected only from central and branch outlets (not from bookmobiles and books-by-mail-only outlets), and missing data arenot imputed. Data were not reported by the outlying areas (American Samoa, Guam, Northern Marianas, Puerto Rico, and Virgin Islands).
† Not applicable.
Single-outlet public libraries
Number of public libraries
Number Square footage
127

128
(Page is intentionally blank.)
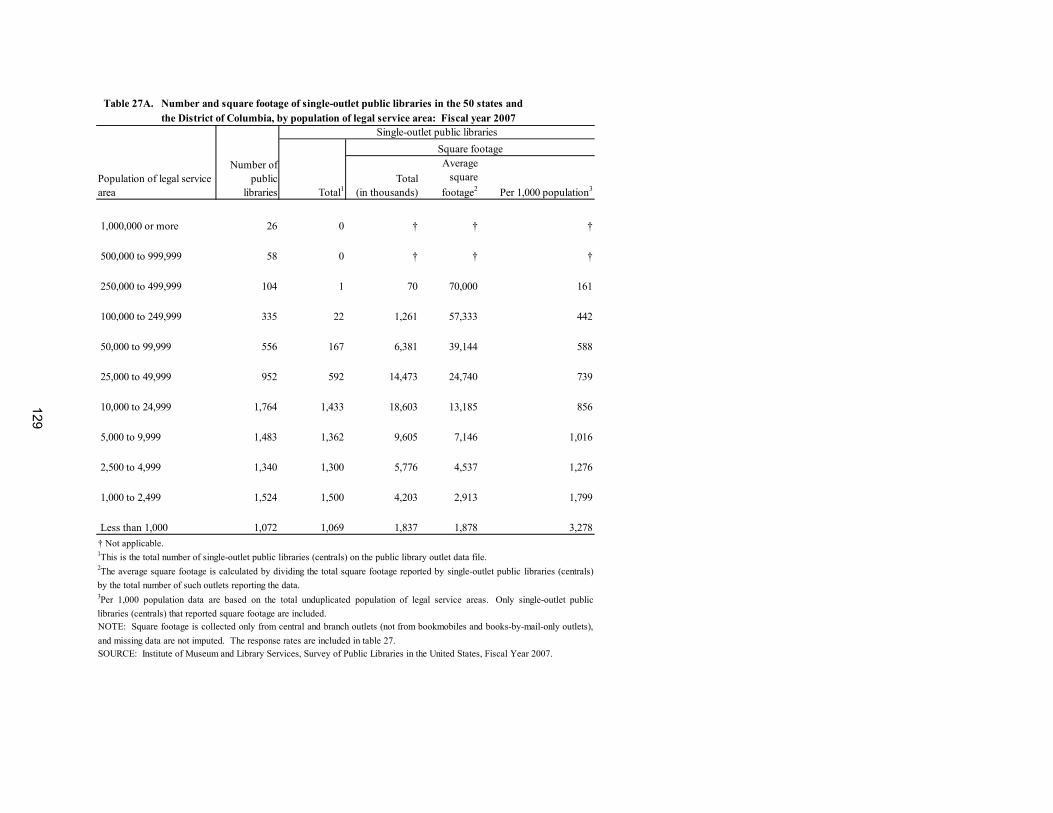
129
Table 27A. Number and square footage of single-outlet public libraries in the 50 states and Table 26A. the District of Columbia, by population of legal service area: Fiscal year 2007
Total1Total
(in thousands)
Average square
footage2 Per 1,000 population3
1,000,000 or more 26 0 † † †
500,000 to 999,999 58 0 † † †
250,000 to 499,999 104 1 70 70,000 161
100,000 to 249,999 335 22 1,261 57,333 442
50,000 to 99,999 556 167 6,381 39,144 588
25,000 to 49,999 952 592 14,473 24,740 739
10,000 to 24,999 1,764 1,433 18,603 13,185 856
5,000 to 9,999 1,483 1,362 9,605 7,146 1,016
2,500 to 4,999 1,340 1,300 5,776 4,537 1,276
1,000 to 2,499 1,524 1,500 4,203 2,913 1,799
Less than 1,000 1,072 1,069 1,837 1,878 3,278
Square footage
Population of legal service area
Number of public
libraries
SOURCE: Institute of Museum and Library Services, Survey of Public Libraries in the United States, Fiscal Year 2007.
2The average square footage is calculated by dividing the total square footage reported by single-outlet public libraries (centrals)by the total number of such outlets reporting the data.
NOTE: Square footage is collected only from central and branch outlets (not from bookmobiles and books-by-mail-only outlets),and missing data are not imputed. The response rates are included in table 27.
3Per 1,000 population data are based on the total unduplicated population of legal service areas. Only single-outlet publiclibraries (centrals) that reported square footage are included.
1This is the total number of single-outlet public libraries (centrals) on the public library outlet data file.† Not applicable.
Single-outlet public libraries
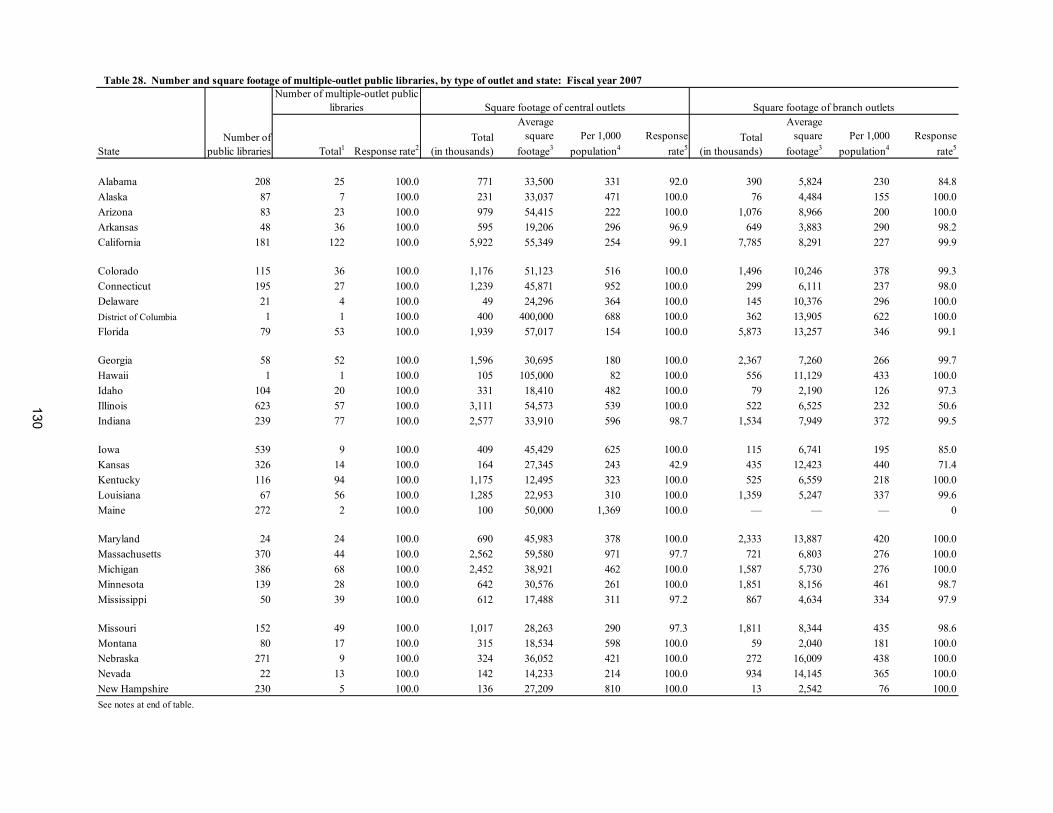
Table 28. Number and square footage of multiple-outlet public libraries, by type of outlet and state: Fiscal year 2007
Total1 Response rate2Total
(in thousands)
Average square
footage3Per 1,000
population4Response
rate5Total
(in thousands)
Average square
footage3Per 1,000
population4Response
rate5
Alabama 208 25 100.0 771 33,500 331 92.0 390 5,824 230 84.8Alaska 87 7 100.0 231 33,037 471 100.0 76 4,484 155 100.0Arizona 83 23 100.0 979 54,415 222 100.0 1,076 8,966 200 100.0Arkansas 48 36 100.0 595 19,206 296 96.9 649 3,883 290 98.2California 181 122 100.0 5,922 55,349 254 99.1 7,785 8,291 227 99.9
Colorado 115 36 100.0 1,176 51,123 516 100.0 1,496 10,246 378 99.3Connecticut 195 27 100.0 1,239 45,871 952 100.0 299 6,111 237 98.0Delaware 21 4 100.0 49 24,296 364 100.0 145 10,376 296 100.0District of Columbia 1 1 100.0 400 400,000 688 100.0 362 13,905 622 100.0Florida 79 53 100.0 1,939 57,017 154 100.0 5,873 13,257 346 99.1
Georgia 58 52 100.0 1,596 30,695 180 100.0 2,367 7,260 266 99.7Hawaii 1 1 100.0 105 105,000 82 100.0 556 11,129 433 100.0Idaho 104 20 100.0 331 18,410 482 100.0 79 2,190 126 97.3Illinois 623 57 100.0 3,111 54,573 539 100.0 522 6,525 232 50.6Indiana 239 77 100.0 2,577 33,910 596 98.7 1,534 7,949 372 99.5
Iowa 539 9 100.0 409 45,429 625 100.0 115 6,741 195 85.0Kansas 326 14 100.0 164 27,345 243 42.9 435 12,423 440 71.4Kentucky 116 94 100.0 1,175 12,495 323 100.0 525 6,559 218 100.0Louisiana 67 56 100.0 1,285 22,953 310 100.0 1,359 5,247 337 99.6Maine 272 2 100.0 100 50,000 1,369 100.0 — — — 0
Maryland 24 24 100.0 690 45,983 378 100.0 2,333 13,887 420 100.0Massachusetts 370 44 100.0 2,562 59,580 971 97.7 721 6,803 276 100.0Michigan 386 68 100.0 2,452 38,921 462 100.0 1,587 5,730 276 100.0Minnesota 139 28 100.0 642 30,576 261 100.0 1,851 8,156 461 98.7Mississippi 50 39 100.0 612 17,488 311 97.2 867 4,634 334 97.9
Missouri 152 49 100.0 1,017 28,263 290 97.3 1,811 8,344 435 98.6Montana 80 17 100.0 315 18,534 598 100.0 59 2,040 181 100.0Nebraska 271 9 100.0 324 36,052 421 100.0 272 16,009 438 100.0Nevada 22 13 100.0 142 14,233 214 100.0 934 14,145 365 100.0New Hampshire 230 5 100.0 136 27,209 810 100.0 13 2,542 76 100.0See notes at end of table.
Square footage of branch outlets
StateNumber of
public libraries
Number of multiple-outlet public libraries Square footage of central outlets
130
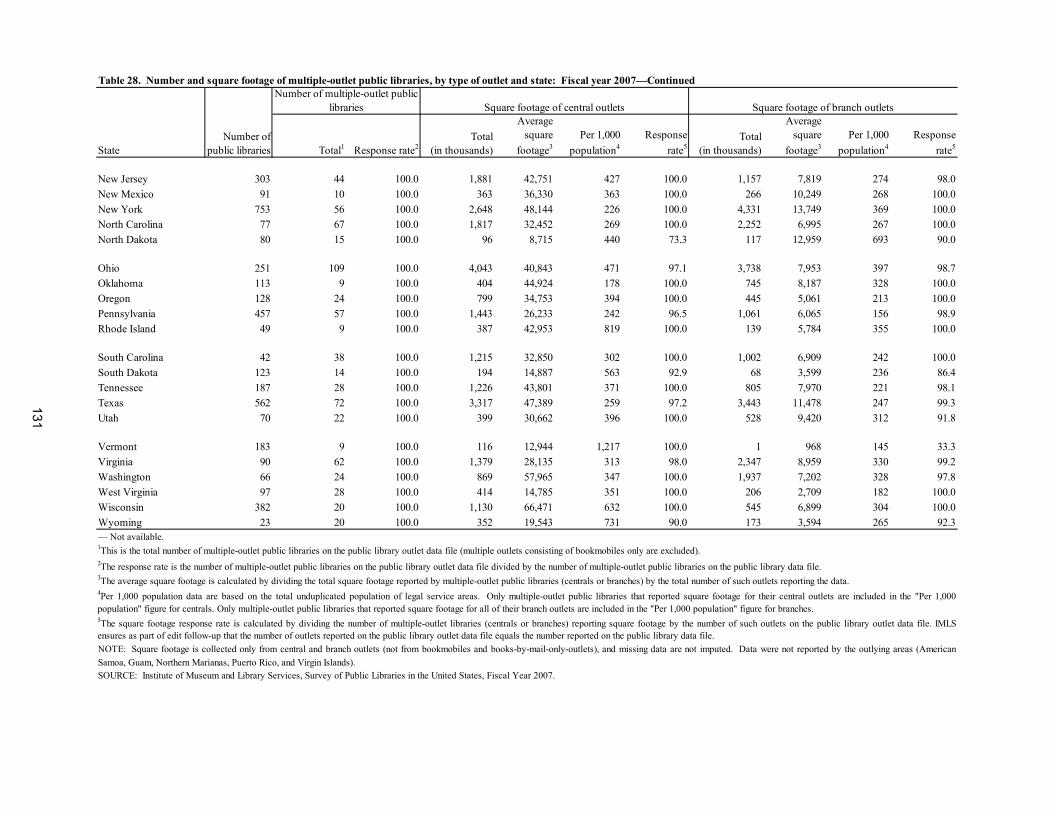
Table 28. Number and square footage of multiple-outlet public libraries, by type of outlet and state: Fiscal year 2007—Continued
Total1 Response rate2Total
(in thousands)
Average square
footage3Per 1,000
population4Response
rate5Total
(in thousands)
Average square
footage3Per 1,000
population4Response
rate5
New Jersey 303 44 100.0 1,881 42,751 427 100.0 1,157 7,819 274 98.0New Mexico 91 10 100.0 363 36,330 363 100.0 266 10,249 268 100.0New York 753 56 100.0 2,648 48,144 226 100.0 4,331 13,749 369 100.0North Carolina 77 67 100.0 1,817 32,452 269 100.0 2,252 6,995 267 100.0North Dakota 80 15 100.0 96 8,715 440 73.3 117 12,959 693 90.0
Ohio 251 109 100.0 4,043 40,843 471 97.1 3,738 7,953 397 98.7Oklahoma 113 9 100.0 404 44,924 178 100.0 745 8,187 328 100.0Oregon 128 24 100.0 799 34,753 394 100.0 445 5,061 213 100.0Pennsylvania 457 57 100.0 1,443 26,233 242 96.5 1,061 6,065 156 98.9Rhode Island 49 9 100.0 387 42,953 819 100.0 139 5,784 355 100.0
South Carolina 42 38 100.0 1,215 32,850 302 100.0 1,002 6,909 242 100.0South Dakota 123 14 100.0 194 14,887 563 92.9 68 3,599 236 86.4Tennessee 187 28 100.0 1,226 43,801 371 100.0 805 7,970 221 98.1Texas 562 72 100.0 3,317 47,389 259 97.2 3,443 11,478 247 99.3Utah 70 22 100.0 399 30,662 396 100.0 528 9,420 312 91.8
Vermont 183 9 100.0 116 12,944 1,217 100.0 1 968 145 33.3Virginia 90 62 100.0 1,379 28,135 313 98.0 2,347 8,959 330 99.2Washington 66 24 100.0 869 57,965 347 100.0 1,937 7,202 328 97.8West Virginia 97 28 100.0 414 14,785 351 100.0 206 2,709 182 100.0Wisconsin 382 20 100.0 1,130 66,471 632 100.0 545 6,899 304 100.0Wyoming 23 20 100.0 352 19,543 731 90.0 173 3,594 265 92.3— Not available.
5The square footage response rate is calculated by dividing the number of multiple-outlet libraries (centrals or branches) reporting square footage by the number of such outlets on the public library outlet data file. IMLSensures as part of edit follow-up that the number of outlets reported on the public library outlet data file equals the number reported on the public library data file.NOTE: Square footage is collected only from central and branch outlets (not from bookmobiles and books-by-mail-only-outlets), and missing data are not imputed. Data were not reported by the outlying areas (AmericanSamoa, Guam, Northern Marianas, Puerto Rico, and Virgin Islands).SOURCE: Institute of Museum and Library Services, Survey of Public Libraries in the United States, Fiscal Year 2007.
1This is the total number of multiple-outlet public libraries on the public library outlet data file (multiple outlets consisting of bookmobiles only are excluded).2The response rate is the number of multiple-outlet public libraries on the public library outlet data file divided by the number of multiple-outlet public libraries on the public library data file.3The average square footage is calculated by dividing the total square footage reported by multiple-outlet public libraries (centrals or branches) by the total number of such outlets reporting the data.4Per 1,000 population data are based on the total unduplicated population of legal service areas. Only multiple-outlet public libraries that reported square footage for their central outlets are included in the "Per 1,000population" figure for centrals. Only multiple-outlet public libraries that reported square footage for all of their branch outlets are included in the "Per 1,000 population" figure for branches.
StateNumber of
public libraries
Number of multiple-outlet public libraries Square footage of central outlets Square footage of branch outlets
131

132
(Page is intentionally blank.)
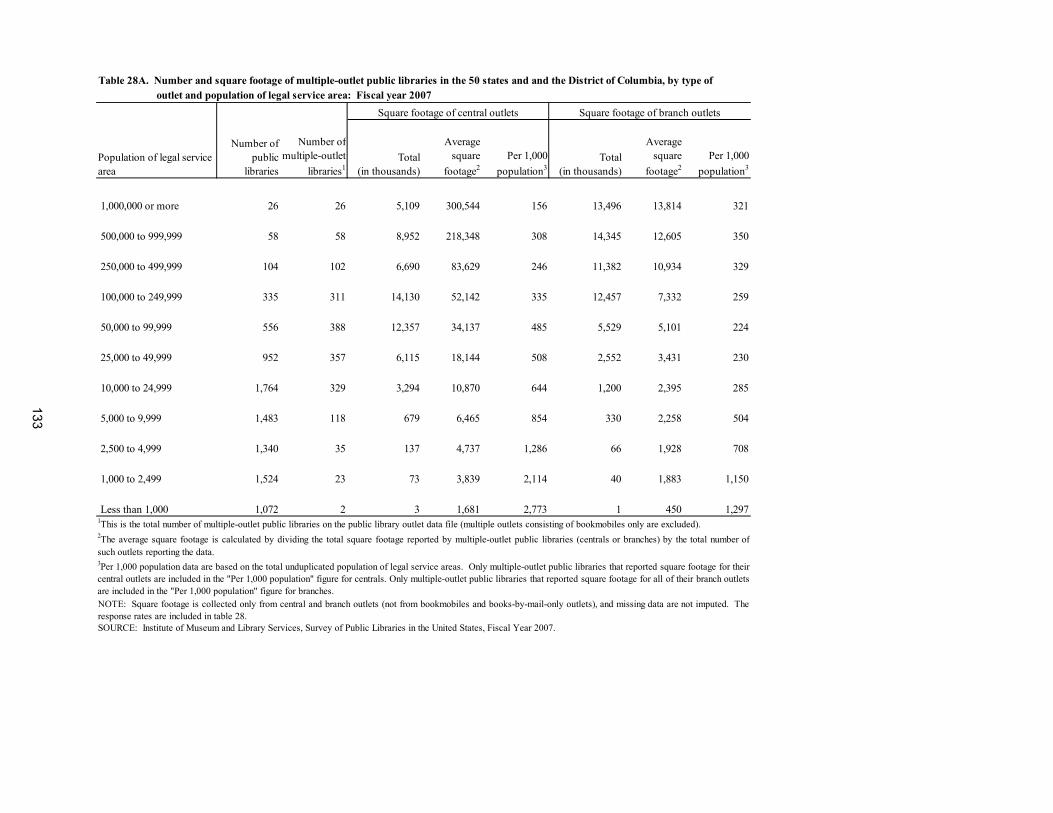
Table 28A. Number and square footage of multiple-outlet public libraries in the 50 states and and the District of Columbia, by type ofTable 27A. outlet and population of legal service area: Fiscal year 2007
Number of multiple-outlet
libraries1Total
(in thousands)
Average square
footage2Per 1,000
population3Total
(in thousands)
Average square
footage2Per 1,000
population3
1,000,000 or more 26 26 5,109 300,544 156 13,496 13,814 321
500,000 to 999,999 58 58 8,952 218,348 308 14,345 12,605 350
250,000 to 499,999 104 102 6,690 83,629 246 11,382 10,934 329
100,000 to 249,999 335 311 14,130 52,142 335 12,457 7,332 259
50,000 to 99,999 556 388 12,357 34,137 485 5,529 5,101 224
25,000 to 49,999 952 357 6,115 18,144 508 2,552 3,431 230
10,000 to 24,999 1,764 329 3,294 10,870 644 1,200 2,395 285
5,000 to 9,999 1,483 118 679 6,465 854 330 2,258 504
2,500 to 4,999 1,340 35 137 4,737 1,286 66 1,928 708
1,000 to 2,499 1,524 23 73 3,839 2,114 40 1,883 1,150
Less than 1,000 1,072 2 3 1,681 2,773 1 450 1,297
3Per 1,000 population data are based on the total unduplicated population of legal service areas. Only multiple-outlet public libraries that reported square footage for theircentral outlets are included in the "Per 1,000 population" figure for centrals. Only multiple-outlet public libraries that reported square footage for all of their branch outletsare included in the "Per 1,000 population" figure for branches. NOTE: Square footage is collected only from central and branch outlets (not from bookmobiles and books-by-mail-only outlets), and missing data are not imputed. Theresponse rates are included in table 28.SOURCE: Institute of Museum and Library Services, Survey of Public Libraries in the United States, Fiscal Year 2007.
Number of public
libraries
Square footage of central outlets Square footage of branch outlets
Population of legal service area
1This is the total number of multiple-outlet public libraries on the public library outlet data file (multiple outlets consisting of bookmobiles only are excluded).2The average square footage is calculated by dividing the total square footage reported by multiple-outlet public libraries (centrals or branches) by the total number ofsuch outlets reporting the data.
133
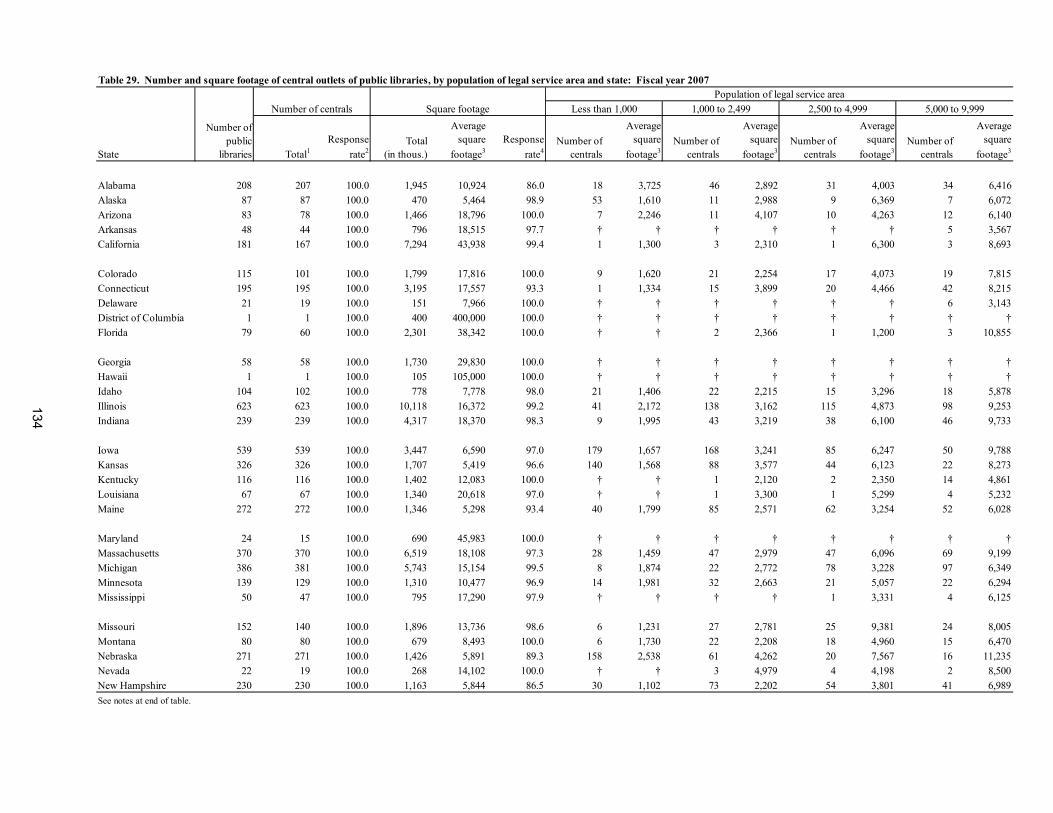
134
Table 29. Number and square footage of central outlets of public libraries, by population of legal service area and state: Fiscal year 2007Population of legal service area
Less than 1,000 1,000 to 2,499 2,500 to 4,999 5,000 to 9,999
Total1Response
rate2Total
(in thous.)
Average square
footage3Response
rate4Number of
centrals
Average square
footage3Number of
centrals
Average square
footage3Number of
centrals
Average square
footage3Number of
centrals
Average square
footage3
Alabama 208 207 100.0 1,945 10,924 86.0 18 3,725 46 2,892 31 4,003 34 6,416Alaska 87 87 100.0 470 5,464 98.9 53 1,610 11 2,988 9 6,369 7 6,072Arizona 83 78 100.0 1,466 18,796 100.0 7 2,246 11 4,107 10 4,263 12 6,140Arkansas 48 44 100.0 796 18,515 97.7 † † † † † † 5 3,567California 181 167 100.0 7,294 43,938 99.4 1 1,300 3 2,310 1 6,300 3 8,693
Colorado 115 101 100.0 1,799 17,816 100.0 9 1,620 21 2,254 17 4,073 19 7,815Connecticut 195 195 100.0 3,195 17,557 93.3 1 1,334 15 3,899 20 4,466 42 8,215Delaware 21 19 100.0 151 7,966 100.0 † † † † † † 6 3,143District of Columbia 1 1 100.0 400 400,000 100.0 † † † † † † † †Florida 79 60 100.0 2,301 38,342 100.0 † † 2 2,366 1 1,200 3 10,855
Georgia 58 58 100.0 1,730 29,830 100.0 † † † † † † † †Hawaii 1 1 100.0 105 105,000 100.0 † † † † † † † †Idaho 104 102 100.0 778 7,778 98.0 21 1,406 22 2,215 15 3,296 18 5,878Illinois 623 623 100.0 10,118 16,372 99.2 41 2,172 138 3,162 115 4,873 98 9,253Indiana 239 239 100.0 4,317 18,370 98.3 9 1,995 43 3,219 38 6,100 46 9,733
Iowa 539 539 100.0 3,447 6,590 97.0 179 1,657 168 3,241 85 6,247 50 9,788Kansas 326 326 100.0 1,707 5,419 96.6 140 1,568 88 3,577 44 6,123 22 8,273Kentucky 116 116 100.0 1,402 12,083 100.0 † † 1 2,120 2 2,350 14 4,861Louisiana 67 67 100.0 1,340 20,618 97.0 † † 1 3,300 1 5,299 4 5,232Maine 272 272 100.0 1,346 5,298 93.4 40 1,799 85 2,571 62 3,254 52 6,028
Maryland 24 15 100.0 690 45,983 100.0 † † † † † † † †Massachusetts 370 370 100.0 6,519 18,108 97.3 28 1,459 47 2,979 47 6,096 69 9,199Michigan 386 381 100.0 5,743 15,154 99.5 8 1,874 22 2,772 78 3,228 97 6,349Minnesota 139 129 100.0 1,310 10,477 96.9 14 1,981 32 2,663 21 5,057 22 6,294Mississippi 50 47 100.0 795 17,290 97.9 † † † † 1 3,331 4 6,125
Missouri 152 140 100.0 1,896 13,736 98.6 6 1,231 27 2,781 25 9,381 24 8,005Montana 80 80 100.0 679 8,493 100.0 6 1,730 22 2,208 18 4,960 15 6,470Nebraska 271 271 100.0 1,426 5,891 89.3 158 2,538 61 4,262 20 7,567 16 11,235Nevada 22 19 100.0 268 14,102 100.0 † † 3 4,979 4 4,198 2 8,500New Hampshire 230 230 100.0 1,163 5,844 86.5 30 1,102 73 2,202 54 3,801 41 6,989See notes at end of table.
Number of public
libraries
Square footageNumber of centrals
State
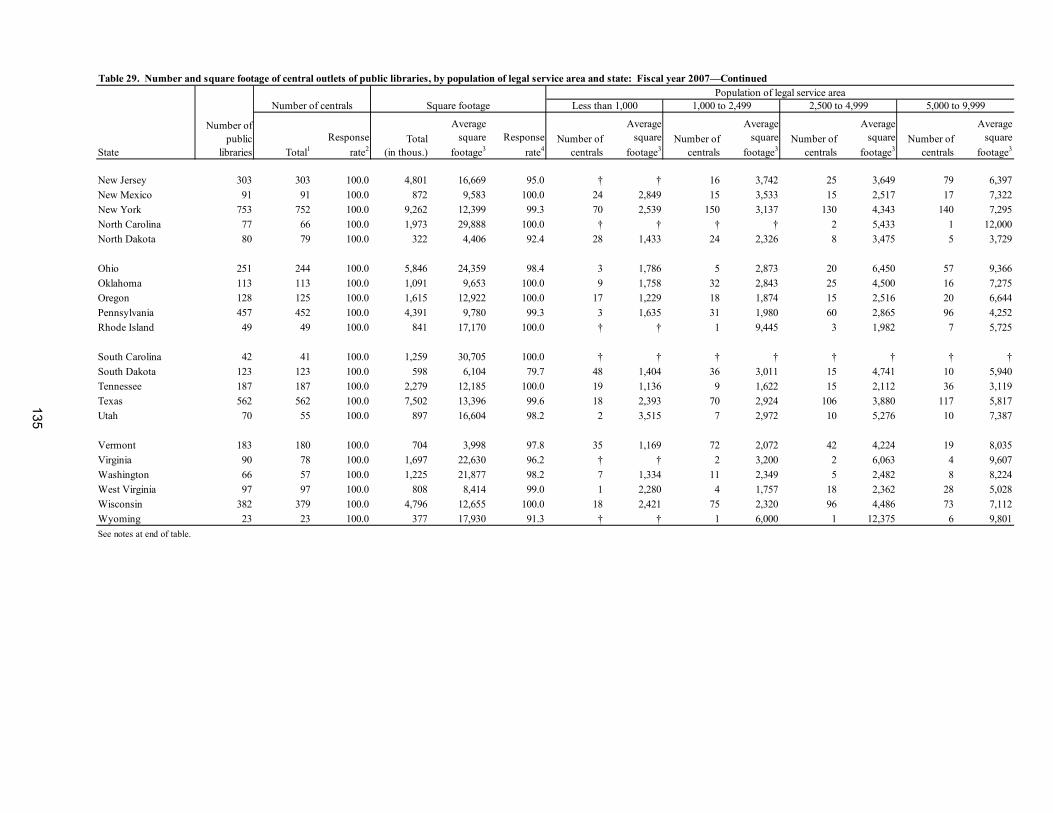
Table 29. Number and square footage of central outlets of public libraries, by population of legal service area and state: Fiscal year 2007—ContinuedPopulation of legal service area
Less than 1,000 1,000 to 2,499 2,500 to 4,999 5,000 to 9,999
Total1Response
rate2Total
(in thous.)
Average square
footage3Response
rate4Number of
centrals
Average square
footage3Number of
centrals
Average square
footage3Number of
centrals
Average square
footage3Number of
centrals
Average square
footage3
New Jersey 303 303 100.0 4,801 16,669 95.0 † † 16 3,742 25 3,649 79 6,397New Mexico 91 91 100.0 872 9,583 100.0 24 2,849 15 3,533 15 2,517 17 7,322New York 753 752 100.0 9,262 12,399 99.3 70 2,539 150 3,137 130 4,343 140 7,295North Carolina 77 66 100.0 1,973 29,888 100.0 † † † † 2 5,433 1 12,000North Dakota 80 79 100.0 322 4,406 92.4 28 1,433 24 2,326 8 3,475 5 3,729
Ohio 251 244 100.0 5,846 24,359 98.4 3 1,786 5 2,873 20 6,450 57 9,366Oklahoma 113 113 100.0 1,091 9,653 100.0 9 1,758 32 2,843 25 4,500 16 7,275Oregon 128 125 100.0 1,615 12,922 100.0 17 1,229 18 1,874 15 2,516 20 6,644Pennsylvania 457 452 100.0 4,391 9,780 99.3 3 1,635 31 1,980 60 2,865 96 4,252Rhode Island 49 49 100.0 841 17,170 100.0 † † 1 9,445 3 1,982 7 5,725
South Carolina 42 41 100.0 1,259 30,705 100.0 † † † † † † † †South Dakota 123 123 100.0 598 6,104 79.7 48 1,404 36 3,011 15 4,741 10 5,940Tennessee 187 187 100.0 2,279 12,185 100.0 19 1,136 9 1,622 15 2,112 36 3,119Texas 562 562 100.0 7,502 13,396 99.6 18 2,393 70 2,924 106 3,880 117 5,817Utah 70 55 100.0 897 16,604 98.2 2 3,515 7 2,972 10 5,276 10 7,387
Vermont 183 180 100.0 704 3,998 97.8 35 1,169 72 2,072 42 4,224 19 8,035Virginia 90 78 100.0 1,697 22,630 96.2 † † 2 3,200 2 6,063 4 9,607Washington 66 57 100.0 1,225 21,877 98.2 7 1,334 11 2,349 5 2,482 8 8,224West Virginia 97 97 100.0 808 8,414 99.0 1 2,280 4 1,757 18 2,362 28 5,028Wisconsin 382 379 100.0 4,796 12,655 100.0 18 2,421 75 2,320 96 4,486 73 7,112Wyoming 23 23 100.0 377 17,930 91.3 † † 1 6,000 1 12,375 6 9,801See notes at end of table.
Number of public
libraries
Square footage
State
Number of centrals
135
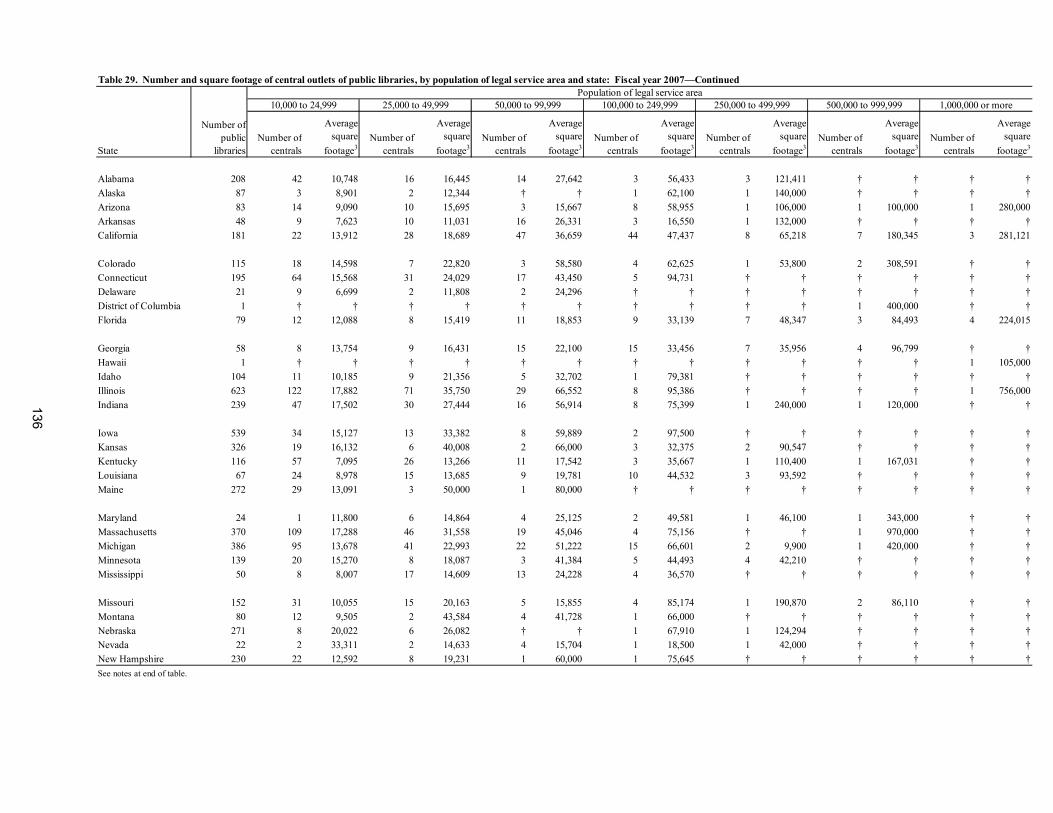
Table 29. Number and square footage of central outlets of public libraries, by population of legal service area and state: Fiscal year 2007—ContinuedPopulation of legal service area
10,000 to 24,999 25,000 to 49,999 50,000 to 99,999 100,000 to 249,999 250,000 to 499,999 500,000 to 999,999 1,000,000 or more
Number of centrals
Average square
footage3Number of
centrals
Average square
footage3Number of
centrals
Average square
footage3Number of
centrals
Average square
footage3Number of
centrals
Average square
footage3Number of
centrals
Average square
footage3Number of
centrals
Average square
footage3
Alabama 208 42 10,748 16 16,445 14 27,642 3 56,433 3 121,411 † † † †Alaska 87 3 8,901 2 12,344 † † 1 62,100 1 140,000 † † † †Arizona 83 14 9,090 10 15,695 3 15,667 8 58,955 1 106,000 1 100,000 1 280,000Arkansas 48 9 7,623 10 11,031 16 26,331 3 16,550 1 132,000 † † † †California 181 22 13,912 28 18,689 47 36,659 44 47,437 8 65,218 7 180,345 3 281,121
Colorado 115 18 14,598 7 22,820 3 58,580 4 62,625 1 53,800 2 308,591 † †Connecticut 195 64 15,568 31 24,029 17 43,450 5 94,731 † † † † † †Delaware 21 9 6,699 2 11,808 2 24,296 † † † † † † † †District of Columbia 1 † † † † † † † † † † 1 400,000 † †Florida 79 12 12,088 8 15,419 11 18,853 9 33,139 7 48,347 3 84,493 4 224,015
Georgia 58 8 13,754 9 16,431 15 22,100 15 33,456 7 35,956 4 96,799 † †Hawaii 1 † † † † † † † † † † † † 1 105,000Idaho 104 11 10,185 9 21,356 5 32,702 1 79,381 † † † † † †Illinois 623 122 17,882 71 35,750 29 66,552 8 95,386 † † † † 1 756,000Indiana 239 47 17,502 30 27,444 16 56,914 8 75,399 1 240,000 1 120,000 † †
Iowa 539 34 15,127 13 33,382 8 59,889 2 97,500 † † † † † †Kansas 326 19 16,132 6 40,008 2 66,000 3 32,375 2 90,547 † † † †Kentucky 116 57 7,095 26 13,266 11 17,542 3 35,667 1 110,400 1 167,031 † †Louisiana 67 24 8,978 15 13,685 9 19,781 10 44,532 3 93,592 † † † †Maine 272 29 13,091 3 50,000 1 80,000 † † † † † † † †
Maryland 24 1 11,800 6 14,864 4 25,125 2 49,581 1 46,100 1 343,000 † †Massachusetts 370 109 17,288 46 31,558 19 45,046 4 75,156 † † 1 970,000 † †Michigan 386 95 13,678 41 22,993 22 51,222 15 66,601 2 9,900 1 420,000 † †Minnesota 139 20 15,270 8 18,087 3 41,384 5 44,493 4 42,210 † † † †Mississippi 50 8 8,007 17 14,609 13 24,228 4 36,570 † † † † † †
Missouri 152 31 10,055 15 20,163 5 15,855 4 85,174 1 190,870 2 86,110 † †Montana 80 12 9,505 2 43,584 4 41,728 1 66,000 † † † † † †Nebraska 271 8 20,022 6 26,082 † † 1 67,910 1 124,294 † † † †Nevada 22 2 33,311 2 14,633 4 15,704 1 18,500 1 42,000 † † † †New Hampshire 230 22 12,592 8 19,231 1 60,000 1 75,645 † † † † † †See notes at end of table.
Number of public
librariesState
136
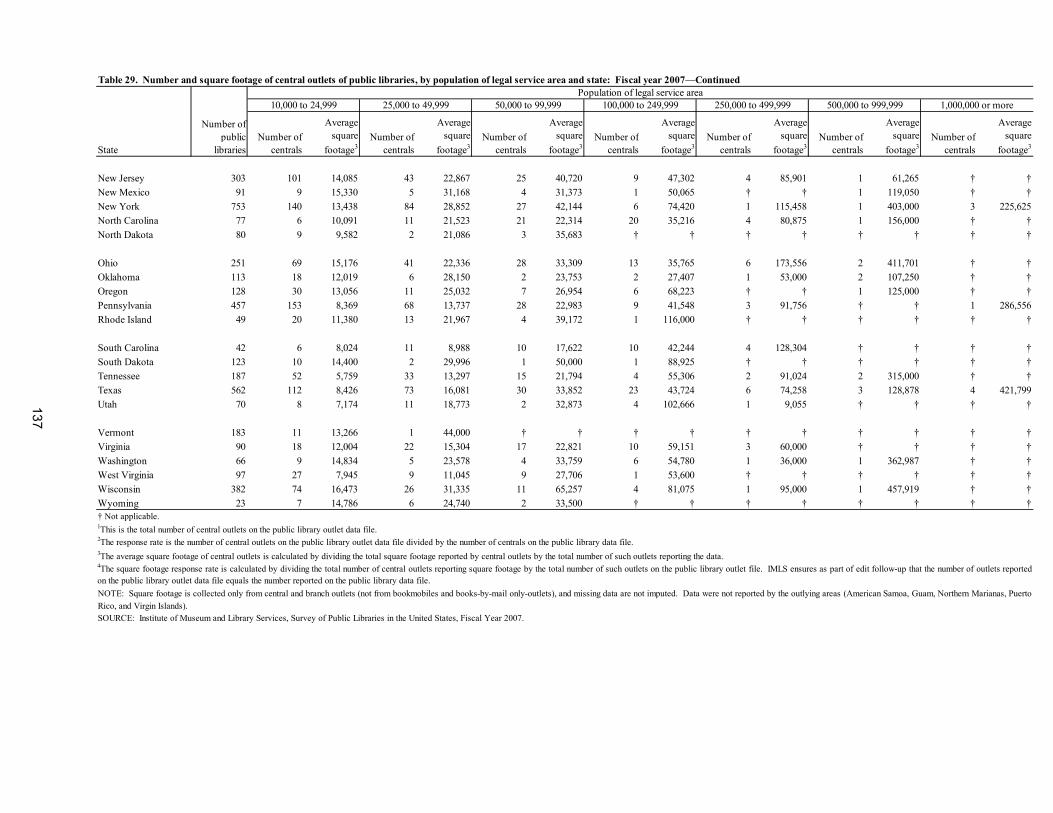
Table 29. Number and square footage of central outlets of public libraries, by population of legal service area and state: Fiscal year 2007—ContinuedPopulation of legal service area
10,000 to 24,999 25,000 to 49,999 50,000 to 99,999 100,000 to 249,999 250,000 to 499,999 500,000 to 999,999 1,000,000 or more
Number of centrals
Average square
footage3Number of
centrals
Average square
footage3Number of
centrals
Average square
footage3Number of
centrals
Average square
footage3Number of
centrals
Average square
footage3Number of
centrals
Average square
footage3Number of
centrals
Average square
footage3
New Jersey 303 101 14,085 43 22,867 25 40,720 9 47,302 4 85,901 1 61,265 † †New Mexico 91 9 15,330 5 31,168 4 31,373 1 50,065 † † 1 119,050 † †New York 753 140 13,438 84 28,852 27 42,144 6 74,420 1 115,458 1 403,000 3 225,625North Carolina 77 6 10,091 11 21,523 21 22,314 20 35,216 4 80,875 1 156,000 † †North Dakota 80 9 9,582 2 21,086 3 35,683 † † † † † † † †
Ohio 251 69 15,176 41 22,336 28 33,309 13 35,765 6 173,556 2 411,701 † †Oklahoma 113 18 12,019 6 28,150 2 23,753 2 27,407 1 53,000 2 107,250 † †Oregon 128 30 13,056 11 25,032 7 26,954 6 68,223 † † 1 125,000 † †Pennsylvania 457 153 8,369 68 13,737 28 22,983 9 41,548 3 91,756 † † 1 286,556Rhode Island 49 20 11,380 13 21,967 4 39,172 1 116,000 † † † † † †
South Carolina 42 6 8,024 11 8,988 10 17,622 10 42,244 4 128,304 † † † †South Dakota 123 10 14,400 2 29,996 1 50,000 1 88,925 † † † † † †Tennessee 187 52 5,759 33 13,297 15 21,794 4 55,306 2 91,024 2 315,000 † †Texas 562 112 8,426 73 16,081 30 33,852 23 43,724 6 74,258 3 128,878 4 421,799Utah 70 8 7,174 11 18,773 2 32,873 4 102,666 1 9,055 † † † †
Vermont 183 11 13,266 1 44,000 † † † † † † † † † †Virginia 90 18 12,004 22 15,304 17 22,821 10 59,151 3 60,000 † † † †Washington 66 9 14,834 5 23,578 4 33,759 6 54,780 1 36,000 1 362,987 † †West Virginia 97 27 7,945 9 11,045 9 27,706 1 53,600 † † † † † †Wisconsin 382 74 16,473 26 31,335 11 65,257 4 81,075 1 95,000 1 457,919 † †Wyoming 23 7 14,786 6 24,740 2 33,500 † † † † † † † †
SOURCE: Institute of Museum and Library Services, Survey of Public Libraries in the United States, Fiscal Year 2007.
1This is the total number of central outlets on the public library outlet data file.2The response rate is the number of central outlets on the public library outlet data file divided by the number of centrals on the public library data file.3The average square footage of central outlets is calculated by dividing the total square footage reported by central outlets by the total number of such outlets reporting the data.4The square footage response rate is calculated by dividing the total number of central outlets reporting square footage by the total number of such outlets on the public library outlet file. IMLS ensures as part of edit follow-up that the number of outlets reportedon the public library outlet data file equals the number reported on the public library data file.
Number of public
libraries
NOTE: Square footage is collected only from central and branch outlets (not from bookmobiles and books-by-mail only-outlets), and missing data are not imputed. Data were not reported by the outlying areas (American Samoa, Guam, Northern Marianas, PuertoRico, and Virgin Islands).
† Not applicable.
State
137
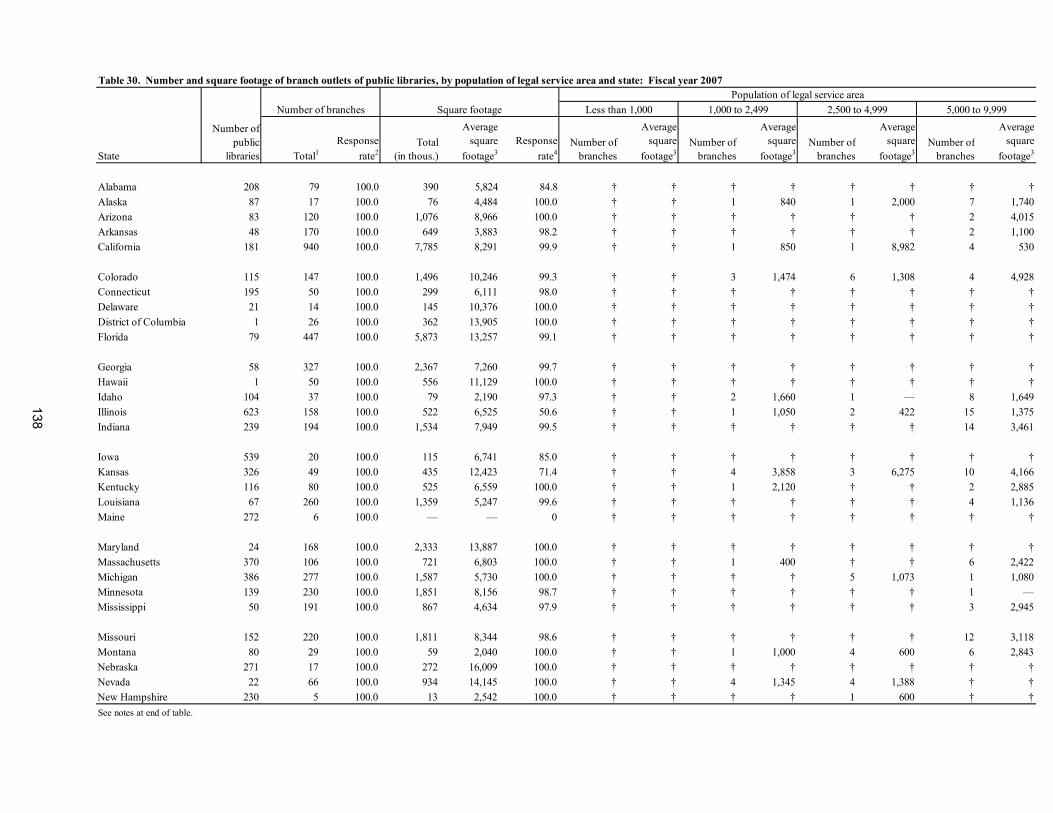
Table 30. Number and square footage of branch outlets of public libraries, by population of legal service area and state: Fiscal year 2007Population of legal service area
Less than 1,000 1,000 to 2,499 2,500 to 4,999 5,000 to 9,999
Total1Response
rate2Total
(in thous.)
Average square
footage3Response
rate4Number of
branches
Average square
footage3Number of
branches
Average square
footage3Number of
branches
Average square
footage3Number of
branches
Average square
footage3
Alabama 208 79 100.0 390 5,824 84.8 † † † † † † † †Alaska 87 17 100.0 76 4,484 100.0 † † 1 840 1 2,000 7 1,740Arizona 83 120 100.0 1,076 8,966 100.0 † † † † † † 2 4,015Arkansas 48 170 100.0 649 3,883 98.2 † † † † † † 2 1,100California 181 940 100.0 7,785 8,291 99.9 † † 1 850 1 8,982 4 530
Colorado 115 147 100.0 1,496 10,246 99.3 † † 3 1,474 6 1,308 4 4,928Connecticut 195 50 100.0 299 6,111 98.0 † † † † † † † †Delaware 21 14 100.0 145 10,376 100.0 † † † † † † † †District of Columbia 1 26 100.0 362 13,905 100.0 † † † † † † † †Florida 79 447 100.0 5,873 13,257 99.1 † † † † † † † †
Georgia 58 327 100.0 2,367 7,260 99.7 † † † † † † † †Hawaii 1 50 100.0 556 11,129 100.0 † † † † † † † †Idaho 104 37 100.0 79 2,190 97.3 † † 2 1,660 1 — 8 1,649Illinois 623 158 100.0 522 6,525 50.6 † † 1 1,050 2 422 15 1,375Indiana 239 194 100.0 1,534 7,949 99.5 † † † † † † 14 3,461
Iowa 539 20 100.0 115 6,741 85.0 † † † † † † † †Kansas 326 49 100.0 435 12,423 71.4 † † 4 3,858 3 6,275 10 4,166Kentucky 116 80 100.0 525 6,559 100.0 † † 1 2,120 † † 2 2,885Louisiana 67 260 100.0 1,359 5,247 99.6 † † † † † † 4 1,136Maine 272 6 100.0 — — 0 † † † † † † † †
Maryland 24 168 100.0 2,333 13,887 100.0 † † † † † † † †Massachusetts 370 106 100.0 721 6,803 100.0 † † 1 400 † † 6 2,422Michigan 386 277 100.0 1,587 5,730 100.0 † † † † 5 1,073 1 1,080Minnesota 139 230 100.0 1,851 8,156 98.7 † † † † † † 1 —Mississippi 50 191 100.0 867 4,634 97.9 † † † † † † 3 2,945
Missouri 152 220 100.0 1,811 8,344 98.6 † † † † † † 12 3,118Montana 80 29 100.0 59 2,040 100.0 † † 1 1,000 4 600 6 2,843Nebraska 271 17 100.0 272 16,009 100.0 † † † † † † † †Nevada 22 66 100.0 934 14,145 100.0 † † 4 1,345 4 1,388 † †New Hampshire 230 5 100.0 13 2,542 100.0 † † † † 1 600 † †See notes at end of table.
State
Number of public
libraries
Number of branches Square footage
138
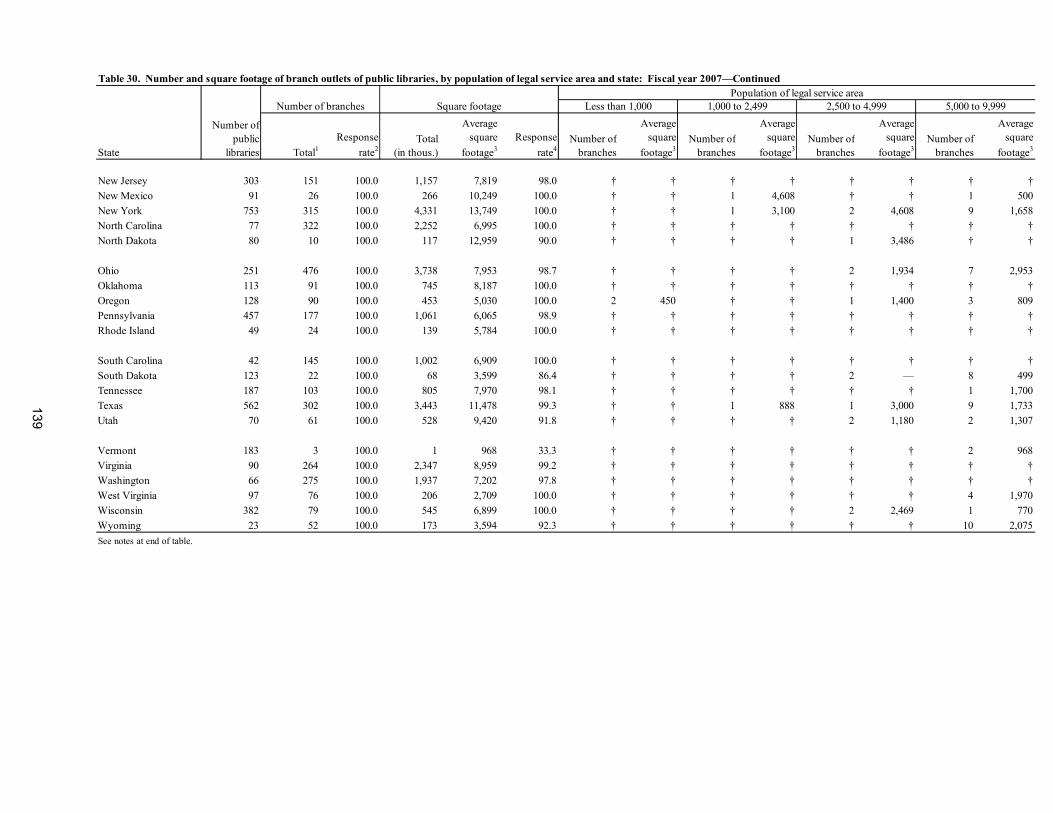
Table 30. Number and square footage of branch outlets of public libraries, by population of legal service area and state: Fiscal year 2007—ContinuedPopulation of legal service area
Less than 1,000 1,000 to 2,499 2,500 to 4,999 5,000 to 9,999
Total1Response
rate2Total
(in thous.)
Average square
footage3Response
rate4Number of
branches
Average square
footage3Number of
branches
Average square
footage3Number of
branches
Average square
footage3Number of
branches
Average square
footage3
New Jersey 303 151 100.0 1,157 7,819 98.0 † † † † † † † †New Mexico 91 26 100.0 266 10,249 100.0 † † 1 4,608 † † 1 500New York 753 315 100.0 4,331 13,749 100.0 † † 1 3,100 2 4,608 9 1,658North Carolina 77 322 100.0 2,252 6,995 100.0 † † † † † † † †North Dakota 80 10 100.0 117 12,959 90.0 † † † † 1 3,486 † †
Ohio 251 476 100.0 3,738 7,953 98.7 † † † † 2 1,934 7 2,953Oklahoma 113 91 100.0 745 8,187 100.0 † † † † † † † †Oregon 128 90 100.0 453 5,030 100.0 2 450 † † 1 1,400 3 809Pennsylvania 457 177 100.0 1,061 6,065 98.9 † † † † † † † †Rhode Island 49 24 100.0 139 5,784 100.0 † † † † † † † †
South Carolina 42 145 100.0 1,002 6,909 100.0 † † † † † † † †South Dakota 123 22 100.0 68 3,599 86.4 † † † † 2 — 8 499Tennessee 187 103 100.0 805 7,970 98.1 † † † † † † 1 1,700Texas 562 302 100.0 3,443 11,478 99.3 † † 1 888 1 3,000 9 1,733Utah 70 61 100.0 528 9,420 91.8 † † † † 2 1,180 2 1,307
Vermont 183 3 100.0 1 968 33.3 † † † † † † 2 968Virginia 90 264 100.0 2,347 8,959 99.2 † † † † † † † †Washington 66 275 100.0 1,937 7,202 97.8 † † † † † † † †West Virginia 97 76 100.0 206 2,709 100.0 † † † † † † 4 1,970Wisconsin 382 79 100.0 545 6,899 100.0 † † † † 2 2,469 1 770Wyoming 23 52 100.0 173 3,594 92.3 † † † † † † 10 2,075See notes at end of table.
State
Number of public
libraries
Number of branches Square footage
139
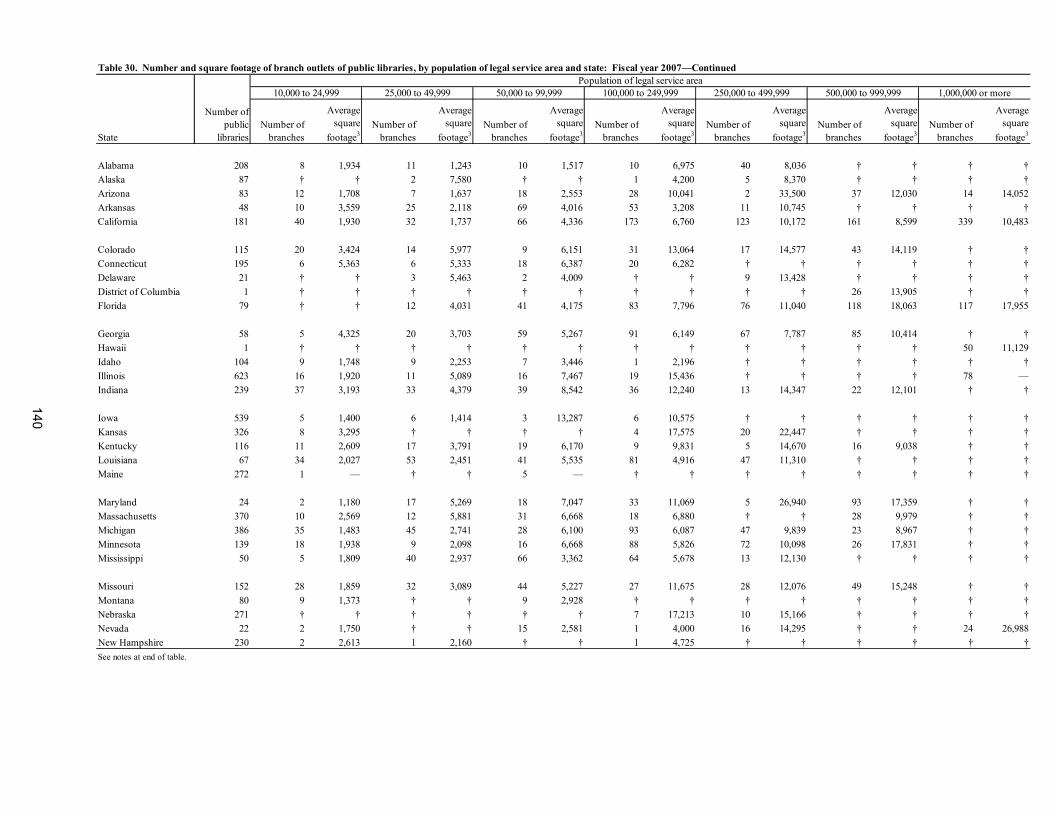
140
Table 30. Number and square footage of branch outlets of public libraries, by population of legal service area and state: Fiscal year 2007—ContinuedPopulation of legal service area
10,000 to 24,999 25,000 to 49,999 50,000 to 99,999 100,000 to 249,999 250,000 to 499,999 500,000 to 999,999 1,000,000 or more
Number of branches
Average square
footage3Number of
branches
Average square
footage3Number of
branches
Average square
footage3Number of
branches
Average square
footage3Number of
branches
Average square
footage3Number of
branches
Average square
footage3Number of
branches
Average square
footage3
Alabama 208 8 1,934 11 1,243 10 1,517 10 6,975 40 8,036 † † † †Alaska 87 † † 2 7,580 † † 1 4,200 5 8,370 † † † †Arizona 83 12 1,708 7 1,637 18 2,553 28 10,041 2 33,500 37 12,030 14 14,052Arkansas 48 10 3,559 25 2,118 69 4,016 53 3,208 11 10,745 † † † †California 181 40 1,930 32 1,737 66 4,336 173 6,760 123 10,172 161 8,599 339 10,483
Colorado 115 20 3,424 14 5,977 9 6,151 31 13,064 17 14,577 43 14,119 † †Connecticut 195 6 5,363 6 5,333 18 6,387 20 6,282 † † † † † †Delaware 21 † † 3 5,463 2 4,009 † † 9 13,428 † † † †District of Columbia 1 † † † † † † † † † † 26 13,905 † †Florida 79 † † 12 4,031 41 4,175 83 7,796 76 11,040 118 18,063 117 17,955
Georgia 58 5 4,325 20 3,703 59 5,267 91 6,149 67 7,787 85 10,414 † †Hawaii 1 † † † † † † † † † † † † 50 11,129Idaho 104 9 1,748 9 2,253 7 3,446 1 2,196 † † † † † †Illinois 623 16 1,920 11 5,089 16 7,467 19 15,436 † † † † 78 —Indiana 239 37 3,193 33 4,379 39 8,542 36 12,240 13 14,347 22 12,101 † †
Iowa 539 5 1,400 6 1,414 3 13,287 6 10,575 † † † † † †Kansas 326 8 3,295 † † † † 4 17,575 20 22,447 † † † †Kentucky 116 11 2,609 17 3,791 19 6,170 9 9,831 5 14,670 16 9,038 † †Louisiana 67 34 2,027 53 2,451 41 5,535 81 4,916 47 11,310 † † † †Maine 272 1 — † † 5 — † † † † † † † †
Maryland 24 2 1,180 17 5,269 18 7,047 33 11,069 5 26,940 93 17,359 † †Massachusetts 370 10 2,569 12 5,881 31 6,668 18 6,880 † † 28 9,979 † †Michigan 386 35 1,483 45 2,741 28 6,100 93 6,087 47 9,839 23 8,967 † †Minnesota 139 18 1,938 9 2,098 16 6,668 88 5,826 72 10,098 26 17,831 † †Mississippi 50 5 1,809 40 2,937 66 3,362 64 5,678 13 12,130 † † † †
Missouri 152 28 1,859 32 3,089 44 5,227 27 11,675 28 12,076 49 15,248 † †Montana 80 9 1,373 † † 9 2,928 † † † † † † † †Nebraska 271 † † † † † † 7 17,213 10 15,166 † † † †Nevada 22 2 1,750 † † 15 2,581 1 4,000 16 14,295 † † 24 26,988New Hampshire 230 2 2,613 1 2,160 † † 1 4,725 † † † † † †See notes at end of table.
State
Number of public
libraries
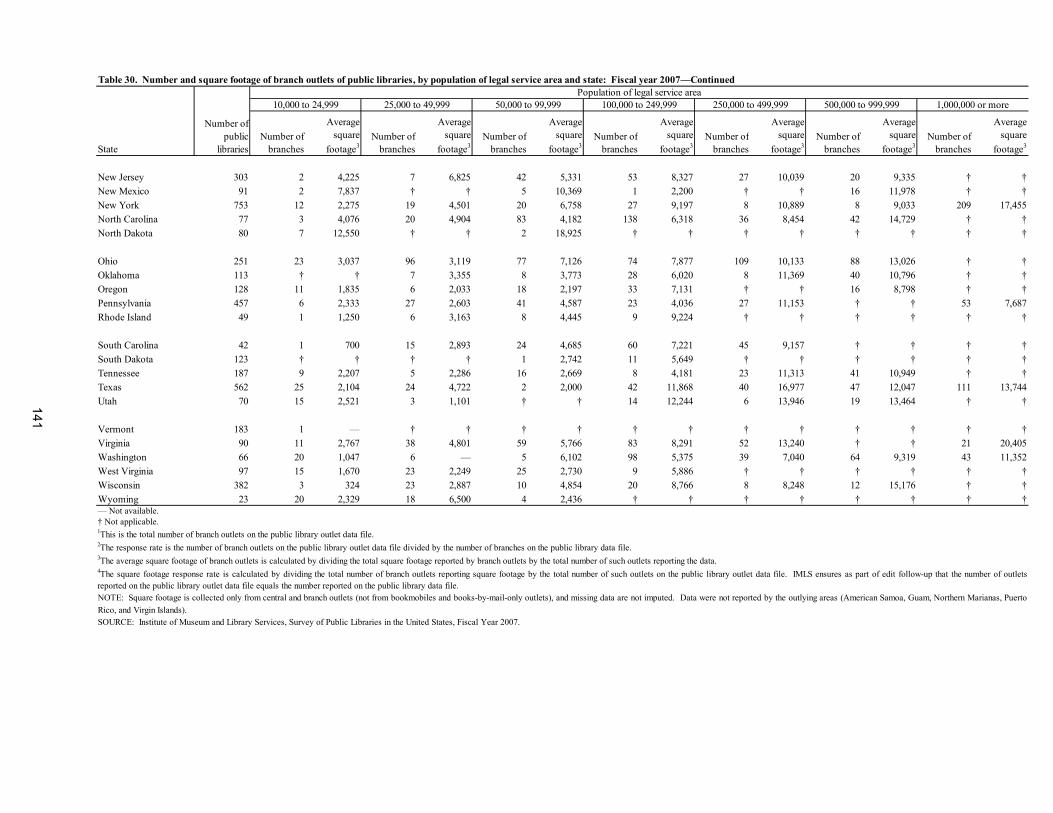
141
Table 30. Number and square footage of branch outlets of public libraries, by population of legal service area and state: Fiscal year 2007—ContinuedPopulation of legal service area
10,000 to 24,999 25,000 to 49,999 50,000 to 99,999 100,000 to 249,999 250,000 to 499,999 500,000 to 999,999 1,000,000 or more
Number of branches
Average square
footage3Number of
branches
Average square
footage3Number of
branches
Average square
footage3Number of
branches
Average square
footage3Number of
branches
Average square
footage3Number of
branches
Average square
footage3Number of
branches
Average square
footage3
New Jersey 303 2 4,225 7 6,825 42 5,331 53 8,327 27 10,039 20 9,335 † †New Mexico 91 2 7,837 † † 5 10,369 1 2,200 † † 16 11,978 † †New York 753 12 2,275 19 4,501 20 6,758 27 9,197 8 10,889 8 9,033 209 17,455North Carolina 77 3 4,076 20 4,904 83 4,182 138 6,318 36 8,454 42 14,729 † †North Dakota 80 7 12,550 † † 2 18,925 † † † † † † † †
Ohio 251 23 3,037 96 3,119 77 7,126 74 7,877 109 10,133 88 13,026 † †Oklahoma 113 † † 7 3,355 8 3,773 28 6,020 8 11,369 40 10,796 † †Oregon 128 11 1,835 6 2,033 18 2,197 33 7,131 † † 16 8,798 † †Pennsylvania 457 6 2,333 27 2,603 41 4,587 23 4,036 27 11,153 † † 53 7,687Rhode Island 49 1 1,250 6 3,163 8 4,445 9 9,224 † † † † † †
South Carolina 42 1 700 15 2,893 24 4,685 60 7,221 45 9,157 † † † †South Dakota 123 † † † † 1 2,742 11 5,649 † † † † † †Tennessee 187 9 2,207 5 2,286 16 2,669 8 4,181 23 11,313 41 10,949 † †Texas 562 25 2,104 24 4,722 2 2,000 42 11,868 40 16,977 47 12,047 111 13,744Utah 70 15 2,521 3 1,101 † † 14 12,244 6 13,946 19 13,464 † †
Vermont 183 1 — † † † † † † † † † † † †Virginia 90 11 2,767 38 4,801 59 5,766 83 8,291 52 13,240 † † 21 20,405Washington 66 20 1,047 6 — 5 6,102 98 5,375 39 7,040 64 9,319 43 11,352West Virginia 97 15 1,670 23 2,249 25 2,730 9 5,886 † † † † † †Wisconsin 382 3 324 23 2,887 10 4,854 20 8,766 8 8,248 12 15,176 † †Wyoming 23 20 2,329 18 6,500 4 2,436 † † † † † † † †
1This is the total number of branch outlets on the public library outlet data file.2The response rate is the number of branch outlets on the public library outlet data file divided by the number of branches on the public library data file.
State
Number of public
libraries
— Not available.† Not applicable.
3The average square footage of branch outlets is calculated by dividing the total square footage reported by branch outlets by the total number of such outlets reporting the data.4The square footage response rate is calculated by dividing the total number of branch outlets reporting square footage by the total number of such outlets on the public library outlet data file. IMLS ensures as part of edit follow-up that the number of outletsreported on the public library outlet data file equals the number reported on the public library data file.
SOURCE: Institute of Museum and Library Services, Survey of Public Libraries in the United States, Fiscal Year 2007.
NOTE: Square footage is collected only from central and branch outlets (not from bookmobiles and books-by-mail-only outlets), and missing data are not imputed. Data were not reported by the outlying areas (American Samoa, Guam, Northern Marianas, PuertoRico, and Virgin Islands).

(Page is intentionally blank.)
142

Appendix A—Public Library State Ranking Tables
143

(Page is intentionally blank.)
144
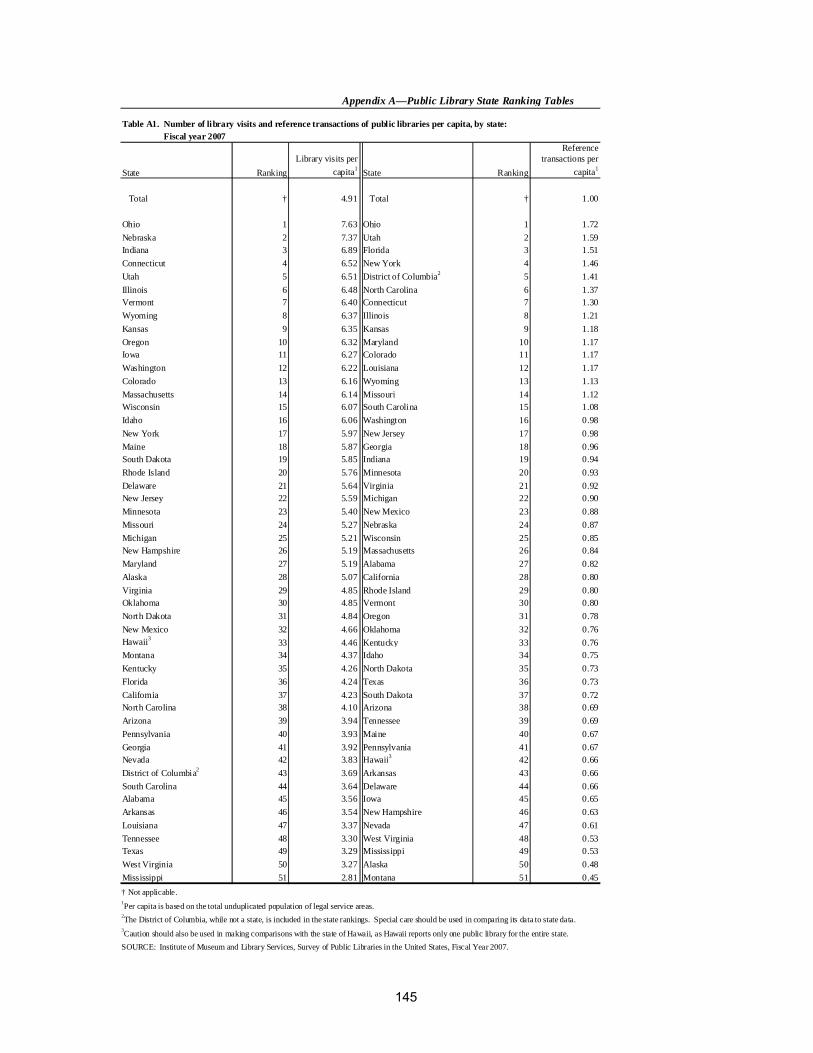
State RankingLibrary visits per
capita1 State Ranking
Reference transactions per
capita1
Total † 4.91 Total † 1.00
Ohio 1 7.63 Ohio 1 1.72Nebraska 2 7.37 Utah 2 1.59Indiana 3 6.89 Florida 3 1.51Connecticut 4 6.52 New York 4 1.46Utah 5 6.51 District of Columbia2 5 1Illinois 6 6.48 North Carolina 6 1.37Vermont 7 6.40 Connecticut 7 1.30Wyoming 8 6.37 Illinois 8 1.21Kansas 9 6.35 Kansas 9 1.18Oregon 10 6.32 Maryland 10 1.17Iowa 11 6.27 Colorado 11 1.17Washington 12 6.22 Louisiana 12 1.17Colorado 13 6.16 Wyoming 13 1.13Massachusetts 14 6.14 Missouri 14 1.12Wisconsin 15 6.07 South Carolina 15 1.08Idaho 16 6.06 Washington 16 0.98New York 17 5.97 New Jersey 17 0.98Maine 18 5.87 Georgia 18 0.96South Dakota 19 5.85 Indiana 19 0.94Rhode Island 20 5.76 Minnesota 20 0.93Delaware 21 5.64 Virginia 21 0.92New Jersey 22 5.59 Michigan 22 0.90Minnesota 23 5.40 New Mexico 23 0.88Missouri 24 5.27 Nebraska 24 0.87Michigan 25 5.21 Wisconsin 25 0.85New Hampshire 26 5.19 Massachusetts 26 0.84Maryland 27 5.19 Alabama 27 0.82Alaska 28 5.07 California 28 0.80Virginia 29 4.85 Rhode Island 29 0.80Oklahoma 30 4.85 Vermont 30 0.80North Dakota 31 4.84 Oregon 31 0.78New Mexico 32 4.66 Oklahoma 32 0.76Hawaii3 33 4.4
.41
6 Kentucky 33 0.76Montana 34 4.37 Idaho 34 0.75Kentucky 35 4.26 North Dakota 35 0.73Florida 36 4.24 Texas 36 0.73California 37 4.23 South Dakota 37 0.72North Carolina 38 4.10 Arizona 38 0.69Arizona 39 3.94 Tennessee 39 0.69Pennsylvania 40 3.93 Maine 40 0.67Georgia 41 3.92 Pennsylvania 41 0.67Nevada 42 3.83 Hawaii3 42 0.66District of Columbia2 43 3.69 Arkansas 43 0.66South Carolina 44 3.64 Delaware 44 0.66Alabama 45 3.56 Iowa 45 0.65Arkansas 46 3.54 New Hampshire 46 0.63Louisiana 47 3.37 Nevada 47 0.61Tennessee 48 3.30 West Virginia 48 0.53Texas 49 3.29 Mississippi 49 0.53West Virginia 50 3.27 Alaska 50 0.48Mississippi 51 2.81 Montana 51 0.45† Not applicable.1Per capita is based on the total unduplicated population of legal service areas.
SOURCE: Institute of Museum and Library Services, Survey of Public Libraries in the United States, Fiscal Year 2007.
3Caution should also be used in making comparisons with the state of Hawaii, as Hawaii reports only one public library for the entire state.
Appendix A—Public Library State Ranking Tables
Table A1. Number of library visits and reference transactions of public libraries per capita, by state:Table A1. Fiscal year 2007
2The District of Columbia, while not a state, is included in the state rankings. Special care should be used in comparing its data to state data.
145
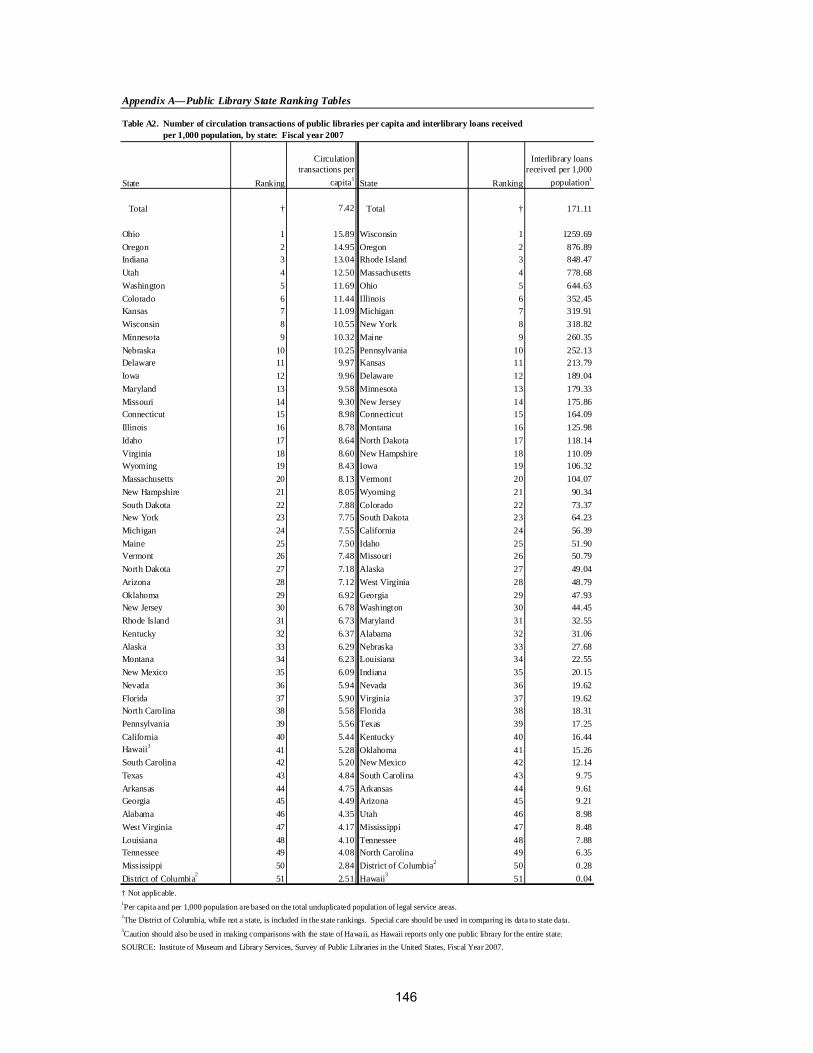
State Ranking
Circulation transactions per
capita1 State Ranking
Interlibrary loans received per 1,000
population1
Total † 7.42 Total † 171.11
Ohio 1 15.89 Wisconsin 1 1259.69Oregon 2 14.95 Oregon 2 876.89Indiana 3 13.04 Rhode Island 3 848.47Utah 4 12.50 Massachusetts 4 778.68Washington 5 11.69 Ohio 5 644.63Colorado 6 11.44 Illinois 6 352.45Kansas 7 11.09 Michigan 7 319.91Wisconsin 8 10.55 New York 8 318.82Minnesota 9 10.32 Maine 9 260.35Nebraska 10 10.25 Pennsylvania 10 252.13Delaware 11 9.97 Kansas 11 213.79Iowa 12 9.96 Delaware 12 189.04Maryland 13 9.58 Minnesota 13 179.33Missouri 14 9.30 New Jersey 14 175.86Connecticut 15 8.98 Connecticut 15 164.09Illinois 16 8.78 Montana 16 125.98Idaho 17 8.64 North Dakota 17 118.14Virginia 18 8.60 New Hampshire 18 110.09Wyoming 19 8.43 Iowa 19 106.32Massachusetts 20 8.13 Vermont 20 104.07New Hampshire 21 8.05 Wyoming 21 90.34South Dakota 22 7.88 Colorado 22 73.37New York 23 7.75 South Dakota 23 64.23Michigan 24 7.55 California 24 56.39Maine 25 7.50 Idaho 25 51.90Vermont 26 7.48 Missouri 26 50.79North Dakota 27 7.18 Alaska 27 49.04Arizona 28 7.12 West Virginia 28 48.79Oklahoma 29 6.92 Georgia 29 47.93New Jersey 30 6.78 Washington 30 44.45Rhode Island 31 6.73 Maryland 31 32.55Kentucky 32 6.37 Alabama 32 31.06Alaska 33 6.29 Nebraska 33 27.68Montana 34 6.23 Louisiana 34 22.55New Mexico 35 6.09 Indiana 35 20.15Nevada 36 5.94 Nevada 36 19.62Florida 37 5.90 Virginia 37 19.62North Carolina 38 5.58 Florida 38 18.31Pennsylvania 39 5.56 Texas 39 17.25California 40 5.44 Kentucky 40 16.44Hawaii3 41 5.28 Oklahoma 41 15.26South Carolina 42 5.20 New Mexico 42 12.14Texas 43 4.84 South Carolina 43 9.75Arkansas 44 4.75 Arkansas 44 9.61Georgia 45 4.49 Arizona 45 9.21Alabama 46 4.35 Utah 46 8.98West Virginia 47 4.17 Mississippi 47 8.48Louisiana 48 4.10 Tennessee 48 7.88Tennessee 49 4.08 North Carolina 49 6.35Mississippi 50 2.84 District of Columbia2 50 0.28District of Columbia2 51 2.51 Hawaii3 51 0.04† Not applicable.1Per capita and per 1,000 population are based on the total unduplicated population of legal service areas.
SOURCE: Institute of Museum and Library Services, Survey of Public Libraries in the United States, Fiscal Year 2007.
3Caution should also be used in making comparisons with the state of Hawaii, as Hawaii reports only one public library for the entire state.
Table A2. per 1,000 population, by state: Fiscal year 2007
Appendix A—Public Library State Ranking Tables
2The District of Columbia, while not a state, is included in the state rankings. Special care should be used in comparing its data to state data.
Table A2. Number of circulation transactions of public libraries per capita and interlibrary loans received
146
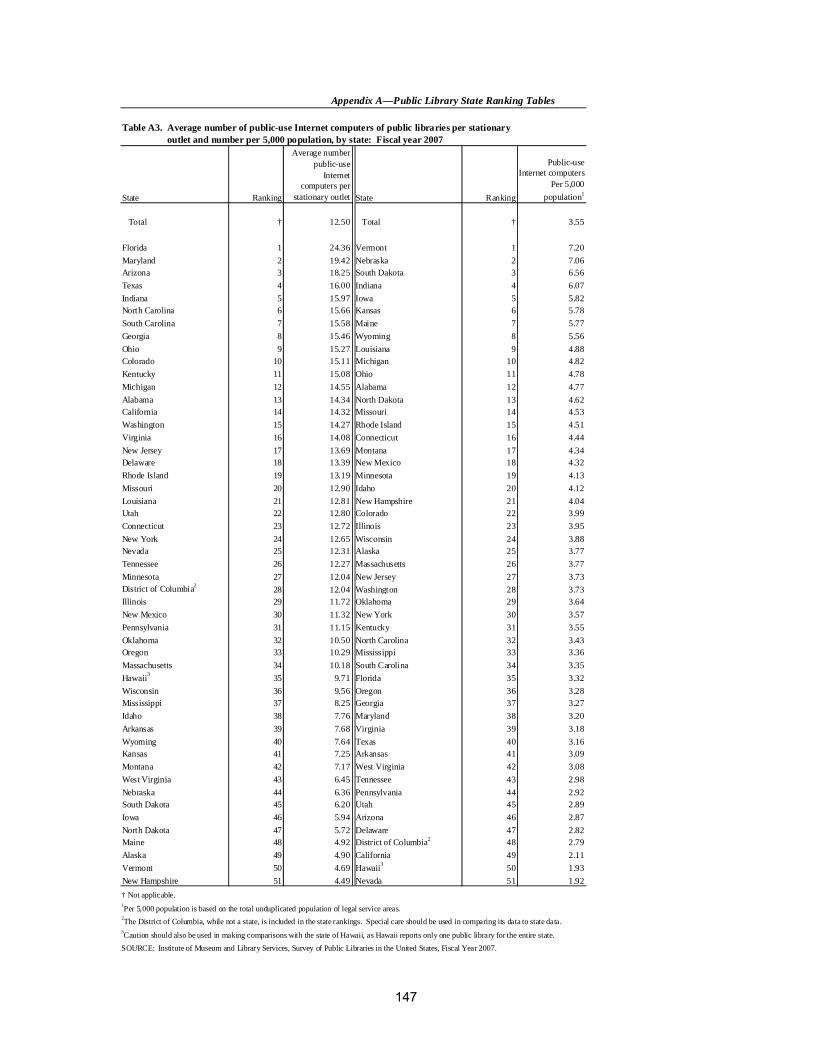
State Ranking
Average number public-use
Internet computers per
stationary outlet State Ranking
Public-use Internet computers
Per 5,000 population1
Total † 12.50 Total † 3.55
Florida 1 24.36 Vermont 1 7.20Maryland 2 19.42 Nebraska 2 7.06Arizona 3 18.25 South Dakota 3 6.56Texas 4 16.00 Indiana 4 6.07Indiana 5 15.97 Iowa 5 5.82North Carolina 6 15.66 Kansas 6 5.78South Carolina 7 15.58 Maine 7 5.77Georgia 8 15.46 Wyoming 8 5.56Ohio 9 15.27 Louisiana 9 4.88Colorado 10 15.11 Michigan 10 4.82Kentucky 11 15.08 Ohio 11 4.78Michigan 12 14.55 Alabama 12 4.77Alabama 13 14.34 North Dakota 13 4.62California 14 14.32 Missouri 14 4.53Washington 15 14.27 Rhode Island 15 4.51Virginia 16 14.08 Connecticut 16 4.44New Jersey 17 13.69 Montana 17 4.34Delaware 18 13.39 New Mexico 18 4.32Rhode Island 19 13.19 Minnesota 19 4.13Missouri 20 12.90 Idaho 20 4.12Louisiana 21 12.81 New Hampshire 21 4.04Utah 22 12.80 Colorado 22 3.99Connecticut 23 12.72 Illinois 23 3.95New York 24 12.65 Wisconsin 24 3.88Nevada 25 12.31 Alaska 25 3.77Tennessee 26 12.27 Massachusetts 26 3.77Minnesota 27 12.04 New Jersey 27 3.73District of Columbia2 28 12.04 Washington 28 3.73Illinois 29 11.72 Oklahoma 29 3.64New Mexico 30 11.32 New York 30 3.57Pennsylvania 31 11.15 Kentucky 31 3.55Oklahoma 32 10.50 North Carolina 32 3.43Oregon 33 10.29 Mississippi 33 3.36Massachusetts 34 10.18 South Carolina 34 3.35Hawaii3 35 9.71 Florida 35 3.32Wisconsin 36 9.56 Oregon 36 3.28Mississippi 37 8.25 Georgia 37 3.27Idaho 38 7.76 Maryland 38 3.20Arkansas 39 7.68 Virginia 39 3.18Wyoming 40 7.64 Texas 40 3.16Kansas 41 7.25 Arkansas 41 3.09Montana 42 7.17 West Virginia 42 3.08West Virginia 43 6.45 Tennessee 43 2.98Nebraska 44 6.36 Pennsylvania 44 2.92South Dakota 45 6.20 Utah 45 2.89Iowa 46 5.94 Arizona 46 2.87North Dakota 47 5.72 Delaware 47 2.82Maine 48 4.92 District of Columbia2 48 2.79Alaska 49 4.90 California 49 2.11Vermont 50 4.69 Hawaii3 50 1.93New Hampshire 51 4.49 Nevada 51 1.92† Not applicable.1Per 5,000 population is based on the total unduplicated population of legal service areas.
3Caution should also be used in making comparisons with the state of Hawaii, as Hawaii reports only one public library for the entire state.SOURCE: Institute of Museum and Library Services, Survey of Public Libraries in the United States, Fiscal Year 2007.
Appendix A—Public Library State Ranking Tables
Table A3. Average number of public-use Internet computers of public libraries per stationary Table A3. outlet and number per 5,000 population, by state: Fiscal year 2007
2The District of Columbia, while not a state, is included in the state rankings. Special care should be used in comparing its data to state data.
147
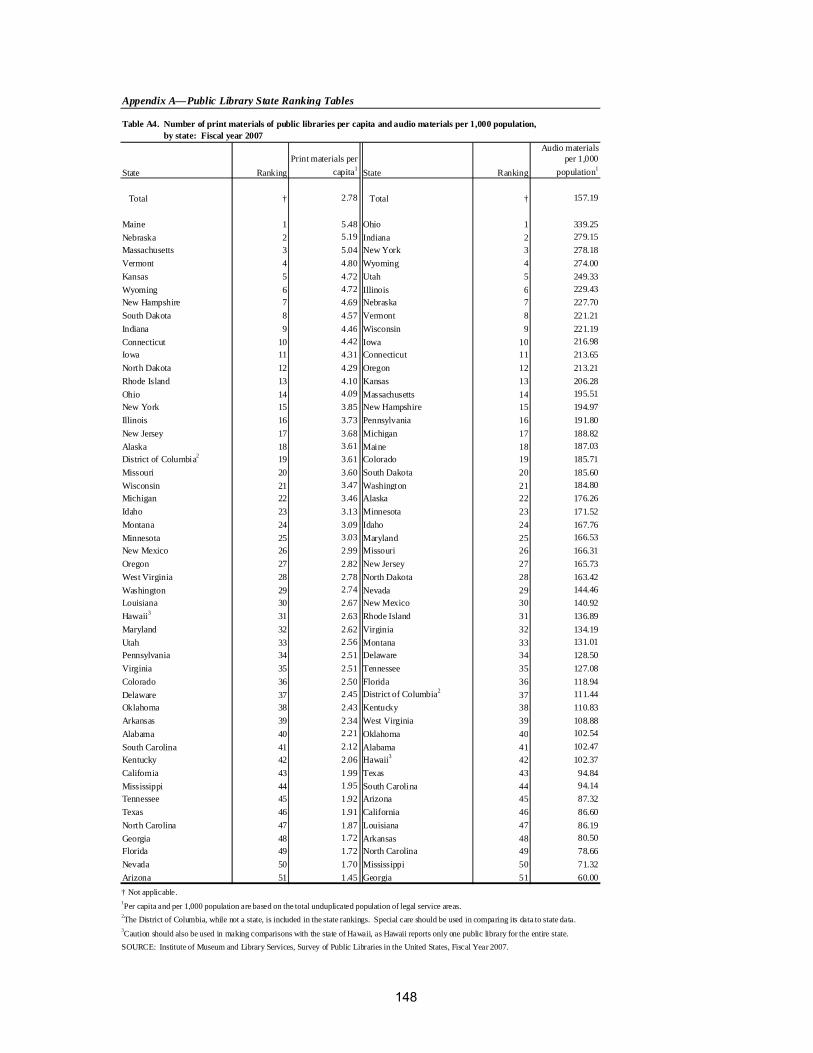
State RankingPrint materials per
capita1 State Ranking
Audio materials per 1,000
population1
Total † 2.78 Total † 157.19
Maine 1 5.48 Ohio 1 339.25Nebraska 2 5.19 Indiana 2 279.15Massachusetts 3 5.04 New York 3 278.18Vermont 4 4.80 Wyoming 4 274.00Kansas 5 4.72 Utah 5 249.33Wyoming 6 4.72 Illinois 6 229.43New Hampshire 7 4.69 Nebraska 7 227.70South Dakota 8 4.57 Vermont 8 221.21Indiana 9 4.46 Wisconsin 9 221.19Connecticut 10 4.42 Iowa 10 216.98Iowa 11 4.31 Connecticut 11 213.65North Dakota 12 4.29 Oregon 12 213.21Rhode Island 13 4.10 Kansas 13 206.28Ohio 14 4.09 Massachusetts 14 195.51New York 15 3.85 New Hampshire 15 194.97Illinois 16 3.73 Pennsylvania 16 191.80New Jersey 17 3.68 Michigan 17 188.82Alaska 18 3.61 Maine 18 187.03District of Columbia2 19 3.61 Colorado 19 185.71Missouri 20 3.60 South Dakota 20 185.60Wisconsin 21 3.47 Washington 21 184.80Michigan 22 3.46 Alaska 22 176.26Idaho 23 3.13 Minnesota 23 171.52Montana 24 3.09 Idaho 24 167.76Minnesota 25 3.03 Maryland 25 166.53New Mexico 26 2.99 Missouri 26 166.31Oregon 27 2.82 New Jersey 27 165.73West Virginia 28 2.78 North Dakota 28 163.42Washington 29 2.74 Nevada 29 144.46Louisiana 30 2.67 New Mexico 30 140.92Hawaii3 31 2.63 Rhode Island 31 136.89Maryland 32 2.62 Virginia 32 134.19Utah 33 2.56 Montana 33 131.01Pennsylvania 34 2.51 Delaware 34 128.50Virginia 35 2.51 Tennessee 35 127.08Colorado 36 2.50 Florida 36 118.94Delaware 37 2.45 District of Columbia2 37 111.44Oklahoma 38 2.43 Kentucky 38 110.83Arkansas 39 2.34 West Virginia 39 108.88Alabama 40 2.21 Oklahoma 40 102.54South Carolina 41 2.12 Alabama 41 102.47Kentucky 42 2.06 Hawaii3 42 102.37California 43 1.99 Texas 43 94.84Mississippi 44 1.95 South Carolina 44 94.14Tennessee 45 1.92 Arizona 45 87.32Texas 46 1.91 California 46 86.60North Carolina 47 1.87 Louisiana 47 86.19Georgia 48 1.72 Arkansas 48 80.50Florida 49 1.72 North Carolina 49 78.66Nevada 50 1.70 Mississippi 50 71.32Arizona 51 1.45 Georgia 51 60.00† Not applicable.1Per capita and per 1,000 population are based on the total unduplicated population of legal service areas.
3Caution should also be used in making comparisons with the state of Hawaii, as Hawaii reports only one public library for the entire state.SOURCE: Institute of Museum and Library Services, Survey of Public Libraries in the United States, Fiscal Year 2007.
Table A4. by state: Fiscal year 2007
Appendix A—Public Library State Ranking Tables
2The District of Columbia, while not a state, is included in the state rankings. Special care should be used in comparing its data to state data.
Table A4. Number of print materials of public libraries per capita and audio materials per 1,000 population,
148
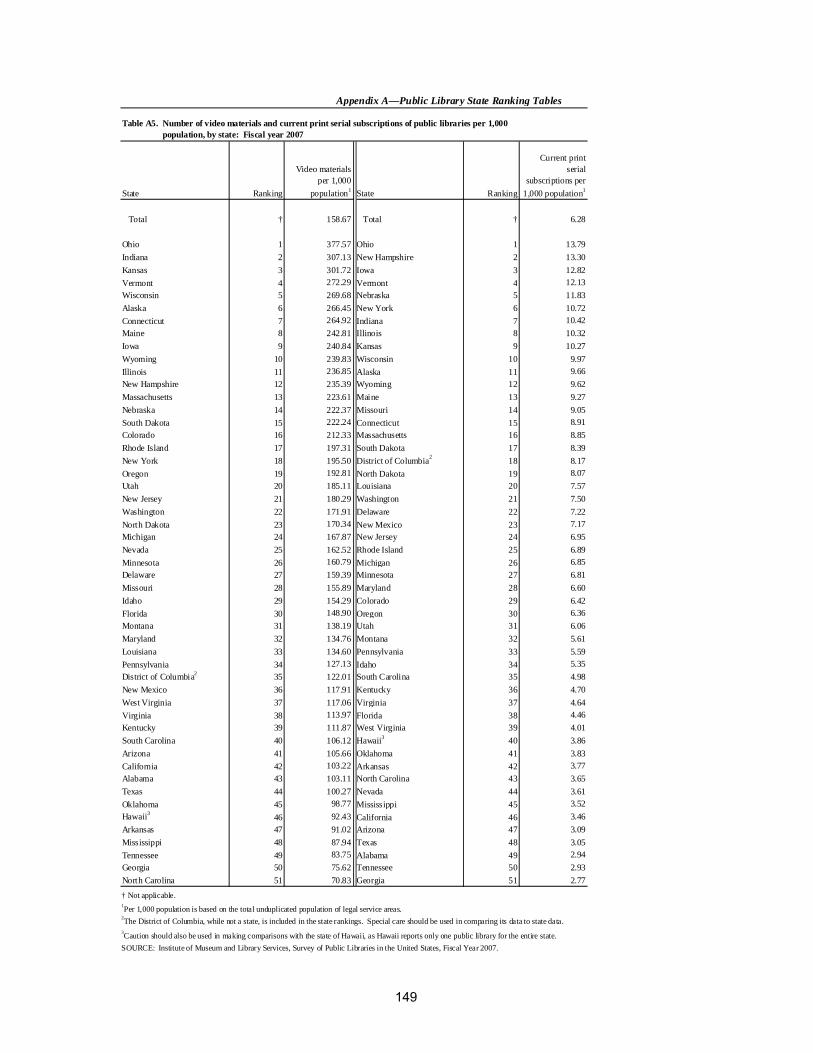
State Ranking
Video materials per 1,000
population1 State Ranking
Current print serial
subscriptions per 1,000 population1
Total † 158.67 Total † 6.28
Ohio 1 377.57 Ohio 1 13.79Indiana 2 307.13 New Hampshire 2 13.30Kansas 3 301.72 Iowa 3 12.82Vermont 4 272.29 Vermont 4 12.13Wisconsin 5 269.68 Nebraska 5 11.83Alaska 6 266.45 New York 6 10.72Connecticut 7 264.92 Indiana 7 10.42Maine 8 242.81 Illinois 8 10.32Iowa 9 240.84 Kansas 9 10.27Wyoming 10 239.83 Wisconsin 10 9.97Illinois 11 236.85 Alaska 11 9.66New Hampshire 12 235.39 Wyoming 12 9.62Massachusetts 13 223.61 Maine 13 9.27Nebraska 14 222.37 Missouri 14 9.05South Dakota 15 222.24 Connecticut 15 8.91Colorado 16 212.33 Massachusetts 16 8.85Rhode Island 17 197.31 South Dakota 17 8.39New York 18 195.50 District of Columbia2 18 8.17Oregon 19 192.81 North Dakota 19 8.07Utah 20 185.11 Louisiana 20 7.57New Jersey 21 180.29 Washington 21 7.50Washington 22 171.91 Delaware 22 7.22North Dakota 23 170.34 New Mexico 23 7.17Michigan 24 167.87 New Jersey 24 6.95Nevada 25 162.52 Rhode Island 25 6.89Minnesota 26 160.79 Michigan 26 6.85Delaware 27 159.39 Minnesota 27 6.81Missouri 28 155.89 Maryland 28 6.60Idaho 29 154.29 Colorado 29 6.42Florida 30 148.90 Oregon 30 6.36Montana 31 138.19 Utah 31 6.06Maryland 32 134.76 Montana 32 5.61Louisiana 33 134.60 Pennsylvania 33 5.59Pennsylvania 34 127.13 Idaho 34 5.35District of Columbia2 35 122.01 South Carolina 35 4.98New Mexico 36 117.91 Kentucky 36 4.70West Virginia 37 117.06 Virginia 37 4.64Virginia 38 113.97 Florida 38 4.46Kentucky 39 111.87 West Virginia 39 4.01South Carolina 40 106.12 Hawaii3 40 3.86Arizona 41 105.66 Oklahoma 41 3.83California 42 103.22 Arkansas 42 3.77Alabama 43 103.11 North Carolina 43 3.65Texas 44 100.27 Nevada 44 3.61Oklahoma 45 98.77 Mississippi 45 3.52Hawaii3 46 92.43 California 46 3.46Arkansas 47 91.02 Arizona 47 3.09Mississippi 48 87.94 Texas 48 3.05Tennessee 49 83.75 Alabama 49 2.94Georgia 50 75.62 Tennessee 50 2.93North Carolina 51 70.83 Georgia 51 2.77
† Not applicable.1Per 1,000 population is based on the total unduplicated population of legal service areas.
3Caution should also be used in making comparisons with the state of Hawaii, as Hawaii reports only one public library for the entire state.SOURCE: Institute of Museum and Library Services, Survey of Public Libraries in the United States, Fiscal Year 2007.
Table A5. population, by state: Fiscal year 2007
Appendix A—Public Library State Ranking Tables
2The District of Columbia, while not a state, is included in the state rankings. Special care should be used in comparing its data to state data.
Table A5. Number of video materials and current print serial subscriptions of public libraries per 1,000
149
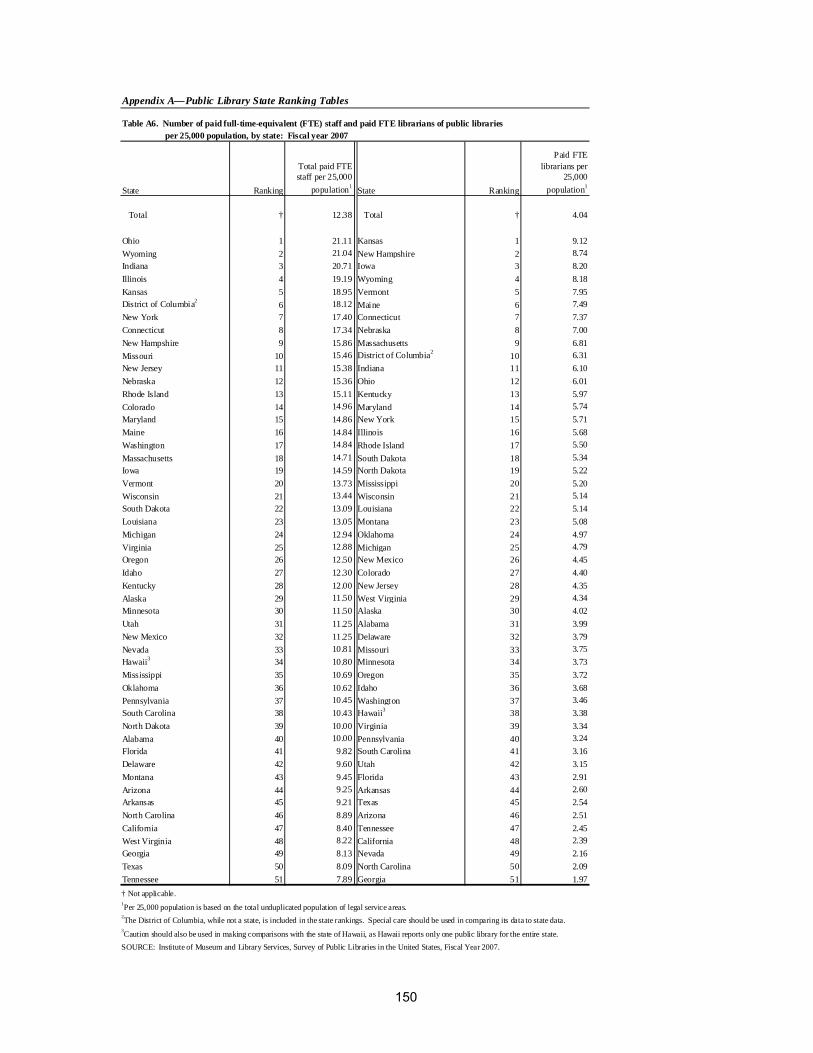
State Ranking
Total paid FTE staff per 25,000
population1 State Ranking
Paid FTE librarians per
25,000 population1
Total † 12.38 Total † 4.04
Ohio 1 21.11 Kansas 1 9.12Wyoming 2 21.04 New Hampshire 2 8.74Indiana 3 20.71 Iowa 3 8.20Illinois 4 19.19 Wyoming 4 8.18Kansas 5 18.95 Vermont 5 7.95District of Columbia2 6 18.12 Maine 6 7.49New York 7 17.40 Connecticut 7 7.37Connecticut 8 17.34 Nebraska 8 7.00New Hampshire 9 15.86 Massachusetts 9 6.81Missouri 10 15.46 District of Columbia2 10 6.31New Jersey 11 15.38 Indiana 11 6.10Nebraska 12 15.36 Ohio 12 6.01Rhode Island 13 15.11 Kentucky 13 5.97Colorado 14 14.96 Maryland 14 5.74Maryland 15 14.86 New York 15 5.71Maine 16 14.84 Illinois 16 5.68Washington 17 14.84 Rhode Island 17 5.50Massachusetts 18 14.71 South Dakota 18 5.34Iowa 19 14.59 North Dakota 19 5.22Vermont 20 13.73 Mississippi 20 5.20Wisconsin 21 13.44 Wisconsin 21 5.14South Dakota 22 13.09 Louisiana 22 5.14Louisiana 23 13.05 Montana 23 5.08Michigan 24 12.94 Oklahoma 24 4.97Virginia 25 12.88 Michigan 25 4.79Oregon 26 12.50 New Mexico 26 4.45Idaho 27 12.30 Colorado 27 4.40Kentucky 28 12.00 New Jersey 28 4.35Alaska 29 11.50 West Virginia 29 4.34Minnesota 30 11.50 Alaska 30 4.02Utah 31 11.25 Alabama 31 3.99New Mexico 32 11.25 Delaware 32 3.79Nevada 33 10.81 Missouri 33 3.75Hawaii3 34 10.80 Minnesota 34 3.73Mississippi 35 10.69 Oregon 35 3.72Oklahoma 36 10.62 Idaho 36 3.68Pennsylvania 37 10.45 Washington 37 3.46South Carolina 38 10.43 Hawaii3 38 3.38North Dakota 39 10.00 Virginia 39 3.34Alabama 40 10.00 Pennsylvania 40 3.24Florida 41 9.82 South Carolina 41 3.16Delaware 42 9.60 Utah 42 3.15Montana 43 9.45 Florida 43 2.91Arizona 44 9.25 Arkansas 44 2.60Arkansas 45 9.21 Texas 45 2.54North Carolina 46 8.89 Arizona 46 2.51California 47 8.40 Tennessee 47 2.45West Virginia 48 8.22 California 48 2.39Georgia 49 8.13 Nevada 49 2.16Texas 50 8.09 North Carolina 50 2.09Tennessee 51 7.89 Georgia 51 1.97† Not applicable.1Per 25,000 population is based on the total unduplicated population of legal service areas.
3Caution should also be used in making comparisons with the state of Hawaii, as Hawaii reports only one public library for the entire state.SOURCE: Institute of Museum and Library Services, Survey of Public Libraries in the United States, Fiscal Year 2007.
Table A6. per 25,000 population, by state: Fiscal year 2007
Appendix A—Public Library State Ranking Tables
2The District of Columbia, while not a state, is included in the state rankings. Special care should be used in comparing its data to state data.
Table A6. Number of paid full-time-equivalent (FTE) staff and paid FTE librarians of public libraries
150
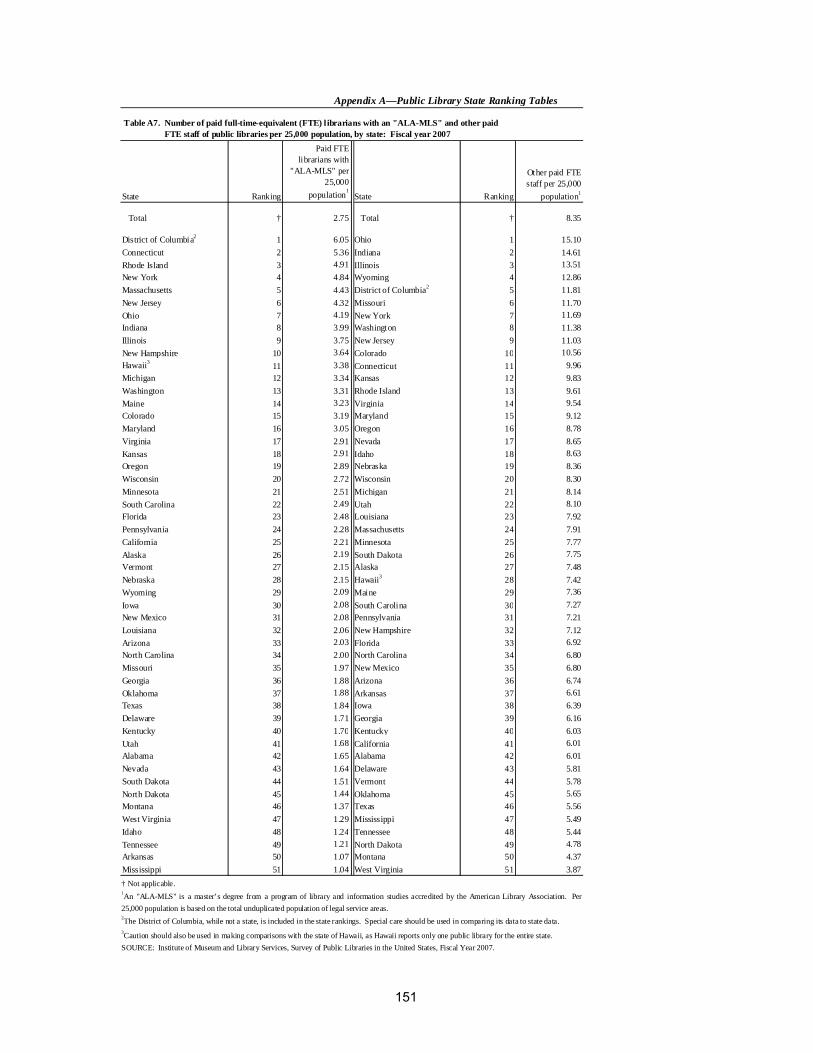
State Ranking
Paid FTE librarians with
"ALA-MLS" per 25,000
population1State Ranking
Other paid FTE staff per 25,000
population1
Total † 2.75 Total † 8.35
District of Columbia2 1 6.05 Ohio 1 15.10Connecticut 2 5.36 Indiana 2 14.61Rhode Island 3 4.91 Illinois 3 13.51New York 4 4.84 Wyoming 4 12.86Massachusetts 5 4.43 District of Columbia2 5 1New Jersey 6 4.32 Missouri 6 11.70Ohio 7 4.19 New York 7 11.69Indiana 8 3.99 Washington 8 11.38Illinois 9 3.75 New Jersey 9 11.03New Hampshire 10 3.64 Colorado 1
1.81
0 10.56Hawaii3 11 3.38 Connecticut 11 9.96Michigan 12 3.34 Kansas 12 9.83Washington 13 3.31 Rhode Island 13 9.61Maine 14 3.23 Virginia 14 9.54Colorado 15 3.19 Maryland 15 9.12Maryland 16 3.05 Oregon 16 8.78Virginia 17 2.91 Nevada 17 8.65Kansas 18 2.91 Idaho 18 8.63Oregon 19 2.89 Nebraska 19 8.36Wisconsin 20 2.72 Wisconsin 20 8.30Minnesota 21 2.51 Michigan 21 8.14South Carolina 22 2.49 Utah 22 8.10Florida 23 2.48 Louisiana 23 7.92Pennsylvania 24 2.28 Massachusetts 24 7.91California 25 2.21 Minnesota 25 7.77Alaska 26 2.19 South Dakota 26 7.75Vermont 27 2.15 Alaska 27 7.48Nebraska 28 2.15 Hawaii3 28 7.42Wyoming 29 2.09 Maine 29 7.36Iowa 30 2.08 South Carolina 30 7.27New Mexico 31 2.08 Pennsylvania 31 7.21Louisiana 32 2.06 New Hampshire 32 7.12Arizona 33 2.03 Florida 33 6.92North Carolina 34 2.00 North Carolina 34 6.80Missouri 35 1.97 New Mexico 35 6.80Georgia 36 1.88 Arizona 36 6.74Oklahoma 37 1.88 Arkansas 37 6.61Texas 38 1.84 Iowa 38 6.39Delaware 39 1.71 Georgia 39 6.16Kentucky 40 1.70 Kentucky 40 6.03Utah 41 1.68 California 41 6.01Alabama 42 1.65 Alabama 42 6.01Nevada 43 1.64 Delaware 43 5.81South Dakota 44 1.51 Vermont 44 5.78North Dakota 45 1.44 Oklahoma 45 5.65Montana 46 1.37 Texas 46 5.56West Virginia 47 1.29 Mississippi 47 5.49Idaho 48 1.24 Tennessee 48 5.44Tennessee 49 1.21 North Dakota 49 4.78Arkansas 50 1.07 Montana 50 4.37Mississippi 51 1.04 West Virginia 51 3.87† Not applicable.
Appendix A—Public Library State Ranking Tables
2The District of Columbia, while not a state, is included in the state rankings. Special care should be used in comparing its data to state data. 3Caution should also be used in making comparisons with the state of Hawaii, as Hawaii reports only one public library for the entire state.SOURCE: Institute of Museum and Library Services, Survey of Public Libraries in the United States, Fiscal Year 2007.
1An "ALA-MLS" is a master’s degree from a program of library and information studies accredited by the American Library Association. Per25,000 population is based on the total unduplicated population of legal service areas.
Table A7. Number of paid full-time-equivalent (FTE) l ibrarians with an "ALA-MLS" and other paid Table A7. FTE staff of public libraries per 25,000 population, by state: Fiscal year 2007
151
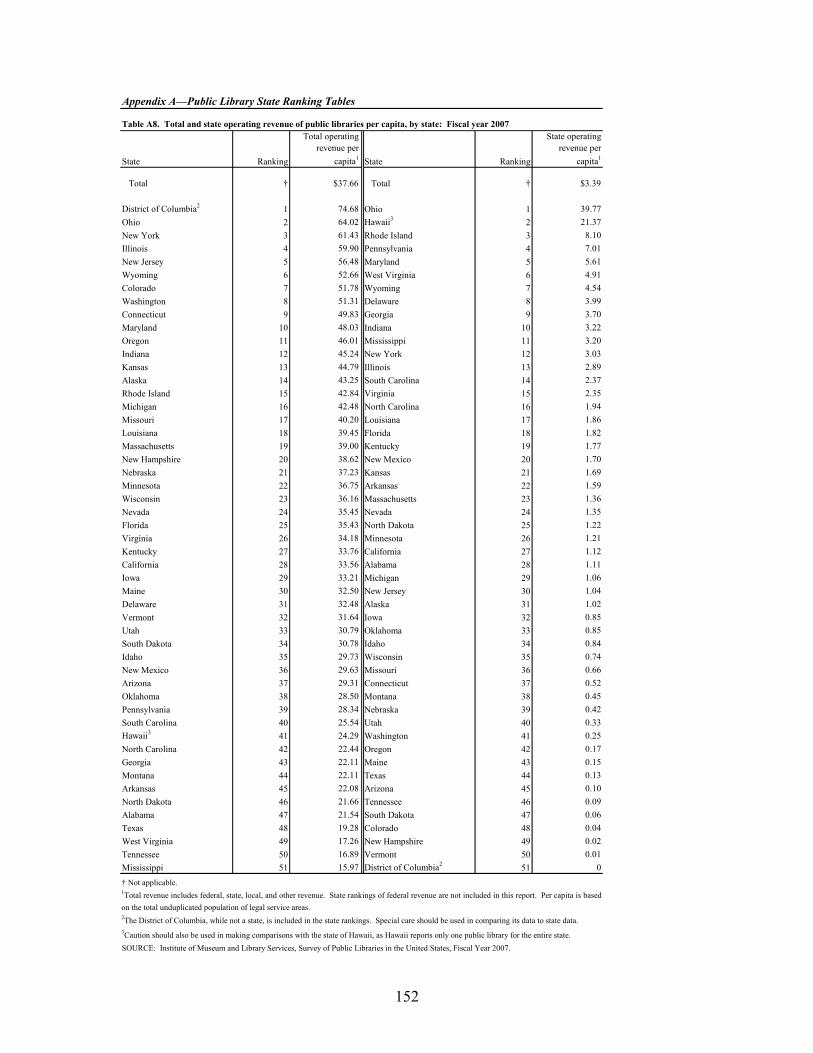
152
State Ranking
Total operating revenue per
capita1 State Ranking
State operating revenue per
capita1
Total † $37.66 Total † $3.39
District of Columbia2 1 74.68 Ohio 1 39.77Ohio 2 64.02 Hawaii3 2 21.37New York 3 61.43 Rhode Island 3 8.10Illinois 4 59.90 Pennsylvania 4 7.01New Jersey 5 56.48 Maryland 5 5.61Wyoming 6 52.66 West Virginia 6 4.91Colorado 7 51.78 Wyoming 7 4.54Washington 8 51.31 Delaware 8 3.99Connecticut 9 49.83 Georgia 9 3.70Maryland 10 48.03 Indiana 10 3.22Oregon 11 46.01 Mississippi 11 3.20Indiana 12 45.24 New York 12 3.03Kansas 13 44.79 Illinois 13 2.89Alaska 14 43.25 South Carolina 14 2.37Rhode Island 15 42.84 Virginia 15 2.35Michigan 16 42.48 North Carolina 16 1.94Missouri 17 40.20 Louisiana 17 1.86Louisiana 18 39.45 Florida 18 1.82Massachusetts 19 39.00 Kentucky 19 1.77New Hampshire 20 38.62 New Mexico 20 1.70Nebraska 21 37.23 Kansas 21 1.69Minnesota 22 36.75 Arkansas 22 1.59Wisconsin 23 36.16 Massachusetts 23 1.36Nevada 24 35.45 Nevada 24 1.35Florida 25 35.43 North Dakota 25 1.22Virginia 26 34.18 Minnesota 26 1.21Kentucky 27 33.76 California 27 1.12California 28 33.56 Alabama 28 1.11Iowa 29 33.21 Michigan 29 1.06Maine 30 32.50 New Jersey 30 1.04Delaware 31 32.48 Alaska 31 1.02Vermont 32 31.64 Iowa 32 0.85Utah 33 30.79 Oklahoma 33 0.85South Dakota 34 30.78 Idaho 34 0.84Idaho 35 29.73 Wisconsin 35 0.74New Mexico 36 29.63 Missouri 36 0.66Arizona 37 29.31 Connecticut 37 0.52Oklahoma 38 28.50 Montana 38 0.45Pennsylvania 39 28.34 Nebraska 39 0.42South Carolina 40 25.54 Utah 40 0.33Hawaii3 41 24.29 Washington 41 0.25North Carolina 42 22.44 Oregon 42 0.17Georgia 43 22.11 Maine 43 0.15Montana 44 22.11 Texas 44 0.13Arkansas 45 22.08 Arizona 45 0.10North Dakota 46 21.66 Tennessee 46 0.09Alabama 47 21.54 South Dakota 47 0.06Texas 48 19.28 Colorado 48 0.04West Virginia 49 17.26 New Hampshire 49 0.02Tennessee 50 16.89 Vermont 50 0.01Mississippi 51 15.97 District of Columbia2 51 0† Not applicable.
Appendix A—Public Library State Ranking Tables
2The District of Columbia, while not a state, is included in the state rankings. Special care should be used in comparing its data to state data. 3Caution should also be used in making comparisons with the state of Hawaii, as Hawaii reports only one public library for the entire state.SOURCE: Institute of Museum and Library Services, Survey of Public Libraries in the United States, Fiscal Year 2007.
1Total revenue includes federal, state, local, and other revenue. State rankings of federal revenue are not included in this report. Per capita is basedon the total unduplicated population of legal service areas.
Table A8. Total and state operating revenue of public libraries per capita, by state: Fiscal year 2007
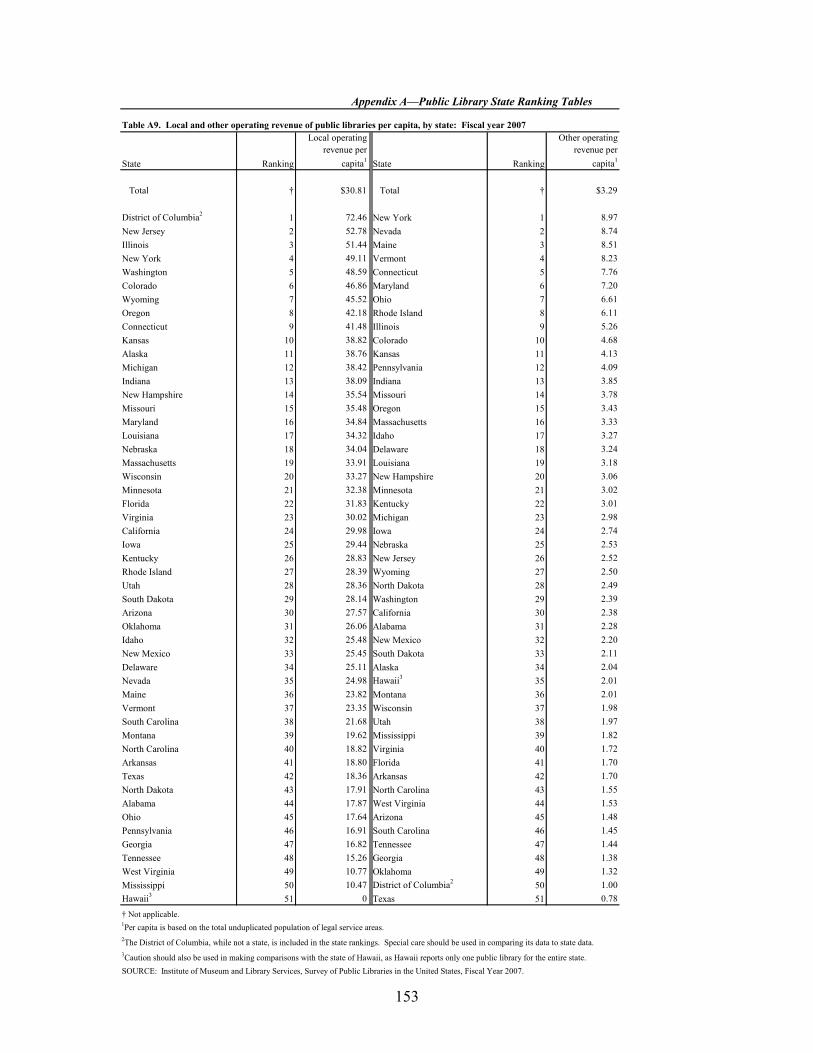
153
State Ranking
Local operating revenue per
capita1 State Ranking
Other operating revenue per
capita1
Total † $30.81 Total † $3.29
District of Columbia2 1 72.46 New York 1 8.97New Jersey 2 52.78 Nevada 2 8.74Illinois 3 51.44 Maine 3 8.51New York 4 49.11 Vermont 4 8.23Washington 5 48.59 Connecticut 5 7.76Colorado 6 46.86 Maryland 6 7.20Wyoming 7 45.52 Ohio 7 6.61Oregon 8 42.18 Rhode Island 8 6.11Connecticut 9 41.48 Illinois 9 5.26Kansas 10 38.82 Colorado 10 4.68Alaska 11 38.76 Kansas 11 4.13Michigan 12 38.42 Pennsylvania 12 4.09Indiana 13 38.09 Indiana 13 3.85New Hampshire 14 35.54 Missouri 14 3.78Missouri 15 35.48 Oregon 15 3.43Maryland 16 34.84 Massachusetts 16 3.33Louisiana 17 34.32 Idaho 17 3.27Nebraska 18 34.04 Delaware 18 3.24Massachusetts 19 33.91 Louisiana 19 3.18Wisconsin 20 33.27 New Hampshire 20 3.06Minnesota 21 32.38 Minnesota 21 3.02Florida 22 31.83 Kentucky 22 3.01Virginia 23 30.02 Michigan 23 2.98California 24 29.98 Iowa 24 2.74Iowa 25 29.44 Nebraska 25 2.53Kentucky 26 28.83 New Jersey 26 2.52Rhode Island 27 28.39 Wyoming 27 2.50Utah 28 28.36 North Dakota 28 2.49South Dakota 29 28.14 Washington 29 2.39Arizona 30 27.57 California 30 2.38Oklahoma 31 26.06 Alabama 31 2.28Idaho 32 25.48 New Mexico 32 2.20New Mexico 33 25.45 South Dakota 33 2.11Delaware 34 25.11 Alaska 34 2.04Nevada 35 24.98 Hawaii3 35 2.01Maine 36 23.82 Montana 36 2.01Vermont 37 23.35 Wisconsin 37 1.98South Carolina 38 21.68 Utah 38 1.97Montana 39 19.62 Mississippi 39 1.82North Carolina 40 18.82 Virginia 40 1.72Arkansas 41 18.80 Florida 41 1.70Texas 42 18.36 Arkansas 42 1.70North Dakota 43 17.91 North Carolina 43 1.55Alabama 44 17.87 West Virginia 44 1.53Ohio 45 17.64 Arizona 45 1.48Pennsylvania 46 16.91 South Carolina 46 1.45Georgia 47 16.82 Tennessee 47 1.44Tennessee 48 15.26 Georgia 48 1.38West Virginia 49 10.77 Oklahoma 49 1.32Mississippi 50 10.47 District of Columbia2 50 1.00Hawaii3 51 0 Texas 51 0.78† Not applicable.1Per capita is based on the total unduplicated population of legal service areas.
Appendix A—Public Library State Ranking Tables
2The District of Columbia, while not a state, is included in the state rankings. Special care should be used in comparing its data to state data. 3Caution should also be used in making comparisons with the state of Hawaii, as Hawaii reports only one public library for the entire state.SOURCE: Institute of Museum and Library Services, Survey of Public Libraries in the United States, Fiscal Year 2007.
Table A9. Local and other operating revenue of public libraries per capita, by state: Fiscal year 2007
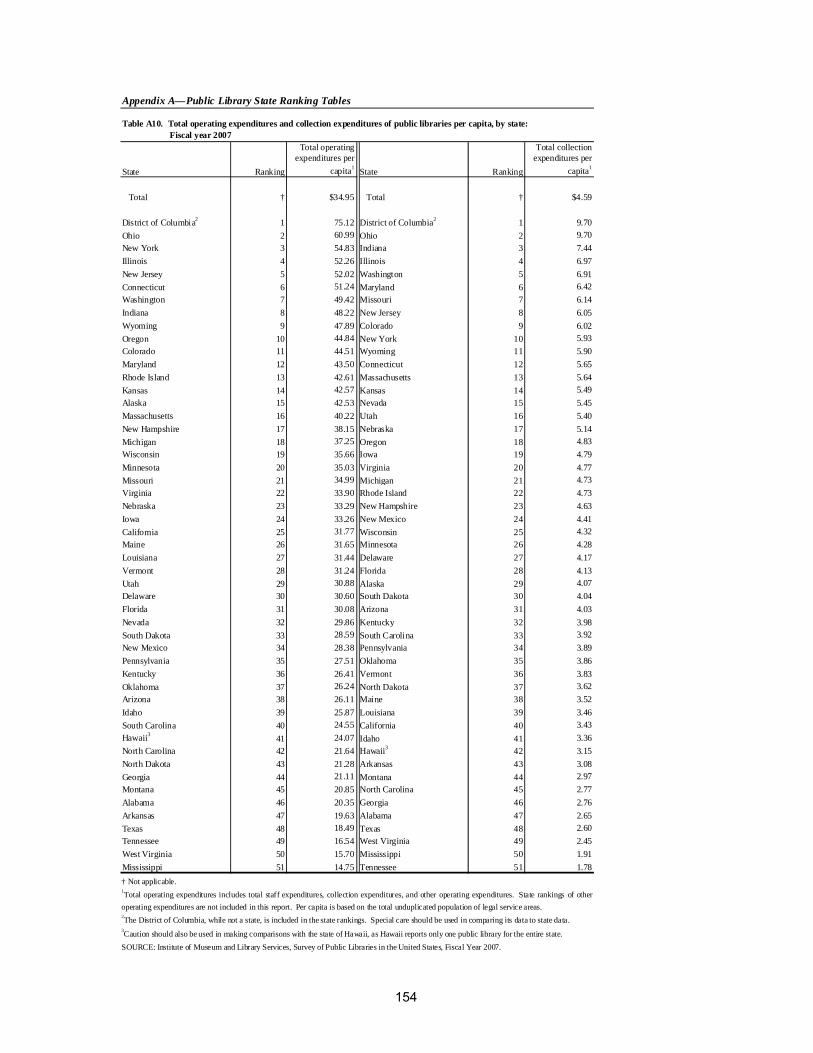
State Ranking
Total operating expenditures per
capita1 State Ranking
Total collection expenditures per
capita1
Total † $34.95 Total † $4.59
District of Columbia2 1 75.12 District of Columbia2 1 9Ohio 2 60.99 Ohio 2 9.70New York 3 54.83 Indiana 3 7.44Illinois 4 52.26 Illinois 4 6.97New Jersey 5 52.02 Washington 5 6.91Connecticut 6 51.24 Mar
.70
yland 6 6.42Washington 7 49.42 Missouri 7 6.14Indiana 8 48.22 New Jersey 8 6.05Wyoming 9 47.89 Colorado 9 6.02Oregon 10 44.84 New York 10 5.93Colorado 11 44.51 Wyoming 11 5.90Maryland 12 43.50 Connecticut 12 5.65Rhode Island 13 42.61 Massachusetts 13 5.64Kansas 14 42.57 Kansas 14 5.49Alaska 15 42.53 Nevada 15 5.45Massachusetts 16 40.22 Utah 16 5.40New Hampshire 17 38.15 Nebraska 17 5.14Michigan 18 37.25 Oregon 18 4.83Wisconsin 19 35.66 Iowa 19 4.79Minnesota 20 35.03 Virginia 20 4.77Missouri 21 34.99 Michigan 21 4.73Virginia 22 33.90 Rhode Island 22 4.73Nebraska 23 33.29 New Hampshire 23 4.63Iowa 24 33.26 New Mexico 24 4.41California 25 31.77 Wisconsin 25 4.32Maine 26 31.65 Minnesota 26 4.28Louisiana 27 31.44 Delaware 27 4.17Vermont 28 31.24 Florida 28 4.13Utah 29 30.88 Alaska 29 4.07Delaware 30 30.60 South Dakota 30 4.04Florida 31 30.08 Arizona 31 4.03Nevada 32 29.86 Kentucky 32 3.98South Dakota 33 28.59 South Carolina 33 3.92New Mexico 34 28.38 Pennsylvania 34 3.89Pennsylvania 35 27.51 Oklahoma 35 3.86Kentucky 36 26.41 Vermont 36 3.83Oklahoma 37 26.24 North Dakota 37 3.62Arizona 38 26.11 Maine 38 3.52Idaho 39 25.87 Louisiana 39 3.46South Carolina 40 24.55 California 40 3.43Hawaii3 41 24.07 Idaho 41 3.36North Carolina 42 21.64 Hawaii3 42 3.15North Dakota 43 21.28 Arkansas 43 3.08Georgia 44 21.11 Montana 44 2.97Montana 45 20.85 North Carolina 45 2.77Alabama 46 20.35 Georgia 46 2.76Arkansas 47 19.63 Alabama 47 2.65Texas 48 18.49 Texas 48 2.60Tennessee 49 16.54 West Virginia 49 2.45West Virginia 50 15.70 Mississippi 50 1.91Mississippi 51 14.75 Tennessee 51 1.78† Not applicable.
Appendix A—Public Library State Ranking Tables
2The District of Columbia, while not a state, is included in the state rankings. Special care should be used in comparing its data to state data. 3Caution should also be used in making comparisons with the state of Hawaii, as Hawaii reports only one public library for the entire state.SOURCE: Institute of Museum and Library Services, Survey of Public Libraries in the United States, Fiscal Year 2007.
1Total operating expenditures includes total staff expenditures, collection expenditures, and other operating expenditures. State rankings of otheroperating expenditures are not included in this report. Per capita is based on the total unduplicated population of legal service areas.
Table A10. Total operating expenditures and collection expenditures of public libraries per capita, by state:Table A10. Fiscal year 2007
154
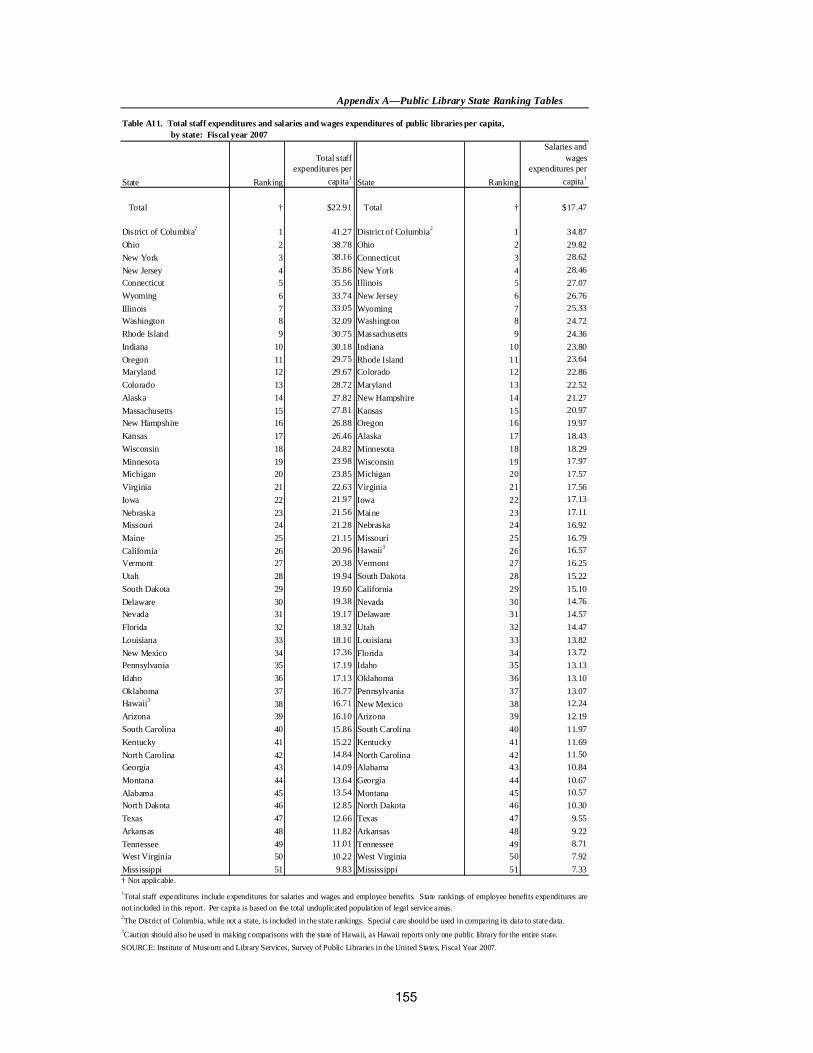
State Ranking
Total staff expenditures per
capita1 State Ranking
Salaries and wages
expenditures per capita1
Total † $22.91 Total † $17.47
District of Columbia2 1 41.27 District of Columbia2 1 34.87Ohio 2 38.78 Ohio 2 29.82New York 3 38.16 Connecticut 3 28.62New Jersey 4 35.86 New York 4 28.46Connecticut 5 35.56 Illinois 5 27.07Wyoming 6 33.74 New Jersey 6 26.76Illinois 7 33.05 Wyoming 7 25.33Washington 8 32.09 Washington 8 24.72Rhode Island 9 30.75 Massachusetts 9 24.36Indiana 10 30.18 Indiana 10 23.80Oregon 11 29.75 Rhode Island 11 23.64Maryland 12 29.67 Colorado 12 22.86Colorado 13 28.72 Maryland 13 22.52Alaska 14 27.82 New Hampshire 14 21.27Massachusetts 15 27.81 Kansas 15 20.97New Hampshire 16 26.88 Oregon 16 19.97Kansas 17 26.46 Alaska 17 18.43Wisconsin 18 24.82 Minnesota 18 18.29Minnesota 19 23.98 Wisconsin 19 17.97Michigan 20 23.85 Michigan 20 17.57Virginia 21 22.63 Virginia 21 17.56Iowa 22 21.97 Iowa 22 17.13Nebraska 23 21.56 Maine 23 17.11Missouri 24 21.28 Nebraska 24 16.92Maine 25 21.15 Missouri 25 16.79California 26 20.96 Hawaii3 26 16.57Vermont 27 20.38 Vermont 27 16.25Utah 28 19.94 South Dakota 28 15.22South Dakota 29 19.60 California 29 15.10Delaware 30 19.38 Nevada 30 14.76Nevada 31 19.17 Delaware 31 14.57Florida 32 18.32 Utah 32 14.47Louisiana 33 18.10 Louisiana 33 13.82New Mexico 34 17.36 Florida 34 13.72Pennsylvania 35 17.19 Idaho 35 13.13Idaho 36 17.13 Oklahoma 36 13.10Oklahoma 37 16.77 Pennsylvania 37 13.07Hawaii3 38 16.71 New Mexico 38 12.24Arizona 39 16.10 Arizona 39 12.19South Carolina 40 15.86 South Carolina 40 11.97Kentucky 41 15.22 Kentucky 41 11.69North Carolina 42 14.84 North Carolina 42 11.50Georgia 43 14.09 Alabama 43 10.84Montana 44 13.64 Georgia 44 10.67Alabama 45 13.54 Montana 45 10.57North Dakota 46 12.85 North Dakota 46 10.30Texas 47 12.66 Texas 47 9.55Arkansas 48 11.82 Arkansas 48 9.22Tennessee 49 11.01 Tennessee 49 8.71West Virginia 50 10.22 West Virginia 50 7.92Mississippi 51 9.83 Mississippi 51 7.33† Not applicable.
Appendix A—Public Library State Ranking Tables
2The District of Columbia, while not a state, is included in the state rankings. Special care should be used in comparing its data to state data.
SOURCE: Institute of Museum and Library Services, Survey of Public Libraries in the United States, Fiscal Year 2007.
3Caution should also be used in making comparisons with the state of Hawaii, as Hawaii reports only one public library for the entire state.
1Total staff expenditures include expenditures for salaries and wages and employee benefits. State rankings of employee benefits expenditures arenot included in this report. Per capita is based on the total unduplicated population of legal service areas.
Table A11. Total staff expenditures and salaries and wages expenditures of public libraries per capita, by state: Fiscal year 2007
155

(Page is intentionally blank.)
156
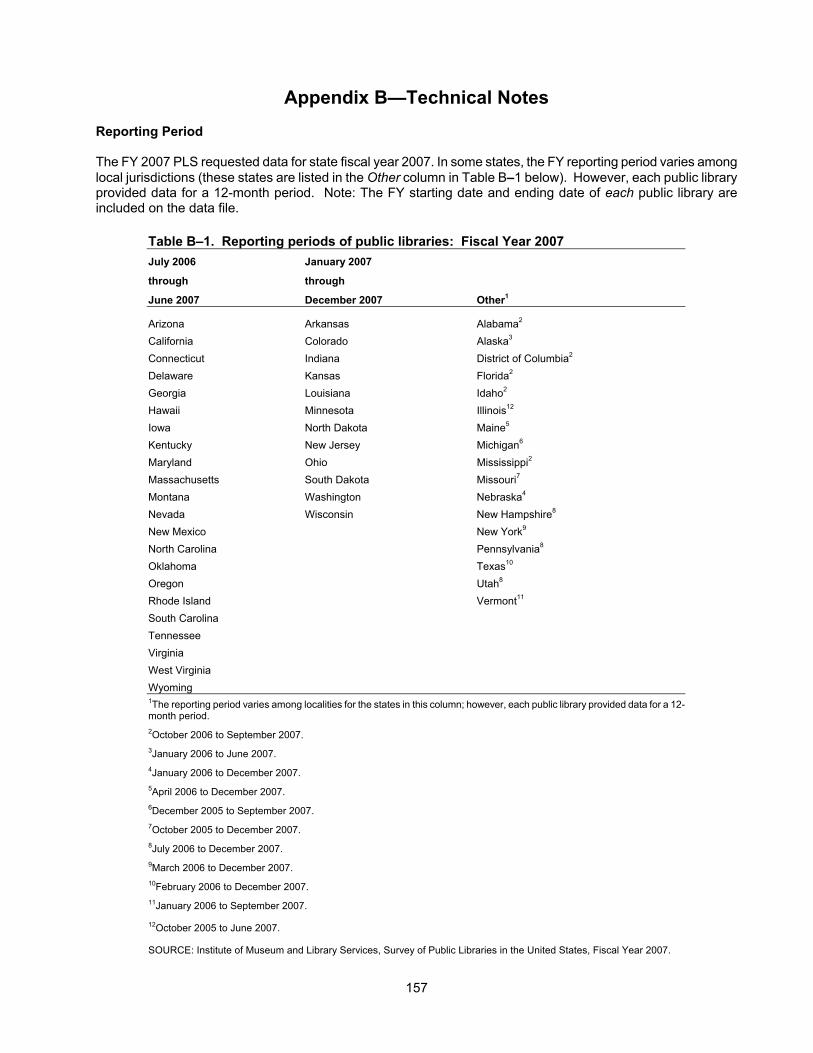
Appendix B—Technical Notes Reporting Period The FY 2007 PLS requested data for state fiscal year 2007. In some states, the FY reporting period varies among local jurisdictions (these states are listed in the Other column in Table B–1 below). However, each public library provided data for a 12-month period. Note: The FY starting date and ending date of each public library are included on the data file.
Table B–1. Reporting periods of public libraries: Fiscal Year 2007 July 2006 January 2007
through through
June 2007 December 2007 Other1
Arizona Arkansas Alabama2 California Colorado Alaska3 Connecticut Indiana District of Columbia2 Delaware Kansas Florida2 Georgia Louisiana Idaho2 Hawaii Minnesota Illinois12 Iowa North Dakota Maine5 Kentucky New Jersey Michigan6 Maryland Ohio Mississippi2 Massachusetts South Dakota Missouri7 Montana Washington Nebraska4 Nevada Wisconsin New Hampshire8 New Mexico New York9 North Carolina Pennsylvania8 Oklahoma Texas10 Oregon Utah8 Rhode Island Vermont11 South Carolina Tennessee Virginia West Virginia Wyoming 1The reporting period varies among localities for the states in this column; however, each public library provided data for a 12-month period. 2October 2006 to September 2007. 3January 2006 to June 2007. 4January 2006 to December 2007. 5April 2006 to December 2007. 6December 2005 to September 2007. 7October 2005 to December 2007. 8July 2006 to December 2007. 9March 2006 to December 2007. 10February 2006 to December 2007. 11January 2006 to September 2007.
12October 2005 to June 2007.
SOURCE: Institute of Museum and Library Services, Survey of Public Libraries in the United States, Fiscal Year 2007.
157
Calculations Included in the Tables Percentages rather than raw numbers are used in some tables to provide a clearer picture of data patterns. Percentage distributions may not sum to 100 due to rounding. To obtain a raw number from a percentage distribution table, multiply the percentage for the item by the total for the item. (The total may be in a different table.) For example, in Table 5, the number of public libraries in the 50 states and the District of Columbia with municipal government as their legal basis is 4,865 (9,214 x 0.528). The percentages are rounded, so multiplying a percentage by a total may not give an exact count for a desired category. Selected tables include per capita values for some items and per 1,000 population or per 5,000 population values for others (e.g., Tables 8 and 10). Scales (per capita, per 1,000, etc.) were selected to provide the clearest display of differences across categories in the data. The calculations are based on the total unduplicated population of legal service areas (instead of the total population of legal service areas) in order to eliminate duplicative reporting due to overlapping service areas. The state population estimate was not used as the basis for the calculations because some states have unserved populations. See Population items below for more information. Caveats for Using the Data The data include imputations, at the unit and item levels, for nonresponding libraries. (See the Imputation section for a discussion of the imputation methodology.) Comparisons to data prior to FY 1992 should be made with caution, as earlier data do not include imputations for nonresponse, and the percentage of libraries responding to a given item varied widely among the states. State data comparisons should be made with caution because of differences in reporting periods (see Table B–1) and adherence to survey definitions. The definitions used by some states in collecting data from their public libraries may not be consistent with the PLS definitions. The 1994 NCES Report on Coverage Evaluations of the Public Library Statistics Program (NCES 94-430) and the 1995 NCES Report on Evaluation of Definitions Used in the Public Library Statistics Program (NCES 95-430) address issues of consistency in definitions among states. For information on these reports, visit the NCES web site at: http://nces.ed.gov/pubsearch/getpubcats.asp?sid=041#052. The District of Columbia, while not a state, is included in this report. Special care should be used in comparing data for a city to state data. Caution should also be used in comparing Hawaii’s data to other states as all public library data are reported under one entity, the Hawaii State Public Library System. Survey Items A few key survey items are discussed below. The definitions of items included in this report are provided in the survey questionnaire in Appendix C. Library visits and reference transactions. Public libraries reported annual library visits and annual reference transactions based on actual counts, if available. Otherwise, annual estimates were provided based on a typical week in October, multiplied by 52. Population items. The PLS has three population items: (1) Population of Legal Service Area for each public library, (2) Total Unduplicated Population of Legal Service Areas for each state, and (3) State Total Population Estimate. The population data are provided by the state library agency. The methods of calculation of the first two items vary significantly among states, and the state reporting periods also vary. The Total Unduplicated Population of Legal Service Areas does not include unserved areas and may vary from data provided by sources using standard methodology (e.g., the Census Bureau). The total Population of Legal Service Area for all public libraries in a state may exceed the state’s Total Unduplicated Population of Legal Service Areas or the Official State Total Population Estimate. This happens in states where there are overlaps in population of legal service areas served by individual libraries, resulting in the same population being counted twice. Twenty-six states had such overlapping service areas in FY 2007. (See following table.)
158
Table B–2. States with public libraries with overlapping Table B–2. service areas: Fiscal Year 2007 Arkansas Mississippi
Colorado Nebraska
Connecticut New Hampshire
Delaware New Jersey
Florida New York
Idaho North Dakota
Indiana Ohio
Kansas Pennsylvania
Louisiana Rhode Island
Maine South Carolina
Massachusetts South Dakota
Michigan Tennessee
Minnesota Vermont
SOURCE: Institute of Museum and Library Services, Survey of Public Libraries in the United States, Fiscal Year 2007. To enable meaningful state comparisons using total Population of Legal Service Area data (for example, the number of print materials per capita), the Population of Legal Service Area data were adjusted to eliminate duplicative reporting due to overlapping service areas. The Public Library Data File includes a derived unduplicated population of legal service area figure for each library for this purpose (the variable is called POPU_UND). This value was prorated for each library by calculating the ratio of a library's Population of Legal Service Area to the state's total Population of Legal Service Area and applying the ratio to the state's Total Unduplicated Population of Legal Service Areas. (The latter item is a single, state-reported figure found on the Public Library State Summary/State Characteristics Data File; the variable is called POPU_UND on this file also.) Paid Full-Time-Equivalent (FTE) Staff. Paid staff were reported in FTEs (Table 14). To ensure comparable data, 40 hours was set as the measure of full-time employment (for example, 60 hours per week of part-time work by employees in a staff category divided by the 40-hour measure equals 1.50 FTEs). FTE data were reported to two decimal places (rounded to one decimal place in the tables). Survey Universe The PLS is designed as a universe survey. The survey frame consists of 9,217 public libraries (9,214 public libraries in the 50 states and the District of Columbia and 3 public libraries in the outlying areas of Guam, the Northern Mariana Islands, and the Virgin Islands), as identified by state library agencies. (Public libraries in two outlying areas, American Samoa and Puerto Rico, are not included in the survey frame because their state library agencies have never responded to the request for participation in the survey. Because their public libraries have not been identified, they are not included in the response rate calculations.) The survey frame (and the survey response rates in the next section) includes 293 public libraries that do not meet all the criteria in the FSCS Public Library Definition. (See Appendix C, item 203 of the Administrative Entity definitions for the criteria.) These libraries are included because they qualify as public libraries under state law. Military libraries that provide public library service and libraries that serve residents of institutions are not included. Data were not systematically collected from public libraries on Native American reservations, although 45 such libraries were reported. Survey Response Unit response. A total of 8,994 of the 9,217 public libraries in the survey frame responded to the FY 2007 PLS (with no outlying areas responding), for a unit response rate of 97.6 percent. Respondents to the survey are defined as public libraries for which the following data were reported: population of the legal service area and at least three of the five following items: total paid employees, total operating revenue, total operating expenditures, print materials, and total circulation. (Note: Some individual survey items, such as population of legal service area, service outlets, and type of legal basis have a 100.0 percent response rate for their state because the state library agency provided this data for all public libraries in their state.)
159
Total response. The base for calculating response rates to individual survey items is the total number of libraries in the survey frame, including unit nonrespondents. Data File and Publication Response Rates. The total response rates on the data file differ from the total response rates in the published report because the outlying areas of Guam, the Northern Mariana Islands, and the Virgin Islands are included on the data file. However, since the outlying areas were nonrespondents, they are not included in the published reports. Data Collection The FY 2007 PLS was released to the states over the Internet on December 12, 2007. States were placed into one of three reporting groups (with survey due dates of April 16, July 30, or August 27, 2008), based on their fiscal cycles or claim of extraordinary reporting hardship. States reported their data over the Internet via a web-based reporting system called WebPLUS (Web Public Library Universe System). WebPLUS was developed by the Census Bureau (the data collection agent). Edit follow-up was completed in December of 2008. The editing process is described below. Editing State level. The respondent generates an edit report following direct data entry or import of their data into WebPLUS. The edit report, which can be viewed on-screen or printed, is used to identify and correct any errors, and to confirm the accuracy of data that generated edit warnings but required no change, before submitting the final file to the Census Bureau. In the FY 2007 PLS, four types of edit checks were performed: 1. Relational edit checks. This is a data consistency check between related data elements. For example, an
edit message is generated if the number of “ALA-MLS” Librarians (librarians with master’s degrees from programs of library and information studies accredited by the American Library Association) is greater than “Total Librarians.”
2. Out-of-range edit checks. This is a range check that compares the data reported for an item to the
“acceptable range” of numeric values for the item. For example, an edit message is generated if average Public Service Hours per outlet per week is less than 11.16 or greater than 129.67, or if the current year/past year change in Children’s Circulation is less than 0.30 or greater than 3.44.
3. Arithmetic edit checks. This is an arithmetical accuracy check of a reported total and its parts to the
generated total. For example, an edit message is generated if Total Operating Revenue is not equal to the sum of its parts (Local Government Revenue, State Government Revenue, Federal Government Revenue, and Other Revenue).
4. Blank, zero, or invalid data edit checks. This is a check of reported data against acceptable values. For
example, an edit message is generated if the Reporting Period Start Date is missing, or Print Materials is 0, or the Legal Basis Code is not a valid code.
The WebPLUS application generates state summary tables (showing state totals for all numeric data items) and single-library tables (showing data for individual public libraries in a state). Respondents were encouraged to review the tables for data quality issues before submitting their data. State data submissions also included a signed form from the Chief Officer of the State Library Agency certifying the accuracy of the data. National level. The Census Bureau and IMLS reviewed and edited the state data submissions, working closely with the PLS State Data Coordinators.
160
Imputation When responses are submitted for processing, sometimes answers are not given for every data item. In order to make complete datasets for constructing estimates of totals, we need to impute for the missing data items. This section describes the imputation methods that were used to fill in for the missing data. All libraries, including nonresponding libraries, were sorted into imputation cells based on the region and size of population served. Imputations for nonresponding libraries were performed using the data calculated from respondents in their imputation cells. Item imputation was performed on each record with nonresponse variables. The data are identified as either imputed or reported on the survey data file through the use of imputation codes. The following imputation rules were applied: A. For libraries that responded in FY 2006 but not FY 2007 (or in FY 2005 but not in FY 2006 or FY 2007):
A1. The mean growth rates (Method 1) were calculated for institutions that reported in both FY 2006 and
FY 2007 (or in both FY 2005 and FY 2007). The average rate was calculated for each imputation cell.
A2. The average change rates computed in Step A1 were applied to the FY 2006 data (or FY 2005 data) of FY 2007 nonresponding libraries to obtain an imputation for FY 2007.
Method 1 was used for imputing centrals, branches, bookmobiles, ALA-MLS librarians, total librarians, other paid employees, print materials, current print serial subscriptions, audio, public service hours, library visits, reference transactions, capital revenue, databases, electronic books, current electronic serial subscriptions, total circulation, total staff expenditures, total collection expenditures, total operating expenditures, total library programs, children’s library programs, total program attendance and total expenditures.
A3. Other operating expenditures was derived by subtracting total operating expenditures from the sum of
total collection expenditures and total staff expenditures imputed in Step A2. A4. The hot-deck growth rate (Method 2) was used for imputing revenue variables (i.e., other revenue and
revenue from federal, state, and local government sources). Both responding and nonresponding libraries in an imputation cell were arranged in decreasing order of size of population served. A nonresponding library’s FY 2006 (or FY 2005) data were pulled forward, and a growth rate was determined by calculating the growth of the next smallest library to the nonresponding library that had data for both FY 2007 and FY 2006 (or FY 2007 and FY 2005). This hot-deck growth rate method was applied to the nonresponding library’s FY 2006 (or FY 2005) data to obtain an estimate for FY 2007. If no prior year growth rate was available for the next smallest library, the growth rate was assumed to be 1.00.
A5. Total operating revenue was derived by adding revenue from federal, state, and local sources and
other revenue. Total paid employees was derived by adding librarians and other paid employees.
A6. Children’s program attendance was imputed by multiplying the current-year total library visits by the prior-year ratio of children’s program attendance to total library visits.
A7. Children’s circulation was imputed by multiplying the current-year total circulation by the prior-year
ratio of children’s circulation to total circulation. A8. Electronic materials expenditures was set to zero if the total of collection expenditures was equal to
zero. A9. For general public Internet terminals, if there were FY 2006 or FY 2005 reported data, the data were
carried forward as an imputation for FY 2007.
A10. For population variables, the prior year data were carried forward in the current year.
161
A11. The electronic users variable was imputed by multiplying the current-year general public Internet terminals by the prior-year (FY 2006 or FY 2005) ratio of electronic users to general public Internet terminals.
A12. Salaries data were derived by multiplying the total staff expenditures (reported or imputed by Step
A2), by the cell median ratio of salaries to total staff expenditures.
A13. Employee benefits was derived by subtracting salaries (reported or imputed by Step A12) from the total staff expenditures (reported or imputed by Step A2).
A14. Print materials expenditures data were derived by multiplying total collection expenditures (reported or
imputed in Step A2), by the prior year ratio of print materials expenditures to total collection expenditures. If total collection expenditures could not be used then total operating expenditures was substituted for that variable.
A15. Other materials expenditures data were derived by multiplying total collection expenditures (reported
or imputed in Step A2), by the prior year ratio of other materials expenditures to total collection expenditures if total collection expenditures data were imputed. If total collection expenditures could not be used then total operating expenditures was substituted for that variable.
A16. Other materials expenditures data were derived by subtracting the sum of print materials expenditures
and electronic materials expenditures from total collection expenditures if total collection expenditures data were reported.
A17. Capital revenue was derived by multiplying capital expenditures times the prior year ratio of capital
revenue to capital expenditures.
A18. Federal government capital revenue, state government capital revenue, and local government capital revenue were derived by multiplying total capital revenue by the prior year ratio of federal government capital revenue, state government capital revenue, or local government capital revenue to total capital revenue.
A19. Total library programs and children’s library programs were imputed to be zero if total library programs
attendance was zero.
A20. Total library programs and children’s library programs were derived by multiplying total library program attendance by the prior year ratio of total library programs or children’s library programs to total library programs attendance.
A21. Total library program attendance was derived by multiplying total library programs by the ratio of
children’s library program attendance to children’s library programs. B. For libraries with no reported data in FY 2005, FY 2006, or FY 2007:
B1. Method 1 (described in Steps A1 and A2) was used to impute for FY 2007 if the prior year data (FY 2006 or FY 2005) were imputed using prior year reported data and the imputed value was greater than zero.
This method was used for imputing centrals, branches, bookmobiles, ALA-MLS librarians, total librarians, other paid employees, print materials, current print serial subscriptions, audio, public service hours, reference transactions, total circulation, other revenue, revenue from federal, state, and local sources, total staff expenditures, total collection expenditures, other operating expenditures, and electronic materials expenditures.
162
B2. The mean of the imputation cell was calculated for all libraries that responded in FY 2007. For every nonrespondent that did not have prior year reported data, the cell mean was adjusted for the size of a nonresponding library by multiplying it by the ratio of the nonrespondent’s total population served to the mean size of population served for all responding libraries.
This method was used for imputing centrals, branches, bookmobiles, ALA-MLS librarians, total librarians, other paid employees, print materials, current print serial subscriptions, current electronic serial subscriptions, audio, public service hours, reference transactions, total circulation, other revenue, revenue from federal, state, and local sources, salaries, total staff expenditures, total collection expenditures, other operating expenditures, and electronic materials expenditures.
B3. To impute total library visits when the prior year imputed data were not based on reported data, library
visits was summed over all responding libraries in an imputation cell, as was the population served. The ratio of total library visits to total population served was multiplied by the nonrespondent’s population value to estimate the nonrespondent’s library visits.
B4. Children’s program attendance was imputed using the method described in Step B3 where the ratio of
total children’s program attendance to total library visits for the responding libraries in an imputation cell was multiplied by the nonrespondent’s current-year library visits.
B5. Children’s circulation was imputed by calculating the ratio of children’s circulation to total circulation
for the responding libraries in an imputation cell and multiplying the ratio by the current-year total circulation of the nonresponding library.
B6. Total staff expenditures was derived by adding salaries and employee benefits determined in Step B1
(or Step B2). Total operating revenue was derived by adding revenue from federal, state, and local sources and other revenue. Total paid employees was derived by adding librarians and other paid employees.
B7. Total operating expenditures was derived by summing total collection expenditures, total staff
expenditures, and other operating expenditures imputed in Step B1 (or Step B2).
B8. The median of the imputation cell was calculated for all libraries that responded in FY 2007. The cell median was not adjusted. This method was used for imputing general public Internet terminals when there was no reported prior year (FY 2006 or FY 2005) data. If the cell median was zero but based on the value of other electronic data items it was determined that the value should be greater than zero then the imputed value was equal to the unadjusted cell mean.
B9. The median ratio of electronic users to general public terminals was used to impute electronic users
when there were no reported (FY 2006 or FY 2005) data.
B10. The median of the imputation cell was calculated for all libraries that responded in FY 2007. The cell median was adjusted for the size of a nonresponding library by multiplying it by the ratio of the nonrespondent’s total population served to the mean size of population served for all responding libraries.
This method was used for imputing print materials expenditures, other materials expenditures, capital revenue, electronic books, and databases.
B11. Federal government capital revenue or local government capital revenue was derived by multiplying
total capital revenue by the median ratio of federal government capital revenue or local government capital revenue to total capital revenue.
B12. State government capital revenue was derived by multiplying total capital revenue by the mean ratio
of state government capital revenue to total capital revenue.
163
164
B13. Other capital revenue is imputed as the difference between total capital revenue and the detail
(federal government capital revenue + local government capital revenue). If the value is negative it is changed to be zero and the detail is proportionately distributed to equal the total.
B14. Total library programs and children’s library programs were imputed to be total library program
attendance multiplied by the median ratio of total library programs or children’s library programs to total library program attendance.
C. For all nonresponding libraries:
C1. Total capital expenditures was derived by imputing total expenditures (a derived variable which is the sum of total collections expenditures, total staff expenditures, other operating expenditures, and total capital expenditures) and subtracting total operating expenditures in order to get total capital expenditures. If the derived total capital expenditures had a negative value, it was changed to zero, the total operating expenditures value was changed to equal total expenditures, and total collection expenditures, total staff expenditures, and other operating expenditures were adjusted so that the sum would equal total operating expenditures. Alternatively, the cell mean (adjusted for population size) was used.
C2. The mean of the imputation cell was used to impute videos and interlibrary loans. The cell mean was
adjusted for the size of a nonresponding library by multiplying it by the ratio of the nonrespondent’s total population served to the mean size of population served for all responding libraries.
Nonsampling Errors Since all units in the universe are surveyed, the data are not subject to sampling error, but they are subject to nonsampling errors, such as errors in response, nonresponse errors, coverage errors arising from an incomplete listing of public libraries, coding errors, or processing errors. Every effort is made to mitigate such errors. The editing efforts described above are designed to decrease the number of errors due to inaccurate response or due to processing problems. Imputation lessens the effect of nonresponse. Efforts are made to obtain complete listings of public libraries from the state library agencies. Although such efforts are made, some nonsampling error likely remains in the data.
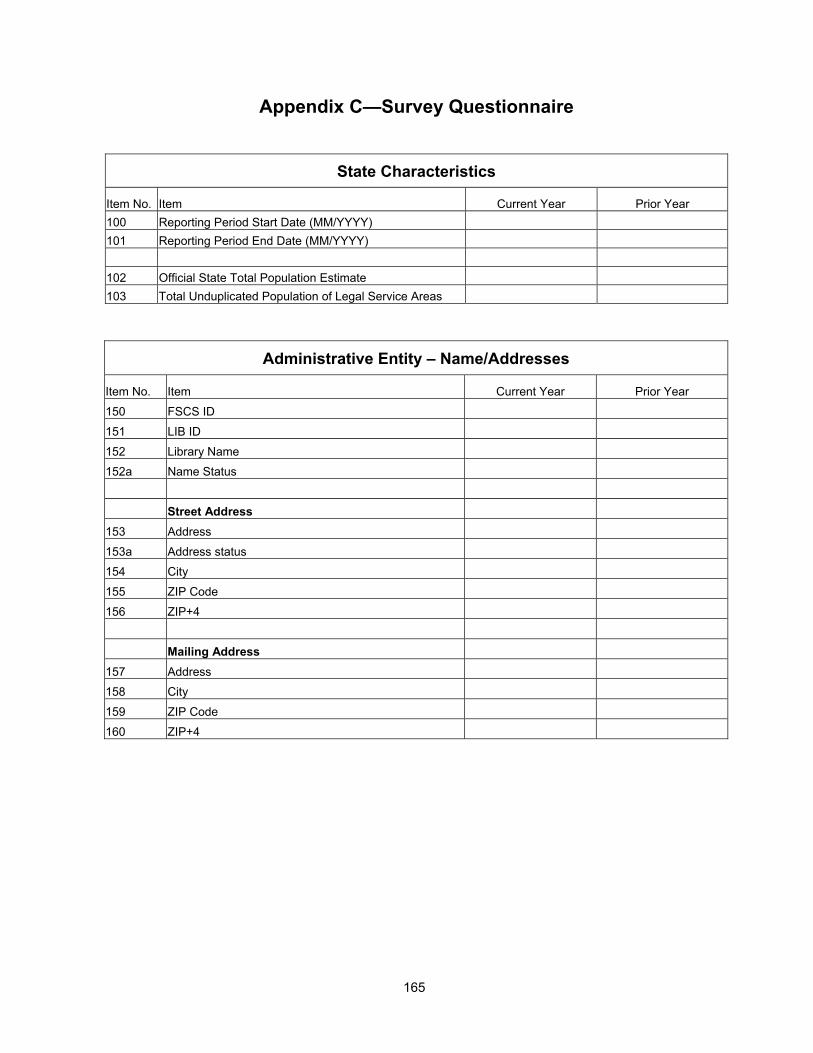
Appendix C—Survey Questionnaire
State Characteristics
Item No. Item Current Year Prior Year 100 Reporting Period Start Date (MM/YYYY) 101 Reporting Period End Date (MM/YYYY) 102 Official State Total Population Estimate 103 Total Unduplicated Population of Legal Service Areas
Administrative Entity – Name/Addresses
Item No. Item Current Year Prior Year
150 FSCS ID 151 LIB ID 152 Library Name 152a Name Status Street Address 153 Address 153a Address status 154 City 155 ZIP Code 156 ZIP+4 Mailing Address 157 Address 158 City 159 ZIP Code 160 ZIP+4
165
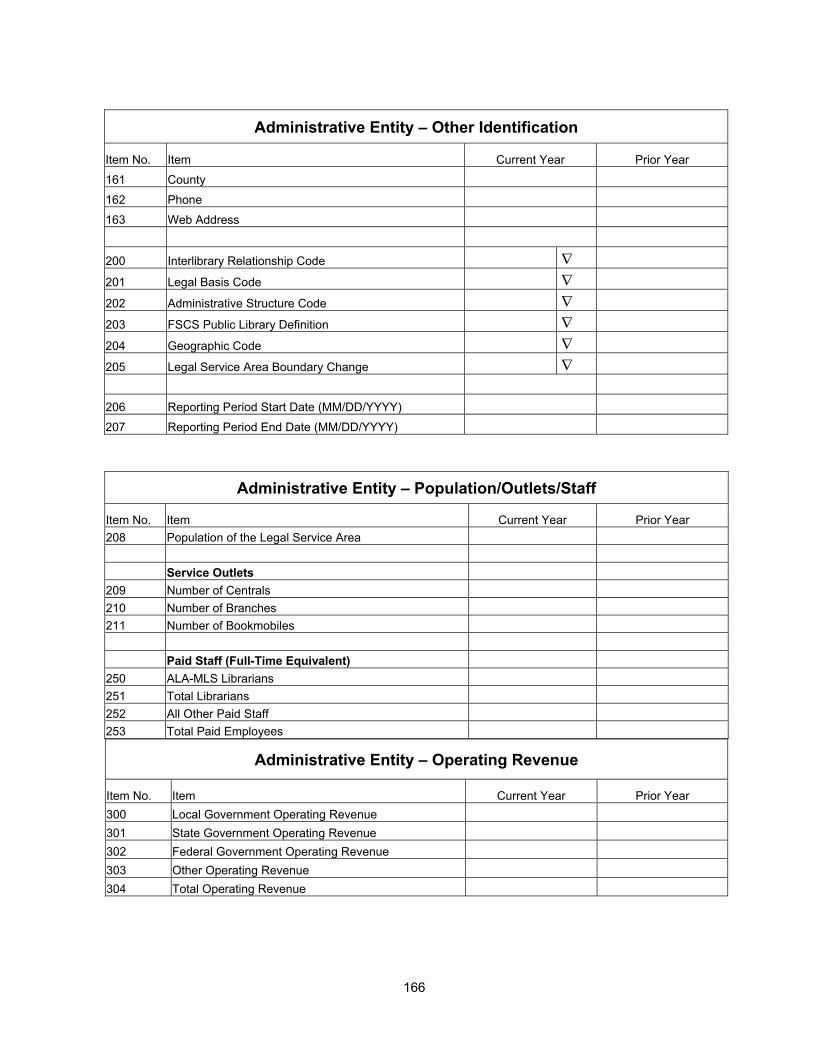
Administrative Entity – Other Identification
Item No. Item Current Year Prior Year
161 County 162 Phone 163 Web Address 200 Interlibrary Relationship Code ∇ 201 Legal Basis Code ∇ 202 Administrative Structure Code ∇ 203 FSCS Public Library Definition ∇ 204 Geographic Code ∇ 205 Legal Service Area Boundary Change ∇ 206 Reporting Period Start Date (MM/DD/YYYY) 207 Reporting Period End Date (MM/DD/YYYY)
Administrative Entity – Population/Outlets/Staff
Item No. Item Current Year Prior Year 208 Population of the Legal Service Area Service Outlets 209 Number of Centrals 210 Number of Branches 211 Number of Bookmobiles Paid Staff (Full-Time Equivalent) 250 ALA-MLS Librarians 251 Total Librarians 252 All Other Paid Staff 253 Total Paid Employees
Administrative Entity – Operating Revenue
Item No. Item Current Year Prior Year 300 Local Government Operating Revenue 301 State Government Operating Revenue 302 Federal Government Operating Revenue 303 Other Operating Revenue 304 Total Operating Revenue
166
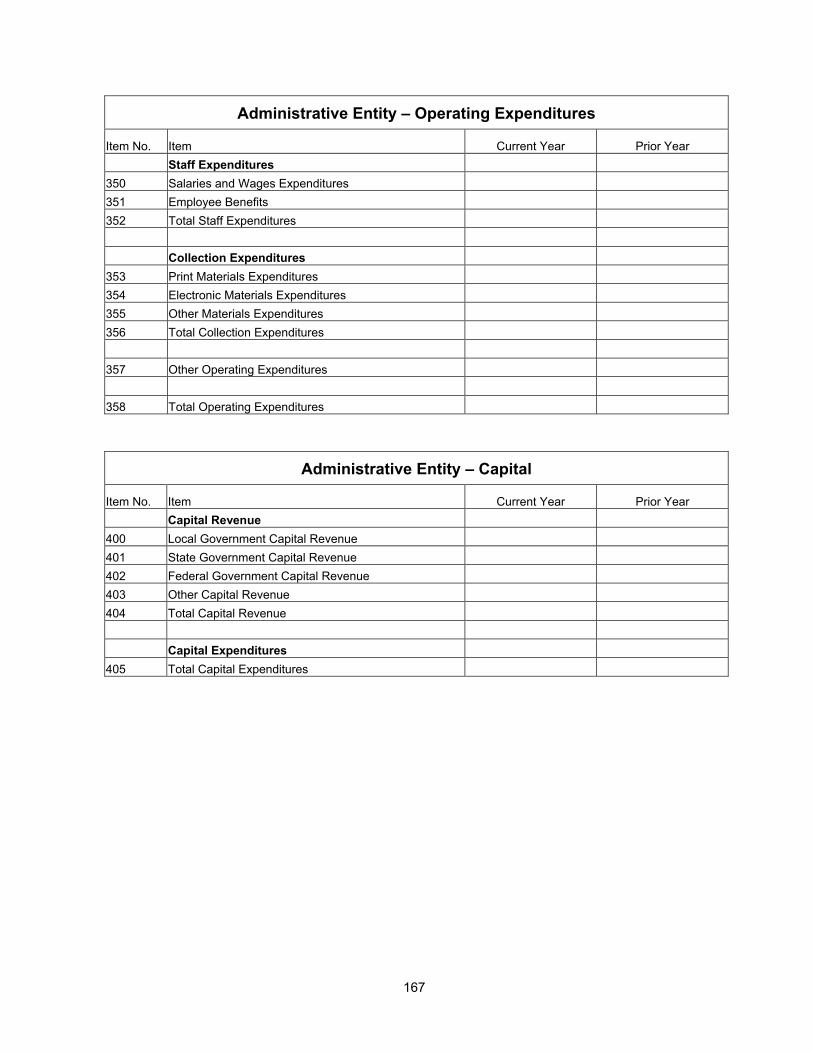
Administrative Entity – Operating Expenditures
Item No. Item Current Year Prior Year Staff Expenditures 350 Salaries and Wages Expenditures 351 Employee Benefits 352 Total Staff Expenditures Collection Expenditures 353 Print Materials Expenditures 354 Electronic Materials Expenditures 355 Other Materials Expenditures 356 Total Collection Expenditures 357 Other Operating Expenditures 358 Total Operating Expenditures
Administrative Entity – Capital
Item No. Item Current Year Prior Year Capital Revenue 400 Local Government Capital Revenue 401 State Government Capital Revenue 402 Federal Government Capital Revenue 403 Other Capital Revenue 404 Total Capital Revenue Capital Expenditures 405 Total Capital Expenditures
167
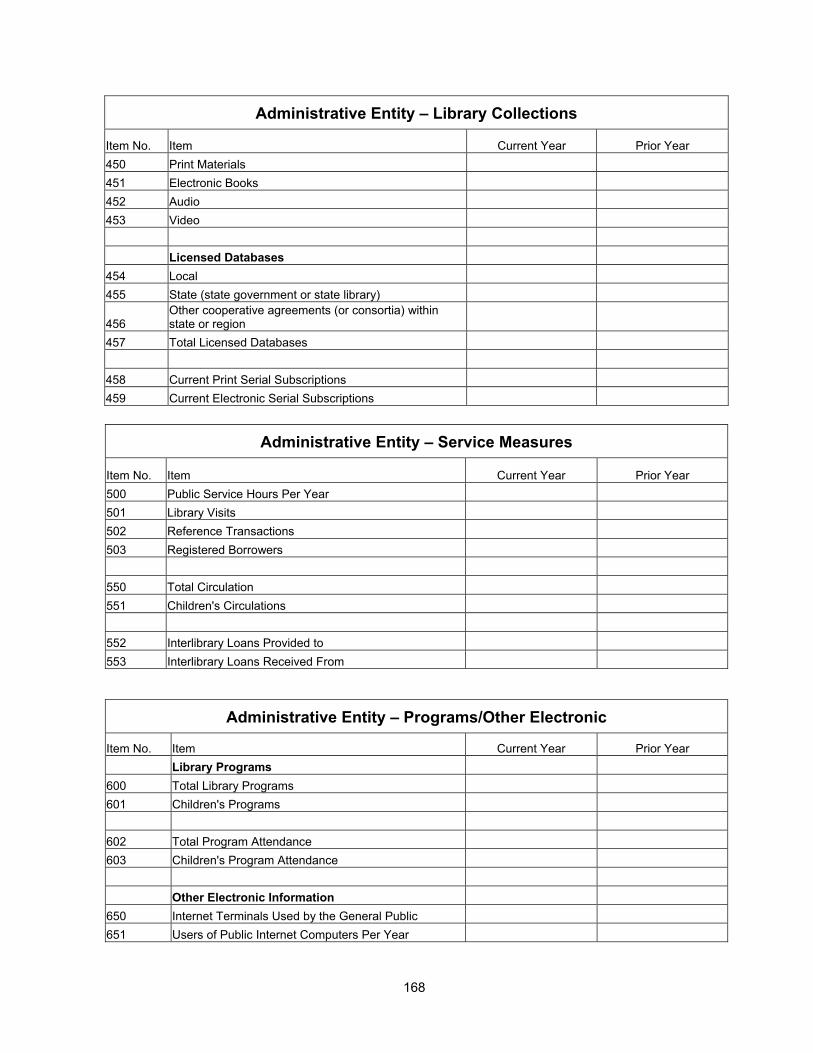
Administrative Entity – Library Collections
Item No. Item Current Year Prior Year 450 Print Materials 451 Electronic Books 452 Audio 453 Video Licensed Databases 454 Local 455 State (state government or state library)
456 Other cooperative agreements (or consortia) within state or region
457 Total Licensed Databases 458 Current Print Serial Subscriptions 459 Current Electronic Serial Subscriptions
Administrative Entity – Service Measures
Item No. Item Current Year Prior Year 500 Public Service Hours Per Year 501 Library Visits 502 Reference Transactions 503 Registered Borrowers 550 Total Circulation 551 Children's Circulations 552 Interlibrary Loans Provided to 553 Interlibrary Loans Received From
Administrative Entity – Programs/Other Electronic
Item No. Item Current Year Prior Year Library Programs 600 Total Library Programs 601 Children's Programs 602 Total Program Attendance 603 Children's Program Attendance Other Electronic Information 650 Internet Terminals Used by the General Public 651 Users of Public Internet Computers Per Year
168
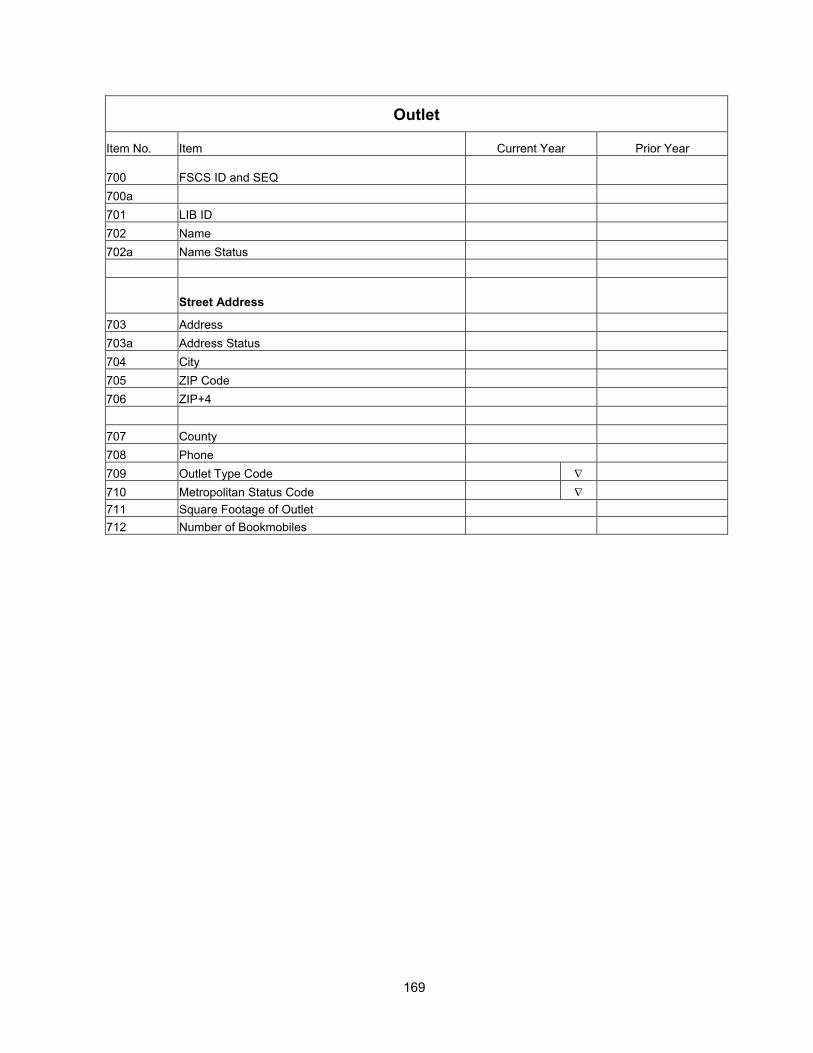
Outlet
Item No. Item Current Year Prior Year
700 FSCS ID and SEQ
700a 701 LIB ID 702 Name 702a Name Status
Street Address 703 Address 703a Address Status 704 City 705 ZIP Code 706 ZIP+4 707 County 708 Phone 709 Outlet Type Code ∇ 710 Metropolitan Status Code ∇ 711 Square Footage of Outlet 712 Number of Bookmobiles
169
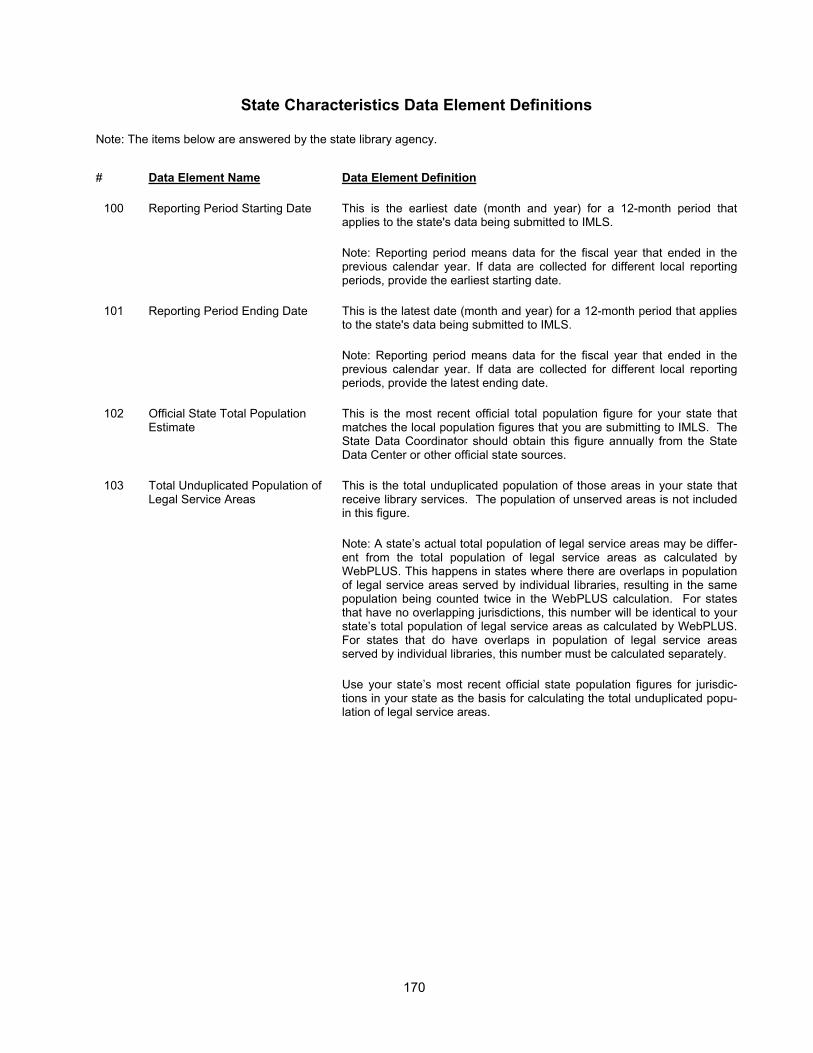
170
State Characteristics Data Element Definitions
Note: The items below are answered by the state library agency.
# Data Element Name Data Element Definition
100 Reporting Period Starting Date This is the earliest date (month and year) for a 12-month period that applies to the state's data being submitted to IMLS.
Note: Reporting period means data for the fiscal year that ended in the previous calendar year. If data are collected for different local reporting periods, provide the earliest starting date.
101 Reporting Period Ending Date This is the latest date (month and year) for a 12-month period that applies to the state's data being submitted to IMLS.
Note: Reporting period means data for the fiscal year that ended in the previous calendar year. If data are collected for different local reporting periods, provide the latest ending date.
102 Official State Total Population Estimate
This is the most recent official total population figure for your state that matches the local population figures that you are submitting to IMLS. The State Data Coordinator should obtain this figure annually from the State Data Center or other official state sources.
103 Total Unduplicated Population of Legal Service Areas
This is the total unduplicated population of those areas in your state that receive library services. The population of unserved areas is not included in this figure.
Note: A state’s actual total population of legal service areas may be differ-ent from the total population of legal service areas as calculated by WebPLUS. This happens in states where there are overlaps in population of legal service areas served by individual libraries, resulting in the same population being counted twice in the WebPLUS calculation. For states that have no overlapping jurisdictions, this number will be identical to your state’s total population of legal service areas as calculated by WebPLUS. For states that do have overlaps in population of legal service areas served by individual libraries, this number must be calculated separately.
Use your state’s most recent official state population figures for jurisdic-tions in your state as the basis for calculating the total unduplicated popu-lation of legal service areas.
171
Administrative Entity Data Element Definitions Administrative Entity. (This is not a WebPLUS Data Element.) This is the agency that is legally established under local or state law to provide public library service to the population of a local jurisdiction. The administrative entity may have a single outlet, or it may have more than one outlet.
# Data Element Name Data Element Definition
150 FSCS ID (Automatic Display) This is the identification code assigned by WebPLUS to the administrative entity.
151 LIB ID This is the state-assigned identification code for the administrative entity.
152 Name This is the legal name of the administrative entity.
Note: Provide the name of the public library. Do not use acronyms. Do not abbreviate the name unless it exceeds the WebPLUS field length of 60 characters. Avoid abbreviations at the beginning of the name and do not punctuate abbreviations. (See Standard Abbreviations for WebPLUS in Appendix I.)
Street Address
153 Street Address This is the complete street address of the administrative entity.
Note: Do not report a post office box or general delivery.
154 City (of street address) This is the city or town in which the administrative entity is located.
155 ZIP Code (of street address) This is the standard five-digit postal zip code for the street address of the administrative entity.
156 ZIP+4 (of street address) This is the four-digit postal ZIP code extension for the street address of the administrative entity.
Mailing Address
157 Mailing Address This is the mailing address of the administrative entity.
158 City (of mailing address) This is the city or town of the mailing address for the administrative entity.
159 ZIP Code (of mailing address) This is the standard five-digit postal ZIP code for the mailing address of the administrative entity.
160 ZIP+4 (of mailing address) This is the four-digit postal ZIP code extension for the mailing address of the administrative entity.
161 County of the Entity This is the county in which the headquarters of the administrative entity is located.
162 Phone This is the telephone number of the administrative entity, including area
code.
Note: Report telephone number without spacing or punctuation. If the Administrative Entity has no phone, enter “–3” (for Not Applicable).
163 Web Address This is the Web address of the administrative entity. http://
Note: If the Administrative Entity has no web address, enter “–3” (for Not Applicable).
200 Interlibrary Relationship Code Select one of the following:
HQ—Headquarters of a Federation or Cooperative. The library or entity that provides the physical space and staff who manage, coordinate, or administer the programs of the federation or cooperative.
Note: Agencies that serve other libraries rather than the public should not be reported to FSCS.
ME—Member of a Federation or Cooperative. An autonomous library joined by formal or informal agreement(s) with (a) other autonomous libraries in the same state to perform various services cooperatively, such as resource sharing, communications, etc., and (b) libraries that are part of national, multi-state or statewide library federations or cooperatives. (Do not include OCLC.) Do not include multiple-outlet administrative entities (e.g., libraries with branches and that have the word "system" in their legal name) if the entity does not have an agreement with another autonomous library.
NO—Not a Member of a Federation or Cooperative.
201 Legal Basis Code The legal basis is the type of local government structure within which the entity functions. It reflects the state or local law, which authorizes the library.
Select one of the following:
CC—City/County. A multi-jurisdictional entity that is operated jointly by a county and a city.
CI—Municipal Government (city, town or village). A municipal government is an organized local government authorized in a state’s constitution and statutes and established to provide general government for a specific concentration of population in a defined area.
CO—County/Parish. An organized local government authorized in a state’s constitution and statutes and established to provide general government.
172
173
LD—Library District. A library district is a local entity other than a county, municipality, township, or school district that is authorized by state law to establish and operate a public library as defined by FSCS. It has sufficient administrative and fiscal autonomy to qualify as a separate government. Fiscal autonomy requires support from local taxation dedicated to library purposes (e.g., a library tax).
MJ—Multi-jurisdictional. An entity operated jointly by two or more units of local government under an intergovernmental agreement which creates a jointly appointed board or similar means of joint governance; to be distin-guished from a library which contracts to serve other jurisdictions and from special library districts.
Note: Please put city/county combinations under ‘CC’, rather than under Multi-jurisdictional.
NL—Native American Tribal Government. An organized local government authorized and established to provide general government to residents of a Native American reservation.
Note: Include native Alaskan villages in this category.
NP—Non-profit Association or Agency. An entity privately controlled but meeting the statutory definition of a public library in a given state; includes association libraries.
SD—School District. An organized local entity providing public elemen-tary, secondary, and/or higher education which, under state law, has suffi-cient administrative and fiscal autonomy to qualify as a separate govern-ment. Excludes "dependent public school systems" of county, municipal, township, or state governments.
OT—Other.
202 Administrative Structure Code This code identifies an autonomous library entity (administrative entity) that has its own governance and funding.
An administrative entity is the agency that is legally established under local or state law to provide public library service to the population of a local jurisdiction. The administrative entity may have a single outlet, or it may have more than one outlet.
Select one of the following:
MA—Administrative Entity with Multiple Direct Service Outlets where Administrative Offices are separate. An administrative entity that serves the public directly with two or more service outlets, including some combi-nation of one central library, branch(es), bookmobile(s), and/or books-by-mail only. The administrative offices are separate from the direct service outlets and do not provide direct library services.
MO—Administrative Entity with Multiple Direct Service Outlets where Administrative Offices are Not Separate. An administrative entity that serves the public directly with two or more service outlets, including some combination of one central library, branch(es), bookmobile(s), and/or books-by-mail only.
SO—Administrative Entity with a Single Direct Service Outlet. An administrative entity that serves the public directly with one central library, books-by-mail only, or one bookmobile.
203 FSCS Public Library Definition Answer <Y>es or <N>o to the following question: “Does this public library meet all the criteria of the FSCS public library definition?”
A public library is an entity that is established under state enabling laws or regulations to serve a community, district, or region, and that provides at least the following:
1. An organized collection of printed or other library materials, or a combination thereof;
2. Paid staff; 3. An established schedule in which services of the staff are
available to the public; 4. The facilities necessary to support such a collection, staff, and
schedule; and 5. Is supported in whole or in part with public funds.
Note: If the library meets all of the requirements of this definition, respond with a <Y>es. If the library does not meet one or more of the requirements, respond with a <N>o.
204 Geographic Code Choose from among the following types of readily available Census Bureau geography, one code that either exactly or most nearly describes the geographic area for which the public library has been established to offer services and from which (or on behalf of which) the library derives revenue, plus any areas served under contract for which the library is the primary service provider.
Note: The Population of Legal Service Area (data element #208) should be reflected in the geographic code selected. For further clarification of municipal government, county/parish, and school district, refer to definitions under Legal Basis Code (data element #201). For further clarification of metropolitan area, see Metropolitan Status Code “NC—Metropolitan Area, but Not Within Central City Limits” (data element #710—Outlet Data Element Definitions).
174
CI1—Municipal Government (city, town or village) (exactly) CI2—Municipal Government (city, town or village) (most nearly) CO1—County/Parish (exactly) CO2—County/Parish (most nearly) MA1—Metropolitan Area (exactly) MA2—Metropolitan Area (most nearly) MC1—Multi-County (exactly) MC2—Multi-County (most nearly) SD1—School District (exactly) SD2—School District (most nearly) OTH—Other
205 Legal Service Area Boundary Change
Answer <Y>es or <N>o to the following question: “Did the administrative entity’s legal service area boundaries change since last year?”
Note: Changes are likely to result, for example, when a municipality annexes land, when one municipality in a county becomes either an independent city or its own county necessitating its exclusion from the first county’s geography, or when an administrative entity contracts to provide public library service for some additional geographic area other than the geographic area for which it was established (e.g., a municipal library contracts to serve county residents).
206 Reporting Period Starting Date This is the starting date (month, day, and year) for a 12-month period that applies to the administrative entity’s data being submitted to IMLS.
Note: Reporting period means data for the fiscal year that ended in the previous calendar year.
207 Reporting Period Ending Date This is the ending date (month, day, and year) for a 12-month period that applies to the administrative entity’s data being submitted to IMLS.
Note: Reporting period means data for the fiscal year that ended in the previous calendar year.
208 Population of the Legal Service Area
The number of people in the geographic area for which a public library has been established to offer services and from which (or on behalf of which) the library derives revenue, plus any areas served under contract for which the library is the primary service provider.
Note: The determination of this population figure shall be the responsibility of the state library agency. This population figure should be based on the most recent official state population figures for jurisdictions in your state available from the State Data Center. The State Data Coordinator should obtain these figures annually from the State Data Center or other official state sources.
175
209 Number of Central Libraries This is one type of single outlet library (SO) or the library, which is the
operational center of a multiple-outlet library (MO or MA). Usually all pro-cessing is centralized here and the principal collections are housed here. Synonymous with main library.
Note: Each administrative entity may report either no central library or one central library. No administrative entity may report more than one central library. In the administrative entity file, this simply means reporting “0” or “1” for central library. Where two or more libraries are considered “centrals” for state or local purposes, one central library and one or more branch libraries should be reported. If you wish to identify a central library in the outlet file, identify the library with the largest collection as the central library, and report all others as branches. Where there are several co-equal outlets and no principal collection, report all such outlets as branches, not central libraries.
210 Number of Branch Libraries A branch library is an auxiliary unit of an administrative entity which has at least all of the following:
1. Separate quarters; 2. An organized collection of library materials; 3. Paid staff; and 4. Regularly scheduled hours for being open to the public.
211 Number of Bookmobiles A bookmobile is a traveling branch library. It consists of at least all of the following:
1. A truck or van that carries an organized collection of library materials;
2. Paid staff; and 3. Regularly scheduled hours (bookmobile stops) for being open to
the public.
Note: Count the number of vehicles in use, not the number of stops the vehicle makes.
PAID STAFF (FULL-TIME EQUIVALENT) Report figures as of the last day of the fiscal year. Include all positions funded in the library’s budget whether those positions are filled or not. To ensure comparable data, 40 hours per week has been set as the measure of full-time employment (FTE). For example, 60 hours per week of part-time work by employees in a staff category divided by the 40-hour measure equals 1.50 FTEs.
250 ALA-MLS Librarians with Master’s degrees from programs of library and information studies accredited by the American Library Association.
251 Total Librarians Persons with the title of librarian who do paid work that usually requires professional training and skill in the theoretical or scientific aspects of library work, or both, as distinct from its mechanical or clerical aspect. This data element also includes ALA-MLS (data element #250).
252 All Other Paid Staff This includes all other FTE employees paid from the reporting unit budget, including plant operations, security, and maintenance staff.
176
253 Total Paid Employees This is the sum of Total Librarians and All Other Paid Staff (data elements #251 and #252).
OPERATING REVENUE Report revenue used for operating expenditures as defined below. Include federal, state, local, or other grants. DO NOT include revenue for major capital expenditures, contributions to endowments, revenue passed through to another agency (e.g., fines), or funds unspent in the previous fiscal year (e.g., carryover). (Funds transferred from one public library to another public library should be reported by only one of the public libraries. The State Data Coordinator shall determine which library will report these funds.)
300 Local Government Revenue This includes all local government funds designated by the community, district, or region and available for expenditure by the public library. Do not include the value of any contributed or in-kind services or the value of any gifts and donations, library fines, fees, or grants.
Do not include state, federal, and other funds passed through local government for library use. Report these funds with state government revenue or federal government revenue, as appropriate.
301 State Government Revenue These are all funds distributed to public libraries by state government for expenditure by the public libraries, except for federal money distributed by the state. This includes funds from such sources as penal fines, license fees, and mineral rights.
Note: If operating revenue from consolidated taxes is the result of state legislation, the revenue should be reported under state revenue (even though the revenue may be from multiple sources).
302 Federal Government Revenue This includes all federal government funds distributed to public libraries for expenditure by the public libraries, including federal money distributed by the state.
303 Other Operating Revenue This is all operating revenue other than that reported under local, state, and federal (data elements #300, #301, and #302). Include, for example, monetary gifts and donations received in the current year, interest, library fines, fees for library services, or grants. Do not include the value of any contributed or in-kind services or the value of any non-monetary gifts and donations.
304 Total Operating Revenue This is the sum of Local Government Revenue, State Government Revenue, Federal Government Revenue, and Other Operating Revenue (data elements #300 through #303).
177
OPERATING EXPENDITURES Operating expenditures are the current and recurrent costs necessary to support the provision of library services. Significant costs, especially benefits and salaries, that are paid by other taxing agencies (government agencies with the authority to levy taxes) "on behalf of" the library may be included if the information is available to the reporting agency. Only such funds that are supported by expenditure documents (such as invoices, contracts, payroll records, etc.) at the point of disbursement should be included. Do not report the value of free items as expenditures. Do not report estimated costs as expenditures. Do not report capital expenditures under this category.
Staff Expenditures
350 Salaries & Wages Expenditures This includes salaries and wages for all library staff (including plant opera-tions, security, and maintenance staff) for the fiscal year. Include salaries and wages before deductions but exclude employee benefits.
351 Employee Benefits Expenditures These are the benefits outside of salaries and wages paid and accruing to employees (including plant operations, security, and maintenance staff), regardless of whether the benefits or equivalent cash options are available to all employees. Include amounts for direct paid employee benefits including Social Security, retirement, medical insurance, life insurance, guaranteed disability income protection, unemployment compensation, workmen’s compensation, tuition, and housing benefits.
352 Total Staff Expenditures This is the sum of Salaries & Wages Expenditures and Employee Benefits Expenditures (data elements #350 and #351).
Collection Expenditures This includes all operating expenditures from the library budget for all materials in print, microform, electronic, and other formats considered part of the collection, whether purchased, leased, or licensed. Exclude charges or fees for interlibrary loans and expenditures for document delivery.
353 Print Materials Expenditures Report all operating expenditures for the following print materials: books, serial back files, current serial subscriptions, government documents, and any other print acquisitions.
354 Electronic Materials Expenditures
Report all operating expenditures for electronic (digital) materials. Types of electronic materials include e-books, e-serials (including journals), government documents, databases (including locally mounted, full text or not), electronic files, reference tools, scores, maps, or pictures in electronic or digital format, including materials digitized by the library. Electronic materials can be distributed on magnetic tape, diskettes, computer software, CD-ROM, or other portable digital carrier, and can be accessed via a computer, via access to the Internet, or by using an e-book reader. Include expenditures for materials held locally and for remote materials for which permanent or temporary access rights have been acquired. Include expenditures for database licenses. [Note: Based on ISO 2789 definition.]
178
Note: Expenditures for computer software used to support library
operations or to link to external networks, including the Internet, are reported under Other Operating Expenditures (data element #357).
355 Other Materials Expenditures Report all operating expenditures for other materials, such as microform, audio, video, DVD, and materials in new formats.
356 Total Collection Expenditures This is the sum of Print Materials Expenditures, Electronic Materials Expenditures, and Other Materials Expenditures (data elements #353, #354, and #355).
357 Other Operating Expenditures This includes all expenditures other than those reported for Total Staff Expenditures (data element #352) and Total Collection Expenditures (data element #356).
Note: Include expenses such as binding, supplies, repair or replacement of existing furnishings and equipment; and costs of computer hardware and software used to support library operations or to link to external networks, including the Internet. Report contracts for services, such as costs of operating and maintaining physical facilities, and fees paid to a consultant, auditor, architect, attorney, etc.
358 Total Operating Expenditures This is the sum of Total Staff Expenditures, Total Collection Expenditures, and Other Operating Expenditures (data elements #352, #356, and #357).
CAPITAL REVENUE Report all revenue to be used for major capital expenditures, by source of revenue. Include funds received for (a) site acquisition; (b) new buildings; (c) additions to or renovation of library buildings; (d) furnishings, equipment, and initial collections (print, non-print, and electronic) for new buildings, building additions, or building renovations; (e) computer hardware and software used to support library operations, to link to networks, or to run information products; (f) new vehicles; and (g) other one-time major projects. Exclude revenue to be used for replacement and repair of existing furnishings and equipment, regular purchase of library materials, and investments for capital appreciation. Exclude income passed through to another agency (e.g., fines), or funds unspent in the previous fiscal year (e.g., carryover). Funds transferred from one public library to another public library should be reported by only one of the public libraries. Report federal, state, local, and other revenue to be used for major capital expenditures in the following categories:
400 Local Government Capital Revenue
Report all governmental funds designated by the community, district, or region and available to the public library for the purpose of major capital expenditures, except for state and/or federal money distributed by the local government.
401 State Government Capital Revenue
Report all funds distributed to public libraries by state government for expenditure by the public libraries for the purpose of major capital expenditures, except for federal money distributed by the state.
402 Federal Government Capital Revenue
Report federal governmental funds, including federal funds distributed by the state or locality, and grants and aid received by the library for the purpose of major capital expenditures.
179
403 Other Capital Revenue Report private (non-governmental funds), including grants received by the
library for the purpose of major capital expenditures.
404 Total Capital Revenue This is the sum of Local Government Capital Revenue, State Government Capital Revenue, Federal Government Capital Revenue, and Other Capital Revenue (data elements #400 through #403).
Note: The amounts reported for Total Capital Revenue and Total Capital Expenditures are not expected to be equal.
CAPITAL EXPENDITURES
405 Total Capital Expenditures Report major capital expenditures (the acquisition of or additions to fixed assets). Examples include expenditures for (a) site acquisitions; (b) new buildings; (c) additions to or renovation of library buildings; (d) furnishings, equipment, and initial book stock for new buildings, building additions, or building renovations; (e) library automation systems; (f) new vehicles; and (g) other one-time major projects. Include federal, state, local, or other revenue used for major capital expenditures. Only funds that are supported by expenditure documents (e.g., invoices, contracts, payroll records, etc.) at the point of disbursement should be included. Estimated costs are not included. Exclude expenditures for replacement and repair of existing furnishings and equipment, regular purchase of library materials, and investments for capital appreciation. Exclude contributions to endowments, or revenue passed through to another agency (e.g., fines). Funds transferred from one public library to another public library should be reported by only one of the public libraries.
LIBRARY COLLECTION This section of the survey collects data on selected types of materials. It does not cover all materials (i.e., microform, scores, maps, and pictures) for which expenditures are reported under Print Materials Expenditures, Electronic Materials Expenditures, and Other Materials Expenditures (data elements #353, #354, and #355). Under this category report only items the library has acquired as part of the collection and catalogued, whether purchased, leased, licensed, or donated as gifts.
450 Print Materials Report a single figure that includes both of the following:
1. Books in print. Books are non-serial printed publications (including music and maps) that are bound in hard or soft covers, or in loose-leaf format. Include non-serial government documents. Report the number of physical units, including duplicates. For smaller libraries, if volume data are not available, count the number of titles. Books packaged together as a unit (e.g., a 2-volume set) and checked out as a unit are counted as one physical unit.
180
2. Serial back files in print. Serials are publications issued in successive
parts, usually at regular intervals, that are intended to be continued indefinitely. Serials include periodicals (magazines); newspapers; annuals (reports, yearbooks, etc.); journals, memoirs, proceedings, and transactions of societies; and numbered monographic series. Government documents and reference tools are often issued as serials. Except for the current volume, count unbound serials as a volume when the library has at least half of the issues in a publisher’s volume. Report the number of physical units, including duplicates. For smaller libraries, if volume data are not available, count the number of titles. Serials packaged together as a unit (e.g., a 2-volume serial monograph) and checked out as a unit are counted as one physical unit.
451 Electronic Books (E-Books) E-books are digital documents (including those digitized by the library), licensed or not, where searchable text is prevalent, and which can be seen in analogy to a printed book (monograph). Include non-serial government documents. E-books are loaned to users on portable devices (e-book readers) or by transmitting the contents to the user’s personal computer for a limited time. Include e-books held locally and remote e-books for which permanent or temporary access rights have been acquired. Report the number of physical or electronic units, including duplicates, for all outlets. For smaller libraries, if volume data are not available, the number of titles may be counted. E-books packaged together as a unit (e.g., multiple titles on a single e-book reader) and checked out as a unit are counted as one unit.
Note: Under this category report only items the library has selected as part of the collection and made accessible through the library’s Online Public Access Catalog (OPAC).
452 Audio These are materials on which sounds (only) are stored (recorded) and that can be reproduced (played back) mechanically, electronically, or both. Include records, audiocassettes, audio cartridges, audio discs (including audio-CD-ROMs), audio-reels, talking books, and other sound recordings.
Report the number of physical units, including duplicates. For smaller libraries, if physical unit data are not available, count the number of titles. Items packaged together as a unit (e.g., two audiocassettes for one recorded book) and checked out as a unit are counted as one physical unit.
453 Video These are materials on which moving pictures are recorded, with or with-out sound. Electronic playback reproduces pictures, with or without sound, using a television receiver or monitor. Video formats may include tape, DVD, CD-ROM, etc.
181
Report the number of physical units, including duplicates. For smaller
libraries, if physical unit data are not available, count the number of titles. Items packaged together as a unit (e.g., two video cassettes for one movie) and checked out as a unit are counted as one physical unit.
Licensed Databases
Report the number of licensed databases (including locally mounted or remote, full-text or not) for which temporary or permanent access rights have been acquired through payment by the library, or by formal agreement with the State Library or a cooperative agreement within the state or region. A database is a collection of electronically stored data or unit records (facts, bibliographic data, abstracts, texts) with a common user interface and software for the retrieval and manipulation of the data. Note: The data or records are usually collected with a particular intent and relate to a defined topic. A database may be issued on CD-ROM, diskette, or other direct access method, or as a computer file accessed via dial-up methods or via the Internet. Subscriptions to individual electronic serial titles are reported under Current Electronic Serial Subscriptions (data element #459). Each database is counted individually even if access to several databases is supported through the same vendor interface Report the number of licensed databases acquired through payment or formal agreement, by source of access:
454* Local
455* State (state government or state library)
456* Other cooperative agreements (or consortia) within state or region
457** Total Licensed Databases This is the sum of Local, State, and Other licensed databases (data elements #454 through #456).
Current Serial Subscriptions Current serial subscriptions are arrangements by which, in return for a sum paid in advance, serials are provided for a specified number of issues. Include current serial subscriptions in print, electronic, and digital formats.
458** Current Print Serial Subscriptions
Report the number of current print serial subscriptions, including duplicates, for all outlets. Examples of serials are periodicals (magazines), newspapers, annuals, some government documents, some reference tools, and numbered monographic series.
182
459** Current Electronic Serial
Subscriptions Report the number of current electronic, electronic and other format, and digital serial subscriptions (e-serials, e-journals), including duplicates, for all outlets. Examples include periodicals (magazines), news-papers, annuals, some government documents, some reference tools, and numbered monographic series distributed in the following ways: (a) via the Internet (e.g., HTML, PDF, JPEG, or compressed file formats such as zipped files), (b) on CD-ROM or other portable digital carrier, (c) on databases (including locally mounted databases), and (d) on diskettes or magnetic tapes. Electronic serial subscriptions include serials held locally or remote resources that the library has authorization to access, including those available through statewide or consortia agreements. Do not include subscriptions to indexing and abstracting databases that include full-text serial content (e.g., EBSCO Host, ProQuest, OCLC FirstSearch).
SERVICES
500
Public Service Hours Per Year This is the sum of annual public service hours for outlets.
Note: Include the hours open for public service for Centrals (data element #209), Branches (data element #210), Bookmobiles (data element #211), and Books-by-Mail Only. For each bookmobile, count only the hours during which the bookmobile is open to the public. For administrative entities that offer ONLY books-by-mail service, count the hours that the outlet is staffed for service. Minor variations in scheduled public service hours need not be included, however, extensive hours closed to the public due to natural disasters or other events should be excluded even if the staff is scheduled to work.
501 Library Visits This is the total number of persons entering the library for whatever purpose during the year.
Note: If an actual count of visits is unavailable, determine an annual estimate by counting visits during a typical week in October and multiplying the count by 52. A “typical week” is a time that is neither unusually busy nor unusually slow. Avoid holiday times, vacation periods for key staff, or days when unusual events are taking place in the community or the library. Choose a week in which the library is open its regular hours. Include seven consecutive calendar days, from Sunday through Saturday (or whenever the library is usually open).
183
502 Reference Transactions A reference transaction is an information contact which involves the
knowledge, use, recommendations, interpretation, or instruction in the use of one or more information sources by a member of the library staff. It includes information and referral services. Information sources include printed and non-printed materials, machine-readable databases, catalogs and other holdings records, and, through communication or referral, other libraries and institutions and people inside and outside the library. The request may come in person, by phone, by fax, or by mail, electronic mail, or through live or networked electronic reference service from an adult, a young adult, or a child.
Do not count directional transactions or questions of rules or policies. Ex-amples of directional transactions are “Where are the children’s books?” and “I’m looking for a book with the call number 811.2G.” An example of a question of rules or policies is “Are you open until 9:00 tonight?”
Note: If an annual count of reference transactions is unavailable, determine an annual estimate by counting reference transactions during a typical week in October and multiply the count by 52. A "typical week" is a time that is neither unusually busy nor unusually slow. Avoid holiday times, vacation periods for key staff, or days when unusual events are taking place in the community or in the library. Choose a week in which the library is open its regular hours. Include seven consecutive calendar days, from Sunday through Saturday (or whenever the library is usually open).
503* Number of Registered Borrowers A registered borrower is a library user who has applied for and received an identification number or card from the public library that has established conditions under which the user may borrow library materials and gain access to other library resources. (Output Measures for Public Libraries, 2nd edition). Note: Files should have been purged within the past three (3) years.
550 Total Circulation The total annual circulation of all library materials of all types, including renewals.
Note: Count all materials in all formats that are charged out for use outside the library. Interlibrary loan transactions included are only items borrowed for users. Do not include items checked out to another library.
551 Circulation of Children’s Materials
The total annual circulation of all children’s materials in all formats to all users, including renewals.
INTER-LIBRARY LOANS
552 Provided To These are library materials, or copies of the materials, provided by one autonomous library to another upon request. The libraries involved in inter-library loans are not under the same library administration. These data are reported as annual figures.
184
553 Received From These are library materials, or copies of the materials, received by one autonomous library from another upon request. The libraries involved in interlibrary loans are not under the same library administration. These data are reported as annual figures.
LIBRARY PROGRAMS
600 Total Number of Library Programs
A program is any planned event which introduces the group attending to any of the broad range of library services or activities or which directly provides information to participants. Programs may cover use of the library, library services, or library tours. Programs may also provide cultural, recreational, or educational information, often designed to meet a specific social need. Examples of these types of programs include film showings, lectures, story hours, literacy, English as a second language, citizenship classes, and book discussions.
Count all programs, whether held on- or off-site, that are sponsored or co-sponsored by the library. Exclude programs sponsored by other groups that use library facilities.
If programs are offered as a series, count each program in the series. For example, a film series offered once a week for eight weeks should be counted as eight programs.
Note: Exclude library activities delivered on a one-to-one basis, rather than to a group, such as one-to-one literacy tutoring, services to homebound, resume writing assistance, homework assistance, and mentoring activities.
601 Number of Children’s Programs A children’s program is any planned event for which the primary audience is children and which introduces the group of children attending to any of the broad range of library services or activities for children or which directly provides information to participants. Children’s programs may cover use of the library, library services, or library tours. Children’s programs may also provide cultural, recreational, or educational information, often designed to meet a specific social need. Examples of these types of programs include story hours and summer reading events.
Count all children’s programs, whether held on- or off-site, that are sponsored or co-sponsored by the library. Do not include children’s programs sponsored by other groups that use library facilities. If children’s programs are offered as a series, count each program in the series. For example, a story hour offered once a week, 48 weeks a year, should be counted as 48 programs. Exclude library activities for children delivered on a one-to-one basis, rather than to a group, such as one-to-one literacy tutoring, services to homebound, homework assistance, and mentoring activities. This figure is a subset of the Total Number of Library Programs (data element #600).
185
Note: Output Measures for Public Library Services to Children: A
Manual of Standardized Procedures (ALA, 1992) defines children as persons age 14 and under.
602 Total Attendance at Library Programs
This is a total count of the audience at all library programs during the reporting period. (See Total Number of Library Programs, data element #600, for the definition of a library program.)
603 Children’s Program Attendance The count of the audience at all programs for which the primary audi-ence is children 14 years and under. Include adults who attend pro-grams intended primarily for children.
Note: Do not count attendance at library activities for children that are delivered on a one-to-one basis, rather than to a group, such as one-to-one literacy tutoring, services to homebound, homework assistance, and mentoring activities. (See Number of Children’s Programs, data element #601, for the definition of a children’s library program.)
OTHER ELECTRONIC INFORMATION
650*** Number of Internet Computers Used by General Public
Report the number of the library’s Internet computers [personal computers (PCs) and laptops], whether purchased, leased, or donated, used by the general public in the library.
651*** Number of Users of Public Internet Computers Per Year
Report the total number of individuals that have used Internet computers in the library during the last year. If the computer is used for multiple purposes (Internet access, word-processing, OPAC, etc.) and Internet users cannot be isolated, report all usage. A typical week or other reliable estimate may be used to determine the annual number. Sign-up forms or Web-log tracking software also may provide a reliable count of users.
Note: The number of users may be counted manually, using registration logs. Count each user that uses public internet computers, regardless of the amount of time spent on the computer. A user who uses the library’s public internet computer(s) three times a year would count as three customers. Software such as “Historian” can also be used to track the number of users at each public internet computer. If the data element is collected as a weekly figure, multiply that figure by 52 to annualize it.
* New data element ** Renumbered data elements *** Revised data element name or definition
186
Outlet Data Element Definitions
# Data Element Name Data Element Definition
700 FSCS ID and SEQ (Automatic Display)
This is the identification code assigned by WebPLUS. Outlets are as-signed the same FSCS ID as the administrative entity to which they be-long, with a unique three-digit suffix added to distinguish each outlet.
701 LIB ID (Optional) This is the state-assigned identification code for the outlet.
702 Name This is the legal name of the outlet.
Note: Provide the legal name of the outlet. Do not use acronyms. Do not abbreviate the name unless it exceeds the WebPLUS field length of 60 characters. Avoid abbreviations at the beginning of the name and do not punctuate abbreviations. (See Standard Abbreviations for WebPLUS in Appendix I.)
703 Street Address This is the complete street address of the outlet.
Note: Do not report a post office box or general delivery. For a bookmobile that operates from an administrative entity, branch, or central library, report the address of the administrative entity, branch or central li-brary from which it operates. For a bookmobile that is itself the administrative entity, report the address where the bookmobile is parked at night.
704 City This is the city or town in which the outlet is located.
705 ZIP Code This is the standard five-digit postal ZIP code for the street address of the outlet.
706 ZIP+4 This is the four-digit postal ZIP code extension for the street address of the outlet.
707 County of the Outlet This is the county in which the outlet is located.
708 Phone This is the telephone number of the outlet, including area code.
Note: Report telephone number without spacing or punctuation. If the outlet has no phone, enter “–3” (for Not Applicable).
187
709 Outlet Type Code An outlet is a unit of an administrative entity that provides direct public
library service.
Select one of the following:
BM—Books-by-Mail Only. A direct mail order service which provides books and other library materials. Books-by-mail typically serves rural residents, the disabled, the homebound, and others without access to another type of public library outlet. Requests for materials are usually received by mail and by telephone only. Only books-by-mail services that are housed separately from any other type of direct public service outlet (that is, central library, branches, or bookmobiles) should be coded here.
BR—Branch Library. A branch library is an auxiliary unit of an administra-tive entity which has at least all of the following:
1. Separate quarters; 2. An organized collection of library materials; 3. Paid staff; and 4. Regularly scheduled hours for being open to the public.
BS—Bookmobile(s). A bookmobile is a traveling branch library. It consists of at least all of the following:
1. A truck or van that carries an organized collection of library mate-
rials; 2. A paid staff; and 3. Regularly scheduled hours (bookmobile stops) for being open to
the public.
Note: A separate outlet record may be created for each bookmobile. You may wish to create separate outlet records for individual bookmobiles if (1) they have different addresses and/or (2) they have different Metro-politan Status Codes (see outlet data element #710). Alternatively, a bookmobile outlet record may include more than one bookmobile.
CE—Central Library. This is one type of single outlet library (SO) or the library which is the operational center of a multiple-outlet library (MO or MA). Usually all processing is centralized here and the principal collec-tions are housed here. Synonymous with main library.
188
Note: Each administrative entity may report either no central library or one central library. No administrative entity may report more than one central library. If you wish to identify a central library in the outlet file, identify the library with the largest collection as the central library, and report all others as branches. Where there are several co-equal outlets and no principal collection, report all such outlets as branches, not central libraries.
710 Metropolitan Status Code Select one of the following. Bookmobiles should report the code which best describes their primary service area.
Note: Contact the State Data Center for specific information about Metro-politan Areas in your state.
CC—Central City. The largest central city and, in some cases, up to two additional central cities are included in the title of the Metropolitan Area; there also are central cities that are not included in a Metropolitan Area title. A Metropolitan Area central city does not include any part of that city that extends outside the Metropolitan Area boundary.
NC—Metropolitan Area, but Not Within Central City Limits. A large population nucleus, together with adjacent communities that have a high degree of economic and social integration with that nucleus. Some Metropolitan Areas are defined around two or more nuclei. Each Metro-politan Area must contain a place with a minimum population of 50,000 or a Census Bureau-defined urbanized area and a total Metropolitan Area population of at least 100,000 (75,000 in New England). A Metropolitan Area comprises one or more central counties. (Independent cities are considered county equivalents.) A Metropolitan Area may also include one or more outlying counties that have close economic and social rela-tionships with the central county. An outlying county must have a specified level of commuting to the central counties and also must meet certain standards regarding metropolitan character, such as population density, urban population, and population growth. In New England, Metropolitan Areas are composed of cities and towns rather than whole counties.
NO—Not in a Metropolitan Area.
711 Square Footage of Outlet Provide the area, in square feet, of the public library outlet (central library or branch). Report the total area in square feet for each library outlet (central library or branch) separately. This is the area on all floors enclosed by the outer walls of the library outlet. Include all areas occupied by the library outlet, including those areas off-limits to the public. Include any areas shared with another agency or agencies if the outlet has use of that area.
189
712 Number of Bookmobiles in the Bookmobile Outlet Record
The number of bookmobiles in the bookmobile outlet record.
Note: A bookmobile outlet record may include one or more bookmobiles. Complete this data element only if the outlet record is of the type BS—Bookmobile(s) (see outlet data element #709). A bookmobile is a traveling branch library. It consists of at least all of the following:
1. A truck or van that carries an organized collection of library mate-rials;
2. A paid staff; and 3. Regularly scheduled hours (bookmobile stops) for being open to
the public. Count vehicles in use, not the number of stops the vehicle makes.
190

(Page is intentionally blank.)