Embed Size (px)
Citation preview

Public Libraries Survey | Fiscal Year 2014 i
Public Libraries in the United States SurveyFISCAL YEAR 2014August 2017
Institute of Museum and Library ServicesDr. Kathryn K. Matthew
Director
About the Institute of Museum and Library ServicesThe Institute of Museum and Library Services (IMLS) is the primary source of federal support for the nation’s approximately 123,000 libraries and 35,000 museums and related organizations. Our mission is to inspire libraries and museums to advance innovation, lifelong learning, and cultural and civic engagement. Our grant making, policy development, and research help libraries and museums deliver valuable services that make it possible for communities and individuals to thrive. To learn more, visit www.imls.gov and follow us on Facebook and Twitter.
As part of its mission, IMLS conducts policy research, analysis, and data collection to extend and improve the nation’s museum, library, and information services. IMLS research activities are conducted in ongoing collaboration with state library administrative agencies; national, state, and regional library and museum organizations; and other relevant agencies and organizations. IMLS research activities are designed to provide consistent, reliable, complete, and accurate indicators of the status and trends in library and museum services and to report timely, useful, and high-quality data to Congress, the states, other policy-makers, practitioners, data users, and the general public.
Contact Information
Institute of Museum and Library Services955 L’Enfant Plaza North, SW, Suite 4000
Washington, DC 20024-2135202-653-IMLS (4657)https://www.imls.gov
August 2017
This publication is available only on the Web at https://www.imls.gov/publications.
IMLS will provide an audio recording of this publication upon request.
For questions or comments, contact [email protected].
Citation
The Institute of Museum and Library Services. 2017. Public Libraries in the United States Fiscal Year 2014. Washington, DC: The Institute.
Unless specifically noted, all information contained herein is in the public domain and may be used and reprinted without special permission. Citation of this source is required.
Cover Photos
New Americans (left): The Brooklyn Public Library supports Brooklyn immigrants on their path to citizenship with a New Americans Corner, where patrons can check out the tools they need to apply for citizenship and ready themselves for the test at our 12-week prep courses, offered in partnership with the USCIS. Photo credit: Gregg Richards
Choosing Books (middle): The James V. Brown Library’s Storymobile is stocked with the best in age-appropriate books, puppets, music and puzzles, as well as teacher and classroom resources. Photo credit: James V. Brown Library
BookBike and Library (right): Eric Tarr pulls the BookBike, a 2015 Local Government Innovation Award winning library lending cart, through the streets of Rochester. Photo credit: Rochester Public Library
Public Libraries Survey | Fiscal Year 2014 iii
Contents
Public Libraries in the United States Survey, Fiscal Year 2014
List of Tables..................................................................................................................................................... vList of Figures ................................................................................................................................................. viiExecutive Summary .......................................................................................................................................... ixIntroduction ......................................................................................................................................................1
Methodology .............................................................................................................................................2Data and Analysis .....................................................................................................................................2
PART ONE: National Overview of Public Library Trends ........................................................................................................ 3Introduction ......................................................................................................................................................4The Great Recession ..........................................................................................................................................5Section 1: Financial Health ................................................................................................................................5
Indicator 1: Total Operating Revenue per Capita...........................................................................................5Indicator 2: Total Operating Expenditures per Capita ....................................................................................6
Section 2: Resources .........................................................................................................................................7Indicator 3: Public Library Collections per 1,000 People ..............................................................................7Indicator 4: Public Library Programs per 1,000 People .................................................................................7Indicator 5: Public-Access Internet Computers per 5,000 People ..................................................................7
Section 3: Use ..................................................................................................................................................7Indicator 6: Visits per Capita ......................................................................................................................7Indicator 7: Circulation per Capita ..............................................................................................................8Indicator 8: Program Attendance per 1,000 People ......................................................................................8Indicator 9: Public-Access Internet Computer Usage per Capita ....................................................................8Indicator 10: Reference Transactions per Capita ..........................................................................................8
Section 4: Staffing ............................................................................................................................................9Indicators 11 and 12: Numbers of Full-Time Equivalent Staff per 25,000 People ...........................................9Indicator 13: Percentage of Librarians with an ALA-Accredited Master’s Degree ..............................................9
Summary of National-Level Estimates ..................................................................................................................9
PART TWO: Public Library Indicators ............................................................................................................................... 11Introduction ....................................................................................................................................................12About the Subgroupings ...................................................................................................................................13Section 1: Financial Health ..............................................................................................................................14
Overview ................................................................................................................................................14Indicator 1: Total Operating Revenue per Capita.........................................................................................14Indicator 2: Total Operating Expenditures per Capita ..................................................................................18
iv Public Libraries Survey | Fiscal Year 2014
Contents
Section 2: Resources .......................................................................................................................................22Overview ................................................................................................................................................22Indicator 3: Public Library Collections per 1,000 People ............................................................................22Indicator 4: Public Library Programs per 1,000 People ...............................................................................26Indicator 5: Public-Access Internet Computers per 5,000 People ................................................................30
Section 3: Use ................................................................................................................................................32Overview ................................................................................................................................................32Indicator 6: Visits per Capita ....................................................................................................................32Indicator 7: Circulation per Capita ............................................................................................................36Indicator 8: Program Attendance per 1,000 People ....................................................................................39Indicator 9: Public-Access Internet Computer Usage per Capita ..................................................................43Indicator 10: Reference Transactions per Capita ........................................................................................45
Section 4: Staffing ..........................................................................................................................................47Overview ................................................................................................................................................47Indicator 11: Staffing per 25,000 People..................................................................................................47Indicator 12: Librarians per 25,000 People ...............................................................................................50Indicator 13: Percentage of Librarians with an ALA-Accredited Master’s Degree ............................................52
APPENDICES ................................................................................................................................................................... 55Appendix A: About the Public Libraries Survey ...................................................................................................56Appendix B: Technical Notes ............................................................................................................................58
Public Libraries Survey | Fiscal Year 2014 v
List of Tables
Table 1-A. Percentage Change of Public Library Indicators, FY 2005–2014 ..........................................................12
Table 1-B. Public Libraries by Locale and Size of Population Served, FY 2014 ......................................................13
Table 1-1.1. Revenue per Capita by Source, FY 2005–2014 (in Constant 2014 Dollars) ........................................14
Table 1-1.2. Operating Revenue per Capita by Source, Locale, and Population Size, FY 2014 (in Constant 2014 Dollars) ......................................................................................................................15
Table 1-2.1. Operating Expenditures per Capita by Type, FY 2005–2014 (in Constant 2014 Dollars) ......................19
Table 1-2.2. Operating Expenditures per Capita by Type of Expenditures, Locale, and Population Size, FY 2014 ......20
Table 2-3.1. Percentage Changes in Numbers of Materials per 1,000 People by Resource Type, FY 2005–2014 ......23
Table 2-3.2. Numbers of Materials per 1,000 People by Type, Locale, and Population Size, FY 2014 ......................24
Table 2-4.1. Number of Total Program, Children’s Program, and Young Adult’s Program Offerings per 1,000 People, FY 2014 .....................................................................................................................27
Table 3-6.1. Visits per Capita by Locale and Population Size, FY 2014 .................................................................33
Table 3-7.1. Total Circulation and Children’s Material Circulation per Capita by Locale and Population Size, FY 2014 ................................................................................................................................................36
Table 3-8.1. Program Attendance per 1,000 People by Type, Locale, and Population Size, FY 2014 .......................39
Table 3-9.1. Public-Access Internet Computer Usage per Capita by Locale and Population Size, FY 2014 ...............43
Table 3-10.1. Reference Transactions per Capita by Locale and Population Size, FY 2014 .....................................45
Table 4-11.1. Staffing (FTEs) per 25,000 People by Locale, FY 2010–2014 ........................................................48
Table 4-11.2. Staffing (FTEs) per 25,000 People by Population Size, FY 2005–2014 ...........................................49
Table 4-12.1. Public Librarians per 25,000 People by Locale and Population Size, FY 2014..................................50
Table 4-13.1. Percentage of Librarians with an ALA-Accredited Master’s Degree by Locale and Population Size, FY 2014 ........................................................................................................................52
Table B-1.1. States with Public Libraries with Overlapping Service Areas, FY 2014 ...............................................60
Table B-1.2. Reporting Periods of Public Libraries, FY 2014 ...............................................................................60
Table B-2.1. Urban-Centric Locale Categories .....................................................................................................63
Table B-2.2. Regional Designations Used in the PLS, from the Bureau of Economic Analysis ..................................64

Public Libraries Survey | Fiscal Year 2014 vii
List of Figures
Figure ES-1. Total Collection Materials per 1,000 People by Material Type, FY 2005–2014 ..................................... x
Figure N-1. Public Library Administrative Entities in the United States, FY 2014 ....................................................4
Figure N-2. Total Public Library Operating Revenue and Expenditures, FY 2005–2014 (in Constant 2014 Dollars) ........................................................................................................................6
Figure 1-1.1. Operating Revenue per Capita by Size of Population in Library Legal Service Area, FY 2005–2014 (in Constant 2014 Dollars) ......................................................................................................................16
Figure 1-1.2. Operating Revenue per Capita by State, FY 2014 ...........................................................................17
Figure 1-2.1. Operating Expenditures per Capita by Expenditure Category, FY 2005–2014 (in Constant 2014 Dollars) ......................................................................................................................18
Figure 1-2.2. Operating Expenditures per Capita by State, FY 2014 .....................................................................21
Figure 2-3.1. Total Collection Materials per 1,000 People by Material Type, FY 2005–2014 ..................................22
Figure 2-3.2. Total Collection Materials per 1,000 People by Size of Population of Library Legal Service Area, FY 2005–2014 ......................................................................................................................................24
Figure 2-3.3. Total Collection Size per 1,000 People by State, FY 2014 ...............................................................25
Figure 2-4.1. Number of Total Program, Children’s Program, and Young Adult’s Program Offerings per 1,000 People, FY 2005–2014 ...........................................................................................................26
Figure 2-4.2. Number of Program Offerings per 1,000 People by Locale, FY 2010–2014 ......................................27
Figure 2-4.3. Number of Program Offerings per 1,000 People by State, FY 2014 ..................................................28
Figure 2-4.4. Number of Children’s Program Offerings per 1,000 People by State, FY 2014 ...................................29
Figure 2-4.5. Number of Young Adult’s Program Offerings per 1,000 People by State, FY 2014 .............................29
Figure 2-5.1. Number of Public-Access Internet Computers per 5,000 People by Locale, FY 2010–2014 ................30
Figure 2-5.2. Number of Public-Access Internet Computers per 5,000 People by State, FY 2014 ...........................31
Figure 3-6.1. Visits per Capita by Size of Population in Library Legal Service Area, FY 2005–2014 .........................33
Figure 3-6.2. Visits per Capita by State, FY 2014 ...............................................................................................34
Figure 3-6.3. Percentage Change in Visits per Capita by State, FY 2013–2014 .....................................................35
Figure 3-7.1. Circulation of Materials per Capita by Locale, FY 2010–2014 ..........................................................37
Figure 3-7.2. Circulation per Capita by State, FY 2014 .......................................................................................38
Figure 3-7.3. Circulation of Children’s Materials per Capita by State, FY 2014 ......................................................38
Figure 3-8.1. Total Program Attendance per 1,000 People by Size of Population in Library Legal Service Area, FY 2005–2014 .....................................................................................................................................40
Figure 3-8.2. Total Program Attendance per 1,000 People by State, FY 2014 .......................................................41
Public Libraries Survey | Fiscal Year 2014
List of Figures
viii
Figure 3-8.3. Children’s Program Attendance per 1,000 People by State, FY 2014 ................................................41
Figure 3-8.4. Young Adult’s Program Attendance per 1,000 People by State, FY 2014 ..........................................42
Figure 3-9.1. User Sessions of Public-Access Internet Computers per Capita by Size of Population Library Legal Service Area, FY 2010–2014 ..........................................................................................................44
Figure 3-9.2. Change in Public-Access Internet Computer User Sessions per Capita by State, FY 2013–2014 .........44
Figure 3-10.1. Reference Transactions per Capita by Locale, FY 2010–2014 ........................................................46
Figure 3-10.2. Percentage Change in Reference Transactions per Capita by State, FY 2013–2014..........................46
Figure 4-11.1. Staffing (FTEs) per 25,000 People, FY 2005–2014 .....................................................................47
Figure 4-12.1. Public Librarians per 25,000 People by Population Size, FY 2005–2014 .......................................51
Figure 4-12.2. Number of Librarians per 25,000 People by State, FY 2014 .........................................................51
Figure 4-13.1. Ratio of Librarians with a Master’s Degree from an ALA-Accredited Master’s Degree Program to All Librarians by Locale, FY 2010–2014 ...............................................................................................53
Figure 4-13.2. Percentage of Libraries with a Librarian Holding a Master’s Degree from an ALA-Accredited Master’s Degree Program by State, FY 2014 ..............................................................................................53
Public Libraries Survey | Fiscal Year 2014 ix
Executive Summary
The Institute of Museum and Library Services (IMLS) is responsible for providing policymakers, researchers, and the general public with information about public libraries in the United States. Public libraries have a long tradition of serving as community anchors—providing a wide array of services and resources in communities. The Public Libraries Survey (PLS), under the Museum and Library Services Act of 2010 administered by IMLS, collects annual data about the ways in which public libraries serve their communities. Since 1989, the PLS has documented the ways that modern public libraries have responded to an increasingly diverse public with broader information needs. This information not only helps to identify areas of activity and community engagement but also can uncover opportunities for further services and reach.
The PLS is a national census that collects information from public libraries in 50 states, the District of Columbia, and outlying territories. The data include library and community characteristics; size and use of collections; revenues, expenditures, staff, and operating hours; and use of programs and technology. PLS data are useful to researchers, journalists, the public, local practitioners, and policymakers at the federal, state, and local levels for planning, evaluation, and policymaking.
More than 9,300 public libraries and 17,500 outlets1
1 In FY 2014, PLS requested data from 9,305 public libraries and 17,566 outlets. Of those, 10 public libraries and 74 outlets are excluded from the analyses for the FY 2014 report because they were reported as closed or temporarily closed in FY 2014.
participated in the fiscal year (FY) 2014 PLS, for a 97.4 percent response rate. This report summarizes the findings from the 9,070 public libraries and 17,218 outlets in the United States that reported PLS data in FY 2014 and met the definition of a public library developed by the Federal and State Cooperative System (FSCS).2
2 In FY 2014, 9,295 public libraries and 17,492 outlets were not reported as closed or temporarily closed, a unit response rate of 97.4 percent.
This report builds on the work of previous PLS annual reports by presenting national FY 2014 estimates and then examining trends across 13 key indicators of the state of public libraries in the United States with 1- and 5-year trends—and, wherever possible, 10-year trends. Examining 10-year trends provides anopportunity to observe how public libraries respondedimmediately in the aftermath of the Great Recession thatbegan in December 2007 and ended in June 2009,3
3 National Bureau of Economic Research (NBER). (2010). Business cycle dating committee announcement. Cambridge, MA: Author. Retrieved from http://www.nber.org/cycles/sept2010.pdf. Business Cycle Dating Committee, NBER. (2010). U.S. Business Cycle Expansions and Contractions. Retrieved from http://www.nber.org/cycles.html#announcements
aswell as the transformations that occurred 5 years afterthat major economic event.
Financial Health of Public LibrariesFor the past 10 years, the financial health of public libraries, as indicated by operating revenue and expenditures, greatly fluctuated. Between FY 2005 and FY 2009, public library operating revenue and expenditures consistently increased nationally, with
Public Libraries Survey | Fiscal Year 2014
Executive Summary
x
an operating revenue increase of 9.8 percent and an operating expenditures increase of 11.0 percent. In FY 2009, operating revenue peaked at $12.6 billion, as did operating expenditures, at $11.9 billion; both declined dramatically over the next 4 years through FY 2013. The downward trend leveled off in FY 2014:
• Per capita operating revenue was $39.34 ($12.1 billion in total revenue), an increase of 2.0 percent compared to FY 2013 and the first revenue increase since FY 2009 (Indicator 1).
• Per capita operating expenditures were $36.96 ($11.3 billion in total operating expenditures), an increase of 2.8 percent compared to FY 2013 (Indicator 2).
Public Library ResourcesThe FY 2014 PLS data show that the types of resources offered by public libraries continued to change over the past 10 years. The most notable change has been the shift toward providing the public with more access to electronic media and the decreased emphasis on acquiring physical media.
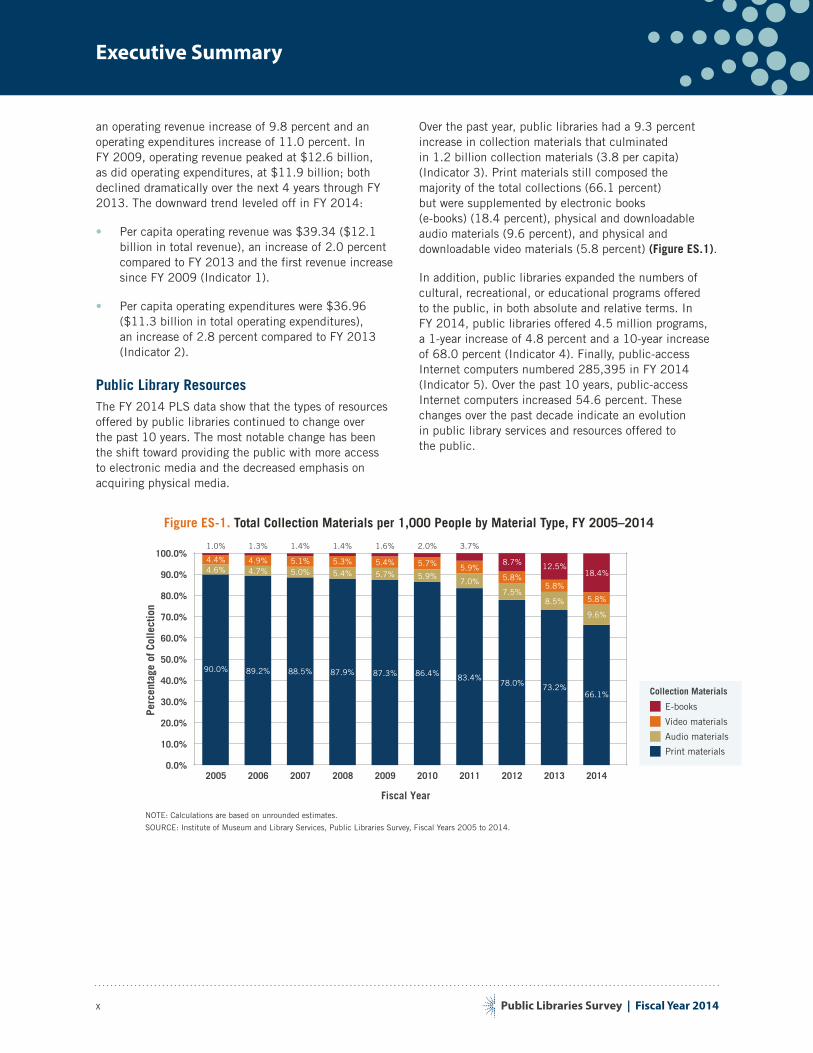
Over the past year, public libraries had a 9.3 percent increase in collection materials that culminated in 1.2 billion collection materials (3.8 per capita) (Indicator 3). Print materials still composed the majority of the total collections (66.1 percent) but were supplemented by electronic books (e-books) (18.4 percent), physical and downloadable audio materials (9.6 percent), and physical and downloadable video materials (5.8 percent) (Figure ES.1).
In addition, public libraries expanded the numbers of cultural, recreational, or educational programs offered to the public, in both absolute and relative terms. In FY 2014, public libraries offered 4.5 million programs, a 1-year increase of 4.8 percent and a 10-year increase of 68.0 percent (Indicator 4). Finally, public-access Internet computers numbered 285,395 in FY 2014 (Indicator 5). Over the past 10 years, public-access Internet computers increased 54.6 percent. These changes over the past decade indicate an evolution in public library services and resources offered to the public.
Figure ES-1. Total Collection Materials per 1,000 People by Material Type, FY 2005–2014
Perc
enta
ge o
f Col
lect
ion
Print materials
Audio materials
Video materials
E-books
Fiscal Year
2005 2006 2007 2008 2009 2010 2011 2012 2013 20140.0%
10.0%
20.0%
30.0%
40.0%
50.0%
60.0%
70.0%
80.0%
90.0%
100.0%
90.0% 89.2% 88.5% 87.9% 87.3% 86.4% 83.4%78.0% 73.2%
66.1%
4.4% 4.9% 5.1% 5.3% 5.4% 5.7% 5.9%5.8%
5.8%
5.8%
1.0% 1.3% 1.4% 1.4% 1.6% 2.0% 3.7%
8.7% 12.5%18.4%4.6% 4.7% 5.0% 5.4% 5.7% 5.9%
7.0%7.5%
8.5%
9.6%
Collection Materials
NOTE: Calculations are based on unrounded estimates.
SOURCE: Institute of Museum and Library Services, Public Libraries Survey, Fiscal Years 2005 to 2014.
Public Libraries Survey | Fiscal Year 2014
Executive Summary
xi
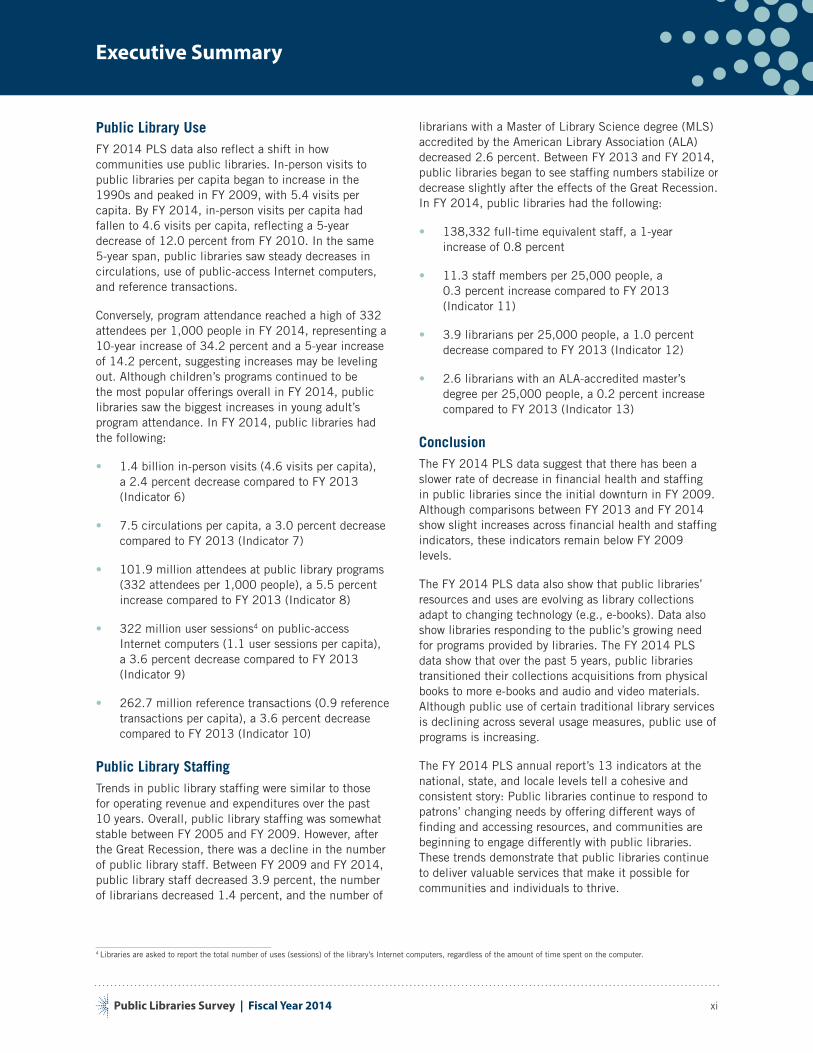
Public Library UseFY 2014 PLS data also reflect a shift in how communities use public libraries. In-person visits to public libraries per capita began to increase in the 1990s and peaked in FY 2009, with 5.4 visits per capita. By FY 2014, in-person visits per capita had fallen to 4.6 visits per capita, reflecting a 5-year decrease of 12.0 percent from FY 2010. In the same 5-year span, public libraries saw steady decreases in circulations, use of public-access Internet computers, and reference transactions.
Conversely, program attendance reached a high of 332 attendees per 1,000 people in FY 2014, representing a 10-year increase of 34.2 percent and a 5-year increase of 14.2 percent, suggesting increases may be leveling out. Although children’s programs continued to be the most popular offerings overall in FY 2014, public libraries saw the biggest increases in young adult’s program attendance. In FY 2014, public libraries had the following:
• 1.4 billion in-person visits (4.6 visits per capita), a 2.4 percent decrease compared to FY 2013 (Indicator 6)
• 7.5 circulations per capita, a 3.0 percent decrease compared to FY 2013 (Indicator 7)
• 101.9 million attendees at public library programs (332 attendees per 1,000 people), a 5.5 percent increase compared to FY 2013 (Indicator 8)
• 322 million user sessions4
4 Libraries are asked to report the total number of uses (sessions) of the library’s Internet computers, regardless of the amount of time spent on the computer.
on public-access Internet computers (1.1 user sessions per capita), a 3.6 percent decrease compared to FY 2013 (Indicator 9)
• 262.7 million reference transactions (0.9 reference transactions per capita), a 3.6 percent decrease compared to FY 2013 (Indicator 10)
Public Library StaffingTrends in public library staffing were similar to those for operating revenue and expenditures over the past 10 years. Overall, public library staffing was somewhat stable between FY 2005 and FY 2009. However, after the Great Recession, there was a decline in the number of public library staff. Between FY 2009 and FY 2014, public library staff decreased 3.9 percent, the number of librarians decreased 1.4 percent, and the number of
librarians with a Master of Library Science degree (MLS) accredited by the American Library Association (ALA) decreased 2.6 percent. Between FY 2013 and FY 2014, public libraries began to see staffing numbers stabilize or decrease slightly after the effects of the Great Recession. In FY 2014, public libraries had the following:
• 138,332 full-time equivalent staff, a 1-year increase of 0.8 percent
• 11.3 staff members per 25,000 people, a 0.3 percent increase compared to FY 2013 (Indicator 11)
• 3.9 librarians per 25,000 people, a 1.0 percent decrease compared to FY 2013 (Indicator 12)
• 2.6 librarians with an ALA-accredited master’s degree per 25,000 people, a 0.2 percent increase compared to FY 2013 (Indicator 13)
ConclusionThe FY 2014 PLS data suggest that there has been a slower rate of decrease in financial health and staffing in public libraries since the initial downturn in FY 2009. Although comparisons between FY 2013 and FY 2014 show slight increases across financial health and staffing indicators, these indicators remain below FY 2009 levels.
The FY 2014 PLS data also show that public libraries’ resources and uses are evolving as library collections adapt to changing technology (e.g., e-books). Data also show libraries responding to the public’s growing need for programs provided by libraries. The FY 2014 PLS data show that over the past 5 years, public libraries transitioned their collections acquisitions from physical books to more e-books and audio and video materials. Although public use of certain traditional library services is declining across several usage measures, public use of programs is increasing.
The FY 2014 PLS annual report’s 13 indicators at the national, state, and locale levels tell a cohesive and consistent story: Public libraries continue to respond to patrons’ changing needs by offering different ways of finding and accessing resources, and communities are beginning to engage differently with public libraries. These trends demonstrate that public libraries continue to deliver valuable services that make it possible for communities and individuals to thrive.

Public Libraries Survey | Fiscal Year 2014 1
Introduction
Public libraries provide learning and information resources for individuals, families, businesses, and nonprofit organizations. Public libraries are community anchor institutions that create opportunities for people of all ages through access to collections of resources and technology.
Public libraries support community improvement by offering adult, youth, and children’s programs that address the health, education, and workforce development needs of communities. Libraries provide access to and assistance with research and information needs through knowledgeable, qualified staff. In communities across the nation, public libraries complement commercial development activity and provide attractive neighborhood amenities.
The Public Libraries Survey (PLS) is a nationwide data collection tool that enables the examination of when, where, and how library services are changing to meet the needs of the public. These data, supplied annually by more than 97 percent of public libraries across the country, provide information that researchers, policymakers, and practitioners can use in the decision-making process about the support and strategic management of libraries.
This report has two parts: (1) National Overview of Public Library Trends, and (2) Public Library Indicators.
Part One, National Overview of Public Library Trends, presents a national-level analysis that aggregates data from all 50 states and the District of Columbia to provide national estimates and trends. This portion of the report presents an overview of the state of public libraries in the United States. The financial health of public libraries, the resources and services they offer, and the ways in which patrons use public libraries are all examined. Furthermore, this report employs a number of metrics to describe public libraries. These metrics use 1-, 5-, and 10-year changes to examine the past and present state of libraries. Examining 10-year trends provides an opportunity to observe how public libraries responded immediately in the aftermath of the Great Recession that began in December 2007 and ended in June 2009,1
1 National Bureau of Economic Research (NBER). (2010). Business cycle dating committee announcement. Cambridge, MA: Author. Retrieved from http://www.nber.org/cycles/sept2010.pdf. Business Cycle Dating Committee, NBER. (2010). U.S. Business Cycle Expansions and Contractions. Retrieved from http://www.nber.org/cycles.html#announcements
as well as the transformations that occurred 5 years after that major economic event.
Part Two, Public Library Indicators, provides an overall level of performance for key metrics and serves as a gauge to evaluate important changes in public library use, services, and resources. In most cases, the indicators are calculated as per capita, per 1,000 people, per 5,000 people, and per 25,000 people; thus, they provide a way to compare performance across libraries. In addition, results for each indicator are broken out for examination at the regional, state, and locale levels. This analysis helps illuminate differences that are occurring across the United States. As an example, operating revenue varies
Public Libraries Survey | Fiscal Year 2014
Introduction
2
across states, regions, and locales. Unlike national trends, which present one key indication of library health, subpopulations offer a unique comparison of public libraries.
Parts One and Two also demonstrate the shifting environment of public libraries in the United States. Traditionally, public libraries have been viewed as resources for lending books, audio, and visual materials to patrons, as well as sources of assistance with research and other educational needs. However, an examination of data from the past 5 to 10 years shows that the landscape of library services is changing. For instance, the analyses in this report indicate growth in program offerings to the public, access to Internet computers, and digital resources. These changes are examined throughout the report.
MethodologyThe PLS is a universe survey, which means that information is solicited from all public libraries in the United States. The PLS questionnaire was designed collaboratively by the Institute of Museum and Library Services (IMLS), State Data Coordinators (SDCs), and the Library Statistics Working Group.
In FY 2014, the PLS survey frame consisted of 9,295 public libraries—9,233 public libraries in 50 states and the District of Columbia, and 62 public libraries in outlying areas. Data were collected using WebPLUS (Web Public Library Universe System), an online data collection tool developed by the U.S. Census Bureau. After data were collected, data editing and imputation were performed.
Historically, PLS response rates have been high. In FY 2014, the unit response rate was 97.4 percent, and the majority of item-level response rates were above 80 percent.
For a detailed description of the PLS data collection methodology, see Appendix B.
Data and AnalysisIn this report, national estimates are aggregate totals based on summing data across all public libraries to the
national level. For estimates based on subpopulations, such as state, region, or locale, data are summed up to the level of the subpopulation. Data are analyzed at the national, locale, and state levels as well as by population size. Analyses at the national level are presented by 1-, 5-, and 10-year changes. At subpopulation levels, comparisons are made for FY 2014 (e.g., between states).
A public library is established under state laws or regulations to serve a community, district, or region. This report summarizes the findings from the 9,070 public libraries and 17,218 outlets in the United States that reported PLS data in FY 2014 and met the definition of a public library developed by the Federal and State Cooperative System (FSCS).2
2 In FY 2014, the PLS contained a total of 9,305 records. This included 9,295 public libraries and 17,492 outlets reported PLS data, with an average unit response rate of 97.4 percent. The analyses presented in this report exclude 166 libraries that did not meet the FSCS public library definition, 59 libraries that were in outlying areas, and 10 libraries that were reported as closed or temporarily closed in FY 2014.
Under this definition, a public library must meet, at a minimum, the following criteria:
• Contains an organized collection of printed or other library materials, or a combination thereof;
• Has paid staff;
• Has an established schedule in which services of the staff are available to the public;
• Has the facilities necessary to support such a collection, staff, and schedule; and
• Is supported in whole or in part with public funds.
A community may have one or more individual public libraries or may be served by a public library system, which may have a central library and multiple branches or bookmobiles. Any reference to a public library in this report refers to the administrative entity, which may be a single-outlet library or a multiple-branch library system. References to outlets refer to central libraries, branch libraries, and bookmobiles.
All calculations and comparisons3
3 Because the PLS is a universe collection, this report does not use statistical tests to measure the statistical significance of differences between subpopulations—a technique that is necessary when only a sample of an entire subpopulation is used.
in the PLS report are based on unrounded estimates. At times, the reader may find that a calculation, such as a percentage change, is not identical to the calculation obtained by using the rounded values shown in the report or supplemental tables.

PART ONE:National Overview of Public Library Trends
Public Libraries Survey | Fiscal Year 2014
PART ONE:National Overview of Public Library Trends
4
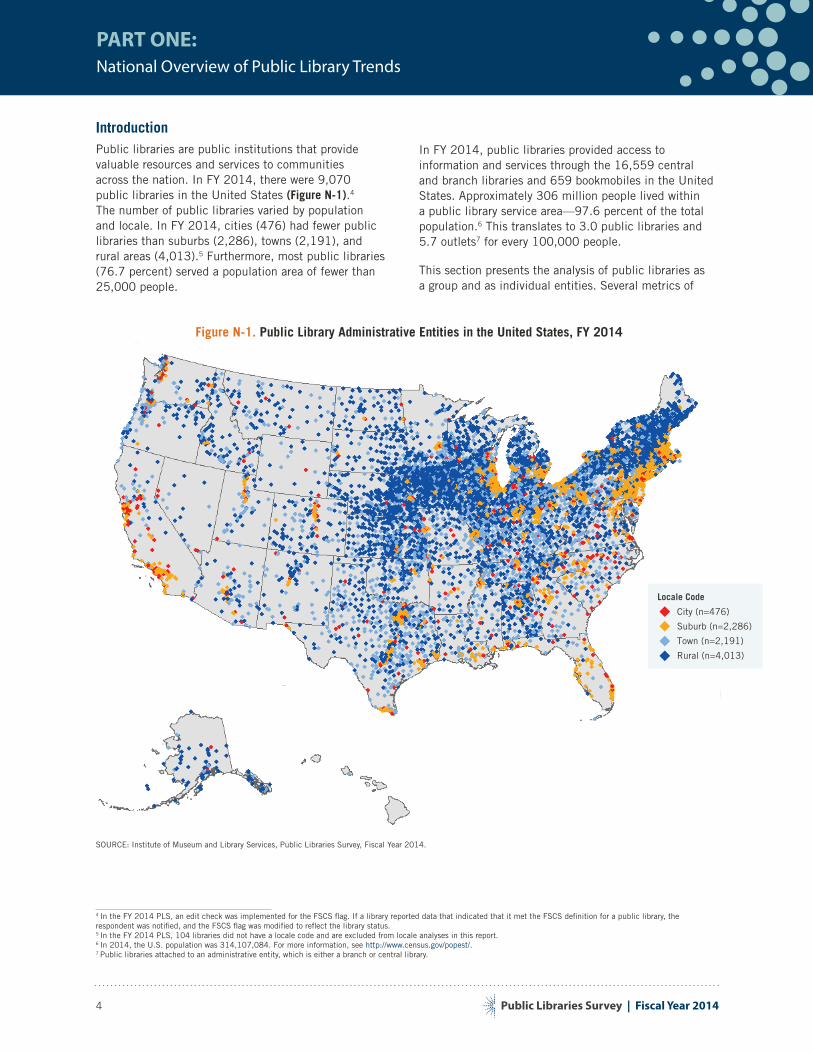
IntroductionPublic libraries are public institutions that provide valuable resources and services to communities across the nation. In FY 2014, there were 9,070 public libraries in the United States (Figure N-1).4
4 In the FY 2014 PLS, an edit check was implemented for the FSCS flag. If a library reported data that indicated that it met the FSCS definition for a public library, the respondent was notified, and the FSCS flag was modified to reflect the library status.
The number of public libraries varied by population and locale. In FY 2014, cities (476) had fewer public libraries than suburbs (2,286), towns (2,191), and rural areas (4,013).5
5 In the FY 2014 PLS, 104 libraries did not have a locale code and are excluded from locale analyses in this report.
Furthermore, most public libraries (76.7 percent) served a population area of fewer than 25,000 people.
In FY 2014, public libraries provided access to information and services through the 16,559 central and branch libraries and 659 bookmobiles in the United States. Approximately 306 million people lived within a public library service area—97.6 percent of the total population.6
6 In 2014, the U.S. population was 314,107,084. For more information, see http://www.census.gov/popest/.
This translates to 3.0 public libraries and 5.7 outlets7
7 Public libraries attached to an administrative entity, which is either a branch or central library.
for every 100,000 people.
This section presents the analysis of public libraries as a group and as individual entities. Several metrics of
Figure N-1. Public Library Administrative Entities in the United States, FY 2014
Locale Code
Rural (n=4,013)
Town (n=2,191)
Suburb (n=2,286)
City (n=476)
SOURCE: Institute of Museum and Library Services, Public Libraries Survey, Fiscal Year 2014.
Public Libraries Survey | Fiscal Year 2014
PART ONE:National Overview of Public Library Trends
5
library use and investment are described in aggregate form, combining information from all libraries into a single national estimate. These national-level estimates provide an overall picture of the use of library resources and services, including how these measures have changed over time. Although it is important to examine how public libraries are doing as a group, aggregated estimates do not capture differences at the local level.
Part One presents national trends of public libraries in the United States in FY 2014. At the national level, there have been drastic changes for public libraries over the last 5-year and 10-year periods. The evolving landscape of public libraries is displayed across metrics used in this report that show the financial health and condition of library resources, use, and staffing. To create a full picture of events occurring at the national level, 1-, 5-, and 10-year changes8
8 Calculations in this report are based on unrounded estimates. For instance, percentage change is not always identical to the calculation obtained by using the rounded values shown in the report or supplemental tables.
are analyzed.
There are many ways to examine the use of public library resources and services. This report presents an analysis of public libraries using several metrics. The first set of metrics provides two key indicators of public library investments: operating revenue and operating expenditures. These indicators help measure the monetary health of libraries in the United States. A second set of metrics examines indicators on library services and resources: collections, public library programs, public-access Internet computers, and the number of staff (measured in full-time equivalents). The third set of metrics analyzes use of public library services indicators: visits, circulation, program attendance, and user sessions on public-access Internet computers. Data are aggregated to the national level for each indicator. However, Part Two presents the use of public library resources and services in greater detail, including analyses at the state, population, and locale levels.
The Great Recession Between December 2008 and June 2009, the United States had a recession that impacted the national economy and the financial health of public libraries. The Great Recession9
9 National Bureau of Economic Research (NBER). (2010). Business cycle dating committee announcement. Cambridge, MA: Author. Retrieved from http://www.nber.org/cycles/sept2010.pdf. Business Cycle Dating Committee, NBER. (2010). U.S. Business Cycle Expansions and Contractions. Retrieved from http://www.nber.org/cycles.html#announcements
—which has changed the financial operations of public libraries—was a period of declining economic activity that impacted communities throughout the United States. Some metrics used in this report still show a sluggish recovery compared to pre-recession
data. For instance, operating revenue and expenditures decreased between FY 2009 and FY 2013. However, operating revenue and expenditures have increased over the past year. Public library staffing also was affected by the Great Recession. These changes, which are discussed in greater detail here in Part One, show how public libraries across the United States and District of Columbia have changed since the Great Recession.
Section 1: Financial HealthPublic investments at local, state, and federal levels allow libraries to provide access to many popular services and resources. Public libraries direct these revenues toward support of their local communities through a variety of services and resources. Most library operating expenditures provide public resources and services, such as the collection of materials for loan, varied programming, digital access, and knowledgeable staff.
Indicator 1: Total Operating Revenue per Capita
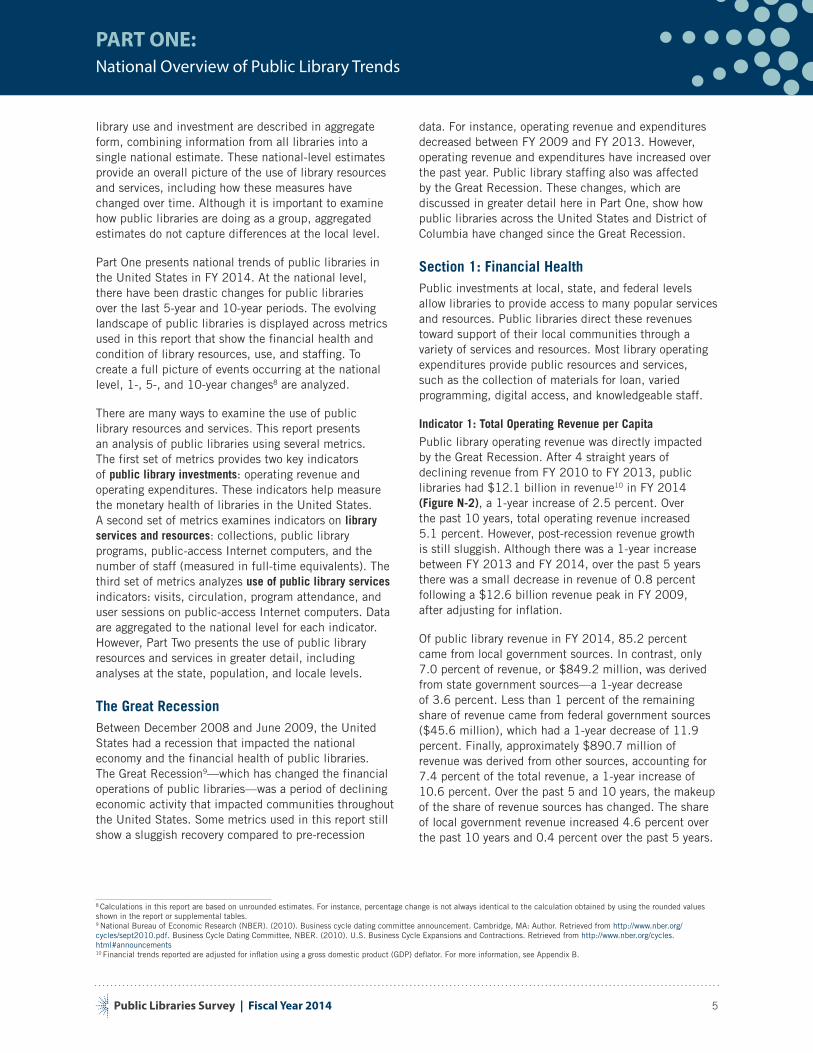
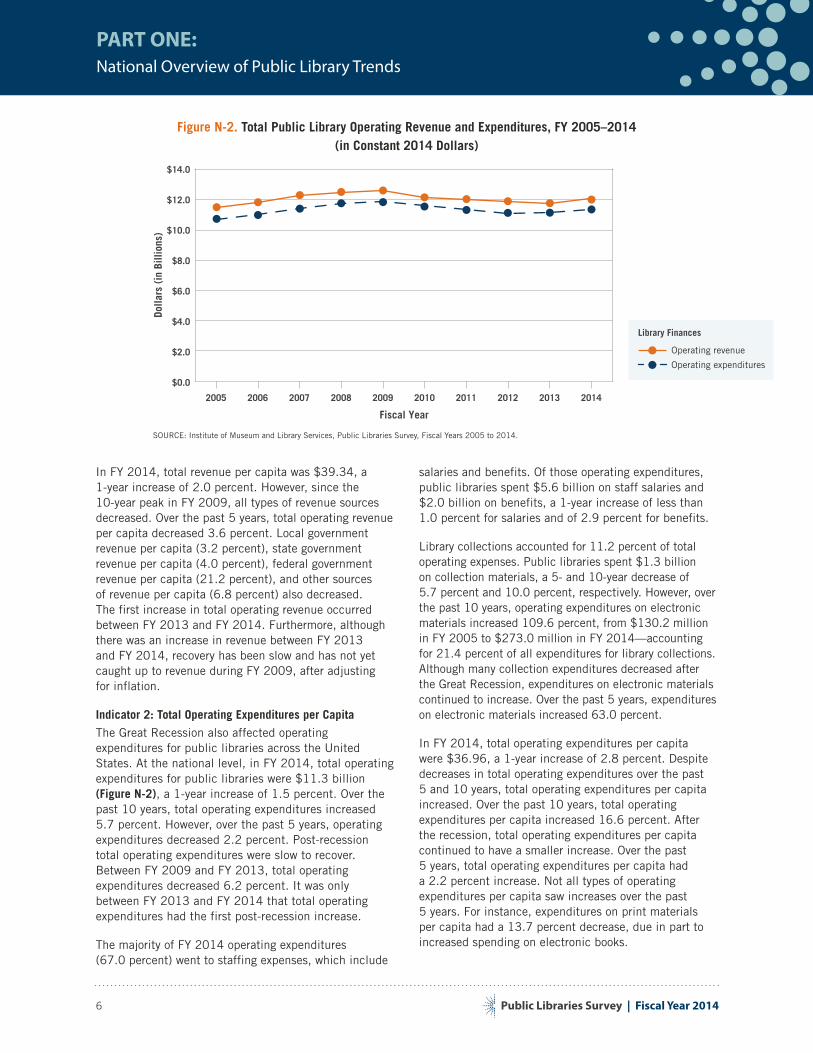
Public library operating revenue was directly impacted by the Great Recession. After 4 straight years of declining revenue from FY 2010 to FY 2013, public libraries had $12.1 billion in revenue10
10 Financial trends reported are adjusted for inflation using a gross domestic product (GDP) deflator. For more information, see Appendix B.
in FY 2014 (Figure N-2), a 1-year increase of 2.5 percent. Over the past 10 years, total operating revenue increased 5.1 percent. However, post-recession revenue growth is still sluggish. Although there was a 1-year increase between FY 2013 and FY 2014, over the past 5 years there was a small decrease in revenue of 0.8 percent following a $12.6 billion revenue peak in FY 2009, after adjusting for inflation.
Of public library revenue in FY 2014, 85.2 percent came from local government sources. In contrast, only 7.0 percent of revenue, or $849.2 million, was derived from state government sources—a 1-year decrease of 3.6 percent. Less than 1 percent of the remaining share of revenue came from federal government sources ($45.6 million), which had a 1-year decrease of 11.9 percent. Finally, approximately $890.7 million of revenue was derived from other sources, accounting for 7.4 percent of the total revenue, a 1-year increase of 10.6 percent. Over the past 5 and 10 years, the makeup of the share of revenue sources has changed. The share of local government revenue increased 4.6 percent over the past 10 years and 0.4 percent over the past 5 years.
Public Libraries Survey | Fiscal Year 2014
PART ONE:National Overview of Public Library Trends
6
Figure N-2. Total Public Library Operating Revenue and Expenditures, FY 2005–2014(in Constant 2014 Dollars)
Operating expenditures
Operating revenue
Dolla
rs (
in B
illio
ns)
2005 2006 2007 2008 2009 2010 2011 2012 2013 2014
Fiscal Year
$0.0
$2.0
$4.0
$6.0
$8.0
$10.0
$12.0
$14.0
Library Finances
SOURCE: Institute of Museum and Library Services, Public Libraries Survey, Fiscal Years 2005 to 2014.
In FY 2014, total revenue per capita was $39.34, a 1-year increase of 2.0 percent. However, since the 10-year peak in FY 2009, all types of revenue sources decreased. Over the past 5 years, total operating revenue per capita decreased 3.6 percent. Local government revenue per capita (3.2 percent), state government revenue per capita (4.0 percent), federal government revenue per capita (21.2 percent), and other sources of revenue per capita (6.8 percent) also decreased. The first increase in total operating revenue occurred between FY 2013 and FY 2014. Furthermore, although there was an increase in revenue between FY 2013 and FY 2014, recovery has been slow and has not yet caught up to revenue during FY 2009, after adjusting for inflation.
Indicator 2: Total Operating Expenditures per Capita
The Great Recession also affected operating expenditures for public libraries across the United States. At the national level, in FY 2014, total operating expenditures for public libraries were $11.3 billion (Figure N-2), a 1-year increase of 1.5 percent. Over the past 10 years, total operating expenditures increased 5.7 percent. However, over the past 5 years, operating expenditures decreased 2.2 percent. Post-recession total operating expenditures were slow to recover. Between FY 2009 and FY 2013, total operating expenditures decreased 6.2 percent. It was only between FY 2013 and FY 2014 that total operating expenditures had the first post-recession increase.
The majority of FY 2014 operating expenditures (67.0 percent) went to staffing expenses, which include
salaries and benefits. Of those operating expenditures, public libraries spent $5.6 billion on staff salaries and $2.0 billion on benefits, a 1-year increase of less than 1.0 percent for salaries and of 2.9 percent for benefits.
Library collections accounted for 11.2 percent of total operating expenses. Public libraries spent $1.3 billion on collection materials, a 5- and 10-year decrease of 5.7 percent and 10.0 percent, respectively. However, over the past 10 years, operating expenditures on electronic materials increased 109.6 percent, from $130.2 million in FY 2005 to $273.0 million in FY 2014—accounting for 21.4 percent of all expenditures for library collections. Although many collection expenditures decreased after the Great Recession, expenditures on electronic materials continued to increase. Over the past 5 years, expenditures on electronic materials increased 63.0 percent.
In FY 2014, total operating expenditures per capita were $36.96, a 1-year increase of 2.8 percent. Despite decreases in total operating expenditures over the past 5 and 10 years, total operating expenditures per capita increased. Over the past 10 years, total operating expenditures per capita increased 16.6 percent. After the recession, total operating expenditures per capita continued to have a smaller increase. Over the past 5 years, total operating expenditures per capita had a 2.2 percent increase. Not all types of operating expenditures per capita saw increases over the past 5 years. For instance, expenditures on print materials per capita had a 13.7 percent decrease, due in part to increased spending on electronic books.
Public Libraries Survey | Fiscal Year 2014
PART ONE:National Overview of Public Library Trends
7
Section 2: ResourcesIndicator 3: Public Library Collections per 1,000 People
Public library collections are developed to meet the information needs of the communities they serve. Collections are made up of physical and digital materials, which include print books, e-books, DVDs, and downloadable audio files. The average collection size across all public libraries was 127,620 items, including printed materials, e-books, and audio and video in all formats. However, collection sizes varied, ranging from 452 items to 25.1 million items. Across all public libraries, there were 765.5 million volumes of print materials, mostly books, and 1.37 million print serial subscriptions.
With increased accessibility, digital holdings at public libraries increased over the past 10 years. E-books provide flexibility and convenience for users and an opportunity for libraries to leverage cooperatives for access. Many cooperatives are shared across libraries. In some cases, states purchase or license e-books to be circulated across all public libraries in the state. In FY 2014, 7,096 public libraries (78.2 percent) held an average of 23,544 e-books as part of their collection, with libraries’ collections of e-books ranging from zero to 1,036,312 e-books.
In addition to books, public libraries include audio and video materials in their collections, in both physical and digital/downloadable formats. Among the 8,928 libraries with audio holdings, the average number of items was 12,497. In the 8,939 libraries with video materials, the average number of video materials was 7,485.
Indicator 4: Public Library Programs per 1,000 People
Public libraries are committed to providing opportunities for learning experiences that educate and inspire people throughout their lifetime, such as digital learning, summer reading programs, story time for children, and job-related programming for adults. In FY 2014, public libraries offered 4.5 million programs—a 1-year increase of 4.8 percent and a 10-year increase of 68.0 percent. Public library programs also increased over the past 5 years (19.3 percent). Furthermore, there were 14.6 programs per 1,000 people, a 1-year increase of 4.2 percent. These changes more broadly indicate a change in the state of library composition. Although print and physical audio materials have been decreasing (see Indicator 3), the number of programs has consistently increased, indicating a demand for in-person opportunities that differ from the traditional library services, such as lending books to patrons.
Children’s programs made up 57.4 percent of all program offerings, or a total of 2.6 million programs—a 1-year increase of 2.1 percent and an 11.4 percent increase over the past 5 years. This equated to 8.4 children’s program offerings per 1,000 people. In FY 2014, there were 423,948 programs for young adults across the nation, with 71.1 percent of libraries (6,451) providing young adult’s programs. This equated to 9.5 percent of all program offerings, and 1.4 programs for young adults per 1,000 people.
Indicator 5: Public-Access Internet Computers per 5,000 People
A core function of public libraries is to facilitate open access to resources. Public libraries accomplish this by providing open access to computers and the Internet, serving as technology points for communities. In FY 2014, there were 285,395 public-access Internet computers available in libraries, a 1-year increase of 2.4 percent and a 5-year increase of 16.6 percent. Over the past 10 years, public-access Internet computers increased 54.6 percent. This increase resulted in 4.7 computers per 5,000 people in FY 2014—a 10-year increase of 44.2 percent and a 5-year increase of 13.3 percent. These changes over the past 5 and 10 years indicate a shift in the public library services and resources offered to the public.
Section 3: UseIndicator 6: Visits per Capita
In FY 2014, there were 1.4 billion in-person visits to public libraries across the United States—the equivalent of approximately 3.9 million visits each day (a 1-year decrease of 2.4 percent). Although this reflects a 10-year increase of 4.8 percent, there has been a decrease in physical visits since a peak in FY 2009.11
11 It is critical to interpret trends in patron visits with caution. The PLS collects data on the number of in-person visits to public libraries, but it does not collect similar data on virtual visits.
For example, over the past 5 years, visits decreased 9.4 percent. In FY 2014, visits per capita were 4.6, a 1-year decrease of 3.0 percent. Moreover, visits per capita decreased 12.0 percent over the past 5 years and 2.2 percent over the past 10 years.
On average, public libraries that had e-books as part of their collection also had higher rates of visits and circulation. Public libraries with e-books in their collection had higher rates of visits per capita (average of 4.7) compared to libraries without e-books (average of 3.4).
Public Libraries Survey | Fiscal Year 2014
PART ONE:National Overview of Public Library Trends
8
There were 171.8 million registered borrowers across public libraries in the United States. Over the past 5 years, the number of registered borrowers had little change, increasing slightly from 171.1 million in FY 2010 to 171.8 million in FY 2014.
Indicator 7: Circulation per Capita
Public libraries have a variety of collections available for circulation (i.e., the number of materials that have been checked out for use) to the public, including print books, audio books, DVDs, and e-books. In FY 2014, 2.3 billion materials were circulated in public libraries. This was a 10-year increase of 12.2 percent. However, over the past 5 years, the number of materials circulated decreased from 2.5 billion in FY 2010 to 2.3 billion in FY 2014, resulting in a 6.1 percentage change.
In FY 2014, 817.9 million children’s materials were circulated in public libraries, accounting for 35.4 percent of total collections for circulation. This represented a 10-year increase of 14.3 percent. However, over the past 5 years, circulation decreased 2.3 percent. The same changes occurred for children’s circulation per capita (2.7 items), a 1-year decrease of 2.6 percent. Although children’s circulation per capita had a 10-year increase of 6.8 percent, over the past 5 years there was a steady decrease in children’s circulation per capita, from 2.8 items in FY 2010 to 2.7 items in FY 2014. Total circulation per capita exhibited the same trends, including a 1-year decrease of 3.0 percent. Over the past 10 years, total circulation per capita increased 4.6 percent but decreased 8.8 percent over the past 5 years.
Indicator 8: Program Attendance per 1,000 People
Public libraries serve as valuable learning spaces in their local communities. People go to libraries for speaker series, tutoring, computer training, story hour, and other activities. Although circulation of material decreased over the past 5 and 10 years, program attendance increased. In FY 2014, there were 101.9 million attendees12
12 The number of attendees is not an accounting of individual people; it may include multiple instances of the same person if that person participated in more than one program.
at public library programs, a 1-year increase of 5.5 percent. Over the past 5 and 10 years, program attendance increased 17.6 percent and 43.9 percent, respectively. Total attendance per 1,000 people was 332.4—that is, for every 1,000 people in a library service area, there were approximately 332 patrons who attended a public library program in FY 2014. Average attendance at library programs was 22.8 people per program.
Children under 18 years of age made up 23.1 percent of the total U.S. population in 2014.13
13 Annual Estimates of the Resident Population for Selected Age Groups by Sex for the United States, States, Counties, and Puerto Rico Commonwealth and Municipios: April 1, 2010, to July 1, 2014. Source: U.S. Census Bureau, Population Division. Release Date: June 2015.
To meet the needs of this segment of the population, public libraries provide programs targeting children and young adults. In FY 2014, there were 70.1 million attendees at programs for children, a 1-year increase of 4.0 percent. Over the past 5 and 10 years, children’s program attendance increased 15.9 percent and 28.6 percent, respectively. Children’s programs at public libraries are among the most popular of all programs: 68.8 percent of total FY 2014 program attendance was for children’s programs. Attendance at children’s programs per 1,000 people was 228.8. There were 6.7 million attendees at programs for young adults, a 1-year increase of 9.2 percent. Young adult attendance had the largest increase, 36.3 percent, over the past 5 years. Attendance at young adult’s programs per 1,000 people was 21.8.
The increase in program attendance shows a larger picture of the changing state of public libraries in the United States. Visits to public libraries decreased over the past 5 and 10 years, yet program attendance increased. Although less physical content is being distributed, patrons are still using libraries for less traditional services. Furthermore, despite the recession in 2008, program attendance has consistently increased—a trend that has been under way since FY 2004.
Indicator 9: Public-Access Internet Computer Usage per Capita
Access to the Internet and computer resources is one of the many services that public libraries provide. Many public libraries offer broadband (high-speed Internet service), which can be accessed through the library-provided computers. In FY 2014, there were 322.0 million user sessions on public-access Internet computers, a 1-year decrease of 3.6 percent and a 5-year decrease of 12.5 percent. Furthermore, there were 1.1 user sessions per capita, a 1-year decrease of 4.5 percent.
Indicator 10: Reference Transactions per Capita
Reference transactions are an important service provided by public libraries. Librarians use their expertise to offer recommendations and provide instruction or interpretation to patrons looking for material or other resources. Librarians and other library staff performed 262.7 million reference transactions in FY 2014, a 1-year decrease of 3.6 percent and 5- and 10-year
Public Libraries Survey | Fiscal Year 2014
PART ONE:National Overview of Public Library Trends
9
decreases of 14.9 percent and 13.1 percent, respectively. This equated to 0.86 reference transactions per capita and a 3.7 percent decrease over the past year. Over the past 5 and 10 years, reference transactions per capita decreased (17.6 percent and 19.1 percent, respectively).
Section 4: StaffingIndicators 11 and 12: Numbers of Full-Time Equivalent Staff per 25,000 People
One of the most important assets in public libraries is knowledgeable library staff. Three indicators describe the current status of library staff: total staff per 25,000 people, full-time equivalent (FTE) librarians per 25,000 people, and percentage of librarians with a Master of Library Science degree (MLS) accredited by the American Library Association (ALA).
Public library services were supported by 138,332 FTE staff,14
14 Full-time equivalent (FTE) refers to 40 hours of work per week. For example, two people who work a part-time schedule of 20 hours per week are equal to 1.0 FTE.
a 1-year increase of 0.8 percent. Across the United States, there were 11.3 FTE staff per 25,000 people, a 10-year decrease of 6.3 percent and a decrease of 9.0 percent when compared to the peak of FY 2007.
FTE librarians (47,194) composed 34.1 percent of total staff, a 10-year increase of 3.8 percent. There were 4.0 FTE librarians per 25,000 people, a 2.8 percent decrease since FY 2005.
Indicator 13: Percentage of Librarians with an ALA-Accredited Master’s Degree
Two-thirds (67.9 percent) of librarians had an MLS degree from an ALA-accredited graduate program. More than half of public libraries (52.6 percent) had at least one librarian on staff with an ALA-accredited master’s degree. In contrast, 1.0 percent (just 94 public libraries across the country) did not have a librarian at all (whether with an MLS degree or not).
Summary of National-Level Estimates Part One of this report explored national-level estimates of public library financial health, resources, and services. Findings indicate an evolving public library system in the United States. In some cases, FY 2014 showed the first increase in finances and services since the Great Recession. Moreover, patron demands differ compared to those of the past 5 and 10 years. For instance, public libraries are seeing a demand for digital versions of print materials and program offerings to children and young adults. In contrast, many of the traditional library resources and services continue to trend downward.
Since FY 2012, public libraries have begun to stabilize after the recession. In many cases, public libraries did not see improvements in financial health until 2014. Operating revenue for public libraries increased over the past 1, 5, and 10 years; the majority of revenue comes from local government sources. However, trends developed after the Great Recession still continue in 2014. Operating revenue has yet to catch up to pre-recession levels (revenue saw consistent increases until the apex of the recession in 2009). Furthermore, between FY 2009 and FY 2013, operating revenue decreased. One of the most striking changes is the increase in the proportion of revenue coming from local governments, as revenue from state and federal governments declined.
Operating expenditures also had 1- and 10-year increases, a possible sign of the improving financial health of libraries across the United States. However, over the past 5 years, since FY 2010, operating expenditures decreased. Much like operating revenue, operating expenditures have not caught up to pre-recession levels. In FY 2009, operating expenditures for public libraries in the United States were higher than those in FY 2014, after adjusting for inflation. In fact, nationally, operating expenditures in public libraries increased until FY 2014. The majority of operating expenditures went toward staffing expenses, specifically staff salaries. Although operating expenditures on print materials decreased, operating expenditures on electronic materials consistently increased over the past 5 and 10 years. Although the recession affected the operating expenditures on staffing and resources, operating expenditures on electronic materials continued because of the demand for digital material.
Overall, collections at public libraries increased over the past 10 years. However, the number of print materials at public libraries decreased, whereas access to e-books increased dramatically over the past 10 years. These changes show an increased demand for digital services and the changing environment of public libraries.
In-person visits and circulation rates decreased over the past 5 years. However, circulation rates still show a 10-year increase. The number of user sessions on public-access Internet computers also had both a 1- and 5-year decrease. In contrast to these other metrics of library
Public Libraries Survey | Fiscal Year 2014
PART ONE:National Overview of Public Library Trends
10
use, attendance at programs of all types (e.g., children’s programs, young adult’s programs, adult’s programs) continued to increase over the past 10 years.
One of the reasons for the increase in program attendance is the increase in the number of program offerings to the public. One-, 5-, and 10-year trends show a continual rise in the number of program offerings. Specifically, children’s programs, which account for the majority of program offerings, increased yearly. Furthermore, the number of public-access Internet computers increased since FY 2004 and continued to increase every year.
Finally, despite increases in operating revenue and expenditures, staffing had very little change over the past year. Furthermore, staffing levels decreased over the past 10 years.
There is still a high demand for the valuable resources and services that public libraries provide. The measures of public library use showed an increase in the demand for library services over the past 10 years. As the public continues to invest in the resources provided by public libraries, it is important that these investments not only be used to provide concrete resources but also be directed toward meeting the strong need for digital resources and trained library staff.
Although there were declines for some metrics in recent years, the indicators tell a cohesive and consistent story: People are still using public libraries. The indicators dig a little deeper into each metric, with additional detail on variations based on state, population, and locale. The deeper dive into the 13 public indicators in Part Two echo the findings from the national analysis presented in Part One.
PART TWO:Public Library Indicators
Public Libraries Survey | Fiscal Year 2014
PART TWO:Public Library Indicators
12
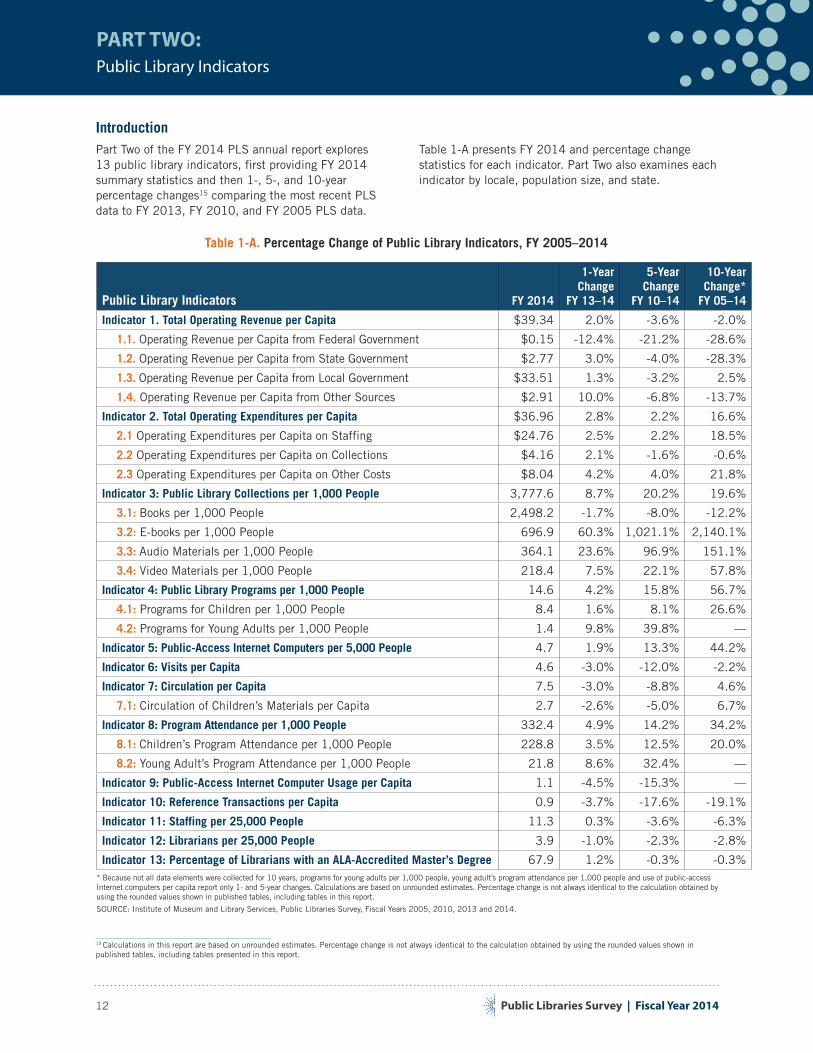
IntroductionPart Two of the FY 2014 PLS annual report explores 13 public library indicators, first providing FY 2014 summary statistics and then 1-, 5-, and 10-year percentage changes15
15 Calculations in this report are based on unrounded estimates. Percentage change is not always identical to the calculation obtained by using the rounded values shown in published tables, including tables presented in this report.
comparing the most recent PLS data to FY 2013, FY 2010, and FY 2005 PLS data.
Table 1-A presents FY 2014 and percentage change statistics for each indicator. Part Two also examines each indicator by locale, population size, and state.
Table 1-A. Percentage Change of Public Library Indicators, FY 2005–2014
Public Library Indicators FY 2014
1-Year Change
FY 13–14
5-Year Change
FY 10–14
10-Year Change*
FY 05–14
Indicator 1. Total Operating Revenue per Capita $39.34 2.0% -3.6% -2.0%
1.1. Operating Revenue per Capita from Federal Government $0.15 -12.4% -21.2% -28.6%
1.2. Operating Revenue per Capita from State Government $2.77 3.0% -4.0% -28.3%
1.3. Operating Revenue per Capita from Local Government $33.51 1.3% -3.2% 2.5%
1.4. Operating Revenue per Capita from Other Sources $2.91 10.0% -6.8% -13.7%
Indicator 2. Total Operating Expenditures per Capita $36.96 2.8% 2.2% 16.6%
2.1 Operating Expenditures per Capita on Staffing $24.76 2.5% 2.2% 18.5%
2.2 Operating Expenditures per Capita on Collections $4.16 2.1% -1.6% -0.6%
2.3 Operating Expenditures per Capita on Other Costs $8.04 4.2% 4.0% 21.8%
Indicator 3: Public Library Collections per 1,000 People 3,777.6 8.7% 20.2% 19.6%
3.1: Books per 1,000 People 2,498.2 -1.7% -8.0% -12.2%
3.2: E-books per 1,000 People 696.9 60.3% 1,021.1% 2,140.1%
3.3: Audio Materials per 1,000 People 364.1 23.6% 96.9% 151.1%
3.4: Video Materials per 1,000 People 218.4 7.5% 22.1% 57.8%
Indicator 4: Public Library Programs per 1,000 People 14.6 4.2% 15.8% 56.7%
4.1: Programs for Children per 1,000 People 8.4 1.6% 8.1% 26.6%
4.2: Programs for Young Adults per 1,000 People 1.4 9.8% 39.8% —
Indicator 5: Public-Access Internet Computers per 5,000 People 4.7 1.9% 13.3% 44.2%
Indicator 6: Visits per Capita 4.6 -3.0% -12.0% -2.2%
Indicator 7: Circulation per Capita 7.5 -3.0% -8.8% 4.6%
7.1: Circulation of Children’s Materials per Capita 2.7 -2.6% -5.0% 6.7%
Indicator 8: Program Attendance per 1,000 People 332.4 4.9% 14.2% 34.2%
8.1: Children’s Program Attendance per 1,000 People 228.8 3.5% 12.5% 20.0%
8.2: Young Adult’s Program Attendance per 1,000 People 21.8 8.6% 32.4% —
Indicator 9: Public-Access Internet Computer Usage per Capita 1.1 -4.5% -15.3% —
Indicator 10: Reference Transactions per Capita 0.9 -3.7% -17.6% -19.1%
Indicator 11: Staffing per 25,000 People 11.3 0.3% -3.6% -6.3%
Indicator 12: Librarians per 25,000 People 3.9 -1.0% -2.3% -2.8%
Indicator 13: Percentage of Librarians with an ALA-Accredited Master’s Degree 67.9 1.2% -0.3% -0.3%* Because not all data elements were collected for 10 years, programs for young adults per 1,000 people, young adult’s program attendance per 1,000 people and use of public-access Internet computers per capita report only 1- and 5-year changes. Calculations are based on unrounded estimates. Percentage change is not always identical to the calculation obtained by using the rounded values shown in published tables, including tables in this report.
SOURCE: Institute of Museum and Library Services, Public Libraries Survey, Fiscal Years 2005, 2010, 2013 and 2014.
Public Libraries Survey | Fiscal Year 2014
PART TWO:Public Library Indicators
13
About the SubgroupingsIn Part Two, each of the indicators is not only examined at the national level but is also based on subgroups: locale, size of population served,16
16 Population size is measured using the population of the legal service area (LSA). In the PLS, the LSA is the geographic space that a library services. Some states have libraries with overlapping boundaries; therefore, multiple libraries could serve the same LSA population.
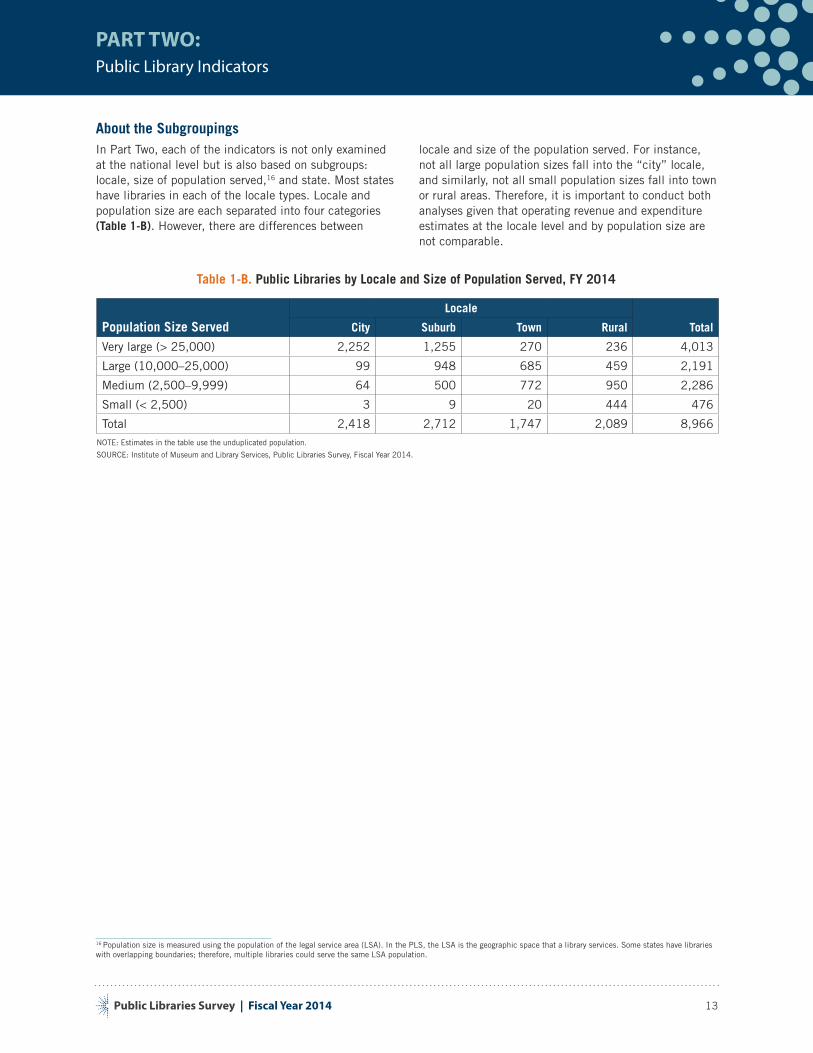
and state. Most states have libraries in each of the locale types. Locale and population size are each separated into four categories (Table 1-B). However, there are differences between
locale and size of the population served. For instance, not all large population sizes fall into the “city” locale, and similarly, not all small population sizes fall into town or rural areas. Therefore, it is important to conduct both analyses given that operating revenue and expenditure estimates at the locale level and by population size are not comparable.
Table 1-B. Public Libraries by Locale and Size of Population Served, FY 2014
Population Size ServedLocale
TotalCity Suburb Town Rural
Very large (> 25,000) 2,252 1,255 270 236 4,013
Large (10,000–25,000) 99 948 685 459 2,191
Medium (2,500–9,999) 64 500 772 950 2,286
Small (< 2,500) 3 9 20 444 476
Total 2,418 2,712 1,747 2,089 8,966NOTE: Estimates in the table use the unduplicated population.
SOURCE: Institute of Museum and Library Services, Public Libraries Survey, Fiscal Year 2014.
Public Libraries Survey | Fiscal Year 2014
PART TWO:Public Library Indicators | Section 1: Financial Health
14
Section 1: Financial Health
OverviewPublic library indicators are a set of metrics that provide a snapshot of the status of the financial health of public libraries. Most public library services and resources are dependent on how public libraries receive and spend money. They serve as a gauge of changes in public library use, service, and resources. Indicators in Section 1 are calculated as per capita estimates, adjusting for population; thus, they provide a way to compare performance across libraries. Results for each indicator are also broken out by category at the regional, state, and local levels. The analysis that follows also examines 1-, 5-, and 10-year changes (FY 2013, FY 2010, and FY 2005, respectively, adjusted to constant 2014 dollars) that paint a picture of the use and health of public libraries in the United States over time.
This section looks at changes in Indicator 1 (operating revenue) and Indicator 2 (operating expenditures) at the national level over time. The majority of operating expenditures increased over the past year as well as the past 5 and 10 years.
Finally, the financial health of public libraries is examined by locale, population size, and state, exploring differences in FY 2014. The national-level analysis provides a snapshot of the operations of libraries at a macro level, whereas these detailed analyses show unique differences in library finances. For instance, there was not a 1-year increase in total operating expenditures for all states.
Indicator 1: Total Operating Revenue per Capita
In FY 2014, public libraries in the United States had $12.1 billion in total operating revenue, or $39.34 per capita.
The types of services, programs, staffing, and collections offered by public libraries are dependent on the total operating revenue. Total operating revenue is generated primarily from four sources: local government, state government, federal government, and other sources (e.g., monetary gifts and donations). Historically, the majority of public library revenue has been generated by local governments.
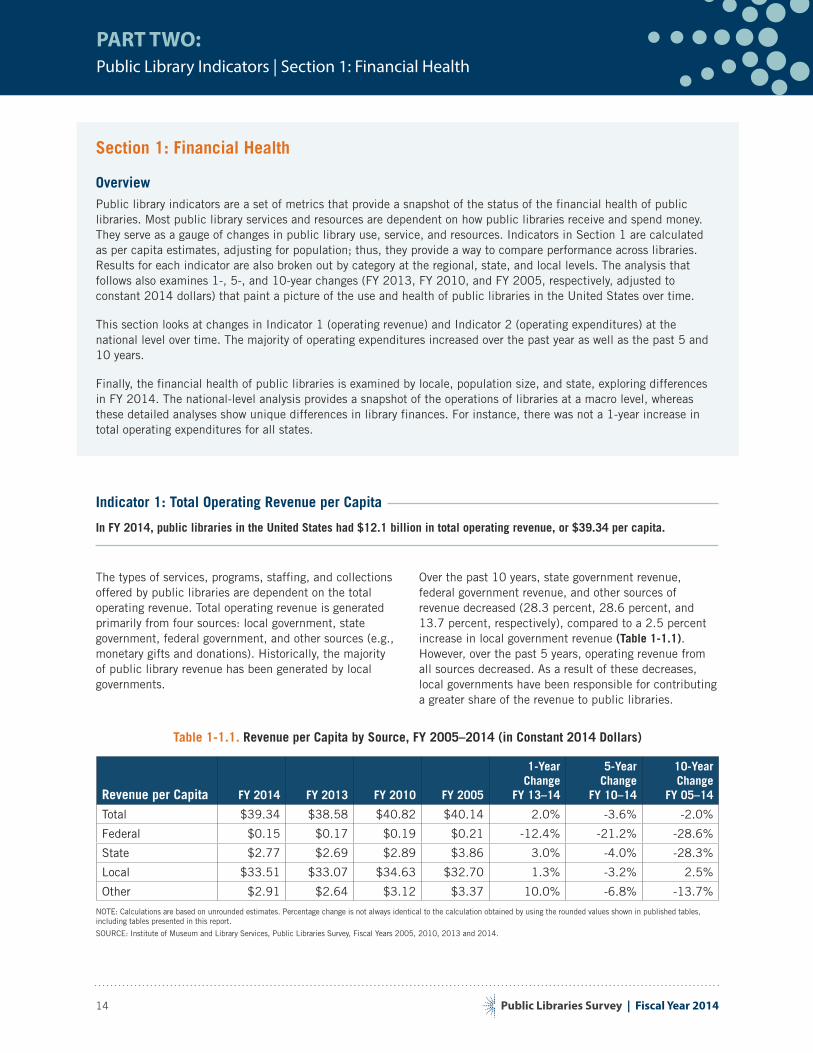
Over the past 10 years, state government revenue, federal government revenue, and other sources of revenue decreased (28.3 percent, 28.6 percent, and 13.7 percent, respectively), compared to a 2.5 percent increase in local government revenue (Table 1-1.1). However, over the past 5 years, operating revenue from all sources decreased. As a result of these decreases, local governments have been responsible for contributing a greater share of the revenue to public libraries.
Table 1-1.1. Revenue per Capita by Source, FY 2005–2014 (in Constant 2014 Dollars)
Revenue per Capita FY 2014 FY 2013 FY 2010 FY 2005
1-Year Change
FY 13–14
5-Year Change
FY 10–14
10-Year Change
FY 05–14
Total $39.34 $38.58 $40.82 $40.14 2.0% -3.6% -2.0%
Federal $0.15 $0.17 $0.19 $0.21 -12.4% -21.2% -28.6%
State $2.77 $2.69 $2.89 $3.86 3.0% -4.0% -28.3%
Local $33.51 $33.07 $34.63 $32.70 1.3% -3.2% 2.5%
Other $2.91 $2.64 $3.12 $3.37 10.0% -6.8% -13.7%
NOTE: Calculations are based on unrounded estimates. Percentage change is not always identical to the calculation obtained by using the rounded values shown in published tables, including tables presented in this report.
SOURCE: Institute of Museum and Library Services, Public Libraries Survey, Fiscal Years 2005, 2010, 2013 and 2014.
Public Libraries Survey | Fiscal Year 2014
PART TWO:Public Library Indicators | Section 1: Financial Health
15
Public libraries in the United States had a total revenue per capita of $39.34 in FY 2014, a 1-year increase of 2.0 percent. There was a 2.0 percent decrease in total revenue per capita over the past 10 years. However, over the past 5 years, there was a 3.6 percent decrease in total operating revenue between FY 2010 ($40.82) and FY 2014 ($39.34).
Federal government revenue per capita made up only 0.4 percent of total revenue, equating to $0.15 per capita in FY 2014, a 1-year decrease of 12.4 percent from FY 2013. Over the past 5 and 10 years, federal government revenue per capita decreased 21.2 percent and 28.6 percent, respectively.
State government revenue made up 7.0 percent of total revenue in FY 2014, equating to $2.77 per capita, for a 1-year increase of 3.0 percent. Over the past 10 years, state government revenue per capita decreased 28.3 percent, with a 4.0 percent decrease over the past 5 years.
In FY 2014, local governments provided most of libraries’ revenue (85.2 percent), which equated to
$33.51 per capita and a 1-year increase of 1.3 percent. Over the past 10 years, local government revenue increased 2.5 percent. In FY 2005, local governments contributed $32.70 per capita, representing 81.4 percent of public libraries’ revenues. However, over the past 5 years, local government revenue decreased 3.2 percent.
Other sources of revenue made up 7.4 percent of total revenue, which equated to $2.91 per capita and a 1-year increase of 10.0 percent. However, over the past 5 and 10 years, other sources of revenue per capita decreased 6.8 percent and 13.7 percent respectively.
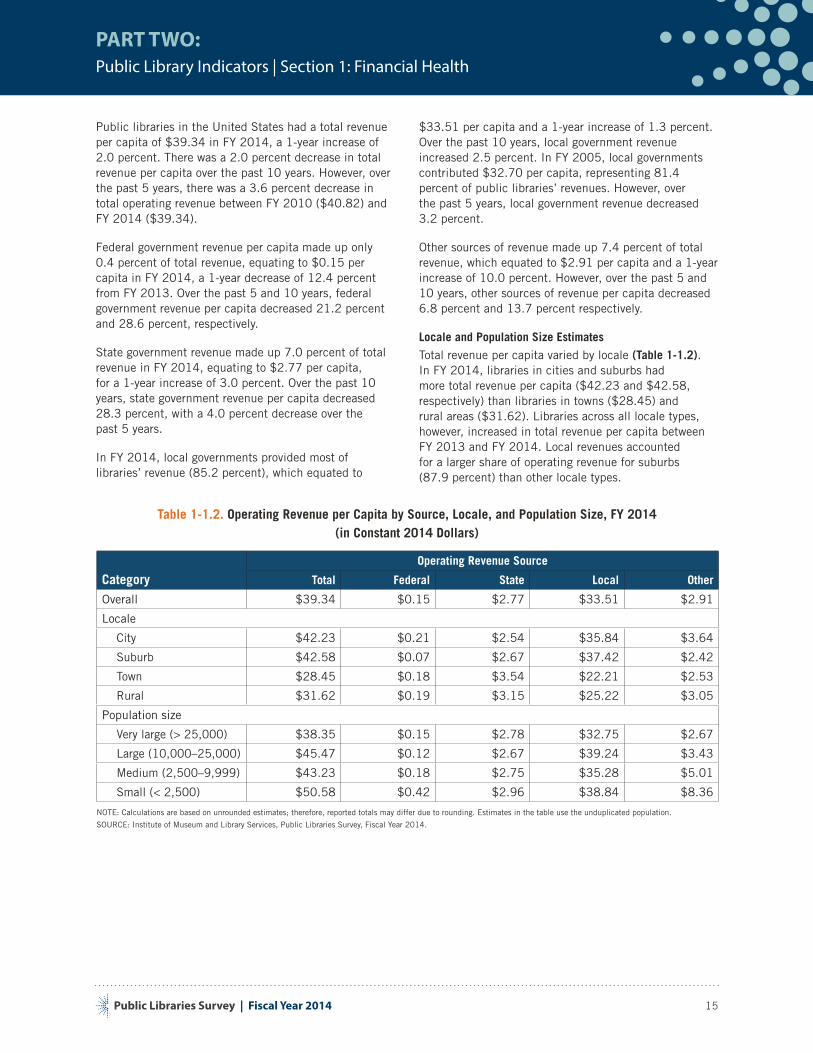
Locale and Population Size Estimates
Total revenue per capita varied by locale (Table 1-1.2). In FY 2014, libraries in cities and suburbs had more total revenue per capita ($42.23 and $42.58, respectively) than libraries in towns ($28.45) and rural areas ($31.62). Libraries across all locale types, however, increased in total revenue per capita between FY 2013 and FY 2014. Local revenues accounted for a larger share of operating revenue for suburbs (87.9 percent) than other locale types.
Table 1-1.2. Operating Revenue per Capita by Source, Locale, and Population Size, FY 2014 (in Constant 2014 Dollars)
CategoryOperating Revenue Source
Total Federal State Local Other
Overall $39.34 $0.15 $2.77 $33.51 $2.91
Locale
City $42.23 $0.21 $2.54 $35.84 $3.64
Suburb $42.58 $0.07 $2.67 $37.42 $2.42
Town $28.45 $0.18 $3.54 $22.21 $2.53
Rural $31.62 $0.19 $3.15 $25.22 $3.05
Population size
Very large (> 25,000) $38.35 $0.15 $2.78 $32.75 $2.67
Large (10,000–25,000) $45.47 $0.12 $2.67 $39.24 $3.43
Medium (2,500–9,999) $43.23 $0.18 $2.75 $35.28 $5.01
Small (< 2,500) $50.58 $0.42 $2.96 $38.84 $8.36
NOTE: Calculations are based on unrounded estimates; therefore, reported totals may differ due to rounding. Estimates in the table use the unduplicated population.
SOURCE: Institute of Museum and Library Services, Public Libraries Survey, Fiscal Year 2014.
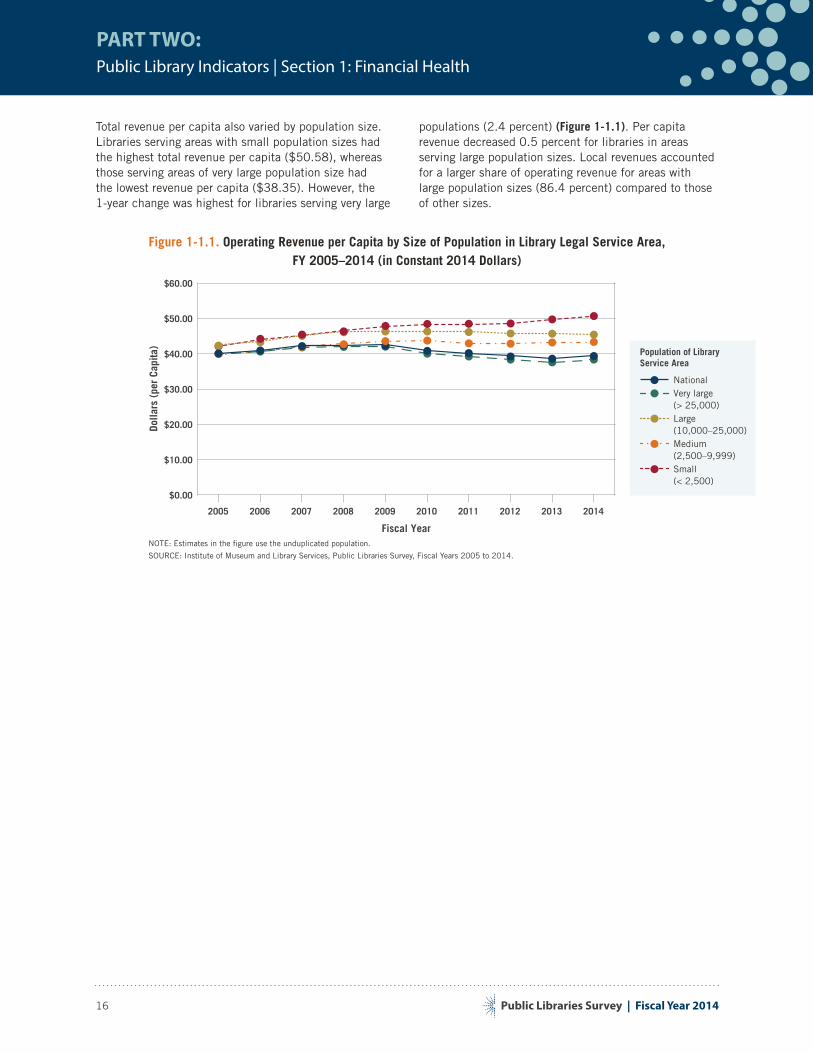
Public Libraries Survey | Fiscal Year 2014
PART TWO:Public Library Indicators | Section 1: Financial Health
16
Total revenue per capita also varied by population size. Libraries serving areas with small population sizes had the highest total revenue per capita ($50.58), whereas those serving areas of very large population size had the lowest revenue per capita ($38.35). However, the 1-year change was highest for libraries serving very large
populations (2.4 percent) (Figure 1-1.1). Per capita revenue decreased 0.5 percent for libraries in areas serving large population sizes. Local revenues accounted for a larger share of operating revenue for areas with large population sizes (86.4 percent) compared to those of other sizes.
Figure 1-1.1. Operating Revenue per Capita by Size of Population in Library Legal Service Area, FY 2005–2014 (in Constant 2014 Dollars)
2005 2006 2007 2008 2009 2010 2011 2012 2013 2014
$0.00
$10.00
$20.00
$30.00
$40.00
$50.00
$60.00
Population of Library Service Area
Fiscal Year
Dolla
rs (
per
Capi
ta)
Small (< 2,500)
Medium (2,500–9,999)
Large (10,000–25,000)
Very large (> 25,000)
National
NOTE: Estimates in the figure use the unduplicated population.
SOURCE: Institute of Museum and Library Services, Public Libraries Survey, Fiscal Years 2005 to 2014.
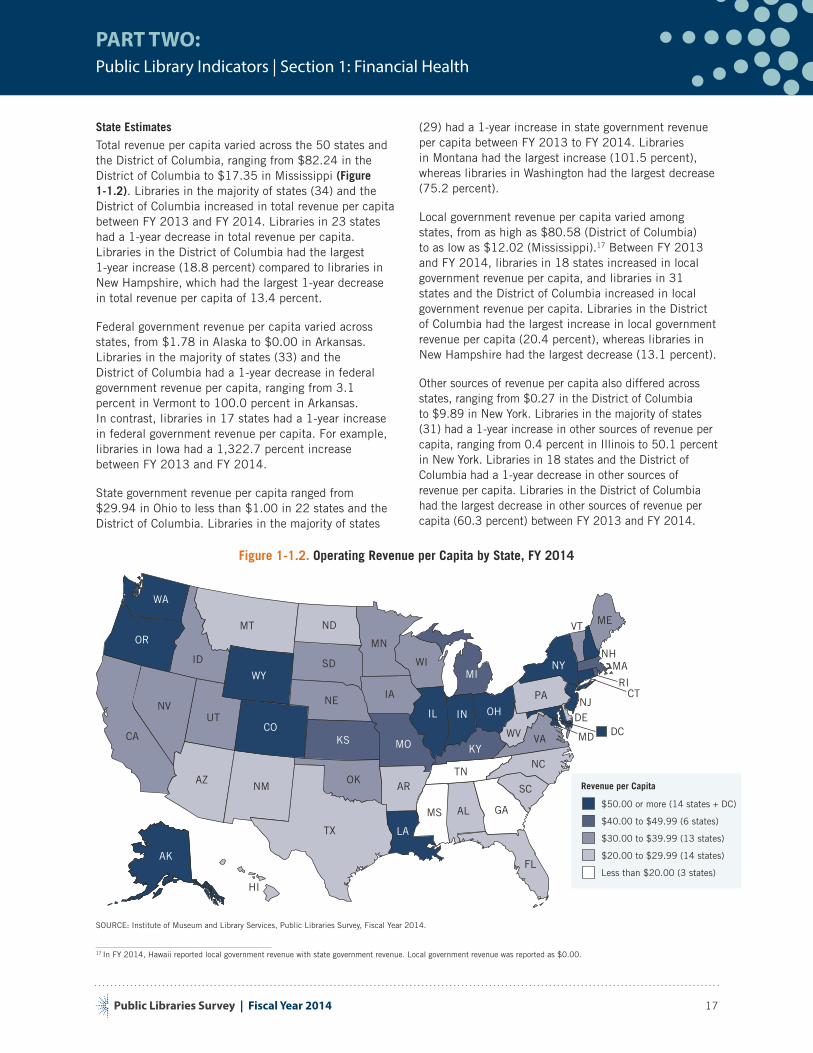
Public Libraries Survey | Fiscal Year 2014
PART TWO:Public Library Indicators | Section 1: Financial Health
17
State Estimates
Total revenue per capita varied across the 50 states and the District of Columbia, ranging from $82.24 in the District of Columbia to $17.35 in Mississippi (Figure 1-1.2). Libraries in the majority of states (34) and the District of Columbia increased in total revenue per capita between FY 2013 and FY 2014. Libraries in 23 states had a 1-year decrease in total revenue per capita. Libraries in the District of Columbia had the largest 1-year increase (18.8 percent) compared to libraries in New Hampshire, which had the largest 1-year decrease in total revenue per capita of 13.4 percent.
Federal government revenue per capita varied across states, from $1.78 in Alaska to $0.00 in Arkansas. Libraries in the majority of states (33) and the District of Columbia had a 1-year decrease in federal government revenue per capita, ranging from 3.1 percent in Vermont to 100.0 percent in Arkansas. In contrast, libraries in 17 states had a 1-year increase in federal government revenue per capita. For example, libraries in Iowa had a 1,322.7 percent increase between FY 2013 and FY 2014.
State government revenue per capita ranged from $29.94 in Ohio to less than $1.00 in 22 states and the District of Columbia. Libraries in the majority of states
(29) had a 1-year increase in state government revenue per capita between FY 2013 to FY 2014. Libraries in Montana had the largest increase (101.5 percent), whereas libraries in Washington had the largest decrease (75.2 percent).
Local government revenue per capita varied among states, from as high as $80.58 (District of Columbia) to as low as $12.02 (Mississippi).17
17 In FY 2014, Hawaii reported local government revenue with state government revenue. Local government revenue was reported as $0.00.
Between FY 2013 and FY 2014, libraries in 18 states increased in local government revenue per capita, and libraries in 31 states and the District of Columbia increased in local government revenue per capita. Libraries in the District of Columbia had the largest increase in local government revenue per capita (20.4 percent), whereas libraries in New Hampshire had the largest decrease (13.1 percent).
Other sources of revenue per capita also differed across states, ranging from $0.27 in the District of Columbia to $9.89 in New York. Libraries in the majority of states (31) had a 1-year increase in other sources of revenue per capita, ranging from 0.4 percent in Illinois to 50.1 percent in New York. Libraries in 18 states and the District of Columbia had a 1-year decrease in other sources of revenue per capita. Libraries in the District of Columbia had the largest decrease in other sources of revenue per capita (60.3 percent) between FY 2013 and FY 2014.
Figure 1-1.2. Operating Revenue per Capita by State, FY 2014
Revenue per Capita
$30.00 to $39.99 (13 states)
$20.00 to $29.99 (14 states)
$40.00 to $49.99 (6 states)
Less than $20.00 (3 states)
$50.00 or more (14 states + DC)
DC DE UT
RI
WA
MT NDOR
ID
WYSD
CA
NV
COKS
NE
AZNM
OK
AK
MN
IA
MO
ARTN
NC
LA
FL
MS AL GA
WI
IL
KY
IN OH
WV
PA
NY
VA
MEVT
NH MA
CT
SC
MI
HI
NJ
TX
MD
SOURCE: Institute of Museum and Library Services, Public Libraries Survey, Fiscal Year 2014.
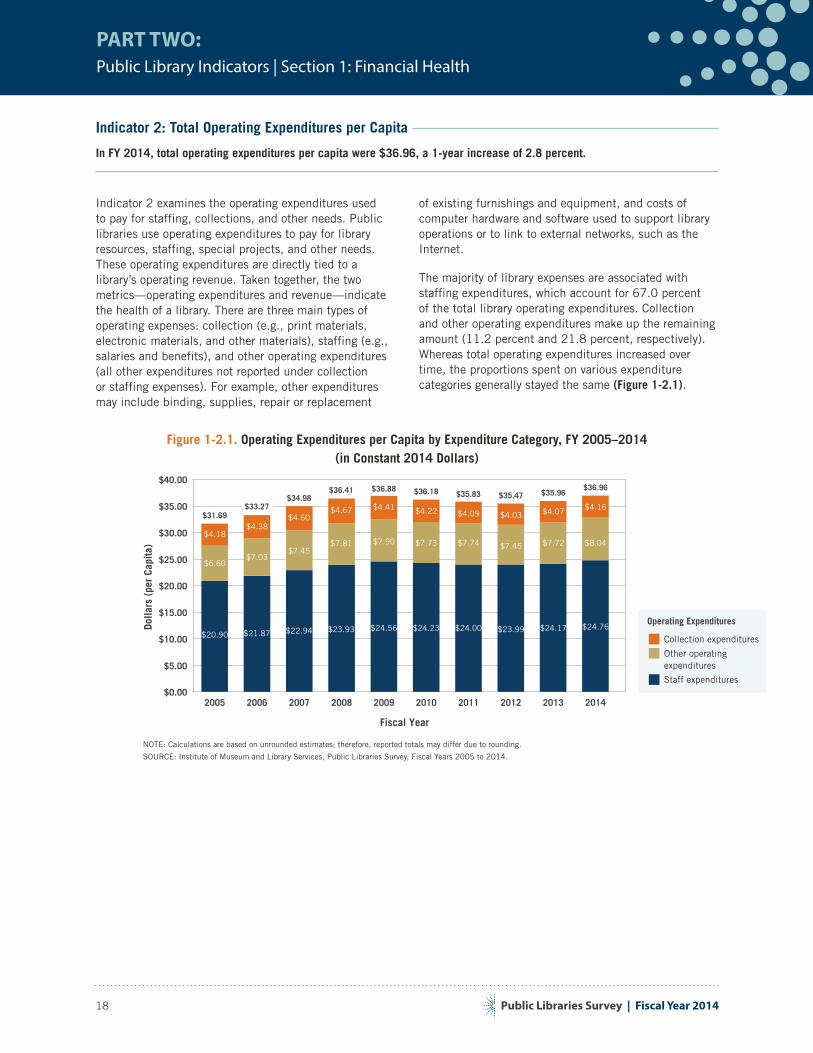
Public Libraries Survey | Fiscal Year 2014
PART TWO:Public Library Indicators | Section 1: Financial Health
18
Indicator 2: Total Operating Expenditures per Capita
In FY 2014, total operating expenditures per capita were $36.96, a 1-year increase of 2.8 percent.
Indicator 2 examines the operating expenditures used to pay for staffing, collections, and other needs. Public libraries use operating expenditures to pay for library resources, staffing, special projects, and other needs. These operating expenditures are directly tied to a library’s operating revenue. Taken together, the two metrics—operating expenditures and revenue—indicate the health of a library. There are three main types of operating expenses: collection (e.g., print materials, electronic materials, and other materials), staffing (e.g., salaries and benefits), and other operating expenditures (all other expenditures not reported under collection or staffing expenses). For example, other expenditures may include binding, supplies, repair or replacement
of existing furnishings and equipment, and costs of computer hardware and software used to support library operations or to link to external networks, such as the Internet.
The majority of library expenses are associated with staffing expenditures, which account for 67.0 percent of the total library operating expenditures. Collection and other operating expenditures make up the remaining amount (11.2 percent and 21.8 percent, respectively). Whereas total operating expenditures increased over time, the proportions spent on various expenditure categories generally stayed the same (Figure 1-2.1).
Figure 1-2.1. Operating Expenditures per Capita by Expenditure Category, FY 2005–2014 (in Constant 2014 Dollars)
Dolla
rs (
per
Capi
ta)
Fiscal Year
2005 2006 2007 2008 2009 2010 2011 2012 2013 2014$0.00
$5.00
$10.00
$15.00
$20.00
$25.00
$30.00
$35.00
$40.00
Operating Expenditures
Staff expenditures
Other operating expenditures
Collection expenditures$20.90 $21.87 $22.94 $23.93 $24.56 $24.23 $24.00 $23.99 $24.17 $24.76
$31.69$33.27
$34.98$36.41 $36.88 $36.18 $35.83 $35.47 $35.96
$36.96
$6.60$7.03
$7.45$7.81 $7.90 $7.73 $7.74 $7.45 $7.72 $8.04
$4.18$4.38
$4.60$4.67 $4.41 $4.22 $4.09 $4.03 $4.07 $4.16
NOTE: Calculations are based on unrounded estimates; therefore, reported totals may differ due to rounding.
SOURCE: Institute of Museum and Library Services, Public Libraries Survey, Fiscal Years 2005 to 2014.
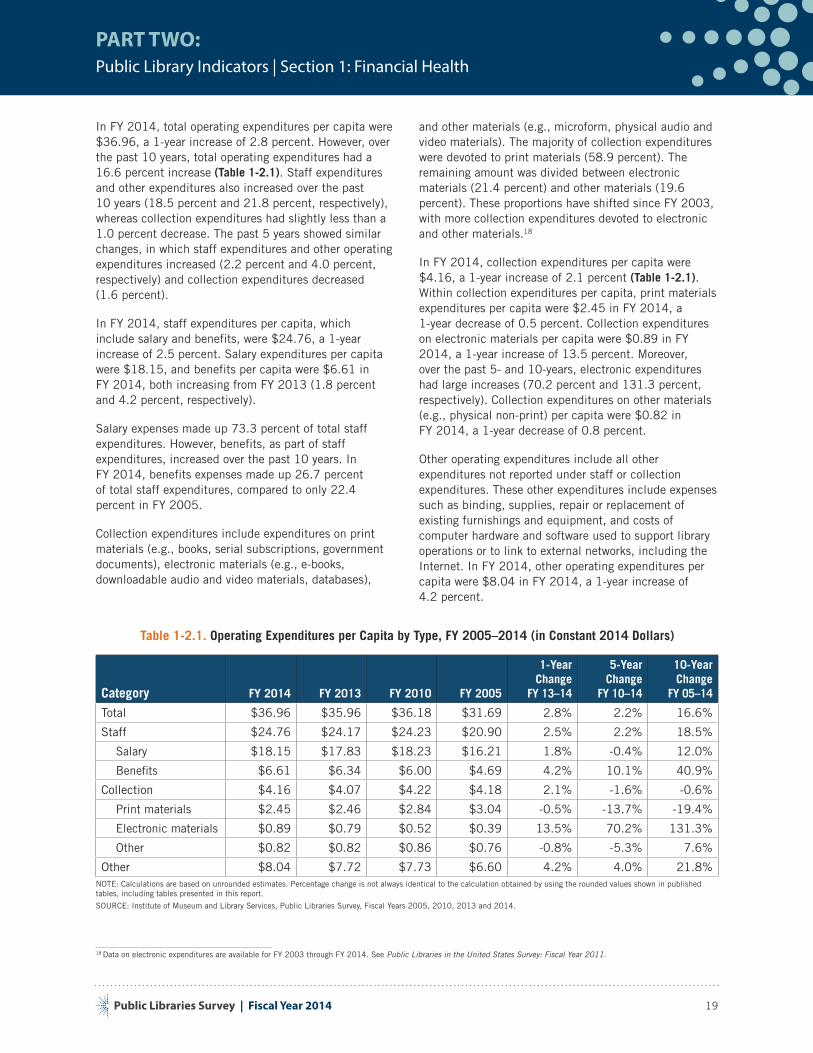
Public Libraries Survey | Fiscal Year 2014
PART TWO:Public Library Indicators | Section 1: Financial Health
19
In FY 2014, total operating expenditures per capita were $36.96, a 1-year increase of 2.8 percent. However, over the past 10 years, total operating expenditures had a 16.6 percent increase (Table 1-2.1). Staff expenditures and other expenditures also increased over the past 10 years (18.5 percent and 21.8 percent, respectively), whereas collection expenditures had slightly less than a 1.0 percent decrease. The past 5 years showed similar changes, in which staff expenditures and other operating expenditures increased (2.2 percent and 4.0 percent, respectively) and collection expenditures decreased (1.6 percent).
In FY 2014, staff expenditures per capita, which include salary and benefits, were $24.76, a 1-year increase of 2.5 percent. Salary expenditures per capita were $18.15, and benefits per capita were $6.61 in FY 2014, both increasing from FY 2013 (1.8 percent and 4.2 percent, respectively).
Salary expenses made up 73.3 percent of total staff expenditures. However, benefits, as part of staff expenditures, increased over the past 10 years. In FY 2014, benefits expenses made up 26.7 percent of total staff expenditures, compared to only 22.4 percent in FY 2005.
Collection expenditures include expenditures on print materials (e.g., books, serial subscriptions, government documents), electronic materials (e.g., e-books, downloadable audio and video materials, databases),
and other materials (e.g., microform, physical audio and video materials). The majority of collection expenditures were devoted to print materials (58.9 percent). The remaining amount was divided between electronic materials (21.4 percent) and other materials (19.6 percent). These proportions have shifted since FY 2003, with more collection expenditures devoted to electronic and other materials.18
18 Data on electronic expenditures are available for FY 2003 through FY 2014. See Public Libraries in the United States Survey: Fiscal Year 2011.
In FY 2014, collection expenditures per capita were $4.16, a 1-year increase of 2.1 percent (Table 1-2.1). Within collection expenditures per capita, print materials expenditures per capita were $2.45 in FY 2014, a 1-year decrease of 0.5 percent. Collection expenditures on electronic materials per capita were $0.89 in FY 2014, a 1-year increase of 13.5 percent. Moreover, over the past 5- and 10-years, electronic expenditures had large increases (70.2 percent and 131.3 percent, respectively). Collection expenditures on other materials (e.g., physical non-print) per capita were $0.82 in FY 2014, a 1-year decrease of 0.8 percent.
Other operating expenditures include all other expenditures not reported under staff or collection expenditures. These other expenditures include expenses such as binding, supplies, repair or replacement of existing furnishings and equipment, and costs of computer hardware and software used to support library operations or to link to external networks, including the Internet. In FY 2014, other operating expenditures per capita were $8.04 in FY 2014, a 1-year increase of 4.2 percent.
Table 1-2.1. Operating Expenditures per Capita by Type, FY 2005–2014 (in Constant 2014 Dollars)
Category FY 2014 FY 2013 FY 2010 FY 2005
1-Year Change
FY 13–14
5-Year Change
FY 10–14
10-Year Change
FY 05–14
Total $36.96 $35.96 $36.18 $31.69 2.8% 2.2% 16.6%
Staff $24.76 $24.17 $24.23 $20.90 2.5% 2.2% 18.5%
Salary $18.15 $17.83 $18.23 $16.21 1.8% -0.4% 12.0%
Benefits $6.61 $6.34 $6.00 $4.69 4.2% 10.1% 40.9%
Collection $4.16 $4.07 $4.22 $4.18 2.1% -1.6% -0.6%
Print materials $2.45 $2.46 $2.84 $3.04 -0.5% -13.7% -19.4%
Electronic materials $0.89 $0.79 $0.52 $0.39 13.5% 70.2% 131.3%
Other $0.82 $0.82 $0.86 $0.76 -0.8% -5.3% 7.6%
Other $8.04 $7.72 $7.73 $6.60 4.2% 4.0% 21.8%NOTE: Calculations are based on unrounded estimates. Percentage change is not always identical to the calculation obtained by using the rounded values shown in published tables, including tables presented in this report.
SOURCE: Institute of Museum and Library Services, Public Libraries Survey, Fiscal Years 2005, 2010, 2013 and 2014.
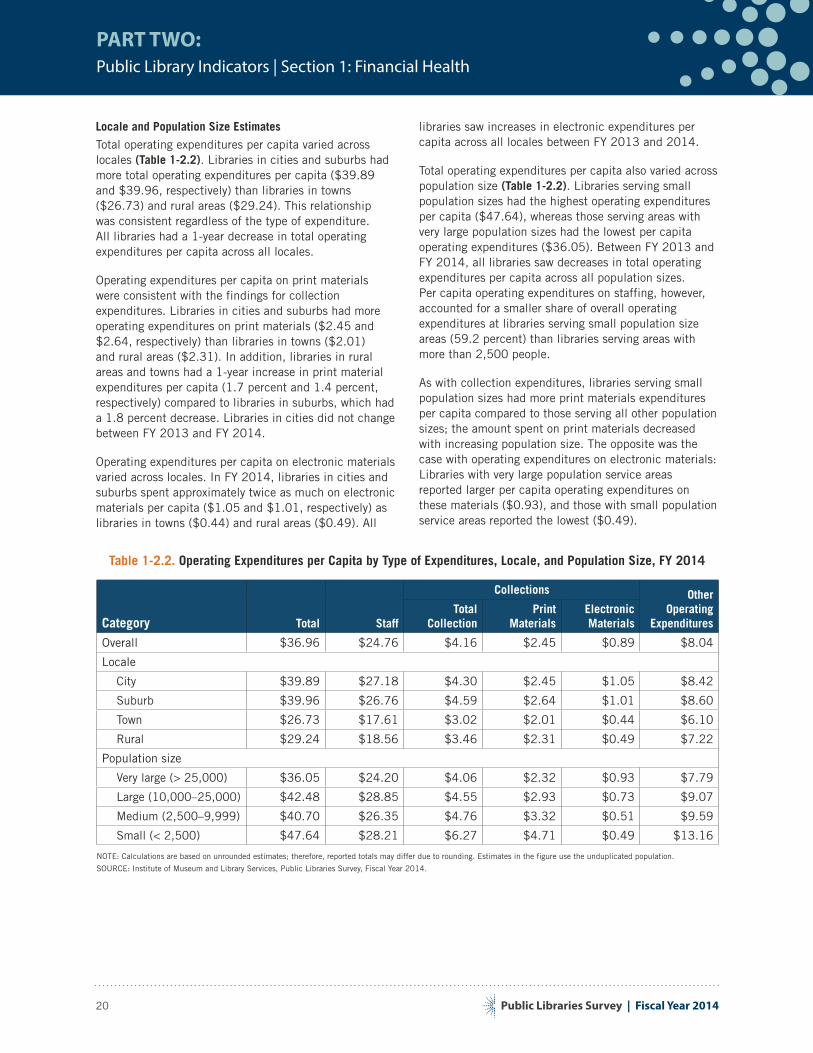
Public Libraries Survey | Fiscal Year 2014
PART TWO:Public Library Indicators | Section 1: Financial Health
20
Locale and Population Size Estimates
Total operating expenditures per capita varied across locales (Table 1-2.2). Libraries in cities and suburbs had more total operating expenditures per capita ($39.89 and $39.96, respectively) than libraries in towns ($26.73) and rural areas ($29.24). This relationship was consistent regardless of the type of expenditure. All libraries had a 1-year decrease in total operating expenditures per capita across all locales.
Operating expenditures per capita on print materials were consistent with the findings for collection expenditures. Libraries in cities and suburbs had more operating expenditures on print materials ($2.45 and $2.64, respectively) than libraries in towns ($2.01) and rural areas ($2.31). In addition, libraries in rural areas and towns had a 1-year increase in print material expenditures per capita (1.7 percent and 1.4 percent, respectively) compared to libraries in suburbs, which had a 1.8 percent decrease. Libraries in cities did not change between FY 2013 and FY 2014.
Operating expenditures per capita on electronic materials varied across locales. In FY 2014, libraries in cities and suburbs spent approximately twice as much on electronic materials per capita ($1.05 and $1.01, respectively) as libraries in towns ($0.44) and rural areas ($0.49). All
libraries saw increases in electronic expenditures per capita across all locales between FY 2013 and 2014.
Total operating expenditures per capita also varied across population size (Table 1-2.2). Libraries serving small population sizes had the highest operating expenditures per capita ($47.64), whereas those serving areas with very large population sizes had the lowest per capita operating expenditures ($36.05). Between FY 2013 and FY 2014, all libraries saw decreases in total operating expenditures per capita across all population sizes. Per capita operating expenditures on staffing, however, accounted for a smaller share of overall operating expenditures at libraries serving small population size areas (59.2 percent) than libraries serving areas with more than 2,500 people.
As with collection expenditures, libraries serving small population sizes had more print materials expenditures per capita compared to those serving all other population sizes; the amount spent on print materials decreased with increasing population size. The opposite was the case with operating expenditures on electronic materials: Libraries with very large population service areas reported larger per capita operating expenditures on these materials ($0.93), and those with small population service areas reported the lowest ($0.49).
Table 1-2.2. Operating Expenditures per Capita by Type of Expenditures, Locale, and Population Size, FY 2014
Category Total Staff
Collections Other Operating
ExpendituresTotal
CollectionPrint
MaterialsElectronic Materials
Overall $36.96 $24.76 $4.16 $2.45 $0.89 $8.04
Locale
City $39.89 $27.18 $4.30 $2.45 $1.05 $8.42
Suburb $39.96 $26.76 $4.59 $2.64 $1.01 $8.60
Town $26.73 $17.61 $3.02 $2.01 $0.44 $6.10
Rural $29.24 $18.56 $3.46 $2.31 $0.49 $7.22
Population size
Very large (> 25,000) $36.05 $24.20 $4.06 $2.32 $0.93 $7.79
Large (10,000–25,000) $42.48 $28.85 $4.55 $2.93 $0.73 $9.07
Medium (2,500–9,999) $40.70 $26.35 $4.76 $3.32 $0.51 $9.59
Small (< 2,500) $47.64 $28.21 $6.27 $4.71 $0.49 $13.16
NOTE: Calculations are based on unrounded estimates; therefore, reported totals may differ due to rounding. Estimates in the figure use the unduplicated population.
SOURCE: Institute of Museum and Library Services, Public Libraries Survey, Fiscal Year 2014.
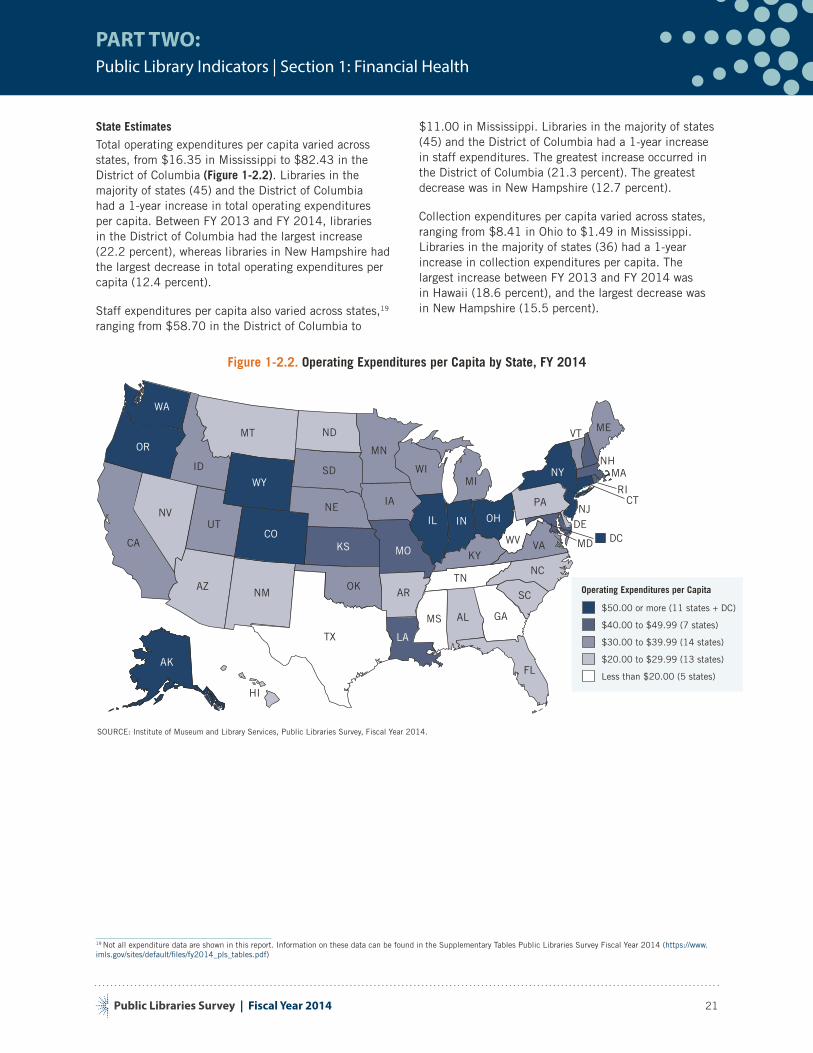
Public Libraries Survey | Fiscal Year 2014
PART TWO:Public Library Indicators | Section 1: Financial Health
21
State Estimates
Total operating expenditures per capita varied across states, from $16.35 in Mississippi to $82.43 in the District of Columbia (Figure 1-2.2). Libraries in the majority of states (45) and the District of Columbia had a 1-year increase in total operating expenditures per capita. Between FY 2013 and FY 2014, libraries in the District of Columbia had the largest increase (22.2 percent), whereas libraries in New Hampshire had the largest decrease in total operating expenditures per capita (12.4 percent).
Staff expenditures per capita also varied across states,19
19 Not all expenditure data are shown in this report. Information on these data can be found in the Supplementary Tables Public Libraries Survey Fiscal Year 2014 (https://www.imls.gov/sites/default/files/fy2014_pls_tables.pdf)
ranging from $58.70 in the District of Columbia to
$11.00 in Mississippi. Libraries in the majority of states (45) and the District of Columbia had a 1-year increase in staff expenditures. The greatest increase occurred in the District of Columbia (21.3 percent). The greatest decrease was in New Hampshire (12.7 percent).
Collection expenditures per capita varied across states, ranging from $8.41 in Ohio to $1.49 in Mississippi. Libraries in the majority of states (36) had a 1-year increase in collection expenditures per capita. The largest increase between FY 2013 and FY 2014 was in Hawaii (18.6 percent), and the largest decrease was in New Hampshire (15.5 percent).
Figure 1-2.2. Operating Expenditures per Capita by State, FY 2014
Operating Expenditures per Capita
$50.00 or more (11 states + DC)
Less than $20.00 (5 states)
$30.00 to $39.99 (14 states)
$20.00 to $29.99 (13 states)
$40.00 to $49.99 (7 states)
DC DE UT
RI
WA
MT NDOR
ID
WYSD
CA
NV
COKS
NE
AZNM
OK
AK
MN
IA
MO
ARTN
NC
LA
FL
MS AL GA
WI
IL
KY
IN OH
WV
PA
NY
VA
MEVT
NH MA
CT
SC
MI
HI
NJ
TX
MD
SOURCE: Institute of Museum and Library Services, Public Libraries Survey, Fiscal Year 2014.
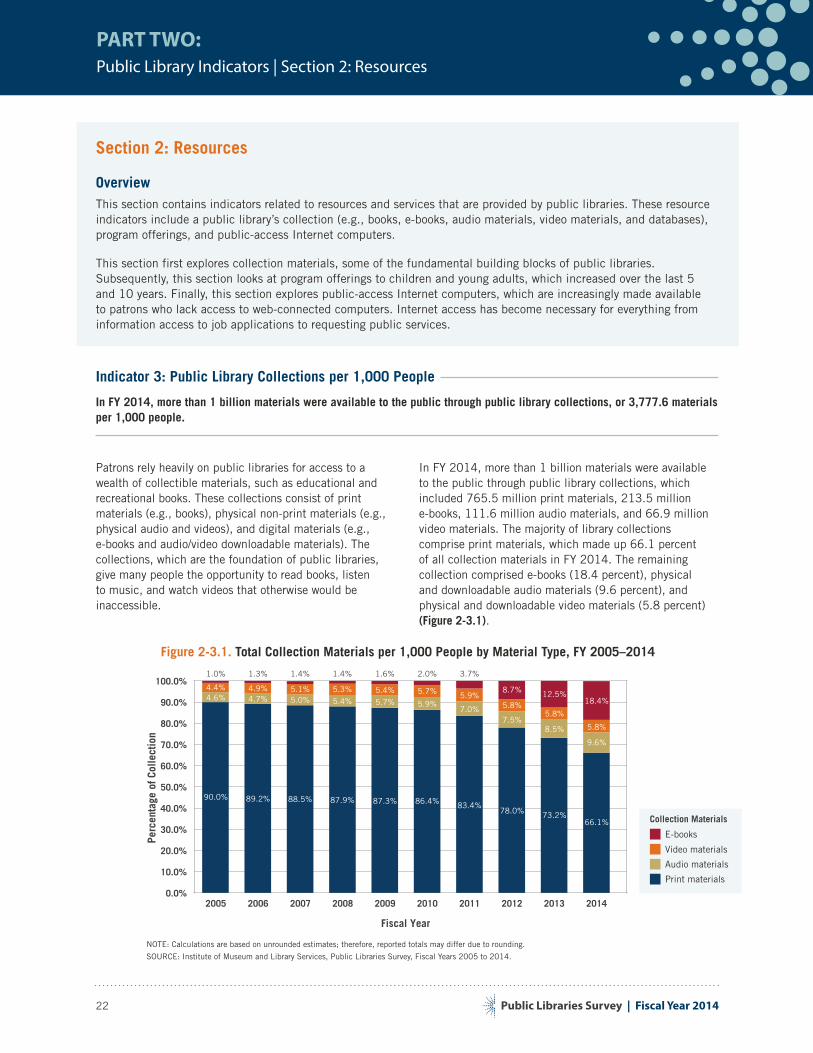
Public Libraries Survey | Fiscal Year 2014
PART TWO:Public Library Indicators | Section 2: Resources
22
Section 2: Resources
OverviewThis section contains indicators related to resources and services that are provided by public libraries. These resource indicators include a public library’s collection (e.g., books, e-books, audio materials, video materials, and databases), program offerings, and public-access Internet computers.
This section first explores collection materials, some of the fundamental building blocks of public libraries. Subsequently, this section looks at program offerings to children and young adults, which increased over the last 5 and 10 years. Finally, this section explores public-access Internet computers, which are increasingly made available to patrons who lack access to web-connected computers. Internet access has become necessary for everything from information access to job applications to requesting public services.
Indicator 3: Public Library Collections per 1,000 People
In FY 2014, more than 1 billion materials were available to the public through public library collections, or 3,777.6 materials per 1,000 people.
Patrons rely heavily on public libraries for access to a wealth of collectible materials, such as educational and recreational books. These collections consist of print materials (e.g., books), physical non-print materials (e.g., physical audio and videos), and digital materials (e.g., e-books and audio/video downloadable materials). The collections, which are the foundation of public libraries, give many people the opportunity to read books, listen to music, and watch videos that otherwise would be inaccessible.
In FY 2014, more than 1 billion materials were available to the public through public library collections, which included 765.5 million print materials, 213.5 million e-books, 111.6 million audio materials, and 66.9 million video materials. The majority of library collections comprise print materials, which made up 66.1 percent of all collection materials in FY 2014. The remaining collection comprised e-books (18.4 percent), physical and downloadable audio materials (9.6 percent), and physical and downloadable video materials (5.8 percent)(Figure 2-3.1).
Figure 2-3.1. Total Collection Materials per 1,000 People by Material Type, FY 2005–2014
Perc
enta
ge o
f Col
lect
ion
Print materials
Audio materials
Video materials
E-books
Fiscal Year
2005 2006 2007 2008 2009 2010 2011 2012 2013 20140.0%
10.0%
20.0%
30.0%
40.0%
50.0%
60.0%
70.0%
80.0%
90.0%
100.0%
90.0% 89.2% 88.5% 87.9% 87.3% 86.4% 83.4%78.0% 73.2%
66.1%
4.4% 4.9% 5.1% 5.3% 5.4% 5.7% 5.9%5.8%
5.8%
5.8%
1.0% 1.3% 1.4% 1.4% 1.6% 2.0% 3.7%
8.7% 12.5%18.4%4.6% 4.7% 5.0% 5.4% 5.7% 5.9%
7.0%7.5%
8.5%
9.6%
Collection Materials
NOTE: Calculations are based on unrounded estimates; therefore, reported totals may differ due to rounding.
SOURCE: Institute of Museum and Library Services, Public Libraries Survey, Fiscal Years 2005 to 2014.
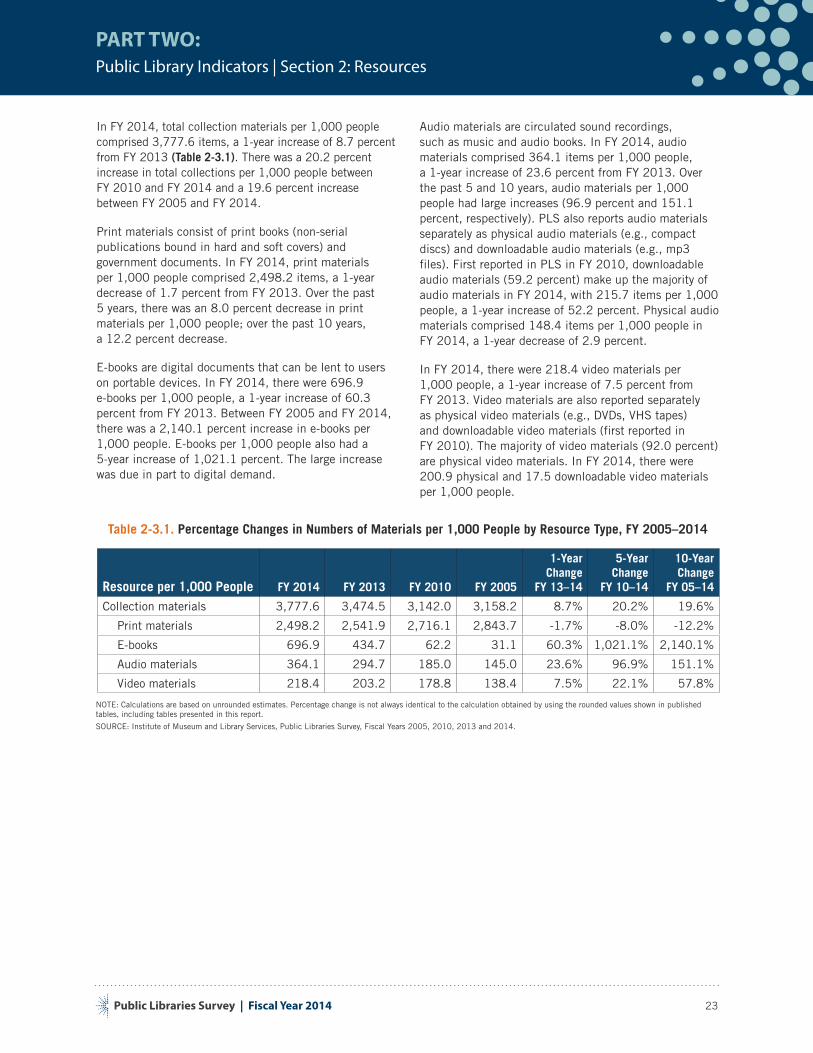
Public Libraries Survey | Fiscal Year 2014
PART TWO:Public Library Indicators | Section 2: Resources
23
In FY 2014, total collection materials per 1,000 people comprised 3,777.6 items, a 1-year increase of 8.7 percent from FY 2013 (Table 2-3.1). There was a 20.2 percent increase in total collections per 1,000 people between FY 2010 and FY 2014 and a 19.6 percent increase between FY 2005 and FY 2014.
Print materials consist of print books (non-serial publications bound in hard and soft covers) and government documents. In FY 2014, print materials per 1,000 people comprised 2,498.2 items, a 1-year decrease of 1.7 percent from FY 2013. Over the past 5 years, there was an 8.0 percent decrease in print materials per 1,000 people; over the past 10 years, a 12.2 percent decrease.
E-books are digital documents that can be lent to users on portable devices. In FY 2014, there were 696.9 e-books per 1,000 people, a 1-year increase of 60.3 percent from FY 2013. Between FY 2005 and FY 2014, there was a 2,140.1 percent increase in e-books per 1,000 people. E-books per 1,000 people also had a 5-year increase of 1,021.1 percent. The large increase was due in part to digital demand.
Audio materials are circulated sound recordings, such as music and audio books. In FY 2014, audio materials comprised 364.1 items per 1,000 people, a 1-year increase of 23.6 percent from FY 2013. Over the past 5 and 10 years, audio materials per 1,000 people had large increases (96.9 percent and 151.1 percent, respectively). PLS also reports audio materials separately as physical audio materials (e.g., compact discs) and downloadable audio materials (e.g., mp3 files). First reported in PLS in FY 2010, downloadable audio materials (59.2 percent) make up the majority of audio materials in FY 2014, with 215.7 items per 1,000 people, a 1-year increase of 52.2 percent. Physical audio materials comprised 148.4 items per 1,000 people in FY 2014, a 1-year decrease of 2.9 percent.
In FY 2014, there were 218.4 video materials per 1,000 people, a 1-year increase of 7.5 percent from FY 2013. Video materials are also reported separately as physical video materials (e.g., DVDs, VHS tapes) and downloadable video materials (first reported in FY 2010). The majority of video materials (92.0 percent) are physical video materials. In FY 2014, there were 200.9 physical and 17.5 downloadable video materials per 1,000 people.
Table 2-3.1. Percentage Changes in Numbers of Materials per 1,000 People by Resource Type, FY 2005–2014
Resource per 1,000 People FY 2014 FY 2013 FY 2010 FY 2005
1-Year Change
FY 13–14
5-Year Change
FY 10–14
10-Year Change
FY 05–14
Collection materials 3,777.6 3,474.5 3,142.0 3,158.2 8.7% 20.2% 19.6%
Print materials 2,498.2 2,541.9 2,716.1 2,843.7 -1.7% -8.0% -12.2%
E-books 696.9 434.7 62.2 31.1 60.3% 1,021.1% 2,140.1%
Audio materials 364.1 294.7 185.0 145.0 23.6% 96.9% 151.1%
Video materials 218.4 203.2 178.8 138.4 7.5% 22.1% 57.8%
NOTE: Calculations are based on unrounded estimates. Percentage change is not always identical to the calculation obtained by using the rounded values shown in published tables, including tables presented in this report.
SOURCE: Institute of Museum and Library Services, Public Libraries Survey, Fiscal Years 2005, 2010, 2013 and 2014.
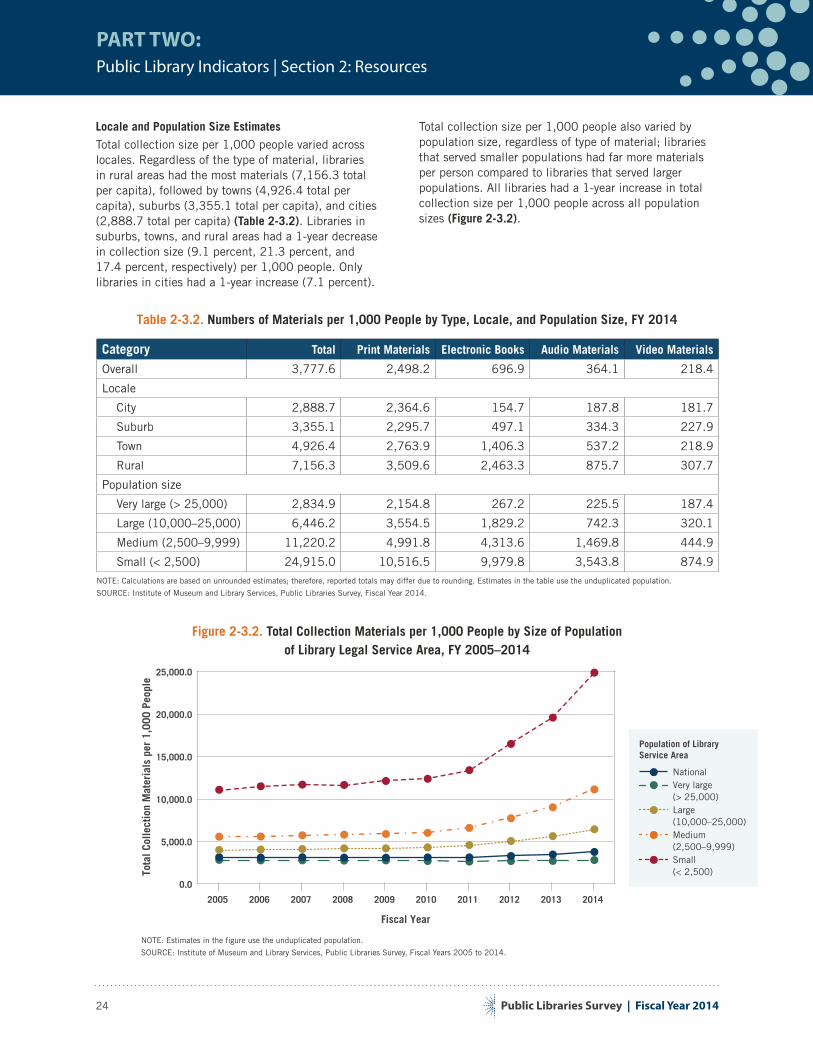
Public Libraries Survey | Fiscal Year 2014
PART TWO:Public Library Indicators | Section 2: Resources
24
Locale and Population Size Estimates
Total collection size per 1,000 people varied across locales. Regardless of the type of material, libraries in rural areas had the most materials (7,156.3 total per capita), followed by towns (4,926.4 total per capita), suburbs (3,355.1 total per capita), and cities (2,888.7 total per capita) (Table 2-3.2). Libraries in suburbs, towns, and rural areas had a 1-year decrease in collection size (9.1 percent, 21.3 percent, and 17.4 percent, respectively) per 1,000 people. Only libraries in cities had a 1-year increase (7.1 percent).
Total collection size per 1,000 people also varied by population size, regardless of type of material; libraries that served smaller populations had far more materials per person compared to libraries that served larger populations. All libraries had a 1-year increase in total collection size per 1,000 people across all population sizes (Figure 2-3.2).
Table 2-3.2. Numbers of Materials per 1,000 People by Type, Locale, and Population Size, FY 2014
Category Total Print Materials Electronic Books Audio Materials Video Materials
Overall 3,777.6 2,498.2 696.9 364.1 218.4
Locale
City 2,888.7 2,364.6 154.7 187.8 181.7
Suburb 3,355.1 2,295.7 497.1 334.3 227.9
Town 4,926.4 2,763.9 1,406.3 537.2 218.9
Rural 7,156.3 3,509.6 2,463.3 875.7 307.7
Population size
Very large (> 25,000) 2,834.9 2,154.8 267.2 225.5 187.4
Large (10,000–25,000) 6,446.2 3,554.5 1,829.2 742.3 320.1
Medium (2,500–9,999) 11,220.2 4,991.8 4,313.6 1,469.8 444.9
Small (< 2,500) 24,915.0 10,516.5 9,979.8 3,543.8 874.9NOTE: Calculations are based on unrounded estimates; therefore, reported totals may differ due to rounding. Estimates in the table use the unduplicated population.
SOURCE: Institute of Museum and Library Services, Public Libraries Survey, Fiscal Year 2014.
Figure 2-3.2. Total Collection Materials per 1,000 People by Size of Population of Library Legal Service Area, FY 2005–2014
2005 2006 2007 2008 2009 2010 2011 2012 2013 2014
Fiscal Year
Population of Library Service Area
Small(< 2,500)
Medium(2,500–9,999)
Large(10,000–25,000)
Very large(> 25,000)
National
Tota
l Col
lect
ion
Mat
eria
ls p
er 1
,000
Peo
ple
0.0
5,000.0
10,000.0
15,000.0
20,000.0
25,000.0
NOTE: Estimates in the figure use the unduplicated population.
SOURCE: Institute of Museum and Library Services, Public Libraries Survey, Fiscal Years 2005 to 2014.
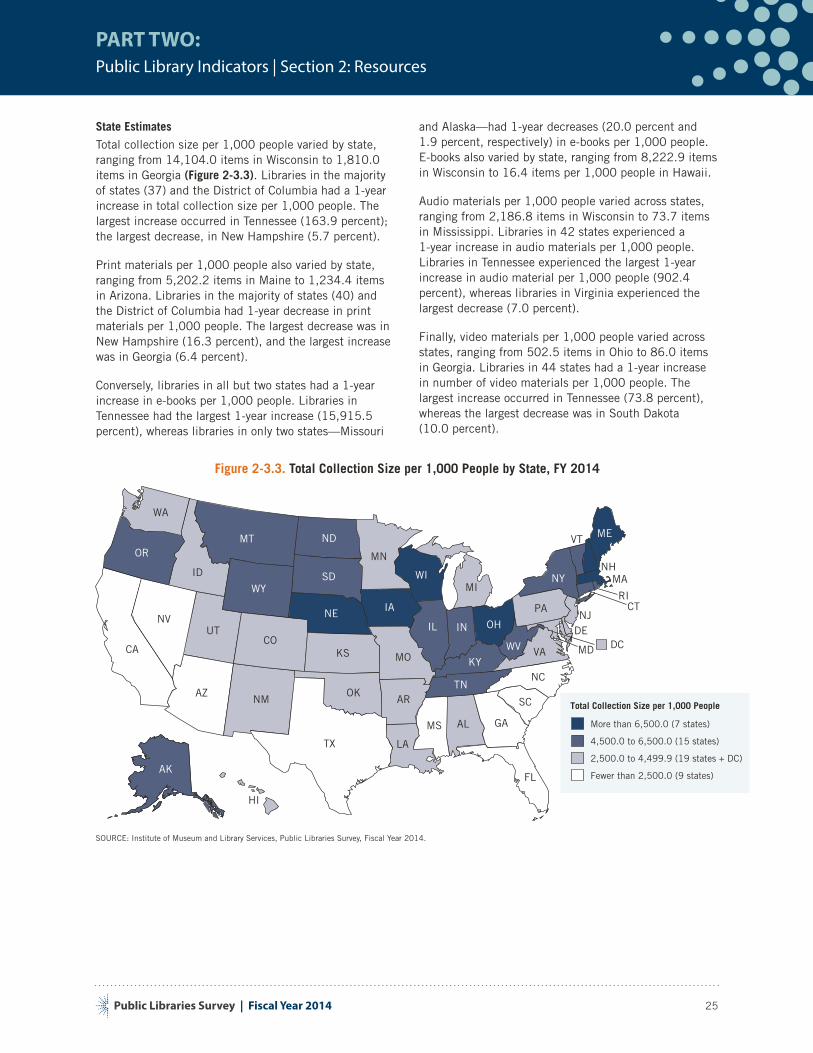
Public Libraries Survey | Fiscal Year 2014
PART TWO:Public Library Indicators | Section 2: Resources
25
State Estimates
Total collection size per 1,000 people varied by state, ranging from 14,104.0 items in Wisconsin to 1,810.0 items in Georgia (Figure 2-3.3). Libraries in the majority of states (37) and the District of Columbia had a 1-year increase in total collection size per 1,000 people. The largest increase occurred in Tennessee (163.9 percent); the largest decrease, in New Hampshire (5.7 percent).
Print materials per 1,000 people also varied by state, ranging from 5,202.2 items in Maine to 1,234.4 items in Arizona. Libraries in the majority of states (40) and the District of Columbia had 1-year decrease in print materials per 1,000 people. The largest decrease was in New Hampshire (16.3 percent), and the largest increase was in Georgia (6.4 percent).
Conversely, libraries in all but two states had a 1-year increase in e-books per 1,000 people. Libraries in Tennessee had the largest 1-year increase (15,915.5 percent), whereas libraries in only two states—Missouri
and Alaska—had 1-year decreases (20.0 percent and 1.9 percent, respectively) in e-books per 1,000 people. E-books also varied by state, ranging from 8,222.9 items in Wisconsin to 16.4 items per 1,000 people in Hawaii.
Audio materials per 1,000 people varied across states, ranging from 2,186.8 items in Wisconsin to 73.7 items in Mississippi. Libraries in 42 states experienced a 1-year increase in audio materials per 1,000 people. Libraries in Tennessee experienced the largest 1-year increase in audio material per 1,000 people (902.4 percent), whereas libraries in Virginia experienced the largest decrease (7.0 percent).
Finally, video materials per 1,000 people varied across states, ranging from 502.5 items in Ohio to 86.0 items in Georgia. Libraries in 44 states had a 1-year increase in number of video materials per 1,000 people. The largest increase occurred in Tennessee (73.8 percent), whereas the largest decrease was in South Dakota (10.0 percent).
Figure 2-3.3. Total Collection Size per 1,000 People by State, FY 2014
Total Collection Size per 1,000 People
More than 6,500.0 (7 states)
2,500.0 to 4,499.9 (19 states + DC)
Fewer than 2,500.0 (9 states)
4,500.0 to 6,500.0 (15 states)
DC DE UT
RI
WA
MT NDOR
ID
WYSD
CA
NV
COKS
NE
AZNM
OK
AK
MN
IA
MO
ARTN
NC
LA
FL
MS AL GA
WI
IL
KY
IN OH
WV
PA
NY
VA
MEVT
NH MA
CT
SC
MI
HI
NJ
TX
MD
SOURCE: Institute of Museum and Library Services, Public Libraries Survey, Fiscal Year 2014.
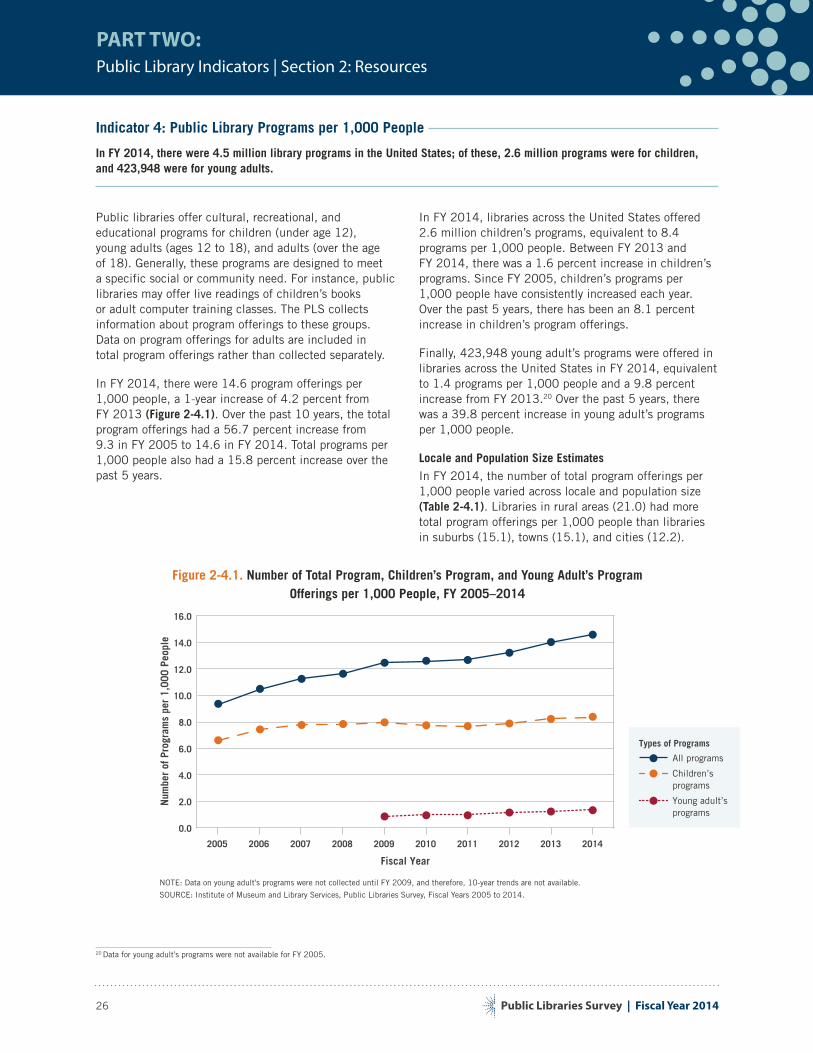
Public Libraries Survey | Fiscal Year 2014
PART TWO:Public Library Indicators | Section 2: Resources
26
Indicator 4: Public Library Programs per 1,000 People
In FY 2014, there were 4.5 million library programs in the United States; of these, 2.6 million programs were for children, and 423,948 were for young adults.
Public libraries offer cultural, recreational, and educational programs for children (under age 12), young adults (ages 12 to 18), and adults (over the age of 18). Generally, these programs are designed to meet a specific social or community need. For instance, public libraries may offer live readings of children’s books or adult computer training classes. The PLS collects information about program offerings to these groups. Data on program offerings for adults are included in total program offerings rather than collected separately.
In FY 2014, there were 14.6 program offerings per 1,000 people, a 1-year increase of 4.2 percent from FY 2013 (Figure 2-4.1). Over the past 10 years, the total program offerings had a 56.7 percent increase from 9.3 in FY 2005 to 14.6 in FY 2014. Total programs per 1,000 people also had a 15.8 percent increase over the past 5 years.
In FY 2014, libraries across the United States offered 2.6 million children’s programs, equivalent to 8.4 programs per 1,000 people. Between FY 2013 and FY 2014, there was a 1.6 percent increase in children’s programs. Since FY 2005, children’s programs per 1,000 people have consistently increased each year. Over the past 5 years, there has been an 8.1 percent increase in children’s program offerings.
Finally, 423,948 young adult’s programs were offered in libraries across the United States in FY 2014, equivalent to 1.4 programs per 1,000 people and a 9.8 percent increase from FY 2013.20
20 Data for young adult’s programs were not available for FY 2005.
Over the past 5 years, there was a 39.8 percent increase in young adult’s programs per 1,000 people.
Locale and Population Size Estimates
In FY 2014, the number of total program offerings per 1,000 people varied across locale and population size (Table 2-4.1). Libraries in rural areas (21.0) had more total program offerings per 1,000 people than libraries in suburbs (15.1), towns (15.1), and cities (12.2).
Figure 2-4.1. Number of Total Program, Children’s Program, and Young Adult’s ProgramOfferings per 1,000 People, FY 2005–2014
0.0
2.0
4.0
6.0
8.0
10.0
12.0
14.0
16.0
Num
ber
of P
rogr
ams
per
1,00
0 Pe
ople
2005 2006 2007 2008 2009 2010 2011 2012 2013 2014
Fiscal Year
Types of Programs
Young adult’sprograms
Children’sprograms
All programs
NOTE: Data on young adult’s programs were not collected until FY 2009, and therefore, 10-year trends are not available.
SOURCE: Institute of Museum and Library Services, Public Libraries Survey, Fiscal Years 2005 to 2014.
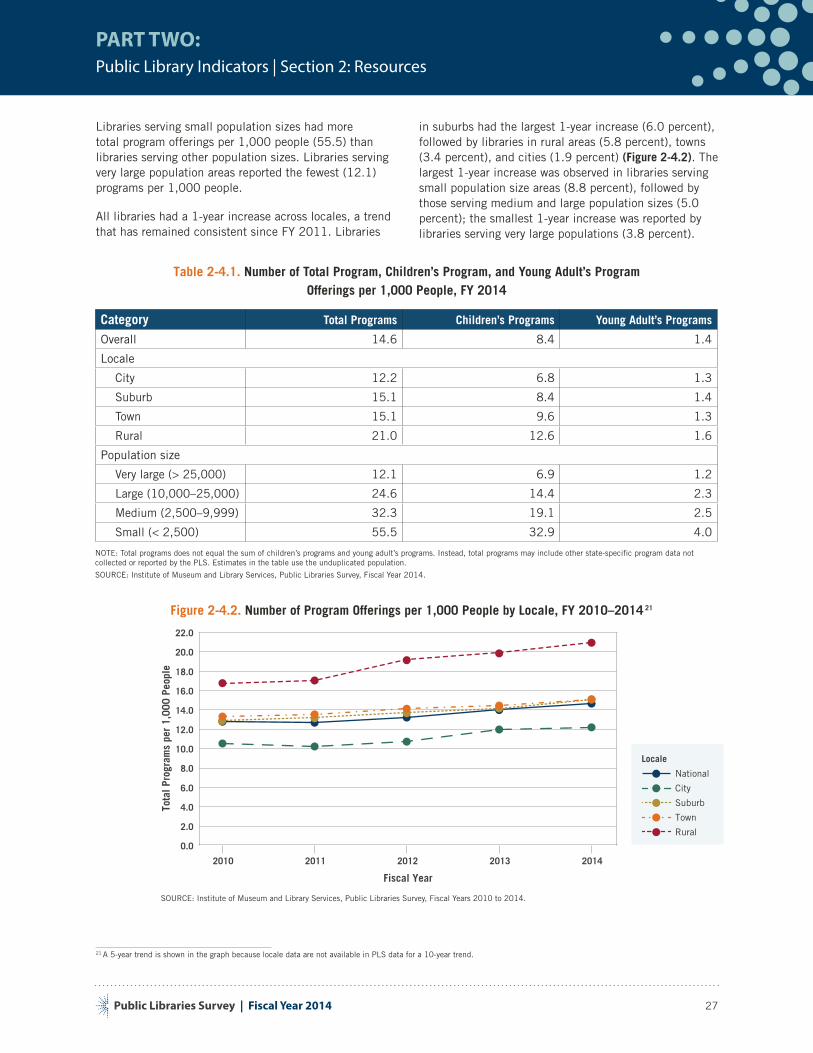
Public Libraries Survey | Fiscal Year 2014
PART TWO:Public Library Indicators | Section 2: Resources
27
Libraries serving small population sizes had more total program offerings per 1,000 people (55.5) than libraries serving other population sizes. Libraries serving very large population areas reported the fewest (12.1) programs per 1,000 people.
All libraries had a 1-year increase across locales, a trend that has remained consistent since FY 2011. Libraries
in suburbs had the largest 1-year increase (6.0 percent), followed by libraries in rural areas (5.8 percent), towns (3.4 percent), and cities (1.9 percent) (Figure 2-4.2). The largest 1-year increase was observed in libraries serving small population size areas (8.8 percent), followed by those serving medium and large population sizes (5.0 percent); the smallest 1-year increase was reported by libraries serving very large populations (3.8 percent).
Table 2-4.1. Number of Total Program, Children’s Program, and Young Adult’s Program Offerings per 1,000 People, FY 2014
Category Total Programs Children’s Programs Young Adult’s Programs
Overall 14.6 8.4 1.4
Locale
City 12.2 6.8 1.3
Suburb 15.1 8.4 1.4
Town 15.1 9.6 1.3
Rural 21.0 12.6 1.6
Population size
Very large (> 25,000) 12.1 6.9 1.2
Large (10,000–25,000) 24.6 14.4 2.3
Medium (2,500–9,999) 32.3 19.1 2.5
Small (< 2,500) 55.5 32.9 4.0
NOTE: Total programs does not equal the sum of children’s programs and young adult’s programs. Instead, total programs may include other state-specific program data not collected or reported by the PLS. Estimates in the table use the unduplicated population.
SOURCE: Institute of Museum and Library Services, Public Libraries Survey, Fiscal Year 2014.
Figure 2-4.2. Number of Program Offerings per 1,000 People by Locale, FY 2010–2014 21
21 A 5-year trend is shown in the graph because locale data are not available in PLS data for a 10-year trend.
Locale
Rural
Town
Suburb
City
National
Tota
l Pro
gram
s pe
r 1,
000
Peop
le
Fiscal Year
2010 2011 2012 2013 2014
0.0
2.0
4.0
6.0
8.0
10.0
12.0
14.0
16.0
18.0
20.0
22.0
SOURCE: Institute of Museum and Library Services, Public Libraries Survey, Fiscal Years 2010 to 2014.
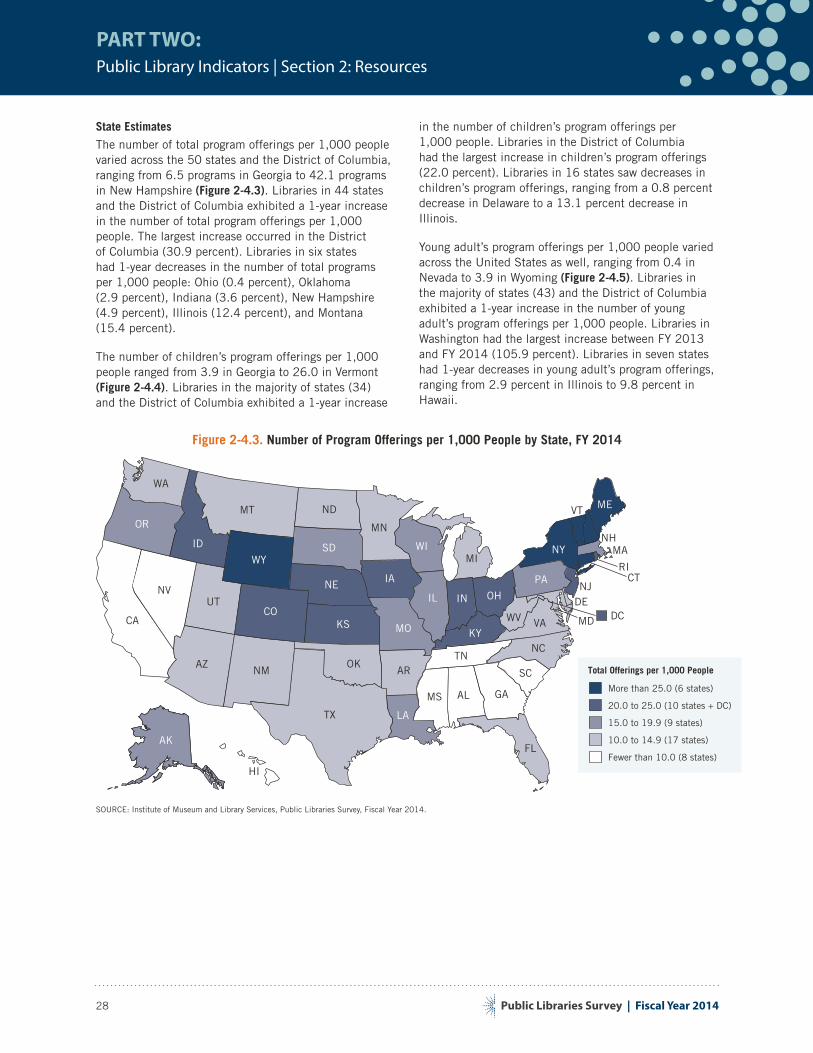
Public Libraries Survey | Fiscal Year 2014
PART TWO:Public Library Indicators | Section 2: Resources
28
State Estimates
The number of total program offerings per 1,000 people varied across the 50 states and the District of Columbia, ranging from 6.5 programs in Georgia to 42.1 programs in New Hampshire (Figure 2-4.3). Libraries in 44 states and the District of Columbia exhibited a 1-year increase in the number of total program offerings per 1,000 people. The largest increase occurred in the District of Columbia (30.9 percent). Libraries in six states had 1-year decreases in the number of total programs per 1,000 people: Ohio (0.4 percent), Oklahoma (2.9 percent), Indiana (3.6 percent), New Hampshire (4.9 percent), Illinois (12.4 percent), and Montana (15.4 percent).
The number of children’s program offerings per 1,000 people ranged from 3.9 in Georgia to 26.0 in Vermont (Figure 2-4.4). Libraries in the majority of states (34) and the District of Columbia exhibited a 1-year increase
in the number of children’s program offerings per 1,000 people. Libraries in the District of Columbia had the largest increase in children’s program offerings (22.0 percent). Libraries in 16 states saw decreases in children’s program offerings, ranging from a 0.8 percent decrease in Delaware to a 13.1 percent decrease in Illinois.
Young adult’s program offerings per 1,000 people varied across the United States as well, ranging from 0.4 in Nevada to 3.9 in Wyoming (Figure 2-4.5). Libraries in the majority of states (43) and the District of Columbia exhibited a 1-year increase in the number of young adult’s program offerings per 1,000 people. Libraries in Washington had the largest increase between FY 2013 and FY 2014 (105.9 percent). Libraries in seven states had 1-year decreases in young adult’s program offerings, ranging from 2.9 percent in Illinois to 9.8 percent in Hawaii.
Figure 2-4.3. Number of Program Offerings per 1,000 People by State, FY 2014
Total Offerings per 1,000 People
More than 25.0 (6 states)
Fewer than 10.0 (8 states)
20.0 to 25.0 (10 states + DC)
10.0 to 14.9 (17 states)
15.0 to 19.9 (9 states)
DC DE UT
RI
WA
MT NDOR
ID
WYSD
CA
NV
COKS
NE
AZNM
OK
AK
MN
IA
MO
ARTN
NC
LA
FL
MS AL GA
WI
IL
KY
IN OH
WV
PA
NY
VA
MEVT
NH MA
CT
SC
MI
HI
NJ
TX
MD
SOURCE: Institute of Museum and Library Services, Public Libraries Survey, Fiscal Year 2014.
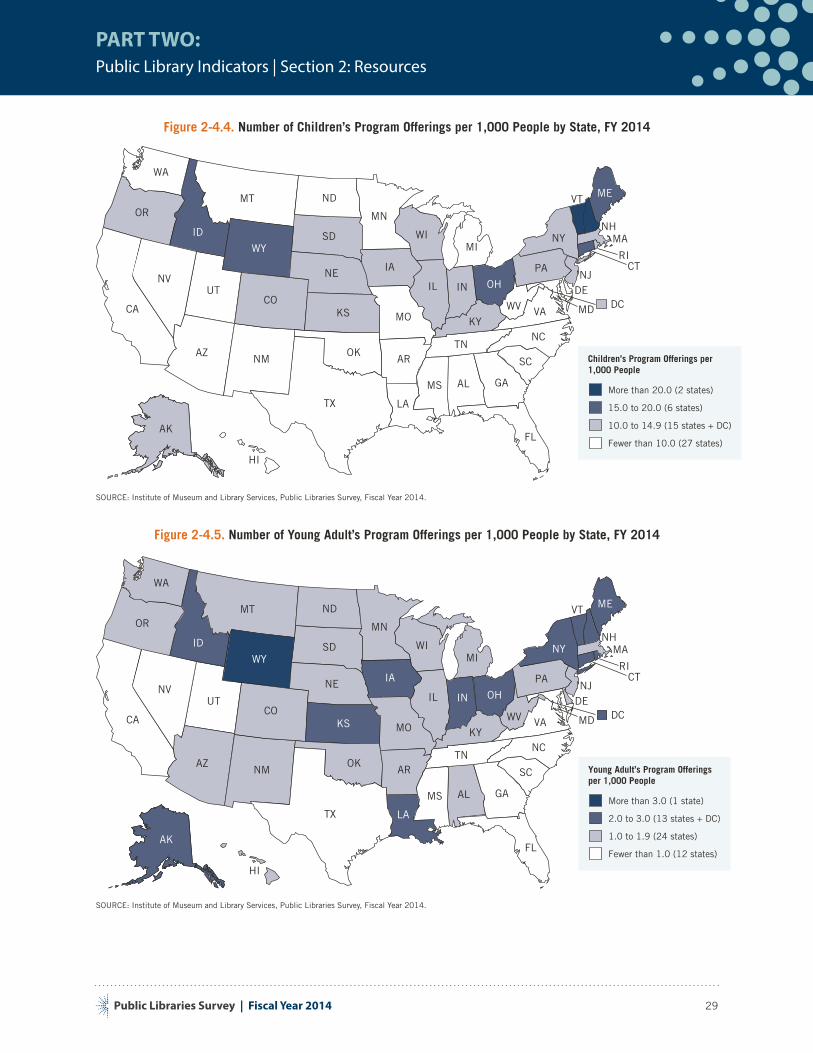
Public Libraries Survey | Fiscal Year 2014
PART TWO:Public Library Indicators | Section 2: Resources
29
Figure 2-4.4. Number of Children’s Program Offerings per 1,000 People by State, FY 2014
Children’s Program Offerings per 1,000 People
More than 20.0 (2 states)
Fewer than 10.0 (27 states)
15.0 to 20.0 (6 states)
10.0 to 14.9 (15 states + DC)
DC DE UT
RI
WA
MT NDOR
ID
WYSD
CA
NV
COKS
NE
AZNM
OK
AK
MN
IA
MO
ARTN
NC
LA
FL
MS AL GA
WI
IL
KY
IN OH
WV
PA
NY
VA
MEVT
NH MA
CT
SC
MI
HI
NJ
TX
MD
SOURCE: Institute of Museum and Library Services, Public Libraries Survey, Fiscal Year 2014.
Figure 2-4.5. Number of Young Adult’s Program Offerings per 1,000 People by State, FY 2014
Young Adult’s Program Offerings per 1,000 People
More than 3.0 (1 state)
Fewer than 1.0 (12 states)
2.0 to 3.0 (13 states + DC)
1.0 to 1.9 (24 states)
DC DE UT
RI
WA
MT NDOR
ID
WYSD
CA
NV
COKS
NE
AZNM
OK
AK
MN
IA
MO
ARTN
NC
LA
FL
MS AL GA
WI
IL
KY
IN OH
WV
PA
NY
VA
MEVT
NH MA
CT
SC
MI
HI
NJ
TX
MD
SOURCE: Institute of Museum and Library Services, Public Libraries Survey, Fiscal Year 2014.
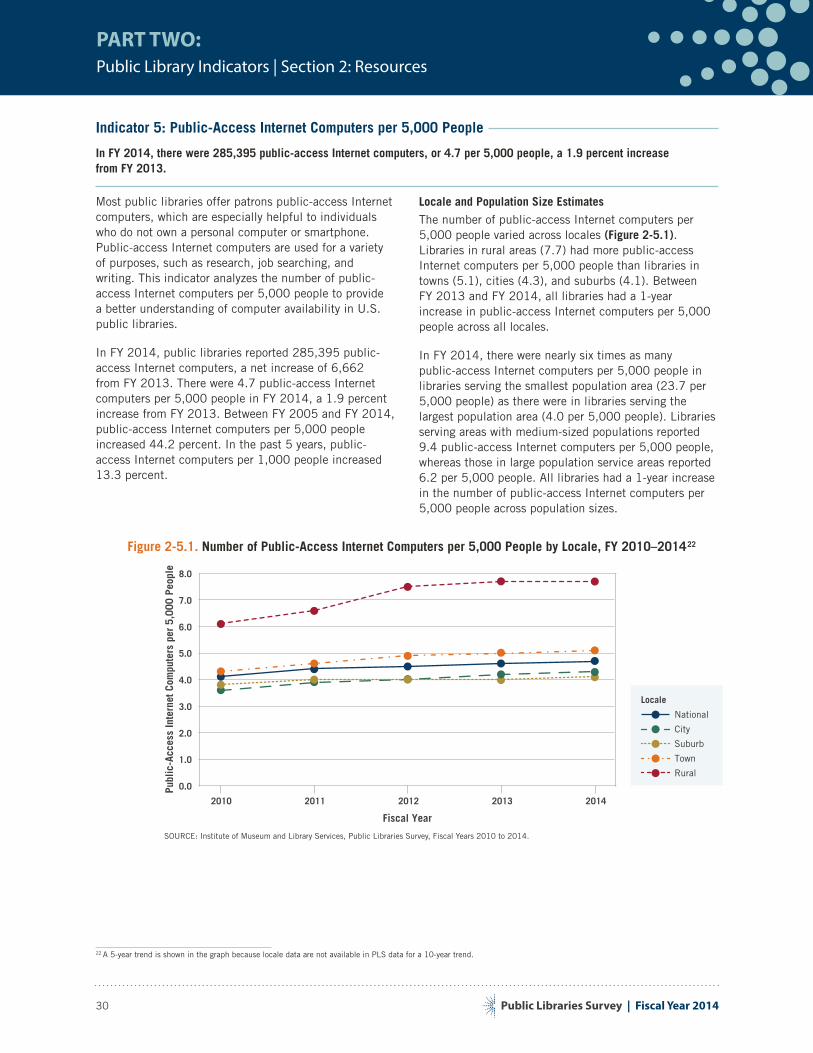
Public Libraries Survey | Fiscal Year 2014
PART TWO:Public Library Indicators | Section 2: Resources
30
Indicator 5: Public-Access Internet Computers per 5,000 People
In FY 2014, there were 285,395 public-access Internet computers, or 4.7 per 5,000 people, a 1.9 percent increase from FY 2013.
Most public libraries offer patrons public-access Internet computers, which are especially helpful to individuals who do not own a personal computer or smartphone. Public-access Internet computers are used for a variety of purposes, such as research, job searching, and writing. This indicator analyzes the number of public-access Internet computers per 5,000 people to provide a better understanding of computer availability in U.S. public libraries.
In FY 2014, public libraries reported 285,395 public-access Internet computers, a net increase of 6,662 from FY 2013. There were 4.7 public-access Internet computers per 5,000 people in FY 2014, a 1.9 percent increase from FY 2013. Between FY 2005 and FY 2014, public-access Internet computers per 5,000 people increased 44.2 percent. In the past 5 years, public-access Internet computers per 1,000 people increased 13.3 percent.
Locale and Population Size Estimates
The number of public-access Internet computers per 5,000 people varied across locales (Figure 2-5.1). Libraries in rural areas (7.7) had more public-access Internet computers per 5,000 people than libraries in towns (5.1), cities (4.3), and suburbs (4.1). Between FY 2013 and FY 2014, all libraries had a 1-year increase in public-access Internet computers per 5,000 people across all locales.
In FY 2014, there were nearly six times as many public-access Internet computers per 5,000 people in libraries serving the smallest population area (23.7 per 5,000 people) as there were in libraries serving the largest population area (4.0 per 5,000 people). Libraries serving areas with medium-sized populations reported 9.4 public-access Internet computers per 5,000 people, whereas those in large population service areas reported 6.2 per 5,000 people. All libraries had a 1-year increase in the number of public-access Internet computers per 5,000 people across population sizes.
Figure 2-5.1. Number of Public-Access Internet Computers per 5,000 People by Locale, FY 2010–201422
22 A 5-year trend is shown in the graph because locale data are not available in PLS data for a 10-year trend.
Locale
Rural
Town
Suburb
City
National
Fiscal Year
2010 2011 2012 2013 2014
Publ
ic-A
cces
s In
tern
et C
ompu
ters
per
5,0
00 P
eopl
e
0.0
1.0
2.0
3.0
4.0
5.0
6.0
7.0
8.0
SOURCE: Institute of Museum and Library Services, Public Libraries Survey, Fiscal Years 2010 to 2014.
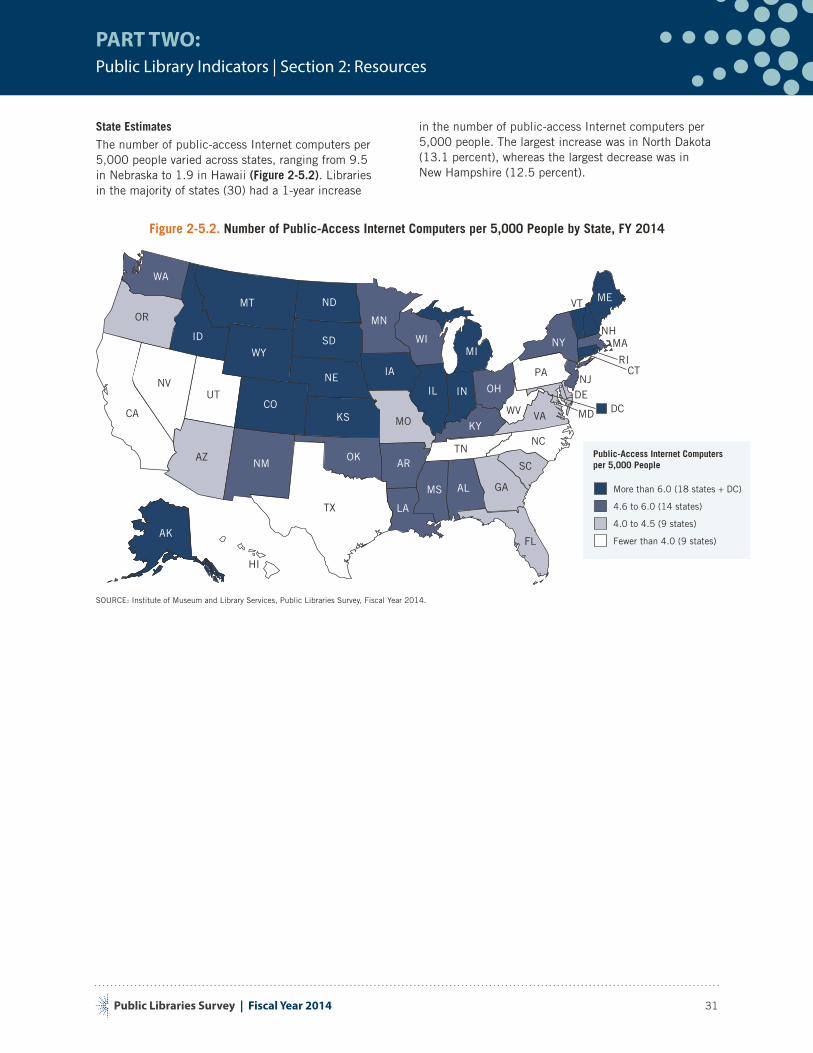
Public Libraries Survey | Fiscal Year 2014
PART TWO:Public Library Indicators | Section 2: Resources
31
State Estimates
The number of public-access Internet computers per 5,000 people varied across states, ranging from 9.5 in Nebraska to 1.9 in Hawaii (Figure 2-5.2). Libraries in the majority of states (30) had a 1-year increase
in the number of public-access Internet computers per 5,000 people. The largest increase was in North Dakota (13.1 percent), whereas the largest decrease was in New Hampshire (12.5 percent).
Figure 2-5.2. Number of Public-Access Internet Computers per 5,000 People by State, FY 2014
Public-Access Internet Computers per 5,000 People
Fewer than 4.0 (9 states)
4.6 to 6.0 (14 states)
4.0 to 4.5 (9 states)
More than 6.0 (18 states + DC)
DC DE UT
RI
WA
MT NDOR
ID
WYSD
CA
NV
COKS
NE
AZNM
OK
AK
MN
IA
MO
ARTN
NC
LA
FL
MS AL GA
WI
IL
KY
IN OH
WV
PA
NY
VA
MEVT
NH MA
CT
SC
MI
HI
NJ
TX
MD
SOURCE: Institute of Museum and Library Services, Public Libraries Survey, Fiscal Year 2014.
Public Libraries Survey | Fiscal Year 2014
PART TWO:Public Library Indicators | Section 3: Use
32
Section 3: Use
OverviewSection 3 focuses on the use of public libraries. Each indicator provides a detailed look at how public libraries are used by the people they serve. Indicator 6 examines visits per capita, and Indicator 7 measures circulation per capita, both of which provide quantifiable measures of library use. Indicator 8 looks at total program attendance, young adult’s program attendance, and children’s program attendance. Unlike many of the other metrics in this section, which indicate 1-, 5-, and 10-year decreases, all types of program attendance increased over all measured periods of time. Finally, Indicator 9 examines the use of public-access Internet computers per capita, and Indicator 10 looks at reference transactions per capita.
Indicators in this section are calculated per capita and per 1,000 people, as appropriate due to the scale of the numbers. For instance, Indicator 8 calculates program attendance per 1,000 people because the value per capita is very small. Much like the indicators discussed in Sections 1 and 2, the indicators in this section were analyzed at the national, state, and locale levels as well as by population size. Furthermore, 1-, 5-, and 10-year changes are presented at the national level.
Indicator 6: Visits per Capita
In FY 2014, libraries had 1.42 billion visits, which equated to 4.6 visits per capita, a 1-year decrease of 3.0 percent.
Patron visits are a useful metric for understanding the physical utilization of public libraries. For instance, patrons may visit public libraries to check out books, attend programs, or use public-access Internet computers. Public library visits encompass the total number of people who physically entered a public library.23
23 This metric is based on a count of the number of people who entered a public library (i.e., foot traffic into the building). Counts are not based on individual people but, rather, the number of visits that a library records, regardless of whether or not a person previously visited the library.
Visits per capita is the ratio of the total number of visits to a public library to the total number of individuals within the legal service area of the public library.
In FY 2014, there were 1.42 billion visits to public libraries, a decrease of 35.41 million visits (2.4 percent) from FY 2013. Furthermore, visits per capita was 4.6, a decrease of 3.0 percent from FY 2013 and a 2.2 percent decrease over the past 10 years. However, over the past 5 years, visits decreased 12.0 percent.
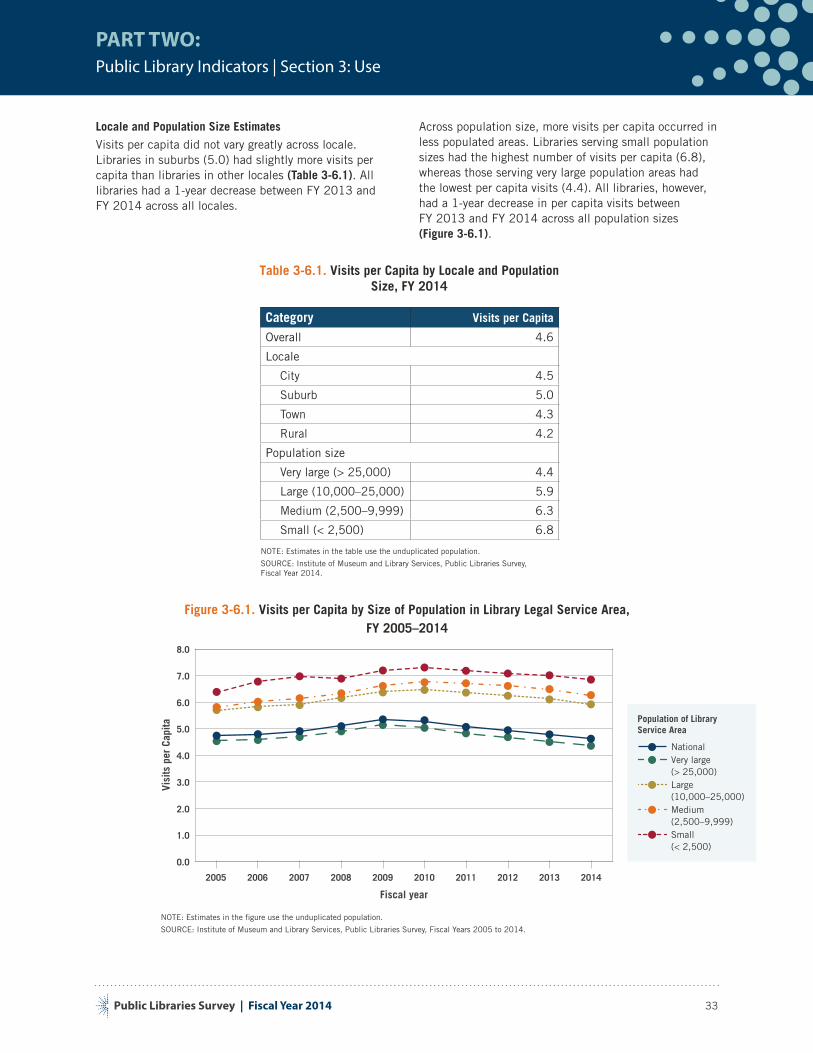
Public Libraries Survey | Fiscal Year 2014
PART TWO:Public Library Indicators | Section 3: Use
33
Locale and Population Size Estimates
Visits per capita did not vary greatly across locale. Libraries in suburbs (5.0) had slightly more visits per capita than libraries in other locales (Table 3-6.1). All libraries had a 1-year decrease between FY 2013 and FY 2014 across all locales.
Across population size, more visits per capita occurred in less populated areas. Libraries serving small population sizes had the highest number of visits per capita (6.8), whereas those serving very large population areas had the lowest per capita visits (4.4). All libraries, however, had a 1-year decrease in per capita visits between FY 2013 and FY 2014 across all population sizes (Figure 3-6.1).
Table 3-6.1. Visits per Capita by Locale and Population Size, FY 2014
Category Visits per Capita
Overall 4.6
Locale
City 4.5
Suburb 5.0
Town 4.3
Rural 4.2
Population size
Very large (> 25,000) 4.4
Large (10,000–25,000) 5.9
Medium (2,500–9,999) 6.3
Small (< 2,500) 6.8
NOTE: Estimates in the table use the unduplicated population.
SOURCE: Institute of Museum and Library Services, Public Libraries Survey, Fiscal Year 2014.
Figure 3-6.1. Visits per Capita by Size of Population in Library Legal Service Area, FY 2005–2014
Population of Library Service Area
Small(< 2,500)
Medium(2,500–9,999)
Large(10,000–25,000)
Very large(> 25,000)
National
Visi
ts p
er C
apita
0.0
1.0
2.0
3.0
4.0
5.0
6.0
7.0
8.0
2005 2006 2007 2008 2009 2010 2011 2012 2013 2014
Fiscal year
NOTE: Estimates in the figure use the unduplicated population.
SOURCE: Institute of Museum and Library Services, Public Libraries Survey, Fiscal Years 2005 to 2014.
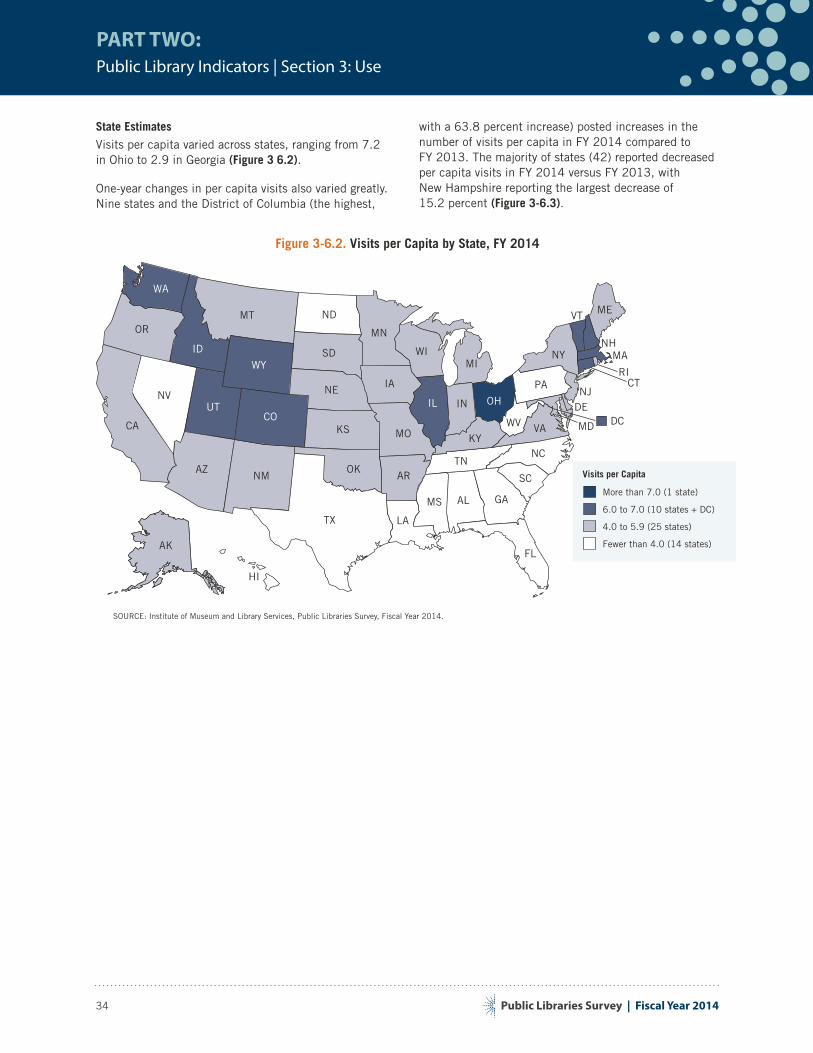
Public Libraries Survey | Fiscal Year 2014
PART TWO:Public Library Indicators | Section 3: Use
34
State Estimates
Visits per capita varied across states, ranging from 7.2 in Ohio to 2.9 in Georgia (Figure 3 6.2).
One-year changes in per capita visits also varied greatly. Nine states and the District of Columbia (the highest,
with a 63.8 percent increase) posted increases in the number of visits per capita in FY 2014 compared to FY 2013. The majority of states (42) reported decreased per capita visits in FY 2014 versus FY 2013, with New Hampshire reporting the largest decrease of 15.2 percent (Figure 3-6.3).
Figure 3-6.2. Visits per Capita by State, FY 2014
Visits per Capita
Fewer than 4.0 (14 states)
4.0 to 5.9 (25 states)
More than 7.0 (1 state)
6.0 to 7.0 (10 states + DC)
DC DE UT
RI
WA
MT NDOR
ID
WYSD
CA
NV
COKS
NE
AZNM
OK
AK
MN
IA
MO
ARTN
NC
LA
FL
MS AL GA
WI
IL
KY
IN OH
WV
PA
NY
VA
MEVT
NH MA
CT
SC
MI
HI
NJ
TX
MD
SOURCE: Institute of Museum and Library Services, Public Libraries Survey, Fiscal Year 2014.
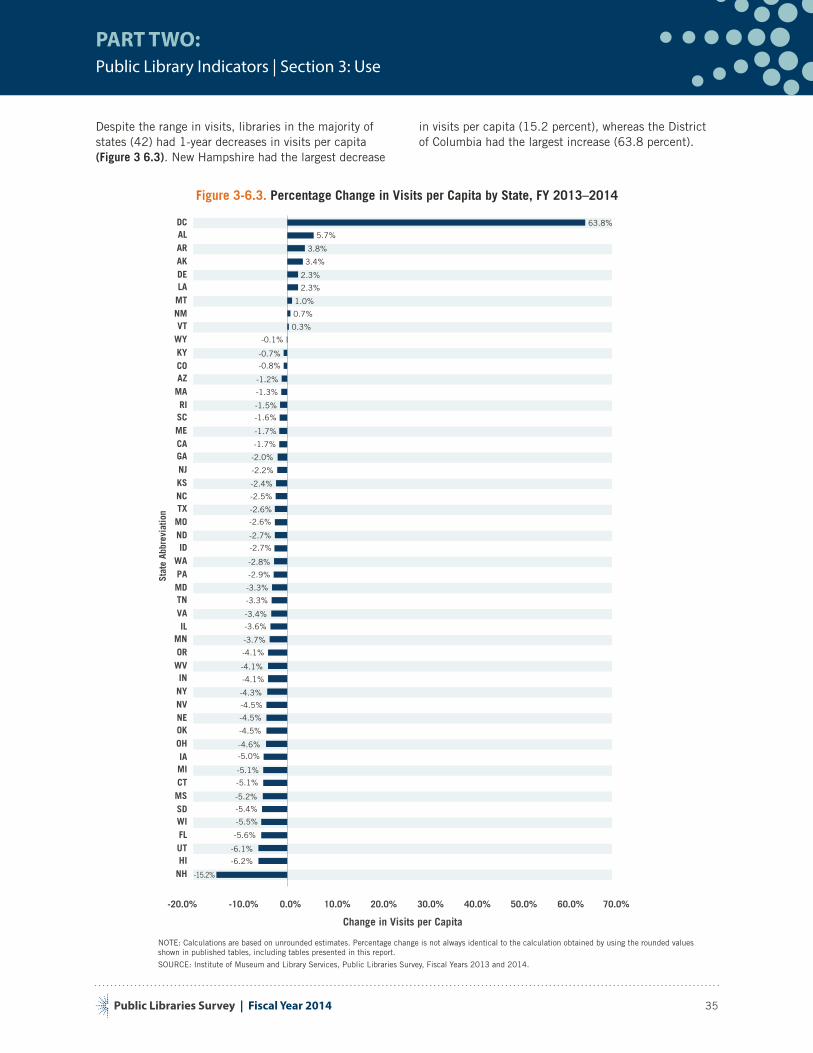
Public Libraries Survey | Fiscal Year 2014
PART TWO:Public Library Indicators | Section 3: Use
35
Despite the range in visits, libraries in the majority of states (42) had 1-year decreases in visits per capita (Figure 3 6.3). New Hampshire had the largest decrease
in visits per capita (15.2 percent), whereas the District of Columbia had the largest increase (63.8 percent).
Figure 3-6.3. Percentage Change in Visits per Capita by State, FY 2013–2014
Change in Visits per Capita
Stat
e Ab
brev
iatio
n
NHHIUTFLWISDMSCTMIIA
OHOKNENVNYIN
WVORMN
ILVATNMDPAWAID
NDMOTXNCKSNJGACAMESCRI
MAAZCOKYWYVT
NMMTLADEAKARALDC
-20.0% -10.0% 0.0% 10.0% 20.0% 30.0% 40.0% 50.0% 60.0% 70.0%
63.8%
5.7%
3.8%
3.4%
2.3%
2.3%
1.0%
0.7%
0.3%
-0.1%
-0.7%
-0.8%
-1.2%
-1.3%
-1.5%
-1.7%
-1.7%
-2.0%
-2.2%
-2.4%
-2.5%
-2.6%
-2.6%
-2.7%
-2.7%
-2.8%
-2.9%
-3.3%
-3.3%
-3.4%
-3.6%
-3.7%
-4.1%
-4.1%
-4.1%
-4.3%
-4.5%
-4.5%
-4.5%
-4.6%-5.0%
-5.1%
-5.1%
-5.2%
-5.5%
-5.6%
-6.1%
-6.2%
-5.4%
-15.2%
-1.6%
NOTE: Calculations are based on unrounded estimates. Percentage change is not always identical to the calculation obtained by using the rounded values shown in published tables, including tables presented in this report.
SOURCE: Institute of Museum and Library Services, Public Libraries Survey, Fiscal Years 2013 and 2014.
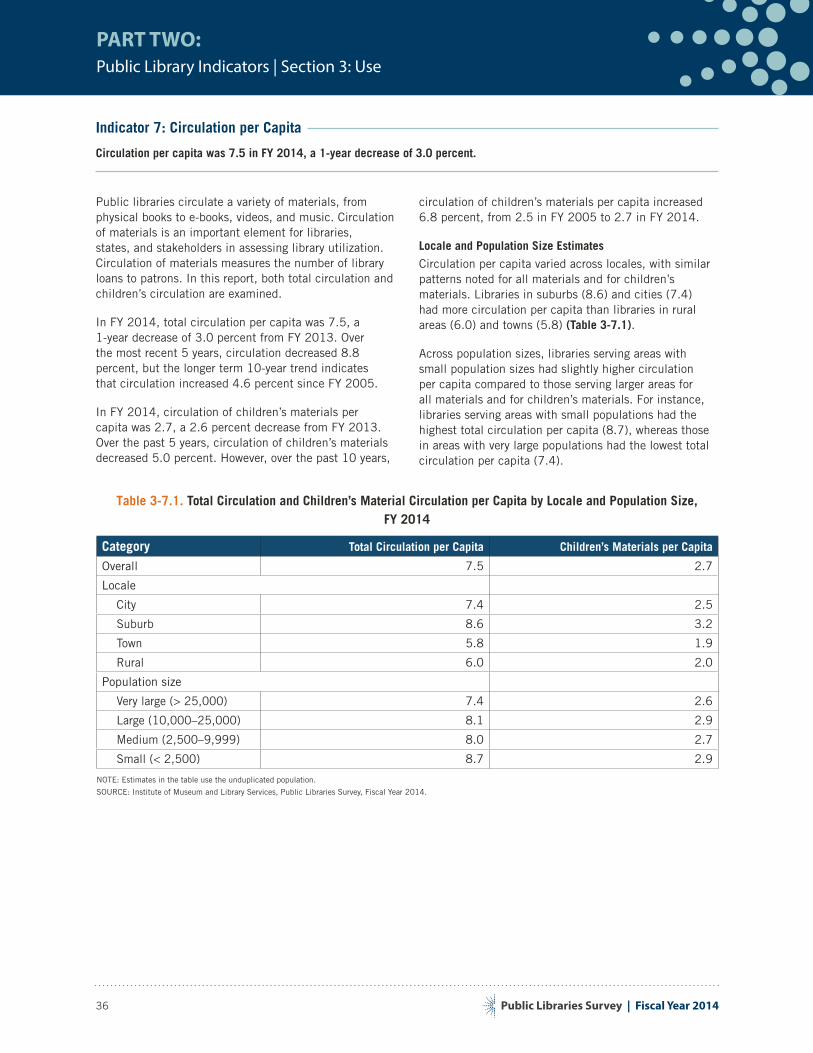
Public Libraries Survey | Fiscal Year 2014
PART TWO:Public Library Indicators | Section 3: Use
36
Indicator 7: Circulation per Capita
Circulation per capita was 7.5 in FY 2014, a 1-year decrease of 3.0 percent.
Public libraries circulate a variety of materials, from physical books to e-books, videos, and music. Circulation of materials is an important element for libraries, states, and stakeholders in assessing library utilization. Circulation of materials measures the number of library loans to patrons. In this report, both total circulation and children’s circulation are examined.
In FY 2014, total circulation per capita was 7.5, a 1-year decrease of 3.0 percent from FY 2013. Over the most recent 5 years, circulation decreased 8.8 percent, but the longer term 10-year trend indicates that circulation increased 4.6 percent since FY 2005.
In FY 2014, circulation of children’s materials per capita was 2.7, a 2.6 percent decrease from FY 2013. Over the past 5 years, circulation of children’s materials decreased 5.0 percent. However, over the past 10 years,
circulation of children’s materials per capita increased 6.8 percent, from 2.5 in FY 2005 to 2.7 in FY 2014.
Locale and Population Size Estimates
Circulation per capita varied across locales, with similar patterns noted for all materials and for children’s materials. Libraries in suburbs (8.6) and cities (7.4) had more circulation per capita than libraries in rural areas (6.0) and towns (5.8) (Table 3-7.1).
Across population sizes, libraries serving areas with small population sizes had slightly higher circulation per capita compared to those serving larger areas for all materials and for children’s materials. For instance, libraries serving areas with small populations had the highest total circulation per capita (8.7), whereas those in areas with very large populations had the lowest total circulation per capita (7.4).
Table 3-7.1. Total Circulation and Children’s Material Circulation per Capita by Locale and Population Size, FY 2014
Category Total Circulation per Capita Children’s Materials per Capita
Overall 7.5 2.7
Locale
City 7.4 2.5
Suburb 8.6 3.2
Town 5.8 1.9
Rural 6.0 2.0
Population size
Very large (> 25,000) 7.4 2.6
Large (10,000–25,000) 8.1 2.9
Medium (2,500–9,999) 8.0 2.7
Small (< 2,500) 8.7 2.9
NOTE: Estimates in the table use the unduplicated population.
SOURCE: Institute of Museum and Library Services, Public Libraries Survey, Fiscal Year 2014.
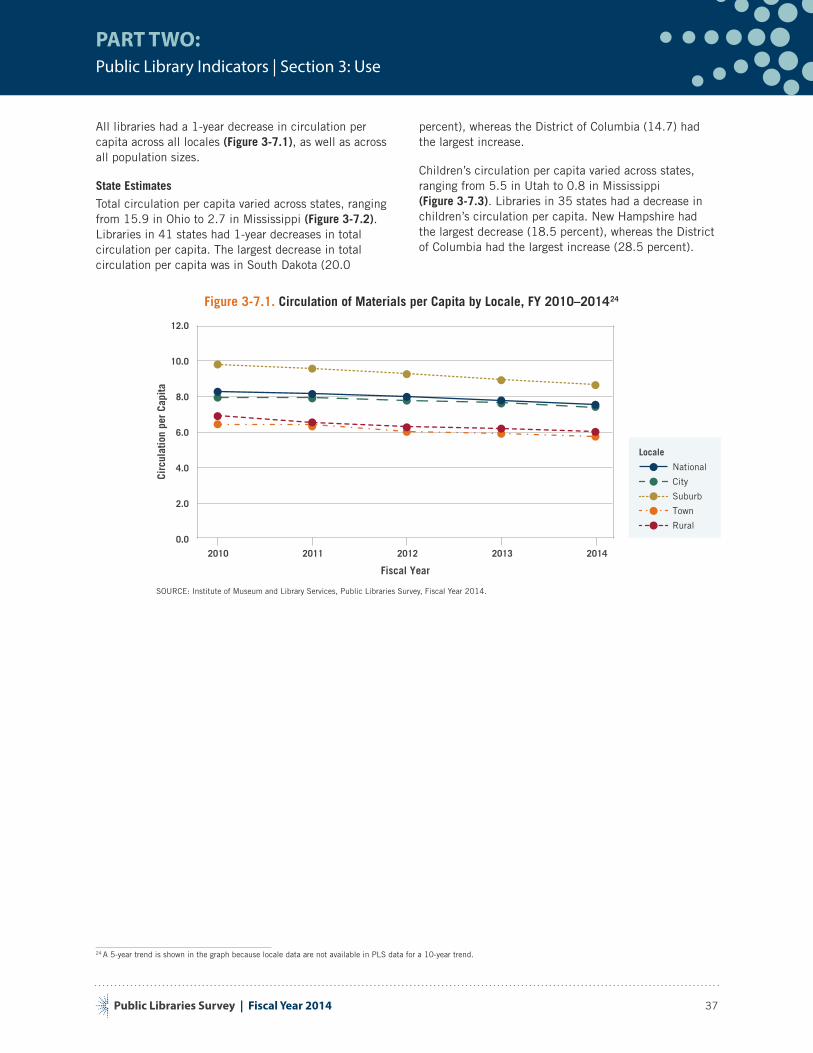
Public Libraries Survey | Fiscal Year 2014
PART TWO:Public Library Indicators | Section 3: Use
37
All libraries had a 1-year decrease in circulation per capita across all locales (Figure 3-7.1), as well as across all population sizes.
State Estimates
Total circulation per capita varied across states, ranging from 15.9 in Ohio to 2.7 in Mississippi (Figure 3-7.2). Libraries in 41 states had 1-year decreases in total circulation per capita. The largest decrease in total circulation per capita was in South Dakota (20.0
percent), whereas the District of Columbia (14.7) had the largest increase.
Children’s circulation per capita varied across states, ranging from 5.5 in Utah to 0.8 in Mississippi (Figure 3-7.3). Libraries in 35 states had a decrease in children’s circulation per capita. New Hampshire had the largest decrease (18.5 percent), whereas the District of Columbia had the largest increase (28.5 percent).
Figure 3-7.1. Circulation of Materials per Capita by Locale, FY 2010–201424
24 A 5-year trend is shown in the graph because locale data are not available in PLS data for a 10-year trend.
Circ
ulat
ion
per
Capi
ta
Fiscal Year
2010 2011 2012 2013 2014
Locale
Rural
Town
Suburb
City
National
0.0
2.0
4.0
6.0
8.0
10.0
12.0
SOURCE: Institute of Museum and Library Services, Public Libraries Survey, Fiscal Year 2014.
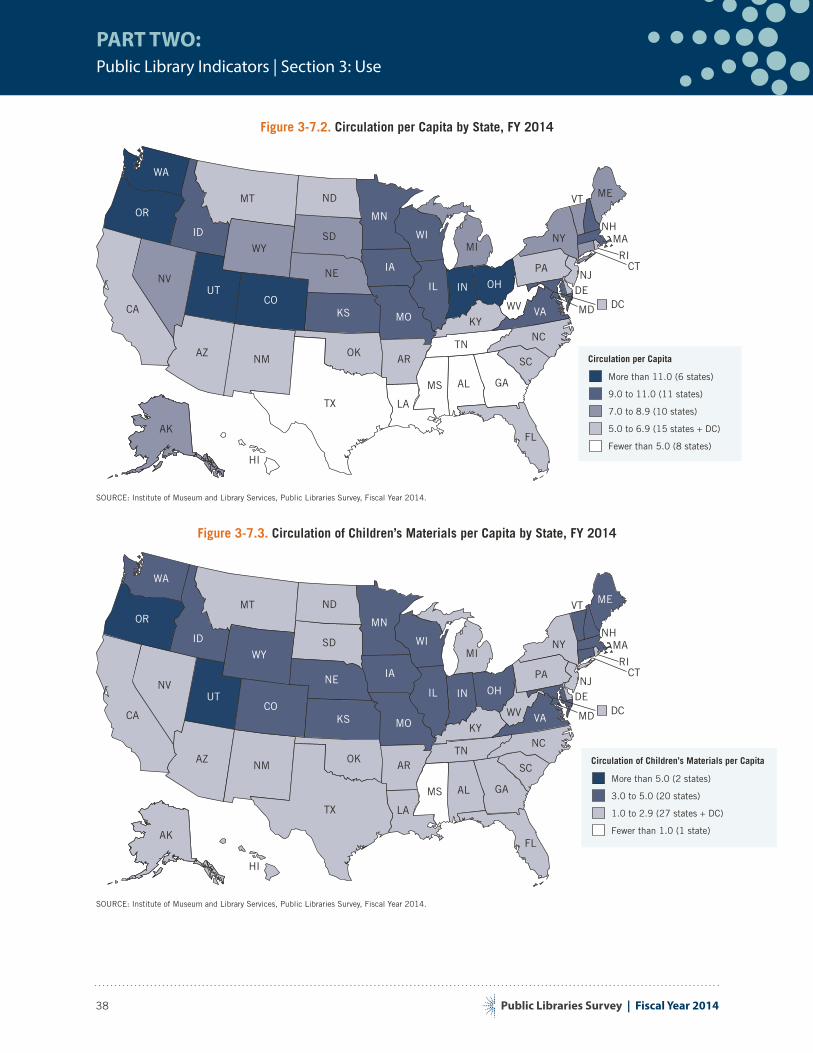
Public Libraries Survey | Fiscal Year 2014
PART TWO:Public Library Indicators | Section 3: Use
38
Figure 3-7.2. Circulation per Capita by State, FY 2014
Circulation per Capita
Fewer than 5.0 (8 states)
5.0 to 6.9 (15 states + DC)
7.0 to 8.9 (10 states)
More than 11.0 (6 states)
9.0 to 11.0 (11 states)
DC DE UT
RI
WA
MT NDOR
ID
WYSD
CA
NV
COKS
NE
AZNM
OK
AK
MN
IA
MO
ARTN
NC
LA
FL
MS AL GA
WI
IL
KY
IN OH
WV
PA
NY
VA
MEVT
NH MA
CT
SC
MI
HI
NJ
TX
MD
SOURCE: Institute of Museum and Library Services, Public Libraries Survey, Fiscal Year 2014.
Figure 3-7.3. Circulation of Children’s Materials per Capita by State, FY 2014
Circulation of Children’s Materials per Capita
Fewer than 1.0 (1 state)
3.0 to 5.0 (20 states)
1.0 to 2.9 (27 states + DC)
More than 5.0 (2 states)
DC DE UT
RI
WA
MT NDOR
ID
WYSD
CA
NV
COKS
NE
AZNM
OK
AK
MN
IA
MO
ARTN
NC
LA
FL
MS AL GA
WI
IL
KY
IN OH
WV
PA
NY
VA
MEVT
NH MA
CT
SC
MI
HI
NJ
TX
MD
SOURCE: Institute of Museum and Library Services, Public Libraries Survey, Fiscal Year 2014.
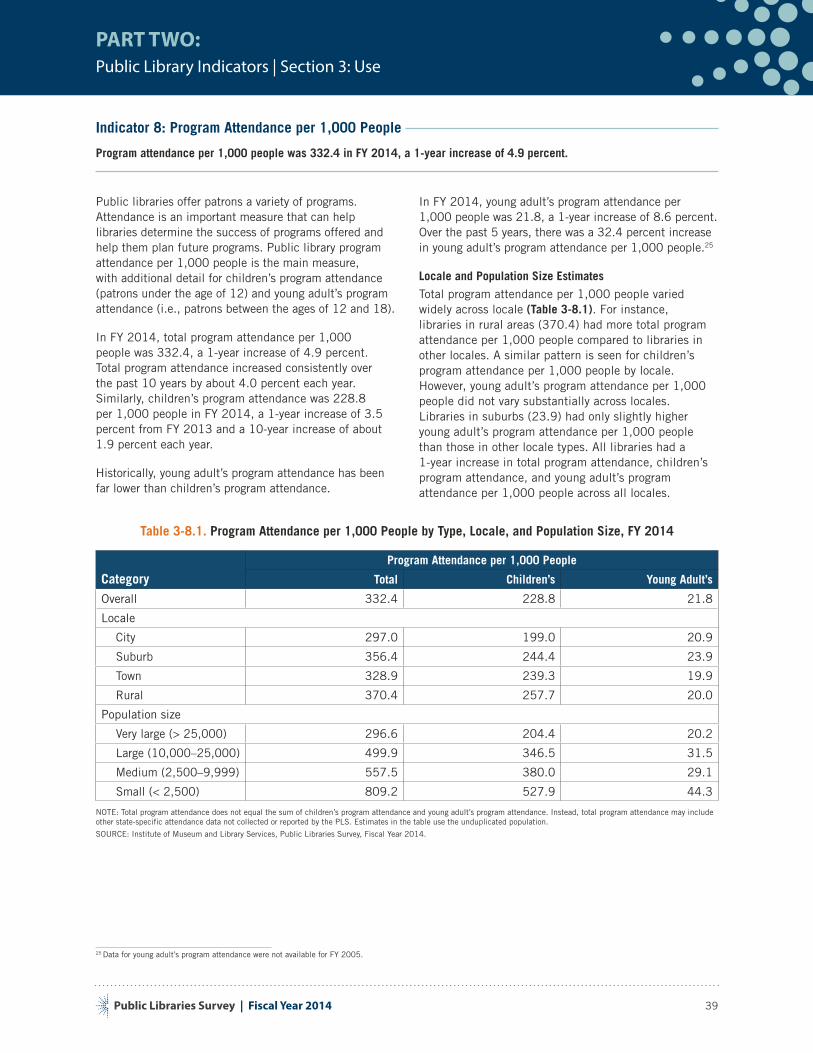
Public Libraries Survey | Fiscal Year 2014
PART TWO:Public Library Indicators | Section 3: Use
39
Indicator 8: Program Attendance per 1,000 People
Program attendance per 1,000 people was 332.4 in FY 2014, a 1-year increase of 4.9 percent.
Public libraries offer patrons a variety of programs. Attendance is an important measure that can help libraries determine the success of programs offered and help them plan future programs. Public library program attendance per 1,000 people is the main measure, with additional detail for children’s program attendance (patrons under the age of 12) and young adult’s program attendance (i.e., patrons between the ages of 12 and 18).
In FY 2014, total program attendance per 1,000 people was 332.4, a 1-year increase of 4.9 percent. Total program attendance increased consistently over the past 10 years by about 4.0 percent each year. Similarly, children’s program attendance was 228.8 per 1,000 people in FY 2014, a 1-year increase of 3.5 percent from FY 2013 and a 10-year increase of about 1.9 percent each year.
Historically, young adult’s program attendance has been far lower than children’s program attendance.
In FY 2014, young adult’s program attendance per 1,000 people was 21.8, a 1-year increase of 8.6 percent. Over the past 5 years, there was a 32.4 percent increase in young adult’s program attendance per 1,000 people.25
25 Data for young adult’s program attendance were not available for FY 2005.
Locale and Population Size Estimates
Total program attendance per 1,000 people varied widely across locale (Table 3-8.1). For instance, libraries in rural areas (370.4) had more total program attendance per 1,000 people compared to libraries in other locales. A similar pattern is seen for children’s program attendance per 1,000 people by locale. However, young adult’s program attendance per 1,000 people did not vary substantially across locales. Libraries in suburbs (23.9) had only slightly higher young adult’s program attendance per 1,000 people than those in other locale types. All libraries had a 1-year increase in total program attendance, children’s program attendance, and young adult’s program attendance per 1,000 people across all locales.
Table 3-8.1. Program Attendance per 1,000 People by Type, Locale, and Population Size, FY 2014
CategoryProgram Attendance per 1,000 People
Total Children’s Young Adult’s
Overall 332.4 228.8 21.8
Locale
City 297.0 199.0 20.9
Suburb 356.4 244.4 23.9
Town 328.9 239.3 19.9
Rural 370.4 257.7 20.0
Population size
Very large (> 25,000) 296.6 204.4 20.2
Large (10,000–25,000) 499.9 346.5 31.5
Medium (2,500–9,999) 557.5 380.0 29.1
Small (< 2,500) 809.2 527.9 44.3
NOTE: Total program attendance does not equal the sum of children’s program attendance and young adult’s program attendance. Instead, total program attendance may include other state-specific attendance data not collected or reported by the PLS. Estimates in the table use the unduplicated population.
SOURCE: Institute of Museum and Library Services, Public Libraries Survey, Fiscal Year 2014.
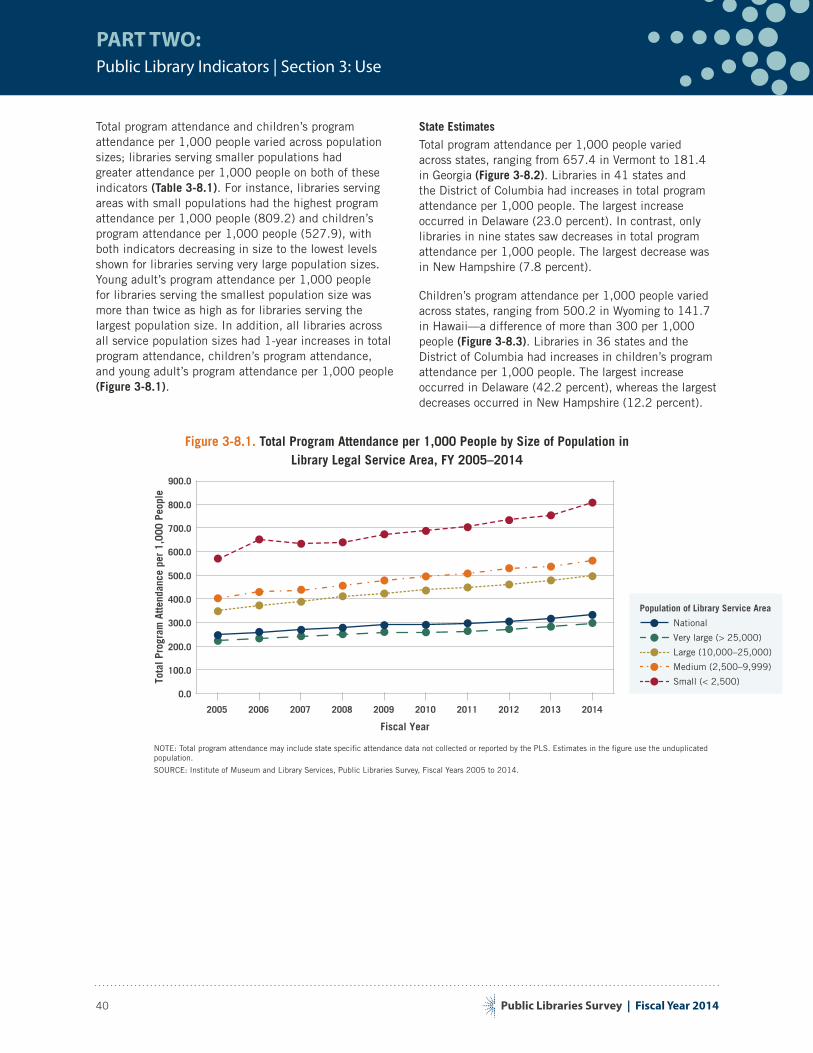
Public Libraries Survey | Fiscal Year 2014
PART TWO:Public Library Indicators | Section 3: Use
40
Total program attendance and children’s program attendance per 1,000 people varied across population sizes; libraries serving smaller populations had greater attendance per 1,000 people on both of these indicators (Table 3-8.1). For instance, libraries serving areas with small populations had the highest program attendance per 1,000 people (809.2) and children’s program attendance per 1,000 people (527.9), with both indicators decreasing in size to the lowest levels shown for libraries serving very large population sizes. Young adult’s program attendance per 1,000 people for libraries serving the smallest population size was more than twice as high as for libraries serving the largest population size. In addition, all libraries across all service population sizes had 1-year increases in total program attendance, children’s program attendance, and young adult’s program attendance per 1,000 people (Figure 3-8.1).
State Estimates
Total program attendance per 1,000 people varied across states, ranging from 657.4 in Vermont to 181.4 in Georgia (Figure 3-8.2). Libraries in 41 states and the District of Columbia had increases in total program attendance per 1,000 people. The largest increase occurred in Delaware (23.0 percent). In contrast, only libraries in nine states saw decreases in total program attendance per 1,000 people. The largest decrease was in New Hampshire (7.8 percent).
Children’s program attendance per 1,000 people varied across states, ranging from 500.2 in Wyoming to 141.7 in Hawaii—a difference of more than 300 per 1,000 people (Figure 3-8.3). Libraries in 36 states and the District of Columbia had increases in children’s program attendance per 1,000 people. The largest increase occurred in Delaware (42.2 percent), whereas the largest decreases occurred in New Hampshire (12.2 percent).
Figure 3-8.1. Total Program Attendance per 1,000 People by Size of Population in Library Legal Service Area, FY 2005–2014
Population of Library Service Area
Small (< 2,500)
Medium (2,500–9,999)
Large (10,000–25,000)
Very large (> 25,000)
National
Tota
l Pro
gram
Atte
ndan
ce p
er 1
,000
Peo
ple
2005 2006 2007 2008 2009 2010 2011 2012 2013 2014
Fiscal Year
0.0
100.0
200.0
300.0
400.0
500.0
600.0
700.0
800.0
900.0
NOTE: Total program attendance may include state specific attendance data not collected or reported by the PLS. Estimates in the figure use the unduplicated population.
SOURCE: Institute of Museum and Library Services, Public Libraries Survey, Fiscal Years 2005 to 2014.
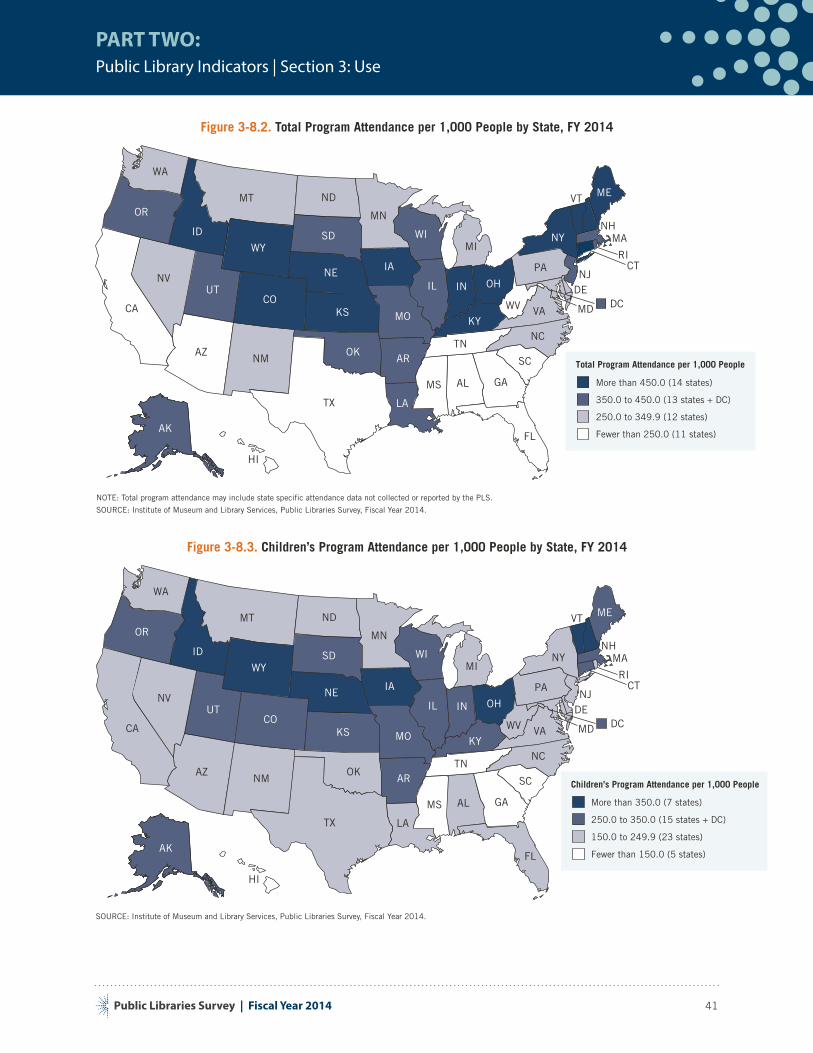
Public Libraries Survey | Fiscal Year 2014
PART TWO:Public Library Indicators | Section 3: Use
41
Figure 3-8.2. Total Program Attendance per 1,000 People by State, FY 2014
Total Program Attendance per 1,000 People
More than 450.0 (14 states)
Fewer than 250.0 (11 states)
350.0 to 450.0 (13 states + DC)
250.0 to 349.9 (12 states)
DC DE UT
RI
WA
MT NDOR
ID
WYSD
CA
NV
COKS
NE
AZNM
OK
AK
MN
IA
MO
ARTN
NC
LA
FL
MS AL GA
WI
IL
KY
IN OH
WV
PA
NY
VA
MEVT
NH MA
CT
SC
MI
HI
NJ
TX
MD
NOTE: Total program attendance may include state specific attendance data not collected or reported by the PLS.
SOURCE: Institute of Museum and Library Services, Public Libraries Survey, Fiscal Year 2014.
Figure 3-8.3. Children’s Program Attendance per 1,000 People by State, FY 2014
Children’s Program Attendance per 1,000 People
More than 350.0 (7 states)
Fewer than 150.0 (5 states)
250.0 to 350.0 (15 states + DC)
150.0 to 249.9 (23 states)
DC DE UT
RI
WA
MT NDOR
ID
WYSD
CA
NV
COKS
NE
AZNM
OK
AK
MN
IA
MO
ARTN
NC
LA
FL
MS AL GA
WI
IL
KY
IN OH
WV
PA
NY
VA
MEVT
NH MA
CT
SC
MI
HI
NJ
TX
MD
SOURCE: Institute of Museum and Library Services, Public Libraries Survey, Fiscal Year 2014.
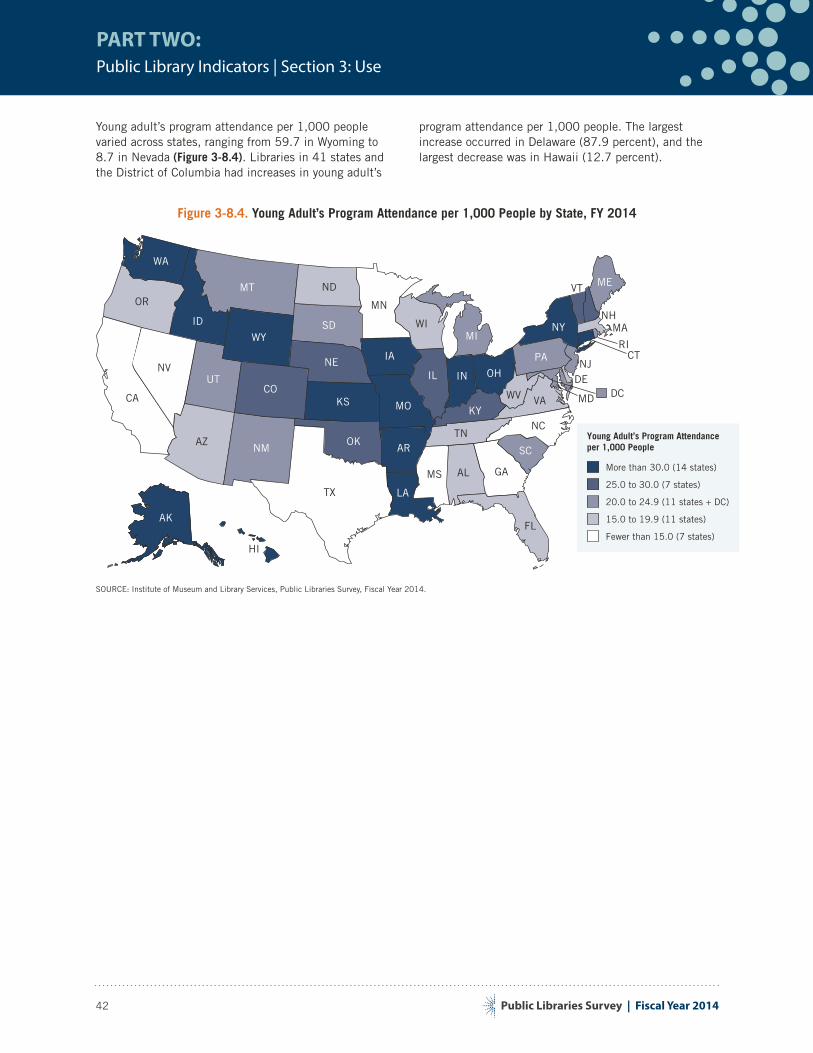
Public Libraries Survey | Fiscal Year 2014
PART TWO:Public Library Indicators | Section 3: Use
42
Young adult’s program attendance per 1,000 people varied across states, ranging from 59.7 in Wyoming to 8.7 in Nevada (Figure 3-8.4). Libraries in 41 states and the District of Columbia had increases in young adult’s
program attendance per 1,000 people. The largest increase occurred in Delaware (87.9 percent), and the largest decrease was in Hawaii (12.7 percent).
Figure 3-8.4. Young Adult’s Program Attendance per 1,000 People by State, FY 2014
Young Adult’s Program Attendance per 1,000 People
More than 30.0 (14 states)
15.0 to 19.9 (11 states)
Fewer than 15.0 (7 states)
25.0 to 30.0 (7 states)
20.0 to 24.9 (11 states + DC)
DC DE UT
RI
WA
MT NDOR
ID
WYSD
CA
NV
COKS
NE
AZNM
OK
AK
MN
IA
MO
ARTN
NC
LA
FL
MS AL GA
WI
IL
KY
IN OH
WV
PA
NY
VA
MEVT
NH MA
CT
SC
MI
HI
NJ
TX
MD
SOURCE: Institute of Museum and Library Services, Public Libraries Survey, Fiscal Year 2014.
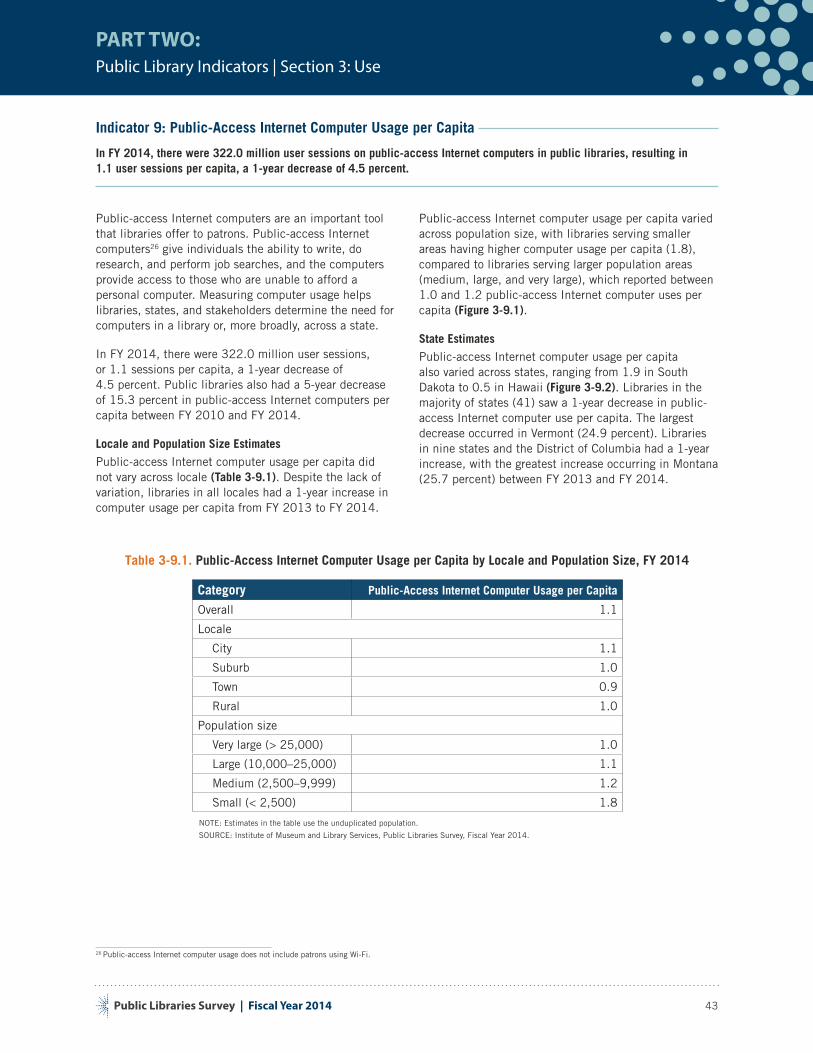
Public Libraries Survey | Fiscal Year 2014
PART TWO:Public Library Indicators | Section 3: Use
43
Indicator 9: Public-Access Internet Computer Usage per Capita
In FY 2014, there were 322.0 million user sessions on public-access Internet computers in public libraries, resulting in 1.1 user sessions per capita, a 1-year decrease of 4.5 percent.
Public-access Internet computers are an important tool that libraries offer to patrons. Public-access Internet computers26
26 Public-access Internet computer usage does not include patrons using Wi-Fi.
give individuals the ability to write, do research, and perform job searches, and the computers provide access to those who are unable to afford a personal computer. Measuring computer usage helps libraries, states, and stakeholders determine the need for computers in a library or, more broadly, across a state.
In FY 2014, there were 322.0 million user sessions, or 1.1 sessions per capita, a 1-year decrease of 4.5 percent. Public libraries also had a 5-year decrease of 15.3 percent in public-access Internet computers per capita between FY 2010 and FY 2014.
Locale and Population Size Estimates
Public-access Internet computer usage per capita did not vary across locale (Table 3-9.1). Despite the lack of variation, libraries in all locales had a 1-year increase in computer usage per capita from FY 2013 to FY 2014.
Public-access Internet computer usage per capita varied across population size, with libraries serving smaller areas having higher computer usage per capita (1.8), compared to libraries serving larger population areas (medium, large, and very large), which reported between 1.0 and 1.2 public-access Internet computer uses per capita (Figure 3-9.1).
State Estimates
Public-access Internet computer usage per capita also varied across states, ranging from 1.9 in South Dakota to 0.5 in Hawaii (Figure 3-9.2). Libraries in the majority of states (41) saw a 1-year decrease in public-access Internet computer use per capita. The largest decrease occurred in Vermont (24.9 percent). Libraries in nine states and the District of Columbia had a 1-year increase, with the greatest increase occurring in Montana (25.7 percent) between FY 2013 and FY 2014.
Table 3-9.1. Public-Access Internet Computer Usage per Capita by Locale and Population Size, FY 2014
Category Public-Access Internet Computer Usage per Capita
Overall 1.1
Locale
City 1.1
Suburb 1.0
Town 0.9
Rural 1.0
Population size
Very large (> 25,000) 1.0
Large (10,000–25,000) 1.1
Medium (2,500–9,999) 1.2
Small (< 2,500) 1.8
NOTE: Estimates in the table use the unduplicated population.
SOURCE: Institute of Museum and Library Services, Public Libraries Survey, Fiscal Year 2014.
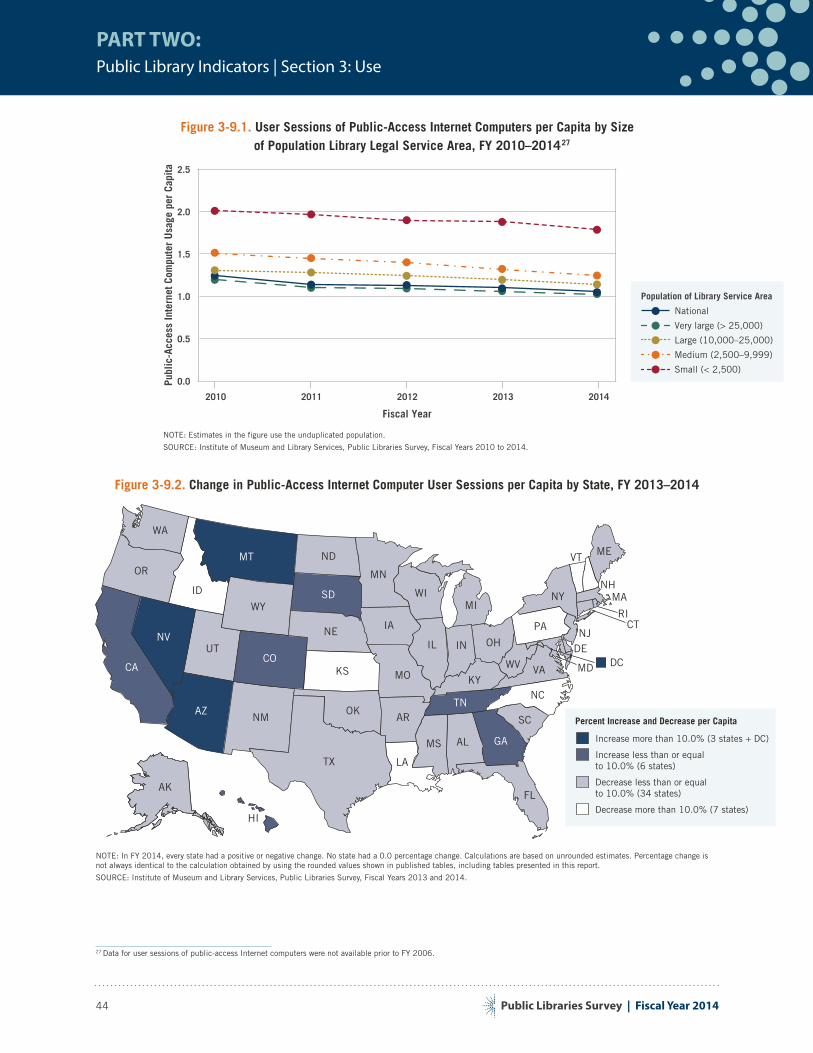
Public Libraries Survey | Fiscal Year 2014
PART TWO:Public Library Indicators | Section 3: Use
44
Figure 3-9.1. User Sessions of Public-Access Internet Computers per Capita by Size of Population Library Legal Service Area, FY 2010–201427
27 Data for user sessions of public-access Internet computers were not available prior to FY 2006.
Publ
ic-A
cces
s In
tern
et C
ompu
ter
Usa
ge p
er C
apita
Fiscal Year
2010 2011 2012 2013 2014
0.0
0.5
1.0
1.5
2.0
2.5
Population of Library Service Area
Small (< 2,500)
Medium (2,500–9,999)
Large (10,000–25,000)
Very large (> 25,000)
National
NOTE: Estimates in the figure use the unduplicated population.
SOURCE: Institute of Museum and Library Services, Public Libraries Survey, Fiscal Years 2010 to 2014.
Figure 3-9.2. Change in Public-Access Internet Computer User Sessions per Capita by State, FY 2013–2014
Percent Increase and Decrease per Capita
Increase more than 10.0% (3 states + DC)
Decrease more than 10.0% (7 states)
Decrease less than or equal to 10.0% (34 states)
Increase less than or equal to 10.0% (6 states)
DC DE UT
RI
WA
MT NDOR
ID
WYSD
CA
NV
COKS
NE
AZNM
OK
AK
MN
IA
MO
ARTN
NC
LA
FL
MS AL GA
WI
IL
KY
IN OH
WV
PA
NY
VA
MEVT
NH MA
CT
SC
MI
HI
NJ
TX
MD
NOTE: In FY 2014, every state had a positive or negative change. No state had a 0.0 percentage change. Calculations are based on unrounded estimates. Percentage change is not always identical to the calculation obtained by using the rounded values shown in published tables, including tables presented in this report.
SOURCE: Institute of Museum and Library Services, Public Libraries Survey, Fiscal Years 2013 and 2014.
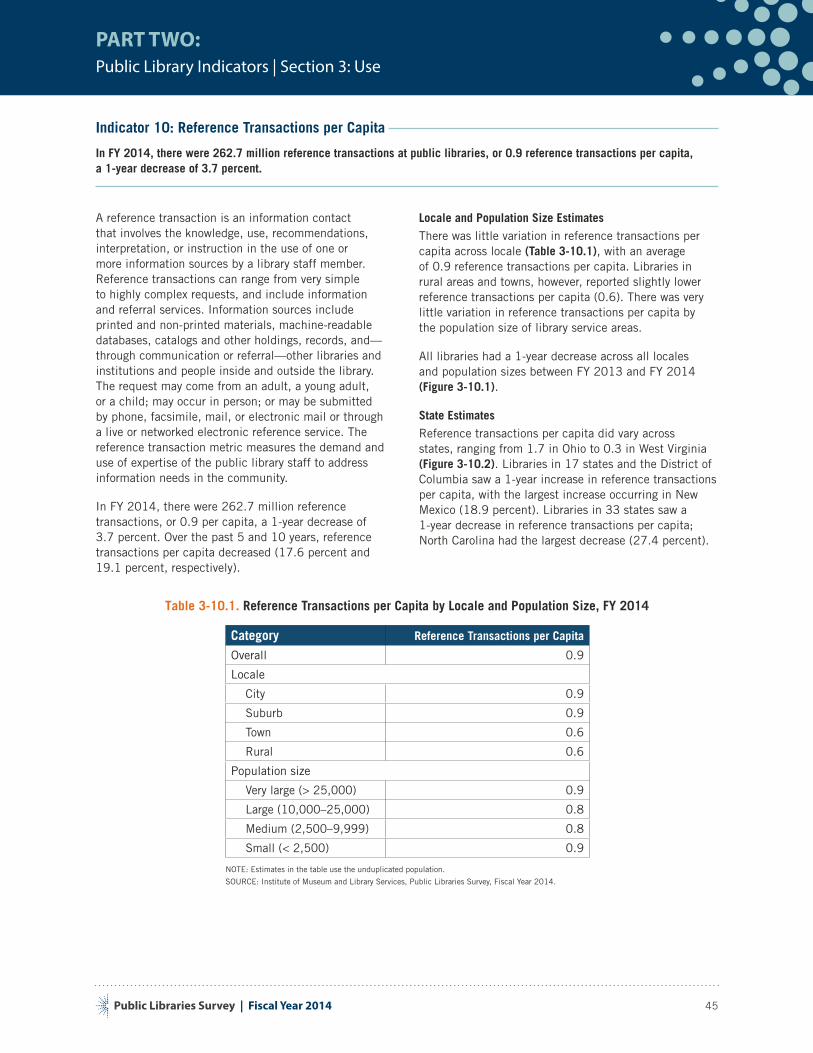
Public Libraries Survey | Fiscal Year 2014
PART TWO:Public Library Indicators | Section 3: Use
45
Indicator 10: Reference Transactions per Capita
In FY 2014, there were 262.7 million reference transactions at public libraries, or 0.9 reference transactions per capita, a 1-year decrease of 3.7 percent.
A reference transaction is an information contact that involves the knowledge, use, recommendations, interpretation, or instruction in the use of one or more information sources by a library staff member. Reference transactions can range from very simple to highly complex requests, and include information and referral services. Information sources include printed and non-printed materials, machine-readable databases, catalogs and other holdings, records, and—through communication or referral—other libraries and institutions and people inside and outside the library. The request may come from an adult, a young adult, or a child; may occur in person; or may be submitted by phone, facsimile, mail, or electronic mail or through a live or networked electronic reference service. The reference transaction metric measures the demand and use of expertise of the public library staff to address information needs in the community.
In FY 2014, there were 262.7 million reference transactions, or 0.9 per capita, a 1-year decrease of 3.7 percent. Over the past 5 and 10 years, reference transactions per capita decreased (17.6 percent and 19.1 percent, respectively).
Locale and Population Size Estimates
There was little variation in reference transactions per capita across locale (Table 3-10.1), with an average of 0.9 reference transactions per capita. Libraries in rural areas and towns, however, reported slightly lower reference transactions per capita (0.6). There was very little variation in reference transactions per capita by the population size of library service areas.
All libraries had a 1-year decrease across all locales and population sizes between FY 2013 and FY 2014 (Figure 3-10.1).
State Estimates
Reference transactions per capita did vary across states, ranging from 1.7 in Ohio to 0.3 in West Virginia(Figure 3-10.2). Libraries in 17 states and the District of Columbia saw a 1-year increase in reference transactions per capita, with the largest increase occurring in New Mexico (18.9 percent). Libraries in 33 states saw a 1-year decrease in reference transactions per capita; North Carolina had the largest decrease (27.4 percent).
Table 3-10.1. Reference Transactions per Capita by Locale and Population Size, FY 2014
Category Reference Transactions per Capita
Overall 0.9
Locale
City 0.9
Suburb 0.9
Town 0.6
Rural 0.6
Population size
Very large (> 25,000) 0.9
Large (10,000–25,000) 0.8
Medium (2,500–9,999) 0.8
Small (< 2,500) 0.9
NOTE: Estimates in the table use the unduplicated population.
SOURCE: Institute of Museum and Library Services, Public Libraries Survey, Fiscal Year 2014.
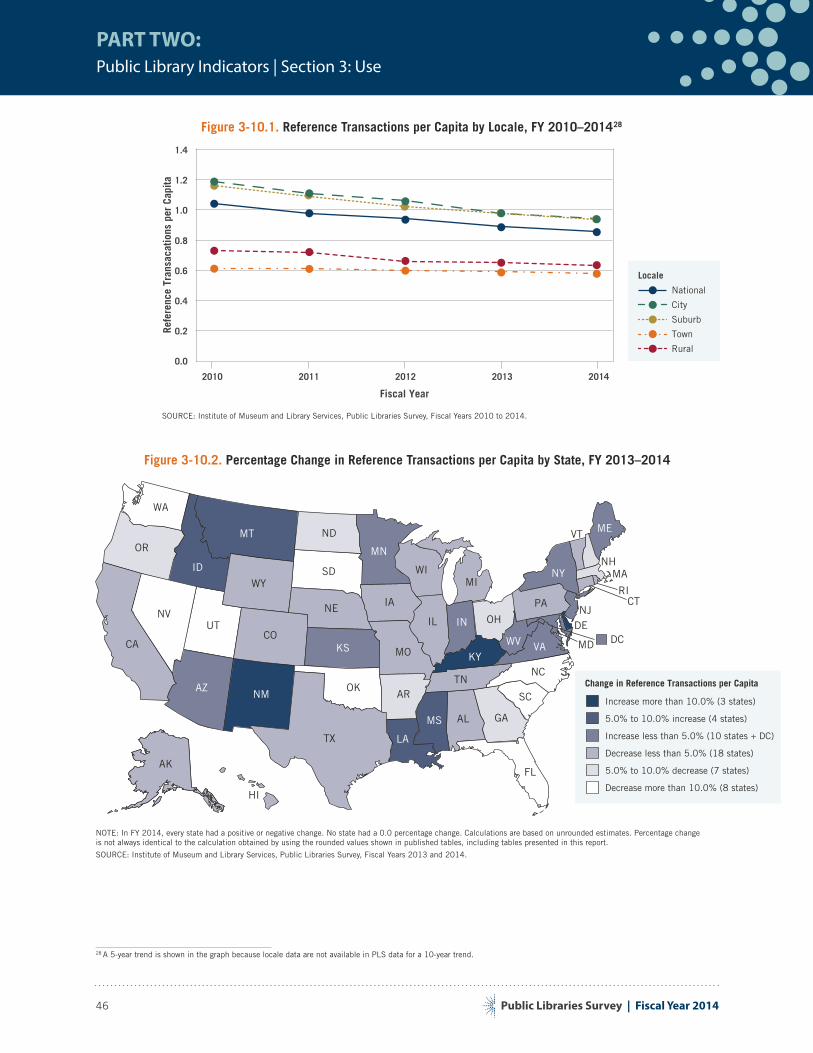
Public Libraries Survey | Fiscal Year 2014
PART TWO:Public Library Indicators | Section 3: Use
46
Figure 3-10.1. Reference Transactions per Capita by Locale, FY 2010–201428
28 A 5-year trend is shown in the graph because locale data are not available in PLS data for a 10-year trend.
Locale
Rural
Town
Suburb
City
National
Refe
renc
e Tr
ansa
catio
ns p
er C
apita
Fiscal Year
2010 2011 2012 2013 2014
0.0
0.2
0.4
0.6
0.8
1.0
1.2
1.4
SOURCE: Institute of Museum and Library Services, Public Libraries Survey, Fiscal Years 2010 to 2014.
Figure 3-10.2. Percentage Change in Reference Transactions per Capita by State, FY 2013–2014
Change in Reference Transactions per Capita
Increase more than 10.0% (3 states)
Decrease more than 10.0% (8 states)
5.0% to 10.0% decrease (7 states)
Decrease less than 5.0% (18 states)
5.0% to 10.0% increase (4 states)
Increase less than 5.0% (10 states + DC)
DC DE UT
RI
WA
MT NDOR
ID
WYSD
CA
NV
COKS
NE
AZNM
OK
AK
MN
IA
MO
ARTN
NC
LA
FL
MS AL GA
WI
IL
KY
IN OH
WV
PA
NY
VA
MEVT
NH MA
CT
SC
MI
HI
NJ
TX
MD
NOTE: In FY 2014, every state had a positive or negative change. No state had a 0.0 percentage change. Calculations are based on unrounded estimates. Percentage change is not always identical to the calculation obtained by using the rounded values shown in published tables, including tables presented in this report.
SOURCE: Institute of Museum and Library Services, Public Libraries Survey, Fiscal Years 2013 and 2014.
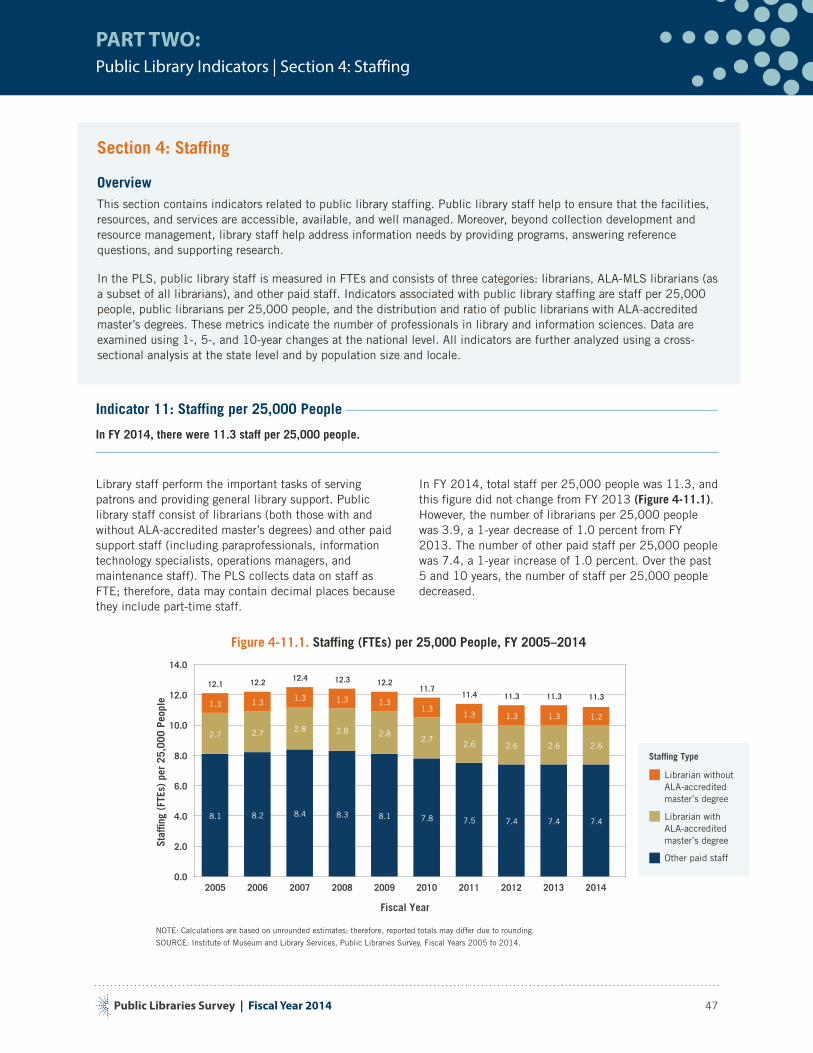
Public Libraries Survey | Fiscal Year 2014
PART TWO:Public Library Indicators | Section 4: Staffing
47
Section 4: Staffing
OverviewThis section contains indicators related to public library staffing. Public library staff help to ensure that the facilities, resources, and services are accessible, available, and well managed. Moreover, beyond collection development and resource management, library staff help address information needs by providing programs, answering reference questions, and supporting research.
In the PLS, public library staff is measured in FTEs and consists of three categories: librarians, ALA-MLS librarians (as a subset of all librarians), and other paid staff. Indicators associated with public library staffing are staff per 25,000 people, public librarians per 25,000 people, and the distribution and ratio of public librarians with ALA-accredited master’s degrees. These metrics indicate the number of professionals in library and information sciences. Data are examined using 1-, 5-, and 10-year changes at the national level. All indicators are further analyzed using a cross-sectional analysis at the state level and by population size and locale.
Indicator 11: Staffing per 25,000 People
In FY 2014, there were 11.3 staff per 25,000 people.
Library staff perform the important tasks of serving patrons and providing general library support. Public library staff consist of librarians (both those with and without ALA-accredited master’s degrees) and other paid support staff (including paraprofessionals, information technology specialists, operations managers, and maintenance staff). The PLS collects data on staff as FTE; therefore, data may contain decimal places because they include part-time staff.
In FY 2014, total staff per 25,000 people was 11.3, and this figure did not change from FY 2013 (Figure 4-11.1). However, the number of librarians per 25,000 people was 3.9, a 1-year decrease of 1.0 percent from FY 2013. The number of other paid staff per 25,000 people was 7.4, a 1-year increase of 1.0 percent. Over the past 5 and 10 years, the number of staff per 25,000 people decreased.
Figure 4-11.1. Staffing (FTEs) per 25,000 People, FY 2005–2014
Staf
fing
(FTE
s) p
er 2
5,00
0 Pe
ople
Fiscal Year
2005 2006 2007 2008 2009 2010 2011 2012 2013 2014
Other paid staff
Librarian without ALA-accredited master’s degree
Librarian with ALA-accredited master’s degree
0.0
2.0
4.0
6.0
8.0
10.0
12.0
14.0
8.1
2.7
1.3
8.2
2.7
1.3
8.4
2.8
1.3
8.3
2.8
1.3
8.1
2.8
1.3
7.8
2.7
1.3
7.5
2.6
1.3
7.4
2.6
1.3
7.4
2.6
1.3
7.4
2.6
1.2
12.1 12.2 12.4 12.3 12.211.7
11.4 11.3 11.3 11.3
Staffing Type
NOTE: Calculations are based on unrounded estimates; therefore, reported totals may differ due to rounding.
SOURCE: Institute of Museum and Library Services, Public Libraries Survey, Fiscal Years 2005 to 2014.
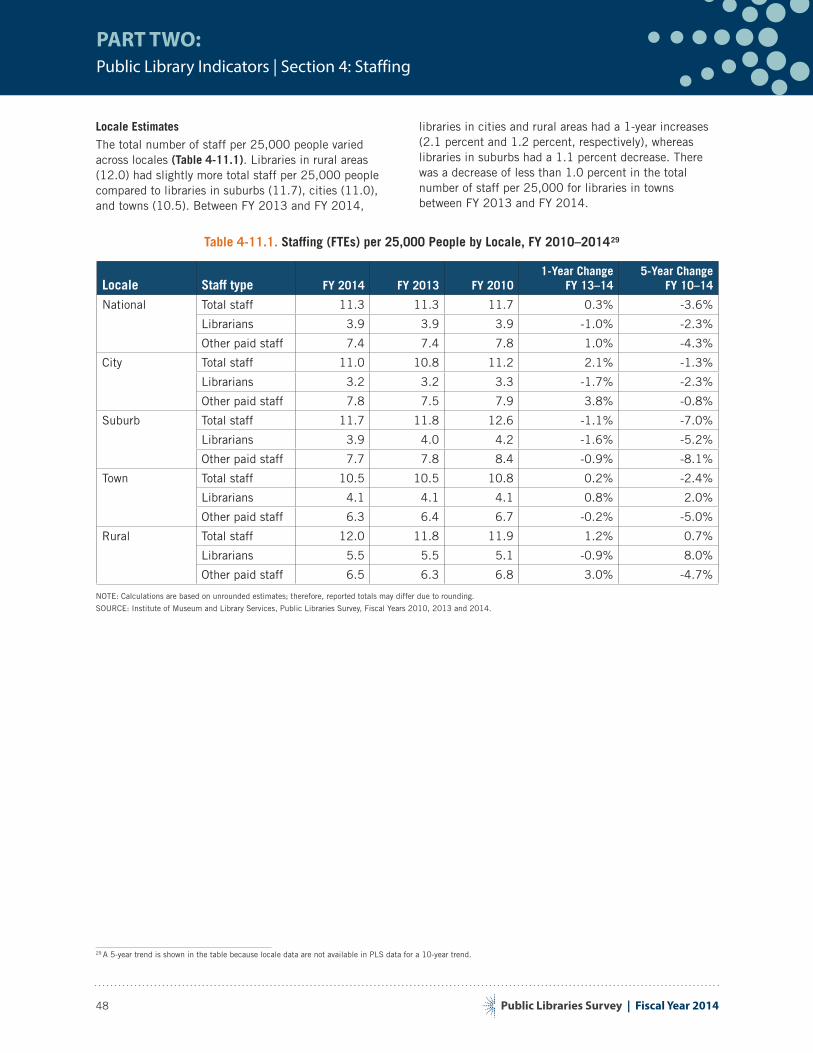
Public Libraries Survey | Fiscal Year 2014
PART TWO:Public Library Indicators | Section 4: Staffing
48
Locale Estimates
The total number of staff per 25,000 people varied across locales (Table 4-11.1). Libraries in rural areas (12.0) had slightly more total staff per 25,000 people compared to libraries in suburbs (11.7), cities (11.0), and towns (10.5). Between FY 2013 and FY 2014,
libraries in cities and rural areas had a 1-year increases (2.1 percent and 1.2 percent, respectively), whereas libraries in suburbs had a 1.1 percent decrease. There was a decrease of less than 1.0 percent in the total number of staff per 25,000 for libraries in towns between FY 2013 and FY 2014.
Table 4-11.1. Staffing (FTEs) per 25,000 People by Locale, FY 2010–201429
29 A 5-year trend is shown in the table because locale data are not available in PLS data for a 10-year trend.
Locale Staff type FY 2014 FY 2013 FY 20101-Year Change
FY 13–145-Year Change
FY 10–14
National Total staff 11.3 11.3 11.7 0.3% -3.6%
Librarians 3.9 3.9 3.9 -1.0% -2.3%
Other paid staff 7.4 7.4 7.8 1.0% -4.3%
City Total staff 11.0 10.8 11.2 2.1% -1.3%
Librarians 3.2 3.2 3.3 -1.7% -2.3%
Other paid staff 7.8 7.5 7.9 3.8% -0.8%
Suburb Total staff 11.7 11.8 12.6 -1.1% -7.0%
Librarians 3.9 4.0 4.2 -1.6% -5.2%
Other paid staff 7.7 7.8 8.4 -0.9% -8.1%
Town Total staff 10.5 10.5 10.8 0.2% -2.4%
Librarians 4.1 4.1 4.1 0.8% 2.0%
Other paid staff 6.3 6.4 6.7 -0.2% -5.0%
Rural Total staff 12.0 11.8 11.9 1.2% 0.7%
Librarians 5.5 5.5 5.1 -0.9% 8.0%
Other paid staff 6.5 6.3 6.8 3.0% -4.7%
NOTE: Calculations are based on unrounded estimates; therefore, reported totals may differ due to rounding.
SOURCE: Institute of Museum and Library Services, Public Libraries Survey, Fiscal Years 2010, 2013 and 2014.
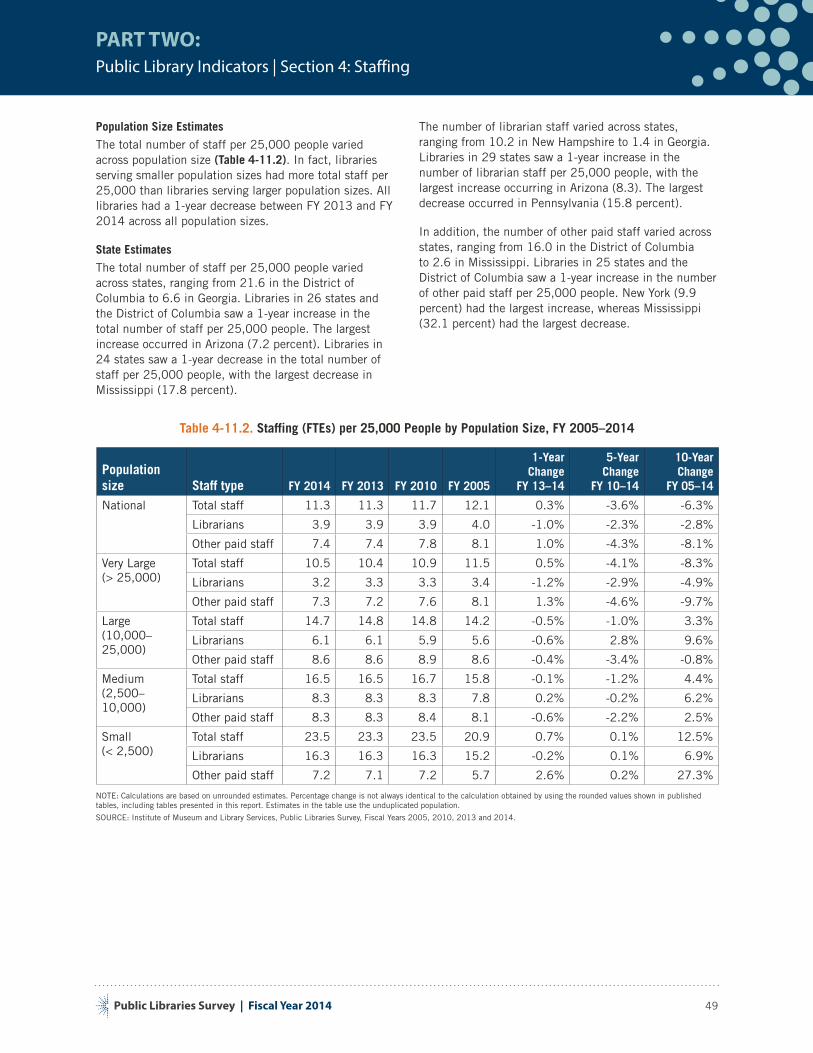
Public Libraries Survey | Fiscal Year 2014
PART TWO:Public Library Indicators | Section 4: Staffing
49
Population Size Estimates
The total number of staff per 25,000 people varied across population size (Table 4-11.2). In fact, libraries serving smaller population sizes had more total staff per 25,000 than libraries serving larger population sizes. All libraries had a 1-year decrease between FY 2013 and FY 2014 across all population sizes.
State Estimates
The total number of staff per 25,000 people varied across states, ranging from 21.6 in the District of Columbia to 6.6 in Georgia. Libraries in 26 states and the District of Columbia saw a 1-year increase in the total number of staff per 25,000 people. The largest increase occurred in Arizona (7.2 percent). Libraries in 24 states saw a 1-year decrease in the total number of staff per 25,000 people, with the largest decrease in Mississippi (17.8 percent).
The number of librarian staff varied across states, ranging from 10.2 in New Hampshire to 1.4 in Georgia. Libraries in 29 states saw a 1-year increase in the number of librarian staff per 25,000 people, with the largest increase occurring in Arizona (8.3). The largest decrease occurred in Pennsylvania (15.8 percent).
In addition, the number of other paid staff varied across states, ranging from 16.0 in the District of Columbia to 2.6 in Mississippi. Libraries in 25 states and the District of Columbia saw a 1-year increase in the number of other paid staff per 25,000 people. New York (9.9 percent) had the largest increase, whereas Mississippi (32.1 percent) had the largest decrease.
Table 4-11.2. Staffing (FTEs) per 25,000 People by Population Size, FY 2005–2014
Population size Staff type FY 2014 FY 2013 FY 2010 FY 2005
1-Year Change
FY 13–14
5-Year Change
FY 10–14
10-Year Change
FY 05–14
National Total staff 11.3 11.3 11.7 12.1 0.3% -3.6% -6.3%
Librarians 3.9 3.9 3.9 4.0 -1.0% -2.3% -2.8%
Other paid staff 7.4 7.4 7.8 8.1 1.0% -4.3% -8.1%
Very Large (> 25,000)
Total staff 10.5 10.4 10.9 11.5 0.5% -4.1% -8.3%
Librarians 3.2 3.3 3.3 3.4 -1.2% -2.9% -4.9%
Other paid staff 7.3 7.2 7.6 8.1 1.3% -4.6% -9.7%
Large (10,000–25,000)
Total staff 14.7 14.8 14.8 14.2 -0.5% -1.0% 3.3%
Librarians 6.1 6.1 5.9 5.6 -0.6% 2.8% 9.6%
Other paid staff 8.6 8.6 8.9 8.6 -0.4% -3.4% -0.8%
Medium (2,500–10,000)
Total staff 16.5 16.5 16.7 15.8 -0.1% -1.2% 4.4%
Librarians 8.3 8.3 8.3 7.8 0.2% -0.2% 6.2%
Other paid staff 8.3 8.3 8.4 8.1 -0.6% -2.2% 2.5%
Small (< 2,500)
Total staff 23.5 23.3 23.5 20.9 0.7% 0.1% 12.5%
Librarians 16.3 16.3 16.3 15.2 -0.2% 0.1% 6.9%
Other paid staff 7.2 7.1 7.2 5.7 2.6% 0.2% 27.3%
NOTE: Calculations are based on unrounded estimates. Percentage change is not always identical to the calculation obtained by using the rounded values shown in published tables, including tables presented in this report. Estimates in the table use the unduplicated population.
SOURCE: Institute of Museum and Library Services, Public Libraries Survey, Fiscal Years 2005, 2010, 2013 and 2014.
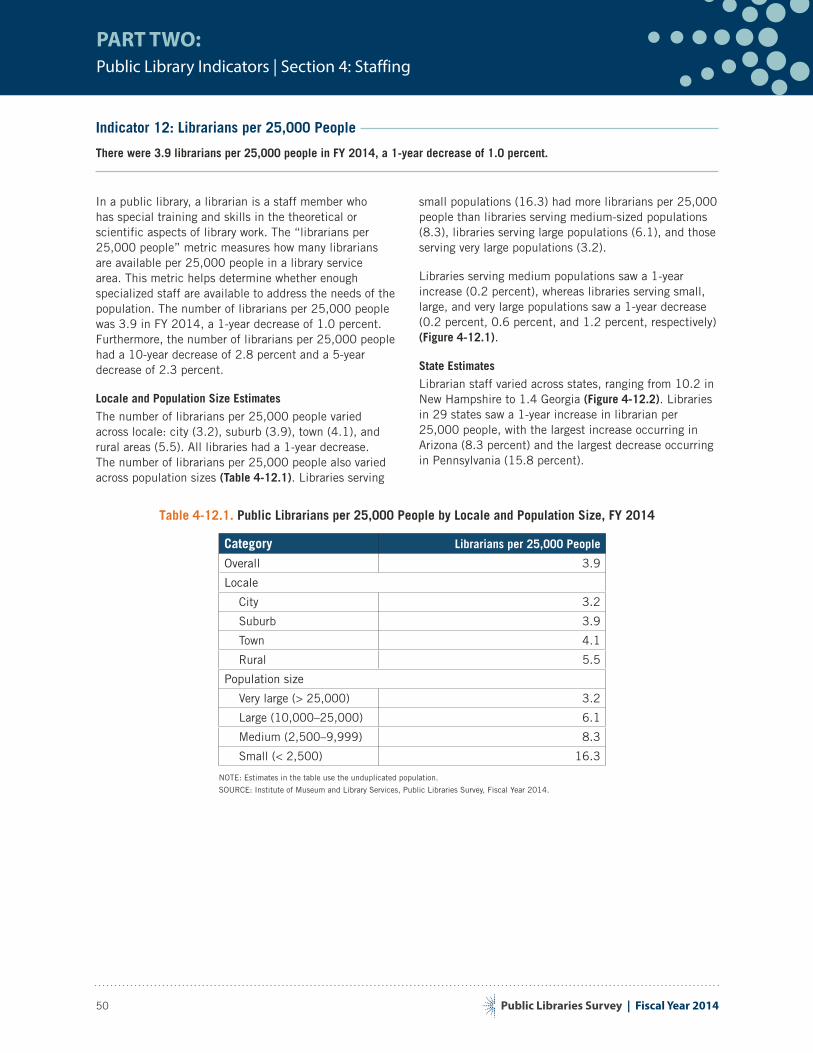
Public Libraries Survey | Fiscal Year 2014
PART TWO:Public Library Indicators | Section 4: Staffing
50
Indicator 12: Librarians per 25,000 People
There were 3.9 librarians per 25,000 people in FY 2014, a 1-year decrease of 1.0 percent.
In a public library, a librarian is a staff member who has special training and skills in the theoretical or scientific aspects of library work. The “librarians per 25,000 people” metric measures how many librarians are available per 25,000 people in a library service area. This metric helps determine whether enough specialized staff are available to address the needs of the population. The number of librarians per 25,000 people was 3.9 in FY 2014, a 1-year decrease of 1.0 percent. Furthermore, the number of librarians per 25,000 people had a 10-year decrease of 2.8 percent and a 5-year decrease of 2.3 percent.
Locale and Population Size Estimates
The number of librarians per 25,000 people varied across locale: city (3.2), suburb (3.9), town (4.1), and rural areas (5.5). All libraries had a 1-year decrease. The number of librarians per 25,000 people also varied across population sizes (Table 4-12.1). Libraries serving
small populations (16.3) had more librarians per 25,000 people than libraries serving medium-sized populations (8.3), libraries serving large populations (6.1), and those serving very large populations (3.2).
Libraries serving medium populations saw a 1-year increase (0.2 percent), whereas libraries serving small, large, and very large populations saw a 1-year decrease (0.2 percent, 0.6 percent, and 1.2 percent, respectively) (Figure 4-12.1).
State Estimates
Librarian staff varied across states, ranging from 10.2 in New Hampshire to 1.4 Georgia (Figure 4-12.2). Libraries in 29 states saw a 1-year increase in librarian per 25,000 people, with the largest increase occurring in Arizona (8.3 percent) and the largest decrease occurring in Pennsylvania (15.8 percent).
Table 4-12.1. Public Librarians per 25,000 People by Locale and Population Size, FY 2014
Category Librarians per 25,000 People
Overall 3.9
Locale
City 3.2
Suburb 3.9
Town 4.1
Rural 5.5
Population size
Very large (> 25,000) 3.2
Large (10,000–25,000) 6.1
Medium (2,500–9,999) 8.3
Small (< 2,500) 16.3
NOTE: Estimates in the table use the unduplicated population.
SOURCE: Institute of Museum and Library Services, Public Libraries Survey, Fiscal Year 2014.
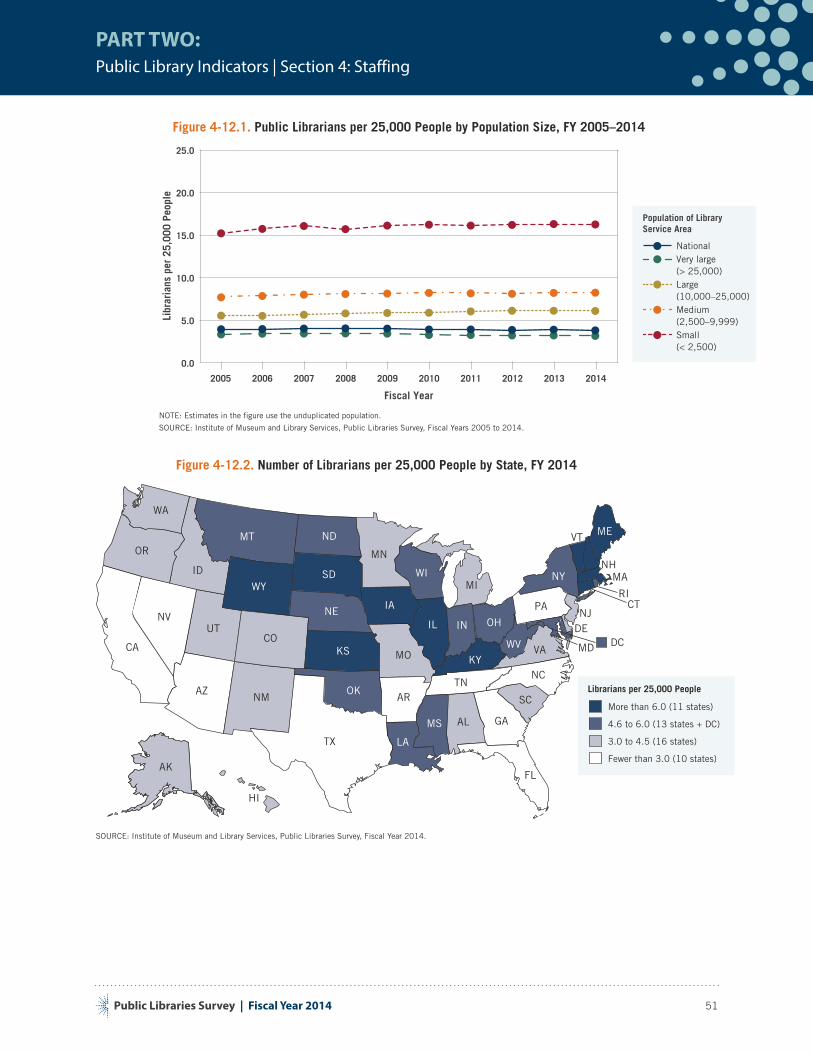
Public Libraries Survey | Fiscal Year 2014
PART TWO:Public Library Indicators | Section 4: Staffing
51
Public Librarians per 25,000 People by Population Size, FY 2005–2014Figure 4-12.1.
Population of LibraryService Area
Small(< 2,500)
Medium(2,500–9,999)
Large(10,000–25,000)
Very large(> 25,000)
National
0.0
5.0
10.0
15.0
20.0
25.0
2005 2006 2007 2008 2009 2010 2011 2012 2013 2014
Fiscal Year
Libr
aria
ns p
er 2
5,00
0 Pe
ople
NOTE: Estimates in the figure use the unduplicated population.
SOURCE: Institute of Museum and Library Services, Public Libraries Survey, Fiscal Years 2005 to 2014.
Figure 4-12.2. Number of Librarians per 25,000 People by State, FY 2014
Librarians per 25,000 People
Fewer than 3.0 (10 states)
3.0 to 4.5 (16 states)
More than 6.0 (11 states)
4.6 to 6.0 (13 states + DC)
DC DE UT
RI
WA
MT NDOR
ID
WYSD
CA
NV
COKS
NE
AZNM
OK
AK
MN
IA
MO
ARTN
NC
LA
FL
MS AL GA
WI
IL
KY
IN OH
WV
PA
NY
VA
MEVT
NH MA
CT
SC
MI
HI
NJ
TX
MD
SOURCE: Institute of Museum and Library Services, Public Libraries Survey, Fiscal Year 2014.
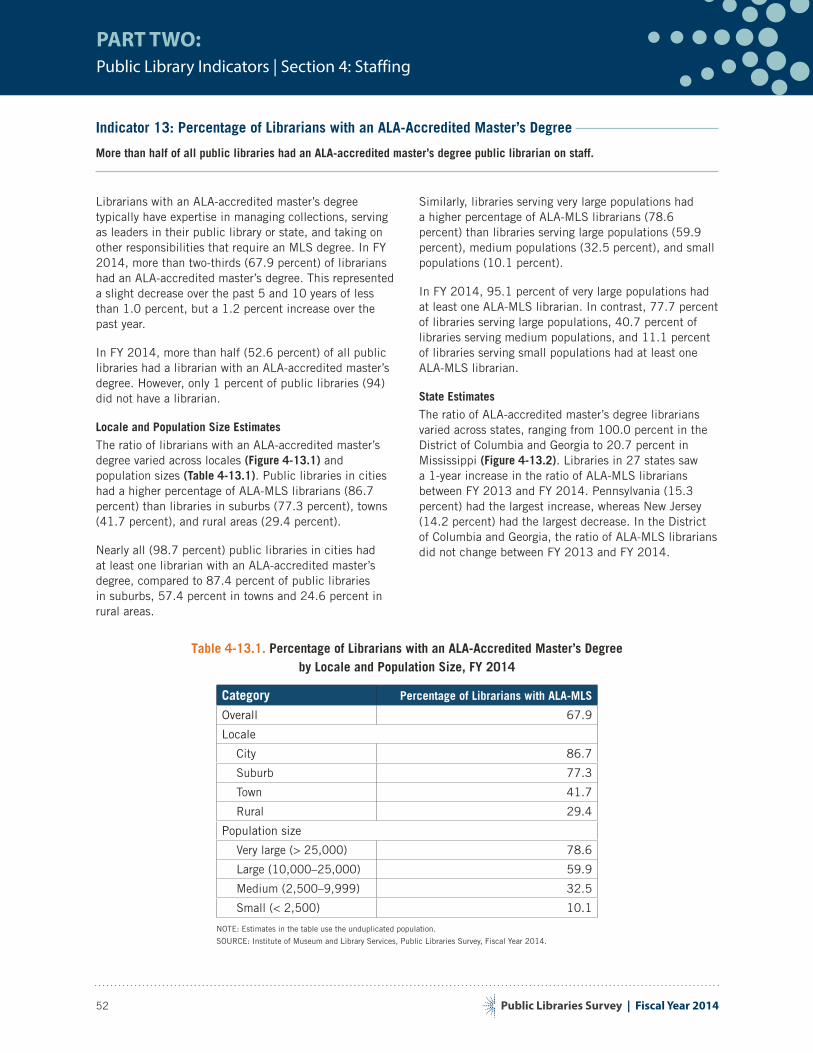
Public Libraries Survey | Fiscal Year 2014
PART TWO:Public Library Indicators | Section 4: Staffing
52
Indicator 13: Percentage of Librarians with an ALA-Accredited Master’s Degree
More than half of all public libraries had an ALA-accredited master’s degree public librarian on staff.
Librarians with an ALA-accredited master’s degree typically have expertise in managing collections, serving as leaders in their public library or state, and taking on other responsibilities that require an MLS degree. In FY 2014, more than two-thirds (67.9 percent) of librarians had an ALA-accredited master’s degree. This represented a slight decrease over the past 5 and 10 years of less than 1.0 percent, but a 1.2 percent increase over the past year.
In FY 2014, more than half (52.6 percent) of all public libraries had a librarian with an ALA-accredited master’s degree. However, only 1 percent of public libraries (94) did not have a librarian.
Locale and Population Size Estimates
The ratio of librarians with an ALA-accredited master’s degree varied across locales (Figure 4-13.1) and population sizes (Table 4-13.1). Public libraries in cities had a higher percentage of ALA-MLS librarians (86.7 percent) than libraries in suburbs (77.3 percent), towns (41.7 percent), and rural areas (29.4 percent).
Nearly all (98.7 percent) public libraries in cities had at least one librarian with an ALA-accredited master’s degree, compared to 87.4 percent of public libraries in suburbs, 57.4 percent in towns and 24.6 percent in rural areas.
Similarly, libraries serving very large populations had a higher percentage of ALA-MLS librarians (78.6 percent) than libraries serving large populations (59.9 percent), medium populations (32.5 percent), and small populations (10.1 percent).
In FY 2014, 95.1 percent of very large populations had at least one ALA-MLS librarian. In contrast, 77.7 percent of libraries serving large populations, 40.7 percent of libraries serving medium populations, and 11.1 percent of libraries serving small populations had at least one ALA-MLS librarian.
State Estimates
The ratio of ALA-accredited master’s degree librarians varied across states, ranging from 100.0 percent in the District of Columbia and Georgia to 20.7 percent in Mississippi (Figure 4-13.2). Libraries in 27 states saw a 1-year increase in the ratio of ALA-MLS librarians between FY 2013 and FY 2014. Pennsylvania (15.3 percent) had the largest increase, whereas New Jersey (14.2 percent) had the largest decrease. In the District of Columbia and Georgia, the ratio of ALA-MLS librarians did not change between FY 2013 and FY 2014.
Table 4-13.1. Percentage of Librarians with an ALA-Accredited Master’s Degree by Locale and Population Size, FY 2014
Category Percentage of Librarians with ALA-MLS
Overall 67.9
Locale
City 86.7
Suburb 77.3
Town 41.7
Rural 29.4
Population size
Very large (> 25,000) 78.6
Large (10,000–25,000) 59.9
Medium (2,500–9,999) 32.5
Small (< 2,500) 10.1
NOTE: Estimates in the table use the unduplicated population.
SOURCE: Institute of Museum and Library Services, Public Libraries Survey, Fiscal Year 2014.
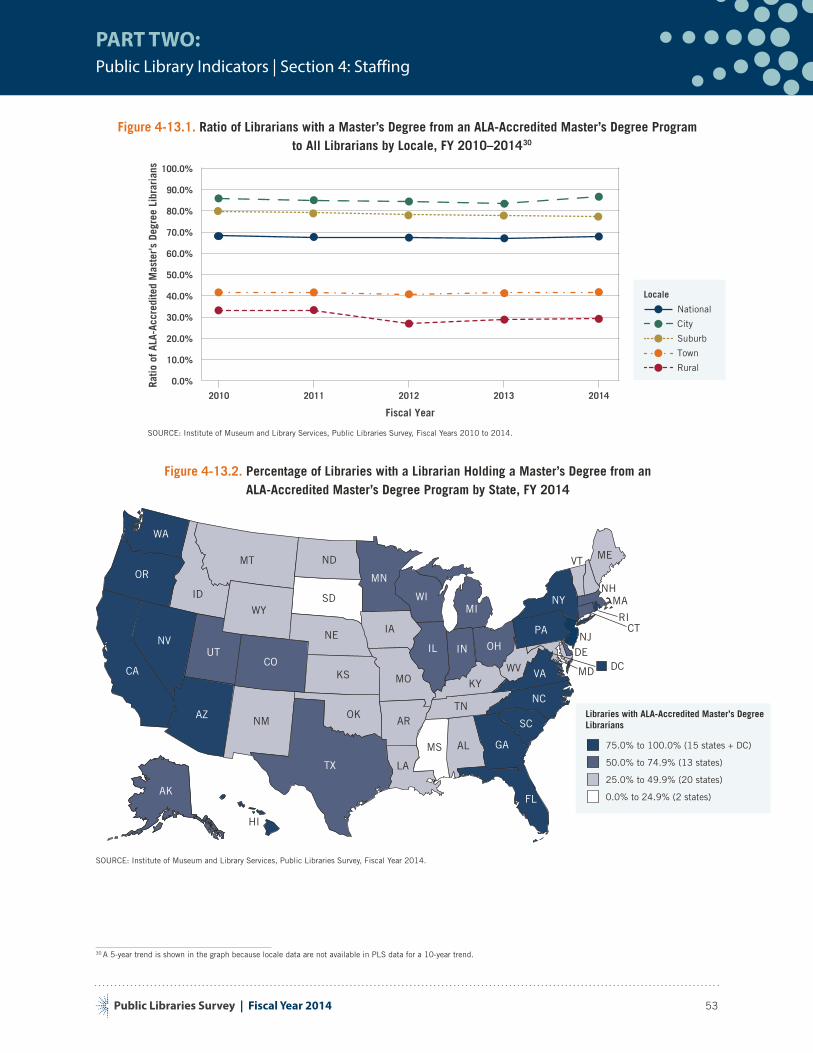
Public Libraries Survey | Fiscal Year 2014
PART TWO:Public Library Indicators | Section 4: Staffing
53
Figure 4-13.1. Ratio of Librarians with a Master’s Degree from an ALA-Accredited Master’s Degree Program to All Librarians by Locale, FY 2010–201430
30 A 5-year trend is shown in the graph because locale data are not available in PLS data for a 10-year trend.
Fiscal Year
2010 2011 2012 2013 2014
Locale
Rural
Town
Suburb
City
National
Ratio
of A
LA-A
ccre
dite
d M
aste
r's D
egre
e Li
brar
ians
0.0%
10.0%
20.0%
30.0%
40.0%
50.0%
60.0%
70.0%
80.0%
90.0%
100.0%
SOURCE: Institute of Museum and Library Services, Public Libraries Survey, Fiscal Years 2010 to 2014.
Figure 4-13.2. Percentage of Libraries with a Librarian Holding a Master’s Degree from an ALA-Accredited Master’s Degree Program by State, FY 2014
Libraries with ALA-Accredited Master’s Degree Librarians
75.0% to 100.0% (15 states + DC)
0.0% to 24.9% (2 states)
25.0% to 49.9% (20 states)
50.0% to 74.9% (13 states)
DC DE UT
RI
WA
MT NDOR
ID
WYSD
CA
NV
COKS
NE
AZNM
OK
AK
MN
IA
MO
ARTN
NC
LA
FL
MS AL GA
WI
IL
KY
IN OH
WV
PA
NY
VA
MEVT
NH MA
CT
SC
MI
HI
NJ
TX
MD
SOURCE: Institute of Museum and Library Services, Public Libraries Survey, Fiscal Year 2014.

APPENDICES:Appendix A. About the Public Libraries SurveyAppendix B. Technical Notes
Public Libraries Survey | Fiscal Year 2014
APPENDIX A: About the Public Libraries Survey
56
Appendix A: About the Public Libraries Survey
About the Public Libraries SurveyThe PLS is a voluntary survey conducted annually by IMLS. IMLS collects these data under the mandate in the Museum and Library Services Act of 2010, as stated in Section 210. The U.S. Census Bureau is the data collection agent for IMLS. The FY 2014 survey is the 27th in the series.
History of the Public Libraries SurveyIn 1985, the National Center for Education Statistics (NCES) and the ALA conducted a pilot project in 15 states to assess the feasibility of a federal-state cooperative program for the collection of public library data. The project was jointly funded by NCES and the U.S. Department of Education’s former Library Programs office. In 1987, the project’s final report recommended the development of a nationwide data collection system. The Hawkins-Stafford Elementary and Secondary School Improvement Amendments of 1988 (P.L. 100-297) tasked NCES with developing a voluntary FSCS for the annual collection of public library data.1
1 The Hawkins-Stafford Elementary and Secondary School Improvement Amendments of 1988 (P.L. 100-297) was superseded by the National Education Statistics Act of 1994 (P.L. 103-382) and, more recently, by the Education Sciences Reform Act of 2002.
To carry out this mandate, a task force was formed by NCES and the National Commission on Libraries and Information Science, and the FSCS was established in 1988.
The first survey report in this series, Public Libraries in 50 States and the District of Columbia: 1989, which includes data from 8,699 public libraries in 50 states and the District of Columbia, was released by NCES in 1991. Since then, a data file and survey report have been released annually. The states have always submitted their data electronically via customized, personal computer survey software through FY 2004 and via a web-based application beginning in FY 2005.
The Museum and Library Services Act transferred the Library Programs office, including the library statistics program, from the Department of Education to IMLS. On October 1, 2007, the survey was transferred from NCES to IMLS. The FY 2006 survey was collected by NCES and released by IMLS. The FY 2014 survey is the eighth PLS data collection released by IMLS.
Survey Purpose and Data Items Included in This ReportThe PLS provides a national census of public libraries and their public service outlets (see the “Key Library Terminology” section of this report). These data
are useful to federal, state, and local policymakers; library and public policy researchers; and the public, journalists, and others. This report provides summary information about public libraries in the 50 states and the District of Columbia for FY 2014.2
2 The fiscal year reporting period varied among states and among local jurisdictions in some states. Please see “Reporting Period” in Appendix B, Note 1, for more information.
It covers service measures such as number of uses (sessions) of public Internet computers, number of Internet computers used by the general public, reference transactions, interlibrary loans, circulation, library visits, children’s program attendance, and circulation of children’s materials. This report also includes information about collection size, staffing, operating revenue and expenditures, type of legal basis, and number and type of public library service outlets. This report is based on the final data file. Appendix B, Note 1 provides detailed information about the data and methods for FY 2014.
Congressional AuthorizationTwo separate laws cover the protection of the confidentiality of individually identifiable information collected by the IMLS—the Privacy Act of 1974 and the E-Government Act of 2002. The Guidelines for Ensuring and Maximizing the Quality, Objectivity, Utility, and Integrity of Information Disseminated by the IMLS were prepared under the Treasury and General Government Appropriations Act for Fiscal Year 2001, Section 515(b). IMLS collects these data as authorized by its congressional mandate, the Museum and Library Services Act of 2010, as stated in 20 U.S.C. Section 9108 (Policy research, analysis, data collection, and dissemination):
20 U.S.C. Section 9108. Policy research, analysis, data collection, and dissemination(a) In general
The Director shall annually conduct policy research, analysis, and data collection to extend and improve the Nation’s museum, library, and information services.
(b) Requirements
The policy research, analysis, and data collection shall be conducted in ongoing collaboration (as determined appropriate by the Director), and in consultation, with—
(1) State library administrative agencies;
(2) National, State, and regional library and museum organizations;
(3) Other relevant agencies and organizations.
Public Libraries Survey | Fiscal Year 2014
APPENDIX A: About the Public Libraries Survey
57
(c) Objectives
The policy research, analysis, and data collection shall be used to—
(1) Identify national needs for and trends in museum, library, and information services;
(2) Measure and report on the impact and effectiveness of museum, library, and information services throughout the United States, including the impact of Federal programs authorized under this chapter;
(3) Identify best practices; and
(4) Develop plans to improve museum, library, and information services of the United States and to strengthen national, State, local, regional, and international communications and cooperative networks.
(d) Dissemination
Each year, the Director shall widely disseminate, as appropriate to accomplish the objectives under subsection (c), the results of the policy research, analysis, and data collection carried out under this section.
IMLS library survey activities will be designed to address high-priority library data needs; provide consistent, reliable, complete, and accurate indicators of the status and trends of State and public libraries; and report timely, useful, and high-quality data to the U.S. Congress, the States, other education policymakers, practitioners, data users, and the general public.
Key Library Terminology3
3 More detailed definitions of the terms used in this report can be found in the data documentation, Data File Documentation: Public Libraries Survey: Fiscal Year 2014. The data documentation is available for download from the IMLS website: www.imls.gov.
Public library. A public library is an entity that is established under state-enabling laws or regulations to serve a community, district, or region, and that provides at least the following: (1) an organized collection of printed or other library materials, or a combination thereof; (2) paid staff; (3) an established schedule in which services of the staff are available to the public; (4) the facilities necessary to support such a collection, staff, and schedule; and (5) support in whole or in part with public funds.
Administrative entity. An administrative entity is the agency that is legally established under local or state law to provide public library service to the population of a local jurisdiction. The administrative entity may have a single public library service outlet, or it may have more than one public library service outlet. (Note: In this report, the term public library means an administrative entity.)
Public library service outlet. Public libraries may have one or more outlets that provide direct services to the public. This report includes information on three types of public library service outlets: central library outlets, branch library outlets, and bookmobile outlets. Information on a fourth type of outlet, books-by-mail-only outlets, was collected but omitted from this report because these outlets are not open to the public.
Supplemental TablesAs a supplement to this report, IMLS has provided 47 tables to make available additional data about the findings in this report. These tables offer both national- and state-level statistics for variables presented in this report, as well as for additional variables found in the PLS data files. Tables 1 through 1B provide overview data by state about the number of public libraries and the population of the legal service areas. Tables 2 through 31 appear in sets of two each. The base table in each set (Tables 2 through 31) displays data for the nation as a whole and for each of the 50 states and the District of Columbia. The “A” table in each set displays the same data by 11 ranges of population of legal service area. Tables 32 through 35 include data about public library size. Tables 36 through 47 provide state rankings on key variables. The supplemental tables are available online only at www.imls.gov.
Survey Questionnaire and Data ElementsThe questionnaire for the PLS is developed in partnership between IMLS and its stakeholders in the library community, specifically the Library Statistics Working Group and the SDCs. The questionnaire used in the FY 2014 survey is published in the data documentation, Data File Documentation: Public Libraries Survey: Fiscal Year 2014, available at www.imls.gov. In addition to the survey, the data documentation provides definitions of items, including those used in this report.
Public Libraries Survey | Fiscal Year 2014
APPENDIX B:Technical Notes
58
Appendix B: Technical Notes
Note 1. Public Libraries Survey, FY 2014Survey Universe
The PLS is a universe survey. Unlike sample surveys, which collect data from a portion of the population, universe surveys collect data from the entire population. In FY 2014, the survey frame consisted of 9,295 public libraries (9,233 public libraries in the 50 states and the District of Columbia and 62 public libraries in the outlying areas of American Samoa, Guam, the Northern Mariana Islands, Puerto Rico and the U.S. Virgin Islands), as identified by state library agencies. The frame consisted of all libraries that were not reported as closed in the prior year (e.g., FY 2013), plus any changes registered with IMLS outside of the prior data collection period. States reported changes to the frame as part of the FY 2014 data collection. Coverage and other forms of non-sampling errors are discussed in the Non-sampling Errors section below.
The survey frame includes 166 public libraries that do not meet all the criteria outlined in the FSCS Public Library Definition (see item 203 of the “Administrative Entity” definitions for the criteria). Military libraries that provide public library service and libraries that serve residents of institutions are not included in the survey frame. The FY 2014 public-use data file also includes 10 records for public libraries that were closed or temporarily closed in FY 2014, but these are generally not considered to be part of the survey frame.
Data Collection
The FY 2014 PLS began collecting data from states, 50 states, the District of Columbia, and outlying territories in December 2014. States were placed into one of three reporting groups (with survey due dates of April 8, July 29, or August 19, 2015) based on their fiscal cycle or claim of extraordinary reporting hardship. State data coordinators–were contacted by email and asked to report their data over the Internet via WebPLUS, a Web-based application developed by the Census Bureau (the data collection agent). Edit follow-up was completed in late 2015. The editing process is described in the “Editing” subsection below. The survey was conducted in English.
Survey Response
Unit response. A total of 9,053 of 9,295 public libraries in the survey frame responded to the FY 2014 PLS,1
1 Including American Samoa, Guam, and Puerto Rico.
for a unit response rate of 97.4 percent. Unit respondents
are defined as public libraries for which the population of the legal service area and at least three of the five following items are reported: total number of paid employees, total operating revenue, total operating expenditures, total number of print materials, and total circulation.2
2 Note: Some individual survey items, such as population of legal service area, service outlets, and type of legal basis have a 100.0 percent response rate because the state library agency provided these data for all public libraries in their state.
All response rates calculated using American Association for Public Opinion Research (AAPOR) Response Rate #2.
Total response. The base for calculating response rates to individual survey items is the total number of libraries in the survey frame, including unit nonrespondents.
Data file and reported numbers of public libraries. PLS data files and publication tables report different numbers of public libraries. Public libraries in outlying areas and libraries that do not meet FSCS public library definitions are treated differently between the data files and publication tables, as follows:
1. Libraries that do not meet FSCS public library definitions are included on the data files but excluded from publication tables and national totals.
2. Responding public libraries in outlying areas are, whenever possible, included in both the data files and publication tables; however, national totals in publication tables include only the 50 states and the District of Columbia, and exclude outlying areas and libraries that do not meet the FSCS public library definition.
3. Nonresponding public libraries in outlying areas are included in data files but not in the publication tables or national totals.
4. Due to low response rates and missing data, Puerto Rico’s responding public libraries are included in the data files but excluded from publication tables.
Reporting period. The FY 2014 PLS requested data for state fiscal year 2014. Most state fiscal years encompass either a calendar year or July to June. In some states, the FY reporting period varies among local jurisdictions. These states are listed in the “Other” column in Table B-1.2. Regardless, most public libraries provided data for at least a 12-month period. The FY starting date and ending date of each public library are included on the data file.
Public Libraries Survey | Fiscal Year 2014
APPENDIX B:Technical Notes
59
Calculations Included in the Tables
Selected tables include per capita values for some items and “per 1,000 population” or “per 5,000 population” values for others. Scales (per capita, per 1,000, etc.) were selected to provide the clearest display of differences across categories in the data. The calculations are based on the total, unduplicated population of legal service areas (instead of the total population of legal service areas) to eliminate duplicative reporting as a result of overlapping service areas. The state population estimate was not used as the basis for the calculations because some states have unserved populations. See the “Population items” subsection below for more information.
Questionnaire
The questionnaire used in the FY 2014 survey is published in the data documentation, Data File Documentation Public Libraries Survey: Fiscal Year 2014, available at www.imls.gov. In addition to the survey, the data documentation provides definitions of items, including those used in this report. A few key survey items are discussed next.
Library visits and reference transactions. Public libraries reported annual library visits and annual reference transactions based on actual counts, if available. Otherwise, annual estimates were provided based on library visits and reference transaction activity during a typical week in October, multiplied by 52.
Population items. The PLS has three population items: (1) Population of Legal Service Area for each publiclibrary, (2) Total Unduplicated Population of LegalService Areas for each state, and (3) State TotalPopulation Estimate. The population data are providedby the state library agency. The methods of calculationof the first two items vary among states, and the statereporting periods also vary. The Total UnduplicatedPopulation of Legal Service Areas does not includeunserved areas and may vary from data provided bysources using standard methodology (e.g., the CensusBureau).
The total Population of Legal Service Area for all public libraries in a state may exceed the state’s Total Unduplicated Population of Legal Service Areas or the State Total Population Estimate. This happens in states in which there are overlaps in population of legal service areas served by individual libraries, resulting in the same population being counted twice. Twenty-nine states had such overlapping service areas in FY 2012 (Table B-1.1).
To enable meaningful state comparisons using total Population of Legal Service Area data (for example, the number of print materials per capita), the Population of Legal Service Area data were adjusted to eliminate duplicative reporting as a result of overlapping service areas. The Public Library Data File includes a derived, unduplicated Population of Legal Service Area value for each library for this purpose (the variable is called POPU_UND). This value was prorated for each library by calculating the ratio of a library’s Population of Legal Service Area (POPU_LSA) to the state’s total Population of Legal Service Area (POPU_UND) and applying the ratio to the state’s Total Unduplicated Population of Legal Service Areas (POPU-UND). The latter item (POPU_UND) is a single, state-reported figure found in the Public Library State Summary/State Characteristics Data File.)
Paid, Full-Time-Equivalent Staff. Paid staff were reported in FTEs. To ensure comparable data, 40 hours was set as the measure of full-time employment (for example, 60 hours per week of part-time work by employees in a staff category divided by the 40-hour measure equals 1.50 FTEs). FTE data were reported to two decimal places (rounded to one decimal place in the tables).
Caveats for Data Use
The data include imputations, at the unit and item levels, for nonresponding libraries. See the “Imputation” section on the next page for a discussion of the imputation methodology. Comparisons to data prior to FY 1992 should be made with caution because earlier data do not include imputations for nonresponse, and the percentage of libraries responding to a given item varied widely among the states.
State data comparisons should be made with caution because of differences in reporting periods (Table B-1.2) and adherence to survey definitions. The definitions used by some states in collecting data from their public libraries may not be consistent with the PLS definitions.
The District of Columbia, although not a state, is included in this report. Special care should be used in comparing data for a city to those for a state. Caution also should be used in comparing Hawaii’s data to those of other states because all public library data in Hawaii are reported under one entity, the Hawaii State Public Library System.
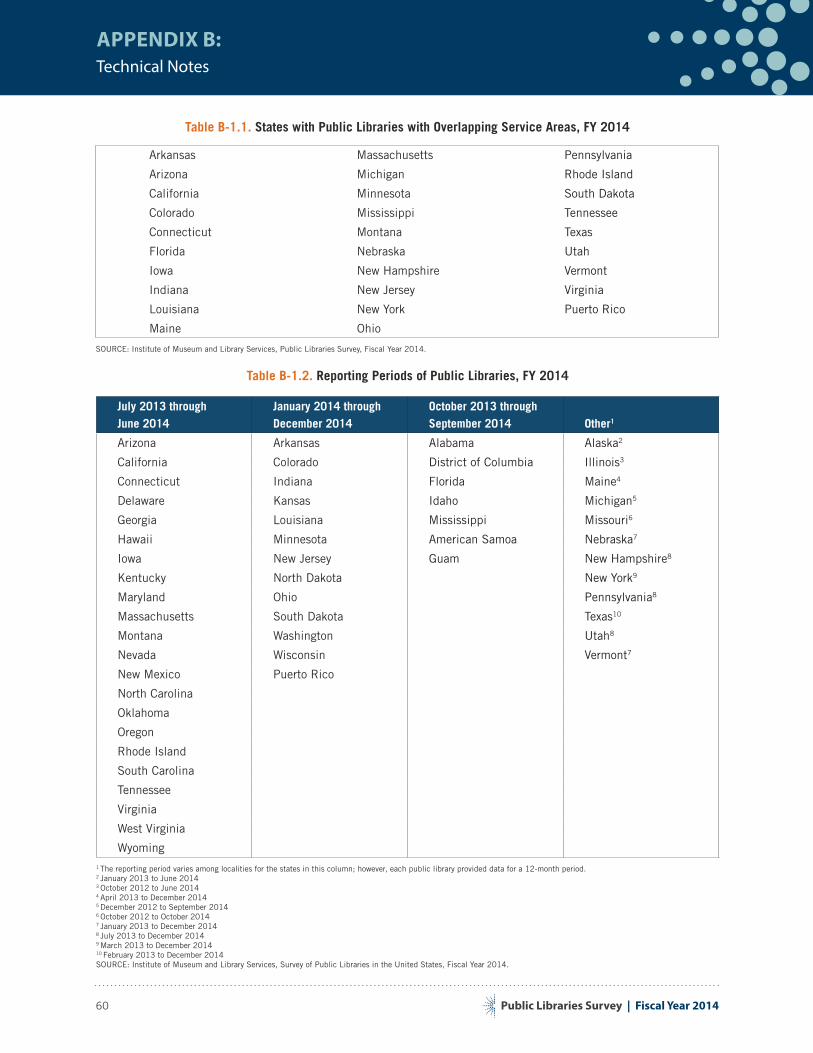
Public Libraries Survey | Fiscal Year 2014
APPENDIX B:
60
Technical Notes
Table B-1.1. States with Public Libraries with Overlapping Service Areas, FY 2014
Arkansas Massachusetts Pennsylvania
Arizona Michigan Rhode Island
California Minnesota South Dakota
Colorado Mississippi Tennessee
Connecticut Montana Texas
Florida Nebraska Utah
Iowa New Hampshire Vermont
Indiana New Jersey Virginia
Louisiana New York Puerto Rico
Maine Ohio
SOURCE: Institute of Museum and Library Services, Public Libraries Survey, Fiscal Year 2014.
Table B-1.2. Reporting Periods of Public Libraries, FY 2014
July 2013 through June 2014
January 2014 through December 2014
October 2013 through September 2014 Other1
Arizona Arkansas Alabama Alaska2
California Colorado District of Columbia Illinois3
Connecticut Indiana Florida Maine4
Delaware Kansas Idaho Michigan5
Georgia Louisiana Mississippi Missouri6
Hawaii Minnesota American Samoa Nebraska7
Iowa New Jersey Guam New Hampshire8
Kentucky North Dakota New York9
Maryland Ohio Pennsylvania8
Massachusetts South Dakota Texas10
Montana Washington Utah8
Nevada Wisconsin Vermont7
New Mexico Puerto Rico
North Carolina
Oklahoma
Oregon
Rhode Island
South Carolina
Tennessee
Virginia
West Virginia
Wyoming1 The reporting period varies among localities for the states in this column; however, each public library provided data for a 12-month period.2 January 2013 to June 20143 October 2012 to June 20144 April 2013 to December 20145 December 2012 to September 20146 October 2012 to October 20147 January 2013 to December 20148 July 2013 to December 20149 March 2013 to December 201410 February 2013 to December 2014SOURCE: Institute of Museum and Library Services, Survey of Public Libraries in the United States, Fiscal Year 2014.
Public Libraries Survey | Fiscal Year 2014
APPENDIX B:Technical Notes
61
Editing
State level. The respondent generates an edit report following direct data entry or import of their data into WebPLUS. The edit report, which may be viewed on-screen or printed, is used to identify and correct any errors, and to confirm the accuracy of data that generated edit warnings but required no change, before the final file is submitted to the Census Bureau.
In the FY 2014 PLS, four types of edit checks were performed:
1. Relational edit checks;
2. Out-of-range edit checks;
3. Arithmetic edit checks; and
4. Blank, zero, or invalid data edit checks.
For more information on edit checks, see the PLS FY 2014 Data Documentation.
The WebPLUS application generates state summary tables (showing state totals for all numeric data items) and single-library tables (showing data for individual public libraries in a state). State item response tables also are generated. Respondents were encouraged to review the tables for data quality issues before submitting their data to IMLS. State data submissions also included a signed form from the Chief Officer of the State Library Agency certifying the accuracy of the data.
National level. The Census Bureau and IMLS, working closely with the PLS SDCs, reviewed and edited the state data submissions.
Imputation
Imputation is a procedure for estimating a value for a specific data item in which the response is missing. This section describes the imputation methods that were used to fill in the missing data items for the FY 2014 survey year. In total, 42 items were imputed.
The responding and nonresponding libraries were sorted into imputation cells based on OBE (Bureau of Economic Analysis; formerly Office of Business Economics) region code and the size of the population. Each state is assigned an OBE region code (e.g., 01–New England [CT, ME, MA, NH, RI, VT]). The cumulative root frequency method3
3 For more information on cumulative root frequency method, see Cochran, W. (1977). Sampling techniques, 3rd edition. John Wiley & Sons, Inc.
was used to determine the imputation cells.
The imputation for nonresponding libraries was performed using the data calculated from respondents in their imputation cells. Item imputation was performed on
each record with nonresponsive variables. Following are descriptions of each imputation method used for the PLS.
Imputations were performed in two stages. In the first stage, imputations were carried out for nearly all missing values using the following methods: prior year times mean growth rate, adjusted cell mean, cell mean, prior year ratio, cell median ratio, direct substitution of prior year data, cell median, and special imputations. In the second stage, imputed values were adjusted for some missing values (based on the variable) using the following methods: obtained value by relationship of total to detail items, raking, special imputations, and consistency checks.
Non-sampling Errors
Because all units in the universe are surveyed, the data are not subject to sampling error; however, they are subject to non-sampling errors, such as errors in response, nonresponse errors, coverage errors arising from an incomplete listing of public libraries, coding errors, or processing errors.
Every effort is made to mitigate such errors. The editing efforts described above are designed to decrease the number of errors resulting from inaccurate responses or processing problems. Imputation lessens the effect of nonresponse. Efforts are made to obtain complete listings of public libraries from the state library agencies. Although such efforts are made, some non-sampling errors likely remain in the data.
Undercoverage errors are estimated to be minimal because states are incentivized to register new libraries with IMLS to access discounts provided through the Universal Service Schools and Libraries Program (more commonly known as E-rate), as well as other benefits afforded to public libraries (e.g., Tech Soup). Overcoverage occurs when libraries are not reported as closed. In addition, overcoverage will occur if data users do not account for libraries in the dataset that do not meet the definition of a public library developed by the FSCS.
Measurement errors are associated with data entry errors, significant structure changes, and complex concepts. There are no formal studies that estimate bias and variance due to measurement errors for PLS.
Unit nonresponse, which is measured at the library level, has minimal bias due to high response rates in the 50 states, but there may be high nonresponse bias in outlying territories due to non-reporting.
Public Libraries Survey | Fiscal Year 2014
APPENDIX B:Technical Notes
62
Item nonresponse rates were generally low. Bias due to item nonresponse bias may be higher for items that are consistently missing data from certain libraries and outlets over multiple years. Newly added items are subject to higher rates of item nonresponse.
Processing errors are considered average for PLS administrative data collection because no reported data values are changed during data processing. Processing errors exist in edit check and imputation processes and depend on the quality of prior years’ data.
Efforts are being made to mitigate such errors and to obtain complete listings of public libraries from state library administrative agencies. Imputation lessens the effect of non-response bias. Editing was designed to decrease the number of errors due to inaccurate responses or processing problems.
Note: Errors in response to the audio and video downloadables data were confirmed by some states. The data were incorrectly reported as “units” instead of “titles.” The incorrect data for these states were deleted from the data files.
Note 2. Commonly Used MeasuresThis report presents statistics for metrics related to aspects of financial, operational, and service activities in public libraries in the United States. National-level summaries of these metrics are presented for FY 2014, and 5- and 10-year trends are presented for many metrics from FY 2004 through FY 2014. Some data elements, such as the number of young adult’s program offerings, were added to the survey after FY 2004. Over the past 5 years (between FY 2010 and FY 2014), trend analyses were performed for these metrics. In the indicators, metrics are also broken out and presented by state, region, or locale.
Per Capita
Many items presented in this report are measured per capita. Per capita is the measure of an item divided by the unduplicated population of the legal service area.4
4 Details about the unduplicated population can be found in the data documentation, Data File Documentation: Public Libraries Survey: Fiscal year 2011, available at www.imls.gov.
Per capita metrics control for population changes over time and allow for standardized comparison of metrics. In some cases, items are measured per 1,000, 5,000, and 25,000 people for illustration purposes. As with per capita, these measures help standardize comparisons over time.
In addition to per capita analyses, trends in services are sometimes examined by the number of visitors. Examination of both per capita and per visitor trends provides a measure of the role that public libraries play in their communities at large.
Locale
Federal agencies use a variety of ways to classify community types. In this report, libraries are classified using a system of locale codes developed by NCES. Working with the U.S. Census Bureau, NCES revised these codes by using improved geocoding technology and the 2010 Office of Management and Budget definitions of metropolitan statistical areas.5
5 The Office of Management and Budget delineates geographic entities for metropolitan and metropolitan statistical areas for use by federal agencies in collecting, tabulating, and publishing federal statistics. To learn about the designation, see the notice in the Federal Register, Vol. 75, No. 123, pp. 37246–39052, published June 28, 2010.
Thus, locale codes rely on proximity to an urbanized area, rather than population size and county boundaries.
Beginning with the FY 2008 data file, locale codes were added to the PLS outlet and administrative entity datasets. Locale codes identify general characteristics about where a public library is situated. The codes allow users to quickly identify which library outlets and administrative entities are located in cities, suburbs, towns, or rural areas. The locale codes are based on the proximity of an address to an urbanized area, defined as a densely settled core with densely settled, surrounding areas.
The locale code system classifies a territory into four major categories: urban, suburban, town, and rural (Table B-2.1). Each category has three subcategories. For urban and suburban areas, gradations are based on population size: large, medium, or small. Towns and rural areas are subcategorized based on their distance from an urbanized area: fringe, distant, or remote. The coding methodology was developed by the Census Bureau as a way to identify the location of public schools for the Common Core of Data, a survey collected by NCES.
These 12 locale codes provide a new way to analyze library services in the United States. By incorporating objective measures of rurality and urbanicity into the data files, researchers and practitioners can benchmark services in a fundamentally different way by basing comparisons on community attributes as well as the attributes of the libraries themselves. In other words, library services in rural, remote areas can now be compared to library services in other rural, remote areas within the same state or across the country by using a standardized rurality/urbanicity metric that is applied
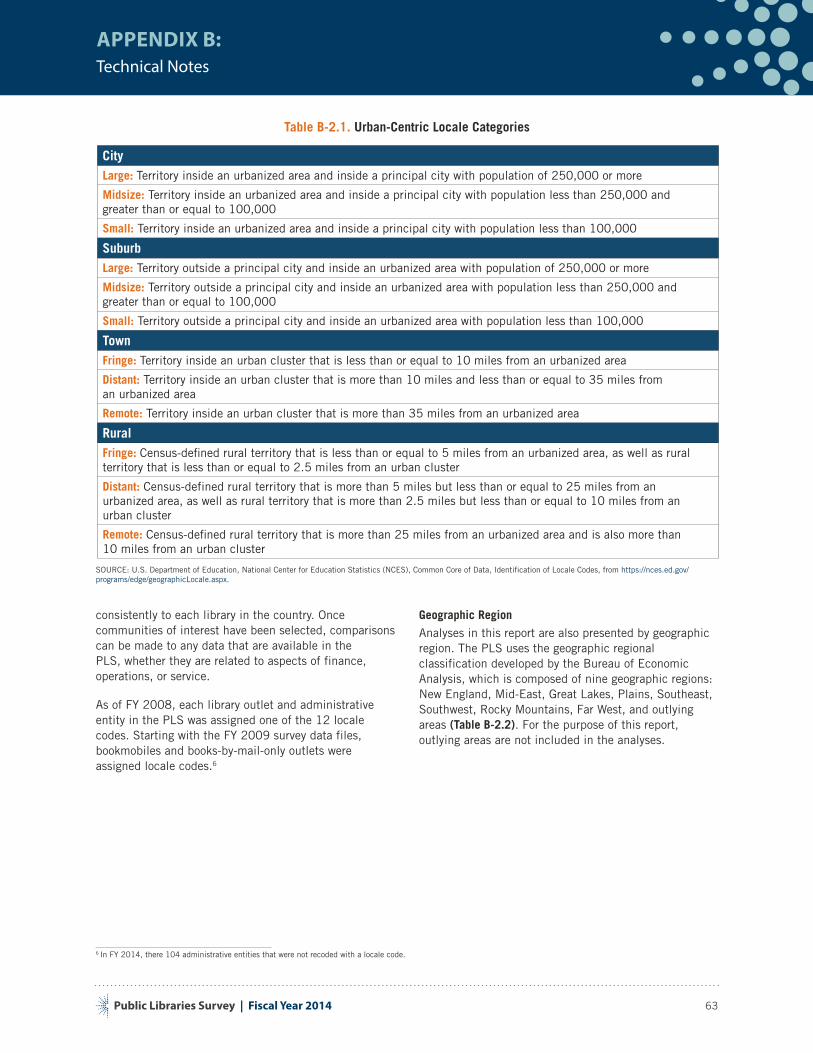
Public Libraries Survey | Fiscal Year 2014
APPENDIX B:Technical Notes
63
Table B-2.1. Urban-Centric Locale Categories
CityLarge: Territory inside an urbanized area and inside a principal city with population of 250,000 or more
Midsize: Territory inside an urbanized area and inside a principal city with population less than 250,000 and greater than or equal to 100,000
Small: Territory inside an urbanized area and inside a principal city with population less than 100,000
SuburbLarge: Territory outside a principal city and inside an urbanized area with population of 250,000 or more
Midsize: Territory outside a principal city and inside an urbanized area with population less than 250,000 and greater than or equal to 100,000
Small: Territory outside a principal city and inside an urbanized area with population less than 100,000
TownFringe: Territory inside an urban cluster that is less than or equal to 10 miles from an urbanized area
Distant: Territory inside an urban cluster that is more than 10 miles and less than or equal to 35 miles from an urbanized area
Remote: Territory inside an urban cluster that is more than 35 miles from an urbanized area
RuralFringe: Census-defined rural territory that is less than or equal to 5 miles from an urbanized area, as well as rural territory that is less than or equal to 2.5 miles from an urban cluster
Distant: Census-defined rural territory that is more than 5 miles but less than or equal to 25 miles from an urbanized area, as well as rural territory that is more than 2.5 miles but less than or equal to 10 miles from an urban cluster
Remote: Census-defined rural territory that is more than 25 miles from an urbanized area and is also more than 10 miles from an urban cluster
SOURCE: U.S. Department of Education, National Center for Education Statistics (NCES), Common Core of Data, Identification of Locale Codes, from https://nces.ed.gov/programs/edge/geographicLocale.aspx.
consistently to each library in the country. Once communities of interest have been selected, comparisons can be made to any data that are available in the PLS, whether they are related to aspects of finance, operations, or service.
As of FY 2008, each library outlet and administrative entity in the PLS was assigned one of the 12 locale codes. Starting with the FY 2009 survey data files, bookmobiles and books-by-mail-only outlets were assigned locale codes.6
6 In FY 2014, there 104 administrative entities that were not recoded with a locale code.
Geographic Region
Analyses in this report are also presented by geographic region. The PLS uses the geographic regional classification developed by the Bureau of Economic Analysis, which is composed of nine geographic regions: New England, Mid-East, Great Lakes, Plains, Southeast, Southwest, Rocky Mountains, Far West, and outlying areas (Table B-2.2). For the purpose of this report, outlying areas are not included in the analyses.
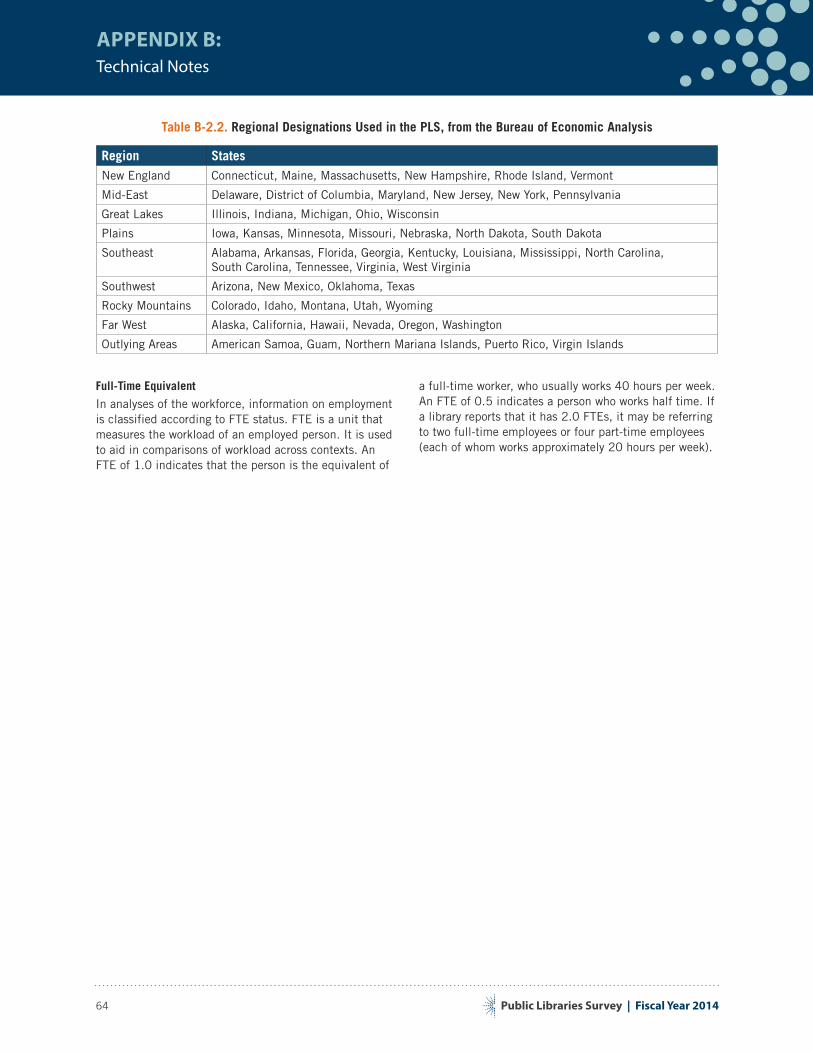
Public Libraries Survey | Fiscal Year 2014
APPENDIX B:Technical Notes
64
Table B-2.2. Regional Designations Used in the PLS, from the Bureau of Economic Analysis
Region StatesNew England Connecticut, Maine, Massachusetts, New Hampshire, Rhode Island, Vermont
Mid-East Delaware, District of Columbia, Maryland, New Jersey, New York, Pennsylvania
Great Lakes Illinois, Indiana, Michigan, Ohio, Wisconsin
Plains Iowa, Kansas, Minnesota, Missouri, Nebraska, North Dakota, South Dakota
Southeast Alabama, Arkansas, Florida, Georgia, Kentucky, Louisiana, Mississippi, North Carolina, South Carolina, Tennessee, Virginia, West Virginia
Southwest Arizona, New Mexico, Oklahoma, Texas
Rocky Mountains Colorado, Idaho, Montana, Utah, Wyoming
Far West Alaska, California, Hawaii, Nevada, Oregon, Washington
Outlying Areas American Samoa, Guam, Northern Mariana Islands, Puerto Rico, Virgin Islands
Full-Time Equivalent
In analyses of the workforce, information on employment is classified according to FTE status. FTE is a unit that measures the workload of an employed person. It is used to aid in comparisons of workload across contexts. An FTE of 1.0 indicates that the person is the equivalent of
a full-time worker, who usually works 40 hours per week. An FTE of 0.5 indicates a person who works half time. If a library reports that it has 2.0 FTEs, it may be referring to two full-time employees or four part-time employees (each of whom works approximately 20 hours per week).
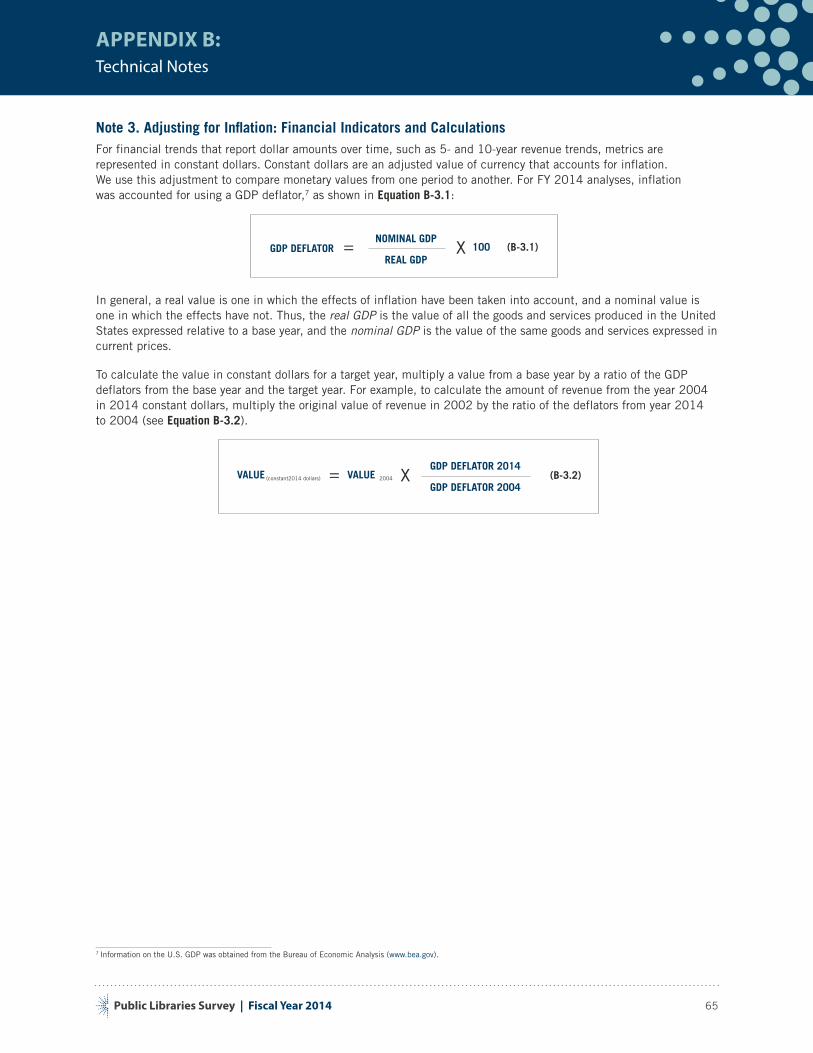
Public Libraries Survey | Fiscal Year 2014
APPENDIX B:Technical Notes
65
Note 3. Adjusting for Inflation: Financial Indicators and CalculationsFor financial trends that report dollar amounts over time, such as 5- and 10-year revenue trends, metrics are represented in constant dollars. Constant dollars are an adjusted value of currency that accounts for inflation. We use this adjustment to compare monetary values from one period to another. For FY 2014 analyses, inflation was accounted for using a GDP deflator,7
7 Information on the U.S. GDP was obtained from the Bureau of Economic Analysis (www.bea.gov).
as shown in Equation B-3.1:
In general, a real value is one in which the effects of inflation have been taken into account, and a nominal value is one in which the effects have not. Thus, the real GDP is the value of all the goods and services produced in the United States expressed relative to a base year, and the nominal GDP is the value of the same goods and services expressed in current prices.
To calculate the value in constant dollars for a target year, multiply a value from a base year by a ratio of the GDP deflators from the base year and the target year. For example, to calculate the amount of revenue from the year 2004 in 2014 constant dollars, multiply the original value of revenue in 2002 by the ratio of the deflators from year 2014 to 2004 (see Equation B-3.2).
GDP DEFLATOR = NOMINAL GDP
REAL GDPX 100 (B-3.1)
VALUE (constant2014 dollars) = VALUE 2004 XGDP DEFLATOR 2014
GDP DEFLATOR 2004(B-3.2)

Acknowledgments
Many individuals made important contributions to this report. The Institute of Museum and Library Services is grateful to the many staff members who contributed to this report, including: Matthew Birnbaum, Lisa Frehill, Marisa Pelczar, and Ben Sweezy. We are also grateful to the team from the American Institutes for Research for producing this report, which includes the following individuals: Christopher A. Cody, Jiashan Cui, Kathryn Low, Katie Mallory, Patrick Stark,
Celeste Stone, Aaron Testoff, and Tzu-Jou Wan.
IMLS also extends sincere gratitude to the Chief Officers, State Data Coordinators, other State Library Administrative Agency staff, and public library directors and their staff who provided the data for this report. Their diligent efforts
result in a national data resource with an exceptionally high response rate, year after year.
IMLS would like to extend a special thank you to members of the survey advisory group for their help in managing the survey process. The Library Statistics Working Group (LSWG) is a vital part of the survey team. Their time and effort
has helped make this report a more valuable resource to the library community and the public.
Library Statistics Working Group Members
Stacey Aldrich, State Librarian, Hawaii State Public Library System
Jay Bank, State Data Coordinator, State Library of Kentucky
Mike Crandall, Principal Research Scientist, University of Washington
Michael Golrick, State Data Coordinator, State Library of Louisiana
Linda Hofschire, Director of Library Research Service, Colorado State Library
Amanda Johnson, State Data Coordinator, State Library of North Carolina
Martha Kyrillidou, Director of Statistics and Service Quality, Association of Research Libraries
Jennifer Nelson, State Librarian/Director of State Library Services, Minnesota Department of Education
Annie Norman, State Librarian and Director, Delaware Division of Libraries
James Ritter, State Librarian, Maine Library Commission
Kathy Rosa, Director, Office for Research and Statistics, American Library Association
Mark Smith, Director and Librarian, Texas State Library and Archives Commission
Katrice Stewart, State Data Coordinator, State Library of Florida


![Public Libraries Data, 1987: [United States]](https://img.pdfslide.us/doc/110x75/627619da196d1d69581cda93/public-libraries-data-1987-united-states.jpg)
