Embed Size (px)
Citation preview
1
Public Expenditure on
Railways in Europe:
a cross-country comparison
Ugo Arrigo - Giacomo Di Foggia
Ugo Arrigo: Professor of Public Finance, University of Milano-Bicocca
Giacomo Di Foggia: Adj. Prof. of Economics, University of Milano-Bicocca
2
Sommario
1. Introduction and main results ...................................................................................................... 3
2. Types of public subsidies to the rail transport sector ..................................................................... 5
3. Public subsidies to the rail transport sector in Italy ...................................................................... 7
4. Public subsidies to the rail transport sector in Great Britain ....................................................... 11
5. Public subsidies to the rail transport sector in Germany ............................................................. 16
6. Public subsidies to the rail transport sector in France ................................................................. 21
7. Public subsidies to the rail transport sector in Sweden ................................................................ 25
8. A comparison of public subsidies granted in the five countries.................................................... 28
9. The formation of the Italian public debt ..................................................................................... 34
References .......................................................................................................................................... 37
3
1. Introduction and main results
What is and which was, over a long period of time, the overall burden of Italian rail expenditure on
public finance? Was it or is it higher or lower than in other countries, taking into consideration
different network sizes and traffic? Can it, from a spending review perspective, be reduced? Have
governments that have succeeded been able to control expenditure and direct it towards objectives of
efficiency, growth within the sector or modal shift? What impact has public railway expenditure given
had on the formation of Italian public debt?
Since the answers to all of these questions are unknown, this paper aims to reconstruct the total
amount of public subsidies paid to the railway sector over the last quarter of a century in five major
European countries: Italy, Great Britain, Germany, France and Sweden. The main objective is to
evaluate the appropriateness of transfers granted in Italy compared to other European countries in view
of containing and rationalising public expenditure, improving overall system efficiency and protecting
competition in a market that has, at least from a legal point of view, fully liberalised segments.
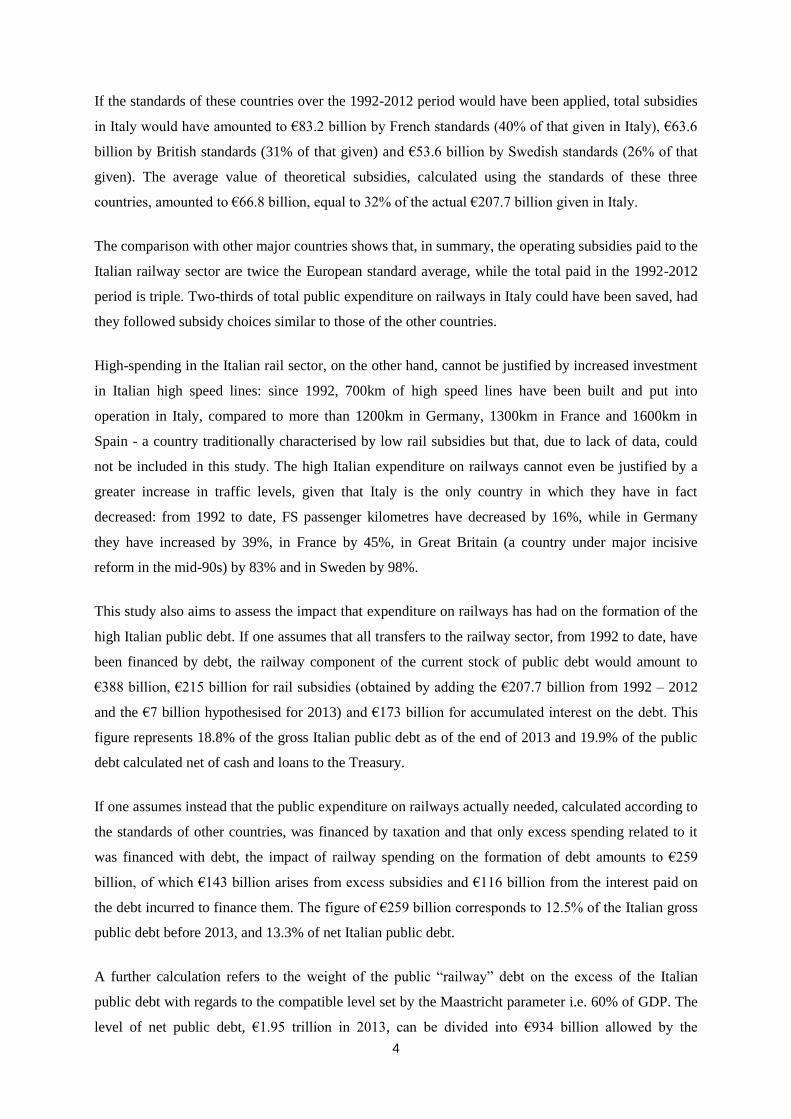
In Italy, the public expenditure on railways in the 21 years since the transformation of FS into a public
limited company (1992-2012) was tremendous: €207.7 billion – €84.8 billion grants to the income
while €122.8 billion to assets, reconstructed by adding historical data together, without any inflation
adjustment. This corresponds to €9.9 billion per year, a figure that represents a significant share of the
annual Italian public deficit. During the same period, French expenditure on railways was €153.6
billion, however the French rail sector is twice the size of Italy’s in terms of infrastructure dimensions
and has more than double the amount of passenger transport. British expenditure on railways was
€69.3 billion, one third of that of Italy, despite the British network being the same length as Italy’s and
the traffic transported throughout the period considered being practically the same. The comparison
with Germany also confirms Italy’s over expenditure. German figures are only available for the nine
years between 2002 and 2010, amounting to €88 billion in total (compared to €85 billion in Italy in the
same period), corresponding to an annual average of €9.8 billion. However, the German railway sector
is two and a half times the size of Italy’s.
In the last year available, 2012, the total government expense finance was €7.6 billion, well below the
average of the 21 years analysed, but considerably higher than the €6.5 billion in 2011 and €5.8 billion
in 2010. By British subsidy standards, calculated in the study based on the size of the network and
traffic, the total transfers to the Italian rail sector would have amounted to just €3.3 billion last year,
€4.6 billion by French standards and €3.6 billion by German and Swedish standards. Based on the
average standards in these four countries, the total outlay for Italian public finance should have only
been €3.8 billion, exactly half of what was actually granted to the FS group.
4
If the standards of these countries over the 1992-2012 period would have been applied, total subsidies
in Italy would have amounted to €83.2 billion by French standards (40% of that given in Italy), €63.6
billion by British standards (31% of that given) and €53.6 billion by Swedish standards (26% of that
given). The average value of theoretical subsidies, calculated using the standards of these three
countries, amounted to €66.8 billion, equal to 32% of the actual €207.7 billion given in Italy.
The comparison with other major countries shows that, in summary, the operating subsidies paid to the
Italian railway sector are twice the European standard average, while the total paid in the 1992-2012
period is triple. Two-thirds of total public expenditure on railways in Italy could have been saved, had
they followed subsidy choices similar to those of the other countries.
High-spending in the Italian rail sector, on the other hand, cannot be justified by increased investment
in Italian high speed lines: since 1992, 700km of high speed lines have been built and put into
operation in Italy, compared to more than 1200km in Germany, 1300km in France and 1600km in
Spain - a country traditionally characterised by low rail subsidies but that, due to lack of data, could
not be included in this study. The high Italian expenditure on railways cannot even be justified by a
greater increase in traffic levels, given that Italy is the only country in which they have in fact
decreased: from 1992 to date, FS passenger kilometres have decreased by 16%, while in Germany
they have increased by 39%, in France by 45%, in Great Britain (a country under major incisive
reform in the mid-90s) by 83% and in Sweden by 98%.
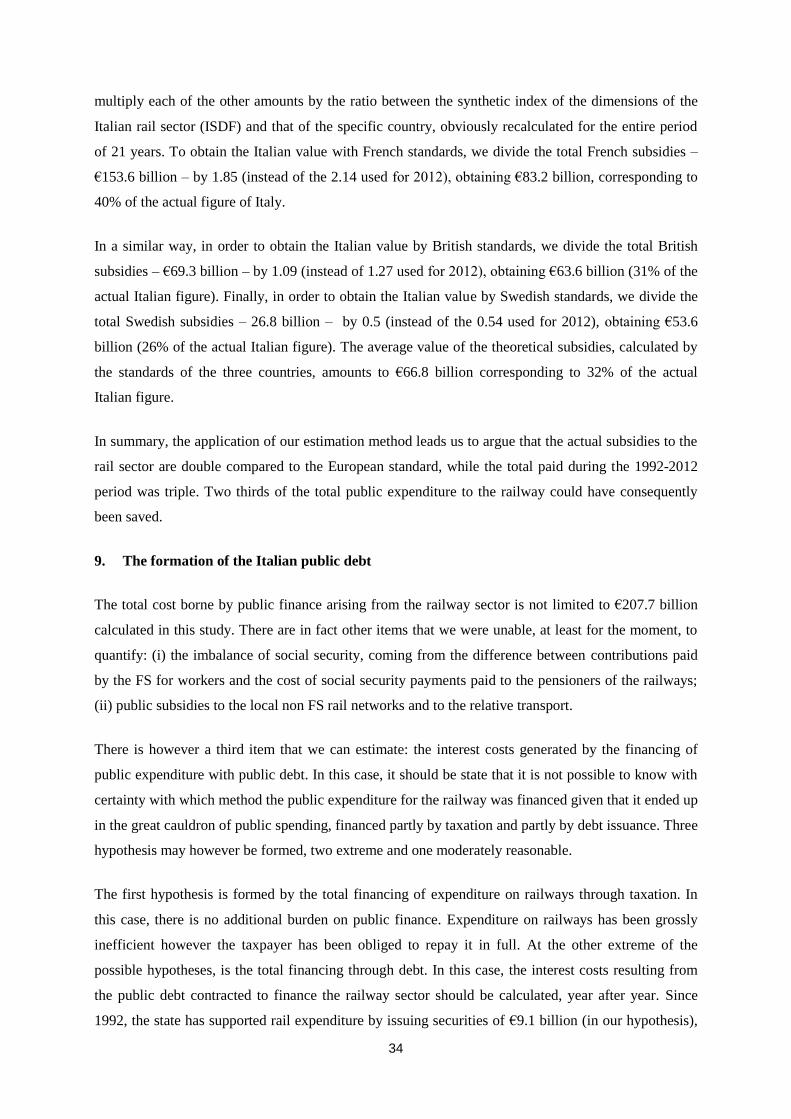
This study also aims to assess the impact that expenditure on railways has had on the formation of the
high Italian public debt. If one assumes that all transfers to the railway sector, from 1992 to date, have
been financed by debt, the railway component of the current stock of public debt would amount to
€388 billion, €215 billion for rail subsidies (obtained by adding the €207.7 billion from 1992 – 2012
and the €7 billion hypothesised for 2013) and €173 billion for accumulated interest on the debt. This
figure represents 18.8% of the gross Italian public debt as of the end of 2013 and 19.9% of the public
debt calculated net of cash and loans to the Treasury.
If one assumes instead that the public expenditure on railways actually needed, calculated according to
the standards of other countries, was financed by taxation and that only excess spending related to it
was financed with debt, the impact of railway spending on the formation of debt amounts to €259
billion, of which €143 billion arises from excess subsidies and €116 billion from the interest paid on
the debt incurred to finance them. The figure of €259 billion corresponds to 12.5% of the Italian gross
public debt before 2013, and 13.3% of net Italian public debt.
A further calculation refers to the weight of the public “railway” debt on the excess of the Italian
public debt with regards to the compatible level set by the Maastricht parameter i.e. 60% of GDP. The
level of net public debt, €1.95 trillion in 2013, can be divided into €934 billion allowed by the
5
Maastricht constraint based on nominal GDP and €1.016 trillion “excess”. Of this €1.016 trillion, the
€259 billion of Italian railway overspending and the relative interest represent 25.5%. If they had been
avoided by a prudent policy of public transfers to the railway sector, today the debt / GDP ratio would
be 17 percentage points lower.
These calculations regarding the impact of the high Italian expenditure on railways on the public debt
refer to the excess expenditure since 1992 (eve of the so-called Second Republic) to date, that we have
been able to estimate. Since it seems difficult to imagine that the rail expenditure, over a long period
of time, was more virtuous in the first republic than the second, we should not be surprised to
discover, if it were possible to go even further back in the reconstruction of rail subsidies, that the
excess Italian rail expenditure is responsible for between one-quarter to one-third of the total Italian
public debt and more than half of the excess debt than that allowed by the Maastricht constraint.
2. Types of public subsidies to the rail transport sector
This paper is a continuation of a previous analysis that examined the transfers to the rail sector listed
as “State Aid”, reported annually by member countries and delivered to the European Union
Commission (Arrigo and Di Foggia, 2013). In Europe, data on state aid to railways suffer from some
limitations (EU Commission, 2013), of which the main ones are the following:
1. Missing data for some years as a result of missing notifications from members. Italy, for example,
did not submit notifications for 2008 and 2011, while the 2012 notification did not include
assistance granted by regions to local rail transport.
2. The published data did not disaggregate between different aid given to the network for financing
new investments, for renewals and maintenance, for operating expenses and for public service
obligations (PSOs). Additionally, some countries (not including Italy) include, without the
possibility of distinguishing them, public expenses resulting from the coverage of the imbalance of
pension accounts of former railwaymen.
In order to overcome these problems, this analysis has attempted to obtain data on the public subsidies
in a direct way, from national sources of the countries surveyed (such as regulator reports, ministries
of the sector, annual reports from the managers of the railway network and the transport operators).
The sources are specified throughout the paper and the relevant references are listed in the
bibliography.
Public financial support to railways assumes a variety of forms and possible purposes. It may be for
the network or transport service and in each case it can result in either capital or operating grants. With
regards to the intended purpose, it may be destined, on the network side, to the construction of new
railway lines, the renewal of existing ones, or their ordinary management; on the transport side, to the
6
acquisition or modernisation of rolling stock, the support of local passenger services (long distance
unprofitable ones) or freight transport.
Regarding operating grants, they may be intended as financial support for the management of the rail
network or transport service. Firstly they have the effect of allowing usage tariffs of the network to be
lower, advantageous for the majority of the rail transport companies that use the network and therefore
not distorting competition. Secondly, specific beneficiary transport companies that may be in
competition with others are not distortive if finance was granted through fair tender procedures that are
transparent and non-discriminatory of the market’s competition mechanisms. This method, although
planned as part of Italian local public transport reforms introduced in the second half of the 90s, has
never reached complete or extensive implementation.
Regarding the objectives, capital grants for the network are typically targeted at the development of
the network in the event that it cannot be maintained by the operator in market conditions through
venture capital and debt financing. Since network operation is rarely profitable due to the inability of
recovering costs through tools that are sustainable for transport operators, this method of support
affects all European networks with very few exceptions. Routes created by project financing are, in
fact, very rare: the great Danish bridges, the Eurotunnel, the High Speed 1 between London and the
English Channel, the connection of Oslo and Stockholm with the respective airports and the new
Franco-Spanish line between Perpignan and Figueras.
Support for network operating expenses is intended to finance network tariffs lower than the average
cost and close to or equal to the incremental cost in the short term if required. Lower network tariffs
represent an important incentive geared towards growing rail transport and, thank to this, readdressing
the balance between different forms of transport. It is clear that this type of support should lead to non-
discriminatory network tariffs in respect of operators that use the network.
Support for transport services, unprofitable regional or long-distance, is ultimately aimed at financing
lower network tariffs for users, lower than the average cost per passenger, that promote greater use of
rail transport. Without them, many links would prove to be non-economically viable, given the low
load factor and the limited willingness of users to pay. Also, it is essential in this case that all rail
operators can compete for grants and that they are not reserved to the incumbent operator by the
decision-maker, which in all of the European countries considered, with the exception of Great Britain,
is still public.
All subsidies to the rail transport sector are justified by the underlying objectives of collective well-
being: those grants to the networks (related to assets) were in the form of infrastructure growth, those
to the network but related to income in the form of usage growth by those who offer transport services
and finally, those to transport services in the form of increased demand from users.
7
If we transition, however, from a normative analysis, which identifies the need to be a system, to a
positive kind of analysis that examines the actual reality, as in this paper, it can be noted that not all
grants are necessarily used to increase infrastructural facilities, the provision of transport services or
the relative demand from customers. They may in reality be provided, by not particularly effective
public decision-makers, excessively with respect to such requirements, or not properly used by those
who receive them for the specific purposes for which they were awarded. In such cases, the following
consequences may occur:
1. The financing of unnecessary, and therefore inefficient, costs by the network operator and/or
the manager of the transport service;
2. The financing of cross-subsidies by transport services offered under monopoly, that receive
public assistance, to services offered in conditions of free competition that should not benefit.
This second risk concerns countries in which market competition (on the tracks) is possible, at least in
certain service segments. Although so far they are few in number, they are destined to grow and Italy
can be found among them, in which there is competition in the high-speed segment. It is evident that if
an incumbent operator obtains direct grants for certain types of offer without competition and in the
absence of checks that should be carried out by an independent market regulator, they will be tempted
to use these grants to finance predatory pricing in the segment in competition, which evidently
represent their alteration.
3. Public subsidies to the rail transport sector in Italy
The public sector has long sustained the rail transport sector in Italy with significant transfers directed
mainly to the financing of investment programs and to covering network operating costs and the cost
of local rail transport. A complete and accurate reconstruction of all subsidies in Italy is very difficult,
unlike other countries, due to the absence of a body taking on the task of recording and publishing the
information over time. As a result of this difficulty, we have had to limit our reconstruction to public
subsidies to the FS group, ignoring local rail networks.
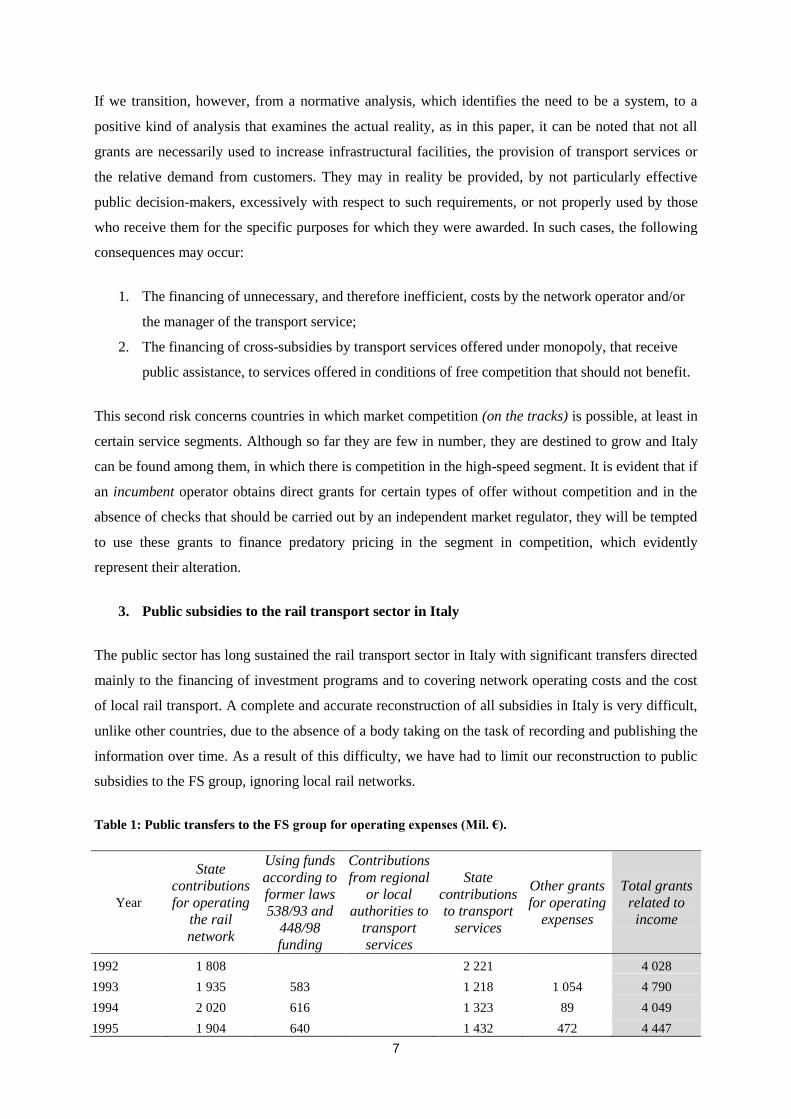
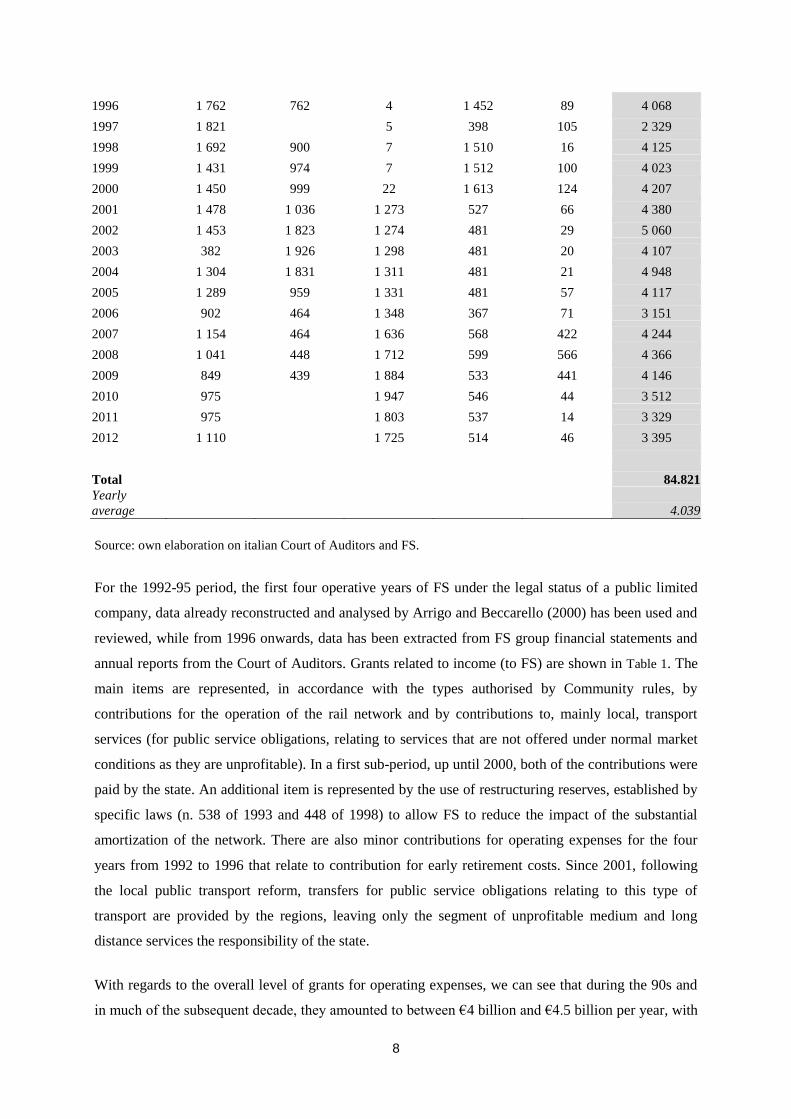
Table 1: Public transfers to the FS group for operating expenses (Mil. €).
Year
State
contributions
for operating
the rail
network
Using funds
according to
former laws
538/93 and
448/98
funding
Contributions
from regional
or local
authorities to
transport
services
State
contributions
to transport
services
Other grants
for operating
expenses
Total grants
related to
income
1992 1 808 2 221 4 028
1993 1 935 583 1 218 1 054 4 790
1994 2 020 616 1 323 89 4 049
1995 1 904 640 1 432 472 4 447
8
1996 1 762 762 4 1 452 89 4 068
1997 1 821 5 398 105 2 329
1998 1 692 900 7 1 510 16 4 125
1999 1 431 974 7 1 512 100 4 023
2000 1 450 999 22 1 613 124 4 207
2001 1 478 1 036 1 273 527 66 4 380
2002 1 453 1 823 1 274 481 29 5 060
2003 382 1 926 1 298 481 20 4 107
2004 1 304 1 831 1 311 481 21 4 948
2005 1 289 959 1 331 481 57 4 117
2006 902 464 1 348 367 71 3 151
2007 1 154 464 1 636 568 422 4 244
2008 1 041 448 1 712 599 566 4 366
2009 849 439 1 884 533 441 4 146
2010 975 1 947 546 44 3 512
2011 975 1 803 537 14 3 329
2012 1 110 1 725 514 46 3 395
Total 84.821
Yearly
average 4.039
Source: own elaboration on italian Court of Auditors and FS.
For the 1992-95 period, the first four operative years of FS under the legal status of a public limited
company, data already reconstructed and analysed by Arrigo and Beccarello (2000) has been used and
reviewed, while from 1996 onwards, data has been extracted from FS group financial statements and
annual reports from the Court of Auditors. Grants related to income (to FS) are shown in Table 1. The
main items are represented, in accordance with the types authorised by Community rules, by
contributions for the operation of the rail network and by contributions to, mainly local, transport
services (for public service obligations, relating to services that are not offered under normal market
conditions as they are unprofitable). In a first sub-period, up until 2000, both of the contributions were
paid by the state. An additional item is represented by the use of restructuring reserves, established by
specific laws (n. 538 of 1993 and 448 of 1998) to allow FS to reduce the impact of the substantial
amortization of the network. There are also minor contributions for operating expenses for the four
years from 1992 to 1996 that relate to contribution for early retirement costs. Since 2001, following
the local public transport reform, transfers for public service obligations relating to this type of
transport are provided by the regions, leaving only the segment of unprofitable medium and long
distance services the responsibility of the state.
With regards to the overall level of grants for operating expenses, we can see that during the 90s and
in much of the subsequent decade, they amounted to between €4 billion and €4.5 billion per year, with
9
some exceptions: in 1996 they were almost halved as a result of the cuts included in public financial
measures designed to meet the 1997 Maastricht criteria and allow admission to the euro; in 2002 and
2004, years that fell within the new center-right wing legislation, annual support rose to around €5
billion; in 2006 there was a new reduction, nevertheless transitory, of total public support. Finally, in
the 2010-12 period, the total transfers for operating expenses amounted on average to the lowest level
of €3.4 billion a year. In the 21 years of the FS in SpA form (public limited company), from 1992-
2012, total operating grants amounted to €85 billion, equivalent to an annual average of €4 billion.
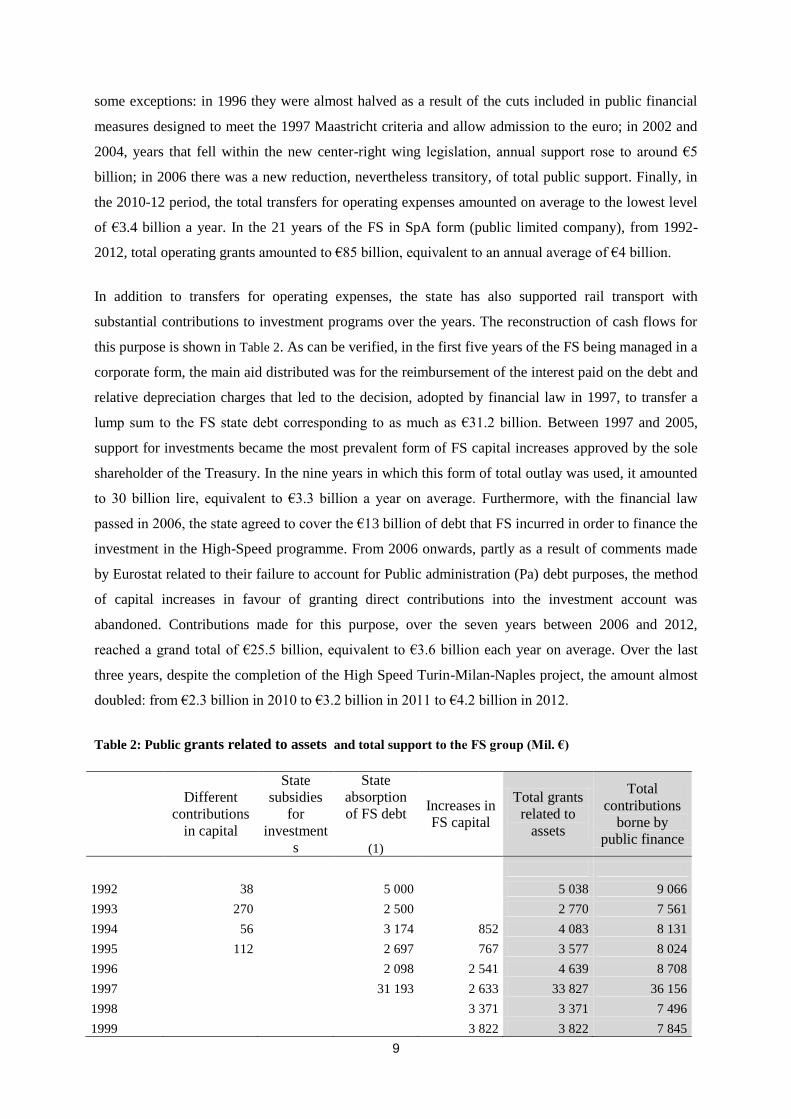
In addition to transfers for operating expenses, the state has also supported rail transport with
substantial contributions to investment programs over the years. The reconstruction of cash flows for
this purpose is shown in Table 2. As can be verified, in the first five years of the FS being managed in a
corporate form, the main aid distributed was for the reimbursement of the interest paid on the debt and
relative depreciation charges that led to the decision, adopted by financial law in 1997, to transfer a
lump sum to the FS state debt corresponding to as much as €31.2 billion. Between 1997 and 2005,
support for investments became the most prevalent form of FS capital increases approved by the sole
shareholder of the Treasury. In the nine years in which this form of total outlay was used, it amounted
to 30 billion lire, equivalent to €3.3 billion a year on average. Furthermore, with the financial law
passed in 2006, the state agreed to cover the €13 billion of debt that FS incurred in order to finance the
investment in the High-Speed programme. From 2006 onwards, partly as a result of comments made
by Eurostat related to their failure to account for Public administration (Pa) debt purposes, the method
of capital increases in favour of granting direct contributions into the investment account was
abandoned. Contributions made for this purpose, over the seven years between 2006 and 2012,
reached a grand total of €25.5 billion, equivalent to €3.6 billion each year on average. Over the last
three years, despite the completion of the High Speed Turin-Milan-Naples project, the amount almost
doubled: from €2.3 billion in 2010 to €3.2 billion in 2011 to €4.2 billion in 2012.
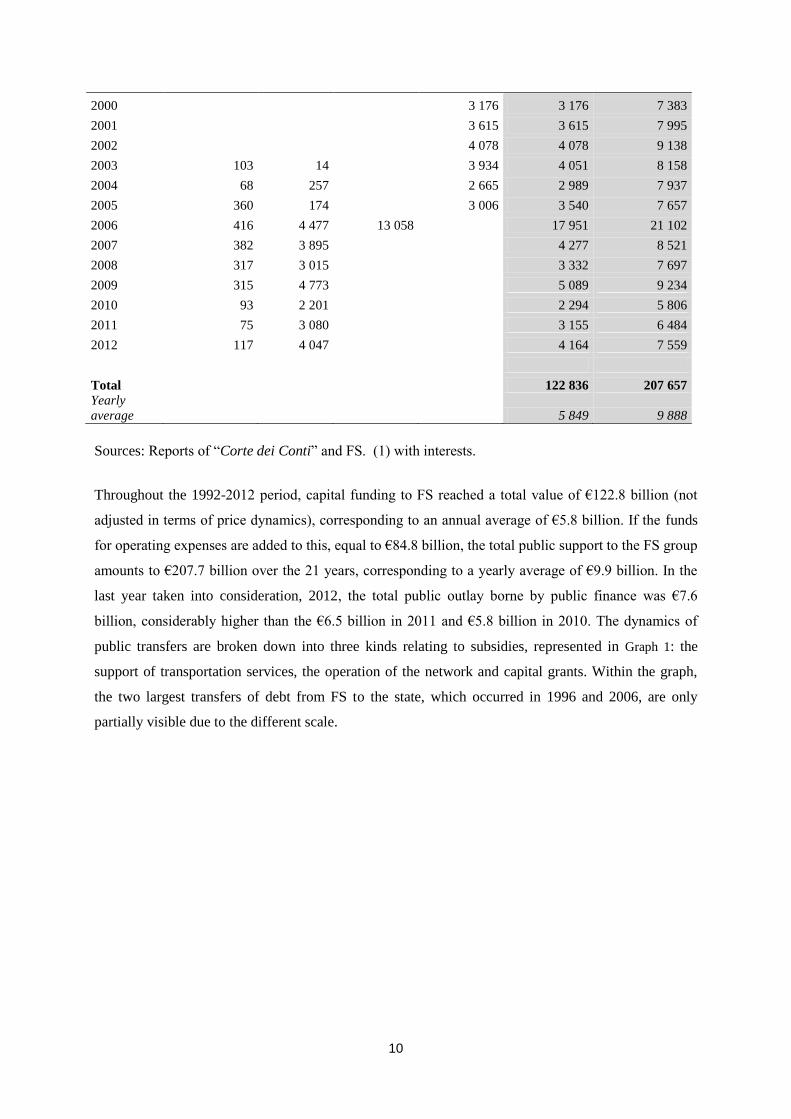
Table 2: Public grants related to assets and total support to the FS group (Mil. €)
Different
contributions
in capital
State
subsidies
for
investment
s
State
absorption
of FS debt
(1)
Increases in
FS capital
Total grants
related to
assets
Total
contributions
borne by
public finance
1992 38 5 000 5 038 9 066
1993 270 2 500 2 770 7 561
1994 56 3 174 852 4 083 8 131
1995 112 2 697 767 3 577 8 024
1996 2 098 2 541 4 639 8 708
1997 31 193 2 633 33 827 36 156
1998 3 371 3 371 7 496
1999 3 822 3 822 7 845
10
2000 3 176 3 176 7 383
2001 3 615 3 615 7 995
2002 4 078 4 078 9 138
2003 103 14 3 934 4 051 8 158
2004 68 257 2 665 2 989 7 937
2005 360 174 3 006 3 540 7 657
2006 416 4 477 13 058 17 951 21 102
2007 382 3 895 4 277 8 521
2008 317 3 015 3 332 7 697
2009 315 4 773 5 089 9 234
2010 93 2 201 2 294 5 806
2011 75 3 080 3 155 6 484
2012 117 4 047 4 164 7 559
Total 122 836 207 657
Yearly
average 5 849 9 888
Sources: Reports of “Corte dei Conti” and FS. (1) with interests.
Throughout the 1992-2012 period, capital funding to FS reached a total value of €122.8 billion (not
adjusted in terms of price dynamics), corresponding to an annual average of €5.8 billion. If the funds
for operating expenses are added to this, equal to €84.8 billion, the total public support to the FS group
amounts to €207.7 billion over the 21 years, corresponding to a yearly average of €9.9 billion. In the
last year taken into consideration, 2012, the total public outlay borne by public finance was €7.6
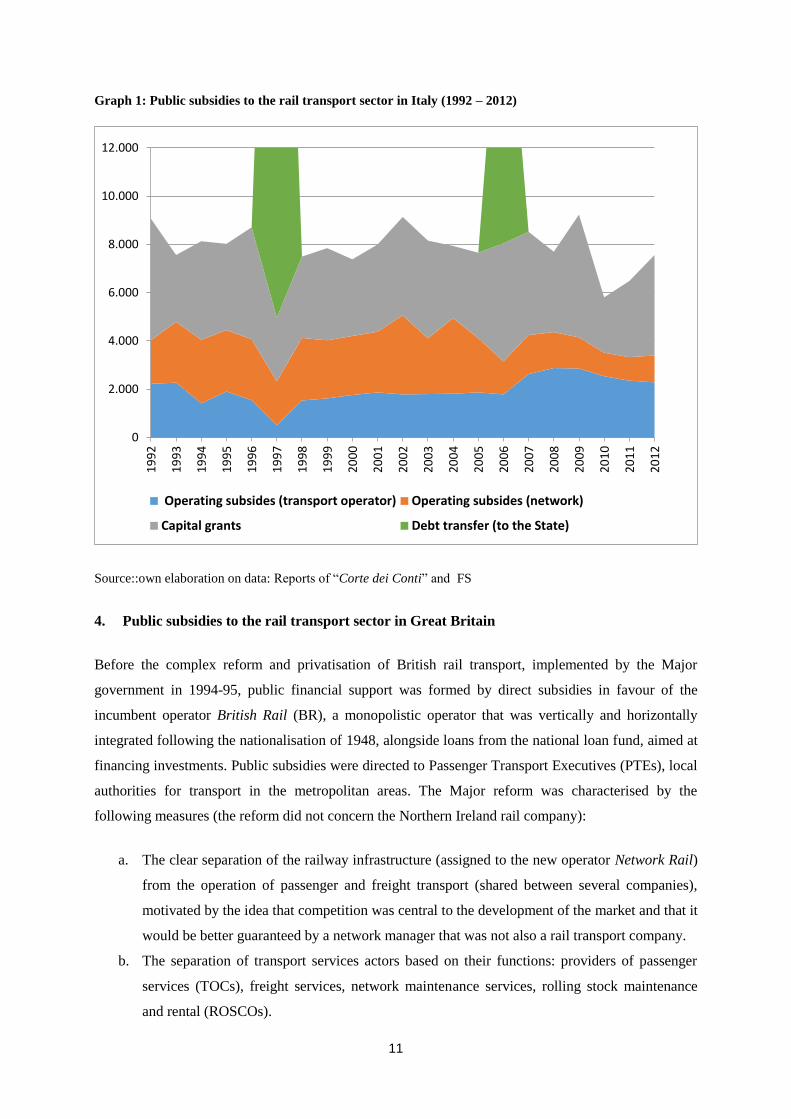
billion, considerably higher than the €6.5 billion in 2011 and €5.8 billion in 2010. The dynamics of
public transfers are broken down into three kinds relating to subsidies, represented in Graph 1: the
support of transportation services, the operation of the network and capital grants. Within the graph,
the two largest transfers of debt from FS to the state, which occurred in 1996 and 2006, are only
partially visible due to the different scale.
11
Graph 1: Public subsidies to the rail transport sector in Italy (1992 – 2012)
Source::own elaboration on data: Reports of “Corte dei Conti” and FS
4. Public subsidies to the rail transport sector in Great Britain
Before the complex reform and privatisation of British rail transport, implemented by the Major
government in 1994-95, public financial support was formed by direct subsidies in favour of the
incumbent operator British Rail (BR), a monopolistic operator that was vertically and horizontally
integrated following the nationalisation of 1948, alongside loans from the national loan fund, aimed at
financing investments. Public subsidies were directed to Passenger Transport Executives (PTEs), local
authorities for transport in the metropolitan areas. The Major reform was characterised by the
following measures (the reform did not concern the Northern Ireland rail company):
a. The clear separation of the railway infrastructure (assigned to the new operator Network Rail)
from the operation of passenger and freight transport (shared between several companies),
motivated by the idea that competition was central to the development of the market and that it
would be better guaranteed by a network manager that was not also a rail transport company.
b. The separation of transport services actors based on their functions: providers of passenger
services (TOCs), freight services, network maintenance services, rolling stock maintenance
and rental (ROSCOs).
0
2.000
4.000
6.000
8.000
10.000
12.0001
99
2
19
93
19
94
19
95
19
96
19
97
19
98
19
99
20
00
20
01
20
02
20
03
20
04
20
05
20
06
20
07
20
08
20
09
20
10
20
11
20
12
Operating subsides (transport operator) Operating subsides (network)
Capital grants Debt transfer (to the State)
12
c. Creating, from the splitting of the public monopoly, a multiplicity of actors for each of the
previous functions in such a way that they were able to operate in competitive conditions.
d. The privatisation of all railway system actors, including “the infrastructure manager” of the
network (that became public again at the beginning of 2000),
e. Keeping the following functions in the public sphere: (i) technical regulation of the sector; (ii)
economic regulation; (iii) allocation, on a competitive basis, of transport services (franchising)
supported by government subsidies on non-profitable routes to new railway companies. The
Railways Act of 1993 assigned the last two duties to non-ministerial government departments:
the Office of the Rail Regulator (ORR) for economic regulation and the Office of Passenger
Rail Franchising (OPRAF) for the allocation of services through tender.
The reform led to significant changes in the scheme of public funding, with the new regime based on
the allocation of passenger rail services, broken down into groups of routes, through tenders designed
to achieve economic stability by compensating for unprofitable lines. Public support to the rail sector
was therefore mainly represented by transfers granted to railway companies of the OPRAF, which was
first overtaken by the Strategic Rail Authority (SRA) followed in a direct way by the Department for
Transport (from 1999 and from 2004). Alongside transfers to the railway companies were grants to the
PTE, limited contributions to BR to finance the residual activities of and subsidies to, even though
small, freight transport. Direct public transfers in favour of the network operator were not provided,
for which reason it was determined that operating costs should be entirely covered by tolls paid by
train operators.
This organizational and financial arrangement for the railway sector did not work and had to be
revised at the beginning of the 2000s, mainly due to the fact that the network needed substantial
investments for modernization and renewal. At the time of the reform, British rail transport was not in
adequate organizational conditions due to insufficient investments in previous years in both the
network and in rolling stock. Moreover, with the new, decidedly profit-oriented, post-reform private
managers and the presence of limited-duration service concessions (franchising contracts), there were
no sufficient incentives to accelerate investments while, in the presence of revenues that could not
easily be increased in the short term, the possibility of gaining profits and rewarding shareholders
depended principally on the reduction of costs. As a result of this, insufficient maintenance and
renewals were carried out, leading to both an old and inadequate network and a dated rolling stock
fleet. The discovery of the severe functional deficiencies of the network in the late '90s led to the need
for costly, extraordinary, improvement interventions that could not be supported by its private operator
and thus required increasing public financial support. The Blair government therefore decided to
restore network operation to public control and to proceed with direct subsidies for its financing needs.
Since then, the different elements of support of the rail sector are as follows:
13
i. Direct subsidies to the network operators (Network Rail and LCR–London and Continental
Railways);
ii. Transfers from the central government to passenger TOCs for franchising contracts (which
include Performance Receipts, expenses and performance awards).
iii. Transfers to the Passenger Transport Executives (PTE) for metropolitan rail transport;
iv. Subsidies to the freight transport segment;
v. Residual costs of the financial relationships between the public sector and the railway sector.
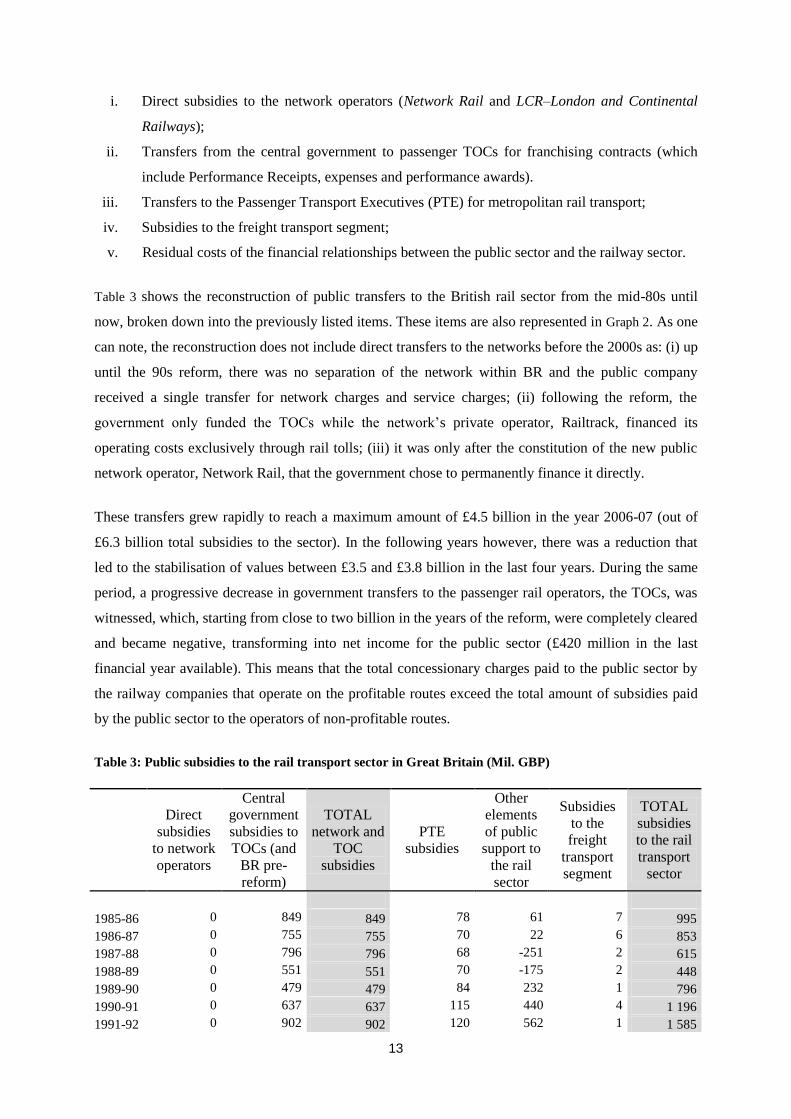
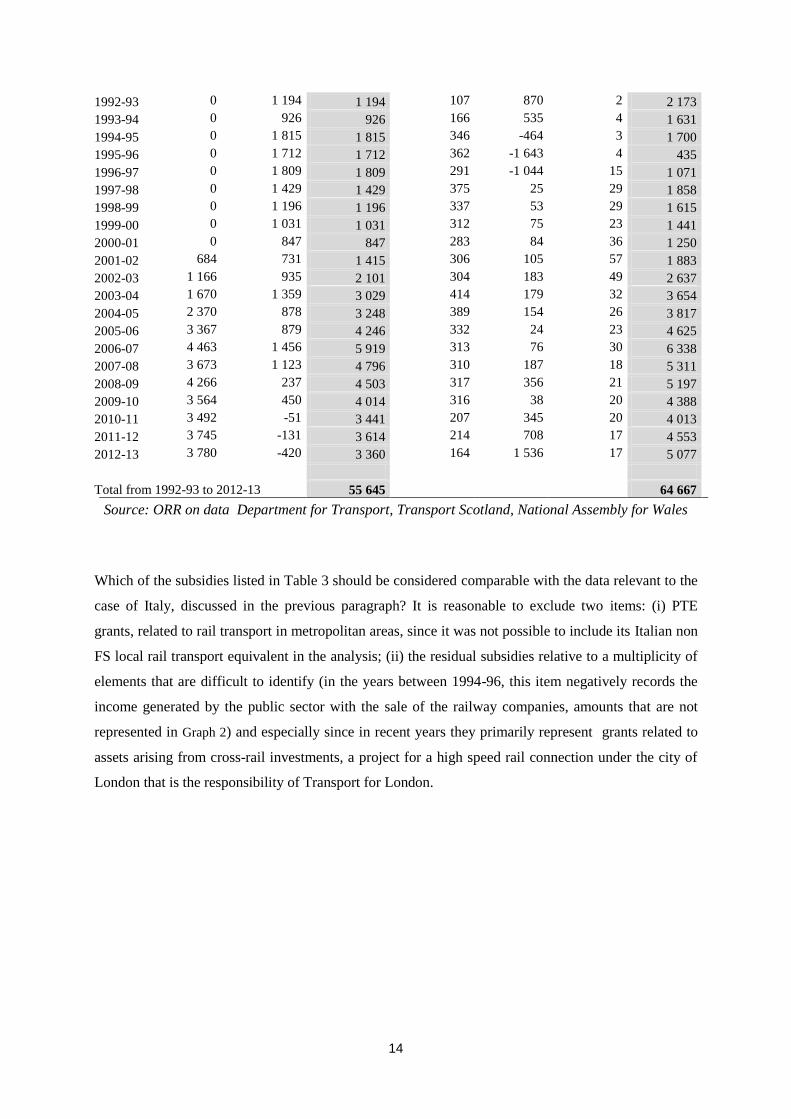
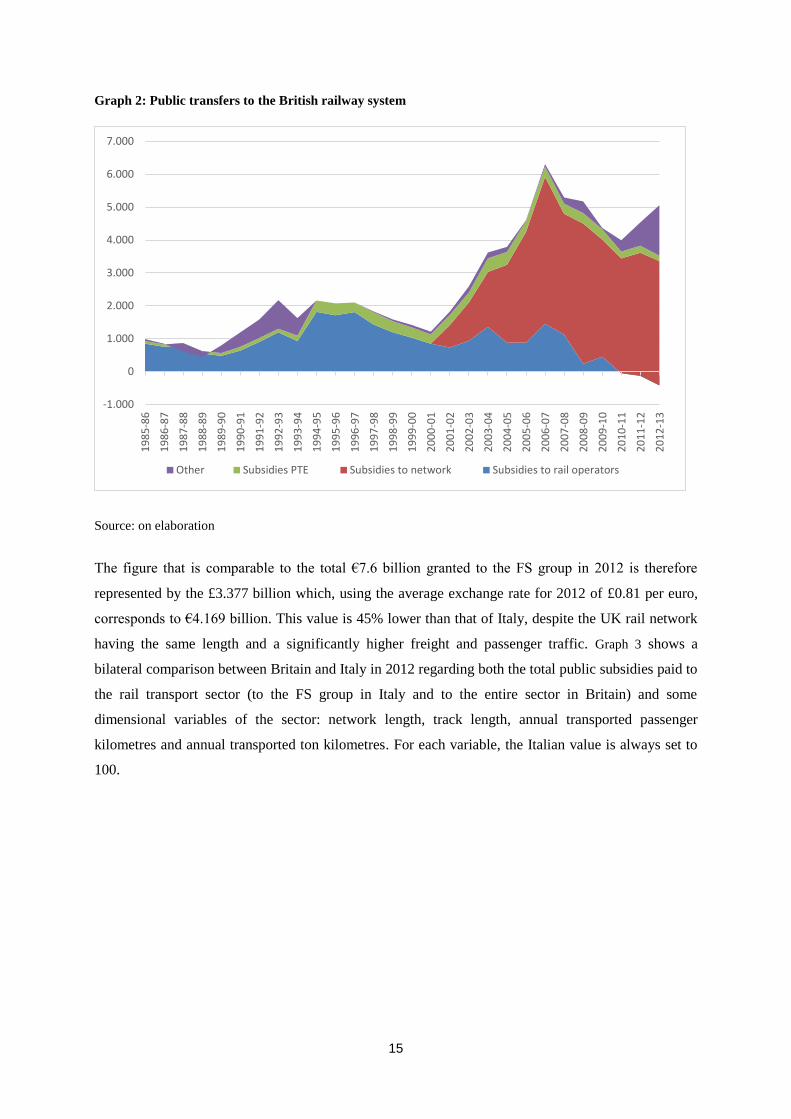
Table 3 shows the reconstruction of public transfers to the British rail sector from the mid-80s until
now, broken down into the previously listed items. These items are also represented in Graph 2. As one
can note, the reconstruction does not include direct transfers to the networks before the 2000s as: (i) up
until the 90s reform, there was no separation of the network within BR and the public company
received a single transfer for network charges and service charges; (ii) following the reform, the
government only funded the TOCs while the network’s private operator, Railtrack, financed its
operating costs exclusively through rail tolls; (iii) it was only after the constitution of the new public
network operator, Network Rail, that the government chose to permanently finance it directly.
These transfers grew rapidly to reach a maximum amount of £4.5 billion in the year 2006-07 (out of
£6.3 billion total subsidies to the sector). In the following years however, there was a reduction that
led to the stabilisation of values between £3.5 and £3.8 billion in the last four years. During the same
period, a progressive decrease in government transfers to the passenger rail operators, the TOCs, was
witnessed, which, starting from close to two billion in the years of the reform, were completely cleared
and became negative, transforming into net income for the public sector (£420 million in the last
financial year available). This means that the total concessionary charges paid to the public sector by
the railway companies that operate on the profitable routes exceed the total amount of subsidies paid
by the public sector to the operators of non-profitable routes.
Table 3: Public subsidies to the rail transport sector in Great Britain (Mil. GBP)
Direct
subsidies
to network
operators
Central
government
subsidies to
TOCs (and
BR pre-
reform)
TOTAL
network and
TOC
subsidies
PTE
subsidies
Other
elements
of public
support to
the rail
sector
Subsidies
to the
freight
transport
segment
TOTAL
subsidies
to the rail
transport
sector
1985-86 0 849 849 78 61 7 995
1986-87 0 755 755 70 22 6 853
1987-88 0 796 796 68 -251 2 615
1988-89 0 551 551 70 -175 2 448
1989-90 0 479 479 84 232 1 796
1990-91 0 637 637 115 440 4 1 196
1991-92 0 902 902 120 562 1 1 585
14
1992-93 0 1 194 1 194 107 870 2 2 173
1993-94 0 926 926 166 535 4 1 631
1994-95 0 1 815 1 815 346 -464 3 1 700
1995-96 0 1 712 1 712 362 -1 643 4 435
1996-97 0 1 809 1 809 291 -1 044 15 1 071
1997-98 0 1 429 1 429 375 25 29 1 858
1998-99 0 1 196 1 196 337 53 29 1 615
1999-00 0 1 031 1 031 312 75 23 1 441
2000-01 0 847 847 283 84 36 1 250
2001-02 684 731 1 415 306 105 57 1 883
2002-03 1 166 935 2 101 304 183 49 2 637
2003-04 1 670 1 359 3 029 414 179 32 3 654
2004-05 2 370 878 3 248 389 154 26 3 817
2005-06 3 367 879 4 246 332 24 23 4 625
2006-07 4 463 1 456 5 919 313 76 30 6 338
2007-08 3 673 1 123 4 796 310 187 18 5 311
2008-09 4 266 237 4 503 317 356 21 5 197
2009-10 3 564 450 4 014 316 38 20 4 388
2010-11 3 492 -51 3 441 207 345 20 4 013
2011-12 3 745 -131 3 614 214 708 17 4 553
2012-13 3 780 -420 3 360 164 1 536 17 5 077
Total from 1992-93 to 2012-13 55 645 64 667
Source: ORR on data Department for Transport, Transport Scotland, National Assembly for Wales
Which of the subsidies listed in Table 3 should be considered comparable with the data relevant to the
case of Italy, discussed in the previous paragraph? It is reasonable to exclude two items: (i) PTE
grants, related to rail transport in metropolitan areas, since it was not possible to include its Italian non
FS local rail transport equivalent in the analysis; (ii) the residual subsidies relative to a multiplicity of
elements that are difficult to identify (in the years between 1994-96, this item negatively records the
income generated by the public sector with the sale of the railway companies, amounts that are not
represented in Graph 2) and especially since in recent years they primarily represent grants related to
assets arising from cross-rail investments, a project for a high speed rail connection under the city of
London that is the responsibility of Transport for London.
15
Graph 2: Public transfers to the British railway system
Source: on elaboration
The figure that is comparable to the total €7.6 billion granted to the FS group in 2012 is therefore
represented by the £3.377 billion which, using the average exchange rate for 2012 of £0.81 per euro,
corresponds to €4.169 billion. This value is 45% lower than that of Italy, despite the UK rail network
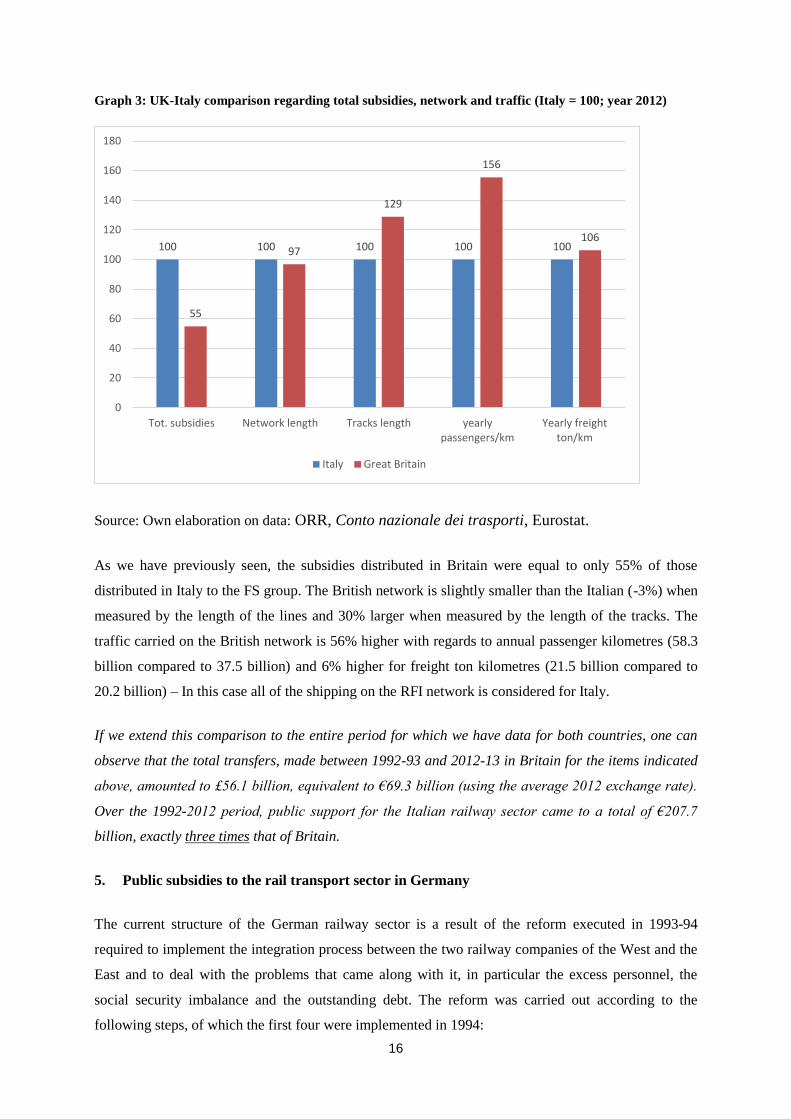
having the same length and a significantly higher freight and passenger traffic. Graph 3 shows a
bilateral comparison between Britain and Italy in 2012 regarding both the total public subsidies paid to
the rail transport sector (to the FS group in Italy and to the entire sector in Britain) and some
dimensional variables of the sector: network length, track length, annual transported passenger
kilometres and annual transported ton kilometres. For each variable, the Italian value is always set to
100.
-1.000
0
1.000
2.000
3.000
4.000
5.000
6.000
7.0001
98
5-8
6
19
86
-87
19
87
-88
19
88
-89
19
89
-90
19
90
-91
19
91
-92
19
92
-93
19
93
-94
19
94
-95
19
95
-96
19
96
-97
19
97
-98
19
98
-99
19
99
-00
20
00
-01
20
01
-02
20
02
-03
20
03
-04
20
04
-05
20
05
-06
20
06
-07
20
07
-08
20
08
-09
20
09
-10
20
10
-11
20
11
-12
20
12
-13
Other Subsidies PTE Subsidies to network Subsidies to rail operators
16
Graph 3: UK-Italy comparison regarding total subsidies, network and traffic (Italy = 100; year 2012)
Source: Own elaboration on data: ORR, Conto nazionale dei trasporti, Eurostat.
As we have previously seen, the subsidies distributed in Britain were equal to only 55% of those
distributed in Italy to the FS group. The British network is slightly smaller than the Italian (-3%) when
measured by the length of the lines and 30% larger when measured by the length of the tracks. The
traffic carried on the British network is 56% higher with regards to annual passenger kilometres (58.3
billion compared to 37.5 billion) and 6% higher for freight ton kilometres (21.5 billion compared to
20.2 billion) – In this case all of the shipping on the RFI network is considered for Italy.
If we extend this comparison to the entire period for which we have data for both countries, one can
observe that the total transfers, made between 1992-93 and 2012-13 in Britain for the items indicated
above, amounted to £56.1 billion, equivalent to €69.3 billion (using the average 2012 exchange rate).
Over the 1992-2012 period, public support for the Italian railway sector came to a total of €207.7
billion, exactly three times that of Britain.
5. Public subsidies to the rail transport sector in Germany
The current structure of the German railway sector is a result of the reform executed in 1993-94
required to implement the integration process between the two railway companies of the West and the
East and to deal with the problems that came along with it, in particular the excess personnel, the
social security imbalance and the outstanding debt. The reform was carried out according to the
following steps, of which the first four were implemented in 1994:
100 100 100 100 100
55
97
129
156
106
0
20
40
60
80
100
120
140
160
180
Tot. subsidies Network length Tracks length yearlypassengers/km
Yearly freightton/km
Italy Great Britain
17
i. The definitive merger of the two companies into a single LTD, (DeutscheBahn Aktion
Gesellschaft) DB AG, divided into three main areas of operation: infrastructure management,
passenger transport and freight transport.
ii. The creation of the EBA (Eisenbahnbundesamt), the Federal Railway Office, a public body for
the technical and partly economic regulation of rail activity, responsible for public funding to
the company.
iii. Reliance on the new body, BEV (Bundeseisenbahnvermagen), a kind of bad public company,
for the management of redundant and retired staff of the old rail companies DB and DR together
with the management of the debt of the past companies, amounting to around 67 billion marks
(corresponding to €34 billion). The federal government bore all of the charges relating to the
historical debt and to retired employees up until the end of 1993.
iv. From 1994, DB Netz was responsible for infrastructure management and carrying out activities
related to the allocation of network capacity to the carriers requesting it, traffic control, network
maintenance and improvements, and the construction of new routes. The company operated
according to commercial principals and recovered its operating costs through solely through toll
charges collected by the carriers and other commercial revenue while the government was
responsible for supporting the costs arising from investments in the network.
v. In 1996, making the Länder responsible for local passenger transport with particular regards to
the definition of different levels of service offered and the possibility to appoint rail operators at
a local level. Simultaneously, the definition of a scheme of subsidies from the federal
government to the Länder was defined to enable them to fund the service.
vi. The division of the DB AG into three independent companies corresponding to the previous
divisions. Consequently, DB became a holding company at the beginning of 1999 that
controlled the following specialised companies: Netz for network management, Reise&Touristik
for long-haul passenger transport; Regio for short-haul passenger transport; Cargo for freight
transport; Station & Service for the management of railway stations and rail yards. In 2002, the
railway market was fully liberalised with free access to the network.
vii. In 2008, DB AG was divided into two separate holdings, the first for network activities (DB AG
that owns 100% of DB Netz Ag, Db Station & Service Ag and DB Energy GmbH) and the
second for transport activities (DB Mobility Logistics Ag). Thereby, a clearer separation
between the network and services was created, comparable to that formed in Sweden at the
beginning of the decade.
Based on the reform, the powers responsible for the provision of subsidies to the rail transport sector
are shared between the central government and local authorities: the Bund is mainly responsible for
financing investments in infrastructure while the Länder, through special authorities of the sector, are
responsible for defining public service obligations for regional/local transport and distributing the
relative compensations. A total of 27 local bodies consequently determine the levels of service and
18
assign the offer, choosing between direct entrustment to the Deutsche Bahn, to a different operator, or
to put the service to tender.
Long distance passenger transport cannot however benefit from public support or service obligation
programmes (PSO), but must rely entirely on market revenues (as a result of this rule, after the
implementation of the reform DA reduced the supply of long distance passenger transport on routes
that were not considered profitable). Funds required by local authorities to finance regional rail
transport are guaranteed by federal transfers from the Regionalisation Fund (RF), whose funds, equal
to around €7 billion per year, also include the financing of road transport in metropolitan areas and of
modernising stations. Only around three-quarters of the Regionalisation Fund is used for local rail
transport.
The types of public subsidies to the German railway system can therefore be classified into the
following:
i. Financial support from the central government to the network managers DB Netz for
investments (new programmes and network renewals).
ii. Funding from local authorities appointed by the Länder for charges arising from public service
obligations (PSO) for regional transport, which is either attributed directly or by tender. On the
basis of the 2010 data available, more than 85% of national expenditure for this purpose is given
to Deutsche Bahn
iii. Financial support to the public entity, BV, that is responsible for paying pensions to pre-reform
rail employees and managing the stock of debt inherited from the previous rail companies. This
support does not generate direct benefits for the two Deutsche Bahn holdings.
19
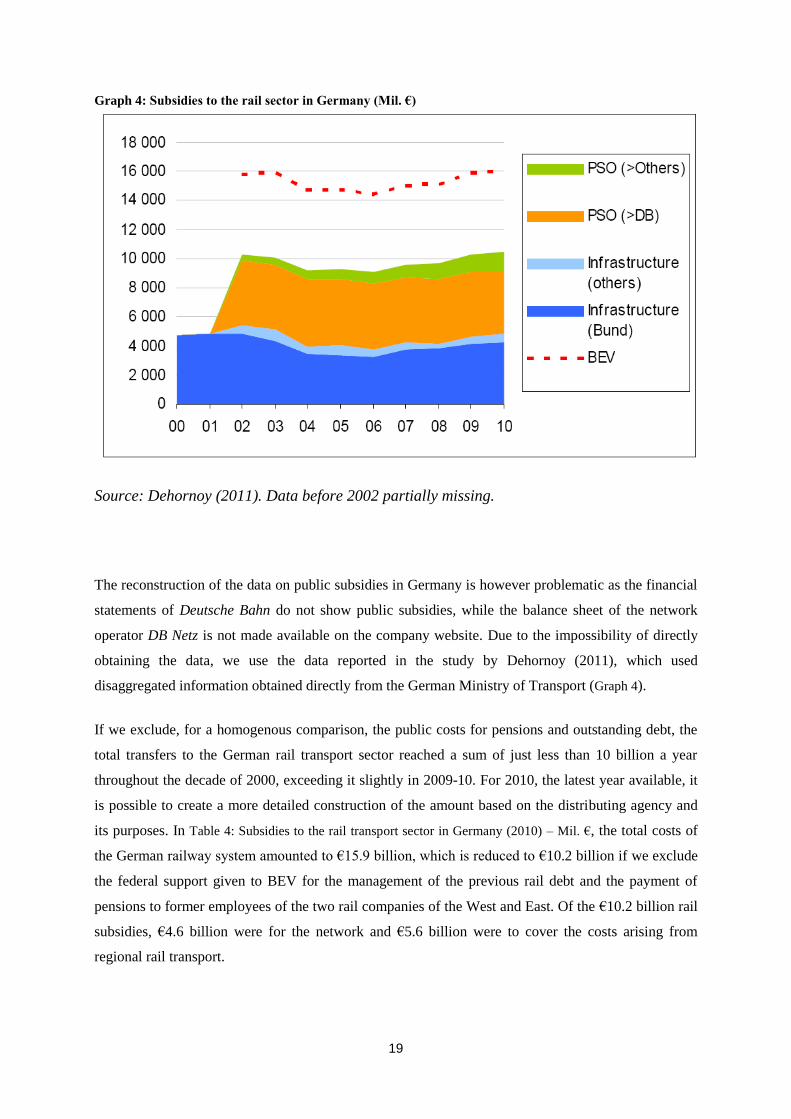
Graph 4: Subsidies to the rail sector in Germany (Mil. €)
Source: Dehornoy (2011). Data before 2002 partially missing.
The reconstruction of the data on public subsidies in Germany is however problematic as the financial
statements of Deutsche Bahn do not show public subsidies, while the balance sheet of the network
operator DB Netz is not made available on the company website. Due to the impossibility of directly
obtaining the data, we use the data reported in the study by Dehornoy (2011), which used
disaggregated information obtained directly from the German Ministry of Transport (Graph 4).
If we exclude, for a homogenous comparison, the public costs for pensions and outstanding debt, the
total transfers to the German rail transport sector reached a sum of just less than 10 billion a year
throughout the decade of 2000, exceeding it slightly in 2009-10. For 2010, the latest year available, it
is possible to create a more detailed construction of the amount based on the distributing agency and
its purposes. In Table 4: Subsidies to the rail transport sector in Germany (2010) – Mil. €, the total costs of
the German railway system amounted to €15.9 billion, which is reduced to €10.2 billion if we exclude
the federal support given to BEV for the management of the previous rail debt and the payment of
pensions to former employees of the two rail companies of the West and East. Of the €10.2 billion rail
subsidies, €4.6 billion were for the network and €5.6 billion were to cover the costs arising from
regional rail transport.
20
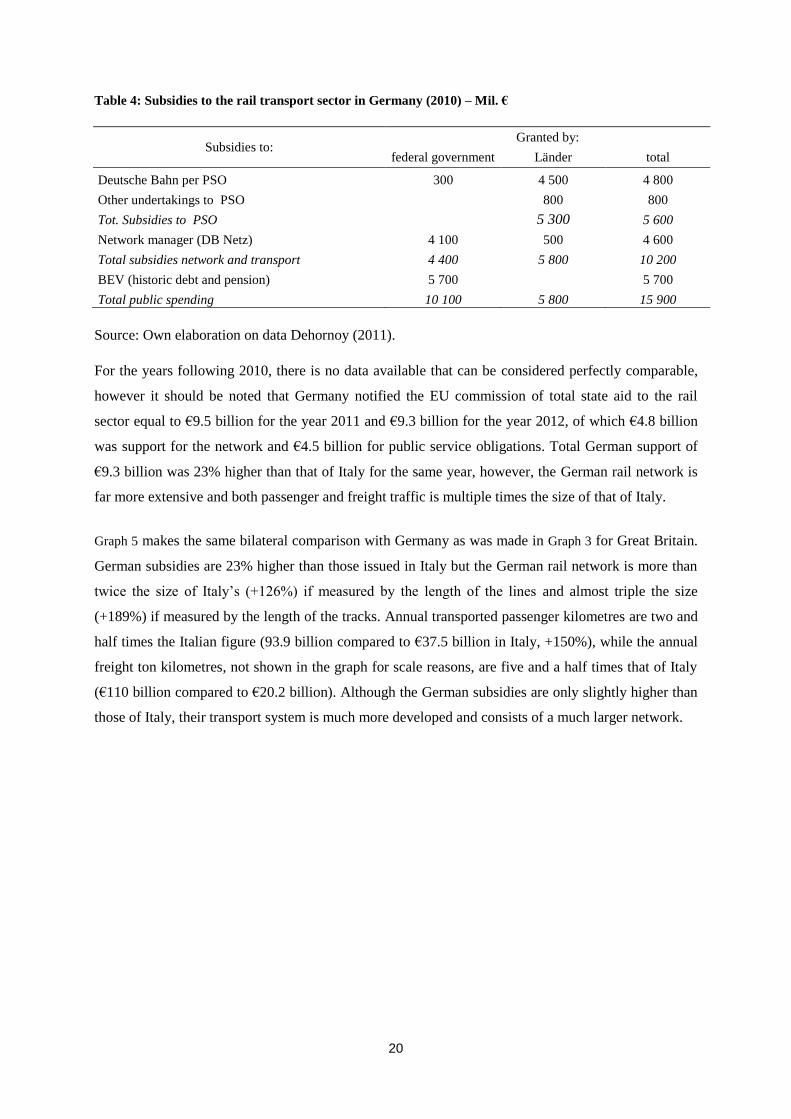
Table 4: Subsidies to the rail transport sector in Germany (2010) – Mil. €
Subsidies to: Granted by:
federal government Länder total
Deutsche Bahn per PSO 300 4 500 4 800
Other undertakings to PSO 800 800
Tot. Subsidies to PSO 5 300 5 600
Network manager (DB Netz) 4 100 500 4 600
Total subsidies network and transport 4 400 5 800 10 200
BEV (historic debt and pension) 5 700 5 700
Total public spending 10 100 5 800 15 900
Source: Own elaboration on data Dehornoy (2011).
For the years following 2010, there is no data available that can be considered perfectly comparable,
however it should be noted that Germany notified the EU commission of total state aid to the rail
sector equal to €9.5 billion for the year 2011 and €9.3 billion for the year 2012, of which €4.8 billion
was support for the network and €4.5 billion for public service obligations. Total German support of
€9.3 billion was 23% higher than that of Italy for the same year, however, the German rail network is
far more extensive and both passenger and freight traffic is multiple times the size of that of Italy.
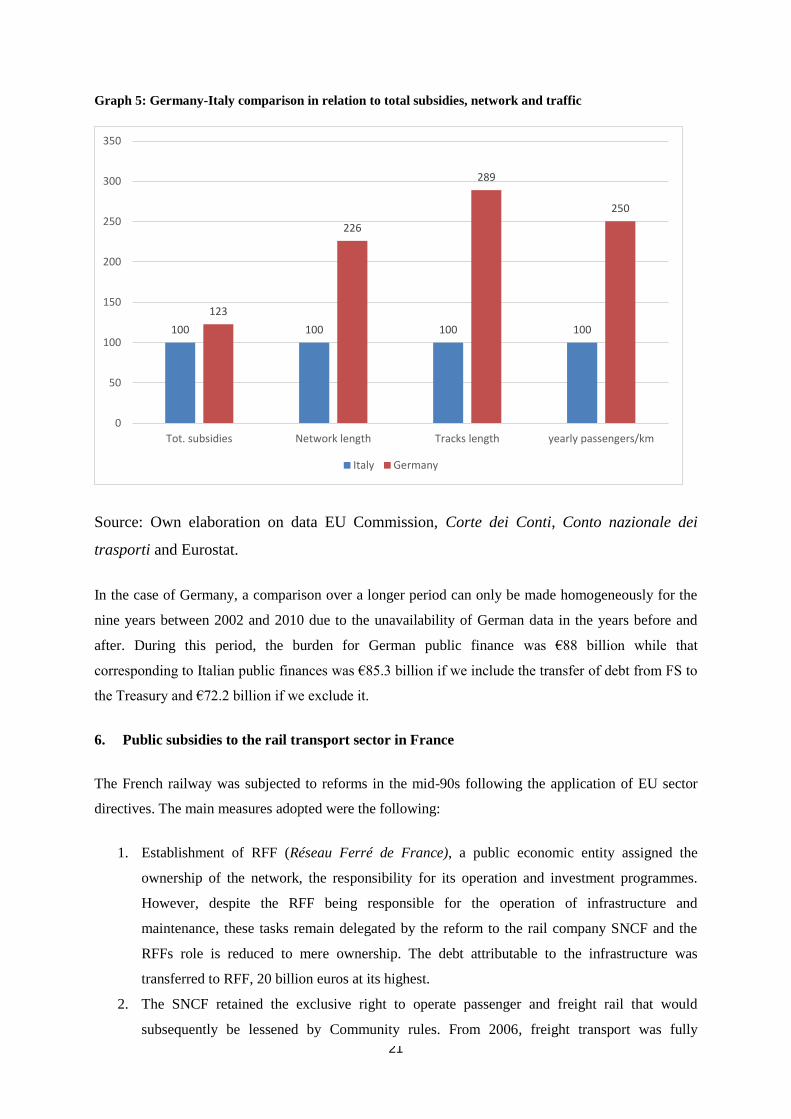
Graph 5 makes the same bilateral comparison with Germany as was made in Graph 3 for Great Britain.
German subsidies are 23% higher than those issued in Italy but the German rail network is more than
twice the size of Italy’s (+126%) if measured by the length of the lines and almost triple the size
(+189%) if measured by the length of the tracks. Annual transported passenger kilometres are two and
half times the Italian figure (93.9 billion compared to €37.5 billion in Italy, +150%), while the annual
freight ton kilometres, not shown in the graph for scale reasons, are five and a half times that of Italy
(€110 billion compared to €20.2 billion). Although the German subsidies are only slightly higher than
those of Italy, their transport system is much more developed and consists of a much larger network.
21
Graph 5: Germany-Italy comparison in relation to total subsidies, network and traffic
Source: Own elaboration on data EU Commission, Corte dei Conti, Conto nazionale dei
trasporti and Eurostat.
In the case of Germany, a comparison over a longer period can only be made homogeneously for the
nine years between 2002 and 2010 due to the unavailability of German data in the years before and
after. During this period, the burden for German public finance was €88 billion while that
corresponding to Italian public finances was €85.3 billion if we include the transfer of debt from FS to
the Treasury and €72.2 billion if we exclude it.
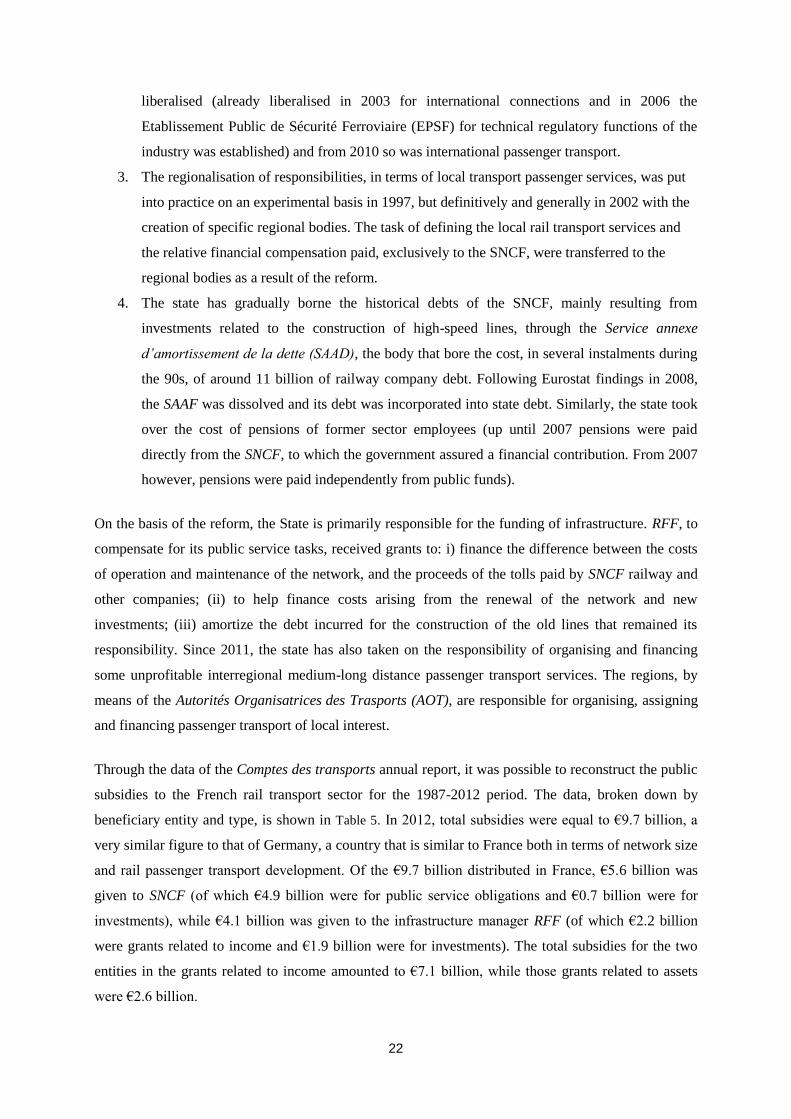
6. Public subsidies to the rail transport sector in France
The French railway was subjected to reforms in the mid-90s following the application of EU sector
directives. The main measures adopted were the following:
1. Establishment of RFF (Réseau Ferré de France), a public economic entity assigned the
ownership of the network, the responsibility for its operation and investment programmes.
However, despite the RFF being responsible for the operation of infrastructure and
maintenance, these tasks remain delegated by the reform to the rail company SNCF and the
RFFs role is reduced to mere ownership. The debt attributable to the infrastructure was
transferred to RFF, 20 billion euros at its highest.
2. The SNCF retained the exclusive right to operate passenger and freight rail that would
subsequently be lessened by Community rules. From 2006, freight transport was fully
100 100 100 100
123
226
289
250
0
50
100
150
200
250
300
350
Tot. subsidies Network length Tracks length yearly passengers/km
Italy Germany
22
liberalised (already liberalised in 2003 for international connections and in 2006 the
Etablissement Public de Sécurité Ferroviaire (EPSF) for technical regulatory functions of the
industry was established) and from 2010 so was international passenger transport.
3. The regionalisation of responsibilities, in terms of local transport passenger services, was put
into practice on an experimental basis in 1997, but definitively and generally in 2002 with the
creation of specific regional bodies. The task of defining the local rail transport services and
the relative financial compensation paid, exclusively to the SNCF, were transferred to the
regional bodies as a result of the reform.
4. The state has gradually borne the historical debts of the SNCF, mainly resulting from
investments related to the construction of high-speed lines, through the Service annexe
d’amortissement de la dette (SAAD), the body that bore the cost, in several instalments during
the 90s, of around 11 billion of railway company debt. Following Eurostat findings in 2008,
the SAAF was dissolved and its debt was incorporated into state debt. Similarly, the state took
over the cost of pensions of former sector employees (up until 2007 pensions were paid
directly from the SNCF, to which the government assured a financial contribution. From 2007
however, pensions were paid independently from public funds).
On the basis of the reform, the State is primarily responsible for the funding of infrastructure. RFF, to
compensate for its public service tasks, received grants to: i) finance the difference between the costs
of operation and maintenance of the network, and the proceeds of the tolls paid by SNCF railway and
other companies; (ii) to help finance costs arising from the renewal of the network and new
investments; (iii) amortize the debt incurred for the construction of the old lines that remained its
responsibility. Since 2011, the state has also taken on the responsibility of organising and financing
some unprofitable interregional medium-long distance passenger transport services. The regions, by
means of the Autorités Organisatrices des Trasports (AOT), are responsible for organising, assigning
and financing passenger transport of local interest.
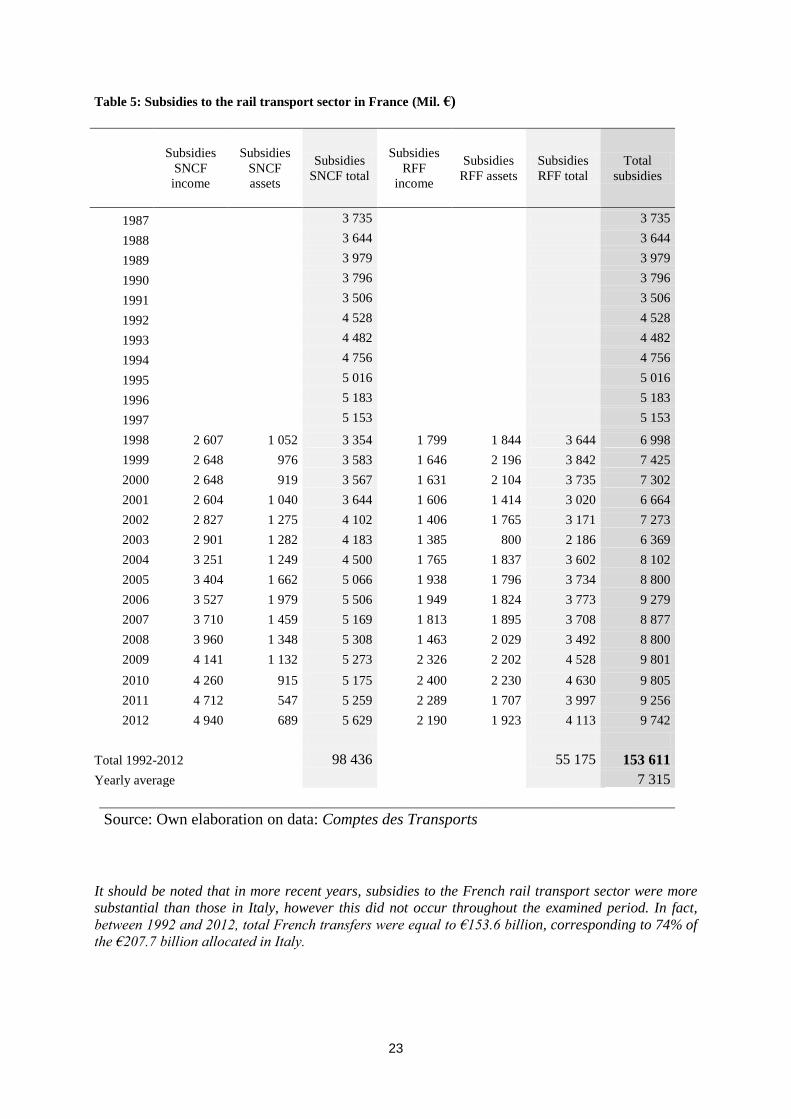
Through the data of the Comptes des transports annual report, it was possible to reconstruct the public
subsidies to the French rail transport sector for the 1987-2012 period. The data, broken down by
beneficiary entity and type, is shown in Table 5. In 2012, total subsidies were equal to €9.7 billion, a
very similar figure to that of Germany, a country that is similar to France both in terms of network size
and rail passenger transport development. Of the €9.7 billion distributed in France, €5.6 billion was
given to SNCF (of which €4.9 billion were for public service obligations and €0.7 billion were for
investments), while €4.1 billion was given to the infrastructure manager RFF (of which €2.2 billion
were grants related to income and €1.9 billion were for investments). The total subsidies for the two
entities in the grants related to income amounted to €7.1 billion, while those grants related to assets
were €2.6 billion.
23
Table 5: Subsidies to the rail transport sector in France (Mil. €)
Subsidies
SNCF
income
Subsidies
SNCF
assets
Subsidies
SNCF total
Subsidies
RFF
income
Subsidies
RFF assets
Subsidies
RFF total
Total
subsidies
1987 3 735 3 735
1988 3 644 3 644
1989 3 979 3 979
1990 3 796 3 796
1991 3 506 3 506
1992 4 528 4 528
1993 4 482 4 482
1994 4 756 4 756
1995 5 016 5 016
1996 5 183 5 183
1997 5 153
5 153
1998 2 607 1 052 3 354 1 799 1 844 3 644 6 998
1999 2 648 976 3 583 1 646 2 196 3 842 7 425
2000 2 648 919 3 567 1 631 2 104 3 735 7 302
2001 2 604 1 040 3 644 1 606 1 414 3 020 6 664
2002 2 827 1 275 4 102 1 406 1 765 3 171 7 273
2003 2 901 1 282 4 183 1 385 800 2 186 6 369
2004 3 251 1 249 4 500 1 765 1 837 3 602 8 102
2005 3 404 1 662 5 066 1 938 1 796 3 734 8 800
2006 3 527 1 979 5 506 1 949 1 824 3 773 9 279
2007 3 710 1 459 5 169 1 813 1 895 3 708 8 877
2008 3 960 1 348 5 308 1 463 2 029 3 492 8 800
2009 4 141 1 132 5 273 2 326 2 202 4 528 9 801
2010 4 260 915 5 175 2 400 2 230 4 630 9 805
2011 4 712 547 5 259 2 289 1 707 3 997 9 256
2012 4 940 689 5 629 2 190 1 923 4 113 9 742
Total 1992-2012
98 436
55 175 153 611
Yearly average
7 315
Source: Own elaboration on data: Comptes des Transports
It should be noted that in more recent years, subsidies to the French rail transport sector were more
substantial than those in Italy, however this did not occur throughout the examined period. In fact,
between 1992 and 2012, total French transfers were equal to €153.6 billion, corresponding to 74% of
the €207.7 billion allocated in Italy.
24
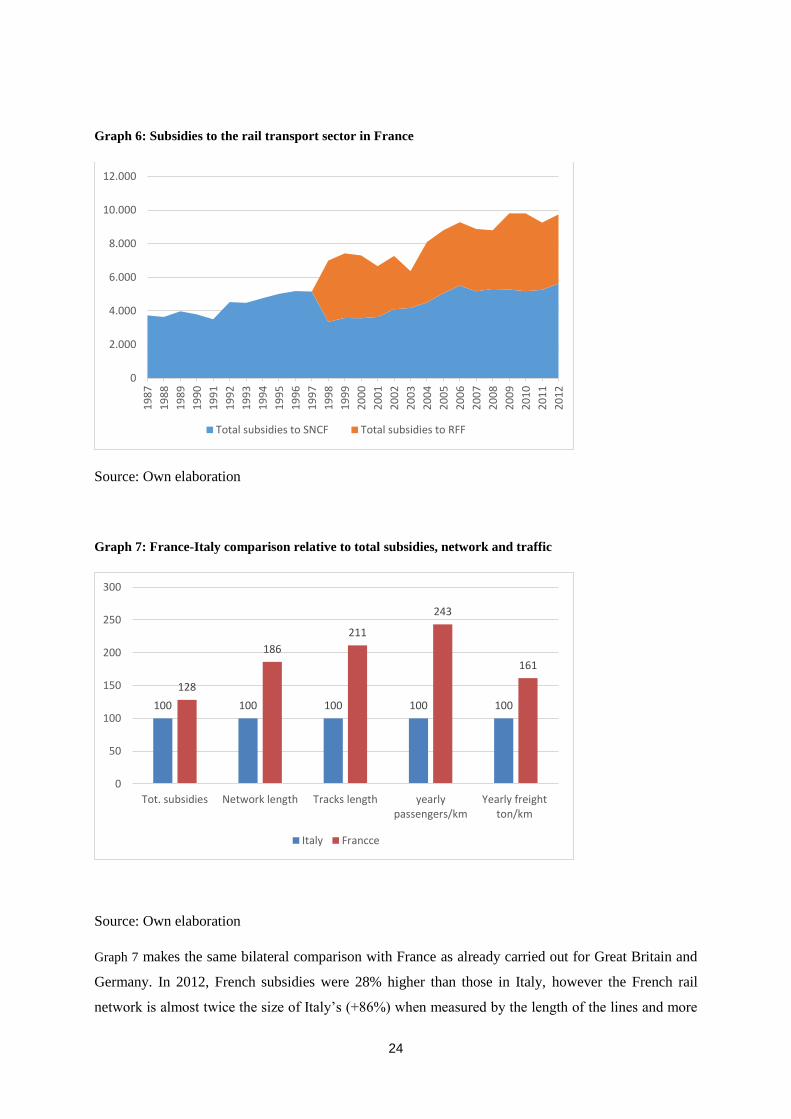
Graph 6: Subsidies to the rail transport sector in France
Source: Own elaboration
Graph 7: France-Italy comparison relative to total subsidies, network and traffic
Source: Own elaboration
Graph 7 makes the same bilateral comparison with France as already carried out for Great Britain and
Germany. In 2012, French subsidies were 28% higher than those in Italy, however the French rail
network is almost twice the size of Italy’s (+86%) when measured by the length of the lines and more
0
2.000
4.000
6.000
8.000
10.000
12.000
19
87
19
88
19
89
19
90
19
91
19
92
19
93
19
94
19
95
19
96
19
97
19
98
19
99
20
00
20
01
20
02
20
03
20
04
20
05
20
06
20
07
20
08
20
09
20
10
20
11
20
12
Total subsidies to SNCF Total subsidies to RFF
100 100 100 100 100
128
186
211
243
161
0
50
100
150
200
250
300
Tot. subsidies Network length Tracks length yearlypassengers/km
Yearly freightton/km
Italy Francce
25
than double (+111%) when measured by the length of the tracks. The annual transported passenger
kilometres were 2.5 times those of Italy (91.2 billion versus 37.5 billion in Italy, (+143%) while
annual freight ton kilometres were 61% higher than the Italian figure. Similarly to the German case,
we can also say that French subsidies were only slightly higher, however the network is much larger
and the traffic much greater.
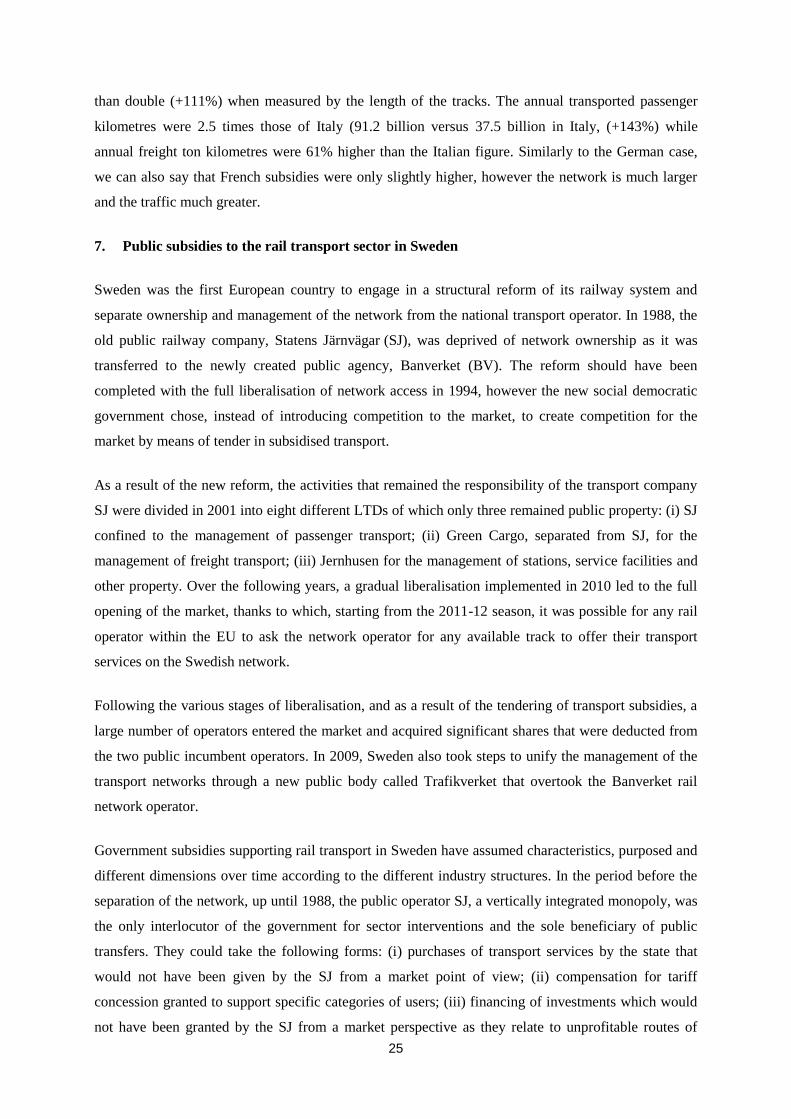
7. Public subsidies to the rail transport sector in Sweden
Sweden was the first European country to engage in a structural reform of its railway system and
separate ownership and management of the network from the national transport operator. In 1988, the
old public railway company, Statens Järnvägar (SJ), was deprived of network ownership as it was
transferred to the newly created public agency, Banverket (BV). The reform should have been
completed with the full liberalisation of network access in 1994, however the new social democratic
government chose, instead of introducing competition to the market, to create competition for the
market by means of tender in subsidised transport.
As a result of the new reform, the activities that remained the responsibility of the transport company
SJ were divided in 2001 into eight different LTDs of which only three remained public property: (i) SJ
confined to the management of passenger transport; (ii) Green Cargo, separated from SJ, for the
management of freight transport; (iii) Jernhusen for the management of stations, service facilities and
other property. Over the following years, a gradual liberalisation implemented in 2010 led to the full
opening of the market, thanks to which, starting from the 2011-12 season, it was possible for any rail
operator within the EU to ask the network operator for any available track to offer their transport
services on the Swedish network.
Following the various stages of liberalisation, and as a result of the tendering of transport subsidies, a
large number of operators entered the market and acquired significant shares that were deducted from
the two public incumbent operators. In 2009, Sweden also took steps to unify the management of the
transport networks through a new public body called Trafikverket that overtook the Banverket rail
network operator.
Government subsidies supporting rail transport in Sweden have assumed characteristics, purposed and
different dimensions over time according to the different industry structures. In the period before the
separation of the network, up until 1988, the public operator SJ, a vertically integrated monopoly, was
the only interlocutor of the government for sector interventions and the sole beneficiary of public
transfers. They could take the following forms: (i) purchases of transport services by the state that
would not have been given by the SJ from a market point of view; (ii) compensation for tariff
concession granted to support specific categories of users; (iii) financing of investments which would
not have been granted by the SJ from a market perspective as they relate to unprofitable routes of
26
interventions; (iv) cancellation of the debts accumulated by SJ to the state. In the decade preceding the
1988 reform, the different types of transfers resulted in an annual average outlay, if certain stages of SJ
debt repayment are excluded, of around 3 billion kronor at 2011 prices, corresponding to less than 300
million euros (Nilsson, 2002).
Following the reform, the different types of subsidy, their total amount, the entities that granted them
and the subjects to which they were intended all changed. Government transfers to Banverket, the new
network manager, were designed to cover: (i) the difference between operating and maintenance costs
and revenues from rail tolls; (ii) investments for network renewals and new projects. Passenger
operators, initially SJ but later all of the operators that won the assignment tender, received
compensation for non-market transport services. Two types of distinct entities distribute these: (i)
Rijkstrafik for interregional/long distance passenger rail services; (ii) the CPTA – County Passenger
Transport Authorities for regional/local services. These grants were permanently low values, never
exceeding 1 billion kroner per year throughout the 90s decade, corresponding to less than 100 million
euros. They included, among other things, gross chargers for the public sector as the type of contract
with which the service is assigned by the local CPTA and Rijkstrafik is of ‘gross cost’: the grantor
pays the operator for the transport service based on the vehicle kms reached but takes the payment
from the passengers.
The overall cost of the network borne by the public sector is much larger than the subsidies to rail
carriers for unprofitable services. It was measured by Nillson (2002) for the 90s decade by calculating
the difference in total costs of Banverket, which include network operating costs, maintenance costs,
renewals and new investments, and operating revenues, mainly coming from rail tolls. Using the same
criteria, we have updated the Swedish data based on the annual reports of Banverket up until 2009 and
Trafikverket from 2010 onwards, with difficulties, in the case of the manager, coming from having to
separate the data related to the network from those related to the road network.
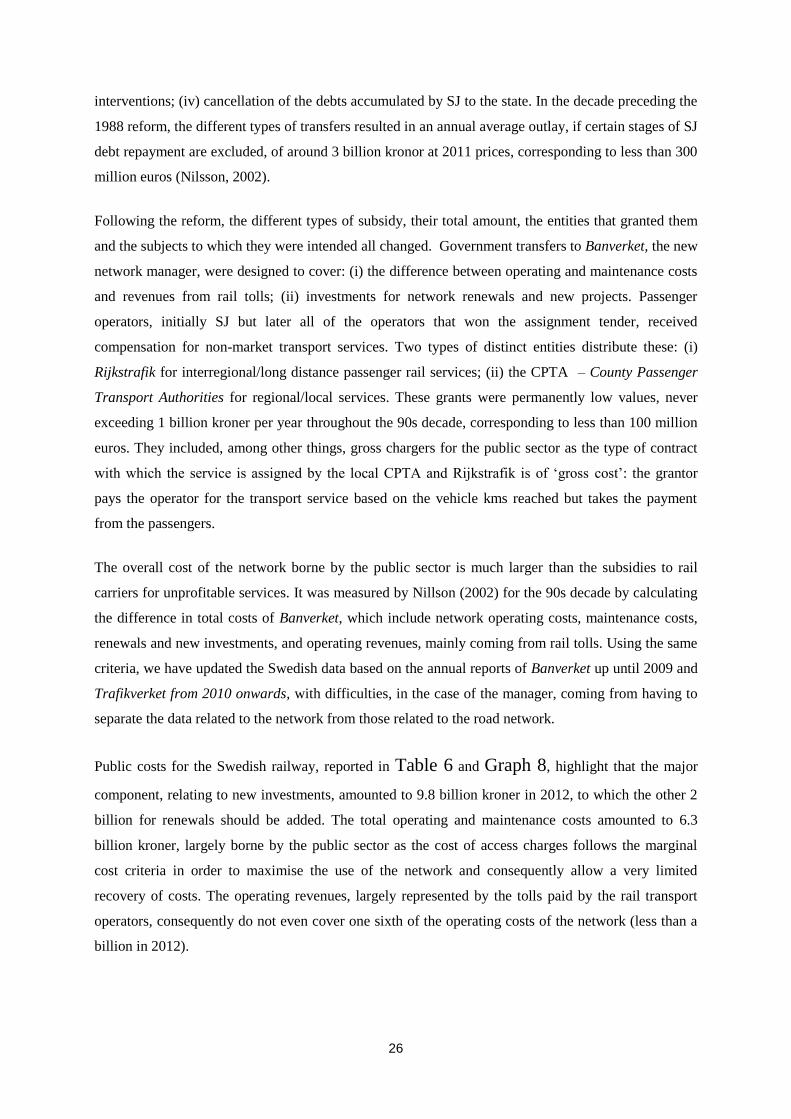
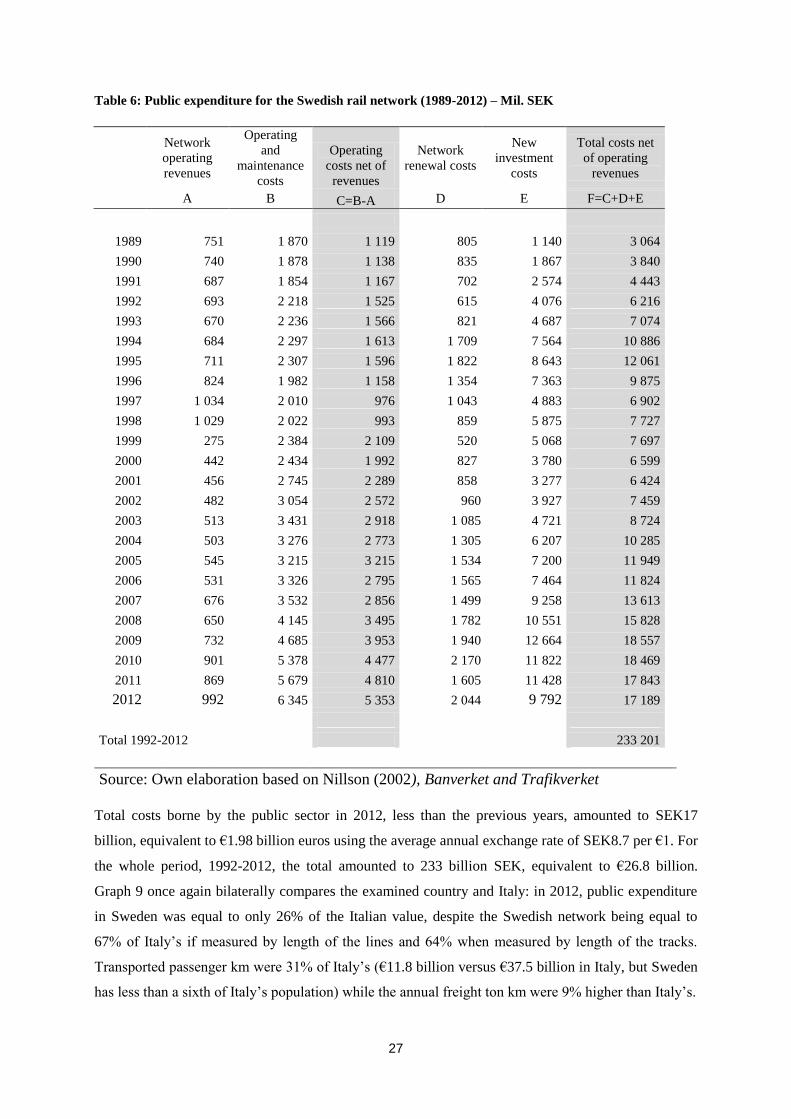
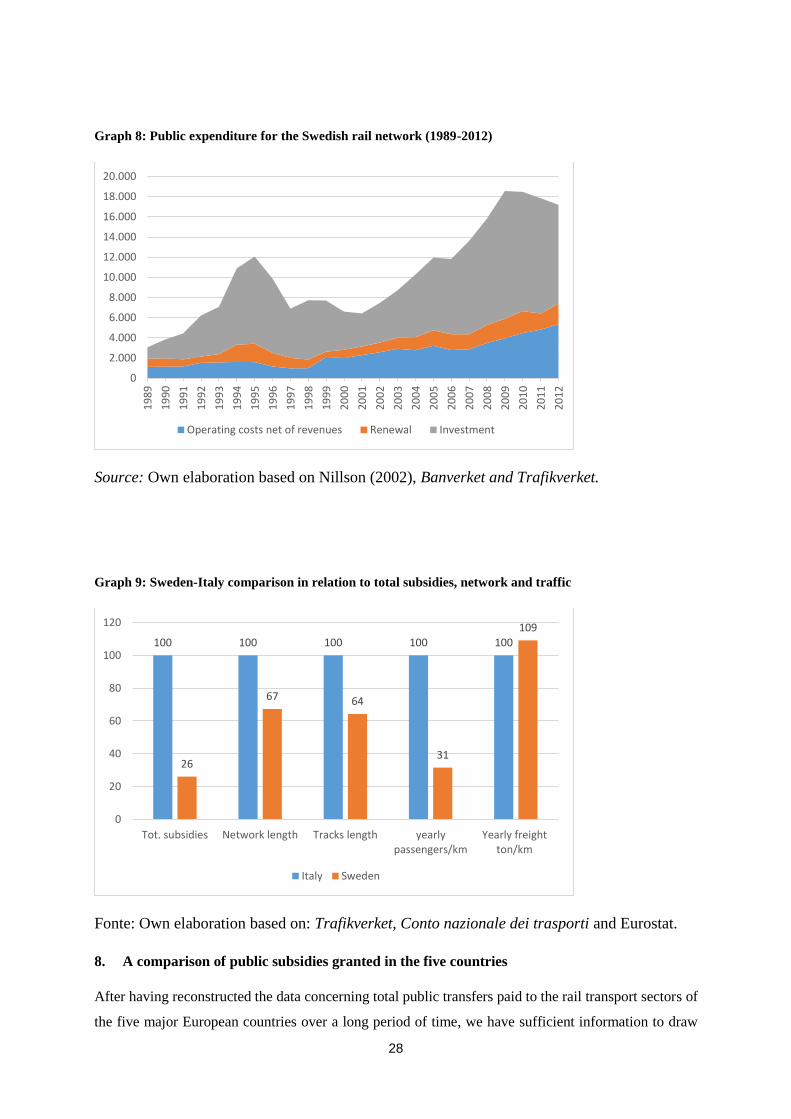
Public costs for the Swedish railway, reported in Table 6 and Graph 8, highlight that the major
component, relating to new investments, amounted to 9.8 billion kroner in 2012, to which the other 2
billion for renewals should be added. The total operating and maintenance costs amounted to 6.3
billion kroner, largely borne by the public sector as the cost of access charges follows the marginal
cost criteria in order to maximise the use of the network and consequently allow a very limited
recovery of costs. The operating revenues, largely represented by the tolls paid by the rail transport
operators, consequently do not even cover one sixth of the operating costs of the network (less than a
billion in 2012).
27
Table 6: Public expenditure for the Swedish rail network (1989-2012) – Mil. SEK
Network
operating
revenues
Operating
and
maintenance
costs
Operating
costs net of
revenues
Network
renewal costs
New
investment
costs
Total costs net
of operating
revenues
A B C=B-A D E F=C+D+E
1989 751 1 870 1 119 805 1 140 3 064
1990 740 1 878 1 138 835 1 867 3 840
1991 687 1 854 1 167 702 2 574 4 443
1992 693 2 218 1 525 615 4 076 6 216
1993 670 2 236 1 566 821 4 687 7 074
1994 684 2 297 1 613 1 709 7 564 10 886
1995 711 2 307 1 596 1 822 8 643 12 061
1996 824 1 982 1 158 1 354 7 363 9 875
1997 1 034 2 010 976 1 043 4 883 6 902
1998 1 029 2 022 993 859 5 875 7 727
1999 275 2 384 2 109 520 5 068 7 697
2000 442 2 434 1 992 827 3 780 6 599
2001 456 2 745 2 289 858 3 277 6 424
2002 482 3 054 2 572 960 3 927 7 459
2003 513 3 431 2 918 1 085 4 721 8 724
2004 503 3 276 2 773 1 305 6 207 10 285
2005 545 3 215 3 215 1 534 7 200 11 949
2006 531 3 326 2 795 1 565 7 464 11 824
2007 676 3 532 2 856 1 499 9 258 13 613
2008 650 4 145 3 495 1 782 10 551 15 828
2009 732 4 685 3 953 1 940 12 664 18 557
2010 901 5 378 4 477 2 170 11 822 18 469
2011 869 5 679 4 810 1 605 11 428 17 843
2012 992 6 345 5 353 2 044 9 792 17 189
Total 1992-2012 233 201
Source: Own elaboration based on Nillson (2002), Banverket and Trafikverket
Total costs borne by the public sector in 2012, less than the previous years, amounted to SEK17
billion, equivalent to €1.98 billion euros using the average annual exchange rate of SEK8.7 per €1. For
the whole period, 1992-2012, the total amounted to 233 billion SEK, equivalent to €26.8 billion.
Graph 9 once again bilaterally compares the examined country and Italy: in 2012, public expenditure
in Sweden was equal to only 26% of the Italian value, despite the Swedish network being equal to
67% of Italy’s if measured by length of the lines and 64% when measured by length of the tracks.
Transported passenger km were 31% of Italy’s (€11.8 billion versus €37.5 billion in Italy, but Sweden
has less than a sixth of Italy’s population) while the annual freight ton km were 9% higher than Italy’s.
28
Graph 8: Public expenditure for the Swedish rail network (1989-2012)
Source: Own elaboration based on Nillson (2002), Banverket and Trafikverket.
Graph 9: Sweden-Italy comparison in relation to total subsidies, network and traffic
Fonte: Own elaboration based on: Trafikverket, Conto nazionale dei trasporti and Eurostat.
8. A comparison of public subsidies granted in the five countries
After having reconstructed the data concerning total public transfers paid to the rail transport sectors of
the five major European countries over a long period of time, we have sufficient information to draw
0
2.000
4.000
6.000
8.000
10.000
12.000
14.000
16.000
18.000
20.000
19
89
19
90
19
91
19
92
19
93
19
94
19
95
19
96
19
97
19
98
19
99
20
00
20
01
20
02
20
03
20
04
20
05
20
06
20
07
20
08
20
09
20
10
20
11
20
12
Operating costs net of revenues Renewal Investment
100 100 100 100 100
26
67 64
31
109
0
20
40
60
80
100
120
Tot. subsidies Network length Tracks length yearlypassengers/km
Yearly freightton/km
Italy Sweden
29
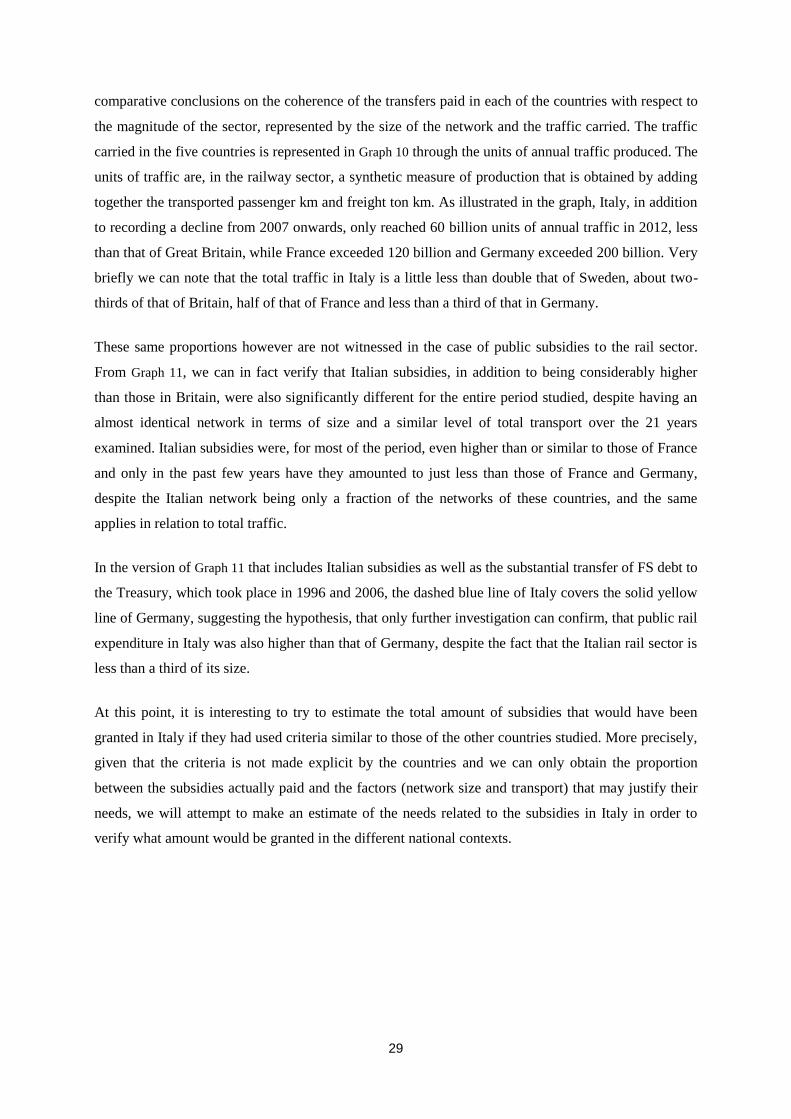
comparative conclusions on the coherence of the transfers paid in each of the countries with respect to
the magnitude of the sector, represented by the size of the network and the traffic carried. The traffic
carried in the five countries is represented in Graph 10 through the units of annual traffic produced. The
units of traffic are, in the railway sector, a synthetic measure of production that is obtained by adding
together the transported passenger km and freight ton km. As illustrated in the graph, Italy, in addition
to recording a decline from 2007 onwards, only reached 60 billion units of annual traffic in 2012, less
than that of Great Britain, while France exceeded 120 billion and Germany exceeded 200 billion. Very
briefly we can note that the total traffic in Italy is a little less than double that of Sweden, about two-
thirds of that of Britain, half of that of France and less than a third of that in Germany.
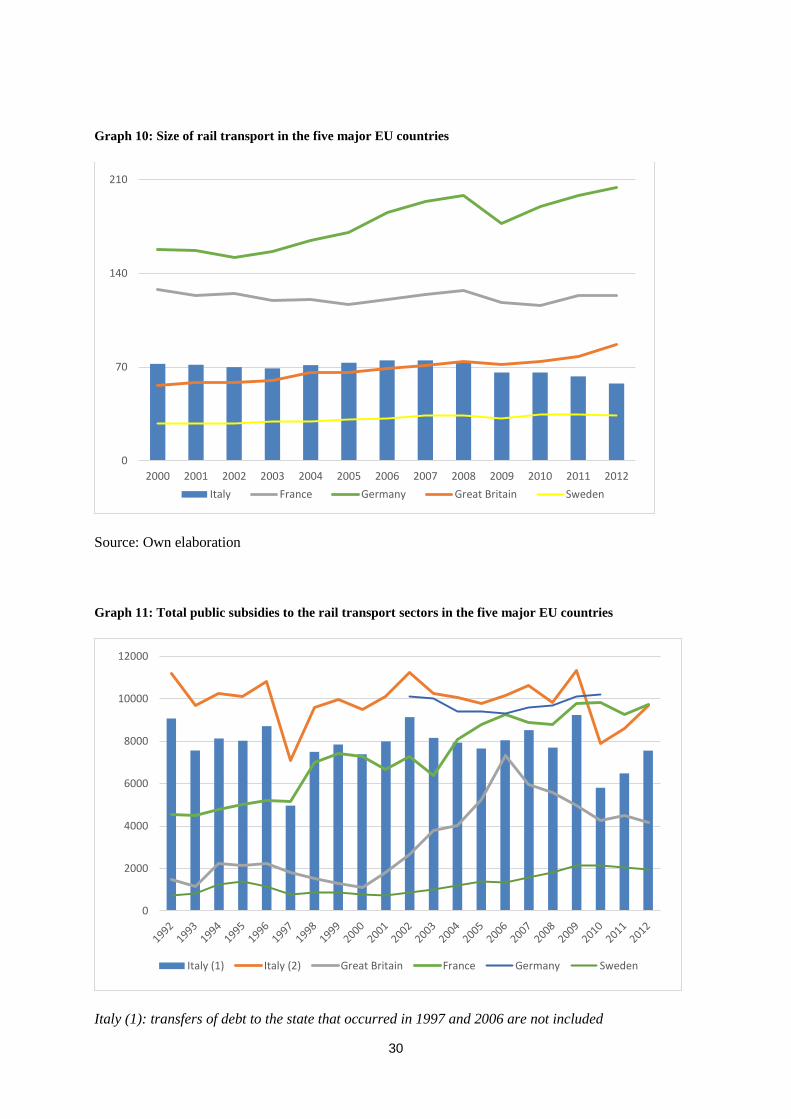
These same proportions however are not witnessed in the case of public subsidies to the rail sector.
From Graph 11, we can in fact verify that Italian subsidies, in addition to being considerably higher
than those in Britain, were also significantly different for the entire period studied, despite having an
almost identical network in terms of size and a similar level of total transport over the 21 years
examined. Italian subsidies were, for most of the period, even higher than or similar to those of France
and only in the past few years have they amounted to just less than those of France and Germany,
despite the Italian network being only a fraction of the networks of these countries, and the same
applies in relation to total traffic.
In the version of Graph 11 that includes Italian subsidies as well as the substantial transfer of FS debt to
the Treasury, which took place in 1996 and 2006, the dashed blue line of Italy covers the solid yellow
line of Germany, suggesting the hypothesis, that only further investigation can confirm, that public rail
expenditure in Italy was also higher than that of Germany, despite the fact that the Italian rail sector is
less than a third of its size.
At this point, it is interesting to try to estimate the total amount of subsidies that would have been
granted in Italy if they had used criteria similar to those of the other countries studied. More precisely,
given that the criteria is not made explicit by the countries and we can only obtain the proportion
between the subsidies actually paid and the factors (network size and transport) that may justify their
needs, we will attempt to make an estimate of the needs related to the subsidies in Italy in order to
verify what amount would be granted in the different national contexts.
30
Graph 10: Size of rail transport in the five major EU countries
Source: Own elaboration
Graph 11: Total public subsidies to the rail transport sectors in the five major EU countries
Italy (1): transfers of debt to the state that occurred in 1997 and 2006 are not included
0
70
140
210
2000 2001 2002 2003 2004 2005 2006 2007 2008 2009 2010 2011 2012
Italy France Germany Great Britain Sweden
0
2000
4000
6000
8000
10000
12000
Italy (1) Italy (2) Great Britain France Germany Sweden
31
Italy (2) transfers of debt in 1997 and 2006 are evenly spread over the 21 years
Source: Elaboration of the data of the bodies indicated in the analysis of each country
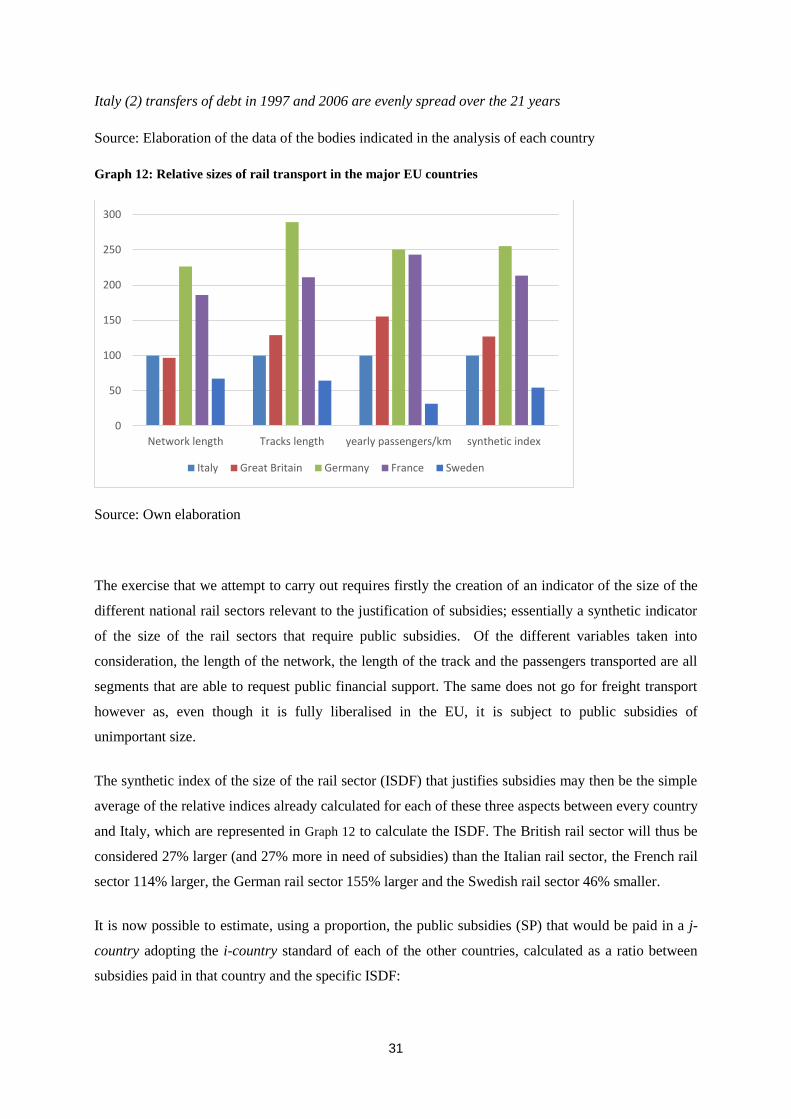
Graph 12: Relative sizes of rail transport in the major EU countries
Source: Own elaboration
The exercise that we attempt to carry out requires firstly the creation of an indicator of the size of the
different national rail sectors relevant to the justification of subsidies; essentially a synthetic indicator
of the size of the rail sectors that require public subsidies. Of the different variables taken into
consideration, the length of the network, the length of the track and the passengers transported are all
segments that are able to request public financial support. The same does not go for freight transport
however as, even though it is fully liberalised in the EU, it is subject to public subsidies of
unimportant size.
The synthetic index of the size of the rail sector (ISDF) that justifies subsidies may then be the simple
average of the relative indices already calculated for each of these three aspects between every country
and Italy, which are represented in Graph 12 to calculate the ISDF. The British rail sector will thus be
considered 27% larger (and 27% more in need of subsidies) than the Italian rail sector, the French rail
sector 114% larger, the German rail sector 155% larger and the Swedish rail sector 46% smaller.
It is now possible to estimate, using a proportion, the public subsidies (SP) that would be paid in a j-
country adopting the i-country standard of each of the other countries, calculated as a ratio between
subsidies paid in that country and the specific ISDF:
0
50
100
150
200
250
300
Network length Tracks length yearly passengers/km synthetic index
Italy Great Britain Germany France Sweden
32
From equation [1] it is possible to derive the theoretical subsidy (SP) described in the equation [2].
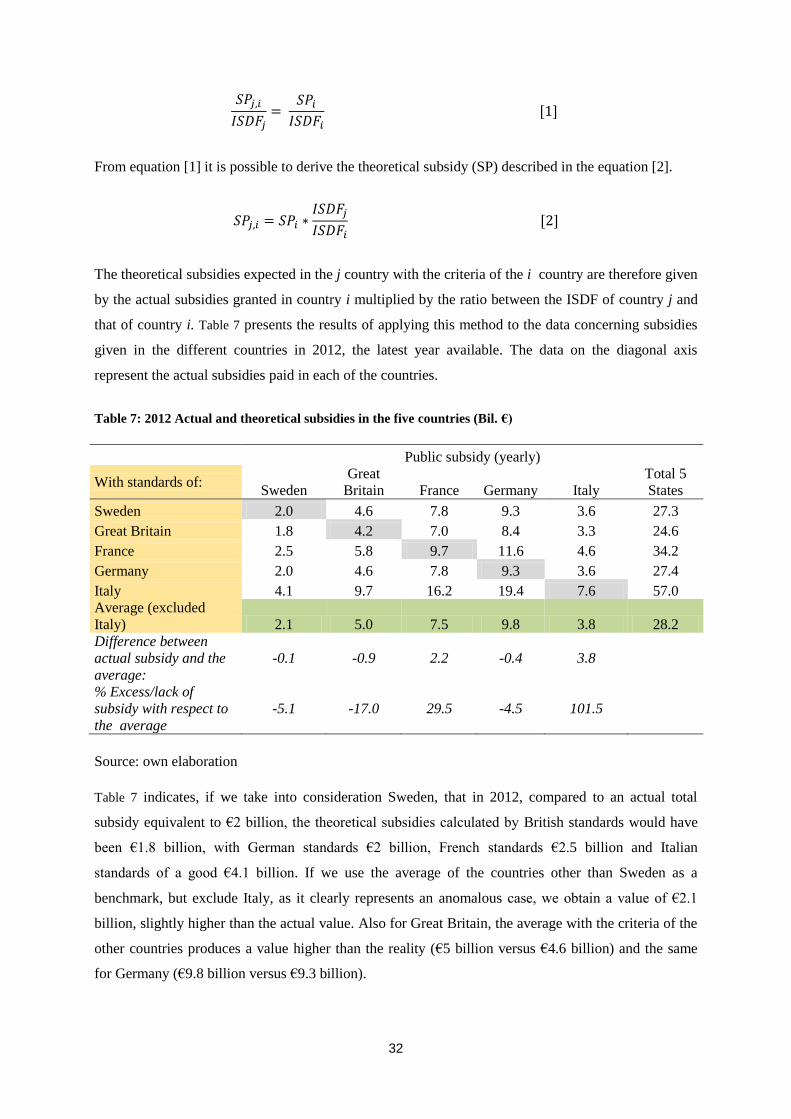
The theoretical subsidies expected in the j country with the criteria of the i country are therefore given
by the actual subsidies granted in country i multiplied by the ratio between the ISDF of country j and
that of country i. Table 7 presents the results of applying this method to the data concerning subsidies
given in the different countries in 2012, the latest year available. The data on the diagonal axis
represent the actual subsidies paid in each of the countries.
Table 7: 2012 Actual and theoretical subsidies in the five countries (Bil. €)
Public subsidy (yearly)
With standards of: Sweden
Great
Britain France Germany Italy
Total 5
States
Sweden 2.0 4.6 7.8 9.3 3.6 27.3
Great Britain 1.8 4.2 7.0 8.4 3.3 24.6
France 2.5 5.8 9.7 11.6 4.6 34.2
Germany 2.0 4.6 7.8 9.3 3.6 27.4
Italy 4.1 9.7 16.2 19.4 7.6 57.0
Average (excluded
Italy) 2.1 5.0 7.5 9.8 3.8 28.2
Difference between
actual subsidy and the
average:
-0.1 -0.9 2.2 -0.4 3.8
% Excess/lack of
subsidy with respect to
the average
-5.1 -17.0 29.5 -4.5 101.5
Source: own elaboration
Table 7 indicates, if we take into consideration Sweden, that in 2012, compared to an actual total
subsidy equivalent to €2 billion, the theoretical subsidies calculated by British standards would have
been €1.8 billion, with German standards €2 billion, French standards €2.5 billion and Italian
standards of a good €4.1 billion. If we use the average of the countries other than Sweden as a
benchmark, but exclude Italy, as it clearly represents an anomalous case, we obtain a value of €2.1
billion, slightly higher than the actual value. Also for Great Britain, the average with the criteria of the
other countries produces a value higher than the reality (€5 billion versus €4.6 billion) and the same
for Germany (€9.8 billion versus €9.3 billion).
33
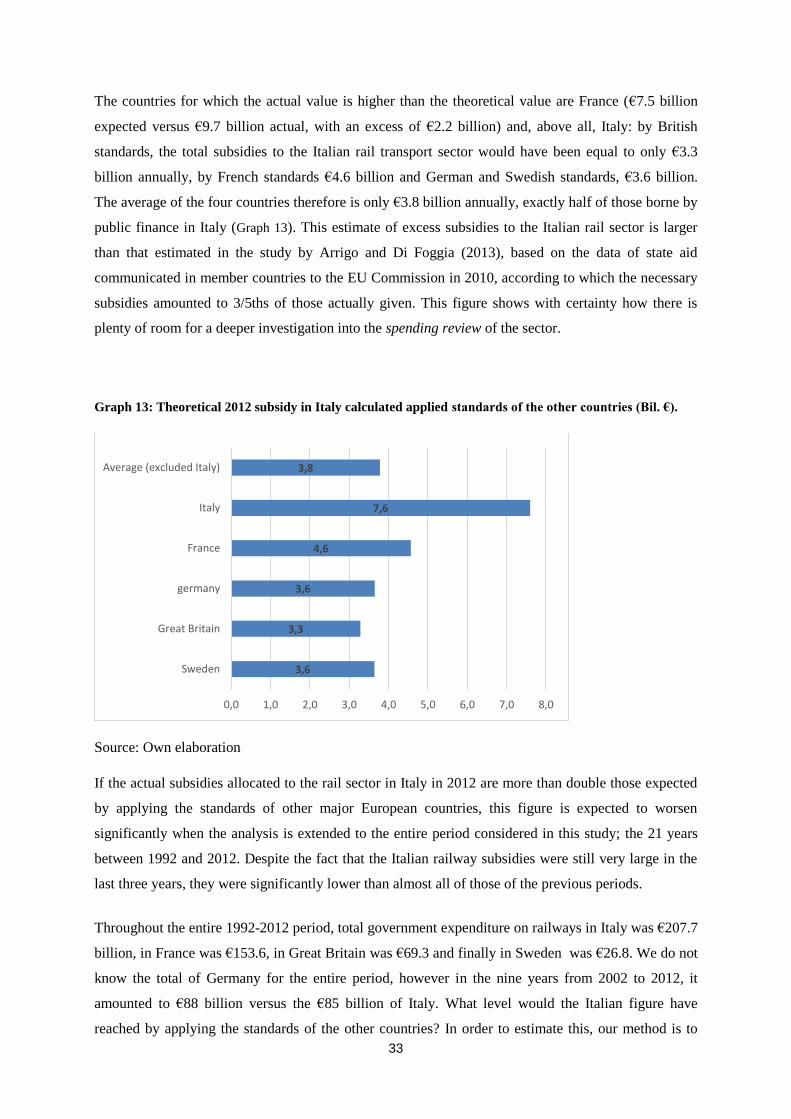
The countries for which the actual value is higher than the theoretical value are France (€7.5 billion
expected versus €9.7 billion actual, with an excess of €2.2 billion) and, above all, Italy: by British
standards, the total subsidies to the Italian rail transport sector would have been equal to only €3.3
billion annually, by French standards €4.6 billion and German and Swedish standards, €3.6 billion.
The average of the four countries therefore is only €3.8 billion annually, exactly half of those borne by
public finance in Italy (Graph 13). This estimate of excess subsidies to the Italian rail sector is larger
than that estimated in the study by Arrigo and Di Foggia (2013), based on the data of state aid
communicated in member countries to the EU Commission in 2010, according to which the necessary
subsidies amounted to 3/5ths of those actually given. This figure shows with certainty how there is
plenty of room for a deeper investigation into the spending review of the sector.
Graph 13: Theoretical 2012 subsidy in Italy calculated applied standards of the other countries (Bil. €).
Source: Own elaboration
If the actual subsidies allocated to the rail sector in Italy in 2012 are more than double those expected
by applying the standards of other major European countries, this figure is expected to worsen
significantly when the analysis is extended to the entire period considered in this study; the 21 years
between 1992 and 2012. Despite the fact that the Italian railway subsidies were still very large in the
last three years, they were significantly lower than almost all of those of the previous periods.
Throughout the entire 1992-2012 period, total government expenditure on railways in Italy was €207.7
billion, in France was €153.6, in Great Britain was €69.3 and finally in Sweden was €26.8. We do not
know the total of Germany for the entire period, however in the nine years from 2002 to 2012, it
amounted to €88 billion versus the €85 billion of Italy. What level would the Italian figure have
reached by applying the standards of the other countries? In order to estimate this, our method is to
3,6
3,3
3,6
4,6
7,6
3,8
0,0 1,0 2,0 3,0 4,0 5,0 6,0 7,0 8,0
Sweden
Great Britain
germany
France
Italy
Average (excluded Italy)
34
multiply each of the other amounts by the ratio between the synthetic index of the dimensions of the
Italian rail sector (ISDF) and that of the specific country, obviously recalculated for the entire period
of 21 years. To obtain the Italian value with French standards, we divide the total French subsidies –
€153.6 billion – by 1.85 (instead of the 2.14 used for 2012), obtaining €83.2 billion, corresponding to
40% of the actual figure of Italy.
In a similar way, in order to obtain the Italian value by British standards, we divide the total British
subsidies – €69.3 billion – by 1.09 (instead of 1.27 used for 2012), obtaining €63.6 billion (31% of the
actual Italian figure). Finally, in order to obtain the Italian value by Swedish standards, we divide the
total Swedish subsidies – 26.8 billion – by 0.5 (instead of the 0.54 used for 2012), obtaining €53.6
billion (26% of the actual Italian figure). The average value of the theoretical subsidies, calculated by
the standards of the three countries, amounts to €66.8 billion corresponding to 32% of the actual
Italian figure.
In summary, the application of our estimation method leads us to argue that the actual subsidies to the
rail sector are double compared to the European standard, while the total paid during the 1992-2012
period was triple. Two thirds of the total public expenditure to the railway could have consequently
been saved.
9. The formation of the Italian public debt
The total cost borne by public finance arising from the railway sector is not limited to €207.7 billion
calculated in this study. There are in fact other items that we were unable, at least for the moment, to
quantify: (i) the imbalance of social security, coming from the difference between contributions paid
by the FS for workers and the cost of social security payments paid to the pensioners of the railways;
(ii) public subsidies to the local non FS rail networks and to the relative transport.
There is however a third item that we can estimate: the interest costs generated by the financing of
public expenditure with public debt. In this case, it should be state that it is not possible to know with
certainty with which method the public expenditure for the railway was financed given that it ended up
in the great cauldron of public spending, financed partly by taxation and partly by debt issuance. Three
hypothesis may however be formed, two extreme and one moderately reasonable.
The first hypothesis is formed by the total financing of expenditure on railways through taxation. In
this case, there is no additional burden on public finance. Expenditure on railways has been grossly
inefficient however the taxpayer has been obliged to repay it in full. At the other extreme of the
possible hypotheses, is the total financing through debt. In this case, the interest costs resulting from
the public debt contracted to finance the railway sector should be calculated, year after year. Since
1992, the state has supported rail expenditure by issuing securities of €9.1 billion (in our hypothesis),
35
and in 1993 (and all of the subsequent years) it would have also had to bear the cost for interests on
said securities. When the average cost of debt was at its highest, the annual interest costs amounted to
€1.1 billion. For the following year, the public ‘rail debt’ would consist of the initial €9.1 billion plus
the €1.1 billion in interests plus €7.6 billion of new subsidies to the railway, reaching a total of €17.8
billion on which interest costs will be paid in the new year. This calculation until 2013, always based
on the average annual cost of each period of public debt, can be seen in Graph 14, which distinguishes
between accumulated public subsidies to the railway and the cost of accumulated interest.
Graph 14: Impact on the Italian public debt in the event of total debt financing of rail subsidies (Mil. €)
Source: own elaboration
In our hypothesis, the public rail debt formed from 1992 until today, would have amounted to €388
billion, of which €215 billion were for rail subsidies and €173 billion for interest accumulated on the
debt (for the year 2013, €7 billion public expenditure on railways conservatively assumed). This
figure, in relation to the Italian gross public debt equal to €2067 billion at the end of 2013, accounts
for 18.8%. However, if we exclude cash and loans to the Treasury from the gross Italian debt then we
compare it with the net debt, the debt that was formed to finance deficit spending equal to €1.95
trillion in 2013, it accounts for 19.9%.
These estimates depend on the hypothesis of total rail subsidy financing with public debt, which may
be considered excessive. More acceptable is the assumption that the necessary rail expenditure,
calculated according to the standards of the other European countries, has been reasonably financed by
taxation and that only the excess spending, compared to other countries, has been financed with debt.
In this hypothesis, the impact of expenditure on railways on the Italian public debt would have been
€259 billion from 1992 until today, with €143 billion coming from excess subsidies and €116 billion
from interest paid on the public debt to finance it. The figure of €259 billion corresponds to 12.5% of
the gross Italian public debt in 2013 and to 13.3% of the net Italian public debt.
0
50.000
100.000
150.000
200.000
250.000
300.000
350.000
400.000
19
92
19
93
19
94
19
95
19
96
19
97
19
98
19
99
20
00
20
01
20
02
20
03
20
04
20
05
20
06
20
07
20
08
20
09
20
10
20
11
20
12
20
13
Cumulated Railways subsidy Cumulated interest on public debt
36
A further calculation can be done in relation to the weight of the public ‘rail’ debt on the excess Italian
public debt compared to the compatible level within the Maastricht parameter, equal to 60% of GDP.
The level of net public debt in 2013 of €1.95 trillion can therefore be divided into €934 billion
compatible with the Maastricht parameter and a further €1.016 trillion ‘excess’. Of this €1.016 trillion,
the €259 billion excess Italian rail expenditure and the relative interest represent 25.5%. If they had
instead been avoided, today the debt/GDP would be 17% lower.
These calculations regarding the impact of the high Italian expenditure on railways on the public debt
refer to the excess expenditure since 1992 (eve of the so-called Second Republic) to date, that we have
been able to estimate. Since it seems difficult to imagine that the rail expenditure, over a long period
of time, was more virtuous in the first republic than the second, we should not be surprised to
discover, if it were possible to go even further back in the reconstruction of rail subsidies, that the
excess Italian rail expenditure is responsible for between one-quarter to one-third of the total Italian
public debt and more than half of the excess debt than that allowed by the Maastricht constraint.
37
References
Arrigo U. e Beccarello M., (2000). Il trasporto ferroviario. La convergenza europea nel settore
pubblico, Franco Angeli, Milano.
Arrigo U. e Di Foggia G., (2013). Gli aiuti di Stato al settore ferroviario nell’Unione Europea [State
Aid to Railways in Europe]. Working Paper, Dipartimento di Scienze Economico Aziendali,
Università di Milano Bicocca.
Arrigo U. e Ferri V., (2012). La separazione delle reti ferroviarie [the separation of Rail Network].
Working paper, Istituto Bruno Leoni.
Banverket, Annual Report, seveal years.
CESifo GmbH - Munich Society for the Promotion of Economic Research, (2011). Degree of
Separation in the EU Railway Sector.
Commisariat Général au Développement Durable, Comptes des Transports, several years.
Corte dei Conti – Italian Court of Auditors (many years). Relazione sulla gestione finanziaria di
Ferrovie dello Stato Italiane [Final relation on the Ferrovie dello Stato financial management].
Corte dei Conti – Italian Court of Auditors (many years). Relazione sulla gestione finanziaria di Rete
Ferroviaria Italiana [Final relation on the Italian rail Network financial management].
Dehornoy J., (2011). The evolution of public funding to the rail sector in 5 European countries. A
comparison.
E.U. Commission, Transport in figures, Statistical Pocketbook,seevveral years
Eurostat, Transport statistics database. Rail statistics.
Everis-NTU, (2010). Study on Regulatory Options on Further Market Opening in Rail Passenger
Transport.
MIT – Ministero delle infrastrutture e dei trasporti, Conto nazionale delle infrastrutture e dei trasporti
(vari anni).
Network Rail, Annual Report and Accounts, several years
ORR–Office of Rail Regulation, Annual efficiency and finance assessment of Network Rail 2009-10

38
ORR–Office of Rail Regulation, National Rail Trends, several years.
Trafikverket, Annual Report, several years.