Embed Size (px)
Citation preview
Working Paper 208
Results-Oriented Public Expenditure Management
Case Study of Ghana
Kojo N. Oduro
June 2003
Overseas Development Institute 111 Westminster Bridge Road
LondonSE1 7JD
UK
ii
List of Working Papers in this Series
Catherine Dom, Tim Ensor, Leon Bernard Suy: ‘Results-oriented Public Expenditure Management in Cambodia’, Working Paper 201, ISBN 0 85003 645 3
Carlos Montes: ‘Results-based Public Management in Bolivia’, Working Paper 202, ISBN 0 85003 646 1
John Roberts: ‘Managing Public Expenditure for Development Results and Poverty Reduction’, Working Paper 203, ISBN 0 85003 647 X
Frans Rønsholt, Richard Mushi, Bedason Shallanda, Paschal Assey: ‘Results-oriented Expenditure Management: Country Study – Tanzania’, Working Paper 204, ISBN 0 85003 648 8
Tim Williamson: ‘Targets and Results in Public Sector Management: Uganda Case Study’, Working Paper 205, ISBN 0 85003 649 6
Marc Raffinot, Jean Muguet, Alhousseynou Touré: ‘Results-oriented Public Expenditure Management: Case Study of Mali’, Working Paper 206, ISBN 0 85003 650 X
Sandrine Mesplé-Somps, Marie-Eugénie Malgoubri, Jean Muguet, Blaise Zongo: ‘Results-oriented Expenditure Management: the Case of Burkina Faso’, Working Paper 207, ISBN 0 85003 651 8
Kojo Oduro: ‘Results-oriented Public Expenditure Management: Case Study of Ghana’, Working Paper 208, ISBN 0 85003 652 6
Aidan Rose: ‘Results-oriented Budget Practice in OECD Countries’, Working Paper 209, ISBN 0 85003 653 4
Related CAPE-ODI Working Papers
John Roberts (2003): ‘Poverty Reduction Outcomes in Education and Health, Public Expenditure and Aid’, Working Paper 210, ISBN 0 85003 654 2
Tim Williamson (2003): ‘Performance Management and Fiscal Decentralisation’ Working Paper 211, ISBN 0 85003 655 0
ISBN 0 85003 652 6
© Overseas Development Institute 2003 All rights reserved. Readers may quote from or reproduce this paper, but as copyright holder, ODI requests due acknowledgement.
iii
Contents
Preface v
Acknowledgements vi
Acronyms vii
Executive Summary ixChapter 1: Introduction 1 1.1 Introduction 1 Chapter 2: Scene Setting, The Public Expenditure Management Systems (PEMs) in Ghana 52.1 Summary of the institutional framework 5 2.2 Summary of budgetary preparation and PEM processes in use 8 2.3 The structure and composition of the budget 11 2.4 Medium term expenditure framework 12 2.5 Record of budget execution 13 2.6 Financial management reform 14
Chapter 3: The Use of Targets and Indicators of Performance and Results 163.1 Process of formulating targets and indicators 16 3.2 The use of public service indicators and targets alongside budget allocations 18 3.3 The cascading-down of indicators and their use by front-line service managers 19
Chapter 4: Factors in the Success or Failure of Results-Based Expenditure Management 204.1 Verification of results and performance assessment. 20 4.2 Sectors 24
Chapter 5: Generic Implications of Ghana’s Experience with ROPEMS 365.1 Some results-oriented budget priorities for Ghana 36 5.2 International lessons 39
Bibliography 41
Annex 1a: Structured Interview 1, Testing the Hypotheses of the Study 45
Annex 1b: Structured Interview 2, Analytical and Descriptive 47
Annex 2: Analysis of Indicators from the GPRS 51
Annex 3: Planned Government Poverty Reduction Expenditure 55Annex 4: Alignment of Ministries’ MTEF with Sector Policies and to the GPRS 57 Annex 5: Sector Shares in Total Broad Budget, GoG & Donors (2003-05) 69
Annex 6: Ghana Education Service Performance Monitoring Test Results 70
Annex 7: The Public Expenditure Reviews 71
BoxesBox 1: A performance management model 2
iv
Box 2: A Performance Management Process 3 Box 3: Highlights of 2003-5 MTEF Budget Preparation Guidelines 9
Tables
Table 1: Total number of sector MDAs 1 Table 2: MDAs by Sectors 6 Table 3: The Budget Structure 12 Table 4: Composition of MDA MTEF Budgets 12 Table 5: Formulating targets and undicators, the medium-term programme 16 Table 6: Cross-Cutting issues in the GPRS and Ministries 18 Table 7: Budget and actual expenditure for MoFA (1995-99) (¢m) 24 Table 8: Weights used in allocation of DACF 1998-2000 25 Table 9: FCUBE programme benchmarks 27 Table 10: Assessment of benchmarks against criteria of performance measurement 29 Table 11: Examples of Education Results and Performance Management 30 Table 12: Indicators for Programme Impact in the Health Sector Targets (1997-2001) 32 Table 13: The analytical bases of developing health sector indicators in Ghana 34
v
Preface
This paper is one of seven country studies on the practice of results-oriented – or performance-based – public expenditure management in low-income developing countries. The studies were commissioned by the Centre for Aid and Public Expenditure (CAPE) at the Overseas Development Institute, London (ODI) with a view to comparing and contrasting the experiences of countries of broadly similar size and per capita income, and to identifying factors conducive to performance budgeting, the preconditions for its adoption and the benefits that even poor countries can derive from it.
This body of research has been undertaken at a time when there is mounting concern, in both developing countries and donor countries, to achieve visible, tangible and sustainable development ‘results’.
The sample of countries whose budgeting and performance management practices have been reviewed consists of Bolivia, Burkina Faso, Cambodia, Ghana, Mali, Tanzania and Uganda. These countries were chosen for their geographical spread, the diversity of their budget and public expenditure management practices, and the fact that they have drawn up one or more interim or final Poverty Reduction Strategy Papers which lay out their priority development objectives and the means they intend to deploy.
Other reports in the series are a survey of relevant practice in OECD countries and a synthesis of this and the country studies. These documents are listed inside the front cover of this paper.
Past ODI contributions towards reducing poverty in Ghana are captured in How, When and Why Does Poverty Get Budget Priority (Ghana Case Study by Mick Foster and Douglas Zormelo (2001); and Poverty-reducing Institutional Change and PRSP processes: The Ghana Case, (July 2001) by Tony Killick and Charles Abudgre.
vi
Acknowledgements
This report is based on fieldwork in Accra between April and September 2002 and desk work in Accra and London. The author is grateful to the Government of Ghana through the office of the Senior Minister and the Economic Management Team who gave their unqualified support to this study. They are, however, not responsible for any of the views and opinions expressed in this report.
The responses received from Ministers and officials who gave their time for this research have been universally; officials saw the merit of such studies in Ghana and gave their support. Most people with whom the report was discussed, were open-minded, highly aware and tuned-in to the environment in which they work and also to international developments. The Ghana Poverty Reduction Strategy (GPRS) is new, so when the studies started in April 2002 many highly placed officials were still assimilating the concept and wondering what implications it had for their work. It is hoped that the 2003 Budget Preparation Guidelines have made the centrality of GPRS clear, and that the Government Budget of 2003 and beyond will reinforce the same message.
The author’s main associates in this exercise were Professor J B Ato Ghartey Controller and Accountant General, 1993-1997, Dr. Daniel Obeng-Ofori, Crop Science, Faculty of Agriculture, Legon and Dr D Sarpong also of Legon, all are highly accomplished academics and practitioners who in their own ways gave professional encouragement. Professor Ghartey read through the assessment of the Public Expenditure System and made several valuable comments. The remaining errors are the author’s. Dr Obeng and Dr Sarpong undertook the initial literature search on the agricultural sector and prepared two background papers based on structured conversations with senior agriculture sector officials. They shared insights on the sector studies with the author.
The author would also like to acknowledge the support from individuals and institutions of the Central Management Agencies (the Office of the President, Office of the Head of the Civil Service, the Ministry of Finance, the National Development Planning Commission and the Ministry of Regional Planning and Cooperation. He thanks all Ministers of State, Chief Director, and Director s of Policy, Planning, Monitoring and Evaluation Departments in all the departments and agencies covered in the study, and also to the heads of agencies and their staff (the Ghana Police Service and the Prisons Service) who participated in structured conversations with him. There are a number of people, too numerous to list indiscriminately, who gave generously of their time and made substantial contributions: without their enthusiasm, insights and serendipitous suggestions this report could not have been completed. In most cases the full content of the discussions might not have found their way into the report for reasons of space and the specific terms of reference of the report. This notwithstanding, it is hoped it has been possible to capture the ‘heart of the matter’ of the strategic and day-to-day challenges the sectors face in working within the Ghana Public Expenditure Management (PEM) system to deliver results.
The author would also like to thank DFID for its financial support in making this study possible.
Responsibility for the views expressed and for any errors of fact or judgement remains with the author who takes the responsibility for the assessment of events, opinions and comments: omissions and commissions to be short. ODI/CAPE and the author aim to be as factual as possible and we hope we have fulfilled this requirement.
vii
Acronyms
AAGDS Accelerated Agricultural Growth and Development Strategy ACP African Caribbean and Pacific AgSSIP Agricultural Sub-Sector Investment Programme AIDS Acquired Immune Deficiency Syndrome ASIP Agricultural Services Investment Project BoG Bank of Ghana BPEMS Budget and Public Expenditure Management System CAGD Controller and Accountant General’s Department CBOs Community Based Organizations CDF Comprehensive Development Framework CEPS Customs and Preventive Services CG Consultation Group of donors CHIM Central Health Information Management CHRAJ Commissioner of Human Rights and administrative Justice CMAs Central Management Agencies CSPIP Civil Service Performance Improvement Plan CWIQ Core Welfare Indicators Questionnaire DACF District Assemblies Common Fund DAs District Assemblies DFID Department for International Development ECOWAS Economic Community of West Africa EMS Economic Management Support EMT Economic Management Team ERP Economic Recovery Programme FCUBE Free Compulsory Basic Education GDP Gross Domestic Product GES Ghana Education Service GHS Ghana Health Service GLSS Ghana Living Standards Survey GoG Government of Ghana GPRS Ghana Poverty Reduction Strategy HIPC Highly Indepted Poor Country Initiative HIV/AIDS Human Immune Virus/Acquired Deficiency Syndrome IFAD International Fund for Agricultural Development IPPD Integrated Personnel/Payroll Database I-PRSP Interim Poverty Reduction Strategy Paper IRS Internal Revenue Service JSS Junior Secondary School KVIP Kumasi Ventilated Improved Pit M& E Monitoring and Evaluation MDAs Ministries, Department and Agencies MEPRC Ministry of Economic Planning and Regional CooperationMIS Management Information System MLGRD Ministry of Local Government and Rural Development MMDAS Metropolitan, Municipal and District Assemblies MoE Ministry of Education MoF Ministry of Finance MoFA Ministry of Food and Agriculture MoH Ministry of Health
viii
MTADP Medium Term Agricultural Development Plan MTDP Medium Term Development Strategy MTEF Medium Term Expenditure Framework NADMO National Disaster Management Organization NAEP National Agricultural Extension Programme NARP National Agricultural Research Programme NDPC National Development Planning Commission NIRP National Institutional Renewal Programme OHCS Office of the Head of Civil Service PAC Public Accounts Committee. PARDIC Public Administration Restructuring and Decentralization Implementation
Committee PEM Public Expenditure Management PER Public Expenditure Review POW Programme of Work PPMED Policy, Planning, Monitoring and Evaluation Department PRSP Poverty Reduction Strategy Paper PUFMARP Public Finance and Management Reform Programme RCC Regional Coordinating Council. ROPEMS Results-oriented Expenditure Management Systems RSDP Road Sector Development Programme RPCU Regional Coordinating Planning Unit RTIP Root and Tuber Improvement Project SA Subvented Agencies SAP Structural Adjustment Programme SOE State-owned Enterprise SSS Senior Secondary School SWAp Sector-Wide Approach TIN Tax Identification Number UNICEF United Nations Children Emergency Fund VAT Value Added Tax VIP Village Improvement Programme WAJU Women and Juvenile Unit of the Ghana Police Service WHO World Health Organization.
ix
Executive Summary
The issues explored in this paper concern the question of what results-oriented public expenditure management systems are in place in Ghana and whether, in the light of political commitment, it is possible for them to deliver poverty reduction results
The government declared poverty reduction to be its principal policy goal in 1997. It prepared an Interim Poverty Reduction Strategy Paper but was not able to implement it. The government which took office at the beginning of 2001 joined the Highly Indebted Poor Country (HIPC) initiative and began to prepare a new Poverty Reduction Strategy Paper whose implementation could be achieved only through efficient Public Expenditure Management systems (PEMs) that are results-based.
The Medium-Term Expenditure Framework
The structure of the Budget has undergone changes with the introduction in 1998 of the MTEF. The existing nine-line items of expenditure were compressed into four and a Service Item was introduced to capture the core business of each ministry, department or agency (MDA). Budgets for sectoral MDAs contain statements of goals and the funding to achieve them. It is in this sense that the MTEF provides for the first time the basis of a performance management culture in the Ghana PEM system.
Budget performance
Since 1993 the government has assessed the impact of its expenditures in annual Public Expenditure Reviews (PERs). The Ministry of Finance selects a thematic area in public expenditure to analyse budgetary performances. The PER process documented the weaknesses in the system and the initiation of the financial management reform agenda in July 1995:
The budgetary system was incremental in approach; operated expenditure control via ‘Drawing Limits’; it was prone to frequent cut-backs and freezes on expenditure; there was a cumbersome certification and payment procedure also designed to keep expenditures down; there were unbudgeted expenditures in the system, which exacerbated the problems of lack of accurate and timely expenditure data.
To solve these problems the government proposed the Public Financial Management Reform programme (PUFMARP), a medium term strategy for achieving improved public expenditure management. Reform of the budgetary system within the Medium-Term Expenditure Framework (MTEF) emphasised the change in focus from short-term to medium-term budgeting, first introduced in 1999. Its major achievement was that in the first year of its introduction all MDAs were able to produce a three-year integrated broad-based budget.
The budgeting system operates within the wider context of the public sector financial management arrangements. A comprehensive Financial Management Reform Action Plan prepared by a committee in the Ministry of Finance in 2001 identified some of the current shortcomings within the PEM system and drafted a programme to address these problems in the short to medium. The committee found: (i) weak Budget formulation and implementation; (ii) weak monitoring and evaluation of the administration’s financial resources; (iii) poor data generation and dissemination;.
x
(iv) poor flow of information between the Bank of Ghana (BoG), the Ministry of Finance (MoF) and the Controller and Accountant General’s Department (CAGD); (v) deficiencies in accounting and auditing practices and standards; (vi) Weak regulatory structures insufficient to enforce sanctions against financial malpractice; (viii) obsolete public financial management laws and regulations; (ix) too many government accounts; (x) lack of awareness, on the part of government employees, of their need to be accountable for their financial responsibilities.
The MoF’s response was an Action Plan covering: (i) streamlining the MoF; (ii) harmonising the Chart of Accounts and classification among the MTEF, the BPEMS and the CAGD; (iii) implementing the BPEMS at 57 pilot sites; (iv) embarking on the MTEF phase 2; (v) completing the IPPD 2 project; (vi) developing and implementing control systems to minimise payroll fraud; and (vii) completing the HIPC Funds Tracking System. These are some of the benchmarks for the judging performance of the MoF.
Sector Investment Programmes (SIPs) and Sector-Wide Approaches (SWAPs)
The deployment by donors of SWAps has been important in inculcating a concern for performance in the Health and Transport sectors where attention has focused on the means and resources required to implement sectoral strategies and to attain sectoral targets, and on complementary organisational and changes. SWAps have been less successful in the other sectors where they have been deployed namely, Education and Agriculture. The approach to improving service delivery and performance management improvement in the remaining sectors is ad hoc surprisingly including the Ministry of Finance itself. The Multi-Donor Budgetary Support (MDBS) discussions which started in June 2002 are attempting to develop comprehensive donor assistance to the government through a package of multilateral and bilateral support to the MoF and various CMAs working with the various sectors.
Process of formulating targets and indicators in the PEM system
Ghana Statistical Services (GSS) through the Ghana Living Standards Survey (GLSS) has provided much useful baseline information for the formulation of targets and indicators. In 1997 the GSS’s Core Welfare Indicators Questionnaire (CWIQ) survey was designed to provide simple indictors on a timely basis for monitoring poverty and the effects of development policies, programmes and projects on living standards. The GLSS 4 and CWIQ were followed by the 2000 Population and Housing Census, which built on the last population census in Ghana in 1984, to provide further substance and a validity check on the survey results contained in the GLSS 4 and the 1997 CWIQ survey.
During the implementation of the GLSS processes, the Ghana Vision 2020 was being developed. The Ghana Vision 2020 (First Steps: 1996-2000) sets out some general indicators, based on the survey results above, to guide MDAs, but it did not provide the basis for MDAs to work out their performance targets. Some sectors began to develop their own programmatic indicators (for example, the Ministry of Health’s first 5-Year Programme of Work in 1997), but to a greater extent they were for in-house use and were not directly linked to national goals. The problem of the Ghana Vision 2020 and the stillborn Interim PRSP is that they did not provide the expected national platform to motivate the MDAs to rework their targets and link them to national plans. This is the gap the GPRS is expected to fill.
In the last year of the previous government the Ministry of Economic Planning and Regional Co-operation (MEPRC) was established to replace the National Development Planning Commission and take on the additional responsibilities of the I-PRS. The Ghana Vision 2020, the Medium-Term Development Plan (MTDP), and the IPRS were the documents from which sector ministries were to
xi
derive their MTEF budgets. Although these processes did not achieve their intended goals, their preparation and existence encouraged all ministries to put in place their own work programmes or medium term reform agenda.
The use of public service indicators and targets alongside budget allocations
Thanks to the MTEF process all MDAs have a mission statement, and a list of objectives, outputs, and activities, but not all have work programmes. These strategic plans support the input costs of the service estimated in the budget. Most top management personnel are fully aware of performance requirements and their implications for their core activities.
At the moment, only the Ministry of Roads and Transport and the Ministry of Education have useful indicators of performance. The Health sector surprisingly could not agree indicators for 2002. The implementation of the GPRS from 2003 will require the revision of all existing service indicators. The expected merger between the MTEF and the GPRS calls for a critical examination of the key aspects of the GPRS document. The GPRS is a good attempt to get everything right by putting down strategic markers and drawing up plans. However, there are problems with how the MDAs are to develop and incorporate the GPRS targets into their MTEF budgets. It remains to be seen what outputs are submitted by the MDAs in the 2003 Budget.
Cascading-down of indicators and their use by frontline service managers
In the GPRS indicators and targets are being cascaded from the Cabinet level down to some MDAs.A more comprehensive target-setting exercise would cover all MDAs and not just a few. At the MDA level the budget operationalises the strategic plan of each Ministry. Through the Budget Committees (BCs) which were set up as part of the MTEF, MDAs are expected to agree their budgets, including outputs and activities and input costs. The mission statement and objectivesremain the same for the MDA as a whole but the outputs, activities and inputs vary from one level of the hierarchy to another. The process of cascading service indicators does not work well because in most cases the budgets are held far from the operational units. There is thus no effective link between the operational managers as service providers and the budget holders who tend to be at head office and the regional levels.
Verification of results achieved
There is little institutionalised independent verification of performance results. Performance monitoring by the Central Management Agencies is weak or almost non-existent. It is difficult to tell whether the poor monitoring and evaluation arrangements have come about because of the past and current pre-occupation of the MoF with expenditure control and cash releases or because of the lack of accountability framework in the MDAs. The constitutional role of the NDPC to monitor development programmes has however been questioned by other MDAs. M&E is weak, and support for it from the ministers, and heads of departments and agencies is uncertain. Central agencies are divided over their M&E requirements. There is no natural ‘champion’ for M&E.
Tables of comparative performance are compiled in the Health sector for health service performance and in Education in the form of school Performance Monitoring Test (PMT) tables. Parents are now starting to demand public schools’ performance league tables as a basis of selecting schools for their children.
Donors and aid instruments
Donors have criticised the GoG in the past for lack of commitment and its inability to raise adequate ‘matching funds’. The MoF’s inadequate forecasting ability has caused government
xii
resource flows to be unpredictable. Gradual improvements in the relationship between the GoG and its partners have now taken place, with successive governments implementing PEM and sectoral reforms. The reforms have been supported by donors using Sector Investment Programmes (SIP) and now the Sector-Wide Approach (SWAps).
Institutional factors vitiating the effectiveness of results-based practices
Institutionally the MoF is responsible for the Budget and the MEPRC/NDPC for planning. These arrangements have led to in institutional rivalry. The failure to link policy-making, planning and budgeting may be the single most important factor contributing to poor budgeting outcomes for developing countries such as Ghana.
The new government is committed to poverty reduction, and the people of Ghana are behind it. However, within civil society and the MDAs there is a prevailing notion that these policies are imposed by development partners.
Agriculture
This sector has been underperforming. Independent verification of results achieved by the MoFA is not an institutionalised activity. Sector Ministers’ knowledge of results achieved is based on field reports submitted to head office without external review. Incomplete information hampers any comprehensive assessment of the efficiency of funds utilisation.
The M&E unit of the PPMED is responsible for the internal monitoring, evaluation and verification of results achieved. Whilst some M&E activities are performed, this unit is weak. MoFA knows that it lacks an effective audit of the Agricultural Sub-Sector Investment Programme (AgSSIP). The Ministry was unable to say which of its plans and programmes had been incorporated into the GPRS.
Rural services
The government’s aim to decentralise administration will requires progress in (i) implementation of the Fiscal Decentralisation programme, and (ii) the passing into law of the Local Government Service Bill. The latter is tailored to shift resources (human and financial, and management) to the local level through the Regions, to Districts, Units and Wards. The bulk of rural infrastructural services (schools, hospitals, sanitation, water and roads, energy, industry and employment, recreation amenities) are still the responsibility of sectoral ministries.
Like all the other sectors, there is no institutionalised verification of performance. The only process of verification is through ad hoc reviews such as the PER process.
Education
The School Inspectorate of the Ghana Education Service (GES), Schools Inspectorate is responsible for the verification of schools performance results. This is an institutionalised process: from the individual school level reporting to the district; the district in turn collating the data and passing it upwards to the regional office; the regions reporting nationally; and nationally reporting to the West African Examination Council and UNESCO.
Starting in 1996, the Free Compulsory Universal Basic Education programme, supported by donors, has developed a three-pronged strategy to address the problems in the educational sector: (i) quality of education, addressed through the institutionalisation of the Performance Measurement Test for
xiii
all public schools; (ii) efficient management which remains to be addressed through the PEM and management reforms in the sector; and (iii) access – also an objective in the GPRS.
Education has developed the most advanced form of costing its GPRS objectives of all sectors. What remains to be seen is how the sector addresses the question of efficient management.
Beneficiaries do not perceive the sector as home-grown. There is a lack of commitment to policy implementation – as confirmed by our research and the Ministry’s CSPIP Beneficiary Survey.
Health sector
The health service shows professionalism and dedication but produces poor results and a poor state of public health in Ghana. ‘Access, quality, and the utilisation of primary health services are still too low’; professional medical carers and public health specialists do not stay for long within the service if they have any options. ‘Overall management of health services is weak and health support functions are underdeveloped. Health personnel are unevenly distributed relative to need, their range of skills is often limited and their morale generally low’ (Health sector 5 Year Programme of Work). There are frequent changes of Ministers of Health.
The sector has a better functioning PPMED than most MDAs. There is also the Central Health Information Management (CHIM) charged with collecting and compiling national health statistics. The sector’s work is dominated by external donors who commission independent consultants the verify specific aspects of the sector.
The sector is still reworking its performance indicators. The use of targets and indicators is inconsistent from one 5-year programme of work to the next. The extent of achievements cannot be clearly assessed, and it was not possible to set indicators for 2002. A more robust performance framework should be set up and carried forward from one 5-year period to another. We found no evidence of independent institutionalised verification of results.
Transport infrastructure
The roads sector has had notable achievements with respect to funding, management and maintenance over the last seven years. The transport sector, however, faces two big problems. First, there is a hangover of payment arrears from earlier road contracts. Second, the programme of expansion presented in the Government’s strategy appears to be beyond current financial capacity, the needs of the transport sector are capable of absorbing all government budgetary resources in any given year.
The Ministry used the MTEF guidelines to develop a comprehensive Road Sector Programme focused on poverty reduction. The Road Sector Development Programme (RSDP) 2001-2004outlined quantified targets for periodic maintenance and routine rehabilitation/construction works. The sector also developed a comprehensive medium-term investment perspective for the period 2002-2006. The roads sector has elaborate arrangements for external authentication of its results achieved. The RSDP is monitored at sector, programme and activity levels.
At the sector level the impact of the programme as a catalyst fpr economic growth in the areas of agriculture, trade and industries, tourism and access to social amenities is assessed. At the programme level the main monitoring indicators is evaluated to assess the achievement of the objectives and how to sustain the achievement. At the Activity Level the performance of the implementing agencies through efficient reporting, procurement, management and supervision is monitored.
xiv
The first in-house review of road sector performance was undertaken in 1995. The exercise identified existing weaknesses in the Ministry’s ability to monitor its programme; it also did the same for the implementing agencies under the sector.
Public safety
This study covers the Ministry of Justice, the Ministry of Interior (the Ministry itself and its agencies the Ghana Prison Service and the Ghana Police). There are no independent processes to verify results in either ministry. There are meticulous records, computerised at headquarters.
The Ministries’ PPMEDs have only one member of staff each. The organisations are run by very competent highly trained professionals and managers, who have been trying to improve their services, but performance figures are not fed into the process of allocation of the budgets.
Overall conclusions
Ghana’s PEMs system is in transition, moving towards results-oriented public management systems. The PEM system is not performance-oriented because that is not what it was designed to do initially. Over time many efforts have been made to reform it enable it to meet the challenges of public sector management today. None was as holistically designed as the PURMARP, through which the MTEF was introduced in 1999. But the MTEF/PUFMARP face the same implementation problems as all the previous reform efforts: lack of political commitment, uncertain leadership, and a pervasive non-performance culture. In addition, the full import of performance management is only just beginning to take hold, as was reflected in the 2003 Budget Preparation Guidelines which contained only a passing reminder to the MDAs about the work undertaken within the Civil Service Performance Improvement Plan (CSPIP).
National lessons
The MDAs as service providers are ill-equipped for the attainment of credible performance-oriented service delivery. Dysfunctional bureaucracy and cash-flow problems affect the implementation of programmes. Overall, these are the current norms in the system. These problems could be solved by strong leadership from the top. The only alternative, as in Ghana, is to appoint a Senior Minister to take charge, with powers to bring all Ministries into line with the system.
International lessons
In Africa leadership from the very top on performance management reforms is crucial for success. The experience of countries in South America is similar. In every successful reform the President and/or top group of senior political figures supports the reform programmes and gives it close personal attention and high political profile.
1
Chapter 1: Introduction
1.1 Introduction
This is one of seven country case studies commissioned by ODI/CAPE on the use and effectiveness of results-oriented budgeting in low-income countries. The purpose of the ODI programme is to throw light on current practices in managing public expenditure with a view to achieving targets and results, to explore the possibilities and constraints of improving current practices, and to make recommendations on best readily achievable practice in low-income/PRSP countries
Ghana is included among the country studies because of its commitment to the ideals of implementing both a results-oriented public expenditure management system and a poverty reduction strategy programme. This country case study is built on the previous work by ODI on Ghana by Mick Foster and Douglas Zormelo: How, When, and Why Does Poverty Get Budgetary Priority and Poverty-reducing Institutional change and PRSP Processes: the Ghana Case, (July 2001) by Tony Killick and Charles Abudgre.
A comprehensive desk study of Poverty Reduction Strategy Papers by ODI1 shows that the countries that have prepared these documents have sharply increased their interest in longer-term poverty reduction outcomes, and in many cases have developed medium-term plans for public expenditure which are associated with explicit targets for increasing the outreach and standards of poverty-reducing public services. However, these outcome and output targets are often not systematically translated into corresponding targets at the input and activity level and the costs of achieving them are often not firmly established. There may thus be mismatches between the resources mobilised and the results sought.
For the purposes of this study, we have selected six sectors covering seven Ministries, Departments and Agencies (MDAs) in Ghana to examine and evaluate their performance delivery mechanisms. These sectors have been chosen because of their central importance to the implementation of Ghana’s Poverty Reduction Strategy (GPRS). In the guidelines for the preparation of the 2003 Budget the Ministry of Finance has reinforce the government’s policy that all MDAs are to develop their GPRS programmes and incorporate them into their Medium-term Expnediture Framework (MTEF) budgets. In this sense, all MDAs in Ghana are beginning to focus on the GPRS and their individual contributions are equally important.
Table 1: Total number of sector MDAs
Sectors of the Study Sector Ministries to be covered Agriculture Ministry of Food and Agriculture Rural Development Services Ministry of Local Government & Rural
Development Education Ministry of Education Health (Public Health and Health Care) Ministry of Health Transport Infrastructure Ministry of Roads and Transport Public Safety Ministry of Interior, Ministry of Justice
Ghana was already on the road to carrying out performance management when in 1997 it embraced the implementation of a results- and accountability-PEM system or put more simply, ‘performance
1 Booth and Lucas (2002)

2
management’. Under performance management, input-oriented budgets are turned into performance budgets; cash-based accounting systems are changed into accrual-based cost accounting systems; and compliance and financial audits are complemented by performance audits and evaluations.2
Box 1: A performance management model
Ghana has been one of the pilot countries for the World Bank’s Comprehensive Development Framework (CDF). CDF principles call on donors to support development strategies to address poverty that are: (i) country-led; (ii) based on long-term, holistic and consultative economic and social programmes; (iii) results-oriented, with realistic objectives linked to resources and effective
2 (OECD (1997a) In Search of Results: Performance Management Practices Paris: OECD). Whilst accrual accounting deals with the financial aspects of performance reporting, performance audits and evaluations deal with the technical qualitative and quantitative aspects of the results being produced.
ST R A T E G Y O utcom es: aim s and objectives o f policy; p rincipal m eans and resources fo r achieving them
P E R F O R M A N C E M E A SU R E S C riteria and m easures fo r assessing achievem ent of po licy ob jectives that dem onstrate results clearly w ithout p lacing excessive burdens on organisations
T A R G E T S Intended Levels o f P erform ance d isaggregated and cascaded dow n to operational units
P R O G R A M M EE V A L U A T IO NR eview o fachievem ent o fstrategic aim s, andof m eans used , inlight o f reportingresults and otherin form ation.
V E R IF IC A T IO N O F R E SU L T S A ssessm ent of progress towards targets
R E P O R T IN G R E SU L T S C ollection and tim ely com m unication o f accurate and consistent data
Characteristics of Performance Measures
Measures should be: 1. Relevant to policy, organisation and programme objectives. 2. Balanced, covering all significant aspects of objectives sought. 3. Attributable to steps taken to implement policies and programmes. 4. Unambiguous in the interpretations that can be placed on them. 5. Timely, allowing progress to be monitored at prescribed intervals. 6. Robust in the face of organisational changes. 7. Compliance with past performance and that of similar entities. 8. Verifiable with documentation and/or triangulation. 9. Should avoid creating perverse incentives.
Source: NAO
3
feedback mechanisms; and (iv) supported by a co-ordinated assistance programme, integrating both donor and government resources. The GPRS reflects the CDF principles. The previous Ghana government prepared an Interim Poverty Reduction Strategy Paper (IPRSP) but was not able to implement it.
When the new democratically elected government took over the administration of the country at the beginning of 2001 the Ministry of Economic Planning and Regional Co-operation (MEPRC) was charged by the government with (i) reviewing the Ghana Vision 2020, and (ii) preparimg a new PRSP. The first version of the new Ghana Poverty Reduction Strategy (GPRS) paper was ready by November 2001. It was subsequently reviewed and improved until a final version was submitted to the mini-Consultation Group meeting in Accra in early 2002. The GPRS is supposed to represent the policy intentions of the Government of Ghana to fight poverty in all its forms.
Efforts to improve the government’s financial management system date back to the start of the Economic Recovery Programme (ERP) and the Structural Adjustment Programme (SAP) in the 1980s.The first phase of the ERP, in 1983, was the most serious and comprehensive effort to change the structure of economic incentives and institutions in the post-independence era. The Economic Management Support (EMS) project in 1991 sought improvements in budgeting, auditing, expenditure reporting and tax administration. These efforts at financial reform were piecemeal in nature, as they were not guided by the requirements of an integrated financial management system. In 1996 the government embarked on the Public Finance and Management Reform Programme (PUFMARP) which was aimed at developing an integrated public financial management system covering: (i) budget preparation; (ii) budget implementation; (iii) accounting; (iv)cash management; (v) aid and debt management; (vi) revenue; (vii) procurement and (viii) auditing. The first three components were described as the Budget and Public Expenditure Management System (BPEMS) and were implemented by means of the development of the Medium Term Expenditure Framework (MTEF).
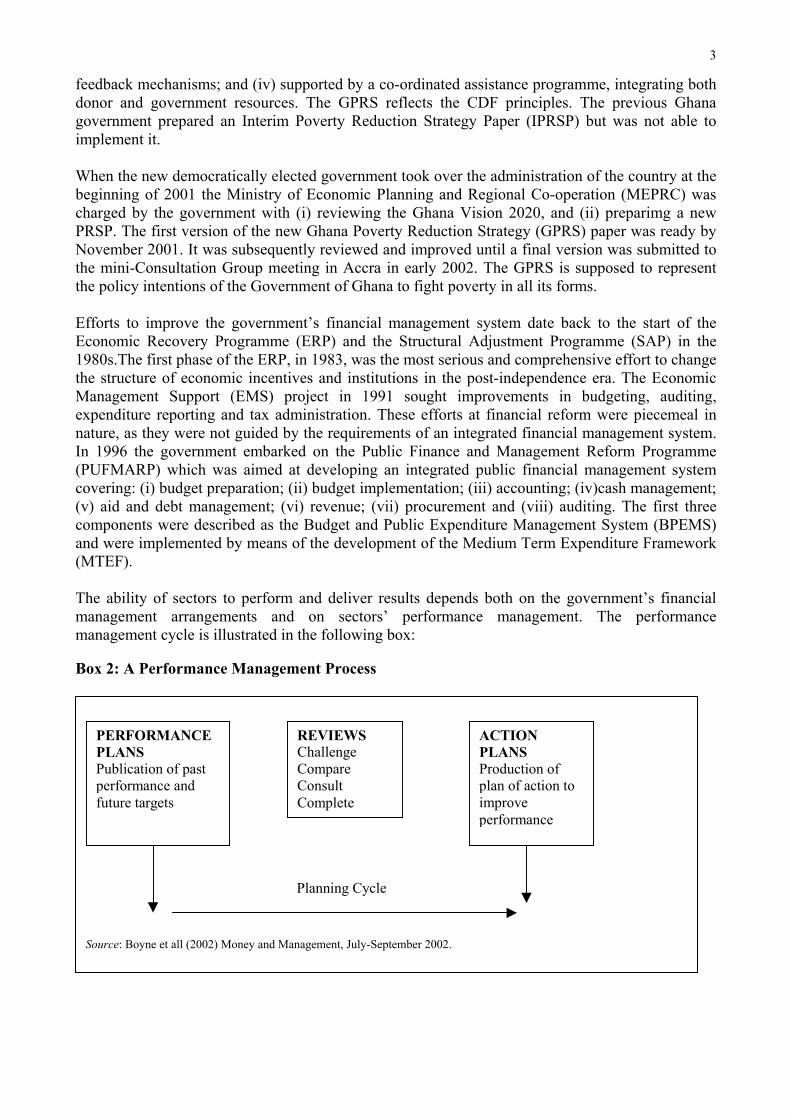
The ability of sectors to perform and deliver results depends both on the government’s financial management arrangements and on sectors’ performance management. The performance management cycle is illustrated in the following box:
Box 2: A Performance Management Process
PERFORMANCEPLANSPublication of pastperformance andfuture targets
REVIEWSChallengeCompareConsultComplete
ACTIONPLANSProduction ofplan of action toimproveperformance
Planning Cycle
Source: Boyne et all (2002) Money and Management, July-September 2002.
4
This paper asks what elements of a results-oriented public expenditure management (PEM) system are in place in Ghana in the six sectors analysed. We examine whether, in the light of political commitment, PEM systems can deliver results, especially the poverty reduction targets pledged by the government. Thus, we examine whether it is possible to turn political intentions into outcomes within the current PEM system in Ghana. The questionnaires used in field work interviews and a summary of the responses are reproduced in Annexes 1A and 1B.
5
Chapter 2: Scene Setting, The Public Expenditure Management Systems (PEMs) in Ghana
2.1 Summary of the institutional framework
The current Public Expenditure Management systems (PEMs) in Ghana are based on tenets outlined in the Financial Administration Decree and the Financial Administration Regulation of 1979. Some innovations were introduced during the Economic Management Support project in 1991 (for example, Public Expenditure Reviews) and the practices introduced under the Medium-Term Expenditure Freamwork since 1999. The 1992 Constitution and the recommendations of the Public Administration Restructuring and Decentralisation Implementation Committee (PARDIC) also inform practices. The PEMs are structured around the functions of the following core institutions of government.
Parliament: Parliament passes all laws in the country, including the Annual Appropriation Bill which sets out all government expenditures for the year. Two committees support its work on public expenditure management: the Finance Committee and the Public Accounts Committee. There are various Parliamentary Select Committees responsible for looking after economic, political, social and legal developments. The lack of independently verifiable data and the insufficiency of research capacity to support parliamentary processes of scrutiny often limit the work of Parliament in supporting the financial management system.
The Cabinet: The Cabinet is made up of the President and a select group of Ministers of State (the Constitution sets an upper limit of 19 members). The Cabinet’s primary financial role is to ensure that the Budget reflects the priorities of the government. It approves sectoral allocations recommended by the Ministry of Finance before they are submitted to Parliament. Currently the Cabinet has four major Committees: the Economic Management Team (EMT); Social Services; Governance; and Infrastructure. Under the present government, an Economic Management Team consisting of five ministers has been set up under the leadership of a Senior Minister. Its role currently is to consider the budget and economic policy generally and to coordinate the economic management within government. It is currently seen as an important institutional bridge in the whole PEM system.
The Ministry of Finance: The MoF (including one of its principal agencies the Controller and Accountant General (CAG)) is responsible for the preparation of the budget, and its implementation, monitoring and reporting. Thje MoF initiates the annual budget preparation process by issuing budget guidelines, including cash ceilings for Ministries, Departments and Agencies (MDAs). It also collates MDAs’ budgets and summarises the budget in a statement presented to the Cabinet for approval. This is an iterative process leading to a final document which is presented to Parliament by the Minister of Finance on behalf of the President. Under present arrangements the financial year starts before the budget pertaining to that year is read. The MoF ( including all the agencies under it) has stated its objectives as follows: (i) to formulate and implement sound macroeconomic policies for economic growth and development; (ii)to create an enabling environment for private sector growth; (iii) to maximise the mobilisation of financial resources; (iv) to allocate and manage financial resources efficiently, effectively and rationally; (v) to account for all public finances properly; and (vi) to improve human resources and institutional management capacity.
6
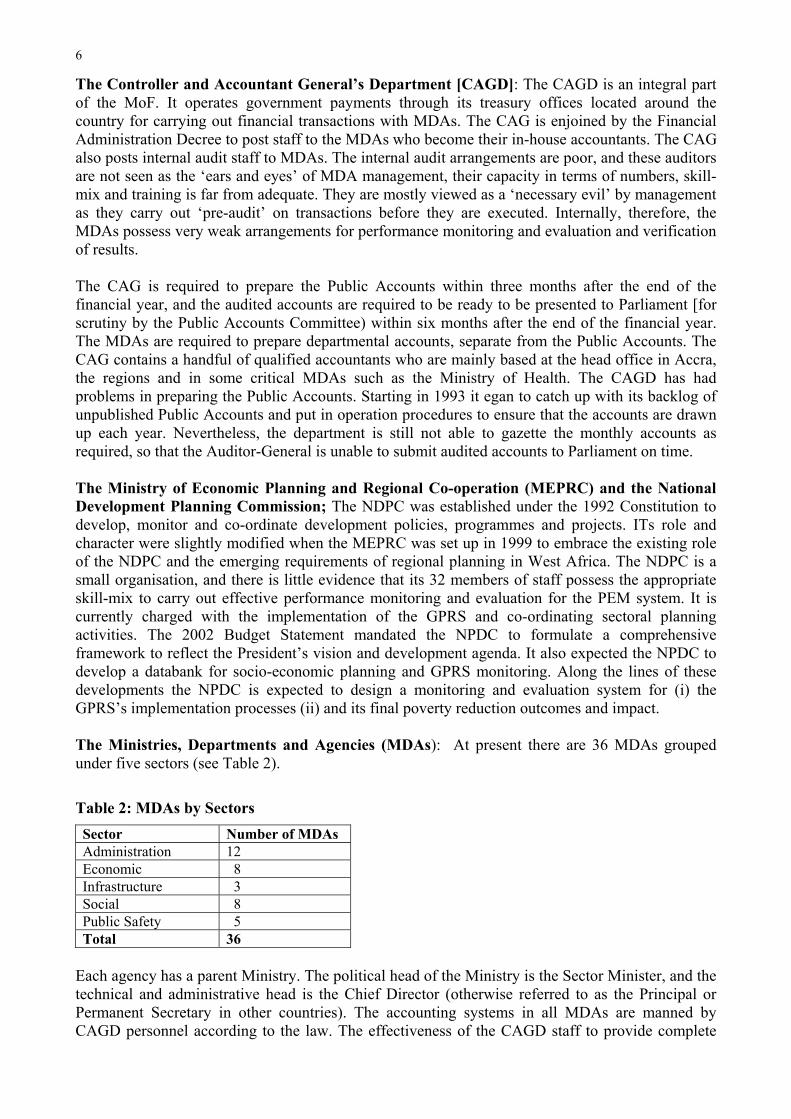
The Controller and Accountant General’s Department [CAGD]: The CAGD is an integral part of the MoF. It operates government payments through its treasury offices located around the country for carrying out financial transactions with MDAs. The CAG is enjoined by the Financial Administration Decree to post staff to the MDAs who become their in-house accountants. The CAG also posts internal audit staff to MDAs. The internal audit arrangements are poor, and these auditors are not seen as the ‘ears and eyes’ of MDA management, their capacity in terms of numbers, skill-mix and training is far from adequate. They are mostly viewed as a ‘necessary evil’ by management as they carry out ‘pre-audit’ on transactions before they are executed. Internally, therefore, the MDAs possess very weak arrangements for performance monitoring and evaluation and verification of results.
The CAG is required to prepare the Public Accounts within three months after the end of the financial year, and the audited accounts are required to be ready to be presented to Parliament [for scrutiny by the Public Accounts Committee) within six months after the end of the financial year. The MDAs are required to prepare departmental accounts, separate from the Public Accounts. The CAG contains a handful of qualified accountants who are mainly based at the head office in Accra, the regions and in some critical MDAs such as the Ministry of Health. The CAGD has had problems in preparing the Public Accounts. Starting in 1993 it egan to catch up with its backlog of unpublished Public Accounts and put in operation procedures to ensure that the accounts are drawn up each year. Nevertheless, the department is still not able to gazette the monthly accounts as required, so that the Auditor-General is unable to submit audited accounts to Parliament on time.
The Ministry of Economic Planning and Regional Co-operation (MEPRC) and the National Development Planning Commission; The NDPC was established under the 1992 Constitution to develop, monitor and co-ordinate development policies, programmes and projects. ITs role and character were slightly modified when the MEPRC was set up in 1999 to embrace the existing role of the NDPC and the emerging requirements of regional planning in West Africa. The NDPC is a small organisation, and there is little evidence that its 32 members of staff possess the appropriate skill-mix to carry out effective performance monitoring and evaluation for the PEM system. It is currently charged with the implementation of the GPRS and co-ordinating sectoral planning activities. The 2002 Budget Statement mandated the NPDC to formulate a comprehensive framework to reflect the President’s vision and development agenda. It also expected the NPDC to develop a databank for socio-economic planning and GPRS monitoring. Along the lines of these developments the NPDC is expected to design a monitoring and evaluation system for (i) the GPRS’s implementation processes (ii) and its final poverty reduction outcomes and impact.
The Ministries, Departments and Agencies (MDAs): At present there are 36 MDAs grouped under five sectors (see Table 2).
Table 2: MDAs by Sectors Sector Number of MDAs Administration 12 Economic 8 Infrastructure 3 Social 8 Public Safety 5 Total 36
Each agency has a parent Ministry. The political head of the Ministry is the Sector Minister, and the technical and administrative head is the Chief Director (otherwise referred to as the Principal or Permanent Secretary in other countries). The accounting systems in all MDAs are manned by CAGD personnel according to the law. The effectiveness of the CAGD staff to provide complete
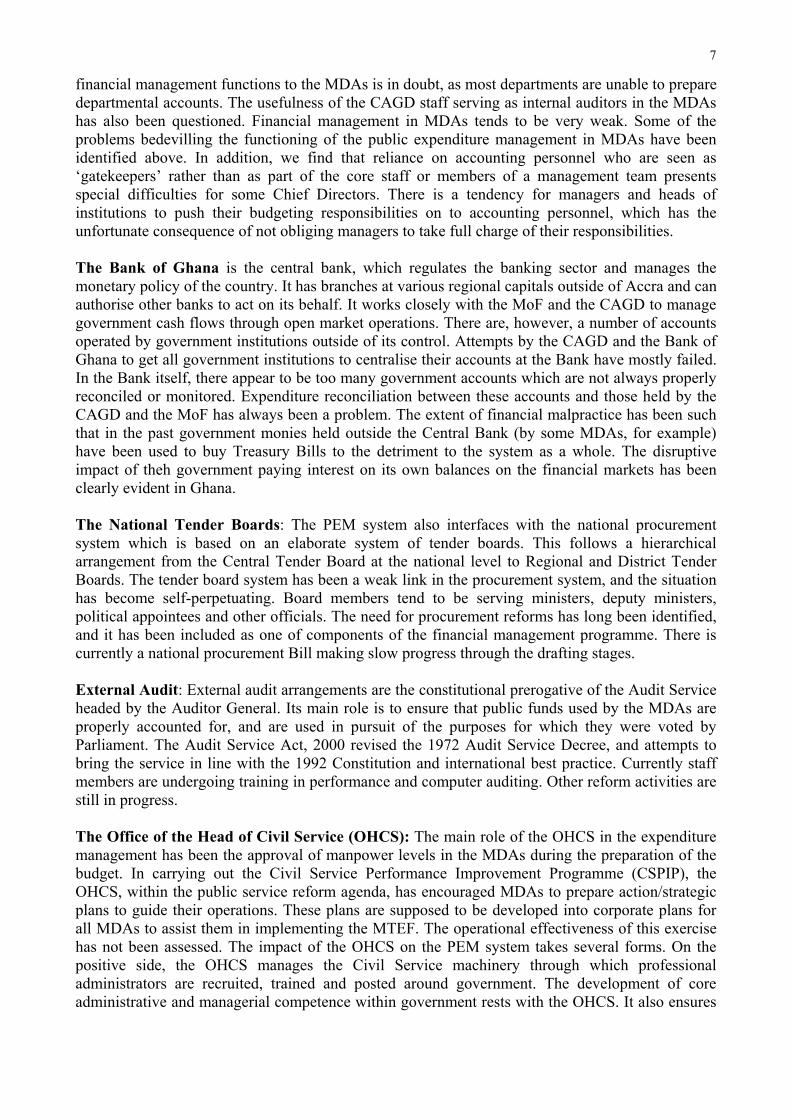
7
financial management functions to the MDAs is in doubt, as most departments are unable to prepare departmental accounts. The usefulness of the CAGD staff serving as internal auditors in the MDAs has also been questioned. Financial management in MDAs tends to be very weak. Some of the problems bedevilling the functioning of the public expenditure management in MDAs have been identified above. In addition, we find that reliance on accounting personnel who are seen as ‘gatekeepers’ rather than as part of the core staff or members of a management team presents special difficulties for some Chief Directors. There is a tendency for managers and heads of institutions to push their budgeting responsibilities on to accounting personnel, which has the unfortunate consequence of not obliging managers to take full charge of their responsibilities.
The Bank of Ghana is the central bank, which regulates the banking sector and manages the monetary policy of the country. It has branches at various regional capitals outside of Accra and can authorise other banks to act on its behalf. It works closely with the MoF and the CAGD to manage government cash flows through open market operations. There are, however, a number of accounts operated by government institutions outside of its control. Attempts by the CAGD and the Bank of Ghana to get all government institutions to centralise their accounts at the Bank have mostly failed. In the Bank itself, there appear to be too many government accounts which are not always properly reconciled or monitored. Expenditure reconciliation between these accounts and those held by the CAGD and the MoF has always been a problem. The extent of financial malpractice has been such that in the past government monies held outside the Central Bank (by some MDAs, for example) have been used to buy Treasury Bills to the detriment to the system as a whole. The disruptive impact of theh government paying interest on its own balances on the financial markets has been clearly evident in Ghana.
The National Tender Boards: The PEM system also interfaces with the national procurement system which is based on an elaborate system of tender boards. This follows a hierarchical arrangement from the Central Tender Board at the national level to Regional and District Tender Boards. The tender board system has been a weak link in the procurement system, and the situation has become self-perpetuating. Board members tend to be serving ministers, deputy ministers, political appointees and other officials. The need for procurement reforms has long been identified, and it has been included as one of components of the financial management programme. There is currently a national procurement Bill making slow progress through the drafting stages.
External Audit: External audit arrangements are the constitutional prerogative of the Audit Service headed by the Auditor General. Its main role is to ensure that public funds used by the MDAs are properly accounted for, and are used in pursuit of the purposes for which they were voted by Parliament. The Audit Service Act, 2000 revised the 1972 Audit Service Decree, and attempts to bring the service in line with the 1992 Constitution and international best practice. Currently staff members are undergoing training in performance and computer auditing. Other reform activities are still in progress.
The Office of the Head of Civil Service (OHCS): The main role of the OHCS in the expenditure management has been the approval of manpower levels in the MDAs during the preparation of the budget. In carrying out the Civil Service Performance Improvement Programme (CSPIP), the OHCS, within the public service reform agenda, has encouraged MDAs to prepare action/strategic plans to guide their operations. These plans are supposed to be developed into corporate plans for all MDAs to assist them in implementing the MTEF. The operational effectiveness of this exercise has not been assessed. The impact of the OHCS on the PEM system takes several forms. On the positive side, the OHCS manages the Civil Service machinery through which professional administrators are recruited, trained and posted around government. The development of core administrative and managerial competence within government rests with the OHCS. It also ensures
8
that departments are not over- or under-staffed by shifting personnel around the government machinery according to the requirements of the service.
These centralised arrangements appear to have performed well in the past. Under present arrangements, however, two important unfortunate side-effects of the modus operandi of the OHCS can be observed. First, by shifting staff around according to central arrangements some MDAs tend to lack critical personnel in certain areas (for example, monitoring and evaluation). The other common complaint is the limitations on the ability of MDAs to recruit qualified financial professionals.
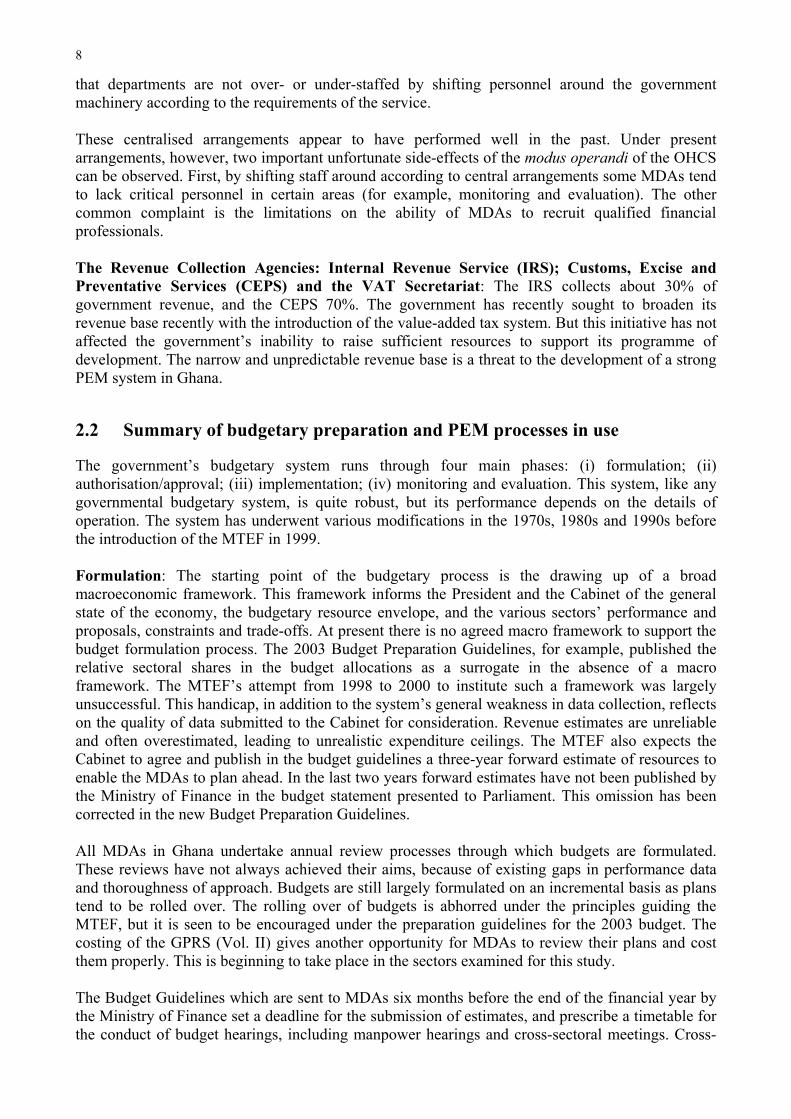
The Revenue Collection Agencies: Internal Revenue Service (IRS); Customs, Excise and Preventative Services (CEPS) and the VAT Secretariat: The IRS collects about 30% of government revenue, and the CEPS 70%. The government has recently sought to broaden its revenue base recently with the introduction of the value-added tax system. But this initiative has not affected the government’s inability to raise sufficient resources to support its programme of development. The narrow and unpredictable revenue base is a threat to the development of a strong PEM system in Ghana.
2.2 Summary of budgetary preparation and PEM processes in use
The government’s budgetary system runs through four main phases: (i) formulation; (ii) authorisation/approval; (iii) implementation; (iv) monitoring and evaluation. This system, like any governmental budgetary system, is quite robust, but its performance depends on the details of operation. The system has underwent various modifications in the 1970s, 1980s and 1990s before the introduction of the MTEF in 1999.
Formulation: The starting point of the budgetary process is the drawing up of a broad macroeconomic framework. This framework informs the President and the Cabinet of the general state of the economy, the budgetary resource envelope, and the various sectors’ performance and proposals, constraints and trade-offs. At present there is no agreed macro framework to support the budget formulation process. The 2003 Budget Preparation Guidelines, for example, published the relative sectoral shares in the budget allocations as a surrogate in the absence of a macro framework. The MTEF’s attempt from 1998 to 2000 to institute such a framework was largely unsuccessful. This handicap, in addition to the system’s general weakness in data collection, reflects on the quality of data submitted to the Cabinet for consideration. Revenue estimates are unreliable and often overestimated, leading to unrealistic expenditure ceilings. The MTEF also expects the Cabinet to agree and publish in the budget guidelines a three-year forward estimate of resources to enable the MDAs to plan ahead. In the last two years forward estimates have not been published by the Ministry of Finance in the budget statement presented to Parliament. This omission has been corrected in the new Budget Preparation Guidelines.
All MDAs in Ghana undertake annual review processes through which budgets are formulated. These reviews have not always achieved their aims, because of existing gaps in performance data and thoroughness of approach. Budgets are still largely formulated on an incremental basis as plans tend to be rolled over. The rolling over of budgets is abhorred under the principles guiding the MTEF, but it is seen to be encouraged under the preparation guidelines for the 2003 budget. The costing of the GPRS (Vol. II) gives another opportunity for MDAs to review their plans and cost them properly. This is beginning to take place in the sectors examined for this study.
The Budget Guidelines which are sent to MDAs six months before the end of the financial year by the Ministry of Finance set a deadline for the submission of estimates, and prescribe a timetable for the conduct of budget hearings, including manpower hearings and cross-sectoral meetings. Cross-
9
sectoral meetings are intended to enable MDAs to identify the objectives and which outputs they have in common, and have been instituted since 1994, but they have not worked well. Under the MTEF, manpower hearings were to be phased out, as Item 1, Personnel Costs were expected to be allocated/apportioned over Service costs.
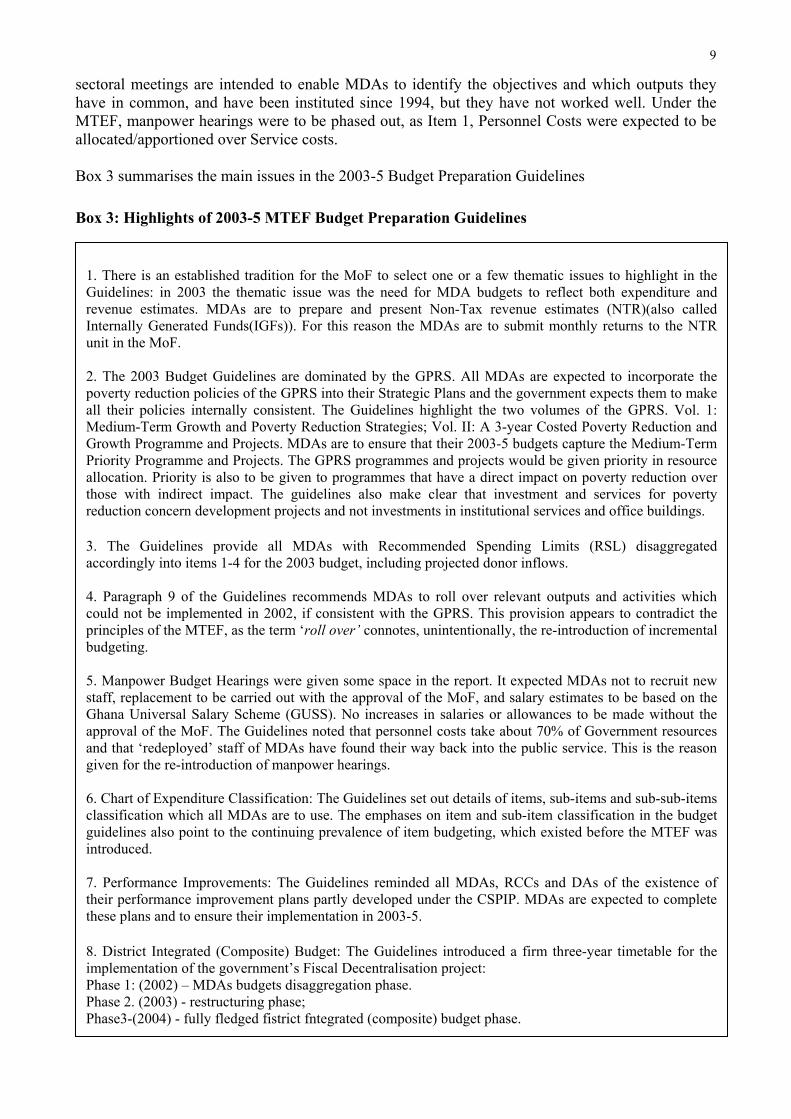
Box 3 summarises the main issues in the 2003-5 Budget Preparation Guidelines
Box 3: Highlights of 2003-5 MTEF Budget Preparation Guidelines
1. There is an established tradition for the MoF to select one or a few thematic issues to highlight in the Guidelines: in 2003 the thematic issue was the need for MDA budgets to reflect both expenditure and revenue estimates. MDAs are to prepare and present Non-Tax revenue estimates (NTR)(also called Internally Generated Funds(IGFs)). For this reason the MDAs are to submit monthly returns to the NTR unit in the MoF.
2. The 2003 Budget Guidelines are dominated by the GPRS. All MDAs are expected to incorporate the poverty reduction policies of the GPRS into their Strategic Plans and the government expects them to make all their policies internally consistent. The Guidelines highlight the two volumes of the GPRS. Vol. 1: Medium-Term Growth and Poverty Reduction Strategies; Vol. II: A 3-year Costed Poverty Reduction and Growth Programme and Projects. MDAs are to ensure that their 2003-5 budgets capture the Medium-Term Priority Programme and Projects. The GPRS programmes and projects would be given priority in resource allocation. Priority is also to be given to programmes that have a direct impact on poverty reduction over those with indirect impact. The guidelines also make clear that investment and services for poverty reduction concern development projects and not investments in institutional services and office buildings.
3. The Guidelines provide all MDAs with Recommended Spending Limits (RSL) disaggregated accordingly into items 1-4 for the 2003 budget, including projected donor inflows.
4. Paragraph 9 of the Guidelines recommends MDAs to roll over relevant outputs and activities which could not be implemented in 2002, if consistent with the GPRS. This provision appears to contradict the principles of the MTEF, as the term ‘roll over’ connotes, unintentionally, the re-introduction of incremental budgeting.
5. Manpower Budget Hearings were given some space in the report. It expected MDAs not to recruit new staff, replacement to be carried out with the approval of the MoF, and salary estimates to be based on the Ghana Universal Salary Scheme (GUSS). No increases in salaries or allowances to be made without the approval of the MoF. The Guidelines noted that personnel costs take about 70% of Government resources and that ‘redeployed’ staff of MDAs have found their way back into the public service. This is the reason given for the re-introduction of manpower hearings.
6. Chart of Expenditure Classification: The Guidelines set out details of items, sub-items and sub-sub-items classification which all MDAs are to use. The emphases on item and sub-item classification in the budget guidelines also point to the continuing prevalence of item budgeting, which existed before the MTEF was introduced.
7. Performance Improvements: The Guidelines reminded all MDAs, RCCs and DAs of the existence of their performance improvement plans partly developed under the CSPIP. MDAs are expected to complete these plans and to ensure their implementation in 2003-5.
8. District Integrated (Composite) Budget: The Guidelines introduced a firm three-year timetable for the implementation of the government’s Fiscal Decentralisation project: Phase 1: (2002) – MDAs budgets disaggregation phase. Phase 2. (2003) - restructuring phase; Phase3-(2004) - fully fledged fistrict fntegrated (composite) budget phase.
10
Authorisation /Approval: Recent changes introduced under the MTEF expect MDA estimates to be prepared and approved by Budget Management Committees (BMCs). When the MDAs receive their budget ceilings from the MoF, the BMCs work with their departmental heads to distribute the allocated sums internally. The details of the MDAs’, once agreed with their sector Ministers, form the basis of their submissions to the MoF. MDAs are also expected to take into account any broad sectoral considerations and integrate their budgets into the GPRS plans. The MDA’s estimates, once agreed with the MoF, are then collated and sent to the Cabinet for approval. Any change at the Cabinet level is signalled down the line for the MDAs to adjust their estimates accordingly. Once this iterative process is complete, the final estimates are sent to Parliament for approval. The deadline for final submission is 30 November of any particular year. At the final approval stage in the Parliament appropriate Select Committees examine the estimates and call on MDA heads to defend their budgets. The process is completed with the passing of the Appropriation Bill.
Implementation: The implementation of the budget begins when the Ministry of Finance issues a general warrant to the Controller and Accountant General who in turn instructs treasury offices to allow the expenditure of specific sums of money by MDAs. Salaries and wages are paid automatically from the CAGD to the MDAs on a quarterly basis once the general warrant is issued by the MoF. Specific warrants are used to control non-wage operational and maintenance expenditures.
Box 3 cont.
The Guidelines noted that all MDAs were expected to disaggregate their budgets into various levels of administration: national, regional and district. Out of about 36 MDAs only 3 (Agriculture, Education and Health) had attempted to disaggregate their budgets. The Guidelines expected all MDAs to do so in 2003.
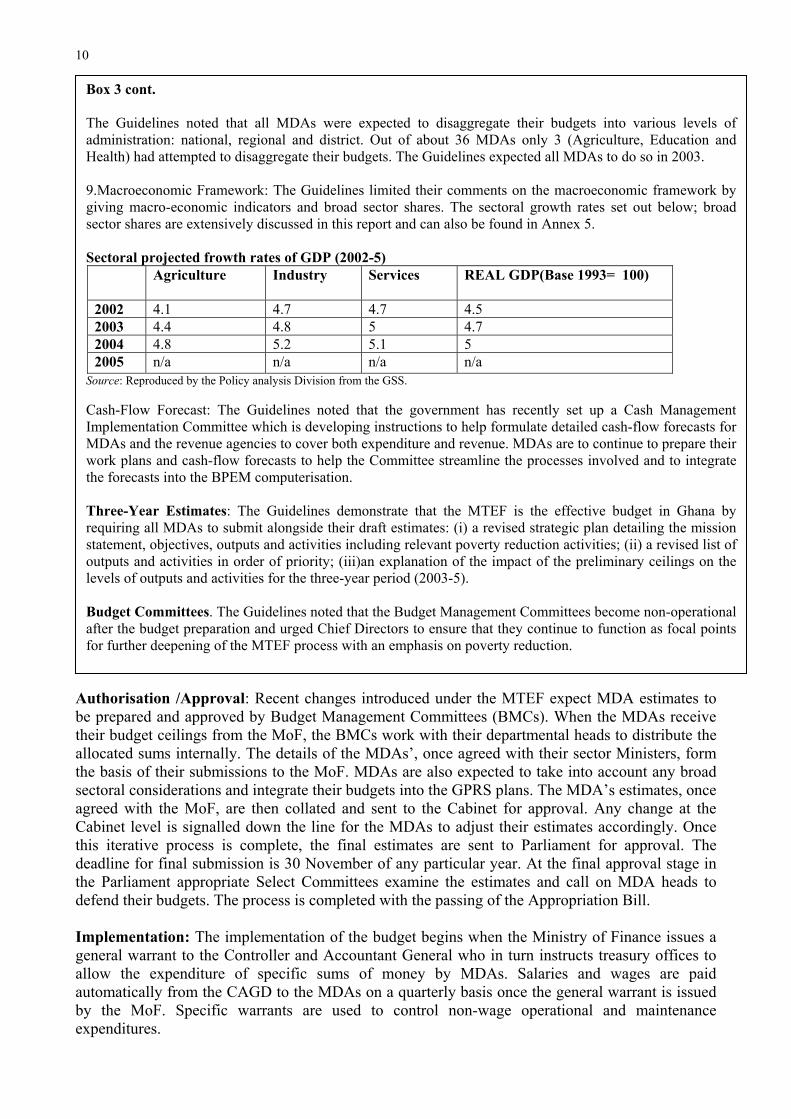
9.Macroeconomic Framework: The Guidelines limited their comments on the macroeconomic framework by giving macro-economic indicators and broad sector shares. The sectoral growth rates set out below; broad sector shares are extensively discussed in this report and can also be found in Annex 5.
Sectoral projected frowth rates of GDP (2002-5) Agriculture Industry Services REAL GDP(Base 1993= 100)
2002 4.1 4.7 4.7 4.5 2003 4.4 4.8 5 4.7 2004 4.8 5.2 5.1 5 2005 n/a n/a n/a n/a
Source: Reproduced by the Policy analysis Division from the GSS.
Cash-Flow Forecast: The Guidelines noted that the government has recently set up a Cash Management Implementation Committee which is developing instructions to help formulate detailed cash-flow forecasts for MDAs and the revenue agencies to cover both expenditure and revenue. MDAs are to continue to prepare their work plans and cash-flow forecasts to help the Committee streamline the processes involved and to integrate the forecasts into the BPEM computerisation.
Three-Year Estimates: The Guidelines demonstrate that the MTEF is the effective budget in Ghana by requiring all MDAs to submit alongside their draft estimates: (i) a revised strategic plan detailing the mission statement, objectives, outputs and activities including relevant poverty reduction activities; (ii) a revised list of outputs and activities in order of priority; (iii)an explanation of the impact of the preliminary ceilings on the levels of outputs and activities for the three-year period (2003-5).
Budget Committees. The Guidelines noted that the Budget Management Committees become non-operational after the budget preparation and urged Chief Directors to ensure that they continue to function as focal points for further deepening of the MTEF process with an emphasis on poverty reduction.
11
The process requires the MDAs to apply to the Ministry of Finance for the release of funds for non-wage expenditures, which, when approved are paid by the CAGD. At times of acute financial crisis, applications far exceed budgetary allocations. At least within the last ten years various changes and innovations have been introduced to facilitate the implementation of the budget (drawing limits, the public investment programme (PIP),. Most of these changes were introduced for the purpose of control and to achieve traditional accountability. In general, the PEM system was set up in an era when the prevailing management wisdom was routine control of expenditure, based on achieving traditional accountability through ‘vote controls’ on line items in the budget. Over time, patches of changes have been added to the system. However, there are no indications under the current arrangement for implementation that the system has been designed to achieve performance.
Monitoring and Evaluation: Within the existing system the institutional M&E arrangements are based on the Public Administration Restructuring and Decentralisation Implementation Committee (PARDIC) structure of the Ministries. M&E is housed in the Policy, Planning, Monitoring and Evaluation Departments (PPMED) in the MDAs.
It has long been observed that the role and functions of the PPMEDs are unclear (for example in the Public Expenditure Review 1993), and they tend to be under-resourced in terms of staff numbers and influence within the various sectors. Their functioning appears to be impaired for all kinds of reasons that differ from agency to agency. The skill mix of staff in these units is not known with any clarity. Comments have been made by MDA heads about the difficulty in attracting good staff into such units, and this appears to be related in part to civil service salaries and career streams. M&E findings are little used in internal decision-making. Low demand for M&E leads to low quality supply. One sure way to stimulate the system is to demand high quality M&E outputs.
Sectoral Ministries appear to differ significantly in the priority they attach to their PPMEDs. While the Ministry of the Interior has only one person responsible for M&E, the Ministry of Agriculture has several staff members devoted to this role (a figure of 80 was given, but it was not clear how many people actually undertake the M&E function). PPMEDs also appear not to collect data on service delivery by parastatal organisations. Thus ministries’ data present an incomplete picture of sector performance, especially for sectors such as health and transport where the parastatals play a significant role.
Monitoring and evaluation by Central Management Agencies (for example, the MoF, NDPC, etc.) is constrained by the lack of regular data. In 1993 the MoF set up the Expenditure Monitoring Unit (EMU) to collate monthly expenditure classified by item using data generated from the treasury offices. The EMU managed to produce reports for a period of time, but difficulties of reconciliation of data from various sources plagued its operations. In general, the EMU did not survive and was eventually wound up.
The MoF has also instituted a project inspection unit to physically inspect projects and report on the work being carried out. The impact of this unit is minimal, however, as its coverage is limited by staff strength and logistics.
2.3 The structure and composition of the budget
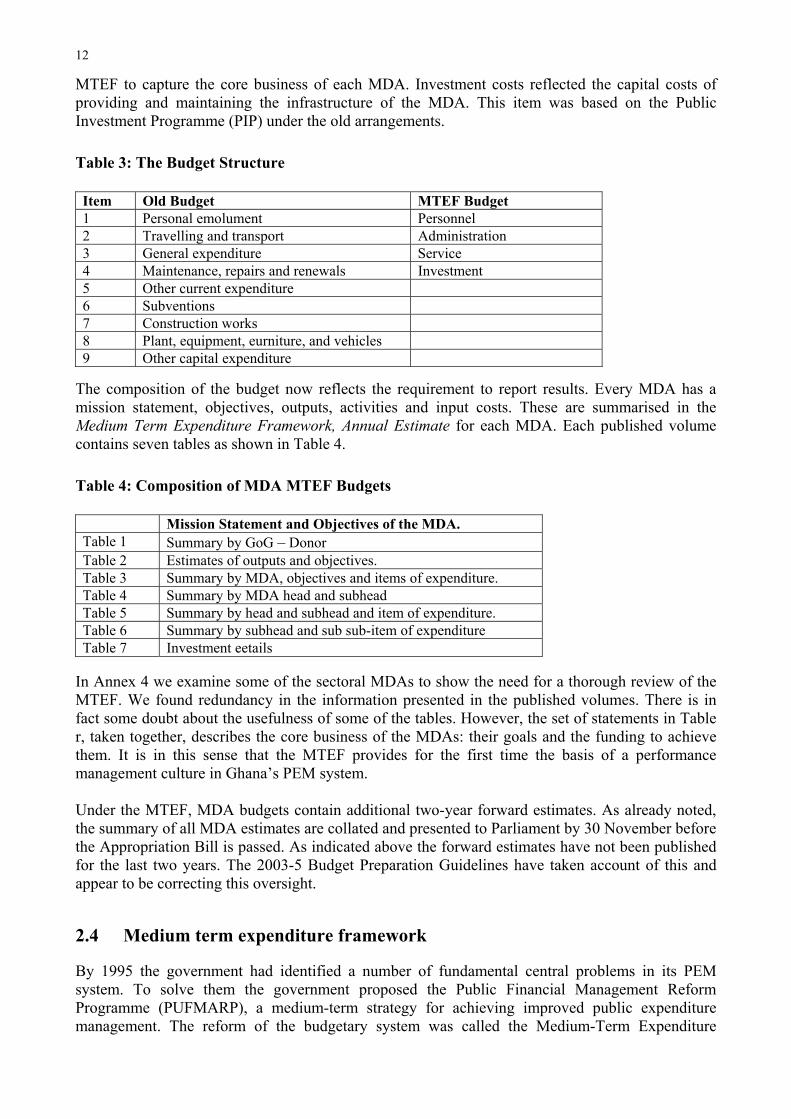
The structure of the Budget has undergone changes with the introduction of the MTEF (see Section 2.4). Before this, the structure of an MDA budget was based on line items, which showed estimates of the costs of various inputs during the year. The existing nine-line items were compressed into four under the MTEF. Personnel costs were carried over from the old system with the intention of disaggregating this item over Service Costs once more data became available. Existing administrative costs were also given similar treatment. The Service item was introduced under the
12
MTEF to capture the core business of each MDA. Investment costs reflected the capital costs of providing and maintaining the infrastructure of the MDA. This item was based on the Public Investment Programme (PIP) under the old arrangements.
Table 3: The Budget Structure
Item Old Budget MTEF Budget 1 Personal emolument Personnel 2 Travelling and transport Administration 3 General expenditure Service 4 Maintenance, repairs and renewals Investment 5 Other current expenditure 6 Subventions 7 Construction works 8 Plant, equipment, eurniture, and vehicles 9 Other capital expenditure
The composition of the budget now reflects the requirement to report results. Every MDA has a mission statement, objectives, outputs, activities and input costs. These are summarised in theMedium Term Expenditure Framework, Annual Estimate for each MDA. Each published volume contains seven tables as shown in Table 4.
Table 4: Composition of MDA MTEF Budgets
Mission Statement and Objectives of the MDA. Table 1 Summary by GoG – Donor Table 2 Estimates of outputs and objectives. Table 3 Summary by MDA, objectives and items of expenditure. Table 4 Summary by MDA head and subhead Table 5 Summary by head and subhead and item of expenditure. Table 6 Summary by subhead and sub sub-item of expenditure Table 7 Investment eetails
In Annex 4 we examine some of the sectoral MDAs to show the need for a thorough review of the MTEF. We found redundancy in the information presented in the published volumes. There is in fact some doubt about the usefulness of some of the tables. However, the set of statements in Table r, taken together, describes the core business of the MDAs: their goals and the funding to achieve them. It is in this sense that the MTEF provides for the first time the basis of a performance management culture in Ghana’s PEM system.
Under the MTEF, MDA budgets contain additional two-year forward estimates. As already noted, the summary of all MDA estimates are collated and presented to Parliament by 30 November before the Appropriation Bill is passed. As indicated above the forward estimates have not been published for the last two years. The 2003-5 Budget Preparation Guidelines have taken account of this and appear to be correcting this oversight.
2.4 Medium term expenditure framework
By 1995 the government had identified a number of fundamental central problems in its PEM system. To solve them the government proposed the Public Financial Management Reform Programme (PUFMARP), a medium-term strategy for achieving improved public expenditure management. The reform of the budgetary system was called the Medium-Term Expenditure
13
Framework (MTEF) to emphasise the change in focus from short term to medium-term budgeting. Under the MTEF approach, Ministries, Departments and Agencies draw upon the principles of both corporate and strategic planning to question the rationale for their existence, how they do business and for whom. First introduced with the implementation of the 1999 budget, the MTEF represents Ghana’s attempt to introduce a performance-based PEM system.
The MTEF was put into operation after two and a half years of preparation. It was designed to correct a number of defects and weaknesses in the financial system, which have been identified and documented extensively. For example, the inability to achieve the desired ‘predictability of flow of resources’ in the execution process rendered the budget an ineffective tool in the economic management. The MTEF was introduced by a government facing increasing challenges in the demand for more public accountability in accordance with international developments. Its initial activities were highly successful, partly because a project team of internationally competent Ghanaians families with the local terrain engineered it. The project team knew how to motivate a core team of budget directors in the Ministry of Finance to look outwards and to create different relationships with the MDAs. Another factor, which ensured the initial success, was the decision by the project team to expand coverage in the first year from three pilot MDAs to all MDAs. The importance of this decision is probably not fully appreciated, but it turned the MTEF process into the budget process.
The introduction of the MTEF in Ghana was seen as impressive by any standard as reported by a number international observers who visited the country during the period 1998-2000. The major achievement was that in its first year all the MDAs were able to produce a three-year integrated broad-based budget. The government acknowledged the need to: (i) create a more stable fiscal policy; (ii) allocate resources to priorities; (iii) use resources efficiently and effectively. To achieve all these objectives, the introduction of the MTEF was to be placed within the larger context of well-co-ordinated and integrated public sector reforms.
However, the rhetoric of the government was not backed by operational support for the reform programmes. The overall assessment of the first attempt to introduce a MTEF in Ghana was that it had generally been a fiasco.3 The MTEF largely failed in its promise to deliver improved PEM because of the lack of political support for the reform agenda itself and the MTEF process in particular. Nevertheless, while the government has been trying to decide how to proceed with the public sector reform agenda, the MTEF remains the effective budgeting system in Ghana.
2.5 Record of budget execution
Public Expenditure Reviews. In 1993 the government took over the responsibility of the annual exercise of assessing the impact of its expenditures, the Public Expenditure Review (PER), from the World Bank. This official record of the budget execution system had been going on for seven years prior to the takeover.
In the PER process (see Annex 7), the Ministry of Finance selects a thematic area in public expenditure every year in order to analyse budgetary performances. In the early years the reviews covered weaknesses in the budget and in public expenditure management as a whole. One practical benefit of the PER process is that it led to documentation of the weaknesses in the system and initiation of the financial management reform agenda in July 1995. By 1993 Ghana had undergone some ten years of Economic Recovery Programme (ERP)/ Structural Adjustment Programme (SAP). The Economic Management Support (EMS) project was under way. The budgetary system
3 Le Houerou and Taliercio (2002), Armah (1999)
14
was incremental in approach, and there were various forms of expenditure control systems (for example, ‘Drawing Limits’ as a means of meeting strict quantitative financial targets). The system was prone to frequent cutbacks and freezes on expenditure. A cumbersome certification and payment procedure was also designed to keep expenditures down. There were also unbudgeted expenditures included in the system, which exacerbated the problem of lack of accurate and timely expenditure data.
Macroeconomic instability and expenditure management. In Ghana high inflation rates and the depreciating cedi make assessments of government budgetary performance based on nominal financial values meaningless.
The cedi depreciated by 33% in 1999, 91.5% in 2000 and has continued to depreciate subsequently. Reported sectoral budgetary allocations rarely correspond to the actual releases to MDAs. Actual releases tend to increase the biases in the allocation process, because, ceteris paribus, the bigger spenders (Health, Education and Roads and Transport) are able to access their budgetary resources more easily than other equally important MDAs with relatively smaller budgets (Interior and Justice). In general, most MDAs do not prepare departmental audited accounts, and there is little evidence of reconciliation of the total overall expenditures in the sectoral MDAs and those reported by the CAGD Treasury Offices, because of fragmentation of funding and spending sources in the MDAs. To compensate for these difficulties, most analyses of budgetary performance is presented in allocated sectoalr shares in the budget. While these may convey the intention of the government, they fall short of the objectivity required in financial analyses.
The MTEF was introduced with the intention of planning and prioritising expenditure. Before the introduction of the MTEF the system did little to re-prioritise activities as resources declined. The 1999 MTEF failed to improve the situation.
Integrating aid into the budget. The MTEF also aimed at improving dialogure between the government and aid donors. Before the MTEF was introduced, sectors such as Roads, Health and Education had been operating Sector Investment Programmes (SIPs) supported by donors. The MTEF approach took the SIP processes a few steps further by taking into account inter- and intra-sectoral trade-offs and links. The process was intended to facilitate the development of comprehensive sector-wide approaches (SWAps) to donor support,
In Ghana the development of SWAPs has been important in the Health and Transport sectors to a large degree, and less so in other sectors – for instance, Education and Agriculture. In 2002 an attempt was made to develop comprehensive donor assistance to the government through a package of Multi-Donor Budgetary Support (MDBS), involving the MoF and various central management agencies (CMAs) working with the sectors. The government and its development partners met in 2002 to work out a new framework for donor support to form part of the budget-making process for 2003. There were difficulties with these arrangements, and the issue of the Budget Guidelines were delayed by three months, thus affecting MDAs’ ability to complete the preparation of their draft budgets for the 2003-5 MTEF incorporating GPRS targets with total confidence.
2.6 Financial management reform
There have been undue delays in the implementation of the entire financial management reform programme, and very little progress has been made to date. The current government is trying to remove some of the problems of implementing projects and programmes in the public sector, starting with the MoF and the CAGD and extending later to other MDAs.
15
In 2001 the new government set up a committee which produced a Comprehensive Financial Management Reform Action Plan, including analysis of the current shortcomings within the PEM system, namely (i) weak budget formulation and implementation; (ii) Weak monitoring and evaluation of the administration’s financial resources; (iii) poor data generation and dissemination. (iv) poor flow of information between the Bank of Ghana, the Ministry of Finance and the Controller and Accountant General’s Department; (v) deficiencies in accounting and auditing practices and standards; (vi) weak regulatory structures insufficient to enforce sanctions against financial malpractice; (vii) obsolete public financial management laws and regulations; (viii) too many government accounts; (ix) lack of awareness, on the part of government employees, of the need to be accountable for their financial responsibilities.
The MOF’s response was an Action Plan which was intended to accomplish the following by the end of 2002: (i) streamline the MoF; (ii) harmonise the Chart of Accounts and classification among the MTEF, BPEMS and CAGD’s; (uuu) implement BPEMS at 57 pilot sites; (iv) embark on MTEF phase 2; (v) complete the Integrated Personnel/Payroll Database (IPPD) 2 project; (iv) develop and implement control systems to minimise payroll fraud; (vii) complete the Heavily-Indepted Poor Countries’ Funds Tracking System. This is a pragmatic way to proceed, under current circumstances, but the signs are not good for effective implementation.
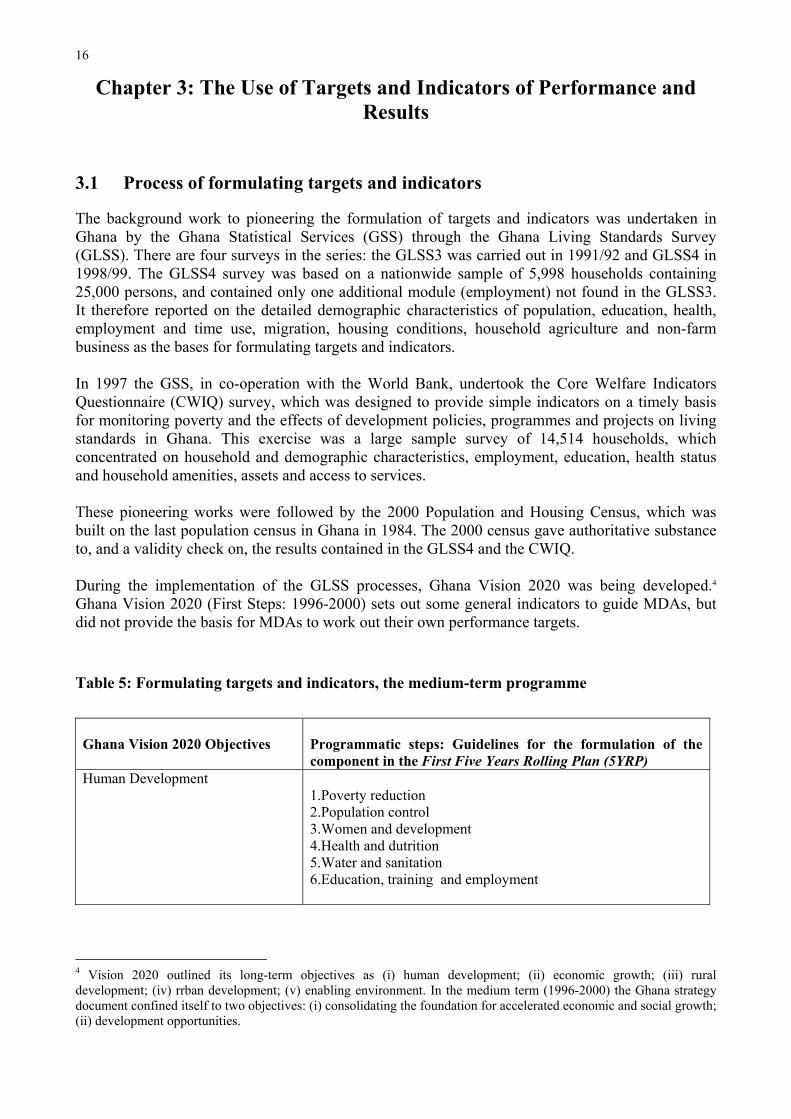
16
Chapter 3: The Use of Targets and Indicators of Performance and Results
3.1 Process of formulating targets and indicators
The background work to pioneering the formulation of targets and indicators was undertaken in Ghana by the Ghana Statistical Services (GSS) through the Ghana Living Standards Survey (GLSS). There are four surveys in the series: the GLSS3 was carried out in 1991/92 and GLSS4 in 1998/99. The GLSS4 survey was based on a nationwide sample of 5,998 households containing 25,000 persons, and contained only one additional module (employment) not found in the GLSS3. It therefore reported on the detailed demographic characteristics of population, education, health, employment and time use, migration, housing conditions, household agriculture and non-farm business as the bases for formulating targets and indicators.
In 1997 the GSS, in co-operation with the World Bank, undertook the Core Welfare Indicators Questionnaire (CWIQ) survey, which was designed to provide simple indicators on a timely basis for monitoring poverty and the effects of development policies, programmes and projects on living standards in Ghana. This exercise was a large sample survey of 14,514 households, which concentrated on household and demographic characteristics, employment, education, health status and household amenities, assets and access to services.
These pioneering works were followed by the 2000 Population and Housing Census, which was built on the last population census in Ghana in 1984. The 2000 census gave authoritative substance to, and a validity check on, the results contained in the GLSS4 and the CWIQ.
During the implementation of the GLSS processes, Ghana Vision 2020 was being developed.4
Ghana Vision 2020 (First Steps: 1996-2000) sets out some general indicators to guide MDAs, but did not provide the basis for MDAs to work out their own performance targets.
Table 5: Formulating targets and indicators, the medium-term programme
Ghana Vision 2020 Objectives Programmatic steps: Guidelines for the formulation of the component in the First Five Years Rolling Plan (5YRP)
Human Development 1.Poverty reduction 2.Population control 3.Women and development 4.Health and dutrition5.Water and sanitation 6.Education, training and employment
4 Vision 2020 outlined its long-term objectives as (i) human development; (ii) economic growth; (iii) rural development; (iv) rrban development; (v) enabling environment. In the medium term (1996-2000) the Ghana strategy document confined itself to two objectives: (i) consolidating the foundation for accelerated economic and social growth; (ii) development opportunities.
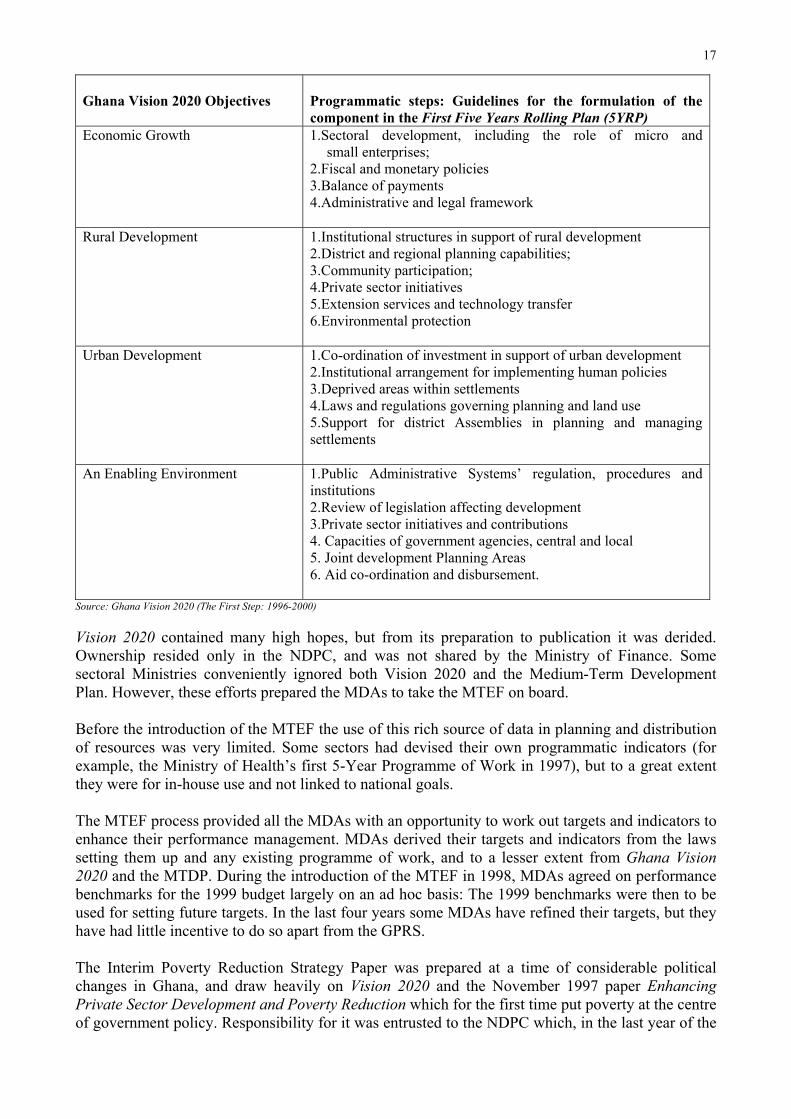
17
Ghana Vision 2020 Objectives Programmatic steps: Guidelines for the formulation of the component in the First Five Years Rolling Plan (5YRP)
Economic Growth 1.Sectoral development, including the role of micro and small enterprises;
2.Fiscal and monetary policies 3.Balance of payments 4.Administrative and legal framework
Rural Development 1.Institutional structures in support of rural development 2.District and regional planning capabilities; 3.Community participation; 4.Private sector initiatives 5.Extension services and technology transfer 6.Environmental protection
Urban Development 1.Co-ordination of investment in support of urban development 2.Institutional arrangement for implementing human policies 3.Deprived areas within settlements 4.Laws and regulations governing planning and land use 5.Support for district Assemblies in planning and managing settlements
An Enabling Environment 1.Public Administrative Systems’ regulation, procedures and institutions2.Review of legislation affecting development 3.Private sector initiatives and contributions 4. Capacities of government agencies, central and local 5. Joint development Planning Areas 6. Aid co-ordination and disbursement.
Source: Ghana Vision 2020 (The First Step: 1996-2000)
Vision 2020 contained many high hopes, but from its preparation to publication it was derided. Ownership resided only in the NDPC, and was not shared by the Ministry of Finance. Some sectoral Ministries conveniently ignored both Vision 2020 and the Medium-Term Development Plan. However, these efforts prepared the MDAs to take the MTEF on board.
Before the introduction of the MTEF the use of this rich source of data in planning and distribution of resources was very limited. Some sectors had devised their own programmatic indicators (for example, the Ministry of Health’s first 5-Year Programme of Work in 1997), but to a great extent they were for in-house use and not linked to national goals.
The MTEF process provided all the MDAs with an opportunity to work out targets and indicators to enhance their performance management. MDAs derived their targets and indicators from the laws setting them up and any existing programme of work, and to a lesser extent from Ghana Vision 2020 and the MTDP. During the introduction of the MTEF in 1998, MDAs agreed on performance benchmarks for the 1999 budget largely on an ad hoc basis: The 1999 benchmarks were then to be used for setting future targets. In the last four years some MDAs have refined their targets, but they have had little incentive to do so apart from the GPRS.
The Interim Poverty Reduction Strategy Paper was prepared at a time of considerable political changes in Ghana, and draw heavily on Vision 2020 and the November 1997 paper EnhancingPrivate Sector Development and Poverty Reduction which for the first time put poverty at the centre of government policy. Responsibility for it was entrusted to the NDPC which, in the last year of the
18
previous government, was incorporated into the new Ministry of Economic Planning and Regional Co-operation (MEPRC).
3.2 The use of public service indicators and targets alongside budget allocations
The MTEF process required the national budget to report on performance. As already noted, all MDAs in Ghana have a mission statement and a list of , objectives, outputs and activities but not all have work programmes (for example the Ministry of the Interior). These strategic plans support the input costs of the service estimated in the budget. Most senior officials are fully aware of the importance of performance and how it could impact on their core activities, thanks to the MTEF and the CSPIP. It is the standard requirement for all MDAs to include their Service activities in Item 3 of their budget (See Table 3).
GRPS
The implementation of the the GPRS from 2003 onwards has made most existing service indicators obsolete, and they will have to be reviewed. Annex 4 compares GPRS targets with those in the MTEF in seven MDAs
The MTEF and GPRS are expected to merge. The main goal of the GPRS is ‘to ensure sustainable equitable growth, accelerated poverty reduction and the protection of the vulnerable and excluded within a decentralised, democratic environment’. The strategy goes beyond the confines of poverty reduction strategies to cover all aspects of Ghana’s economic and social development, including. economic growth, public sector management and financial sector problems.5
The architects of the GPRS expect that ‘implementation of the programme’s objectives and projects will in many cases be at a sectoral level’. However, there are nine cross-sectoral issues for which ministerial leadership has been assigned:
Incorporating these GPRS objectives into the MDAs’ MTEF budgets is problematic. MDAs are supposed to be incorporating them into their 2003 and subsequent budgets, but in practice seem unlikely to do so. In the past MDAs have failed to agree joint action to tackle cross-sectoral issues; they are not willing to take instructions from other MDAs apart from the MoF, or to co-operate with them.
Table 6: Cross-Cutting issues in the GPRS and Ministries
Cross-Cutting Issues Lead Ministry or Agency 1 Macroeconomic stability Ministry of Finance 2 Transformation of the rural economy Ministry of Food and Agriculture 3 Production for export Ministry of Private Sector Development 4 Youth employment Ministry for Manpower, Development
and Employment 5 Gender-equity Ministry of Women and Children
Affairs6 HIV/AIDs Ministry of Health
5 The GPRS’s main objectives are: ensuring economic stability for accelerated growth; Increasing production and promoting sustainable livelihoods; facilitating direct support for equitable human resource development; providing special programmes in support of the vulnerable and excluded; ensuring gender equity; ensuring good governance and the increased capacity of the public sector; the active involvement of the private sector as the main engine of growth and partner in nation building.
19
7 Slum abatements Ministry of Local Government and Rural Affairs
8 Public sector development Office of the President 9 Environment Ministry of Environment and Science
Source: GPRS
3.3 The cascading-down of indicators and their use by front-line service managers
There are two levels in public expenditure management from which indicators could be cascaded downwards; (i) from the Cabinet/CMA level to all MDAs, where the Cabinet or CMA set overall key areas of policy with verifiable indicators from which MDAs could derive their service indicators; (ii) within a particular MDA from the head office to all departments and agencies under it.
Cabinet level to all MDAs: The MTEF defined objectives, outputs and activities and allowed the MDAs to devise their strategic plans without much central direction, as we have seen above. GPRS targets and indicators are being cascaded from the Cabinet/CMA level down.
Within a particular MDA: At the MDA level the budget is guided by the strategic plan of each ministry. Through the Budget Committees (BCs) which were set up as part of the MTEF implementation MDAs are expected to agree their budgets: including Outputs and Activities and Input costs.
The Mission Statement and objectives remain the same for the MDA as a whole but the outputs, activities and inputs vary from one level of the hierarchy to another. The process of cascading service indicators does not work well because in most cases the budgets are kept far away from the operational units. There is no effective link between the operational managers as service providers and the budget holders who tend to be at the head office and regional levels. In the Ghana Police for example operational managers at the district level have virtually no financial discretion. Individual station managers do not have operational budgets, and sometimes have to feed prisoners from their own personal resources when their relatives fail to do so.
Underfunding and misallocation of budgets with respect to operational targets was one of the problems identified during the MTEF implementation. It led to the recommendation to form the Budget Committees. The need to support the work of the BCs has been emphasised several times in several places, and was repeated again in the 2003 Budget Preparation Guidelines.
20
Chapter 4: Factors in the Success or Failure of Results-Based Expenditure Management
4.1 Verification of results and performance assessment.
There is little evidence of institutionalised independent verification of performance results. Performance monitoring by the Central Management Agencies (CMAs) is also weak or almost non-existent. It is difficult to tell whether the poor M&E arrangements have come about because of the past and current preoccupations of the MoF with expenditure control and cash releases, or because of the lack of an accountability framework in the MDAs. Irrespective of the sources of the confusion in the system, what has occurred is that the interface arrangements between the central and the sectoral ministries regarding M&E are unclear.
M&E is weak in Ghana because oversight responsibilities are often not exercised impartially. M&E capacity development is a long-term proposition; it is not something achieved by a short-term technical assistance project. It will require a sustained ongoing commitment by the Government and whichever donors are able to actively support this endeavour.
NDPC & MEPRC
The 1992 Constitution mandated the NDPC (now the MEPRC) to monitor development programmes. But this role has been questioned by other MDAs, and is often criticised by officials of other ministries as adding little value to policy or planning deliberations, and as having uncertain leadership and direction. With the implementation of the GPRS the status of the NPDC has been enhanced, but its role remains challenged by other government departments.
The MEPRC as a small organisation, cannot at present undertake the full-scale verification of performance results of all MDAs. Nevertheless, the GPRS process has promoted it to a leadership role in performance monitoring.
The UK Department for International Development is supporting the MEPRC/NPDC to develop its GPRS monitoring capacity. At the same time, the Office of the President is proposing to set up an M&E unit of 12 staff with 2 members dedicated to monitoring the GPRS. The MEPRC/NDPC itself is wavering between developing its own in-house capability and outsourcing it to a combination of consultants and the Ghana Statistical Services. Though the GSS has handled the GLSS, the CWIQ and the Ghana Population Census professionally, it would be a mistake to involve it in direct monitoring and evaluation of public sector performance as opposed to indirect monitoring through its independent surveys.
The position of the MEPRC/NDPC as the focal point of performance monitoring will continue to be undermined by institutional and administrative problems, including the institutional rift between budgeting and planning functions in PEM, the MDAs’ adverse perception of the NDPC, and the government’s appointment of a political figure from a minority party as minister, thus limiting its political authority.
GPRS monitoring by the MEPRC/NPDC, though a useful element in a results-based system of public expenditure management, will not on its own enshrine results-based budgeting, or even ensure MDA commitment to delivering GPRS designated results. At the moment, MDAs regard the
21
GPRS as a means of accessing additional budgetary funds. The 2003 Budget Guidelines, unfortunately, have reinforced this attitude.
Ministry of Finance
The Minister of Finance announced his 2002 Budget Statement that ‘a more effective control and monitoring of public expenditures’6 would be adopted. However, little more occurs in practice than traditional expenditure monitoring. Staff resources are expended on the processing of ‘funds release letters’ for the MDAs. There is no explicit policy on how to pursue performance management, so what is undertaken is carried out on an ad hoc basis by various officials without much co-ordination, support or feedback. The long-standing commitment of the Ministry to cope with current changes is far from being achieved.
Periodic project inspections are carried out through the Ministry’s Project Implementation Monitoring Unit. These tend to be executed on an ad hoc basis as commissioned and resourced by the Minister from time to time when the need arises. The staff resources of the unit do not allow it to undertake fullsscale monitoring and evaluation. There are overlaps between the work being done by this unit and the NPDC Poverty Unit.
The culture of performance management is weak. A great deal of effort has already gone into setting objectives and defining operational targets for all MDAs, but there is no corresponding emphasis laid on reporting, monitoring, developing management information systems, benchmarking, performance analyses and reviews. The staff charged with these professional responsibilities receive little recognition, training support or professional independence.
MDAs
Of the seven MDAs examined, the Education, Health and Roads and Transport sectors are developing a performance management culture, but it is still embryonic and has not resulted in appreciable changes in service quality to date. Good practice is to be found in isolated pockets and is not yet widely disseminated.
The development of M&E capacities is a key vehicle to help MDAs to acquire the ability to measure and report on development effectiveness within the results-based management framework. Before the GPRS, the government had recognised the existing weaknesses in monitoring and evaluation within the PEM system. The main problem is the failure of the PPMEDs to function properly. The work of the PPMED is to verify and support the achievement of the MDA’s mission and objectives. The determination of sectoral and intra-sectoral priorities and subsequent allocations depends on the quality of the data provided and verified. However, there is no clear evidence that M&E findings have a significant influence on allocations of budget resources.
MDAs also have statistical units, within the structure of the ministries as recommended by PARDIC, to collect data on the activities of the particular MDA. The performance of these statistical units varies from ministry to ministry. The health statistical unit, CHIM, the Educational Management Information System (EMIS) and the Crime Statistics Unit of the Police Service are able to compile service data, but not much routine or systematic use is being made of them by management. The lack of demand for service data on the part of management affects the operations of these units to continue to improve the services they deliver.
Support for M&E from the ministers and heads of departments and agencies is low because the central agencies’ demand for M&E evidence is neither regular nor comprehensive. There is an
6 Ministry of Finance (2002) Budget Statement, page 21
22
urgent need for a powerful central ministry to become an M&E champion, which could encourage the rest of the public service to take this responsibility seriously. It should identify good-practice approaches and disseminate them widely and convincingly to the sectoral ministries. The only ministry powerful enough to do this is the Ministry of Finance working in co-operation with the CAGD and the Audit Service and the OHCS. The MERPC/NPDC role in this is important but should be a supporting one, because of the current institutional set-up in Ghana.
SEC
The model of performance measurement used by the State Enterprises Commission (SEC) demonstrates that the government is capable of developing a Monitoring and Evaluation framework. The SEC oversees the performance of State-owned enterprises by: (i) setting clear objectives for each enterprise, together with a set of agreed performance indicators; (ii) vetting their corporate plans; (iii) linking performance agreements at each organisational and individual level (with performance bonuses for staff if targets are achieved); (iv) requiring quarterly reports by each enterprise on its performance, following clear reporting guidelines; (v) making annual assessments of the performance enterprise.
The SEC model illustrates the government’s ability to set up a sophisticated performance management system. The government plans to apply a broadly similar type of system to subvented (executive) agencies, as part of the public sector reform programme. While the model exists, it is clear that the institutional environment has not allowed the system to work as well as it could have done. Reported past management incompetence at the Ghana National Petroleum Corporation (GNPC), the Tema Oil Refinery (TOR), Ghana Airways and several other SOEs attests to the inability within the system to face up to strong challenges from top management malpractice.
Audit Service
A promising development in the implementation of M&E is the reform of the Ghana Audit Service. Under the PUFMARP arrangements the European Union is supporting the government in its attempt to update its skills in financial and performance auditing. A core group of 10 people have been trained in performance audit and several more are scheduled for training. The aim is for multi-disciplinary audit teams to undertake performance monitoring of both financial and physical outturns.
The GPRS states that ‘At present neither MDA documentation nor the public financial management system provides effective tracking of expenditure and the proper accounting of programmes and projects at any level’. This unsatisfactory situation cannot be rectified at a stroke.
Internal audit
As a management tool, internal audit has not as yet been developed in Ghana. The need for it is stressed in a recent internal review, where recommendations for a major overhaul, if properly implemented by government, would enhance expenditure and performance management capacity in MDAs. Internal audit would also strengthen their information base for continuous performance monitoring and review. Progress requires that MDA Chief Directors be charged with the responsibility of implementing the recommendations and ensuring that there is demand for internal audit of the service delivery performance of programme managers.
Effective use of information
Ghana’s PEM system has not been sufficiently developed for there to be a systematic adoption of benchmarking. However, there are comparative performance tables in the health sector, and in
23
education there are school performance tables. To make this practice more widespread it will be necessary to foster a demand for the information, for example, from the parents of school pupils
The roles of donors and aid instruments
Donors have been frustrated that the government has failed to live up to its pledges to promote growth, reduce poverty and undertake policy reforms. A recurrent problem between donors and the government has been the latter’s inability to fulfil its ‘matching funds’ obligations. MDAs could not access donor funds, and thus could not fulfil their programmes. The MoF’s inadequate forecasting ability has caused the government’s resource flows to be unpredictable.
In the last seven years donors have started to provide assistance to education, health and transport in the form of Sector Investment Programmes (SIPs) and Sector-wide Approaches (SWAps).
At present, issues of the implementation of reforms (governance, financial, sectoral), the HIPC initiative and the GPRS dominate the relationship at the central level. DFID is providing five years of support for the implementation of the MTEF. One aim is to align the objectives and outputs specified in national plans, primarily the Ghana Poverty Reduction Strategy, the Medium-Term Development Plan (MTDP) and the World Bank’s Comprehensive Development Framework (CDF); another is to put in place an expenditure monitoring and reporting system by the CAGD and to restructure and transforming the MoF and the CAGD. The World Bank which has been reworking a financial management reform assistance package since 2000, is planning a new PUFMARP package.
Though the government is committed to poverty reduction and to implementing a social agenda, there is a notion prevailing in the MDAs that development partners are imposing the current policy focus. In spite of several joint workshops by the MEPRC/NDPC and the MoF to brief them about the GPRS, some key senior staff in MDAs still feel insufficiently briefed to embrace the spirit of the exercise. Knowledge of Ghana’s commitment vis-à-vis the international community to a poverty reduction agenda is not widespread.
Performance culture
A lot of effort has gone into combating the institutional rivalry between the NDPC and the MoF and getting the two institutions to work together (for example through training workshops for MoF and NPDC personnel, joint workshops for MDAs, etc.), but to little avail. The rivalry seems to have survived the change of government. The current tangled responsibility for expenditure-related target setting and performance monitoring and management at the centre seems therefore likely to persist. The World Bank’s Public Expenditure Management Handbook suggests that the failure to link policy-making, planning and budgeting may be the single most important factor contributing to poor budgeting outcomes.
The key to effective performance management is timeliness. The ability to prepare timely and relevant management information depends on finance officers meeting reporting deadlines. Evidence from the operation of MDAs indicates that financial regulations and deadlines are not taken seriously, and in most departments critical financial returns are not prepared. The Bill reforming financial regulations is not yet enacted and government inability to pay its contractors on time affects the general attitude of citizens towards obligations and debt.
Performance culture is based, among other things, on the ability of staff and supervisors to carry out their work and provide feedback to each other to achieve agreed outputs. We found that in a lot of MDAs staff supervision was lax, as managerial staff members talk endlessly of their inability to
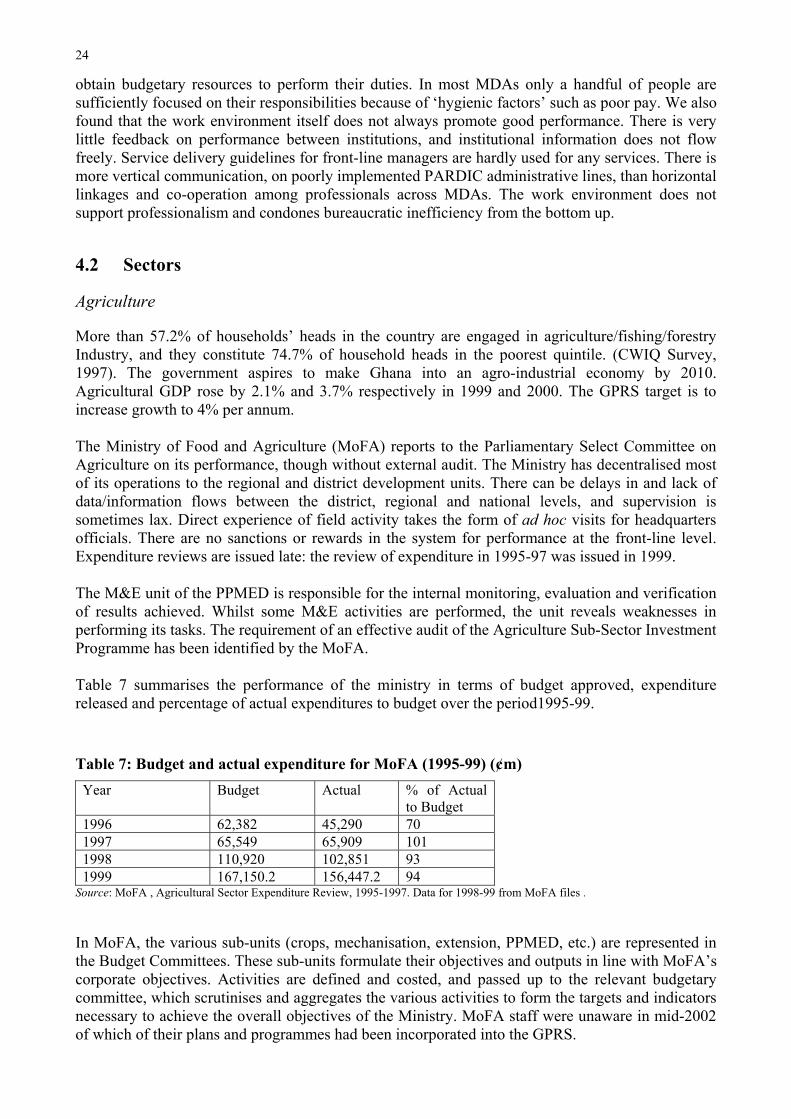
24
obtain budgetary resources to perform their duties. In most MDAs only a handful of people are sufficiently focused on their responsibilities because of ‘hygienic factors’ such as poor pay. We also found that the work environment itself does not always promote good performance. There is very little feedback on performance between institutions, and institutional information does not flow freely. Service delivery guidelines for front-line managers are hardly used for any services. There is more vertical communication, on poorly implemented PARDIC administrative lines, than horizontal linkages and co-operation among professionals across MDAs. The work environment does not support professionalism and condones bureaucratic inefficiency from the bottom up.
4.2 Sectors
Agriculture
More than 57.2% of households’ heads in the country are engaged in agriculture/fishing/forestry Industry, and they constitute 74.7% of household heads in the poorest quintile. (CWIQ Survey, 1997). The government aspires to make Ghana into an agro-industrial economy by 2010. Agricultural GDP rose by 2.1% and 3.7% respectively in 1999 and 2000. The GPRS target is to increase growth to 4% per annum.
The Ministry of Food and Agriculture (MoFA) reports to the Parliamentary Select Committee on Agriculture on its performance, though without external audit. The Ministry has decentralised most of its operations to the regional and district development units. There can be delays in and lack of data/information flows between the district, regional and national levels, and supervision is sometimes lax. Direct experience of field activity takes the form of ad hoc visits for headquarters officials. There are no sanctions or rewards in the system for performance at the front-line level. Expenditure reviews are issued late: the review of expenditure in 1995-97 was issued in 1999.
The M&E unit of the PPMED is responsible for the internal monitoring, evaluation and verification of results achieved. Whilst some M&E activities are performed, the unit reveals weaknesses in performing its tasks. The requirement of an effective audit of the Agriculture Sub-Sector Investment Programme has been identified by the MoFA.
Table 7 summarises the performance of the ministry in terms of budget approved, expenditure released and percentage of actual expenditures to budget over the period1995-99.
Table 7: Budget and actual expenditure for MoFA (1995-99) (¢m) Year Budget Actual % of Actual
to Budget 1996 62,382 45,290 70 1997 65,549 65,909 101 1998 110,920 102,851 93 1999 167,150.2 156,447.2 94
Source: MoFA , Agricultural Sector Expenditure Review, 1995-1997. Data for 1998-99 from MoFA files .
In MoFA, the various sub-units (crops, mechanisation, extension, PPMED, etc.) are represented in the Budget Committees. These sub-units formulate their objectives and outputs in line with MoFA’s corporate objectives. Activities are defined and costed, and passed up to the relevant budgetary committee, which scrutinises and aggregates the various activities to form the targets and indicators necessary to achieve the overall objectives of the Ministry. MoFA staff were unaware in mid-2002 of which of their plans and programmes had been incorporated into the GPRS.
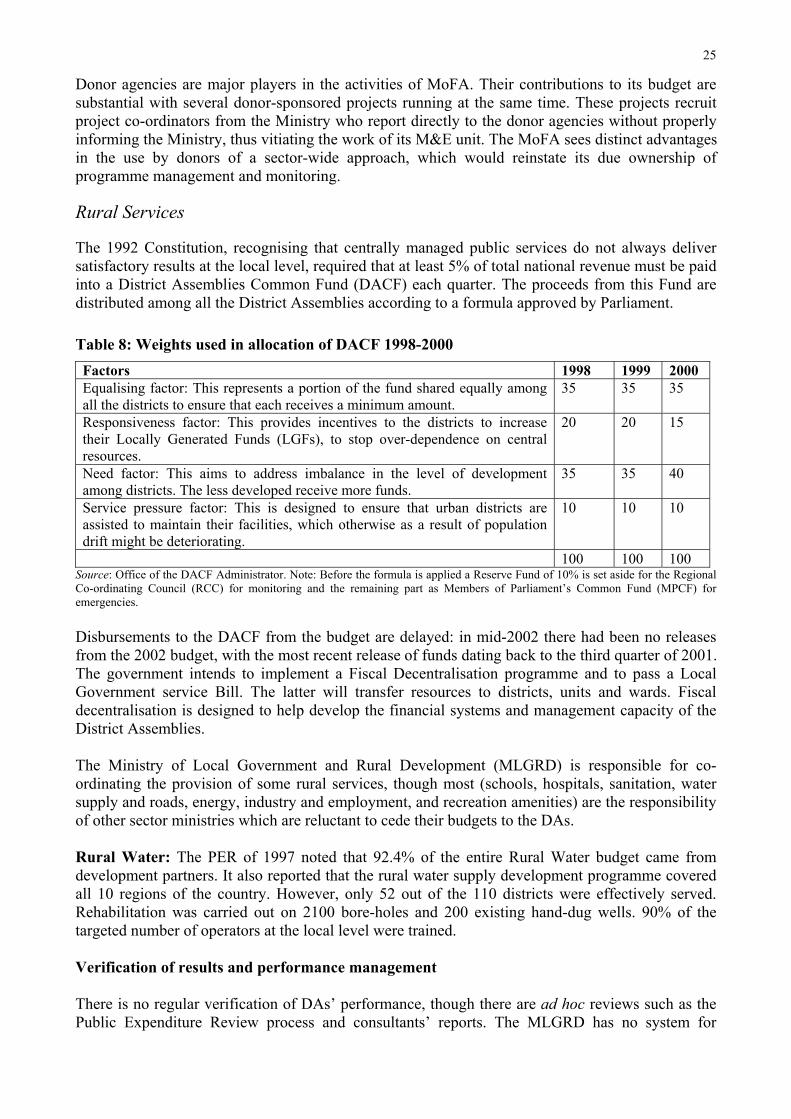
25
Donor agencies are major players in the activities of MoFA. Their contributions to its budget are substantial with several donor-sponsored projects running at the same time. These projects recruit project co-ordinators from the Ministry who report directly to the donor agencies without properly informing the Ministry, thus vitiating the work of its M&E unit. The MoFA sees distinct advantages in the use by donors of a sector-wide approach, which would reinstate its due ownership of programme management and monitoring.
Rural Services
The 1992 Constitution, recognising that centrally managed public services do not always deliver satisfactory results at the local level, required that at least 5% of total national revenue must be paid into a District Assemblies Common Fund (DACF) each quarter. The proceeds from this Fund are distributed among all the District Assemblies according to a formula approved by Parliament.
Table 8: Weights used in allocation of DACF 1998-2000 Factors 1998 1999 2000 Equalising factor: This represents a portion of the fund shared equally among all the districts to ensure that each receives a minimum amount.
35 35 35
Responsiveness factor: This provides incentives to the districts to increase their Locally Generated Funds (LGFs), to stop over-dependence on central resources.
20 20 15
Need factor: This aims to address imbalance in the level of development among districts. The less developed receive more funds.
35 35 40
Service pressure factor: This is designed to ensure that urban districts are assisted to maintain their facilities, which otherwise as a result of population drift might be deteriorating.
10 10 10
100 100 100 Source: Office of the DACF Administrator. Note: Before the formula is applied a Reserve Fund of 10% is set aside for the Regional Co-ordinating Council (RCC) for monitoring and the remaining part as Members of Parliament’s Common Fund (MPCF) for emergencies.
Disbursements to the DACF from the budget are delayed: in mid-2002 there had been no releases from the 2002 budget, with the most recent release of funds dating back to the third quarter of 2001. The government intends to implement a Fiscal Decentralisation programme and to pass a Local Government service Bill. The latter will transfer resources to districts, units and wards. Fiscal decentralisation is designed to help develop the financial systems and management capacity of the District Assemblies.
The Ministry of Local Government and Rural Development (MLGRD) is responsible for co-ordinating the provision of some rural services, though most (schools, hospitals, sanitation, water supply and roads, energy, industry and employment, and recreation amenities) are the responsibility of other sector ministries which are reluctant to cede their budgets to the DAs.
Rural Water: The PER of 1997 noted that 92.4% of the entire Rural Water budget came from development partners. It also reported that the rural water supply development programme covered all 10 regions of the country. However, only 52 out of the 110 districts were effectively served. Rehabilitation was carried out on 2100 bore-holes and 200 existing hand-dug wells. 90% of the targeted number of operators at the local level were trained.
Verification of results and performance management
There is no regular verification of DAs’ performance, though there are ad hoc reviews such as the Public Expenditure Review process and consultants’ reports. The MLGRD has no system for
26
benchmarking and comparing the performance of District Assemblies in delivering rural services. Its Inspectorate Division merely monitors the DA’s budgets, receives financial returns (income and expenditure) from the District Assemblies and summarises them for the Minister of Local Government and undertakes sanitation inspections.
Success of results-based expenditure management.
From the inception of the MTEF budget process in 1998 the MLGRD issued its mission statement and defined its key objectives. Each of the agencies within the MLGRD follows broadly these objectives but sets specific outputs to reflect the mandate of the agency. Although the MLGRD received its due budgetary allocation for planned expenditures on administration, services and investments in 1999, in 2000 it was starved of funds because of the non-release of funds by the MoF and the non-disbursement of promised donor funds.
The role of donors
Donors have been concerned with the design, development and provision of rural infrastructure services, with the building of human capacity at the District Assemblies, and with fiscal decentralisation. The Fiscal Decentralisation project started in 1998 with funding from the Canadian Government. It aimed at developing a comprehensive set of financial systems based on the PUFMARP model for the DAs. It leaves important questions unanswered, however, such as the desirable degree of local autonomy to balance Ghana’s strong centralist administration and political tendencies. The project is now stalled and the DAs continue to receive ad hoc support from development partners at the local level.
Education Sector
The PER of 1997 reported that the government remained the main source of finance for of education, providing 90% of education facilities with the remaining 10% being provided by private sector organisations and religious bodies. District Assemblies increased their contribution by financing some of the development projects of second-cycle institutions in addition to basic education. Larger allocations were made to the regions with higher school enrolment rates. ‘With the national average for school enrolment at 59%, Upper East, Upper West and Northern Regions which had the lowest school enrolment at 28.6%, 29.3% and 39.7% respectively, had the least allocation.’ This demonstrates how resource allocation in practice has flouted national education policy which gives the North a compensating proportion of national resources to bring its performance up to levels achieved by the South. It remains to be seen whether the GPRS will now reassert the primacy of stated policy.
In the last two and a half decades school enrolment rates have stagnated and there has been an exodus of trained teachers, who have been replaced by untrained personnel. In 1987 the government embarked on an educational reform programme to: (i) expand access to primary schools especially in the Northern part of the country where enrolments have been persistently low; (ii) improve quality, efficiency and relevance of education; (iii) reduce the length of pre-university schooling from 17 to 12 years; (iv) make educational financing more efficient and equitable and (v) reinforce planning and administration.
In 1995 the Civil Service Performance Improvement Programme (CSPIP) undertook a survey to obtain at first hand parents’ perceptions of educational services and the impact of the reforms. The majority of respondents rated service quality as average or above average. The main conclusions were: (i) there was widespread awareness and approval of the policies of the Ministry of Education; (ii) but policies did not achieve their intended results, because they were being pursued in a hasty manner without adequate preparation and discussion with beneficiaries, and because of poor
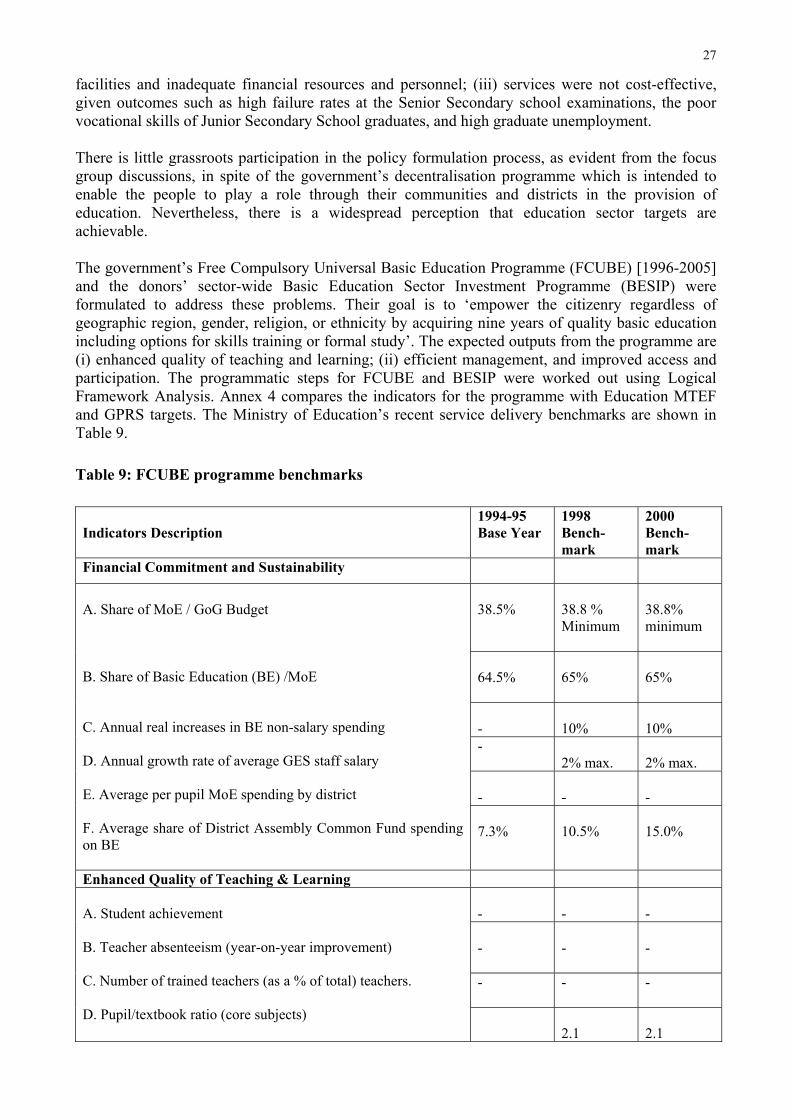
27
facilities and inadequate financial resources and personnel; (iii) services were not cost-effective, given outcomes such as high failure rates at the Senior Secondary school examinations, the poor vocational skills of Junior Secondary School graduates, and high graduate unemployment.
There is little grassroots participation in the policy formulation process, as evident from the focus group discussions, in spite of the government’s decentralisation programme which is intended to enable the people to play a role through their communities and districts in the provision of education. Nevertheless, there is a widespread perception that education sector targets are achievable.
The government’s Free Compulsory Universal Basic Education Programme (FCUBE) [1996-2005] and the donors’ sector-wide Basic Education Sector Investment Programme (BESIP) were formulated to address these problems. Their goal is to ‘empower the citizenry regardless of geographic region, gender, religion, or ethnicity by acquiring nine years of quality basic education including options for skills training or formal study’. The expected outputs from the programme are (i) enhanced quality of teaching and learning; (ii) efficient management, and improved access and participation. The programmatic steps for FCUBE and BESIP were worked out using Logical Framework Analysis. Annex 4 compares the indicators for the programme with Education MTEF and GPRS targets. The Ministry of Education’s recent service delivery benchmarks are shown in Table 9.
Table 9: FCUBE programme benchmarks
Indicators Description 1994-95 Base Year
1998 Bench-mark
2000Bench-mark
Financial Commitment and Sustainability
38.5% 38.8 % Minimum
38.8% minimum
64.5% 65% 65%
- 10% 10% -
2% max. 2% max.
- - -
A. Share of MoE / GoG Budget
B. Share of Basic Education (BE) /MoE
C. Annual real increases in BE non-salary spending
D. Annual growth rate of average GES staff salary
E. Average per pupil MoE spending by district
F. Average share of District Assembly Common Fund spending on BE
7.3% 10.5% 15.0%
Enhanced Quality of Teaching & Learning
- - -
- - -
- - -
A. Student achievement
B. Teacher absenteeism (year-on-year improvement)
C. Number of trained teachers (as a % of total) teachers.
D. Pupil/textbook ratio (core subjects) 2.1 2.1
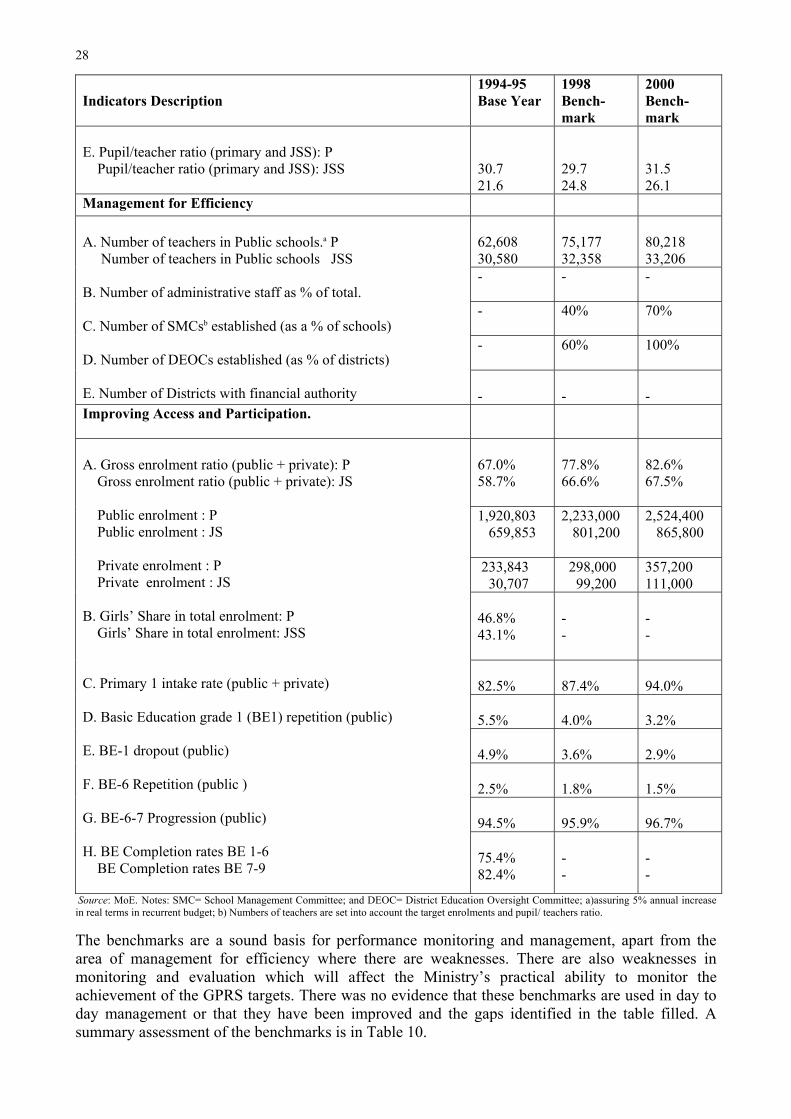
28
Indicators Description 1994-95 Base Year
1998 Bench-mark
2000Bench-mark
E. Pupil/teacher ratio (primary and JSS): P Pupil/teacher ratio (primary and JSS): JSS 30.7
21.629.724.8
31.526.1
Management for Efficiency
62,608 30,580
75,177 32,358
80,218 33,206
- - -
- 40% 70%
- 60% 100%
A. Number of teachers in Public schools.a P Number of teachers in Public schools JSS
B. Number of administrative staff as % of total.
C. Number of SMCsb established (as a % of schools)
D. Number of DEOCs established (as % of districts)
E. Number of Districts with financial authority - - -Improving Access and Participation.
67.0% 58.7%
77.8% 66.6%
82.6% 67.5%
1,920,803 659,853
2,233,000 801,200
2,524,400 865,800
233,843 30,707
298,000 99,200
357,200 111,000
46.8% 43.1%
--
--
82.5% 87.4% 94.0%
5.5% 4.0% 3.2%
4.9% 3.6% 2.9%
2.5% 1.8% 1.5%
94.5% 95.9% 96.7%
A. Gross enrolment ratio (public + private): P Gross enrolment ratio (public + private): JS
Public enrolment : P Public enrolment : JS
Private enrolment : P Private enrolment : JS
B. Girls’ Share in total enrolment: P Girls’ Share in total enrolment: JSS
C. Primary 1 intake rate (public + private)
D. Basic Education grade 1 (BE1) repetition (public)
E. BE-1 dropout (public)
F. BE-6 Repetition (public )
G. BE-6-7 Progression (public)
H. BE Completion rates BE 1-6 BE Completion rates BE 7-9
75.4% 82.4%
--
--
Source: MoE. Notes: SMC= School Management Committee; and DEOC= District Education Oversight Committee; a)assuring 5% annual increase in real terms in recurrent budget; b) Numbers of teachers are set into account the target enrolments and pupil/ teachers ratio.
The benchmarks are a sound basis for performance monitoring and management, apart from the area of management for efficiency where there are weaknesses. There are also weaknesses in monitoring and evaluation which will affect the Ministry’s practical ability to monitor the achievement of the GPRS targets. There was no evidence that these benchmarks are used in day to day management or that they have been improved and the gaps identified in the table filled. A summary assessment of the benchmarks is in Table 10.
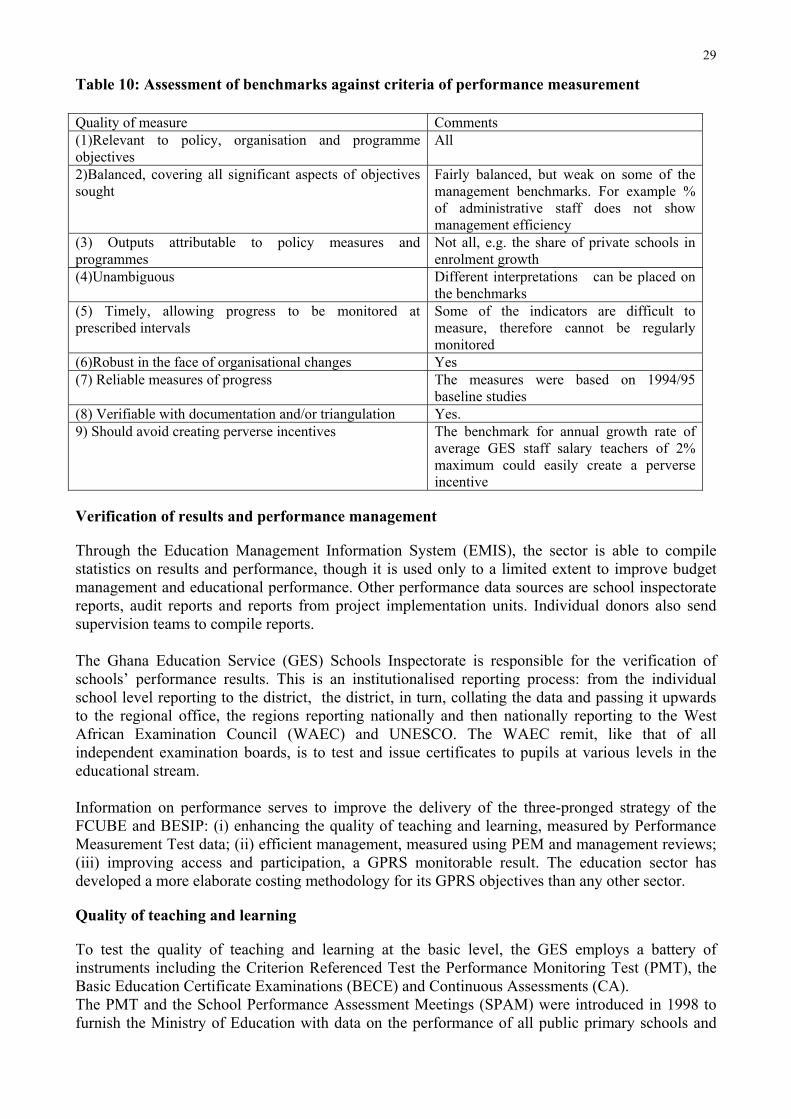
29
Table 10: Assessment of benchmarks against criteria of performance measurement
Quality of measure Comments (1)Relevant to policy, organisation and programme objectives
All
2)Balanced, covering all significant aspects of objectives sought
Fairly balanced, but weak on some of the management benchmarks. For example % of administrative staff does not show management efficiency
(3) Outputs attributable to policy measures and programmes
Not all, e.g. the share of private schools in enrolment growth
(4)Unambiguous Different interpretations can be placed on the benchmarks
(5) Timely, allowing progress to be monitored at prescribed intervals
Some of the indicators are difficult to measure, therefore cannot be regularly monitored
(6)Robust in the face of organisational changes Yes (7) Reliable measures of progress The measures were based on 1994/95
baseline studies (8) Verifiable with documentation and/or triangulation Yes. 9) Should avoid creating perverse incentives The benchmark for annual growth rate of
average GES staff salary teachers of 2% maximum could easily create a perverse incentive
Verification of results and performance management
Through the Education Management Information System (EMIS), the sector is able to compile statistics on results and performance, though it is used only to a limited extent to improve budget management and educational performance. Other performance data sources are school inspectorate reports, audit reports and reports from project implementation units. Individual donors also send supervision teams to compile reports.
The Ghana Education Service (GES) Schools Inspectorate is responsible for the verification of schools’ performance results. This is an institutionalised reporting process: from the individual school level reporting to the district, the district, in turn, collating the data and passing it upwards to the regional office, the regions reporting nationally and then nationally reporting to the West African Examination Council (WAEC) and UNESCO. The WAEC remit, like that of all independent examination boards, is to test and issue certificates to pupils at various levels in the educational stream.
Information on performance serves to improve the delivery of the three-pronged strategy of the FCUBE and BESIP: (i) enhancing the quality of teaching and learning, measured by Performance Measurement Test data; (ii) efficient management, measured using PEM and management reviews; (iii) improving access and participation, a GPRS monitorable result. The education sector has developed a more elaborate costing methodology for its GPRS objectives than any other sector.
Quality of teaching and learning
To test the quality of teaching and learning at the basic level, the GES employs a battery of instruments including the Criterion Referenced Test the Performance Monitoring Test (PMT), the Basic Education Certificate Examinations (BECE) and Continuous Assessments (CA). The PMT and the School Performance Assessment Meetings (SPAM) were introduced in 1998 to furnish the Ministry of Education with data on the performance of all public primary schools and
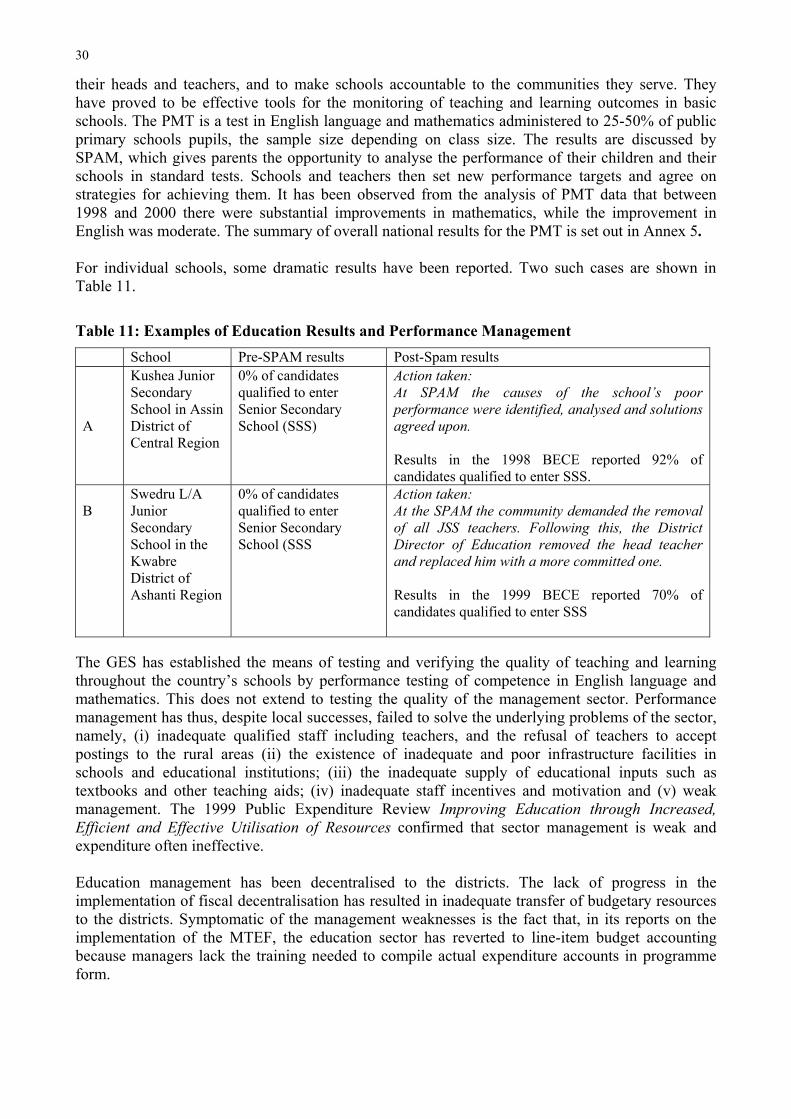
30
their heads and teachers, and to make schools accountable to the communities they serve. They have proved to be effective tools for the monitoring of teaching and learning outcomes in basic schools. The PMT is a test in English language and mathematics administered to 25-50% of public primary schools pupils, the sample size depending on class size. The results are discussed by SPAM, which gives parents the opportunity to analyse the performance of their children and their schools in standard tests. Schools and teachers then set new performance targets and agree on strategies for achieving them. It has been observed from the analysis of PMT data that between 1998 and 2000 there were substantial improvements in mathematics, while the improvement in English was moderate. The summary of overall national results for the PMT is set out in Annex 5.
For individual schools, some dramatic results have been reported. Two such cases are shown in Table 11.
Table 11: Examples of Education Results and Performance Management School Pre-SPAM results Post-Spam results
A
Kushea Junior Secondary School in Assin District of Central Region
0% of candidates qualified to enter Senior Secondary School (SSS)
Action taken: At SPAM the causes of the school’s poor performance were identified, analysed and solutions agreed upon.
Results in the 1998 BECE reported 92% of candidates qualified to enter SSS.
BSwedru L/A JuniorSecondary School in the KwabreDistrict of Ashanti Region
0% of candidates qualified to enter Senior Secondary School (SSS
Action taken: At the SPAM the community demanded the removal of all JSS teachers. Following this, the District Director of Education removed the head teacher and replaced him with a more committed one.
Results in the 1999 BECE reported 70% of candidates qualified to enter SSS
The GES has established the means of testing and verifying the quality of teaching and learning throughout the country’s schools by performance testing of competence in English language and mathematics. This does not extend to testing the quality of the management sector. Performance management has thus, despite local successes, failed to solve the underlying problems of the sector, namely, (i) inadequate qualified staff including teachers, and the refusal of teachers to accept postings to the rural areas (ii) the existence of inadequate and poor infrastructure facilities in schools and educational institutions; (iii) the inadequate supply of educational inputs such as textbooks and other teaching aids; (iv) inadequate staff incentives and motivation and (v) weak management. The 1999 Public Expenditure Review Improving Education through Increased, Efficient and Effective Utilisation of Resources confirmed that sector management is weak and expenditure often ineffective.
Education management has been decentralised to the districts. The lack of progress in the implementation of fiscal decentralisation has resulted in inadequate transfer of budgetary resources to the districts. Symptomatic of the management weaknesses is the fact that, in its reports on the implementation of the MTEF, the education sector has reverted to line-item budget accounting because managers lack the training needed to compile actual expenditure accounts in programme form.
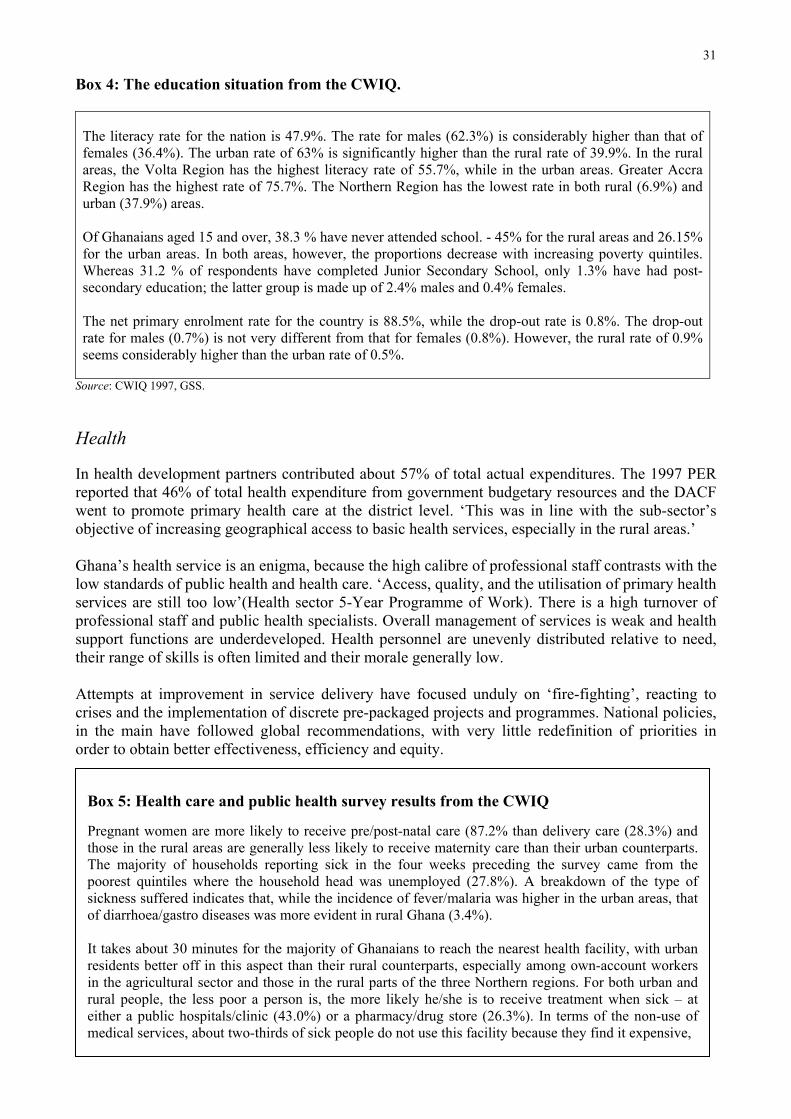
31
Box 4: The education situation from the CWIQ.
The literacy rate for the nation is 47.9%. The rate for males (62.3%) is considerably higher than that of females (36.4%). The urban rate of 63% is significantly higher than the rural rate of 39.9%. In the rural areas, the Volta Region has the highest literacy rate of 55.7%, while in the urban areas. Greater Accra Region has the highest rate of 75.7%. The Northern Region has the lowest rate in both rural (6.9%) and urban (37.9%) areas.
Of Ghanaians aged 15 and over, 38.3 % have never attended school. - 45% for the rural areas and 26.15% for the urban areas. In both areas, however, the proportions decrease with increasing poverty quintiles. Whereas 31.2 % of respondents have completed Junior Secondary School, only 1.3% have had post-secondary education; the latter group is made up of 2.4% males and 0.4% females.
The net primary enrolment rate for the country is 88.5%, while the drop-out rate is 0.8%. The drop-out rate for males (0.7%) is not very different from that for females (0.8%). However, the rural rate of 0.9% seems considerably higher than the urban rate of 0.5%.
Source: CWIQ 1997, GSS.
Health
In health development partners contributed about 57% of total actual expenditures. The 1997 PER reported that 46% of total health expenditure from government budgetary resources and the DACF went to promote primary health care at the district level. ‘This was in line with the sub-sector’s objective of increasing geographical access to basic health services, especially in the rural areas.’
Ghana’s health service is an enigma, because the high calibre of professional staff contrasts with the low standards of public health and health care. ‘Access, quality, and the utilisation of primary health services are still too low’(Health sector 5-Year Programme of Work). There is a high turnover of professional staff and public health specialists. Overall management of services is weak and health support functions are underdeveloped. Health personnel are unevenly distributed relative to need, their range of skills is often limited and their morale generally low.
Attempts at improvement in service delivery have focused unduly on ‘fire-fighting’, reacting to crises and the implementation of discrete pre-packaged projects and programmes. National policies, in the main have followed global recommendations, with very little redefinition of priorities in order to obtain better effectiveness, efficiency and equity.
Box 5: Health care and public health survey results from the CWIQ
Pregnant women are more likely to receive pre/post-natal care (87.2% than delivery care (28.3%) and those in the rural areas are generally less likely to receive maternity care than their urban counterparts. The majority of households reporting sick in the four weeks preceding the survey came from the poorest quintiles where the household head was unemployed (27.8%). A breakdown of the type of sickness suffered indicates that, while the incidence of fever/malaria was higher in the urban areas, that of diarrhoea/gastro diseases was more evident in rural Ghana (3.4%).
It takes about 30 minutes for the majority of Ghanaians to reach the nearest health facility, with urban residents better off in this aspect than their rural counterparts, especially among own-account workers in the agricultural sector and those in the rural parts of the three Northern regions. For both urban and rural people, the less poor a person is, the more likely he/she is to receive treatment when sick – at either a public hospitals/clinic (43.0%) or a pharmacy/drug store (26.3%). In terms of the non-use of medical services, about two-thirds of sick people do not use this facility because they find it expensive,
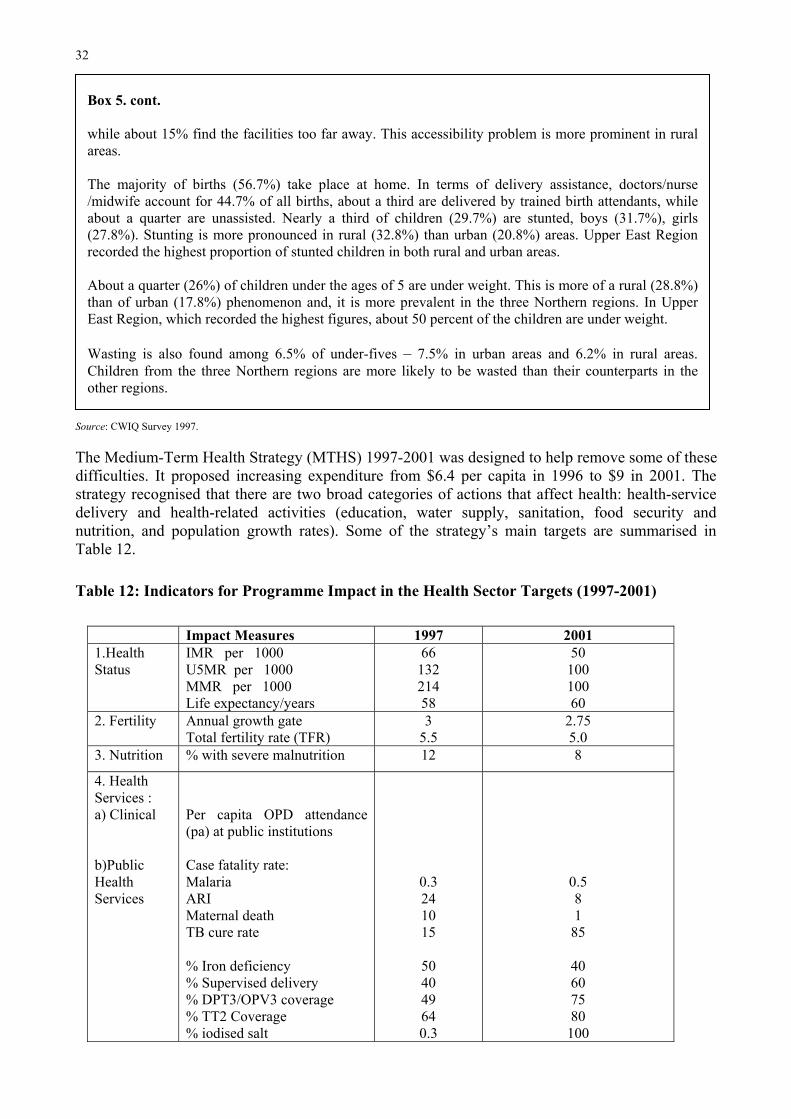
32
Box 5. cont.
while about 15% find the facilities too far away. This accessibility problem is more prominent in rural areas.
The majority of births (56.7%) take place at home. In terms of delivery assistance, doctors/nurse /midwife account for 44.7% of all births, about a third are delivered by trained birth attendants, while about a quarter are unassisted. Nearly a third of children (29.7%) are stunted, boys (31.7%), girls (27.8%). Stunting is more pronounced in rural (32.8%) than urban (20.8%) areas. Upper East Region recorded the highest proportion of stunted children in both rural and urban areas.
About a quarter (26%) of children under the ages of 5 are under weight. This is more of a rural (28.8%) than of urban (17.8%) phenomenon and, it is more prevalent in the three Northern regions. In Upper East Region, which recorded the highest figures, about 50 percent of the children are under weight.
Wasting is also found among 6.5% of under-fives – 7.5% in urban areas and 6.2% in rural areas. Children from the three Northern regions are more likely to be wasted than their counterparts in the other regions.
Source: CWIQ Survey 1997.
The Medium-Term Health Strategy (MTHS) 1997-2001 was designed to help remove some of these difficulties. It proposed increasing expenditure from $6.4 per capita in 1996 to $9 in 2001. The strategy recognised that there are two broad categories of actions that affect health: health-service delivery and health-related activities (education, water supply, sanitation, food security and nutrition, and population growth rates). Some of the strategy’s main targets are summarised in Table 12.
Table 12: Indicators for Programme Impact in the Health Sector Targets (1997-2001)
Impact Measures 1997 2001 1.HealthStatus
IMR per 1000 U5MR per 1000 MMR per 1000 Life expectancy/years
6613221458
5010010060
2. Fertility Annual growth gate Total fertility rate (TFR)
35.5
2.755.0
3. Nutrition % with severe malnutrition 12 8
4. Health Services : a) Clinical
b)PublicHealthServices
Per capita OPD attendance (pa) at public institutions
Case fatality rate: Malaria ARIMaternal death TB cure rate
% Iron deficiency % Supervised delivery % DPT3/OPV3 coverage % TT2 Coverage % iodised salt
0.3241015
504049640.3
0.581
85
40607580
100
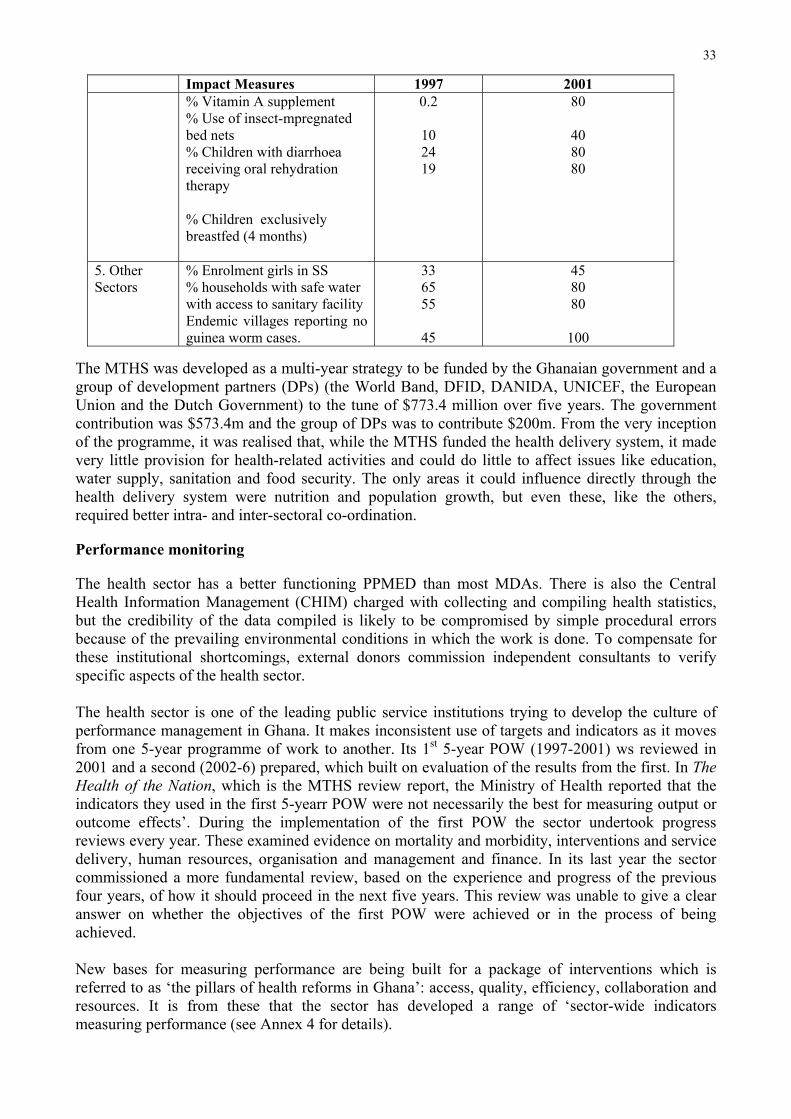
33
Impact Measures 1997 2001 % Vitamin A supplement % Use of insect-mpregnated bed nets % Children with diarrhoea receiving oral rehydration therapy
% Children exclusively breastfed (4 months)
0.2
102419
80
408080
5. Other Sectors
% Enrolment girls in SS % households with safe water with access to sanitary facility Endemic villages reporting no guinea worm cases.
336555
45
458080
100
The MTHS was developed as a multi-year strategy to be funded by the Ghanaian government and a group of development partners (DPs) (the World Band, DFID, DANIDA, UNICEF, the European Union and the Dutch Government) to the tune of $773.4 million over five years. The government contribution was $573.4m and the group of DPs was to contribute $200m. From the very inception of the programme, it was realised that, while the MTHS funded the health delivery system, it made very little provision for health-related activities and could do little to affect issues like education, water supply, sanitation and food security. The only areas it could influence directly through the health delivery system were nutrition and population growth, but even these, like the others, required better intra- and inter-sectoral co-ordination.
Performance monitoring
The health sector has a better functioning PPMED than most MDAs. There is also the Central Health Information Management (CHIM) charged with collecting and compiling health statistics, but the credibility of the data compiled is likely to be compromised by simple procedural errors because of the prevailing environmental conditions in which the work is done. To compensate for these institutional shortcomings, external donors commission independent consultants to verify specific aspects of the health sector.
The health sector is one of the leading public service institutions trying to develop the culture of performance management in Ghana. It makes inconsistent use of targets and indicators as it moves from one 5-year programme of work to another. Its 1st 5-year POW (1997-2001) ws reviewed in 2001 and a second (2002-6) prepared, which built on evaluation of the results from the first. In The Health of the Nation, which is the MTHS review report, the Ministry of Health reported that the indicators they used in the first 5-yearr POW were not necessarily the best for measuring output or outcome effects’. During the implementation of the first POW the sector undertook progress reviews every year. These examined evidence on mortality and morbidity, interventions and service delivery, human resources, organisation and management and finance. In its last year the sector commissioned a more fundamental review, based on the experience and progress of the previous four years, of how it should proceed in the next five years. This review was unable to give a clear answer on whether the objectives of the first POW were achieved or in the process of being achieved.
New bases for measuring performance are being built for a package of interventions which is referred to as ‘the pillars of health reforms in Ghana’: access, quality, efficiency, collaboration and resources. It is from these that the sector has developed a range of ‘sector-wide indicators measuring performance (see Annex 4 for details).
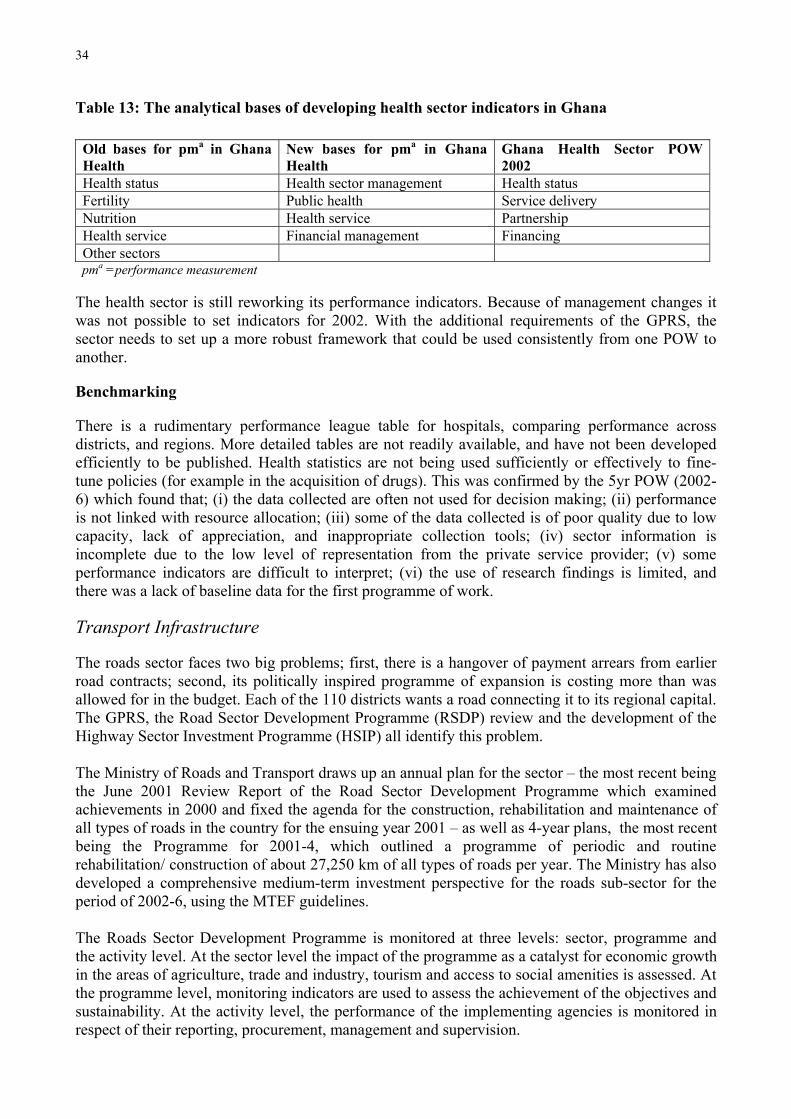
34
Table 13: The analytical bases of developing health sector indicators in Ghana
Old bases for pma in Ghana Health
New bases for pma in Ghana Health
Ghana Health Sector POW 2002
Health status Health sector management Health status Fertility Public health Service delivery Nutrition Health service Partnership Health service Financial management Financing Other sectors
pma =performance measurement
The health sector is still reworking its performance indicators. Because of management changes it was not possible to set indicators for 2002. With the additional requirements of the GPRS, the sector needs to set up a more robust framework that could be used consistently from one POW to another.
Benchmarking
There is a rudimentary performance league table for hospitals, comparing performance across districts, and regions. More detailed tables are not readily available, and have not been developed efficiently to be published. Health statistics are not being used sufficiently or effectively to fine-tune policies (for example in the acquisition of drugs). This was confirmed by the 5yr POW (2002-6) which found that; (i) the data collected are often not used for decision making; (ii) performance is not linked with resource allocation; (iii) some of the data collected is of poor quality due to low capacity, lack of appreciation, and inappropriate collection tools; (iv) sector information is incomplete due to the low level of representation from the private service provider; (v) some performance indicators are difficult to interpret; (vi) the use of research findings is limited, and there was a lack of baseline data for the first programme of work.
Transport Infrastructure
The roads sector faces two big problems; first, there is a hangover of payment arrears from earlier road contracts; second, its politically inspired programme of expansion is costing more than was allowed for in the budget. Each of the 110 districts wants a road connecting it to its regional capital. The GPRS, the Road Sector Development Programme (RSDP) review and the development of the Highway Sector Investment Programme (HSIP) all identify this problem.
The Ministry of Roads and Transport draws up an annual plan for the sector – the most recent being the June 2001 Review Report of the Road Sector Development Programme which examined achievements in 2000 and fixed the agenda for the construction, rehabilitation and maintenance of all types of roads in the country for the ensuing year 2001 – as well as 4-year plans, the most recent being the Programme for 2001-4, which outlined a programme of periodic and routine rehabilitation/ construction of about 27,250 km of all types of roads per year. The Ministry has also developed a comprehensive medium-term investment perspective for the roads sub-sector for the period of 2002-6, using the MTEF guidelines.
The Roads Sector Development Programme is monitored at three levels: sector, programme and the activity level. At the sector level the impact of the programme as a catalyst for economic growth in the areas of agriculture, trade and industry, tourism and access to social amenities is assessed. At the programme level, monitoring indicators are used to assess the achievement of the objectives and sustainability. At the activity level, the performance of the implementing agencies is monitored in respect of their reporting, procurement, management and supervision.
35
To carry out these elaborate monitoring and evaluation arrangements the transport sector commissions impact studies and uses accident statistics from the National Road Safety Committee (NRSC) and the police. It also calls on data provided by agencies such as the Building and Road Research Institute (BRRI) and the Ghana Living Standard Survey reports. Also the government, in partnership with donors appoints external auditors to undertake annual financial and technical audits on the road sector activities, the technical aspects being sub-contracted to engineering firms. The Ministry is planning to extend the audits to procurement arrangements in future.
The first in-house review of road sector performance was undertaken in 1995, prior to that there had been no formalised arrangements to evaluate the performance of the sector. Implementation of the first five-year rolling RSDP began in 1996. The exercise identified weaknesses in the Ministry’s ability to monitor its programmes, as also for the implementing agencies.The roads sector continues to improve its performance management, though independently of the budgeting system. The state of the roads does not yet reveal any tangible improvement.
The role of donors in is important. About 11 donor agencies are working in the roads sector alone. Under the Highway Sector Investment Programme, which immediately preceded the RSDP, the participating donors each agreed to support a portion of the programme. In transport donors choose their favoured projects.
The roads sector has now developed a sector-wide approach to funding its programmes. In the roads sector SWAp all the donors subscribe to one common basket to which about $1.2 billion has been pledged.
Public safety
The current government’s commitment to address matters of public safety is shown in the re-equipment of the police and the institution of fast track procedures in the law courts to speed up trials. Discussions with management in the public safety sector indicated that these services possess the calibre of staff equal to those found anywhere in the world. What is required is training and development and re-equipment.
For this study the Ministry of Justice and the Ministry of the Interior (the Ministry itself and its agencies the Ghana Prison Service and the Ghana Police) were covered. Each of these institutions has a PPMED to monitor and evaluate its programmes of work. However, in each case the PPMED is weak and inadequate, consisting of only one member of staff, who is the director of the department. The Ministry of Justice also has one man team for its PPMED.
Management efforts to deliver results are also constrained by the malfunction of their financial management and budgeting systems. The police, for example, compile statistics on crime figures, but not attention is paid to them in budget allocations. The Prison Service also keeps data on the criminal background of inmates, the incidence of young offenders and juveniles, causes of death in prison, type of training being offered to inmates and other service statistics. Similar statistics are also available in the court system, but there is no direct evidence linking the use of the data collected to the pursuit of performance improvement.
36
Chapter 5: Generic Implications of Ghana’s Experience with ROPEMS
Ghana’s PEM system is in transition, moving towards results orientation. It is not yet performance-oriented because the many efforts to reform it have failed to overcome procedural inertia and a persistent, though not unmitigated, culture of non-performance and non-accountability in the public service. The most comprehensive reform effort to date was PUFMARP, through which the MTEF was introduced in 1999. But the MTEF/PUFMARP faced the same problems of irresolute leadership, weak incentives and incomplete implementation as previous reform efforts. It is of crucial importance that these problems do not similarly cripple the current phase of reform articulated around the GPRS and the new MTEF.
To this end, this chapter makes concluding observations on: (i) how best to design result-oriented PEM systems in the Ghanaian context; and (ii) what generic lessons and implications the experience of Ghana may hold for other countries.
5.1 Some results-oriented budget priorities for Ghana
The results-oriented PEM practice in the sectors covered here could be made more effective if the following issues are addressed:
(i) how best to tailor the results-based framework to institutional capacity
Chapter 2 examined the institutional framework of Ghana’s PEM system. Based on our observations the following recommendations are put forward:
1. Parliament
Build-up R & D capacity to support the Select Committees on sectoral performance Conclude the annual budget before the start of the next financial year Enforce sanctions by law
2. The Cabinet
Build-up R& D on the macro framework and sectoral trade–offs Put in place an accountability framework between Ministers and Chief Directors Encourage institutional linkages by linking the work of the Cabinet Committees to the institutions affected.
3. The Ministry of Finance:
Internal re-organisation required Better analytical examination of sector budgets and their implications Release of funds should not take so much staff effort; some job-enrichment required M&E capacity to be developed and its centrality noted
4. The Controller and Accountant General More job-enrichment for staff by allocating them away from where they are not required (Internal Audit, for example)
37
ii.The interface arrangements between the CAGD, the MoF, the OHCS and the MDAs should be clarifiedEffort should be made to train more qualified accountants, and reserve the title of accountants only for those professionally qualified. Qualified professional accountants to be responsible for all finance in Ministries, reporting to the Chief Director as part of a management team. MDA’s Chief Directors to appoint accountants from the available pool through interviews and open competition.
5. The MEPRC/NPDC Leadership issue of NPDC to be resolved by either merging it formally with MEPRC, or appointing a substantive head GPRS implementation challenges to be addressed Interface arrangements with MoF to be clarified
6. MDAs A better accountability framework to be in place. Chief Directors’ performance contracts were introduced but the system was poorly implemented, resulting in dilution of the concept Re-examine the PARDIC structure to enable MDAs to recruit professional accountants to head their finances and take responsibility for financial reporting A better appreciation of the role of service managers in budget preparation, allowing them to take total responsibility for the resources placed at their disposal Service delivery guidelines to be introduced for all implementing units and front-line managers in all sectors Better appreciation of the role of financial professionals in the sector. Service delivery is the responsibility of service managers and accountants are there to help them achieve their objectives and report on their finances without hindranceBetter M&E arrangements Aim to collect consistent information on all entities in the organisation Motivation is not about salaries and wages, but about getting feedback on work done and the environmental conditions at the workplace Every effort to be made to help staff internalise performance culture
7. The Bank of Ghana Provide better interface arrangements to assist government to monitor all its accounts and reconcile them
8. The Tender Boards Political influence in them to be reduced or removed entirely Procurement Bill to be promoted by government
9. External Audit Continue with reform efforts and develop (a) systems auditing capacity, (b) computer audits capacity, and (c) performance auditing.
10. The Office of the Head of Civil Service Organise more Chief Directors fora to keep them informed about developments and their significance ii.Re-examine the effect of implementation of the PARDIC recommendations on PEM system
11. The Revenue Agencies Modernise the tax administration regime in the IRS
38
CEPS excise and tariff policies to be examined carefully to remove contradictions. Depending on import duties for revenue mobilisation might work against other policy requirements (higher input costs, for example)
(ii) How best to marry central ministries’ desire for standardisation in approaches to target setting and performance measurement with sectoral and local authorities need for sui generis indicators
In designing the PEM systemthere are two alternatives: to design a core system for the CMAs and allow sectoral MDAs to develop their own autonomous systems. Interface arrangements to be ensured by the ‘protocol’ specified by the CMA.alternatively design a unified information system for the entire PEM system. To allow for local autonomy and ownership, a two-tier data coding system could be designed. Data captured once from the local level, but the CMA would aggregate data on a standardised basis for all sectors. At the same time, the sectors would be able to generate their own individual sector targets and indicators.
(iii) How best to strengthen the credibility and sense of ownership of results-based systems
Government expenditure must be seen to be carried out within the framework of the budget. Extra-budgetary spending should be encouraged Delays in release of funds should be avoided Poor remuneration and motivation of staff are characteristic of Ghana‘s MDAs There should be more transparency through regular reports Free information flow and reliability of data for prompt service delivery should be the goal
(iv) How best to promote independent monitoring, performance audit and evaluation
Resourcing the M&E unit of the PPMED Followed by a clearly defined process of targeting core activities within the sector for monitoring and evaluation There appears to be a lack of consistent reviews of what targets were set and what results were achieved in the sector Review of performance focuses mostly on budgetary inadequacies. Inefficiencies in the set-up may be subsumed under lack of funds for operations. There should be a clearer system to help delineate pure inefficiencies within the institutional set-up from lack of adequate funds. Here, the M&E Unit should devise effective methods of monitoring and evaluating activities within the ministry, as well as heads of units strengthening their effective control of units under them.
(v) How best to integrate public service provision targets and indicators with Poverty Reduction Strategy monitoring indicators
GPRS implementation within the sectors is in the early stages. It appears, however, that the MDAs do not know the full extent to which their programmes have been incorporated into the GRSP. This could have a definite impact on any targets/results they might have set for themselves. It is important that implementing departments take the lead, within the GRSP guidelines, to own their programmes and be accountable for those results.
39
(vi) What aid instruments best encourage the adoption of durable, credible and effective results-based frameworks
In terms of achievement of results, sector programmes in the MDAs appear to have created their own ‘culture’. The pace of the development of dialogue between the government and its partners differs between sectors. This has worked against the development of the PEM system. Integrating programmes for all staff to participate would help create ownership.
(vii) How best – at what level of aggregation – should developing countries present their public service performance targets and results to donors in the context of joint performance monitoring
Output levels, not activity levels.
Goals and targets set at the sector level can be achieved efficiently and effectively if:
funds are released on time and monitoring and evaluation efforts are adequate to ensure that the goals set are being achieved; the sub-units are responsive, client-sensitive and customer-focused in their poverty reduction programmes; there are both short- and long-term instruments that target poverty within the sub-units’ purview.
5.2 International lessons
(i) How best to marry central ministries’ desire for standardisation in approaches to target setting and performance measurement with sectoral and local authorities’ need for ‘sui generis’ indicators
Cabinet to approve and cascade down key performance areas to ministries with goals and allow lower units to identify the specific roles they can play Design information systems for budget (MTEF) and financial management to allow for two levels of aggregation. Key indicators and service indicators should be agreed upon.
(ii) How best to strengthen the credibility and sense of ownership of results-based systems
Institute an accountability framework, whereby the budget would define: (i) the purchaser; and (ii) the provider of services. This is to be supported by a formal performance contract. MDAs to define clearly their goals and objectives. Align them to the key performance area set by the Cabinet and get these approved formally. Sub-units within the sector to take the lead in formulating programmes that they can own and effectively implement. To be credible the purchaser must know the exact resources at his disposal and when those resources would be available. Ensuring predictable resource flow for operations in ministries should be the personal responsibility of sector Ministers. Getting results should be the personal responsibility of the equivalent of a Chief Director, who is administratively and managerially in charge of the resources in the Ministry.
40
Additional considerations:
Service delivery guidelines Self-appraisal instruments Beneficiary surveys Structures of their Ministries Motivation is not about pay Internalisation of performance culture Complete information on all entities in the sector
(iii) How best to promote independent monitoring, performance audit and evaluation
Strong central research on key performance areas linked to the performance monitoring work of external monitors and auditors In-house M&E capacity must be developed to complement the work of external monitors, who must assess the in-house monitoring capacity as part of certifying the performance of MDAs A sufficiently resourced Internal Audit to be in place Continuous development of M&E capacity in the MDAs
(iv) How best to integrate public service provision targets and indicators with Poverty Reduction Strategy monitoring indicators
Indicate the key poverty reduction areas from a central perspective MDAs/sectors to align their objectives with the key poverty areas Sub-units within the sector to take the lead in formulating poverty programmes within the PRSP that they can own and effectively implement Ensure that sub-unit programmes are linked to the broad sector objectives Ensure that sub-unit programmes are fully-costed
(v) What aid instruments best encourage the adoption of durable, credible and effective results-based frameworks
General/broad-based support for sector programmes to achieve specific outputs that can be monitoredTechnical assistance support to be specific and initiated at the behest of the recipient country
(vi) How best – at what level of aggregation – should developing countries present their public service performance targets and results to donors in the context of joint performance monitoring
Outcomes and output level. Joint monitoring aiming to ensure that funds are used for the purpose they were voted for and that they have been used efficiently and effectively, in the sense of ascertaining if planned outputs have been produced and the department is achieving its objectives
41
Bibliography
Abban, I.K. (1998) The Judiciary and Democratic Governance in Ghana
Armah, B K (1999) Reflections on the State of the Economy of Ghana in 1999, IEA Legislative Alert, Dec 1
Bartholomew, A (2001) The Medium Term Expenditure Framework. A case Study of Ghana, IEA Legislative Alert, October
Booth, D. and Lucas, H. (2002) Good Practice in the Development of PRSP Indicators and Monitoring Systems,ODI Working Paper 171
Boyne et al. (2002) Money and Management, July-September
Centre for Management and development Studies (1995) Report on Beneficiary Views on Services Rendered by the Ministry of Local Government and Rural Development and the Operations of the District Assemblies,Accra, December
CEPA (2000) Ghana: Macroeconomic Review and Outlook.
CEPA (2000) Ghana: Mid-Year Macroeconomic Review, January-June.
CSPIP (2001) ‘Poverty Reduction: CSPIP’s Contribution’, CSPIP News , Vol. 1 , 11 June
CSPIP (2001) CSPIP Phase One Ends, CSPIP News. August
CSWD (1997) Proposed Programme of Action for Poverty Reduction in the Rural Water and Sanitation Sub-sector, October 10
DFID (2002) ‘Support to the Ministry of Finance’, Ghana Project Memorandum, February
Djangmah, J.S. (1999) ‘Return Schools to Local Communities: Agenda for Decentralisation: Part I’, Legislative Alert, May
Donovan. D. and Kashiwagi, S, Madavo, C. and Nankani, G. (2002) A Study to inform the World Development Report 2000/1 on Poverty and Development, February.
Foster, M and Zormelo, D. (2001) ‘How, when and why does poverty get budget priority? Ghana case Study’, ODI Working Paper, Mick Foster and Douglas Zormelo, CAPE/ODI, July
Foster, M. and Mackintosh-Walker, S. (2001) ‘Sector Wide Programmes and Poverty Reduction’, Mick Foster and Sadie Mackintosh-Walker, ODI Working Paper
Ghartey, A. (2000) ‘Draft Country Financial Assessment For Ghana’, July
Government of Ghana (1970) The Loans Act, Act 335
Government of Ghana (1979) Financial Administration Regulation, 1979, L.I 1234
Government of Ghana (1979) The Financial Administration Decree, 1979, Memorandum
Government of Ghana (1992) The Constitution of The Republic of Ghana
Government of Ghana (1995) ‘Civil Service Performance Improvement Programme Beneficiary Survey of the Ministry of Education’, August
Government of Ghana (1995) ‘Ghana Vision 2020 (The First Steps: 1996-2000); Presidential Report to Parliament on Co-ordinated Programme of Economic and Social Development Policies’, 6 January
Government of Ghana (1997) ‘Report of the Presidential Commission into the Ghana Police Service:Executive Summary’
Government of Ghana (1997) Enhancing Private Sector Development and Poverty Reduction, Paris Nov 4-5.
Government of Ghana (2000) ‘Comprehensive Financial Management Reform Programme 2000-2007’, draft copy Volume 1, Short-term Action Plan
42
Government of Ghana (2000) ‘The Medium Term Expenditure Framework (MTEF) for 2000-2002 and the Annual Estimates for 2000 Expenditure to be met out of Moneys Granted and Drawn from the Consolidated Fund, Central Government Budget; Volume 10: Ministry of Education’
Government of Ghana (2001) ‘Ghana Public Expenditure Review 2000, Managing Local Government Resources to facilitate Poverty Reduction and Good Governance’, November
Government of Ghana (2001) ‘National Economic Dialogue – Action Plan’, May
Government of Ghana (2002) ‘Ghana Poverty Reduction Strategy 2002-2004, An Agenda for Growth and Prosperity, Analysis and Policy Statement’, February 4
Holmes, M. (2000) Ghana Issues in MTEF, World Bank, Washington D.C.
IDA and IFC (2000) ‘Memorandum of the President of the IDA and the IFC to the Executive Directors on a Country Assistance Strategy of the World Bank Group for the Republic of Ghana’, June 29
IMF (2001) The IMF’s Poverty Reduction and Growth Facility, A Fact Sheet, Washington D.C., March
IMF (2002) ‘IMF Concluded Actions to Strengthen the Tracking of Poverty – Reducing Public Spending in Heavily Indebted Poor Countries (HIPCs)’, March 25
IMF (2002) Debt Relief under the Heavily-indebted Poor Countries Initiative, A Factsheet March, Washington D.C.
IMF (2002) Escaping the Under-Reform Trap, IMF staff papers, May, Washington D.C.
IMF and IDA (2002) ‘The IMF and IDA Actions to Strengthen the Tracking of Poverty-Reducing Public Spending in Heavily Indebted Poor Countries (HIPCs)’, March 22, 2002
IMF/World Bank (2002) ‘Ghana to Receive $3.7 Billion in Debt Service Relief: The IMF and World Bank 10.Support Debt Relief for Ghana Under the Enhanced HIPC Initiative’, February 27, 2002
Institute of Statistical and Economic Research (no date) ‘The State of the Ghanaian Economy 2000’, University of Ghana
Joint Government of Ghana and Development Partners (2002) ‘Multi-donor Budgetary support Mission Joint Government of Ghana and Development Partners Status Report’, June 20
Killick, T. and Abudgre, C. (2001) Poverty-reducing Institutional Change and PRSP processes: The Ghana Case, July
Konotey-Ahulu, F. (2002) ‘Black people’s red faces and AIDS prevention’, in The Lancet, Vol. 355. Issue 9214:1559
Kwaku Sowa, N. (no date) ‘Adjustment in Africa: Lessons from Ghana’
Le Houerou, P. and Taliercio, R. (2002) A Preliminary Review of the MTEF Experience in Africa, World Bank, Washington D.C.
Levin, C. (1998), Ghana‘s Agricultural Sector and Prospects for the Future, Occasional Papers No. 15, Institute of Economic Affairs, Accra, Ghana.
Macfarlane, S., Racelis, M and Muli-Musiime, F. (2002) ‘Public Health in less-developed countries’, in The Lancet, Vol. 356, Issue 9232: 841
Mills, A., Zwi, A.B., (eds.) (1995) ‘Health Policies in Developing Countries’, Special issue of the Journal of International Development, ‘Vol 7, No3, Wiley, Chichester.
Ministry of Defence (2000) ‘Strategic plan and the Medium Term Expenditure Framework, 2000-2002’
Ministry of Defence (2001) ‘MTEF Policy Review Report 2001-2003’
Ministry of Education (1998) ‘BESIP/FCUBE Programme Logical Framework 1996-2005’, April
Ministry of Education (2002) ‘Policy Review Report 2002-2004’
Ministry of Finance (1994) ‘Republic of Ghana Public Expenditure Review 1993’, Accra 8th April
Ministry of Finance (1995) ‘Republic of Ghana Public Expenditure Review 1994, Effective Planning and the Execution of the Development Budget’, Paris, 13-14 June
43
Ministry of Finance (1996) ‘Republic of Ghana Public Expenditure Review 1995, Implementation of Previous recommendation and the Way Forward’, Accra, July 1
Ministry of Finance (1997) ‘Republic of Ghana Public Expenditure Review 1996, The Delivery of economic Infrastructure’, July 21
Ministry of Finance (1998) ‘Republic of Ghana Public Expenditure Review 1997, Managing Social Sector Expenditure for Human capital Development’, August
Ministry of Finance (1999) ‘Medium Term Expenditure Framework. – Draft Handbook’, August
Ministry of Finance (200) ‘The Medium Term Expenditure Framework (MTEF) for 2000-2002, Judicial Service Annual Estimates’
Ministry of Finance (2000) ‘MTEF Annual Estimates for Education 2000-2002’
Ministry of Finance (2000) ‘Republic of Ghana Public Expenditure Review 1999,Improving Education Through Increased, Efficient and Effective Utilization of Resources’, August
Ministry of Finance (2000) Ghana I-PRSP 2000-2002, June.
Ministry of Finance (2001) ‘Mid-Year review of the Budget Statement and Economic Policy of the Government of Ghana for the 2001 Financial Year’, presented to Parliament on 8th November 2001, by the Minister of Finance
Ministry of Finance (2001) ‘MTEF Annual Estimates for Education 2001-2003’
Ministry of Finance (2001) ‘The Budget Statement and Economic Policy of the Government of Ghana for the Year 2001 Financial Year’, 9th March
Ministry of Finance (2002) ‘Comprehensive Financial Reform Programs 2002-2007’, Draft Copy. Vol. 1. Short Term Action Plan
Ministry of Finance (2002) ‘Development Strategy for Poverty Reduction’, March 1
Ministry of Finance (2002) ‘MTEF Annual Estimates for Education 2002-2004’
Ministry of Finance (2002) ‘Status of PUFMARP Implementation, Financial Status, Work Plan and Procurement Plan for 2002’, February
Ministry of Finance (2002) ‘The Budget Statement and Economic Policy of the Government of Ghana for the Year 2002 Financial Year’, 21st February
Ministry of Finance (2002) The Medium Term Expenditure Framework for 2002-2004 for the Ministry. of Roads and Transport’, volume 8, January
Ministry of Finance (no date) ‘Procurement Reform Proposals’
Ministry of Health (1996) ‘Health Sector 5 Year Programme of Work’
Ministry of Health (1996) ‘Institutional Reform in the Health Sector’
Ministry of Health (1996) ‘Management Arrangements for Implementation of the Medium Term Programme of Work 1997-2001’
Ministry of Health (1997) ‘Report on Regional Accountants’ Meeting’ , City Hotel, Kumasi.
Ministry of Health (2001) ‘Bulletin of Health Information’, July-September
Ministry of Health (2002) ‘Common Management Arrangements (CMA II), for the Implementation of the second Health sector five year programme of work 2002-2006, a Component of SWAP II’
Ministry of Health (2002) ‘Ghana Health Sector Programme of Work 2002’, February
Ministry of Health (2002) Five Year Programme of Work, 2002-2006, Partnership for Health, Bridging the inequalities Gap
Ministry of Health (no date) ‘Health Sector Proposal for Poverty alleviation’
Ministry of Health (no date) ‘Policy Framework for the Establishment of Health Insurance in Ghana’
Ministry of Health (no date) ‘Self Appraisal Instrument of Ministry of Health’
44
Ministry of Interior (2001) ‘Linking MDA objectives to Shareholders Expectation & Interests, 2001-2003’
Ministry of Interior (no date) ‘Financial and Operating Structure’
Ministry of Local Government and Rural Development (2002) ‘MTEF for 2002-2004 and the Annual Estimates for 2002’. Vol.15. Draft Copy
Ministry of Roads and Transport (2001) ‘Road Sector Development Programme 2001 Review Report’, June
MLGRD (2002) ‘Decentralisation in Ghana. Implementation Status and Proposed Future Directions’. March.
MOFA (1995) ‘Development of a New Agricultural Sector Strategy for Ghana: A Report on Consultations with Stakeholders in Agriculture’. September
MOFA (1999) ‘A Programme Preparation Document on Agricultural Sub-Sector Investment Programme’, main report
MOFA (1999) ‘Accelerated Agricultural Growth and Development Strategy (AAGDS) in Support of Ghana Vision 2020’, Final Draft, August
MOFA (1999) ‘Agricultural Sector Expenditure Review, 1995-1997’, final draft report, April
MOFA (no date) ‘Draft Strategy for National Agricultural Development Horizon 2010 Ghana’
MOFA (no date) ‘Ghana: Agricultural Services Sub-sector Investment Program’ Annex 2 Program Description
Nsaful, N. (no date) ‘Enhancing the Public Sector legal and regulatory Environment for Accelerated Development and Good Governance’
OECD (1997) In Search of Results: Performance Management Practices Paris: OECD
Orivel, F. (2002) Strategies for Financing the Education Sector, Final Report. Ghana education Sector Development programme, Trust Fund 25634 PHRD, April
Premchard, A. and Talat, J. (1986) Ghana: A survey of budgetary and Expenditure Control Systems in Government, Nov 25, 1986, IMF Fiscal Affairs Department
The International Fund for Agricultural Development (1997) Ghana Root and Tuber Improvement Programme. Appraisal Report. Volume 1 - Main Report. Document of The International Fund for Agricultural Development. Project Management Department, Africa Division 1. September 30
World Bank (1992) World Bank Mission Aide Memoir on Education
World Bank (1995) Ghana Poverty Past, Present and Future, Population and Human Resource Division, Africa Region, WB Report 14504-GH, June
World Bank (1999) ‘Ghana Consultations with the Poor, Prepared for Global Synthesis Workshop’. September 22-23, Poverty Group, PREM World Bank
World Bank (2000) Ghana Medium Term Agricultural Development Strategy: An Agenda for Sustained Growth and Development 1991-2000, World Bank. Report No. 8914-GH
World Bank (2001) ‘Staff Appraisal Report (SAR) for the Road Sector Development Programme’, World Bank, July
World Bank (2002) MTEF Project Memorandum. Support to the Ministry of Finance, Ghana (Draft) Version 3, February 2002
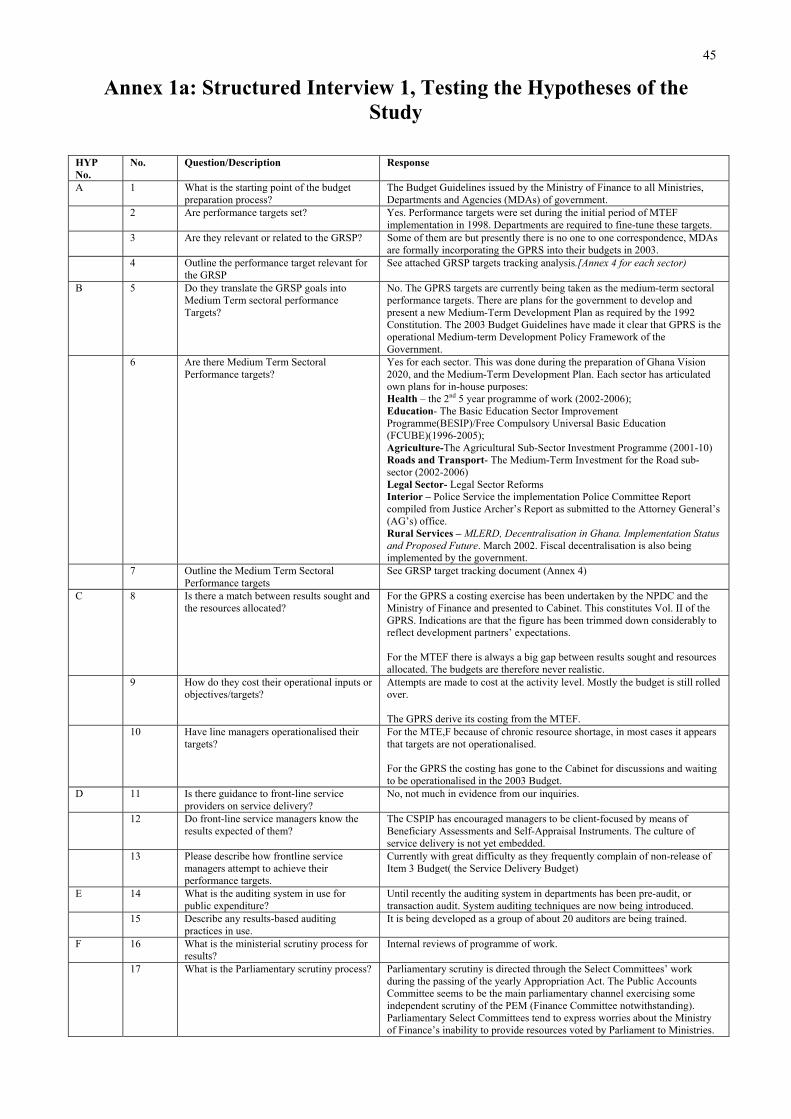
45
Annex 1a: Structured Interview 1, Testing the Hypotheses of the Study
HYP No.
No. Question/Description Response
A 1 What is the starting point of the budget preparation process?
The Budget Guidelines issued by the Ministry of Finance to all Ministries, Departments and Agencies (MDAs) of government.
2 Are performance targets set? Yes. Performance targets were set during the initial period of MTEF implementation in 1998. Departments are required to fine-tune these targets.
3 Are they relevant or related to the GRSP? Some of them are but presently there is no one to one correspondence, MDAs are formally incorporating the GPRS into their budgets in 2003.
4 Outline the performance target relevant for the GRSP
See attached GRSP targets tracking analysis.[Annex 4 for each sector)
B 5 Do they translate the GRSP goals into Medium Term sectoral performance Targets?
No. The GPRS targets are currently being taken as the medium-term sectoral performance targets. There are plans for the government to develop and present a new Medium-Term Development Plan as required by the 1992 Constitution. The 2003 Budget Guidelines have made it clear that GPRS is the operational Medium-term Development Policy Framework of the Government.
6 Are there Medium Term Sectoral Performance targets?
Yes for each sector. This was done during the preparation of Ghana Vision 2020, and the Medium-Term Development Plan. Each sector has articulated own plans for in-house purposes: Health – the 2nd 5 year programme of work (2002-2006); Education- The Basic Education Sector Improvement Programme(BESIP)/Free Compulsory Universal Basic Education (FCUBE)(1996-2005); Agriculture-The Agricultural Sub-Sector Investment Programme (2001-10)Roads and Transport- The Medium-Term Investment for the Road sub-sector (2002-2006) Legal Sector- Legal Sector ReformsInterior – Police Service the implementation Police Committee Report compiled from Justice Archer’s Report as submitted to the Attorney General’s (AG’s) office.Rural Services – MLERD, Decentralisation in Ghana. Implementation Status and Proposed Future. March 2002. Fiscal decentralisation is also being implemented by the government.
7 Outline the Medium Term Sectoral Performance targets
See GRSP target tracking document (Annex 4)
C 8 Is there a match between results sought and the resources allocated?
For the GPRS a costing exercise has been undertaken by the NPDC and the Ministry of Finance and presented to Cabinet. This constitutes Vol. II of the GPRS. Indications are that the figure has been trimmed down considerably to reflect development partners’ expectations.
For the MTEF there is always a big gap between results sought and resources allocated. The budgets are therefore never realistic.
9 How do they cost their operational inputs or objectives/targets?
Attempts are made to cost at the activity level. Mostly the budget is still rolled over.
The GPRS derive its costing from the MTEF. 10 Have line managers operationalised their
targets? For the MTE,F because of chronic resource shortage, in most cases it appears that targets are not operationalised.
For the GPRS the costing has gone to the Cabinet for discussions and waiting to be operationalised in the 2003 Budget.
D 11 Is there guidance to front-line service providers on service delivery?
No, not much in evidence from our inquiries.
12 Do front-line service managers know the results expected of them?
The CSPIP has encouraged managers to be client-focused by means of Beneficiary Assessments and Self-Appraisal Instruments. The culture of service delivery is not yet embedded.
13 Please describe how frontline service managers attempt to achieve their performance targets.
Currently with great difficulty as they frequently complain of non-release of Item 3 Budget( the Service Delivery Budget)
E 14 What is the auditing system in use for public expenditure?
Until recently the auditing system in departments has been pre-audit, or transaction audit. System auditing techniques are now being introduced.
15 Describe any results-based auditing practices in use.
It is being developed as a group of about 20 auditors are being trained.
F 16 What is the ministerial scrutiny process for results?
Internal reviews of programme of work.
17 What is the Parliamentary scrutiny process? Parliamentary scrutiny is directed through the Select Committees’ work during the passing of the yearly Appropriation Act. The Public Accounts Committee seems to be the main parliamentary channel exercising some independent scrutiny of the PEM (Finance Committee notwithstanding). Parliamentary Select Committees tend to express worries about the Ministry of Finance’s inability to provide resources voted by Parliament to Ministries.

46
HYP No.
No. Question/Description Response
18 Does the political process examine the causes of performance below expectations?
Frequent complaints of inadequate resources during the year appear to undermine any political examination of non-performance.
In the Ministries performance monitoring and feedback by Ministers is very weak.
19 How do they hold those who do not perform to account?
Not much is done. Performance monitoring culture is not generally prevalent.
20 Is there a systematic way for doing this throughout the organisation?
In theory it should be done through the PPMEDs, but these departments are very weak.
G 21 How far have they gone with the implementation of the PRSP? [possible options:i. do not know what is being done; ii. just started; iii. gone far]
Targets have been agreed with the National Development Planning Commission (NDPC), and have been costed and presented to the Cabinet. Not much is happening in the implementation of the GPRS in the sectors (at least not in 2002). For 2003 the government expects all MDAs to start implementing the GPRS.
22 How far have they gone with monitoring the output (directly or indirectly) of the PRSP? [possible options: i. do not know what is being done; ii. just started,iii. gone far]
Monitoring arrangements have been made with the Ghana Statistical Services. There is a small monitoring unit in the MEPRC/NDPC but their work is still in its infancy.
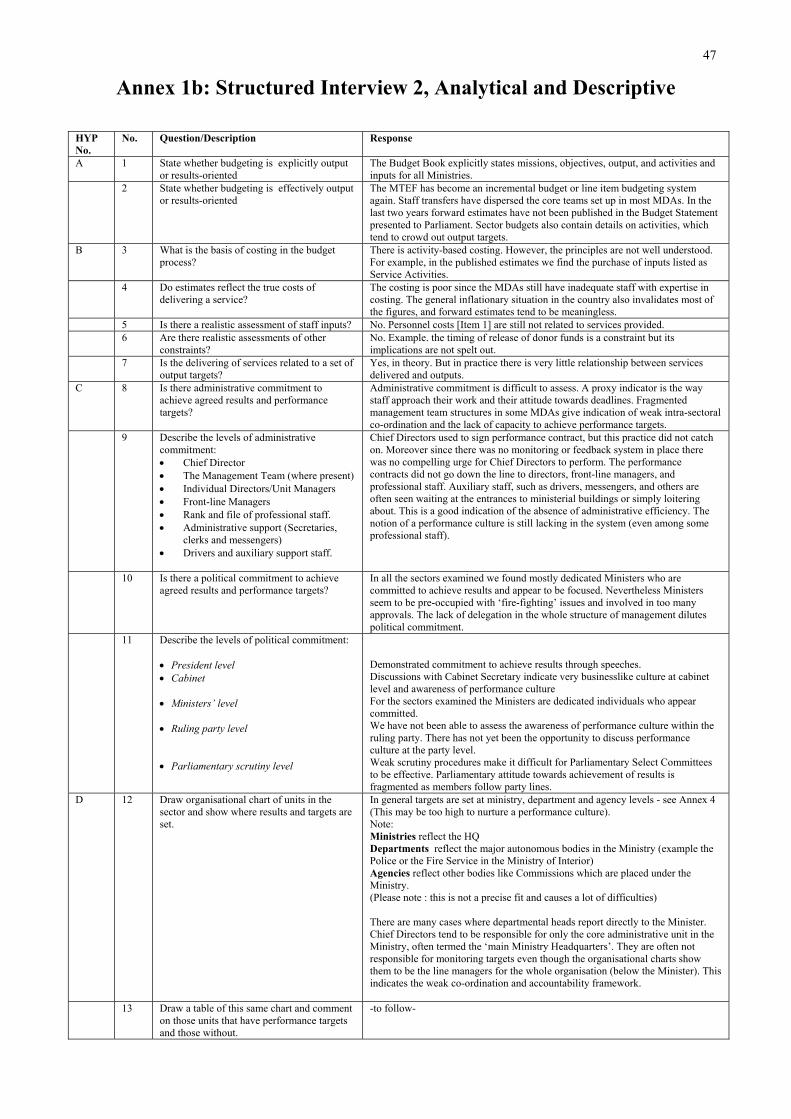
47
Annex 1b: Structured Interview 2, Analytical and Descriptive
HYP No.
No. Question/Description Response
A 1 State whether budgeting is explicitly output or results-oriented
The Budget Book explicitly states missions, objectives, output, and activities and inputs for all Ministries.
2 State whether budgeting is effectively output or results-oriented
The MTEF has become an incremental budget or line item budgeting system again. Staff transfers have dispersed the core teams set up in most MDAs. In the last two years forward estimates have not been published in the Budget Statement presented to Parliament. Sector budgets also contain details on activities, which tend to crowd out output targets.
B 3 What is the basis of costing in the budget process?
There is activity-based costing. However, the principles are not well understood. For example, in the published estimates we find the purchase of inputs listed as Service Activities.
4 Do estimates reflect the true costs of delivering a service?
The costing is poor since the MDAs still have inadequate staff with expertise in costing. The general inflationary situation in the country also invalidates most of the figures, and forward estimates tend to be meaningless.
5 Is there a realistic assessment of staff inputs? No. Personnel costs [Item 1] are still not related to services provided. 6 Are there realistic assessments of other
constraints? No. Example. the timing of release of donor funds is a constraint but its implications are not spelt out.
7 Is the delivering of services related to a set of output targets?
Yes, in theory. But in practice there is very little relationship between services delivered and outputs.
C 8 Is there administrative commitment to achieve agreed results and performance targets?
Administrative commitment is difficult to assess. A proxy indicator is the way staff approach their work and their attitude towards deadlines. Fragmented management team structures in some MDAs give indication of weak intra-sectoral co-ordination and the lack of capacity to achieve performance targets.
9 Describe the levels of administrative commitment:
Chief Director The Management Team (where present) Individual Directors/Unit Managers Front-line Managers Rank and file of professional staff. Administrative support (Secretaries, clerks and messengers) Drivers and auxiliary support staff.
Chief Directors used to sign performance contract, but this practice did not catch on. Moreover since there was no monitoring or feedback system in place there was no compelling urge for Chief Directors to perform. The performance contracts did not go down the line to directors, front-line managers, and professional staff. Auxiliary staff, such as drivers, messengers, and others are often seen waiting at the entrances to ministerial buildings or simply loitering about. This is a good indication of the absence of administrative efficiency. The notion of a performance culture is still lacking in the system (even among some professional staff).
10 Is there a political commitment to achieve agreed results and performance targets?
In all the sectors examined we found mostly dedicated Ministers who are committed to achieve results and appear to be focused. Nevertheless Ministers seem to be pre-occupied with ‘fire-fighting’ issues and involved in too many approvals. The lack of delegation in the whole structure of management dilutes political commitment.
11 Describe the levels of political commitment:
President level Cabinet
Ministers’ level
Ruling party level
Parliamentary scrutiny level
Demonstrated commitment to achieve results through speeches. Discussions with Cabinet Secretary indicate very businesslike culture at cabinet level and awareness of performance culture For the sectors examined the Ministers are dedicated individuals who appear committed. We have not been able to assess the awareness of performance culture within the ruling party. There has not yet been the opportunity to discuss performance culture at the party level. Weak scrutiny procedures make it difficult for Parliamentary Select Committees to be effective. Parliamentary attitude towards achievement of results is fragmented as members follow party lines.
D 12 Draw organisational chart of units in the sector and show where results and targets are set.
In general targets are set at ministry, department and agency levels - see Annex 4 (This may be too high to nurture a performance culture). Note:Ministries reflect the HQ Departments reflect the major autonomous bodies in the Ministry (example the Police or the Fire Service in the Ministry of Interior) Agencies reflect other bodies like Commissions which are placed under the Ministry. (Please note : this is not a precise fit and causes a lot of difficulties)
There are many cases where departmental heads report directly to the Minister. Chief Directors tend to be responsible for only the core administrative unit in the Ministry, often termed the ‘main Ministry Headquarters’. They are often not responsible for monitoring targets even though the organisational charts show them to be the line managers for the whole organisation (below the Minister). This indicates the weak co-ordination and accountability framework.
13 Draw a table of this same chart and comment on those units that have performance targets and those without.
-to follow-
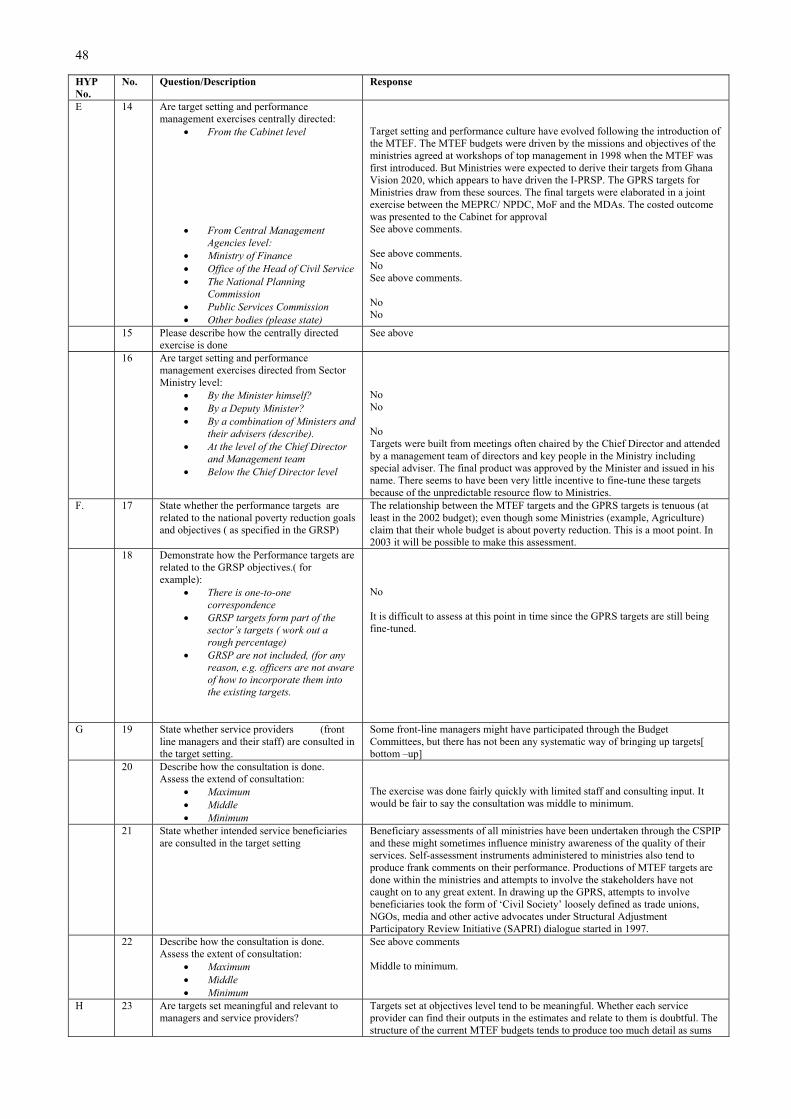
48
HYP No.
No. Question/Description Response
E 14 Are target setting and performance management exercises centrally directed:
From the Cabinet level
From Central Management Agencies level: Ministry of Finance Office of the Head of Civil Service The National Planning CommissionPublic Services Commission Other bodies (please state)
Target setting and performance culture have evolved following the introduction of the MTEF. The MTEF budgets were driven by the missions and objectives of the ministries agreed at workshops of top management in 1998 when the MTEF was first introduced. But Ministries were expected to derive their targets from Ghana Vision 2020, which appears to have driven the I-PRSP. The GPRS targets for Ministries draw from these sources. The final targets were elaborated in a joint exercise between the MEPRC/ NPDC, MoF and the MDAs. The costed outcome was presented to the Cabinet for approval See above comments.
See above comments. NoSee above comments.
NoNo
15 Please describe how the centrally directed exercise is done
See above
16 Are target setting and performance management exercises directed from Sector Ministry level:
By the Minister himself? By a Deputy Minister? By a combination of Ministers and their advisers (describe). At the level of the Chief Director and Management team Below the Chief Director level
NoNo
NoTargets were built from meetings often chaired by the Chief Director and attended by a management team of directors and key people in the Ministry including special adviser. The final product was approved by the Minister and issued in his name. There seems to have been very little incentive to fine-tune these targets because of the unpredictable resource flow to Ministries.
F. 17 State whether the performance targets are related to the national poverty reduction goals and objectives ( as specified in the GRSP)
The relationship between the MTEF targets and the GPRS targets is tenuous (at least in the 2002 budget); even though some Ministries (example, Agriculture) claim that their whole budget is about poverty reduction. This is a moot point. In 2003 it will be possible to make this assessment.
18 Demonstrate how the Performance targets are related to the GRSP objectives.( for example):
There is one-to-one correspondence GRSP targets form part of the sector’s targets ( work out a rough percentage) GRSP are not included, (for any reason, e.g. officers are not aware of how to incorporate them into the existing targets.
No
It is difficult to assess at this point in time since the GPRS targets are still being fine-tuned.
G 19 State whether service providers (front line managers and their staff) are consulted in the target setting.
Some front-line managers might have participated through the Budget Committees, but there has not been any systematic way of bringing up targets[ bottom –up]
20 Describe how the consultation is done. Assess the extend of consultation:
MaximumMiddleMinimum
The exercise was done fairly quickly with limited staff and consulting input. It would be fair to say the consultation was middle to minimum.
21 State whether intended service beneficiaries are consulted in the target setting
Beneficiary assessments of all ministries have been undertaken through the CSPIP and these might sometimes influence ministry awareness of the quality of their services. Self-assessment instruments administered to ministries also tend to produce frank comments on their performance. Productions of MTEF targets are done within the ministries and attempts to involve the stakeholders have not caught on to any great extent. In drawing up the GPRS, attempts to involve beneficiaries took the form of ‘Civil Society’ loosely defined as trade unions, NGOs, media and other active advocates under Structural Adjustment Participatory Review Initiative (SAPRI) dialogue started in 1997.
22 Describe how the consultation is done. Assess the extent of consultation:
MaximumMiddleMinimum
See above comments
Middle to minimum.
H 23 Are targets set meaningful and relevant to managers and service providers?
Targets set at objectives level tend to be meaningful. Whether each service provider can find their outputs in the estimates and relate to them is doubtful. The structure of the current MTEF budgets tends to produce too much detail as sums
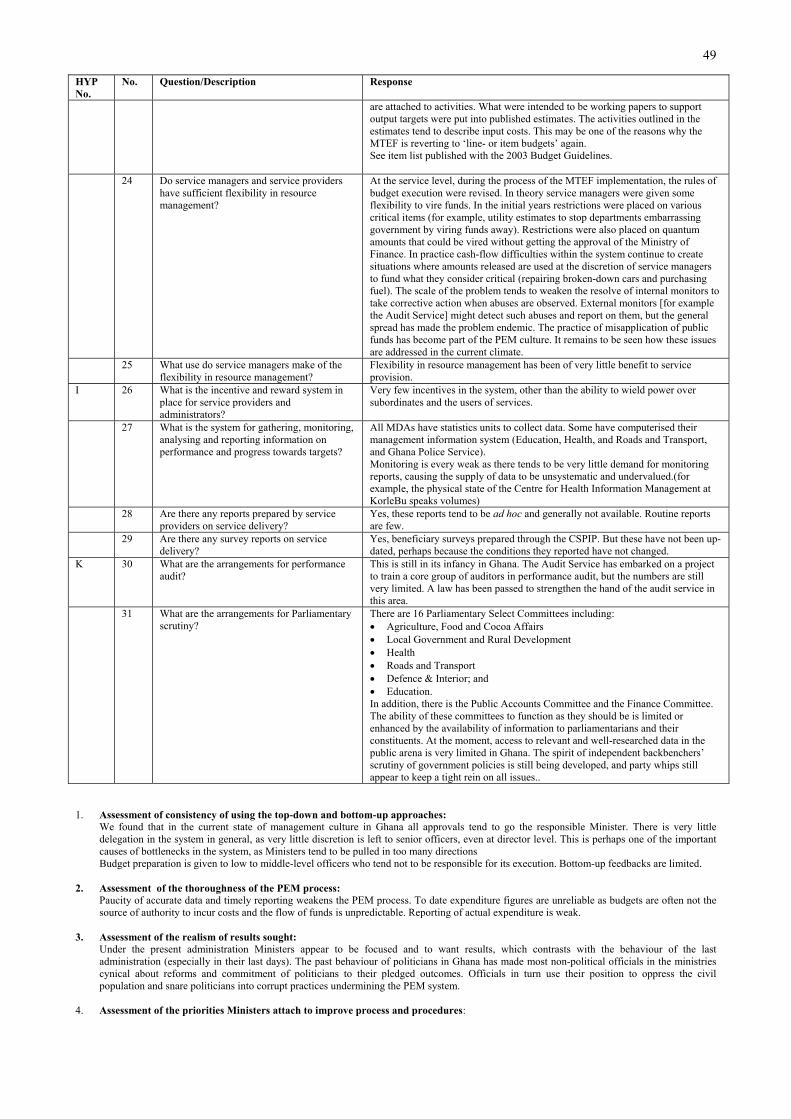
49
HYP No.
No. Question/Description Response
are attached to activities. What were intended to be working papers to support output targets were put into published estimates. The activities outlined in the estimates tend to describe input costs. This may be one of the reasons why the MTEF is reverting to ‘line- or item budgets’ again. See item list published with the 2003 Budget Guidelines.
24 Do service managers and service providers have sufficient flexibility in resource management?
At the service level, during the process of the MTEF implementation, the rules of budget execution were revised. In theory service managers were given some flexibility to vire funds. In the initial years restrictions were placed on various critical items (for example, utility estimates to stop departments embarrassing government by viring funds away). Restrictions were also placed on quantum amounts that could be vired without getting the approval of the Ministry of Finance. In practice cash-flow difficulties within the system continue to create situations where amounts released are used at the discretion of service managers to fund what they consider critical (repairing broken-down cars and purchasing fuel). The scale of the problem tends to weaken the resolve of internal monitors to take corrective action when abuses are observed. External monitors [for example the Audit Service] might detect such abuses and report on them, but the general spread has made the problem endemic. The practice of misapplication of public funds has become part of the PEM culture. It remains to be seen how these issues are addressed in the current climate.
25 What use do service managers make of the flexibility in resource management?
Flexibility in resource management has been of very little benefit to service provision.
I 26 What is the incentive and reward system in place for service providers and administrators?
Very few incentives in the system, other than the ability to wield power over subordinates and the users of services.
27 What is the system for gathering, monitoring, analysing and reporting information on performance and progress towards targets?
All MDAs have statistics units to collect data. Some have computerised their management information system (Education, Health, and Roads and Transport, and Ghana Police Service). Monitoring is every weak as there tends to be very little demand for monitoring reports, causing the supply of data to be unsystematic and undervalued.(for example, the physical state of the Centre for Health Information Management at KorleBu speaks volumes)
28 Are there any reports prepared by service providers on service delivery?
Yes, these reports tend to be ad hoc and generally not available. Routine reports are few.
29 Are there any survey reports on service delivery?
Yes, beneficiary surveys prepared through the CSPIP. But these have not been up-dated, perhaps because the conditions they reported have not changed.
K 30 What are the arrangements for performance audit?
This is still in its infancy in Ghana. The Audit Service has embarked on a project to train a core group of auditors in performance audit, but the numbers are still very limited. A law has been passed to strengthen the hand of the audit service in this area.
31 What are the arrangements for Parliamentary scrutiny?
There are 16 Parliamentary Select Committees including: Agriculture, Food and Cocoa Affairs Local Government and Rural Development HealthRoads and Transport Defence & Interior; and Education.
In addition, there is the Public Accounts Committee and the Finance Committee. The ability of these committees to function as they should be is limited or enhanced by the availability of information to parliamentarians and their constituents. At the moment, access to relevant and well-researched data in the public arena is very limited in Ghana. The spirit of independent backbenchers’ scrutiny of government policies is still being developed, and party whips still appear to keep a tight rein on all issues..
1. Assessment of consistency of using the top-down and bottom-up approaches: We found that in the current state of management culture in Ghana all approvals tend to go the responsible Minister. There is very little
delegation in the system in general, as very little discretion is left to senior officers, even at director level. This is perhaps one of the important causes of bottlenecks in the system, as Ministers tend to be pulled in too many directions
Budget preparation is given to low to middle-level officers who tend not to be responsible for its execution. Bottom-up feedbacks are limited.
2. Assessment of the thoroughness of the PEM process: Paucity of accurate data and timely reporting weakens the PEM process. To date expenditure figures are unreliable as budgets are often not the
source of authority to incur costs and the flow of funds is unpredictable. Reporting of actual expenditure is weak.
3. Assessment of the realism of results sought: Under the present administration Ministers appear to be focused and to want results, which contrasts with the behaviour of the last
administration (especially in their last days). The past behaviour of politicians in Ghana has made most non-political officials in the ministries cynical about reforms and commitment of politicians to their pledged outcomes. Officials in turn use their position to oppress the civil population and snare politicians into corrupt practices undermining the PEM system.
4. Assessment of the priorities Ministers attach to improve process and procedures:
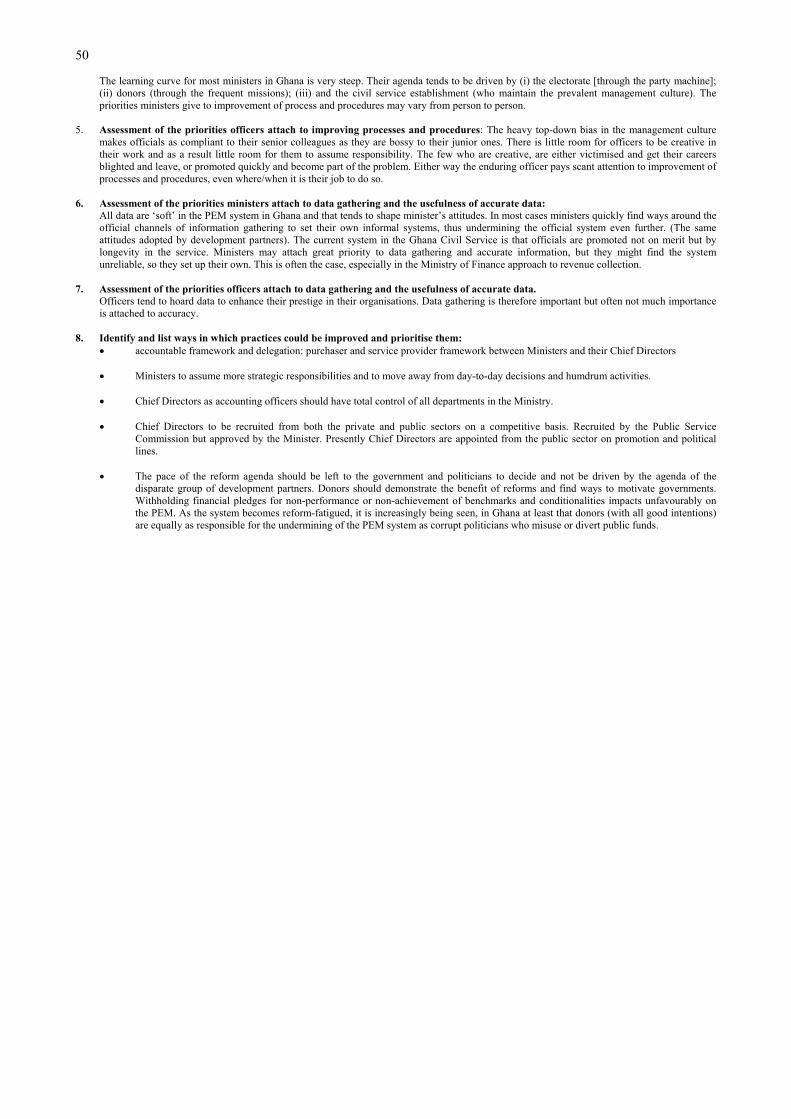
50
The learning curve for most ministers in Ghana is very steep. Their agenda tends to be driven by (i) the electorate [through the party machine]; (ii) donors (through the frequent missions); (iii) and the civil service establishment (who maintain the prevalent management culture). The priorities ministers give to improvement of process and procedures may vary from person to person.
5. Assessment of the priorities officers attach to improving processes and procedures: The heavy top-down bias in the management culture makes officials as compliant to their senior colleagues as they are bossy to their junior ones. There is little room for officers to be creative in their work and as a result little room for them to assume responsibility. The few who are creative, are either victimised and get their careers blighted and leave, or promoted quickly and become part of the problem. Either way the enduring officer pays scant attention to improvement of processes and procedures, even where/when it is their job to do so.
6. Assessment of the priorities ministers attach to data gathering and the usefulness of accurate data: All data are ‘soft’ in the PEM system in Ghana and that tends to shape minister’s attitudes. In most cases ministers quickly find ways around the
official channels of information gathering to set their own informal systems, thus undermining the official system even further. (The same attitudes adopted by development partners). The current system in the Ghana Civil Service is that officials are promoted not on merit but by longevity in the service. Ministers may attach great priority to data gathering and accurate information, but they might find the system unreliable, so they set up their own. This is often the case, especially in the Ministry of Finance approach to revenue collection.
7. Assessment of the priorities officers attach to data gathering and the usefulness of accurate data. Officers tend to hoard data to enhance their prestige in their organisations. Data gathering is therefore important but often not much importance
is attached to accuracy.
8. Identify and list ways in which practices could be improved and prioritise them: accountable framework and delegation: purchaser and service provider framework between Ministers and their Chief Directors
Ministers to assume more strategic responsibilities and to move away from day-to-day decisions and humdrum activities.
Chief Directors as accounting officers should have total control of all departments in the Ministry.
Chief Directors to be recruited from both the private and public sectors on a competitive basis. Recruited by the Public ServiceCommission but approved by the Minister. Presently Chief Directors are appointed from the public sector on promotion and political lines.
The pace of the reform agenda should be left to the government and politicians to decide and not be driven by the agenda of thedisparate group of development partners. Donors should demonstrate the benefit of reforms and find ways to motivate governments.Withholding financial pledges for non-performance or non-achievement of benchmarks and conditionalities impacts unfavourably onthe PEM. As the system becomes reform-fatigued, it is increasingly being seen, in Ghana at least that donors (with all good intentions) are equally as responsible for the undermining of the PEM system as corrupt politicians who misuse or divert public funds.
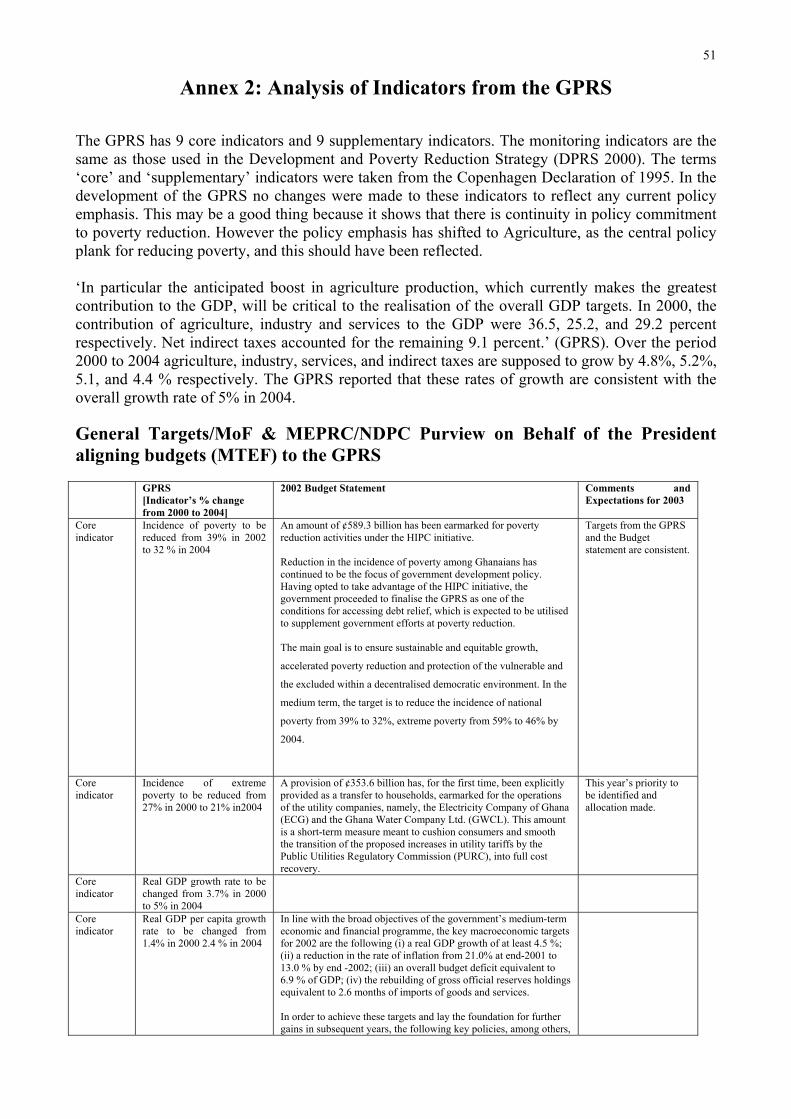
51
Annex 2: Analysis of Indicators from the GPRS
The GPRS has 9 core indicators and 9 supplementary indicators. The monitoring indicators are the same as those used in the Development and Poverty Reduction Strategy (DPRS 2000). The terms ‘core’ and ‘supplementary’ indicators were taken from the Copenhagen Declaration of 1995. In the development of the GPRS no changes were made to these indicators to reflect any current policy emphasis. This may be a good thing because it shows that there is continuity in policy commitment to poverty reduction. However the policy emphasis has shifted to Agriculture, as the central policy plank for reducing poverty, and this should have been reflected.
‘In particular the anticipated boost in agriculture production, which currently makes the greatest contribution to the GDP, will be critical to the realisation of the overall GDP targets. In 2000, the contribution of agriculture, industry and services to the GDP were 36.5, 25.2, and 29.2 percent respectively. Net indirect taxes accounted for the remaining 9.1 percent.’ (GPRS). Over the period 2000 to 2004 agriculture, industry, services, and indirect taxes are supposed to grow by 4.8%, 5.2%, 5.1, and 4.4 % respectively. The GPRS reported that these rates of growth are consistent with the overall growth rate of 5% in 2004.
General Targets/MoF & MEPRC/NDPC Purview on Behalf of the President aligning budgets (MTEF) to the GPRS
GPRS [Indicator’s % change from 2000 to 2004]
2002 Budget Statement Comments and Expectations for 2003
Coreindicator
Incidence of poverty to be reduced from 39% in 2002 to 32 % in 2004
An amount of ¢589.3 billion has been earmarked for poverty reduction activities under the HIPC initiative.
Reduction in the incidence of poverty among Ghanaians has continued to be the focus of government development policy. Having opted to take advantage of the HIPC initiative, the government proceeded to finalise the GPRS as one of the conditions for accessing debt relief, which is expected to be utilised to supplement government efforts at poverty reduction.
The main goal is to ensure sustainable and equitable growth,
accelerated poverty reduction and protection of the vulnerable and
the excluded within a decentralised democratic environment. In the
medium term, the target is to reduce the incidence of national
poverty from 39% to 32%, extreme poverty from 59% to 46% by
2004.
Targets from the GPRS and the Budget statement are consistent.
Coreindicator
Incidence of extreme poverty to be reduced from 27% in 2000 to 21% in2004
A provision of ¢353.6 billion has, for the first time, been explicitly provided as a transfer to households, earmarked for the operations of the utility companies, namely, the Electricity Company of Ghana (ECG) and the Ghana Water Company Ltd. (GWCL). This amount is a short-term measure meant to cushion consumers and smooth the transition of the proposed increases in utility tariffs by the Public Utilities Regulatory Commission (PURC), into full cost recovery.
This year’s priority to be identified and allocation made.
Coreindicator
Real GDP growth rate to be changed from 3.7% in 2000 to 5% in 2004
Coreindicator
Real GDP per capita growth rate to be changed from 1.4% in 2000 2.4 % in 2004
In line with the broad objectives of the government’s medium-term economic and financial programme, the key macroeconomic targets for 2002 are the following (i) a real GDP growth of at least 4.5 %; (ii) a reduction in the rate of inflation from 21.0% at end-2001 to 13.0 % by end -2002; (iii) an overall budget deficit equivalent to 6.9 % of GDP; (iv) the rebuilding of gross official reserves holdings equivalent to 2.6 months of imports of goods and services.
In order to achieve these targets and lay the foundation for further gains in subsequent years, the following key policies, among others,
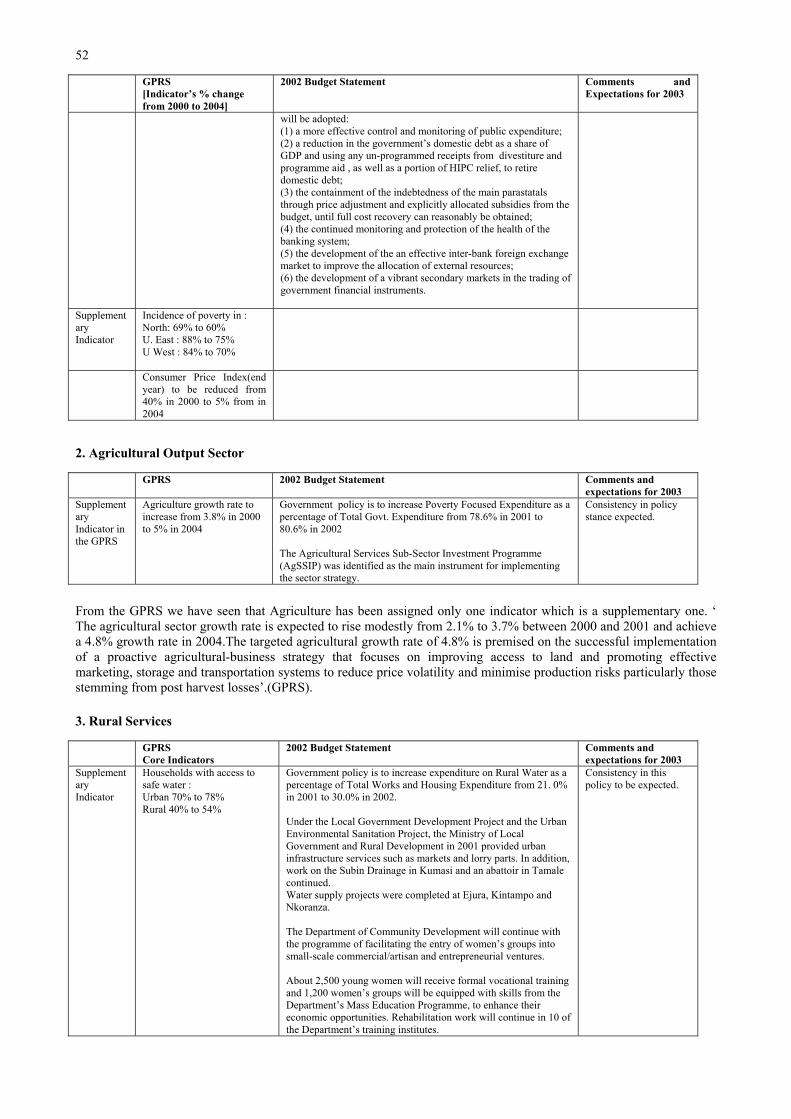
52
GPRS [Indicator’s % change from 2000 to 2004]
2002 Budget Statement Comments and Expectations for 2003
will be adopted: (1) a more effective control and monitoring of public expenditure; (2) a reduction in the government’s domestic debt as a share of GDP and using any un-programmed receipts from divestiture and programme aid , as well as a portion of HIPC relief, to retire domestic debt; (3) the containment of the indebtedness of the main parastatals through price adjustment and explicitly allocated subsidies from the budget, until full cost recovery can reasonably be obtained; (4) the continued monitoring and protection of the health of the banking system; (5) the development of the an effective inter-bank foreign exchange market to improve the allocation of external resources; (6) the development of a vibrant secondary markets in the trading of government financial instruments.
SupplementaryIndicator
Incidence of poverty in : North: 69% to 60% U. East : 88% to 75% U West : 84% to 70%
Consumer Price Index(end year) to be reduced from 40% in 2000 to 5% from in 2004
2. Agricultural Output Sector
GPRS 2002 Budget Statement Comments and expectations for 2003
SupplementaryIndicator in the GPRS
Agriculture growth rate to increase from 3.8% in 2000 to 5% in 2004
Government policy is to increase Poverty Focused Expenditure as a percentage of Total Govt. Expenditure from 78.6% in 2001 to 80.6% in 2002
The Agricultural Services Sub-Sector Investment Programme (AgSSIP) was identified as the main instrument for implementing the sector strategy.
Consistency in policy stance expected.
From the GPRS we have seen that Agriculture has been assigned only one indicator which is a supplementary one. ‘ The agricultural sector growth rate is expected to rise modestly from 2.1% to 3.7% between 2000 and 2001 and achieve a 4.8% growth rate in 2004.The targeted agricultural growth rate of 4.8% is premised on the successful implementation of a proactive agricultural-business strategy that focuses on improving access to land and promoting effective marketing, storage and transportation systems to reduce price volatility and minimise production risks particularly those stemming from post harvest losses’.(GPRS).
3. Rural Services
GPRS Core Indicators
2002 Budget Statement Comments and expectations for 2003
SupplementaryIndicator
Households with access to safe water : Urban 70% to 78% Rural 40% to 54%
Government policy is to increase expenditure on Rural Water as a percentage of Total Works and Housing Expenditure from 21. 0% in 2001 to 30.0% in 2002.
Under the Local Government Development Project and the Urban Environmental Sanitation Project, the Ministry of Local Government and Rural Development in 2001 provided urban infrastructure services such as markets and lorry parts. In addition, work on the Subin Drainage in Kumasi and an abattoir in Tamale continued. Water supply projects were completed at Ejura, Kintampo and Nkoranza.
The Department of Community Development will continue with the programme of facilitating the entry of women’s groups into small-scale commercial/artisan and entrepreneurial ventures.
About 2,500 young women will receive formal vocational training and 1,200 women’s groups will be equipped with skills from the Department’s Mass Education Programme, to enhance their economic opportunities. Rehabilitation work will continue in 10 of the Department’s training institutes.
Consistency in this policy to be expected.
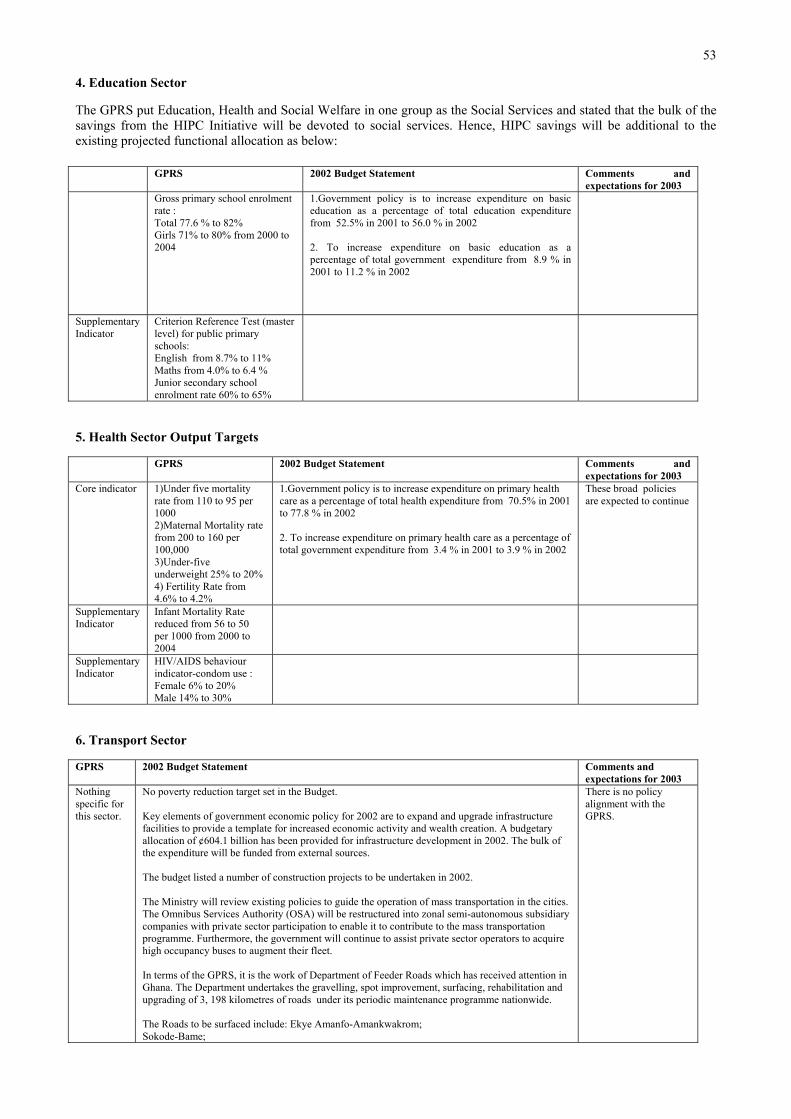
53
4. Education Sector
The GPRS put Education, Health and Social Welfare in one group as the Social Services and stated that the bulk of the savings from the HIPC Initiative will be devoted to social services. Hence, HIPC savings will be additional to the existing projected functional allocation as below:
GPRS 2002 Budget Statement Comments and expectations for 2003
Gross primary school enrolment rate : Total 77.6 % to 82% Girls 71% to 80% from 2000 to 2004
1.Government policy is to increase expenditure on basic education as a percentage of total education expenditure from 52.5% in 2001 to 56.0 % in 2002
2. To increase expenditure on basic education as a percentage of total government expenditure from 8.9 % in 2001 to 11.2 % in 2002
Supplementary Indicator
Criterion Reference Test (master level) for public primary schools:English from 8.7% to 11% Maths from 4.0% to 6.4 % Junior secondary school enrolment rate 60% to 65%
5. Health Sector Output Targets
GPRS 2002 Budget Statement Comments and expectations for 2003
Core indicator 1)Under five mortality rate from 110 to 95 per 10002)Maternal Mortality rate from 200 to 160 per 100,000 3)Under-five underweight 25% to 20% 4) Fertility Rate from 4.6% to 4.2%
1.Government policy is to increase expenditure on primary health care as a percentage of total health expenditure from 70.5% in 2001 to 77.8 % in 2002
2. To increase expenditure on primary health care as a percentage of total government expenditure from 3.4 % in 2001 to 3.9 % in 2002
These broad policies are expected to continue
Supplementary Indicator
Infant Mortality Rate reduced from 56 to 50 per 1000 from 2000 to 2004
Supplementary Indicator
HIV/AIDS behaviour indicator-condom use : Female 6% to 20% Male 14% to 30%
6. Transport Sector
GPRS 2002 Budget Statement Comments and expectations for 2003
Nothingspecific for this sector.
No poverty reduction target set in the Budget.
Key elements of government economic policy for 2002 are to expand and upgrade infrastructure facilities to provide a template for increased economic activity and wealth creation. A budgetary allocation of ¢604.1 billion has been provided for infrastructure development in 2002. The bulk of the expenditure will be funded from external sources.
The budget listed a number of construction projects to be undertaken in 2002.
The Ministry will review existing policies to guide the operation of mass transportation in the cities. The Omnibus Services Authority (OSA) will be restructured into zonal semi-autonomous subsidiary companies with private sector participation to enable it to contribute to the mass transportation programme. Furthermore, the government will continue to assist private sector operators to acquire high occupancy buses to augment their fleet.
In terms of the GPRS, it is the work of Department of Feeder Roads which has received attention in Ghana. The Department undertakes the gravelling, spot improvement, surfacing, rehabilitation and upgrading of 3, 198 kilometres of roads under its periodic maintenance programme nationwide.
The Roads to be surfaced include: Ekye Amanfo-Amankwakrom; Sokode-Bame;
There is no policy alignment with the GPRS.
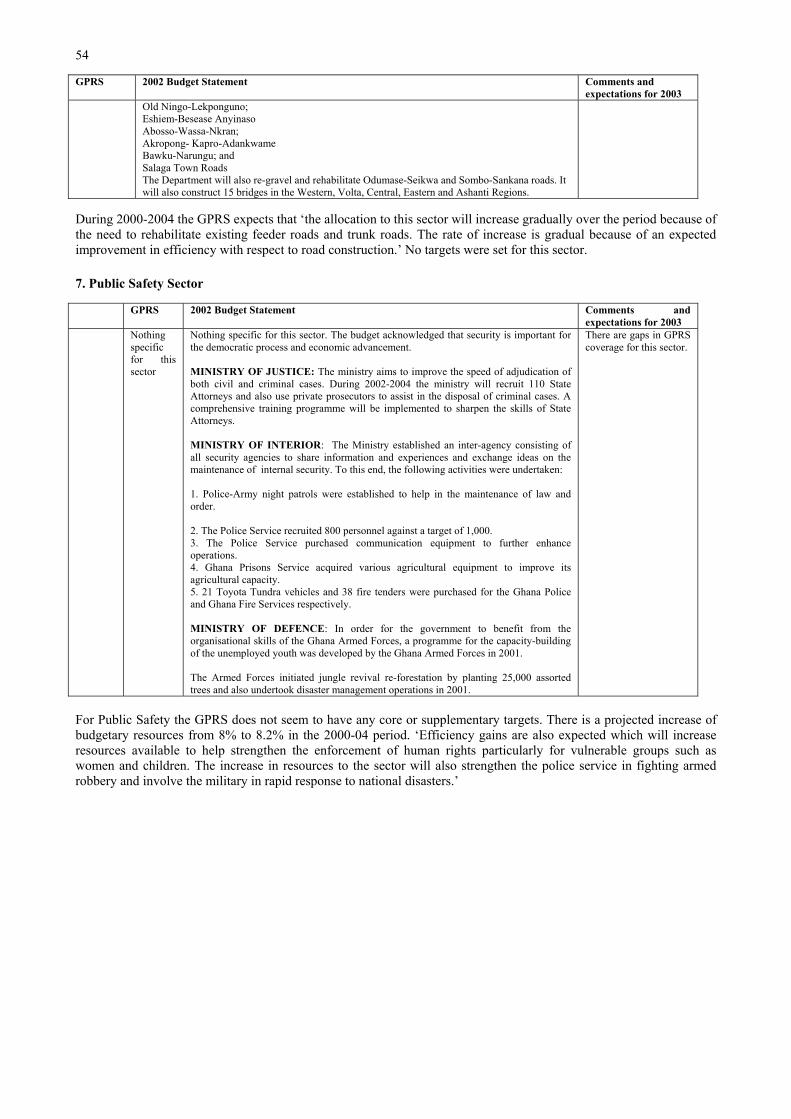
54
GPRS 2002 Budget Statement Comments and expectations for 2003
Old Ningo-Lekponguno; Eshiem-Besease Anyinaso Abosso-Wassa-Nkran; Akropong- Kapro-Adankwame Bawku-Narungu; and Salaga Town Roads The Department will also re-gravel and rehabilitate Odumase-Seikwa and Sombo-Sankana roads. It will also construct 15 bridges in the Western, Volta, Central, Eastern and Ashanti Regions.
During 2000-2004 the GPRS expects that ‘the allocation to this sector will increase gradually over the period because of the need to rehabilitate existing feeder roads and trunk roads. The rate of increase is gradual because of an expected improvement in efficiency with respect to road construction.’ No targets were set for this sector.
7. Public Safety Sector
GPRS 2002 Budget Statement Comments and expectations for 2003
Nothing specific for this sector
Nothing specific for this sector. The budget acknowledged that security is important for the democratic process and economic advancement.
MINISTRY OF JUSTICE: The ministry aims to improve the speed of adjudication of both civil and criminal cases. During 2002-2004 the ministry will recruit 110 State Attorneys and also use private prosecutors to assist in the disposal of criminal cases. A comprehensive training programme will be implemented to sharpen the skills of State Attorneys.
MINISTRY OF INTERIOR: The Ministry established an inter-agency consisting of all security agencies to share information and experiences and exchange ideas on the maintenance of internal security. To this end, the following activities were undertaken:
1. Police-Army night patrols were established to help in the maintenance of law and order.
2. The Police Service recruited 800 personnel against a target of 1,000. 3. The Police Service purchased communication equipment to further enhance operations. 4. Ghana Prisons Service acquired various agricultural equipment to improve its agricultural capacity. 5. 21 Toyota Tundra vehicles and 38 fire tenders were purchased for the Ghana Police and Ghana Fire Services respectively.
MINISTRY OF DEFENCE: In order for the government to benefit from the organisational skills of the Ghana Armed Forces, a programme for the capacity-building of the unemployed youth was developed by the Ghana Armed Forces in 2001.
The Armed Forces initiated jungle revival re-forestation by planting 25,000 assorted trees and also undertook disaster management operations in 2001.
There are gaps in GPRS coverage for this sector.
For Public Safety the GPRS does not seem to have any core or supplementary targets. There is a projected increase of budgetary resources from 8% to 8.2% in the 2000-04 period. ‘Efficiency gains are also expected which will increase resources available to help strengthen the enforcement of human rights particularly for vulnerable groups such as women and children. The increase in resources to the sector will also strengthen the police service in fighting armed robbery and involve the military in rapid response to national disasters.’

55
Annex 3: Planned Government Poverty Reduction Expenditure
Planned Government Poverty Reduction Expenditure 2001-2002 (in billion cedis)
2001 2002 Notes on Funding Sources
Total Government Expenditure
Total Poverty Reduction Expenditure
Poverty reduction as % of government expenditure
8,908.1
1,525.4
17.1%
9,796.1
2,128.2
21.7%
Total GoG payments less foreign amortisation and arrears clearance
Education Sector
Basic Education
Basic Education. /Total Education. Expenditure
Basic Education. / Total Gov. Expenditure
1,504.2
789.6
52.5%
8.9%
1,955.9
1,094.7
56.0%
11.2%
MTEF Estimates+ District Assemblies Common Fund + Ghana Education Trust Fund.
Health Sector
Primary Health Sector
Primary Health Care/ Total Health Expenditure
Primary Health/ Total Government Expenditure
427.0
301.2
70.5%
3.4%
488.9
380.4
77.8%
3.9%
MTEF estimates + District Assemblies Common Fund
Agriculture Sector
Poverty-focused Agriculture
Poverty-focused Agriculture/ Total Agriculture Expenditure
55.6
43.7
78.6%
102.7
82.7
80.6%
MTEF Estimates
Works and Housing
Rural Water
Rural Water/Total Works and Housing
54.3
11.4
21.0%
59.4
17.8
30.0%
MTEF Estimates + District Assemblies Common Fund
Roads and Housing
Feeder Roads
Feeder Roads/Total Roads and Highways
302.9
85.3
28.1%
571.9
203.8
35.6%
MTEF Estimates + District Assemblies Common Fund + Road Fund
Energy Sector
Rural Electrification
Rural Electrification/ Total Energy Expenditure
24.2
18.0
74.2%
44.75
33.9
75.7%
MTEF Estimates and District Assemblies Common Fund
Other Poverty
Other Poverty/ Total Government Expenditure
276.2
3.1%
314.9
3.2%
Social welfare, Population Management, Governance,HIV/AIDS, etc.
Source: GoG 2002 Budget Statement based on MDA Annual Estimates, 2001-2002
56
The Budget Statement and Economic Policy of the Government of Ghana for the 2002 Financial Year, 21st February 2002 represented the first ‘real’ policy budget of the present government The new administration is responsible for the MTEF budgets of 2001 and 2002. The 2001 budget was largely inherited and had to be reviewed in the course of implementation under ‘the Mid-Year Review of the Budget Statement and Economic Policy of the Government for the 2001 Financial Year’ which was presented to Parliament on 8 November 2001. The MTEF 2002 budget, therefore, represents the first full budget of the new administration.
One thing that stands out in the government Budget Statement 2002 is the role and centrality of agriculture in Ghana’s development effort. The government stated: ‘ Raising the typical small-scale farmer’s productivity and supporting his efforts with enhanced facilities – credit, marketing, storage and processing of his produce – these constitute the core of the NPP strategy for breaking out of the poverty and acute deprivation which affects so many of our people.’
It went on to set the time-scale of implementing people-centred development within the remaining time span (2002-4) of its first term in office to reduce poverty. These issues were discussed within the terms of the party’s manifesto, the national development agenda and the annual budgets.
Highlights were given to the HIPC Initiative which the document stated would bring in savings of $190m in 2001 (about ¢1, 368 billion). For 2002, the an inflow of $249m (net) in HIPC savings was expected. Our examinations indicated that the government intends to apply the savings to:
Policies to support planned subsidies for the poor to meet the cost of electricity and water consumption after the implementation of full cost-recovery measures for the utility companies in question. (Para. 107 of the Statement states: ‘A provision of ¢353.6 billion has, for the first time, been explicitly provided as a transfer to households, earmarked for the operations of the utility companies, namely the Electricity Company of Ghana (ECG) and the Ghana Water Company Ltd. (GWCL).’ This amount is a short-term measure meant to cushion consumers and smooth the transition of the proposed increases in utility tariffs by the Public Utilities Regulatory Commission (PURC), into full cost recovery;
Domestic revenue mobilisation;
Further poverty-related expenditure (80% of $96m. attributable to the enhanced HIPC relief);
Reduce domestic debt (20% of the said $96m.).
For effective tracking of HIPC relief, the government is seeking the agreement of donors to channel all donor resources through government accounts (including committed donor accounts) at the Bank of Ghana. The government is intensifying its efforts to ensure that all MDAs report to the Ministry of Finance expenditures financed from internally-generated funds (IGFs) ( such as user fees) and from direct donor funding.
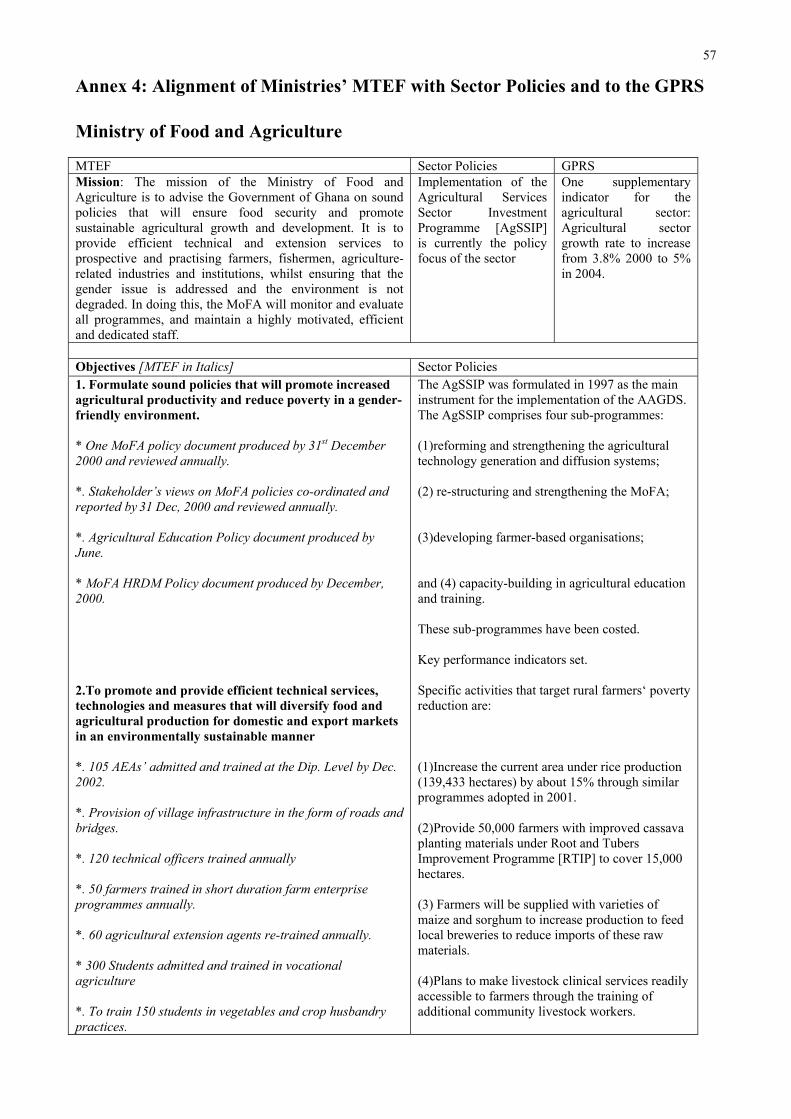
57
Annex 4: Alignment of Ministries’ MTEF with Sector Policies and to the GPRS
Ministry of Food and Agriculture
MTEF Sector Policies GPRS Mission: The mission of the Ministry of Food and Agriculture is to advise the Government of Ghana on sound policies that will ensure food security and promote sustainable agricultural growth and development. It is to provide efficient technical and extension services to prospective and practising farmers, fishermen, agriculture-related industries and institutions, whilst ensuring that the gender issue is addressed and the environment is not degraded. In doing this, the MoFA will monitor and evaluate all programmes, and maintain a highly motivated, efficient and dedicated staff.
Implementation of the Agricultural Services Sector Investment Programme [AgSSIP] is currently the policy focus of the sector
One supplementary indicator for the agricultural sector: Agricultural sector growth rate to increase from 3.8% 2000 to 5% in 2004.
Objectives [MTEF in Italics] Sector Policies 1. Formulate sound policies that will promote increased agricultural productivity and reduce poverty in a gender-friendly environment.
* One MoFA policy document produced by 31st December 2000 and reviewed annually.
*. Stakeholder’s views on MoFA policies co-ordinated and reported by 31 Dec, 2000 and reviewed annually.
*. Agricultural Education Policy document produced by June.
* MoFA HRDM Policy document produced by December, 2000.
2.To promote and provide efficient technical services, technologies and measures that will diversify food and agricultural production for domestic and export markets in an environmentally sustainable manner
*. 105 AEAs’ admitted and trained at the Dip. Level by Dec. 2002.
*. Provision of village infrastructure in the form of roads and bridges.
*. 120 technical officers trained annually
*. 50 farmers trained in short duration farm enterprise programmes annually.
*. 60 agricultural extension agents re-trained annually.
* 300 Students admitted and trained in vocational agriculture
*. To train 150 students in vegetables and crop husbandry practices.
The AgSSIP was formulated in 1997 as the main instrument for the implementation of the AAGDS. The AgSSIP comprises four sub-programmes:
(1)reforming and strengthening the agricultural technology generation and diffusion systems;
(2) re-structuring and strengthening the MoFA;
(3)developing farmer-based organisations;
and (4) capacity-building in agricultural education and training.
These sub-programmes have been costed.
Key performance indicators set.
Specific activities that target rural farmers‘ poverty reduction are:
(1)Increase the current area under rice production (139,433 hectares) by about 15% through similar programmes adopted in 2001.
(2)Provide 50,000 farmers with improved cassava planting materials under Root and Tubers Improvement Programme [RTIP] to cover 15,000 hectares.
(3) Farmers will be supplied with varieties of maize and sorghum to increase production to feed local breweries to reduce imports of these raw materials.
(4)Plans to make livestock clinical services readily accessible to farmers through the training of additional community livestock workers.
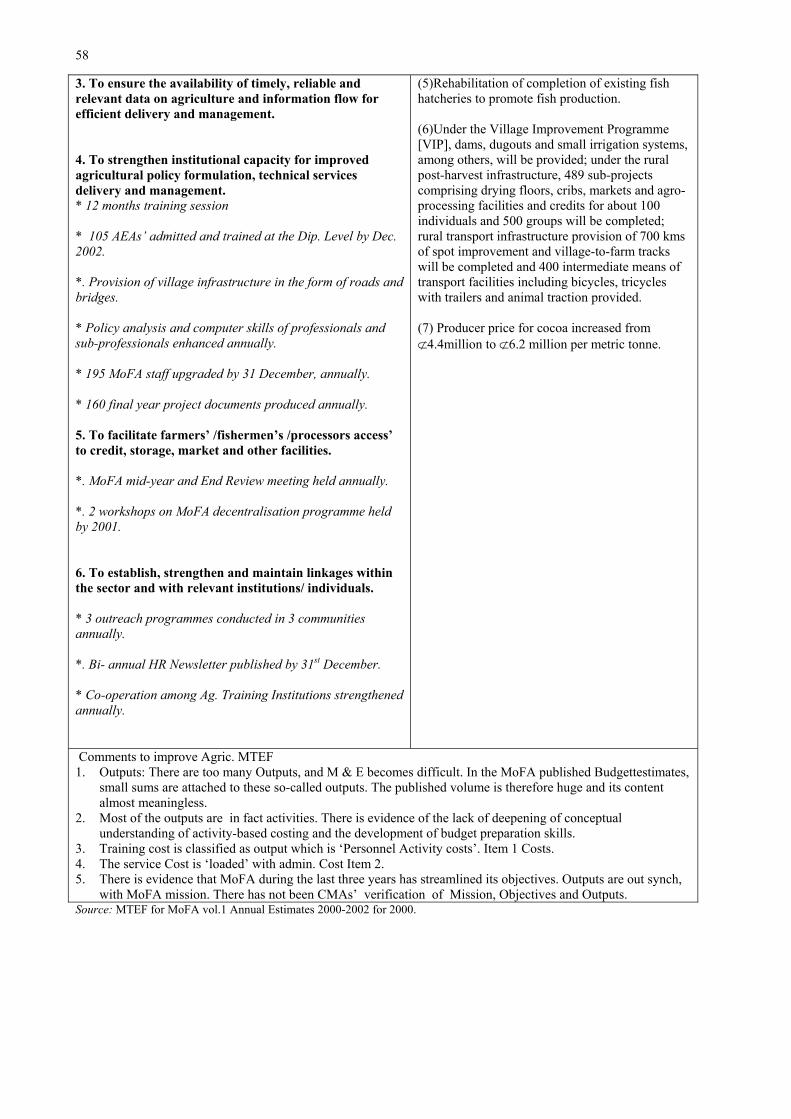
58
3. To ensure the availability of timely, reliable and relevant data on agriculture and information flow for efficient delivery and management.
4. To strengthen institutional capacity for improved agricultural policy formulation, technical services delivery and management. * 12 months training session
* 105 AEAs’ admitted and trained at the Dip. Level by Dec. 2002.
*. Provision of village infrastructure in the form of roads and bridges.
* Policy analysis and computer skills of professionals and sub-professionals enhanced annually.
* 195 MoFA staff upgraded by 31 December, annually.
* 160 final year project documents produced annually.
5. To facilitate farmers’ /fishermen’s /processors access’ to credit, storage, market and other facilities.
*. MoFA mid-year and End Review meeting held annually.
*. 2 workshops on MoFA decentralisation programme held by 2001.
6. To establish, strengthen and maintain linkages within the sector and with relevant institutions/ individuals.
* 3 outreach programmes conducted in 3 communities annually.
*. Bi- annual HR Newsletter published by 31st December.
* Co-operation among Ag. Training Institutions strengthened annually.
(5)Rehabilitation of completion of existing fish hatcheries to promote fish production.
(6)Under the Village Improvement Programme [VIP], dams, dugouts and small irrigation systems, among others, will be provided; under the rural post-harvest infrastructure, 489 sub-projects comprising drying floors, cribs, markets and agro-processing facilities and credits for about 100 individuals and 500 groups will be completed; rural transport infrastructure provision of 700 kms of spot improvement and village-to-farm tracks will be completed and 400 intermediate means of transport facilities including bicycles, tricycles with trailers and animal traction provided.
(7) Producer price for cocoa increased from 4.4million to 6.2 million per metric tonne.
Comments to improve Agric. MTEF 1. Outputs: There are too many Outputs, and M & E becomes difficult. In the MoFA published Budgettestimates,
small sums are attached to these so-called outputs. The published volume is therefore huge and its content almost meaningless.
2. Most of the outputs are in fact activities. There is evidence of the lack of deepening of conceptual understanding of activity-based costing and the development of budget preparation skills.
3. Training cost is classified as output which is ‘Personnel Activity costs’. Item 1 Costs. 4. The service Cost is ‘loaded’ with admin. Cost Item 2. 5. There is evidence that MoFA during the last three years has streamlined its objectives. Outputs are out synch,
with MoFA mission. There has not been CMAs’ verification of Mission, Objectives and Outputs. Source: MTEF for MoFA vol.1 Annual Estimates 2000-2002 for 2000.
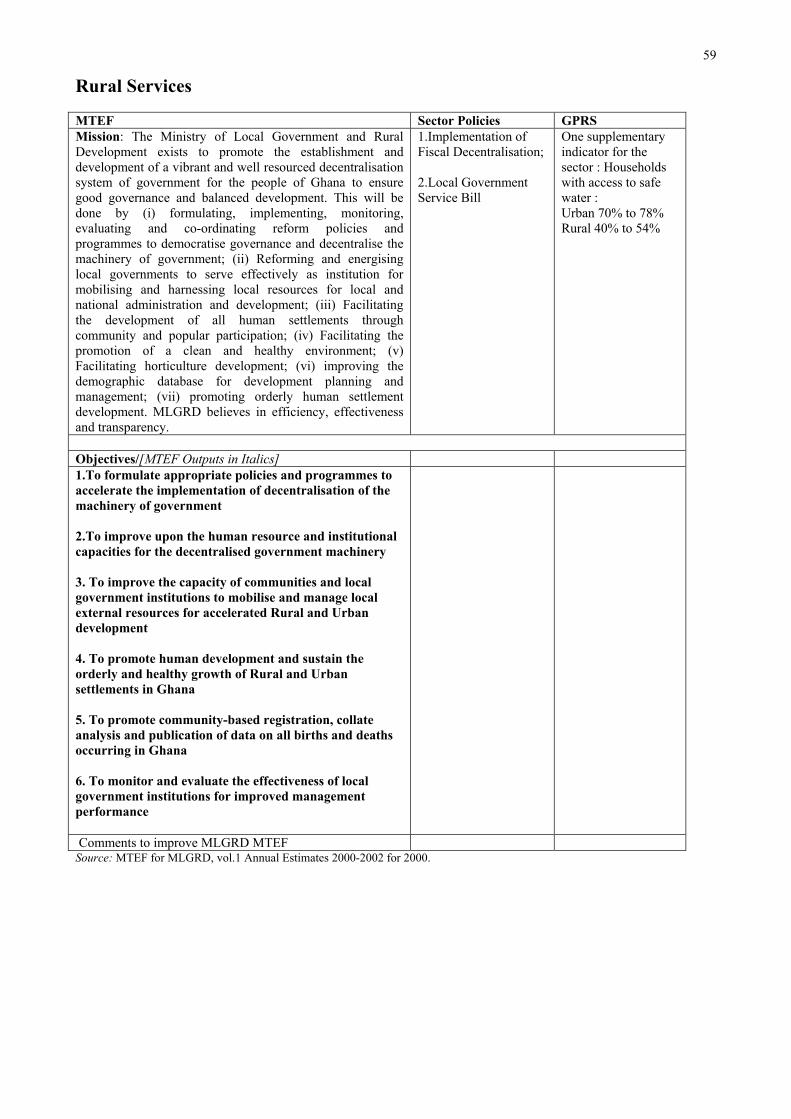
59
Rural Services
MTEF Sector Policies GPRS Mission: The Ministry of Local Government and Rural Development exists to promote the establishment and development of a vibrant and well resourced decentralisation system of government for the people of Ghana to ensure good governance and balanced development. This will be done by (i) formulating, implementing, monitoring, evaluating and co-ordinating reform policies and programmes to democratise governance and decentralise the machinery of government; (ii) Reforming and energising local governments to serve effectively as institution for mobilising and harnessing local resources for local and national administration and development; (iii) Facilitating the development of all human settlements through community and popular participation; (iv) Facilitating the promotion of a clean and healthy environment; (v) Facilitating horticulture development; (vi) improving the demographic database for development planning and management; (vii) promoting orderly human settlement development. MLGRD believes in efficiency, effectiveness and transparency.
1.Implementation of Fiscal Decentralisation;
2.Local Government Service Bill
One supplementary indicator for the sector : Households with access to safe water : Urban 70% to 78% Rural 40% to 54%
Objectives/[MTEF Outputs in Italics] 1.To formulate appropriate policies and programmes to accelerate the implementation of decentralisation of the machinery of government
2.To improve upon the human resource and institutional capacities for the decentralised government machinery
3. To improve the capacity of communities and local government institutions to mobilise and manage local external resources for accelerated Rural and Urban development
4. To promote human development and sustain the orderly and healthy growth of Rural and Urban settlements in Ghana
5. To promote community-based registration, collate analysis and publication of data on all births and deaths occurring in Ghana
6. To monitor and evaluate the effectiveness of local government institutions for improved management performance
Comments to improve MLGRD MTEF Source: MTEF for MLGRD, vol.1 Annual Estimates 2000-2002 for 2000.
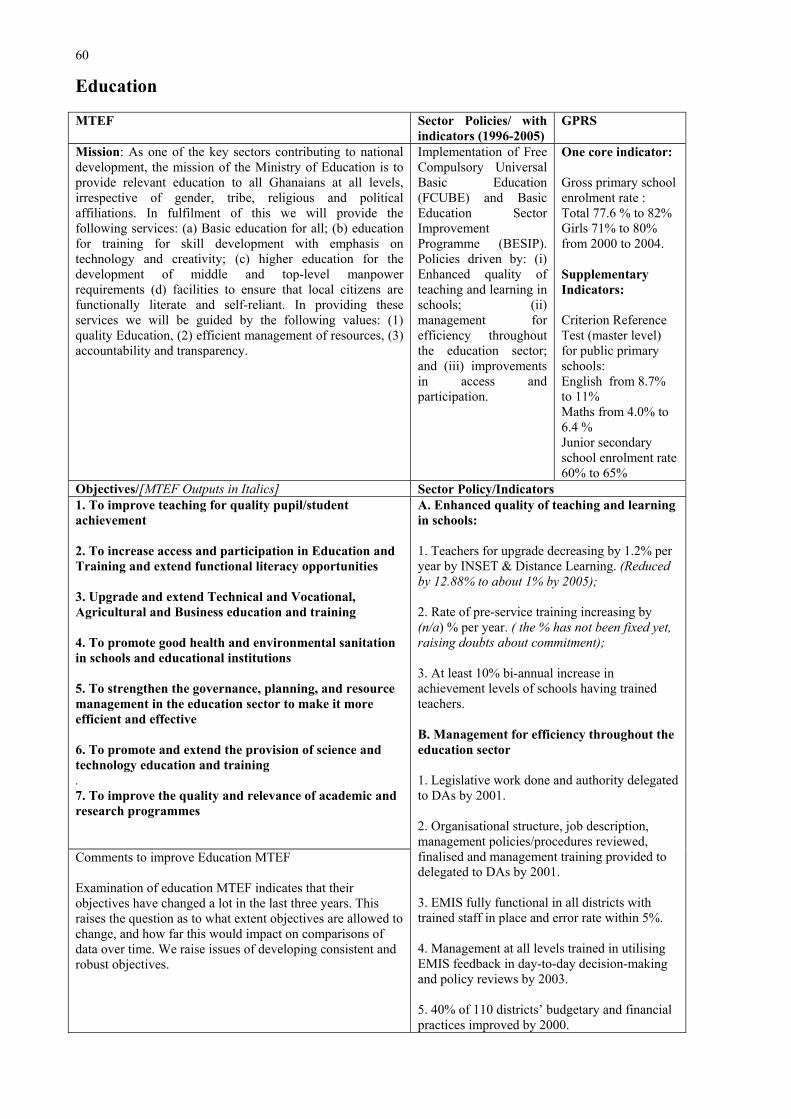
60
Education
MTEF Sector Policies/ with indicators (1996-2005)
GPRS
Mission: As one of the key sectors contributing to national development, the mission of the Ministry of Education is to provide relevant education to all Ghanaians at all levels, irrespective of gender, tribe, religious and political affiliations. In fulfilment of this we will provide the following services: (a) Basic education for all; (b) education for training for skill development with emphasis on technology and creativity; (c) higher education for the development of middle and top-level manpower requirements (d) facilities to ensure that local citizens are functionally literate and self-reliant. In providing these services we will be guided by the following values: (1) quality Education, (2) efficient management of resources, (3) accountability and transparency.
Implementation of Free Compulsory Universal Basic Education (FCUBE) and Basic Education Sector Improvement Programme (BESIP). Policies driven by: (i) Enhanced quality of teaching and learning in schools; (ii) management for efficiency throughout the education sector; and (iii) improvements in access and participation.
One core indicator:
Gross primary school enrolment rate : Total 77.6 % to 82% Girls 71% to 80% from 2000 to 2004.
Supplementary Indicators:
Criterion Reference Test (master level) for public primary schools:English from 8.7% to 11% Maths from 4.0% to 6.4 % Junior secondary school enrolment rate 60% to 65%
Objectives/[MTEF Outputs in Italics] Sector Policy/Indicators1. To improve teaching for quality pupil/student achievement
2. To increase access and participation in Education and Training and extend functional literacy opportunities
3. Upgrade and extend Technical and Vocational, Agricultural and Business education and training
4. To promote good health and environmental sanitation in schools and educational institutions
5. To strengthen the governance, planning, and resource management in the education sector to make it more efficient and effective
6. To promote and extend the provision of science and technology education and training.7. To improve the quality and relevance of academic and research programmes
Comments to improve Education MTEF
Examination of education MTEF indicates that their objectives have changed a lot in the last three years. This raises the question as to what extent objectives are allowed to change, and how far this would impact on comparisons of data over time. We raise issues of developing consistent and robust objectives.
A. Enhanced quality of teaching and learningin schools:
1. Teachers for upgrade decreasing by 1.2% per year by INSET & Distance Learning. (Reduced by 12.88% to about 1% by 2005);
2. Rate of pre-service training increasing by (n/a) % per year. ( the % has not been fixed yet, raising doubts about commitment);
3. At least 10% bi-annual increase in achievement levels of schools having trained teachers.
B. Management for efficiency throughout the education sector
1. Legislative work done and authority delegated to DAs by 2001.
2. Organisational structure, job description, management policies/procedures reviewed, finalised and management training provided to delegated to DAs by 2001.
3. EMIS fully functional in all districts with trained staff in place and error rate within 5%.
4. Management at all levels trained in utilising EMIS feedback in day-to-day decision-making and policy reviews by 2003.
5. 40% of 110 districts’ budgetary and financial practices improved by 2000.
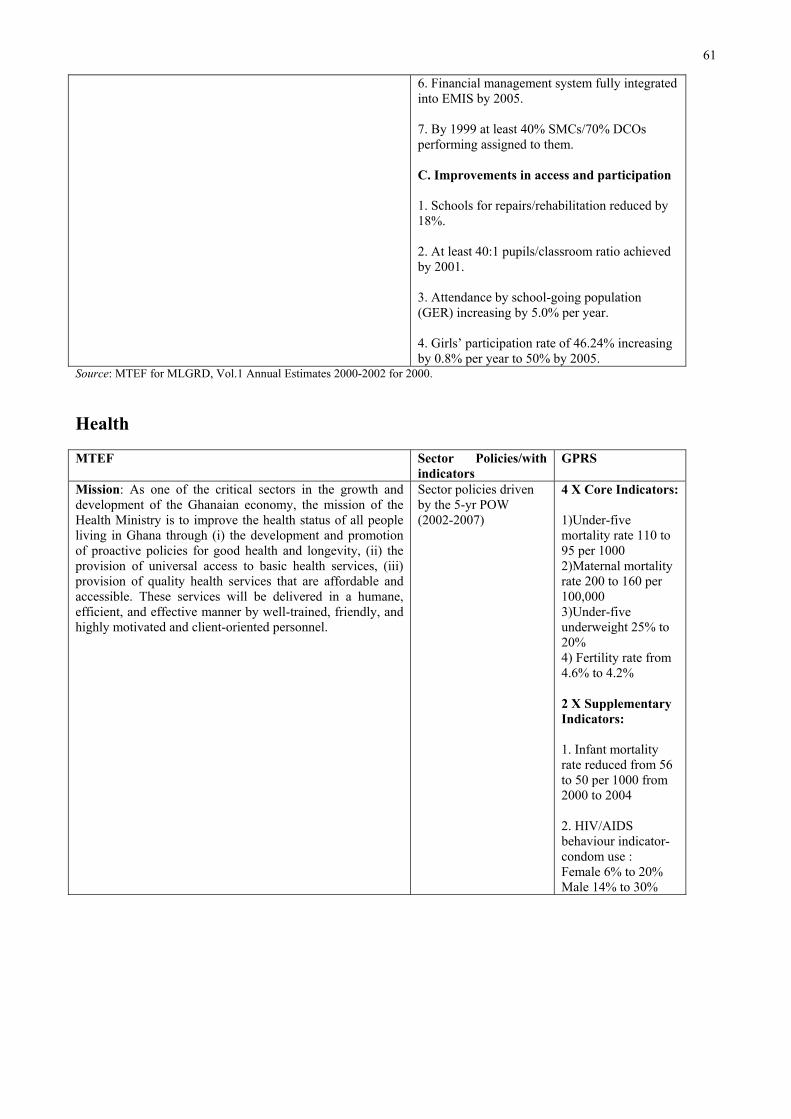
61
6. Financial management system fully integrated into EMIS by 2005.
7. By 1999 at least 40% SMCs/70% DCOs performing assigned to them.
C. Improvements in access and participation
1. Schools for repairs/rehabilitation reduced by 18%.
2. At least 40:1 pupils/classroom ratio achieved by 2001.
3. Attendance by school-going population (GER) increasing by 5.0% per year.
4. Girls’ participation rate of 46.24% increasing by 0.8% per year to 50% by 2005.
Source: MTEF for MLGRD, Vol.1 Annual Estimates 2000-2002 for 2000.
Health
MTEF Sector Policies/with indicators
GPRS
Mission: As one of the critical sectors in the growth and development of the Ghanaian economy, the mission of the Health Ministry is to improve the health status of all people living in Ghana through (i) the development and promotion of proactive policies for good health and longevity, (ii) the provision of universal access to basic health services, (iii) provision of quality health services that are affordable and accessible. These services will be delivered in a humane, efficient, and effective manner by well-trained, friendly, and highly motivated and client-oriented personnel.
Sector policies driven by the 5-yr POW (2002-2007)
4 X Core Indicators:
1)Under-five mortality rate 110 to 95 per 1000 2)Maternal mortality rate 200 to 160 per 100,000 3)Under-five underweight 25% to 20% 4) Fertility rate from 4.6% to 4.2%
2 X Supplementary Indicators:
1. Infant mortality rate reduced from 56 to 50 per 1000 from 2000 to 2004
2. HIV/AIDS behaviour indicator-condom use : Female 6% to 20% Male 14% to 30%
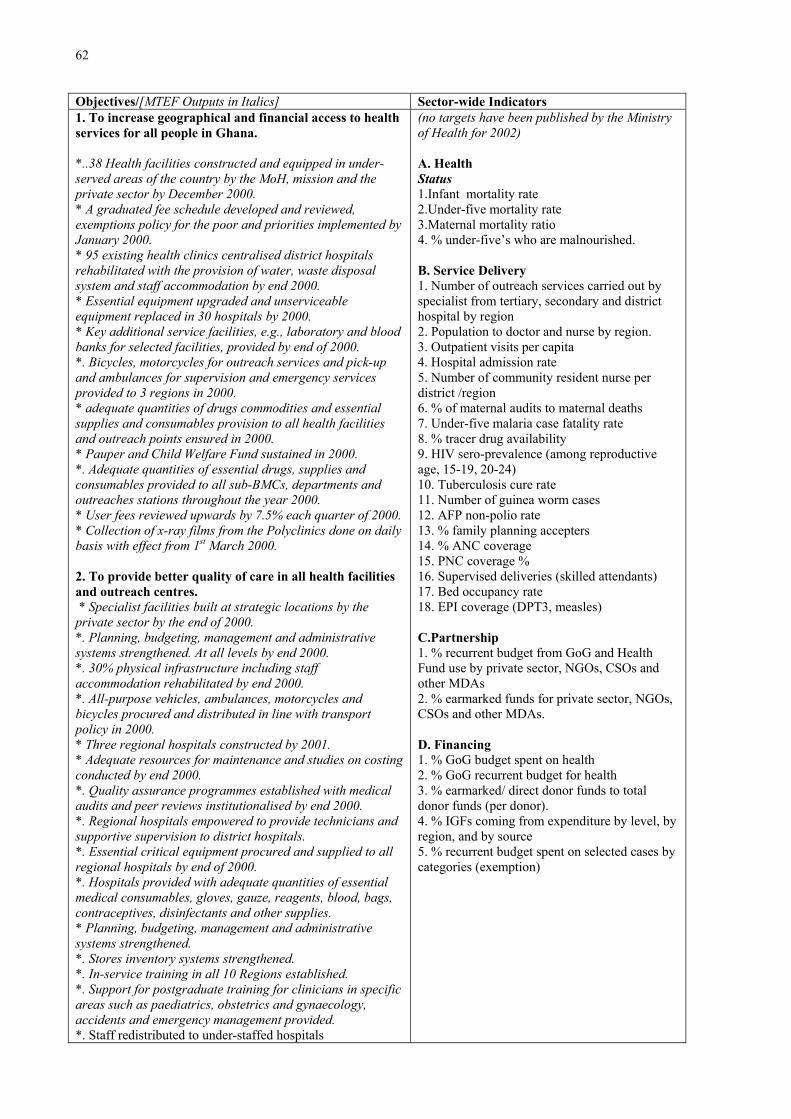
62
Objectives/[MTEF Outputs in Italics] Sector-wide Indicators 1. To increase geographical and financial access to health services for all people in Ghana.
*..38 Health facilities constructed and equipped in under-served areas of the country by the MoH, mission and the private sector by December 2000. * A graduated fee schedule developed and reviewed, exemptions policy for the poor and priorities implemented by January 2000. * 95 existing health clinics centralised district hospitals rehabilitated with the provision of water, waste disposal system and staff accommodation by end 2000. * Essential equipment upgraded and unserviceable equipment replaced in 30 hospitals by 2000. * Key additional service facilities, e.g., laboratory and blood banks for selected facilities, provided by end of 2000. *. Bicycles, motorcycles for outreach services and pick-up and ambulances for supervision and emergency services provided to 3 regions in 2000. * adequate quantities of drugs commodities and essential supplies and consumables provision to all health facilities and outreach points ensured in 2000. * Pauper and Child Welfare Fund sustained in 2000. *. Adequate quantities of essential drugs, supplies and consumables provided to all sub-BMCs, departments and outreaches stations throughout the year 2000. * User fees reviewed upwards by 7.5% each quarter of 2000. * Collection of x-ray films from the Polyclinics done on daily basis with effect from 1st March 2000.
2. To provide better quality of care in all health facilities and outreach centres. * Specialist facilities built at strategic locations by the private sector by the end of 2000. *. Planning, budgeting, management and administrative systems strengthened. At all levels by end 2000. *. 30% physical infrastructure including staff accommodation rehabilitated by end 2000. *. All-purpose vehicles, ambulances, motorcycles and bicycles procured and distributed in line with transport policy in 2000. * Three regional hospitals constructed by 2001. * Adequate resources for maintenance and studies on costing conducted by end 2000. *. Quality assurance programmes established with medical audits and peer reviews institutionalised by end 2000. *. Regional hospitals empowered to provide technicians and supportive supervision to district hospitals. *. Essential critical equipment procured and supplied to all regional hospitals by end of 2000. *. Hospitals provided with adequate quantities of essential medical consumables, gloves, gauze, reagents, blood, bags, contraceptives, disinfectants and other supplies. * Planning, budgeting, management and administrative systems strengthened. *. Stores inventory systems strengthened. *. In-service training in all 10 Regions established. *. Support for postgraduate training for clinicians in specific areas such as paediatrics, obstetrics and gynaecology, accidents and emergency management provided. *. Staff redistributed to under-staffed hospitals
(no targets have been published by the Ministry of Health for 2002)
A. Health Status1.Infant mortality rate 2.Under-five mortality rate 3.Maternal mortality ratio 4. % under-five’s who are malnourished.
B. Service Delivery 1. Number of outreach services carried out by specialist from tertiary, secondary and district hospital by region 2. Population to doctor and nurse by region. 3. Outpatient visits per capita 4. Hospital admission rate 5. Number of community resident nurse per district /region 6. % of maternal audits to maternal deaths 7. Under-five malaria case fatality rate 8. % tracer drug availability 9. HIV sero-prevalence (among reproductive age, 15-19, 20-24) 10. Tuberculosis cure rate 11. Number of guinea worm cases 12. AFP non-polio rate 13. % family planning accepters 14. % ANC coverage 15. PNC coverage % 16. Supervised deliveries (skilled attendants) 17. Bed occupancy rate 18. EPI coverage (DPT3, measles)
C.Partnership 1. % recurrent budget from GoG and Health Fund use by private sector, NGOs, CSOs and other MDAs 2. % earmarked funds for private sector, NGOs, CSOs and other MDAs.
D. Financing 1. % GoG budget spent on health 2. % GoG recurrent budget for health 3. % earmarked/ direct donor funds to total donor funds (per donor). 4. % IGFs coming from expenditure by level, by region, and by source 5. % recurrent budget spent on selected cases by categories (exemption)
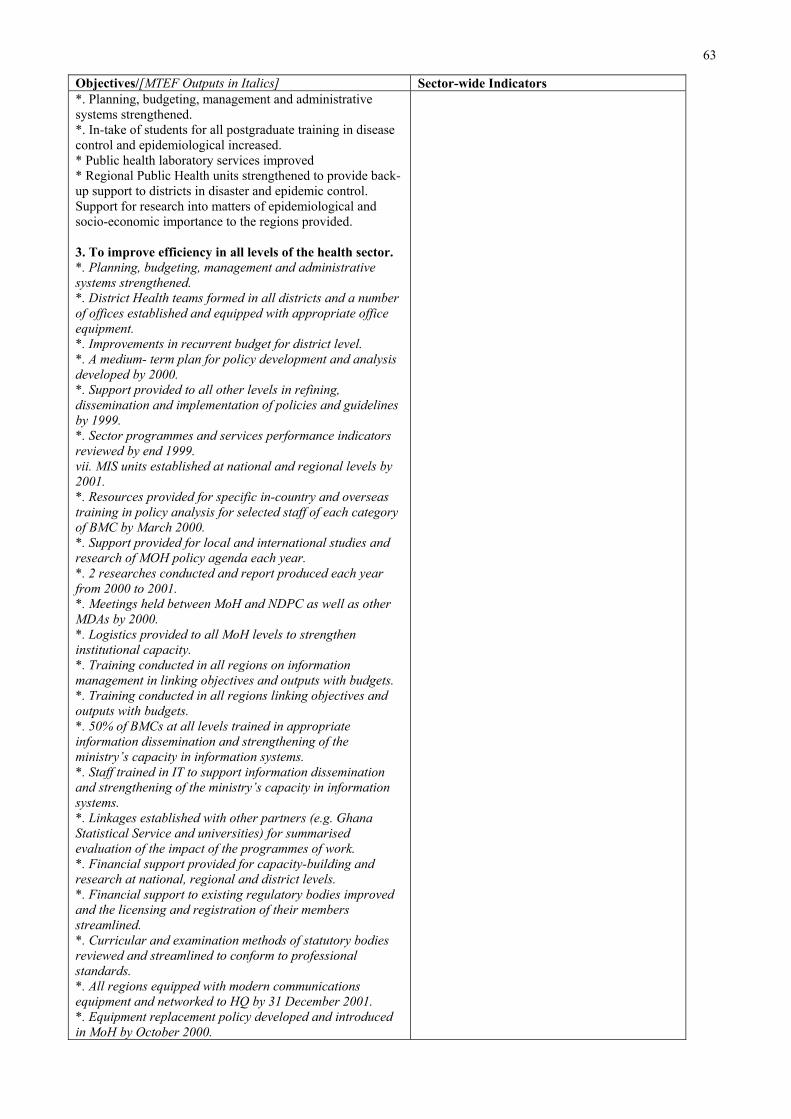
63
Objectives/[MTEF Outputs in Italics] Sector-wide Indicators *. Planning, budgeting, management and administrative systems strengthened. *. In-take of students for all postgraduate training in disease control and epidemiological increased. * Public health laboratory services improved * Regional Public Health units strengthened to provide back-up support to districts in disaster and epidemic control. Support for research into matters of epidemiological and socio-economic importance to the regions provided.
3. To improve efficiency in all levels of the health sector. *. Planning, budgeting, management and administrative systems strengthened. *. District Health teams formed in all districts and a number of offices established and equipped with appropriate office equipment. *. Improvements in recurrent budget for district level. *. A medium- term plan for policy development and analysis developed by 2000. *. Support provided to all other levels in refining, dissemination and implementation of policies and guidelines by 1999. *. Sector programmes and services performance indicators reviewed by end 1999. vii. MIS units established at national and regional levels by 2001. *. Resources provided for specific in-country and overseas training in policy analysis for selected staff of each category of BMC by March 2000. *. Support provided for local and international studies and research of MOH policy agenda each year. *. 2 researches conducted and report produced each year from 2000 to 2001. *. Meetings held between MoH and NDPC as well as other MDAs by 2000. *. Logistics provided to all MoH levels to strengthen institutional capacity. *. Training conducted in all regions on information management in linking objectives and outputs with budgets. *. Training conducted in all regions linking objectives and outputs with budgets. *. 50% of BMCs at all levels trained in appropriate information dissemination and strengthening of the ministry’s capacity in information systems. *. Staff trained in IT to support information dissemination and strengthening of the ministry’s capacity in information systems.*. Linkages established with other partners (e.g. Ghana Statistical Service and universities) for summarised evaluation of the impact of the programmes of work. *. Financial support provided for capacity-building and research at national, regional and district levels. *. Financial support to existing regulatory bodies improved and the licensing and registration of their members streamlined. *. Curricular and examination methods of statutory bodies reviewed and streamlined to conform to professional standards. *. All regions equipped with modern communications equipment and networked to HQ by 31 December 2001. *. Equipment replacement policy developed and introduced in MoH by October 2000.
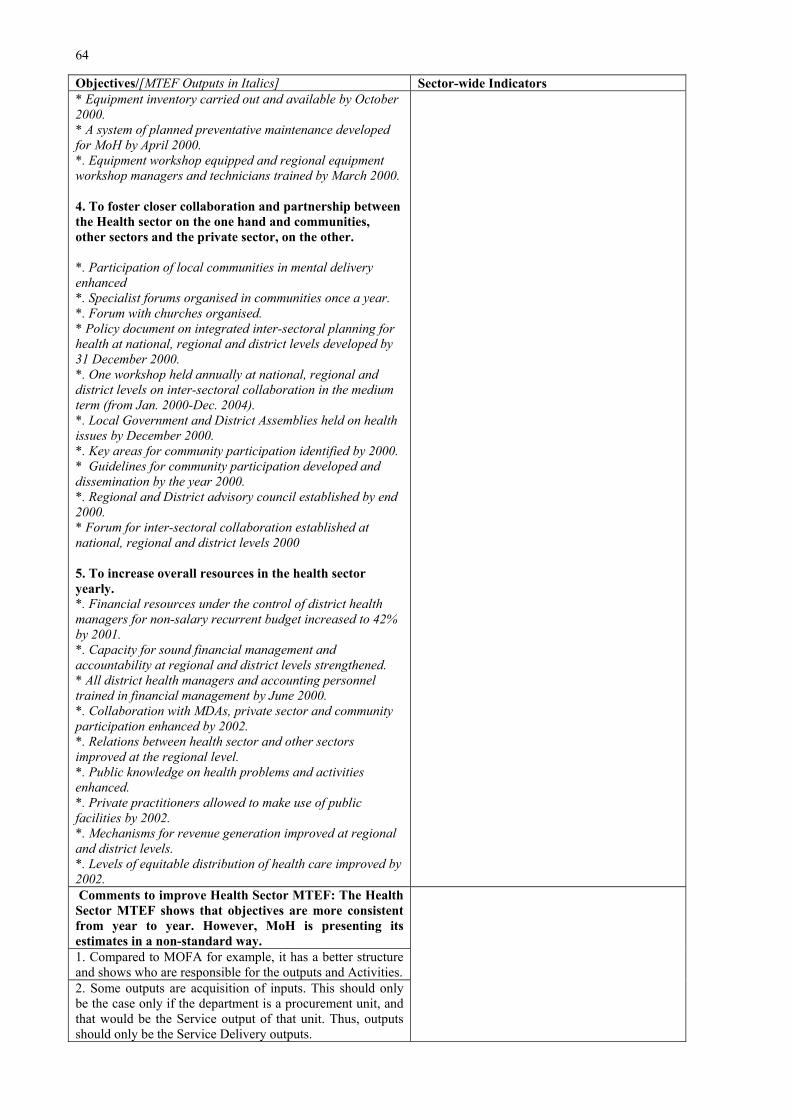
64
Objectives/[MTEF Outputs in Italics] Sector-wide Indicators * Equipment inventory carried out and available by October 2000. * A system of planned preventative maintenance developed for MoH by April 2000. *. Equipment workshop equipped and regional equipment workshop managers and technicians trained by March 2000.
4. To foster closer collaboration and partnership between the Health sector on the one hand and communities, other sectors and the private sector, on the other.
*. Participation of local communities in mental delivery enhanced*. Specialist forums organised in communities once a year. *. Forum with churches organised. * Policy document on integrated inter-sectoral planning for health at national, regional and district levels developed by 31 December 2000. *. One workshop held annually at national, regional and district levels on inter-sectoral collaboration in the medium term (from Jan. 2000-Dec. 2004). *. Local Government and District Assemblies held on health issues by December 2000. *. Key areas for community participation identified by 2000. * Guidelines for community participation developed and dissemination by the year 2000. *. Regional and District advisory council established by end 2000. * Forum for inter-sectoral collaboration established at national, regional and district levels 2000
5. To increase overall resources in the health sector yearly. *. Financial resources under the control of district health managers for non-salary recurrent budget increased to 42% by 2001. *. Capacity for sound financial management and accountability at regional and district levels strengthened. * All district health managers and accounting personnel trained in financial management by June 2000. *. Collaboration with MDAs, private sector and community participation enhanced by 2002. *. Relations between health sector and other sectors improved at the regional level. *. Public knowledge on health problems and activities enhanced.*. Private practitioners allowed to make use of public facilities by 2002. *. Mechanisms for revenue generation improved at regional and district levels. *. Levels of equitable distribution of health care improved by 2002. Comments to improve Health Sector MTEF: The Health Sector MTEF shows that objectives are more consistent from year to year. However, MoH is presenting its estimates in a non-standard way. 1. Compared to MOFA for example, it has a better structure and shows who are responsible for the outputs and Activities. 2. Some outputs are acquisition of inputs. This should only be the case only if the department is a procurement unit, and that would be the Service output of that unit. Thus, outputs should only be the Service Delivery outputs.
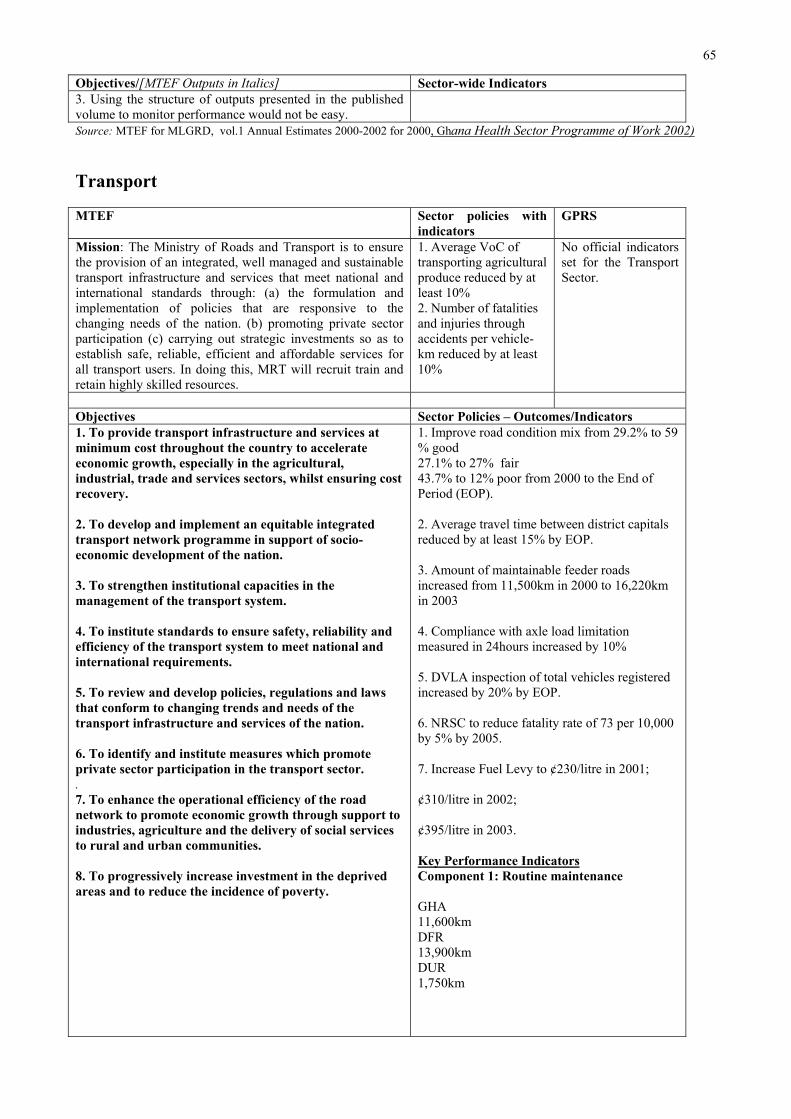
65
Objectives/[MTEF Outputs in Italics] Sector-wide Indicators 3. Using the structure of outputs presented in the published volume to monitor performance would not be easy. Source: MTEF for MLGRD, vol.1 Annual Estimates 2000-2002 for 2000, Ghana Health Sector Programme of Work 2002)
Transport
MTEF Sector policies with indicators
GPRS
Mission: The Ministry of Roads and Transport is to ensure the provision of an integrated, well managed and sustainable transport infrastructure and services that meet national and international standards through: (a) the formulation and implementation of policies that are responsive to the changing needs of the nation. (b) promoting private sector participation (c) carrying out strategic investments so as to establish safe, reliable, efficient and affordable services for all transport users. In doing this, MRT will recruit train and retain highly skilled resources.
1. Average VoC of transporting agricultural produce reduced by at least 10% 2. Number of fatalities and injuries through accidents per vehicle-km reduced by at least 10%
No official indicators set for the Transport Sector.
Objectives Sector Policies – Outcomes/Indicators 1. To provide transport infrastructure and services at minimum cost throughout the country to accelerate economic growth, especially in the agricultural, industrial, trade and services sectors, whilst ensuring cost recovery.
2. To develop and implement an equitable integrated transport network programme in support of socio-economic development of the nation.
3. To strengthen institutional capacities in the management of the transport system.
4. To institute standards to ensure safety, reliability and efficiency of the transport system to meet national and international requirements.
5. To review and develop policies, regulations and laws that conform to changing trends and needs of the transport infrastructure and services of the nation.
6. To identify and institute measures which promote private sector participation in the transport sector..7. To enhance the operational efficiency of the road network to promote economic growth through support to industries, agriculture and the delivery of social services to rural and urban communities.
8. To progressively increase investment in the deprived areas and to reduce the incidence of poverty.
1. Improve road condition mix from 29.2% to 59 % good 27.1% to 27% fair 43.7% to 12% poor from 2000 to the End of Period (EOP).
2. Average travel time between district capitals reduced by at least 15% by EOP.
3. Amount of maintainable feeder roads increased from 11,500km in 2000 to 16,220km in 2003
4. Compliance with axle load limitation measured in 24hours increased by 10%
5. DVLA inspection of total vehicles registered increased by 20% by EOP.
6. NRSC to reduce fatality rate of 73 per 10,000 by 5% by 2005.
7. Increase Fuel Levy to ¢230/litre in 2001;
¢310/litre in 2002;
¢395/litre in 2003.
Key Performance IndicatorsComponent 1: Routine maintenance
GHA 11,600km DFR13,900km DUR1,750km
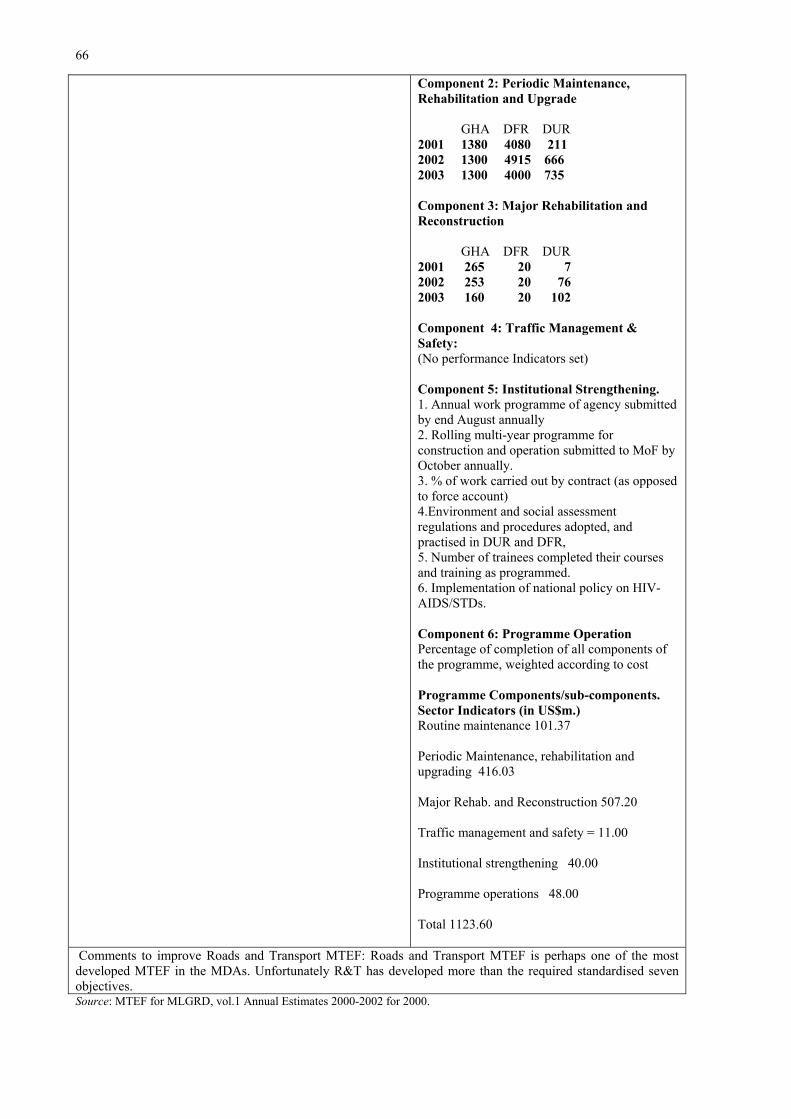
66
Component 2: Periodic Maintenance, Rehabilitation and Upgrade GHA DFR DUR 2001 1380 4080 211 2002 1300 4915 666 2003 1300 4000 735
Component 3: Major Rehabilitation and Reconstruction
GHA DFR DUR 2001 265 20 7 2002 253 20 76 2003 160 20 102
Component 4: Traffic Management & Safety:(No performance Indicators set)
Component 5: Institutional Strengthening. 1. Annual work programme of agency submitted by end August annually 2. Rolling multi-year programme for construction and operation submitted to MoF by October annually. 3. % of work carried out by contract (as opposed to force account) 4.Environment and social assessment regulations and procedures adopted, and practised in DUR and DFR, 5. Number of trainees completed their courses and training as programmed. 6. Implementation of national policy on HIV-AIDS/STDs.
Component 6: Programme OperationPercentage of completion of all components of the programme, weighted according to cost
Programme Components/sub-components. Sector Indicators (in US$m.) Routine maintenance 101.37
Periodic Maintenance, rehabilitation and upgrading 416.03
Major Rehab. and Reconstruction 507.20
Traffic management and safety = 11.00
Institutional strengthening 40.00
Programme operations 48.00
Total 1123.60
Comments to improve Roads and Transport MTEF: Roads and Transport MTEF is perhaps one of the most developed MTEF in the MDAs. Unfortunately R&T has developed more than the required standardised seven objectives. Source: MTEF for MLGRD, vol.1 Annual Estimates 2000-2002 for 2000.
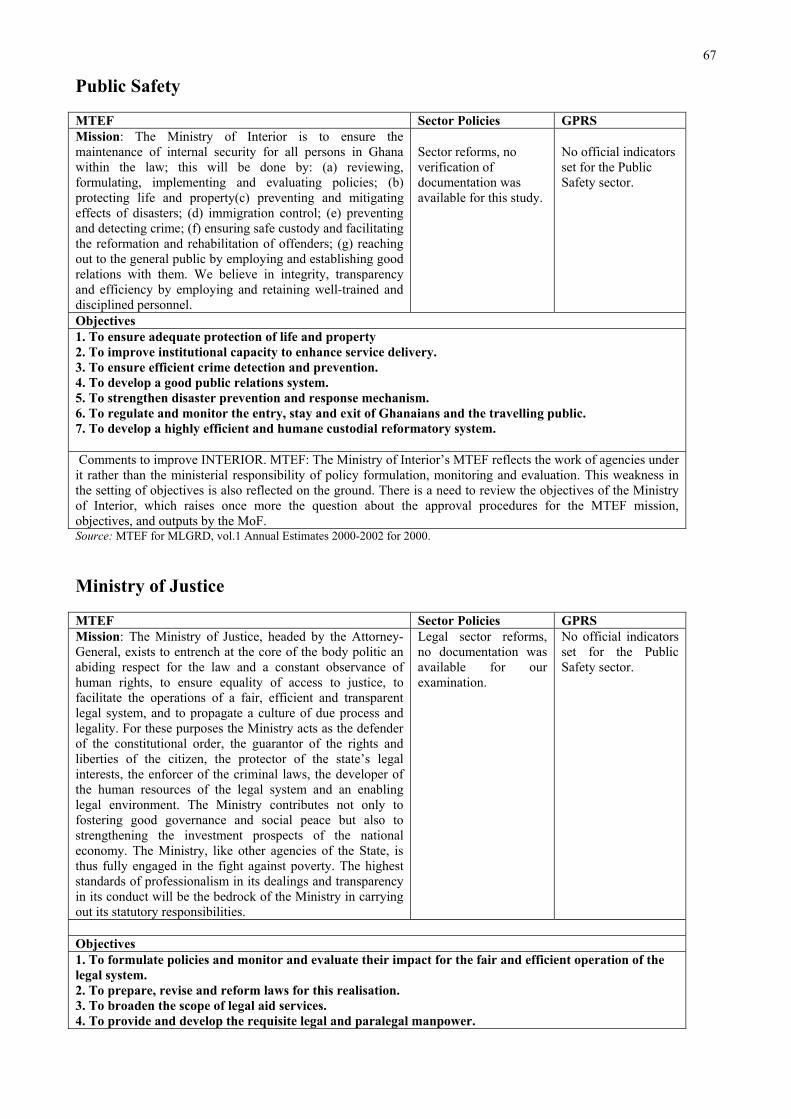
67
Public Safety
MTEF Sector Policies GPRS Mission: The Ministry of Interior is to ensure the maintenance of internal security for all persons in Ghana within the law; this will be done by: (a) reviewing, formulating, implementing and evaluating policies; (b) protecting life and property(c) preventing and mitigating effects of disasters; (d) immigration control; (e) preventing and detecting crime; (f) ensuring safe custody and facilitating the reformation and rehabilitation of offenders; (g) reaching out to the general public by employing and establishing good relations with them. We believe in integrity, transparency and efficiency by employing and retaining well-trained and disciplined personnel.
Sector reforms, no verification of documentation was available for this study.
No official indicators set for the Public Safety sector.
Objectives1. To ensure adequate protection of life and property 2. To improve institutional capacity to enhance service delivery. 3. To ensure efficient crime detection and prevention. 4. To develop a good public relations system. 5. To strengthen disaster prevention and response mechanism. 6. To regulate and monitor the entry, stay and exit of Ghanaians and the travelling public. 7. To develop a highly efficient and humane custodial reformatory system.
Comments to improve INTERIOR. MTEF: The Ministry of Interior’s MTEF reflects the work of agencies under it rather than the ministerial responsibility of policy formulation, monitoring and evaluation. This weakness in the setting of objectives is also reflected on the ground. There is a need to review the objectives of the Ministry of Interior, which raises once more the question about the approval procedures for the MTEF mission, objectives, and outputs by the MoF. Source: MTEF for MLGRD, vol.1 Annual Estimates 2000-2002 for 2000.
Ministry of Justice
MTEF Sector Policies GPRS Mission: The Ministry of Justice, headed by the Attorney-General, exists to entrench at the core of the body politic an abiding respect for the law and a constant observance of human rights, to ensure equality of access to justice, to facilitate the operations of a fair, efficient and transparent legal system, and to propagate a culture of due process and legality. For these purposes the Ministry acts as the defender of the constitutional order, the guarantor of the rights and liberties of the citizen, the protector of the state’s legal interests, the enforcer of the criminal laws, the developer of the human resources of the legal system and an enabling legal environment. The Ministry contributes not only to fostering good governance and social peace but also to strengthening the investment prospects of the national economy. The Ministry, like other agencies of the State, is thus fully engaged in the fight against poverty. The highest standards of professionalism in its dealings and transparency in its conduct will be the bedrock of the Ministry in carrying out its statutory responsibilities.
Legal sector reforms, no documentation was available for our examination.
No official indicators set for the Public Safety sector.
Objectives1. To formulate policies and monitor and evaluate their impact for the fair and efficient operation of the legal system. 2. To prepare, revise and reform laws for this realisation. 3. To broaden the scope of legal aid services. 4. To provide and develop the requisite legal and paralegal manpower.
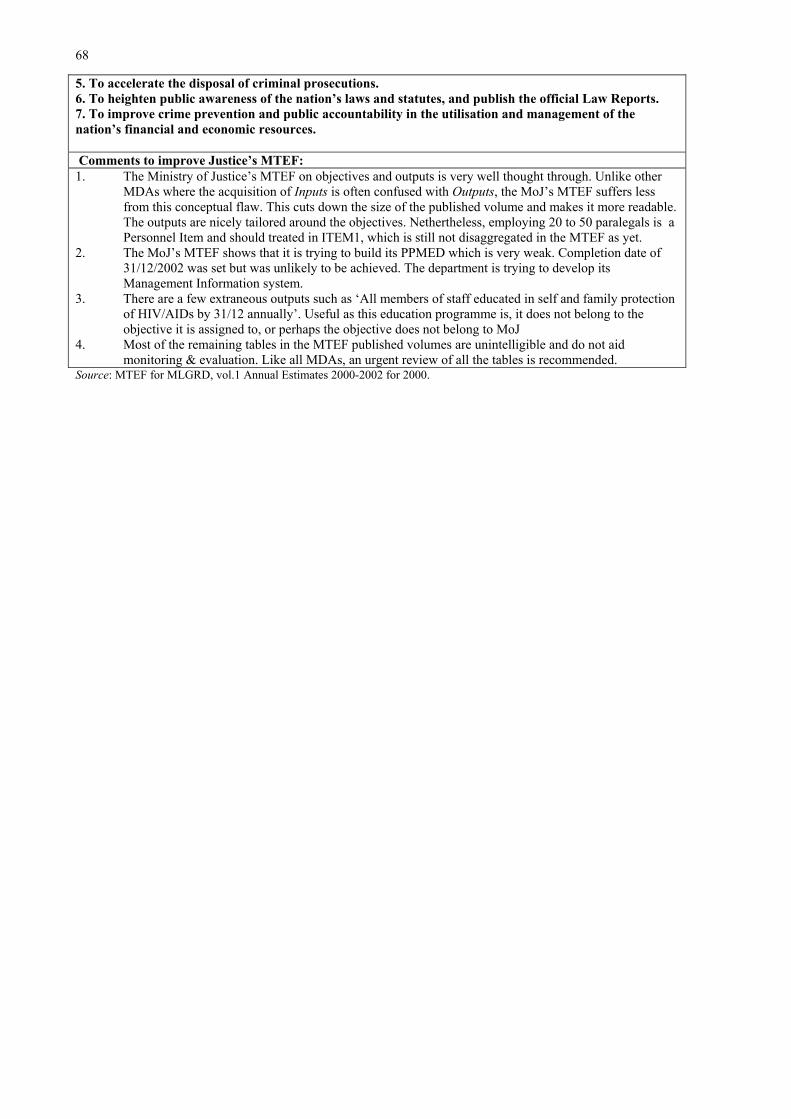
68
5. To accelerate the disposal of criminal prosecutions. 6. To heighten public awareness of the nation’s laws and statutes, and publish the official Law Reports. 7. To improve crime prevention and public accountability in the utilisation and management of the nation’s financial and economic resources.
Comments to improve Justice’s MTEF: 1. The Ministry of Justice’s MTEF on objectives and outputs is very well thought through. Unlike other
MDAs where the acquisition of Inputs is often confused with Outputs, the MoJ’s MTEF suffers less from this conceptual flaw. This cuts down the size of the published volume and makes it more readable. The outputs are nicely tailored around the objectives. Nethertheless, employing 20 to 50 paralegals is a Personnel Item and should treated in ITEM1, which is still not disaggregated in the MTEF as yet.
2. The MoJ’s MTEF shows that it is trying to build its PPMED which is very weak. Completion date of 31/12/2002 was set but was unlikely to be achieved. The department is trying to develop its Management Information system.
3. There are a few extraneous outputs such as ‘All members of staff educated in self and family protection of HIV/AIDs by 31/12 annually’. Useful as this education programme is, it does not belong to the objective it is assigned to, or perhaps the objective does not belong to MoJ
4. Most of the remaining tables in the MTEF published volumes are unintelligible and do not aid monitoring & evaluation. Like all MDAs, an urgent review of all the tables is recommended.
Source: MTEF for MLGRD, vol.1 Annual Estimates 2000-2002 for 2000.
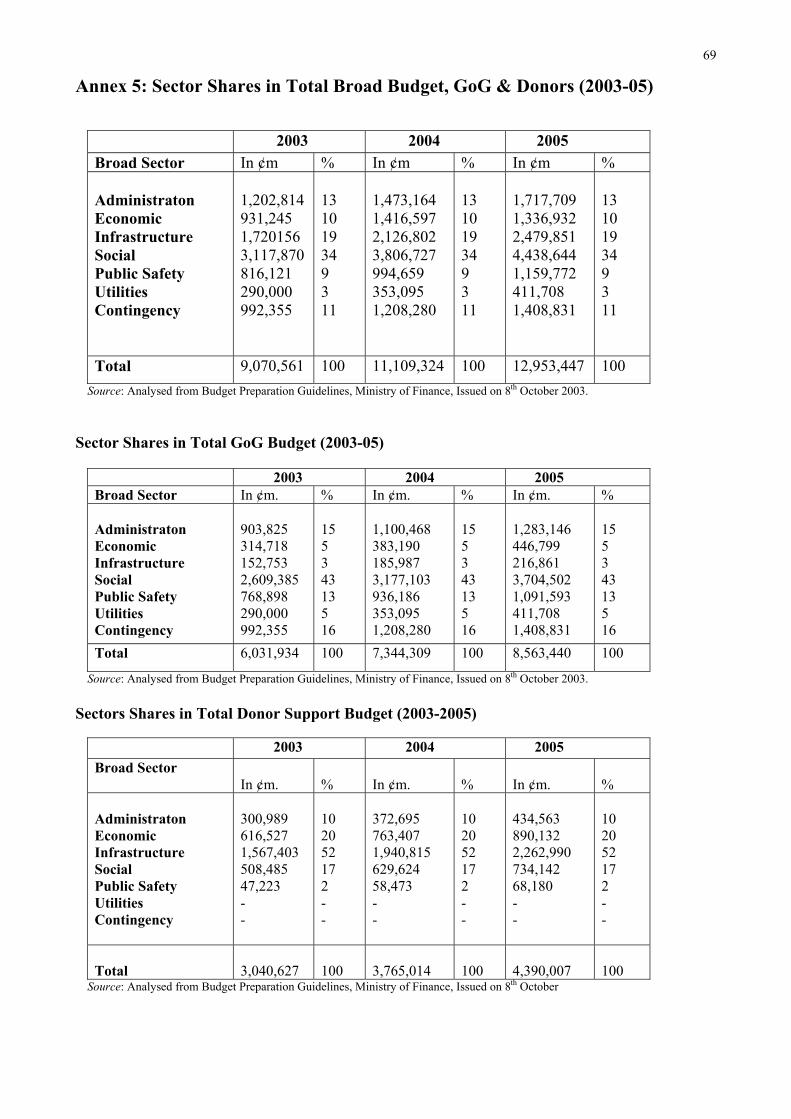
69
Annex 5: Sector Shares in Total Broad Budget, GoG & Donors (2003-05)
2003 2004 2005 Broad Sector In ¢m % In ¢m % In ¢m %
Administraton EconomicInfrastructure SocialPublic Safety Utilities Contingency
1,202,814931,2451,7201563,117,870816,121290,000992,355
131019349311
1,473,1641,416,5972,126,8023,806,727994,659353,0951,208,280
131019349311
1,717,7091,336,9322,479,8514,438,6441,159,772411,7081,408,831
131019349311
Total 9,070,561 100 11,109,324 100 12,953,447 100 Source: Analysed from Budget Preparation Guidelines, Ministry of Finance, Issued on 8th October 2003.
Sector Shares in Total GoG Budget (2003-05)
2003 2004 2005 Broad Sector In ¢m. % In ¢m. % In ¢m. %
Administraton Economic InfrastructureSocialPublic Safety UtilitiesContingency
903,825 314,718 152,753 2,609,385 768,898 290,000 992,355
15534313516
1,100,468 383,190 185,987 3,177,103 936,186 353,095 1,208,280
15534313516
1,283,146 446,799 216,861 3,704,502 1,091,593 411,708 1,408,831
15534313516
Total 6,031,934 100 7,344,309 100 8,563,440 100
Source: Analysed from Budget Preparation Guidelines, Ministry of Finance, Issued on 8th October 2003.
Sectors Shares in Total Donor Support Budget (2003-2005)
2003 2004 2005 Broad Sector
In ¢m. % In ¢m. % In ¢m. %
Administraton Economic InfrastructureSocialPublic Safety UtilitiesContingency
300,989 616,527 1,567,403 508,485 47,223 --
102052172--
372,695 763,407 1,940,815 629,624 58,473 --
102052172--
434,563 890,132 2,262,990 734,142 68,180 --
102052172--
Total 3,040,627 100 3,765,014 100 4,390,007 100Source: Analysed from Budget Preparation Guidelines, Ministry of Finance, Issued on 8th October
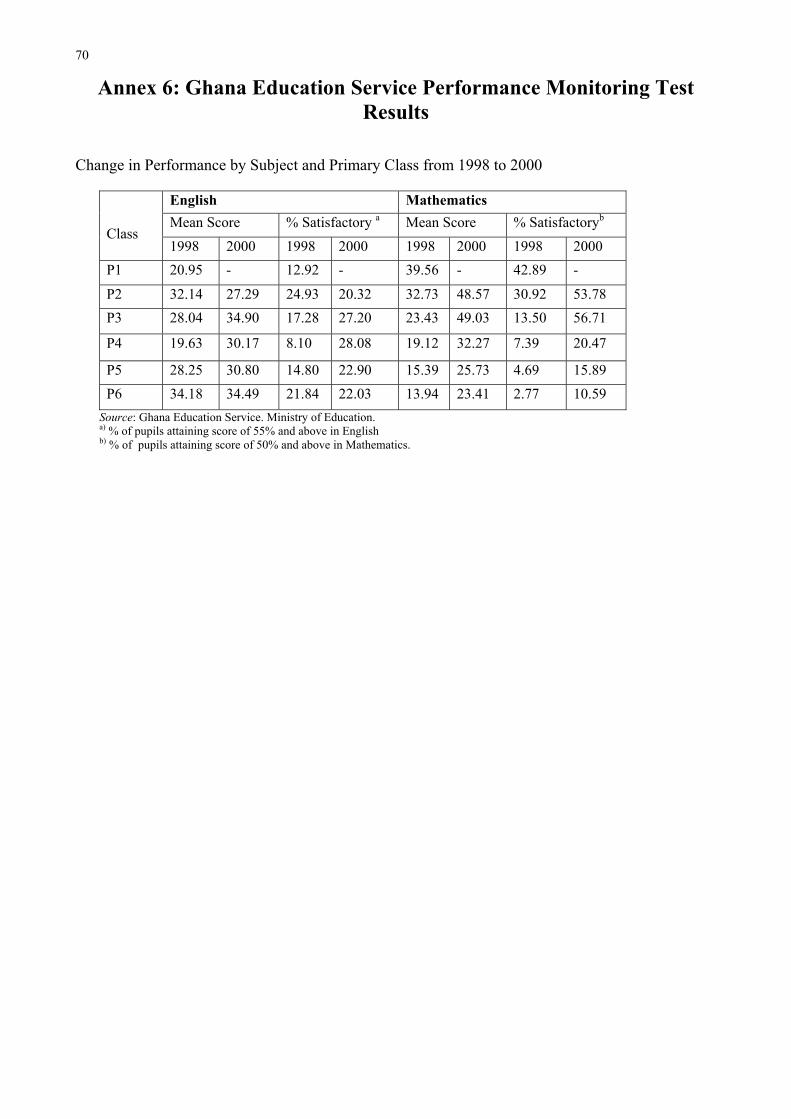
70
Annex 6: Ghana Education Service Performance Monitoring Test Results
Change in Performance by Subject and Primary Class from 1998 to 2000
English Mathematics Mean Score % Satisfactory a Mean Score % Satisfactoryb
Class1998 2000 1998 2000 1998 2000 1998 2000
P1 20.95 - 12.92 - 39.56 - 42.89 -
P2 32.14 27.29 24.93 20.32 32.73 48.57 30.92 53.78 P3 28.04 34.90 17.28 27.20 23.43 49.03 13.50 56.71
P4 19.63 30.17 8.10 28.08 19.12 32.27 7.39 20.47
P5 28.25 30.80 14.80 22.90 15.39 25.73 4.69 15.89 P6 34.18 34.49 21.84 22.03 13.94 23.41 2.77 10.59
Source: Ghana Education Service. Ministry of Education. a) % of pupils attaining score of 55% and above in English b) % of pupils attaining score of 50% and above in Mathematics.
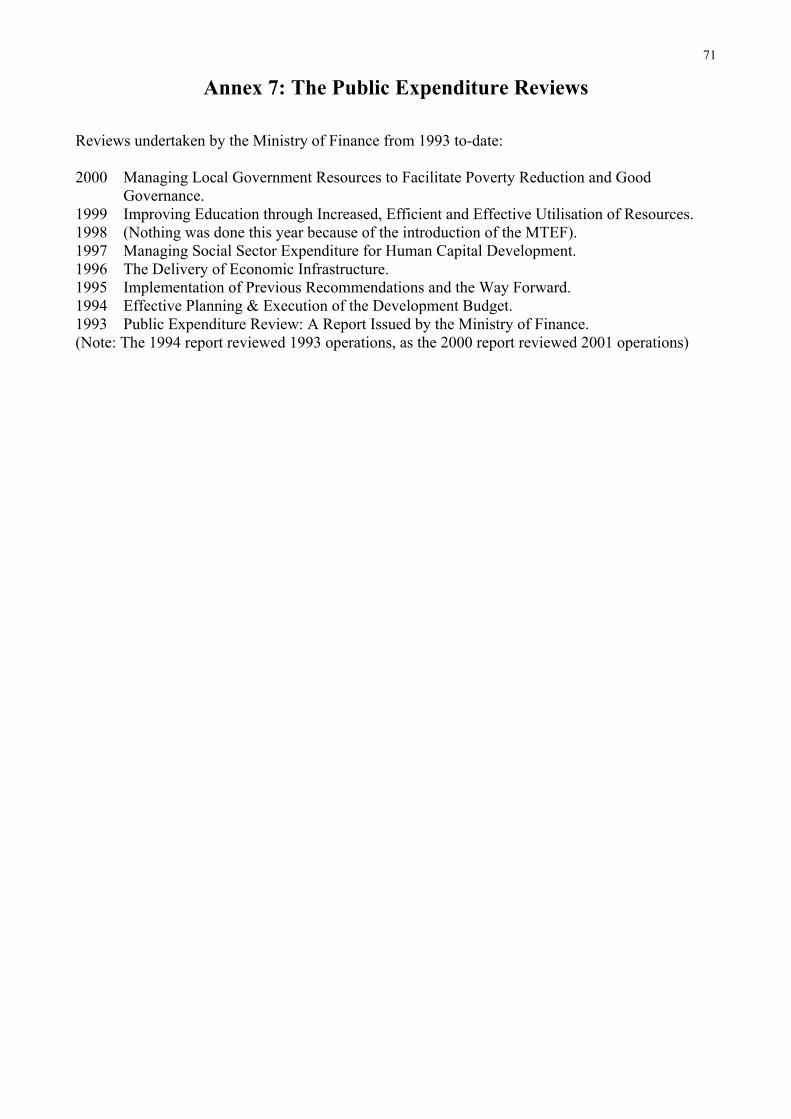
71
Annex 7: The Public Expenditure Reviews
Reviews undertaken by the Ministry of Finance from 1993 to-date:
2000 Managing Local Government Resources to Facilitate Poverty Reduction and Good Governance.
1999 Improving Education through Increased, Efficient and Effective Utilisation of Resources. 1998 (Nothing was done this year because of the introduction of the MTEF).1997 Managing Social Sector Expenditure for Human Capital Development. 1996 The Delivery of Economic Infrastructure. 1995 Implementation of Previous Recommendations and the Way Forward. 1994 Effective Planning & Execution of the Development Budget. 1993 Public Expenditure Review: A Report Issued by the Ministry of Finance. (Note: The 1994 report reviewed 1993 operations, as the 2000 report reviewed 2001 operations)