Embed Size (px)
Citation preview
Public Accounts and Estimates Committee: 2012-13 Financial and Performance Outcomes - General Questionnaire
Department of Premier and Cabinet 1
PUBLIC ACCOUNTS AND ESTIMATES COMMITTEE
2012-13 FINANCIAL AND PERFORMANCE OUTCOMES GENERAL QUESTIONNAIRE
DEPARTMENT OF PREMIER AND CABINET
EMAIL RCVD PAEC 08/11/2013
Public Accounts and Estimates Committee: 2012-13 Financial and Performance Outcomes - General Questionnaire
Department of Premier and Cabinet 2
SECTION A: Output variations and performance measures
Question 1
Please provide copies of all of your department’s/agency’s annual plans, business plans, strategic plans, corporate plans or similar relating to 2012-13 (these
are requested in accordance with Section 28(1) of the Parliamentary Committees Act 2003) unless they are online. If they are online, please specify the
document name and web address:
Document Web address:
DPC is currently undergoing an internal planning process. The department’s corporate plan will be based on the objectives, indicators and outputs outlined in Budget Paper 3, page 201.
http://www.dtf.vic.gov.au/Publications/State-Budget-publications/Budget-Paper-No-3-Service-Delivery
Question 2
Regarding the use of the performance measures in the budget papers relating to your department/agency:
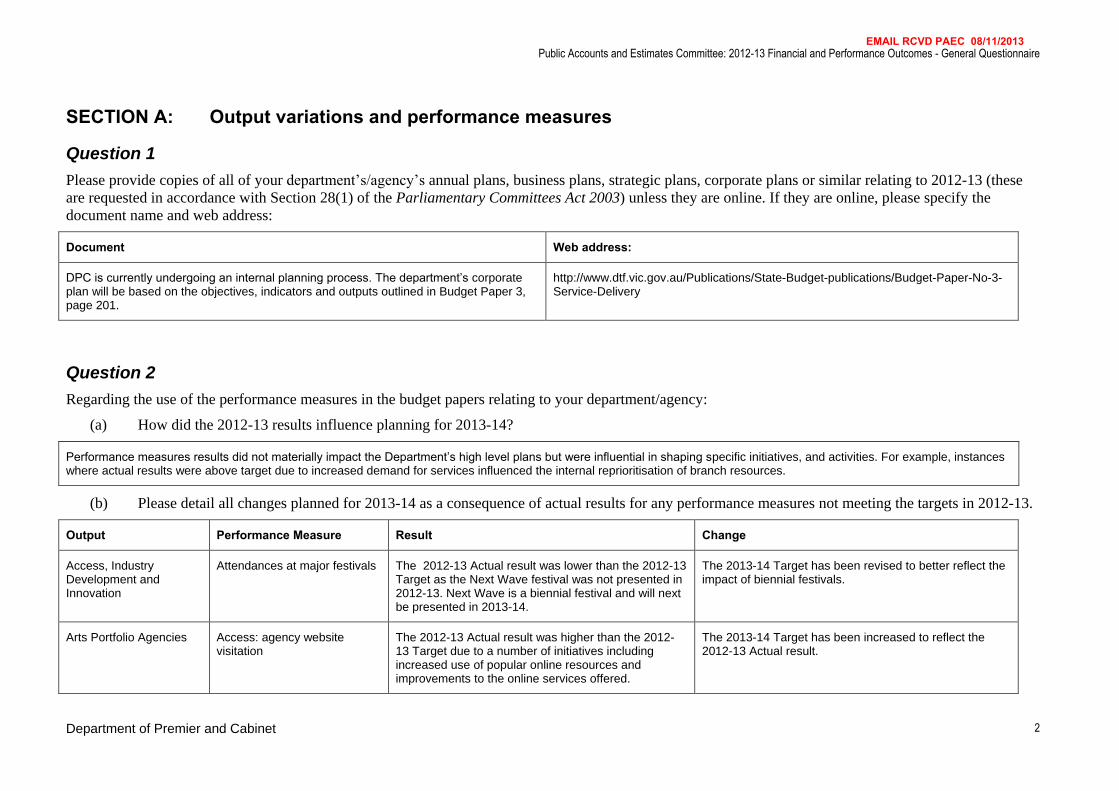
(a) How did the 2012-13 results influence planning for 2013-14?
Performance measures results did not materially impact the Department’s high level plans but were influential in shaping specific initiatives, and activities. For example, instances where actual results were above target due to increased demand for services influenced the internal reprioritisation of branch resources.
(b) Please detail all changes planned for 2013-14 as a consequence of actual results for any performance measures not meeting the targets in 2012-13.
Output Performance Measure Result Change
Access, Industry Development and Innovation
Attendances at major festivals The 2012-13 Actual result was lower than the 2012-13 Target as the Next Wave festival was not presented in 2012-13. Next Wave is a biennial festival and will next be presented in 2013-14.
The 2013-14 Target has been revised to better reflect the impact of biennial festivals.
Arts Portfolio Agencies Access: agency website visitation
The 2012-13 Actual result was higher than the 2012-13 Target due to a number of initiatives including increased use of popular online resources and improvements to the online services offered.
The 2013-14 Target has been increased to reflect the 2012-13 Actual result.
EMAIL RCVD PAEC 08/11/2013
Public Accounts and Estimates Committee: 2012-13 Financial and Performance Outcomes - General Questionnaire
Department of Premier and Cabinet 3
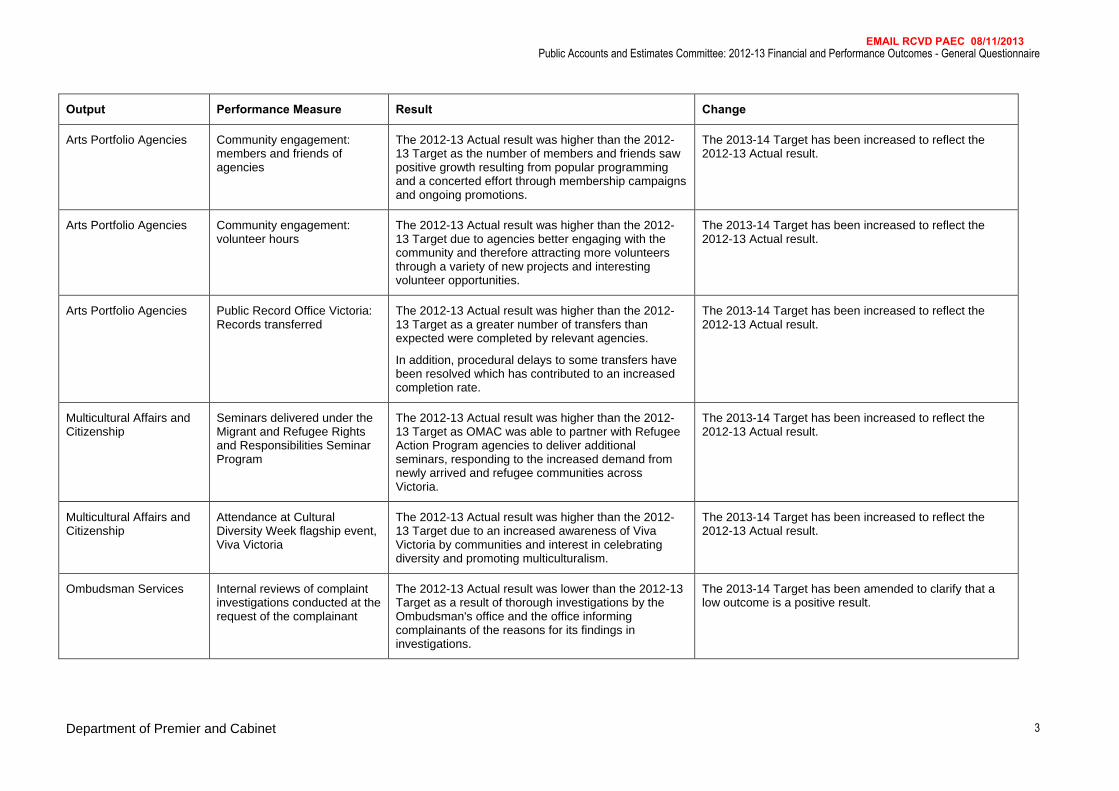
Output Performance Measure Result Change
Arts Portfolio Agencies Community engagement: members and friends of agencies
The 2012-13 Actual result was higher than the 2012-13 Target as the number of members and friends saw positive growth resulting from popular programming and a concerted effort through membership campaigns and ongoing promotions.
The 2013-14 Target has been increased to reflect the 2012-13 Actual result.
Arts Portfolio Agencies Community engagement: volunteer hours
The 2012-13 Actual result was higher than the 2012-13 Target due to agencies better engaging with the community and therefore attracting more volunteers through a variety of new projects and interesting volunteer opportunities.
The 2013-14 Target has been increased to reflect the 2012-13 Actual result.
Arts Portfolio Agencies Public Record Office Victoria: Records transferred
The 2012-13 Actual result was higher than the 2012-13 Target as a greater number of transfers than expected were completed by relevant agencies.
In addition, procedural delays to some transfers have been resolved which has contributed to an increased completion rate.
The 2013-14 Target has been increased to reflect the 2012-13 Actual result.
Multicultural Affairs and Citizenship
Seminars delivered under the Migrant and Refugee Rights and Responsibilities Seminar Program
The 2012-13 Actual result was higher than the 2012-13 Target as OMAC was able to partner with Refugee Action Program agencies to deliver additional seminars, responding to the increased demand from newly arrived and refugee communities across Victoria.
The 2013-14 Target has been increased to reflect the 2012-13 Actual result.
Multicultural Affairs and Citizenship
Attendance at Cultural Diversity Week flagship event, Viva Victoria
The 2012-13 Actual result was higher than the 2012-13 Target due to an increased awareness of Viva Victoria by communities and interest in celebrating diversity and promoting multiculturalism.
The 2013-14 Target has been increased to reflect the 2012-13 Actual result.
Ombudsman Services Internal reviews of complaint investigations conducted at the request of the complainant
The 2012-13 Actual result was lower than the 2012-13 Target as a result of thorough investigations by the Ombudsman's office and the office informing complainants of the reasons for its findings in investigations.
The 2013-14 Target has been amended to clarify that a low outcome is a positive result.
EMAIL RCVD PAEC 08/11/2013
Public Accounts and Estimates Committee: 2012-13 Financial and Performance Outcomes - General Questionnaire
Department of Premier and Cabinet 4
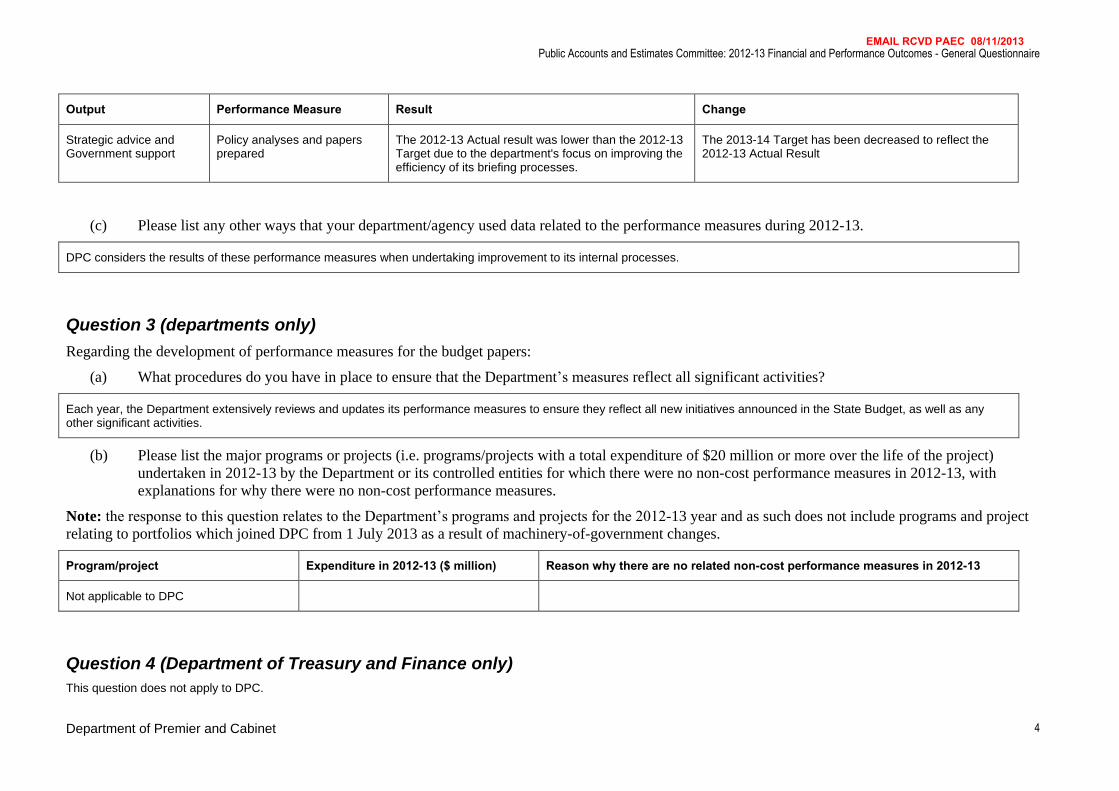
Output Performance Measure Result Change
Strategic advice and Government support
Policy analyses and papers prepared
The 2012-13 Actual result was lower than the 2012-13 Target due to the department's focus on improving the efficiency of its briefing processes.
The 2013-14 Target has been decreased to reflect the 2012-13 Actual Result
(c) Please list any other ways that your department/agency used data related to the performance measures during 2012-13.
DPC considers the results of these performance measures when undertaking improvement to its internal processes.
Question 3 (departments only)
Regarding the development of performance measures for the budget papers:
(a) What procedures do you have in place to ensure that the Department’s measures reflect all significant activities?
Each year, the Department extensively reviews and updates its performance measures to ensure they reflect all new initiatives announced in the State Budget, as well as any other significant activities.
(b) Please list the major programs or projects (i.e. programs/projects with a total expenditure of $20 million or more over the life of the project)
undertaken in 2012-13 by the Department or its controlled entities for which there were no non-cost performance measures in 2012-13, with
explanations for why there were no non-cost performance measures.
Note: the response to this question relates to the Department’s programs and projects for the 2012-13 year and as such does not include programs and project
relating to portfolios which joined DPC from 1 July 2013 as a result of machinery-of-government changes.
Program/project Expenditure in 2012-13 ($ million) Reason why there are no related non-cost performance measures in 2012-13
Not applicable to DPC
Question 4 (Department of Treasury and Finance only)
This question does not apply to DPC.
EMAIL RCVD PAEC 08/11/2013
Public Accounts and Estimates Committee: 2012-13 Financial and Performance Outcomes - General Questionnaire
Department of Premier and Cabinet 5
SECTION B: Asset investment (departments only)
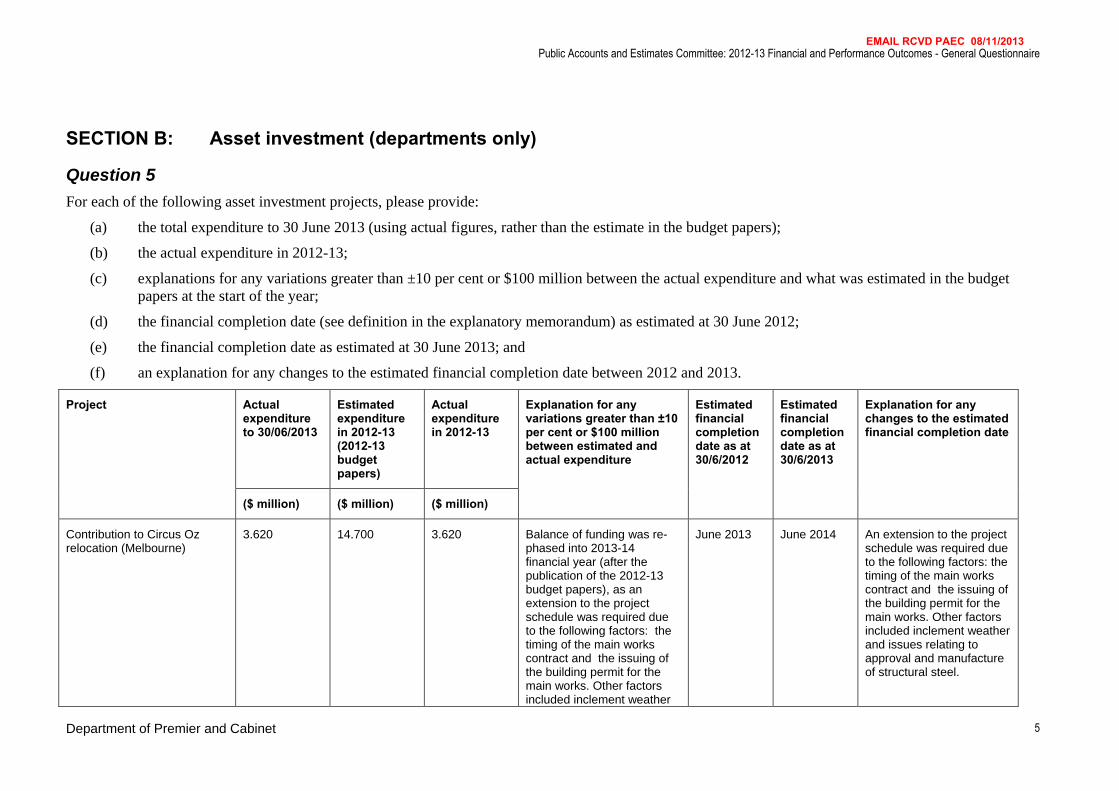
Question 5
For each of the following asset investment projects, please provide:
(a) the total expenditure to 30 June 2013 (using actual figures, rather than the estimate in the budget papers);
(b) the actual expenditure in 2012-13;
(c) explanations for any variations greater than ±10 per cent or $100 million between the actual expenditure and what was estimated in the budget
papers at the start of the year;
(d) the financial completion date (see definition in the explanatory memorandum) as estimated at 30 June 2012;
(e) the financial completion date as estimated at 30 June 2013; and
(f) an explanation for any changes to the estimated financial completion date between 2012 and 2013.
Project Actual expenditure to 30/06/2013
Estimated expenditure in 2012-13 (2012-13 budget papers)
Actual expenditure in 2012-13
Explanation for any variations greater than ±10 per cent or $100 million between estimated and actual expenditure
Estimated financial completion date as at 30/6/2012
Estimated financial completion date as at 30/6/2013
Explanation for any changes to the estimated financial completion date
($ million) ($ million) ($ million)
Contribution to Circus Oz relocation (Melbourne)
3.620 14.700 3.620 Balance of funding was re-phased into 2013-14 financial year (after the publication of the 2012-13 budget papers), as an extension to the project schedule was required due to the following factors: the timing of the main works contract and the issuing of the building permit for the main works. Other factors included inclement weather
June 2013 June 2014 An extension to the project schedule was required due to the following factors: the timing of the main works contract and the issuing of the building permit for the main works. Other factors included inclement weather and issues relating to approval and manufacture of structural steel.
EMAIL RCVD PAEC 08/11/2013
Public Accounts and Estimates Committee: 2012-13 Financial and Performance Outcomes - General Questionnaire
Department of Premier and Cabinet 6
Project Actual expenditure to 30/06/2013
Estimated expenditure in 2012-13 (2012-13 budget papers)
Actual expenditure in 2012-13
Explanation for any variations greater than ±10 per cent or $100 million between estimated and actual expenditure
Estimated financial completion date as at 30/6/2012
Estimated financial completion date as at 30/6/2013
Explanation for any changes to the estimated financial completion date
($ million) ($ million) ($ million)
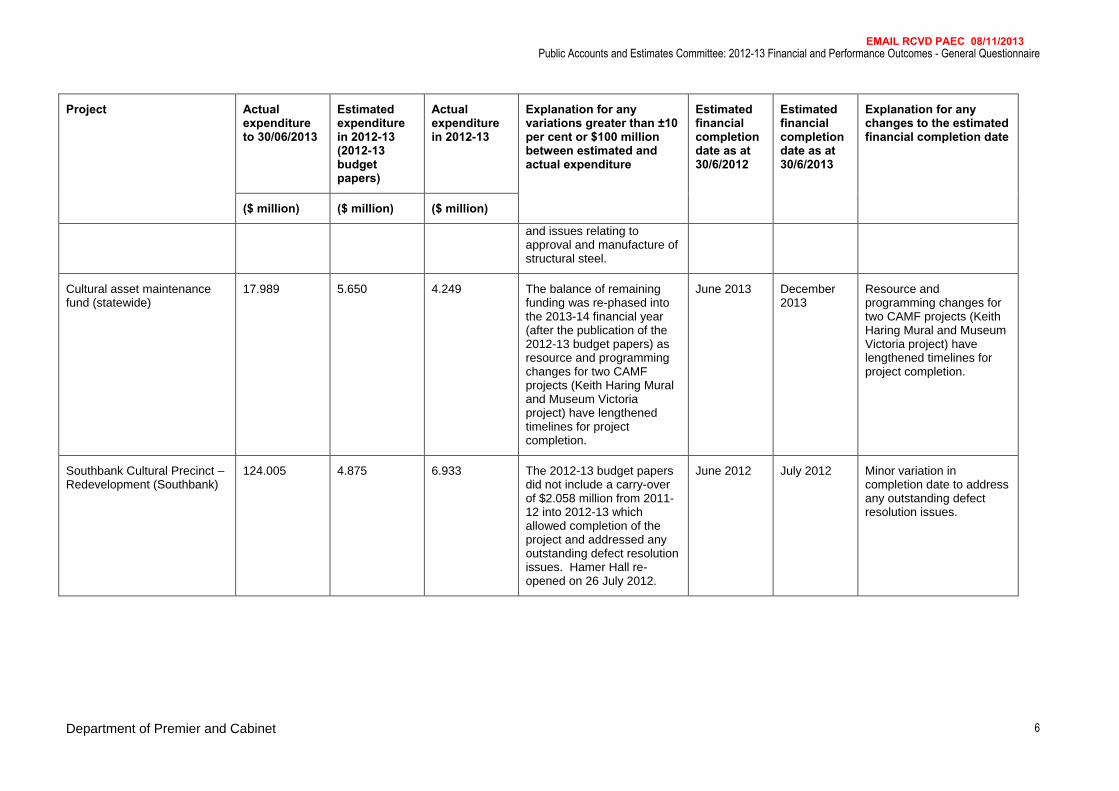
and issues relating to approval and manufacture of structural steel.
Cultural asset maintenance fund (statewide)
17.989 5.650 4.249 The balance of remaining funding was re-phased into the 2013-14 financial year (after the publication of the 2012-13 budget papers) as resource and programming changes for two CAMF projects (Keith Haring Mural and Museum Victoria project) have lengthened timelines for project completion.
June 2013 December 2013
Resource and programming changes for two CAMF projects (Keith Haring Mural and Museum Victoria project) have lengthened timelines for project completion.
Southbank Cultural Precinct – Redevelopment (Southbank)
124.005 4.875 6.933 The 2012-13 budget papers did not include a carry-over of $2.058 million from 2011-12 into 2012-13 which allowed completion of the project and addressed any outstanding defect resolution issues. Hamer Hall re-opened on 26 July 2012.
June 2012 July 2012 Minor variation in completion date to address any outstanding defect resolution issues.
EMAIL RCVD PAEC 08/11/2013
Public Accounts and Estimates Committee: 2012-13 Financial and Performance Outcomes - General Questionnaire
Department of Premier and Cabinet 7
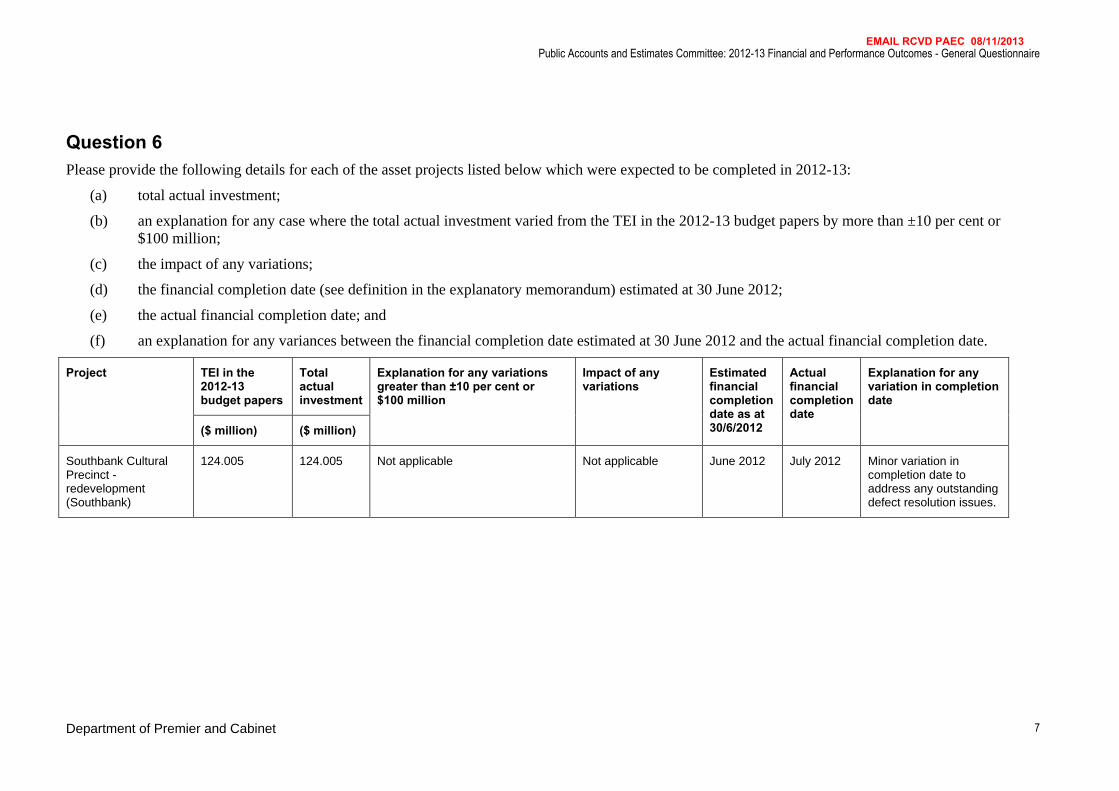
Question 6
Please provide the following details for each of the asset projects listed below which were expected to be completed in 2012-13:
(a) total actual investment;
(b) an explanation for any case where the total actual investment varied from the TEI in the 2012-13 budget papers by more than ±10 per cent or
$100 million;
(c) the impact of any variations;
(d) the financial completion date (see definition in the explanatory memorandum) estimated at 30 June 2012;
(e) the actual financial completion date; and
(f) an explanation for any variances between the financial completion date estimated at 30 June 2012 and the actual financial completion date.
Project TEI in the 2012-13 budget papers
Total actual investment
Explanation for any variations greater than ±10 per cent or $100 million
Impact of any variations
Estimated financial completion date as at 30/6/2012
Actual financial completion date
Explanation for any variation in completion date
($ million) ($ million)
Southbank Cultural Precinct - redevelopment (Southbank)
124.005 124.005 Not applicable Not applicable June 2012 July 2012 Minor variation in completion date to address any outstanding defect resolution issues.
EMAIL RCVD PAEC 08/11/2013
Public Accounts and Estimates Committee: 2012-13 Financial and Performance Outcomes - General Questionnaire
Department of Premier and Cabinet 8
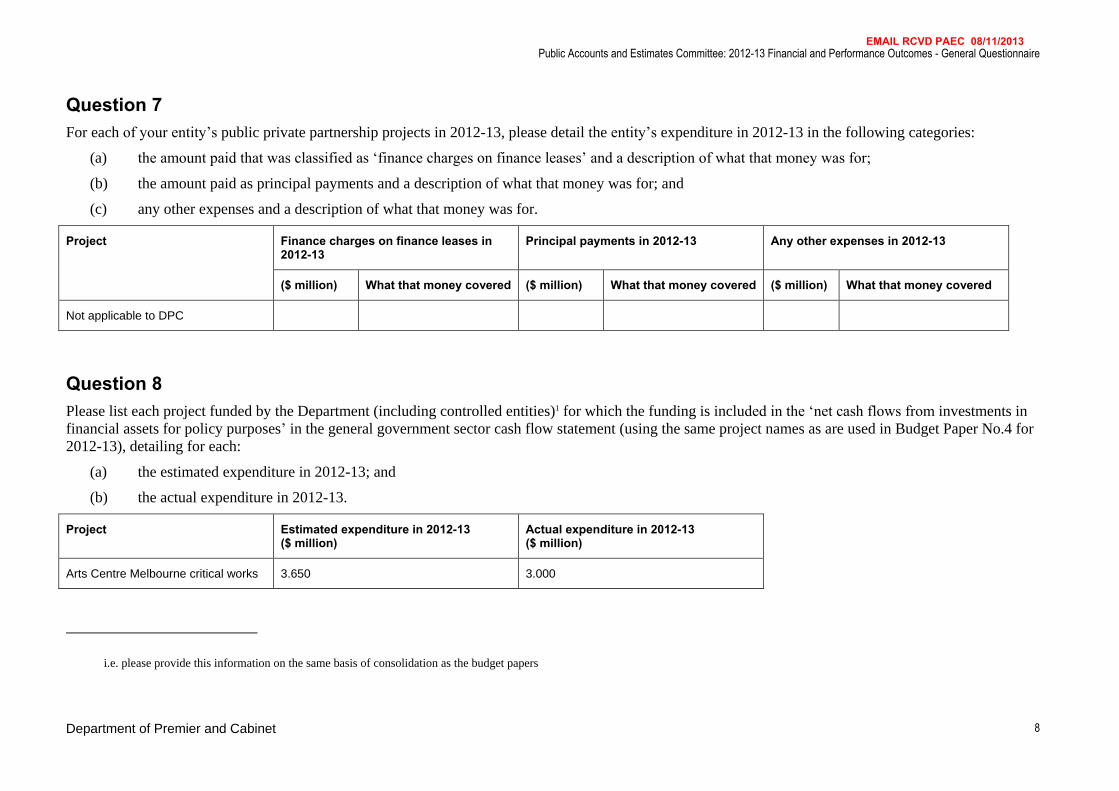
Question 7
For each of your entity’s public private partnership projects in 2012-13, please detail the entity’s expenditure in 2012-13 in the following categories:
(a) the amount paid that was classified as ‘finance charges on finance leases’ and a description of what that money was for;
(b) the amount paid as principal payments and a description of what that money was for; and
(c) any other expenses and a description of what that money was for.
Project Finance charges on finance leases in 2012-13
Principal payments in 2012-13 Any other expenses in 2012-13
($ million) What that money covered ($ million) What that money covered ($ million) What that money covered
Not applicable to DPC
Question 8
Please list each project funded by the Department (including controlled entities)1 for which the funding is included in the ‘net cash flows from investments in
financial assets for policy purposes’ in the general government sector cash flow statement (using the same project names as are used in Budget Paper No.4 for
2012-13), detailing for each:
(a) the estimated expenditure in 2012-13; and
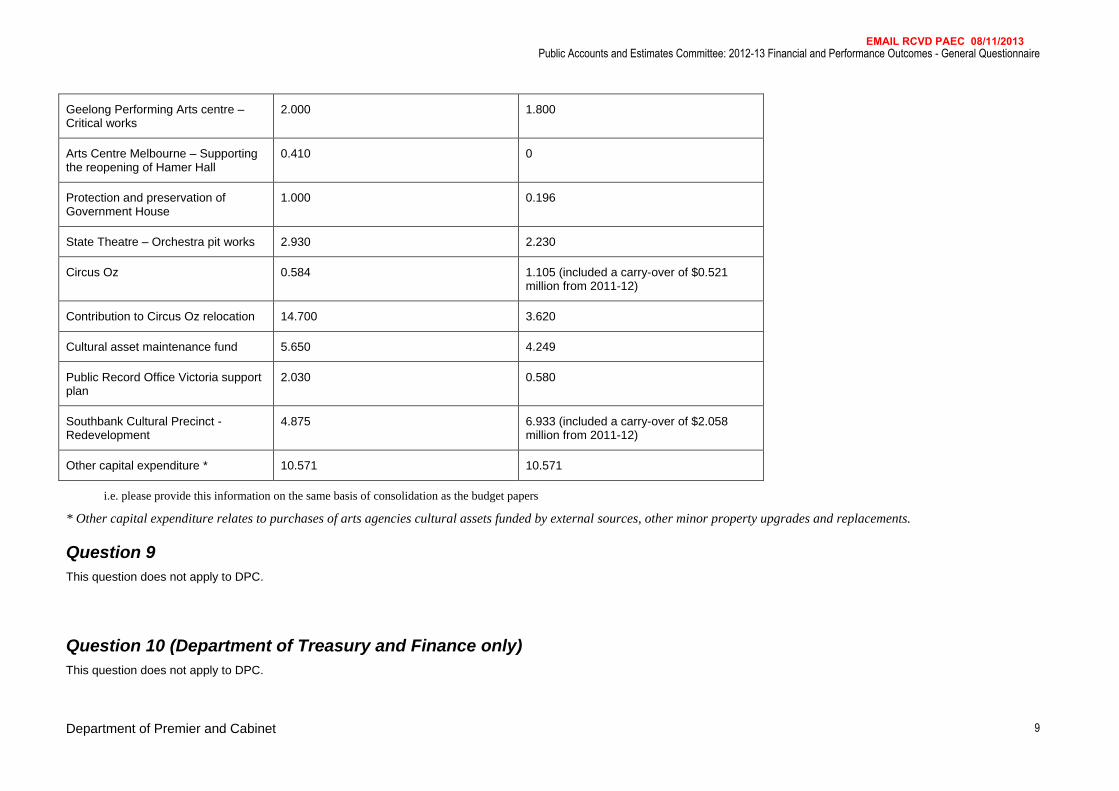
(b) the actual expenditure in 2012-13.
Project Estimated expenditure in 2012-13 ($ million)
Actual expenditure in 2012-13 ($ million)
Arts Centre Melbourne critical works 3.650 3.000
i.e. please provide this information on the same basis of consolidation as the budget papers
EMAIL RCVD PAEC 08/11/2013
Public Accounts and Estimates Committee: 2012-13 Financial and Performance Outcomes - General Questionnaire
Department of Premier and Cabinet 9
Geelong Performing Arts centre – Critical works
2.000 1.800
Arts Centre Melbourne – Supporting the reopening of Hamer Hall
0.410 0
Protection and preservation of Government House
1.000 0.196
State Theatre – Orchestra pit works 2.930 2.230
Circus Oz 0.584 1.105 (included a carry-over of $0.521 million from 2011-12)
Contribution to Circus Oz relocation 14.700 3.620
Cultural asset maintenance fund 5.650 4.249
Public Record Office Victoria support plan
2.030 0.580
Southbank Cultural Precinct - Redevelopment
4.875 6.933 (included a carry-over of $2.058 million from 2011-12)
Other capital expenditure * 10.571 10.571
i.e. please provide this information on the same basis of consolidation as the budget papers
* Other capital expenditure relates to purchases of arts agencies cultural assets funded by external sources, other minor property upgrades and replacements.
Question 9
This question does not apply to DPC.
Question 10 (Department of Treasury and Finance only)
This question does not apply to DPC.
EMAIL RCVD PAEC 08/11/2013
Public Accounts and Estimates Committee: 2012-13 Financial and Performance Outcomes - General Questionnaire
Department of Premier and Cabinet 10
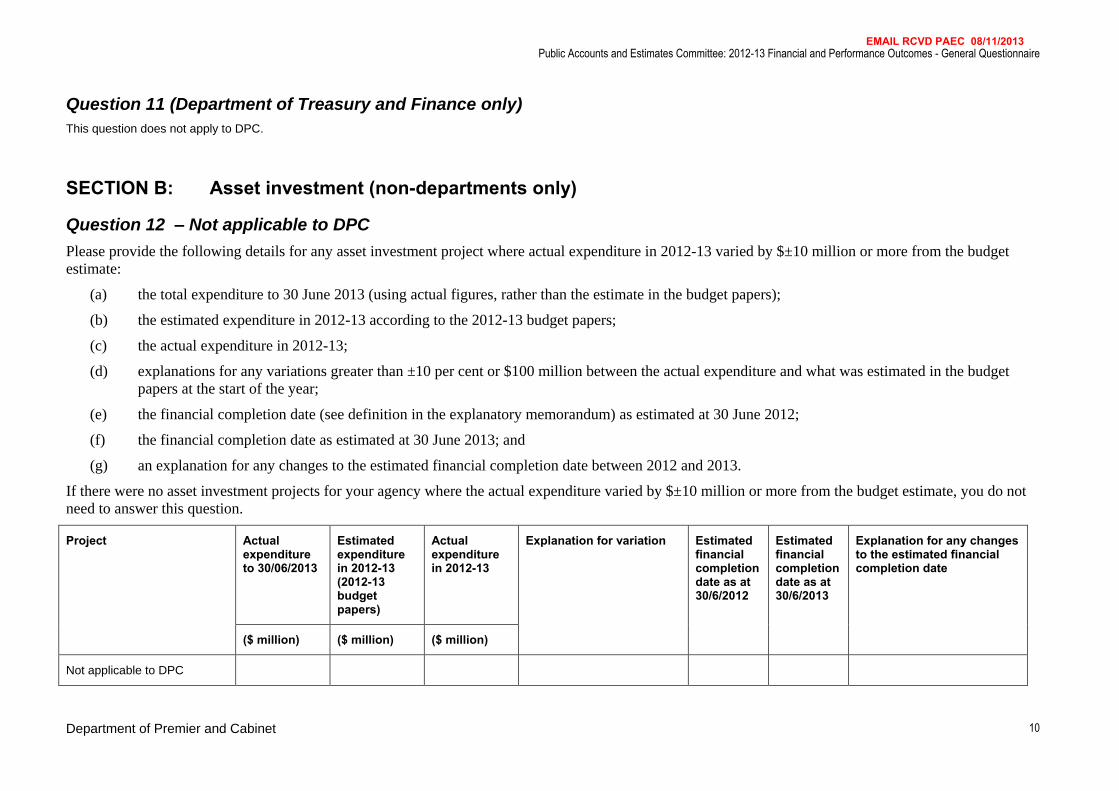
Question 11 (Department of Treasury and Finance only)
This question does not apply to DPC.
SECTION B: Asset investment (non-departments only)
Question 12 – Not applicable to DPC
Please provide the following details for any asset investment project where actual expenditure in 2012-13 varied by $±10 million or more from the budget
estimate:
(a) the total expenditure to 30 June 2013 (using actual figures, rather than the estimate in the budget papers);
(b) the estimated expenditure in 2012-13 according to the 2012-13 budget papers;
(c) the actual expenditure in 2012-13;
(d) explanations for any variations greater than ±10 per cent or $100 million between the actual expenditure and what was estimated in the budget
papers at the start of the year;
(e) the financial completion date (see definition in the explanatory memorandum) as estimated at 30 June 2012;
(f) the financial completion date as estimated at 30 June 2013; and
(g) an explanation for any changes to the estimated financial completion date between 2012 and 2013.
If there were no asset investment projects for your agency where the actual expenditure varied by $±10 million or more from the budget estimate, you do not
need to answer this question.
Project Actual expenditure to 30/06/2013
Estimated expenditure in 2012-13 (2012-13 budget papers)
Actual expenditure in 2012-13
Explanation for variation Estimated financial completion date as at 30/6/2012
Estimated financial completion date as at 30/6/2013
Explanation for any changes to the estimated financial completion date
($ million) ($ million) ($ million)
Not applicable to DPC
EMAIL RCVD PAEC 08/11/2013
Public Accounts and Estimates Committee: 2012-13 Financial and Performance Outcomes - General Questionnaire
Department of Premier and Cabinet 11
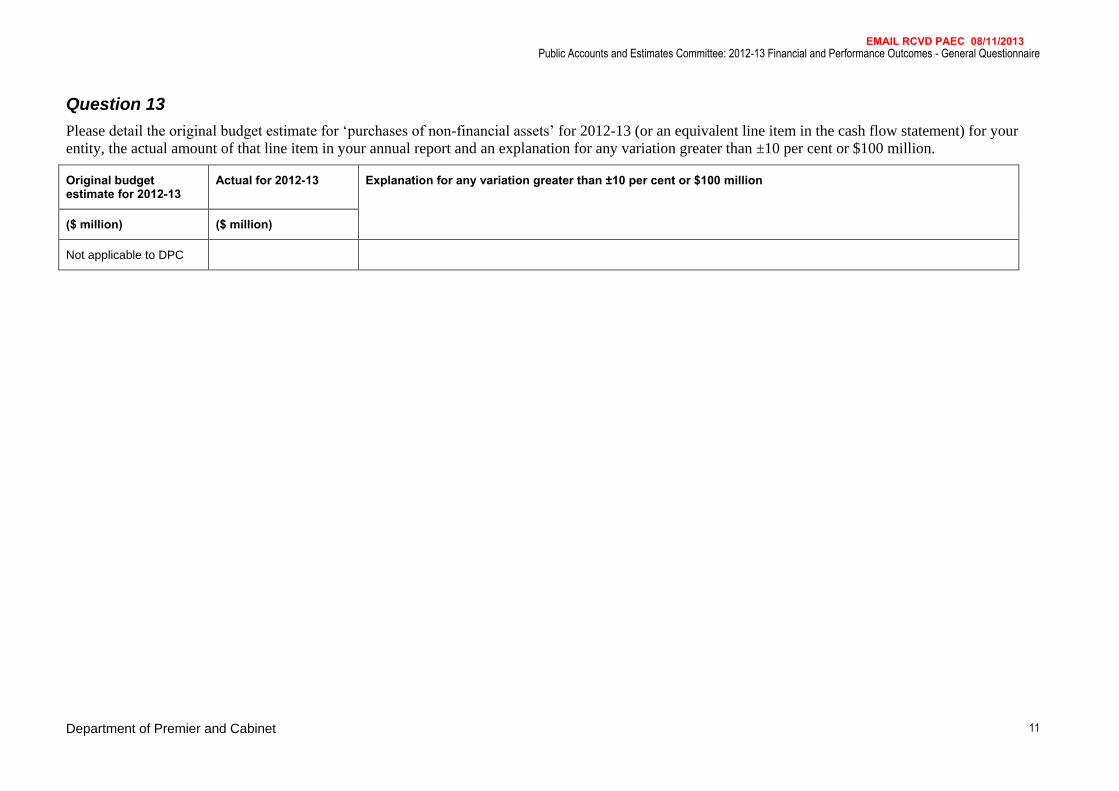
Question 13
Please detail the original budget estimate for ‘purchases of non-financial assets’ for 2012-13 (or an equivalent line item in the cash flow statement) for your
entity, the actual amount of that line item in your annual report and an explanation for any variation greater than ±10 per cent or $100 million.
Original budget estimate for 2012-13
Actual for 2012-13 Explanation for any variation greater than ±10 per cent or $100 million
($ million) ($ million)
Not applicable to DPC
EMAIL RCVD PAEC 08/11/2013
Public Accounts and Estimates Committee: 2012-13 Financial and Performance Outcomes - General Questionnaire
Department of Premier and Cabinet 12
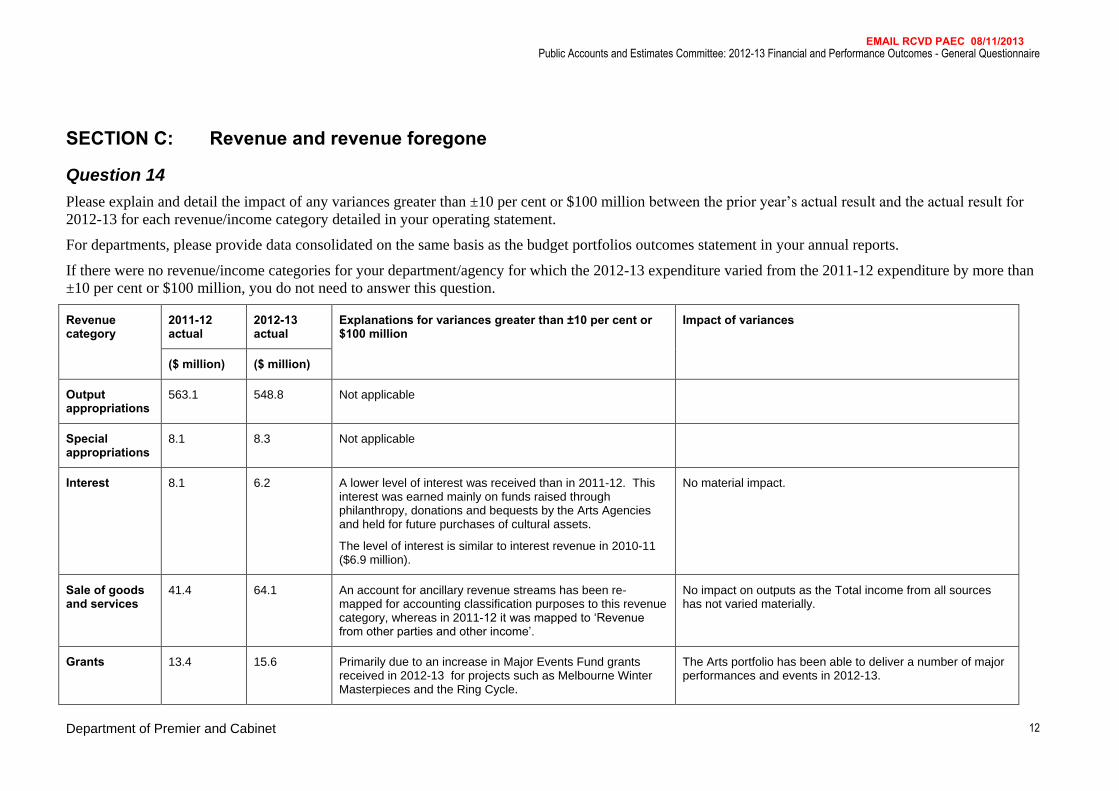
SECTION C: Revenue and revenue foregone
Question 14
Please explain and detail the impact of any variances greater than ±10 per cent or $100 million between the prior year’s actual result and the actual result for
2012-13 for each revenue/income category detailed in your operating statement.
For departments, please provide data consolidated on the same basis as the budget portfolios outcomes statement in your annual reports.
If there were no revenue/income categories for your department/agency for which the 2012-13 expenditure varied from the 2011-12 expenditure by more than
±10 per cent or $100 million, you do not need to answer this question.
Revenue category
2011-12 actual
2012-13 actual
Explanations for variances greater than ±10 per cent or $100 million
Impact of variances
($ million) ($ million)
Output appropriations
563.1 548.8 Not applicable
Special appropriations
8.1 8.3 Not applicable
Interest 8.1 6.2 A lower level of interest was received than in 2011-12. This interest was earned mainly on funds raised through philanthropy, donations and bequests by the Arts Agencies and held for future purchases of cultural assets.
The level of interest is similar to interest revenue in 2010-11 ($6.9 million).
No material impact.
Sale of goods and services
41.4 64.1 An account for ancillary revenue streams has been re-mapped for accounting classification purposes to this revenue category, whereas in 2011-12 it was mapped to ‘Revenue from other parties and other income’.
No impact on outputs as the Total income from all sources has not varied materially.
Grants 13.4 15.6 Primarily due to an increase in Major Events Fund grants received in 2012-13 for projects such as Melbourne Winter Masterpieces and the Ring Cycle.
The Arts portfolio has been able to deliver a number of major performances and events in 2012-13.
EMAIL RCVD PAEC 08/11/2013
Public Accounts and Estimates Committee: 2012-13 Financial and Performance Outcomes - General Questionnaire
Department of Premier and Cabinet 13
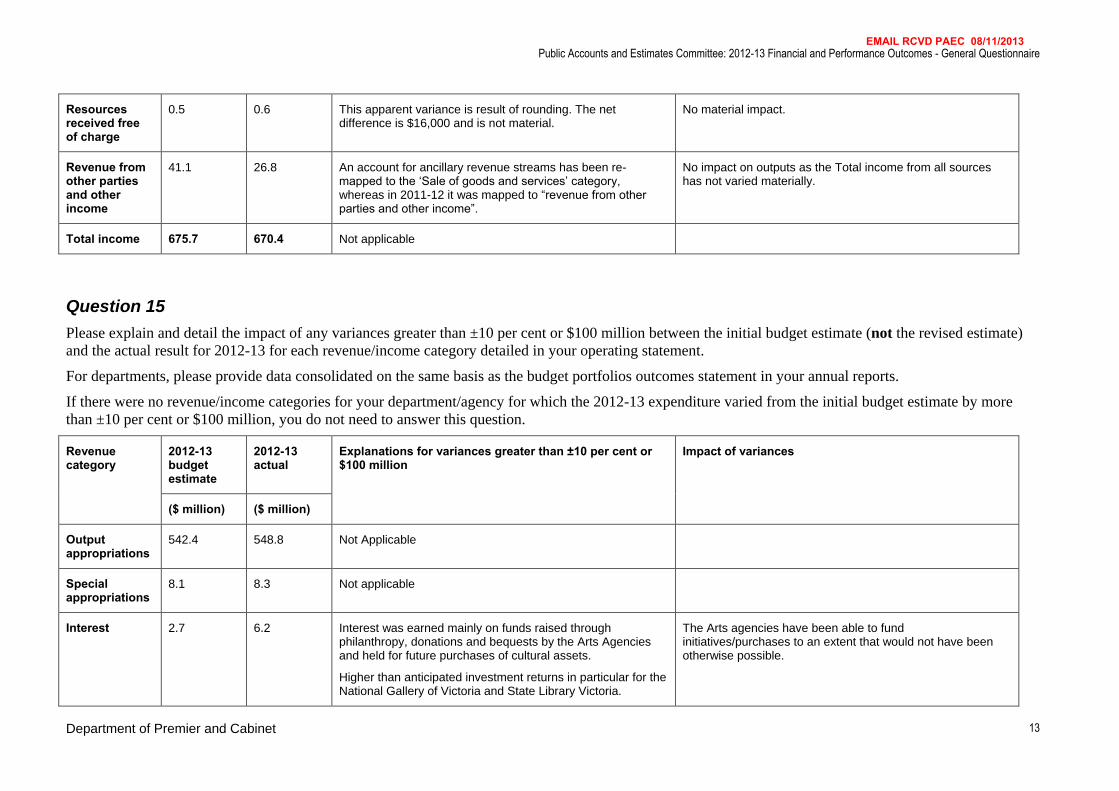
Resources received free of charge
0.5 0.6 This apparent variance is result of rounding. The net difference is $16,000 and is not material.
No material impact.
Revenue from other parties and other income
41.1 26.8 An account for ancillary revenue streams has been re-mapped to the ‘Sale of goods and services’ category, whereas in 2011-12 it was mapped to “revenue from other parties and other income”.
No impact on outputs as the Total income from all sources has not varied materially.
Total income 675.7 670.4 Not applicable
Question 15
Please explain and detail the impact of any variances greater than ±10 per cent or $100 million between the initial budget estimate (not the revised estimate)
and the actual result for 2012-13 for each revenue/income category detailed in your operating statement.
For departments, please provide data consolidated on the same basis as the budget portfolios outcomes statement in your annual reports.
If there were no revenue/income categories for your department/agency for which the 2012-13 expenditure varied from the initial budget estimate by more
than ±10 per cent or $100 million, you do not need to answer this question.
Revenue category
2012-13 budget estimate
2012-13 actual
Explanations for variances greater than ±10 per cent or $100 million
Impact of variances
($ million) ($ million)
Output appropriations
542.4 548.8 Not Applicable
Special appropriations
8.1 8.3 Not applicable
Interest 2.7 6.2 Interest was earned mainly on funds raised through philanthropy, donations and bequests by the Arts Agencies and held for future purchases of cultural assets.
Higher than anticipated investment returns in particular for the National Gallery of Victoria and State Library Victoria.
The Arts agencies have been able to fund initiatives/purchases to an extent that would not have been otherwise possible.
EMAIL RCVD PAEC 08/11/2013
Public Accounts and Estimates Committee: 2012-13 Financial and Performance Outcomes - General Questionnaire
Department of Premier and Cabinet 14
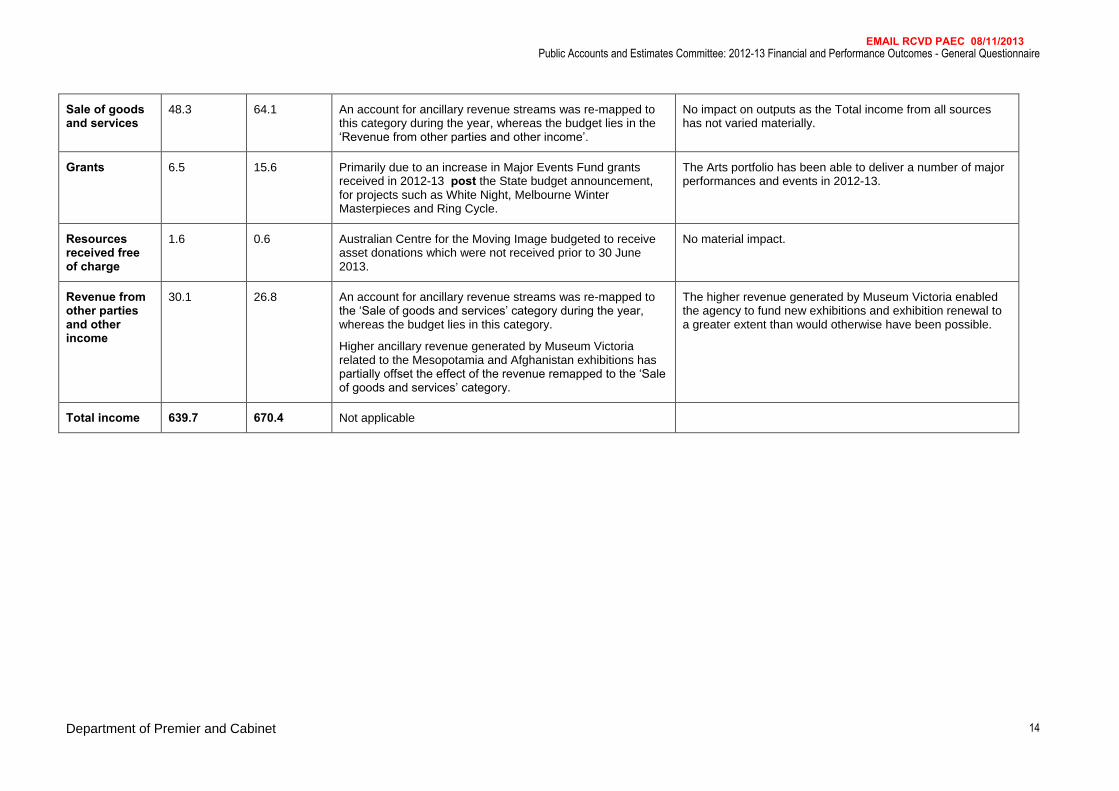
Sale of goods and services
48.3 64.1 An account for ancillary revenue streams was re-mapped to this category during the year, whereas the budget lies in the ‘Revenue from other parties and other income’.
No impact on outputs as the Total income from all sources has not varied materially.
Grants 6.5 15.6 Primarily due to an increase in Major Events Fund grants received in 2012-13 post the State budget announcement, for projects such as White Night, Melbourne Winter Masterpieces and Ring Cycle.
The Arts portfolio has been able to deliver a number of major performances and events in 2012-13.
Resources received free of charge
1.6 0.6 Australian Centre for the Moving Image budgeted to receive asset donations which were not received prior to 30 June 2013.
No material impact.
Revenue from other parties and other income
30.1 26.8 An account for ancillary revenue streams was re-mapped to the ‘Sale of goods and services’ category during the year, whereas the budget lies in this category.
Higher ancillary revenue generated by Museum Victoria related to the Mesopotamia and Afghanistan exhibitions has partially offset the effect of the revenue remapped to the ‘Sale of goods and services’ category.
The higher revenue generated by Museum Victoria enabled the agency to fund new exhibitions and exhibition renewal to a greater extent than would otherwise have been possible.
Total income 639.7 670.4 Not applicable
EMAIL RCVD PAEC 08/11/2013
Public Accounts and Estimates Committee: 2012-13 Financial and Performance Outcomes - General Questionnaire
Department of Premier and Cabinet 15
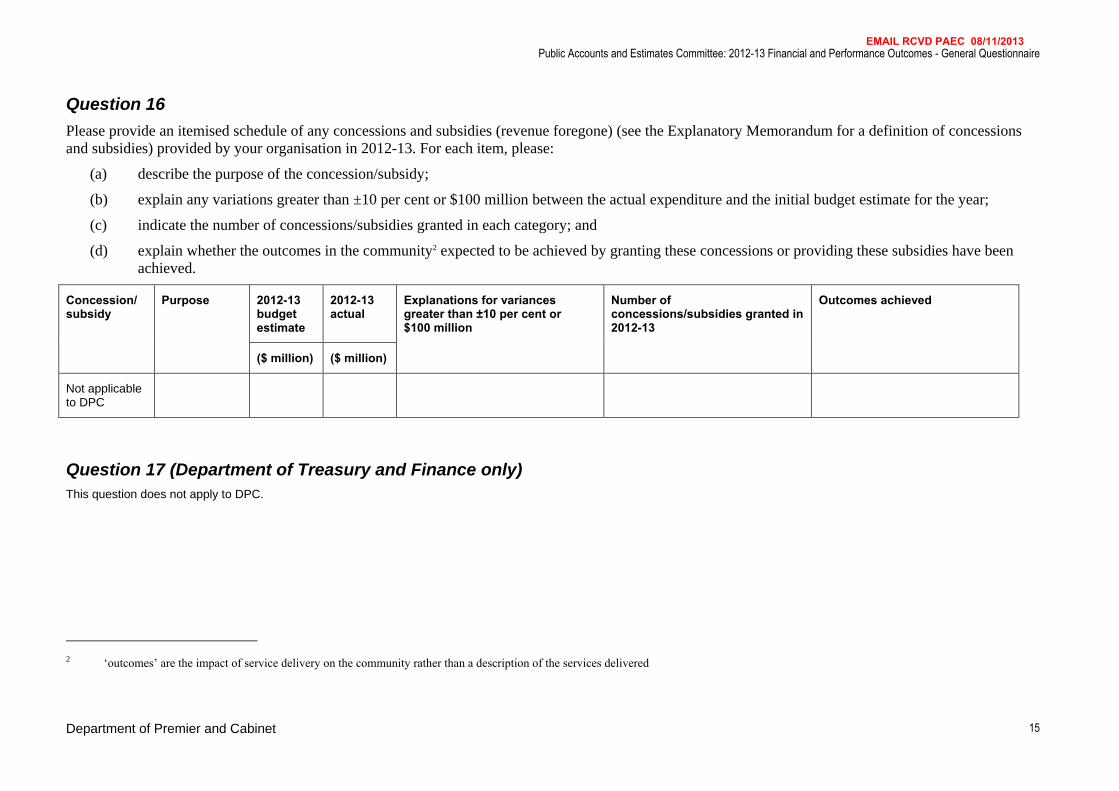
Question 16
Please provide an itemised schedule of any concessions and subsidies (revenue foregone) (see the Explanatory Memorandum for a definition of concessions
and subsidies) provided by your organisation in 2012-13. For each item, please:
(a) describe the purpose of the concession/subsidy;
(b) explain any variations greater than ±10 per cent or $100 million between the actual expenditure and the initial budget estimate for the year;
(c) indicate the number of concessions/subsidies granted in each category; and
(d) explain whether the outcomes in the community2 expected to be achieved by granting these concessions or providing these subsidies have been
achieved.
Concession/ subsidy
Purpose 2012-13 budget estimate
2012-13 actual
Explanations for variances greater than ±10 per cent or $100 million
Number of concessions/subsidies granted in 2012-13
Outcomes achieved
($ million) ($ million)
Not applicable to DPC
Question 17 (Department of Treasury and Finance only)
This question does not apply to DPC.
2 ‘outcomes’ are the impact of service delivery on the community rather than a description of the services delivered
EMAIL RCVD PAEC 08/11/2013
Public Accounts and Estimates Committee: 2012-13 Financial and Performance Outcomes - General Questionnaire
Department of Premier and Cabinet 16
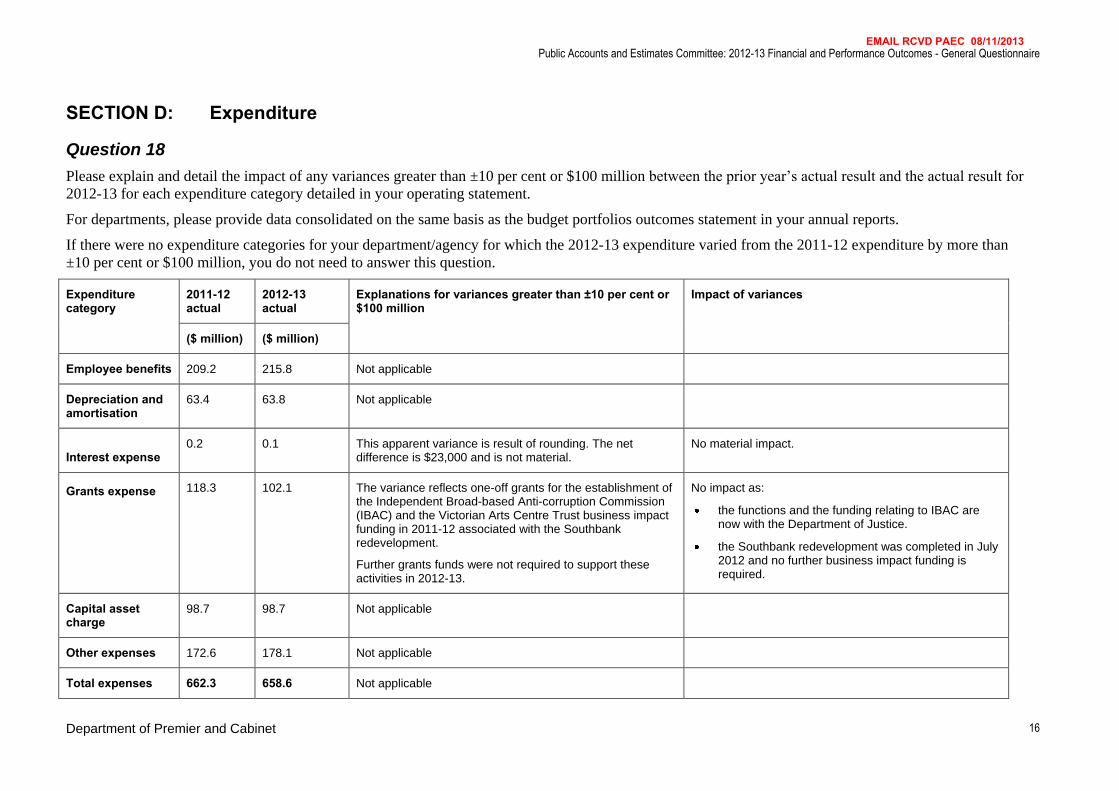
SECTION D: Expenditure
Question 18
Please explain and detail the impact of any variances greater than ±10 per cent or $100 million between the prior year’s actual result and the actual result for
2012-13 for each expenditure category detailed in your operating statement.
For departments, please provide data consolidated on the same basis as the budget portfolios outcomes statement in your annual reports.
If there were no expenditure categories for your department/agency for which the 2012-13 expenditure varied from the 2011-12 expenditure by more than
±10 per cent or $100 million, you do not need to answer this question.
Expenditure category
2011-12 actual
2012-13 actual
Explanations for variances greater than ±10 per cent or $100 million
Impact of variances
($ million) ($ million)
Employee benefits 209.2 215.8 Not applicable
Depreciation and amortisation
63.4 63.8 Not applicable
Interest expense 0.2 0.1 This apparent variance is result of rounding. The net
difference is $23,000 and is not material. No material impact.
Grants expense
118.3 102.1 The variance reflects one-off grants for the establishment of the Independent Broad-based Anti-corruption Commission (IBAC) and the Victorian Arts Centre Trust business impact funding in 2011-12 associated with the Southbank redevelopment.
Further grants funds were not required to support these activities in 2012-13.
No impact as:
the functions and the funding relating to IBAC are now with the Department of Justice.
the Southbank redevelopment was completed in July 2012 and no further business impact funding is required.
Capital asset charge
98.7 98.7 Not applicable
Other expenses 172.6 178.1 Not applicable
Total expenses 662.3 658.6 Not applicable
EMAIL RCVD PAEC 08/11/2013
Public Accounts and Estimates Committee: 2012-13 Financial and Performance Outcomes - General Questionnaire
Department of Premier and Cabinet 17
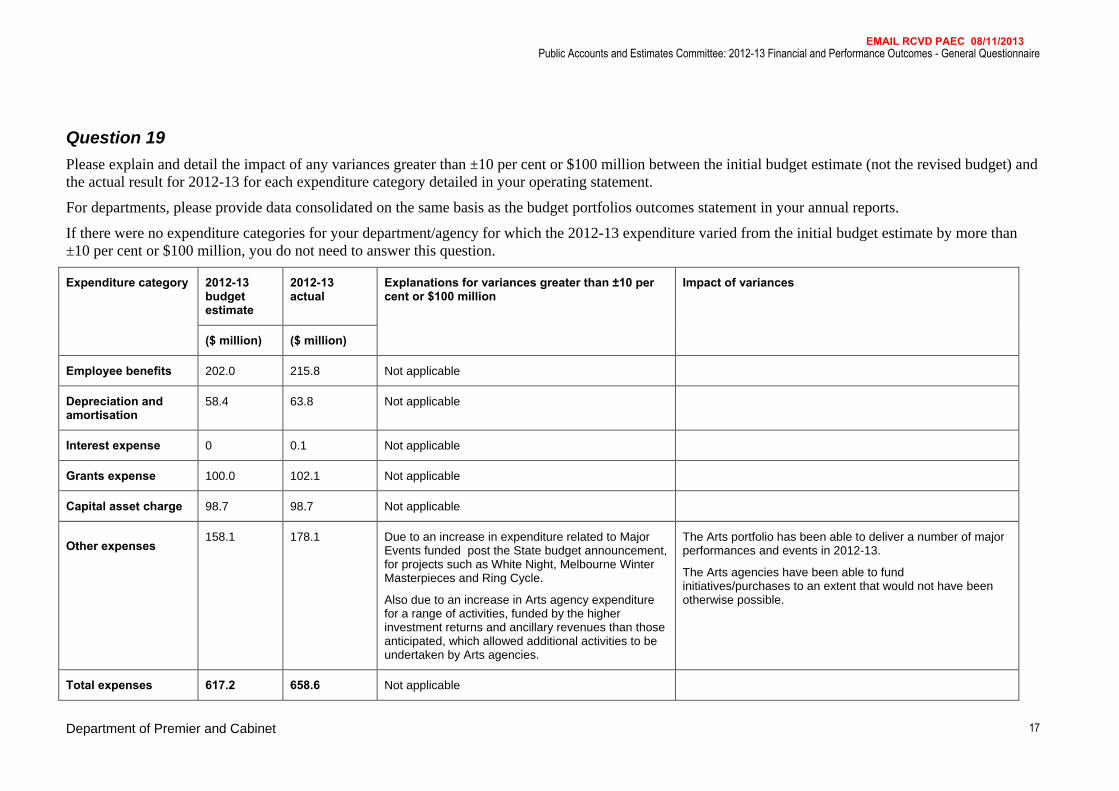
Question 19
Please explain and detail the impact of any variances greater than ±10 per cent or $100 million between the initial budget estimate (not the revised budget) and
the actual result for 2012-13 for each expenditure category detailed in your operating statement.
For departments, please provide data consolidated on the same basis as the budget portfolios outcomes statement in your annual reports.
If there were no expenditure categories for your department/agency for which the 2012-13 expenditure varied from the initial budget estimate by more than
±10 per cent or $100 million, you do not need to answer this question.
Expenditure category 2012-13 budget estimate
2012-13 actual
Explanations for variances greater than ±10 per cent or $100 million
Impact of variances
($ million) ($ million)
Employee benefits 202.0 215.8 Not applicable
Depreciation and amortisation
58.4 63.8 Not applicable
Interest expense 0 0.1 Not applicable
Grants expense 100.0 102.1 Not applicable
Capital asset charge 98.7 98.7 Not applicable
Other expenses
158.1 178.1 Due to an increase in expenditure related to Major Events funded post the State budget announcement, for projects such as White Night, Melbourne Winter Masterpieces and Ring Cycle.
Also due to an increase in Arts agency expenditure for a range of activities, funded by the higher investment returns and ancillary revenues than those anticipated, which allowed additional activities to be undertaken by Arts agencies.
The Arts portfolio has been able to deliver a number of major performances and events in 2012-13.
The Arts agencies have been able to fund initiatives/purchases to an extent that would not have been otherwise possible.
Total expenses 617.2 658.6 Not applicable
EMAIL RCVD PAEC 08/11/2013
Public Accounts and Estimates Committee: 2012-13 Financial and Performance Outcomes - General Questionnaire
Department of Premier and Cabinet 18
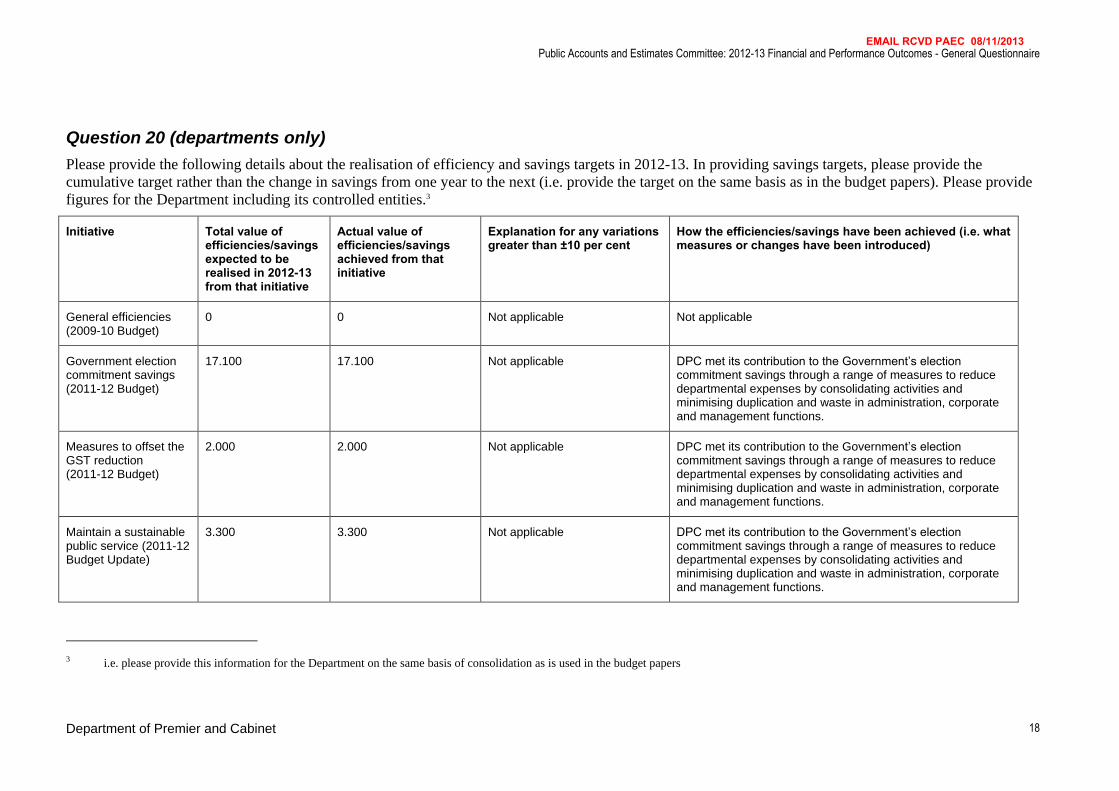
Question 20 (departments only)
Please provide the following details about the realisation of efficiency and savings targets in 2012-13. In providing savings targets, please provide the
cumulative target rather than the change in savings from one year to the next (i.e. provide the target on the same basis as in the budget papers). Please provide
figures for the Department including its controlled entities.3
Initiative Total value of efficiencies/savings expected to be realised in 2012-13 from that initiative
Actual value of efficiencies/savings achieved from that initiative
Explanation for any variations greater than ±10 per cent
How the efficiencies/savings have been achieved (i.e. what measures or changes have been introduced)
General efficiencies (2009-10 Budget)
0 0 Not applicable Not applicable
Government election commitment savings (2011-12 Budget)
17.100 17.100 Not applicable DPC met its contribution to the Government’s election commitment savings through a range of measures to reduce departmental expenses by consolidating activities and minimising duplication and waste in administration, corporate and management functions.
Measures to offset the GST reduction (2011-12 Budget)
2.000 2.000 Not applicable DPC met its contribution to the Government’s election commitment savings through a range of measures to reduce departmental expenses by consolidating activities and minimising duplication and waste in administration, corporate and management functions.
Maintain a sustainable public service (2011-12 Budget Update)
3.300 3.300 Not applicable DPC met its contribution to the Government’s election commitment savings through a range of measures to reduce departmental expenses by consolidating activities and minimising duplication and waste in administration, corporate and management functions.
3 i.e. please provide this information for the Department on the same basis of consolidation as is used in the budget papers
EMAIL RCVD PAEC 08/11/2013
Public Accounts and Estimates Committee: 2012-13 Financial and Performance Outcomes - General Questionnaire
Department of Premier and Cabinet 19
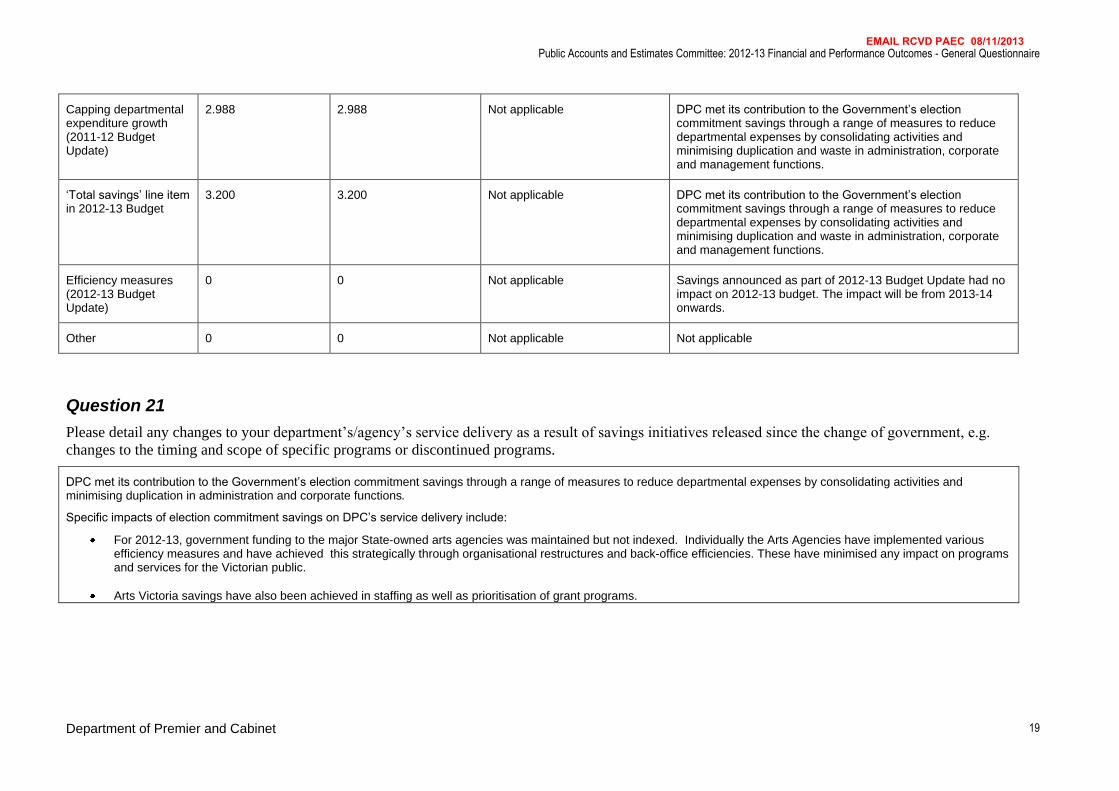
Capping departmental expenditure growth (2011-12 Budget Update)
2.988 2.988 Not applicable DPC met its contribution to the Government’s election commitment savings through a range of measures to reduce departmental expenses by consolidating activities and minimising duplication and waste in administration, corporate and management functions.
‘Total savings’ line item in 2012-13 Budget
3.200 3.200 Not applicable DPC met its contribution to the Government’s election commitment savings through a range of measures to reduce departmental expenses by consolidating activities and minimising duplication and waste in administration, corporate and management functions.
Efficiency measures (2012-13 Budget Update)
0 0 Not applicable Savings announced as part of 2012-13 Budget Update had no impact on 2012-13 budget. The impact will be from 2013-14 onwards.
Other 0 0 Not applicable Not applicable
Question 21
Please detail any changes to your department’s/agency’s service delivery as a result of savings initiatives released since the change of government, e.g.
changes to the timing and scope of specific programs or discontinued programs.
DPC met its contribution to the Government’s election commitment savings through a range of measures to reduce departmental expenses by consolidating activities and minimising duplication in administration and corporate functions.
Specific impacts of election commitment savings on DPC’s service delivery include:
For 2012-13, government funding to the major State-owned arts agencies was maintained but not indexed. Individually the Arts Agencies have implemented various efficiency measures and have achieved this strategically through organisational restructures and back-office efficiencies. These have minimised any impact on programs and services for the Victorian public.
Arts Victoria savings have also been achieved in staffing as well as prioritisation of grant programs.
EMAIL RCVD PAEC 08/11/2013
Public Accounts and Estimates Committee: 2012-13 Financial and Performance Outcomes - General Questionnaire
Department of Premier and Cabinet 20
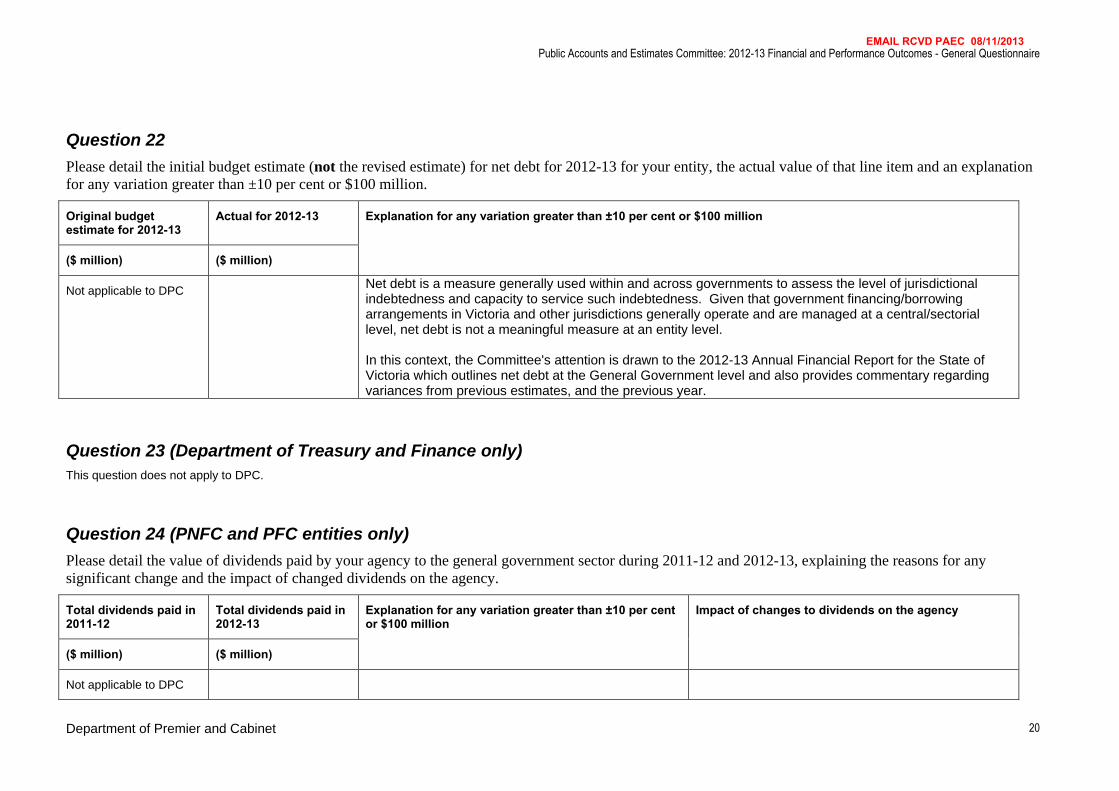
Question 22
Please detail the initial budget estimate (not the revised estimate) for net debt for 2012-13 for your entity, the actual value of that line item and an explanation
for any variation greater than ±10 per cent or $100 million.
Original budget estimate for 2012-13
Actual for 2012-13 Explanation for any variation greater than ±10 per cent or $100 million
($ million) ($ million)
Not applicable to DPC Net debt is a measure generally used within and across governments to assess the level of jurisdictional indebtedness and capacity to service such indebtedness. Given that government financing/borrowing arrangements in Victoria and other jurisdictions generally operate and are managed at a central/sectorial level, net debt is not a meaningful measure at an entity level. In this context, the Committee's attention is drawn to the 2012-13 Annual Financial Report for the State of Victoria which outlines net debt at the General Government level and also provides commentary regarding variances from previous estimates, and the previous year.
Question 23 (Department of Treasury and Finance only)
This question does not apply to DPC.
Question 24 (PNFC and PFC entities only)
Please detail the value of dividends paid by your agency to the general government sector during 2011-12 and 2012-13, explaining the reasons for any
significant change and the impact of changed dividends on the agency.
Total dividends paid in 2011-12
Total dividends paid in 2012-13
Explanation for any variation greater than ±10 per cent or $100 million
Impact of changes to dividends on the agency
($ million) ($ million)
Not applicable to DPC
EMAIL RCVD PAEC 08/11/2013
Public Accounts and Estimates Committee: 2012-13 Financial and Performance Outcomes - General Questionnaire
Department of Premier and Cabinet 21
SECTION E: Public sector workforce
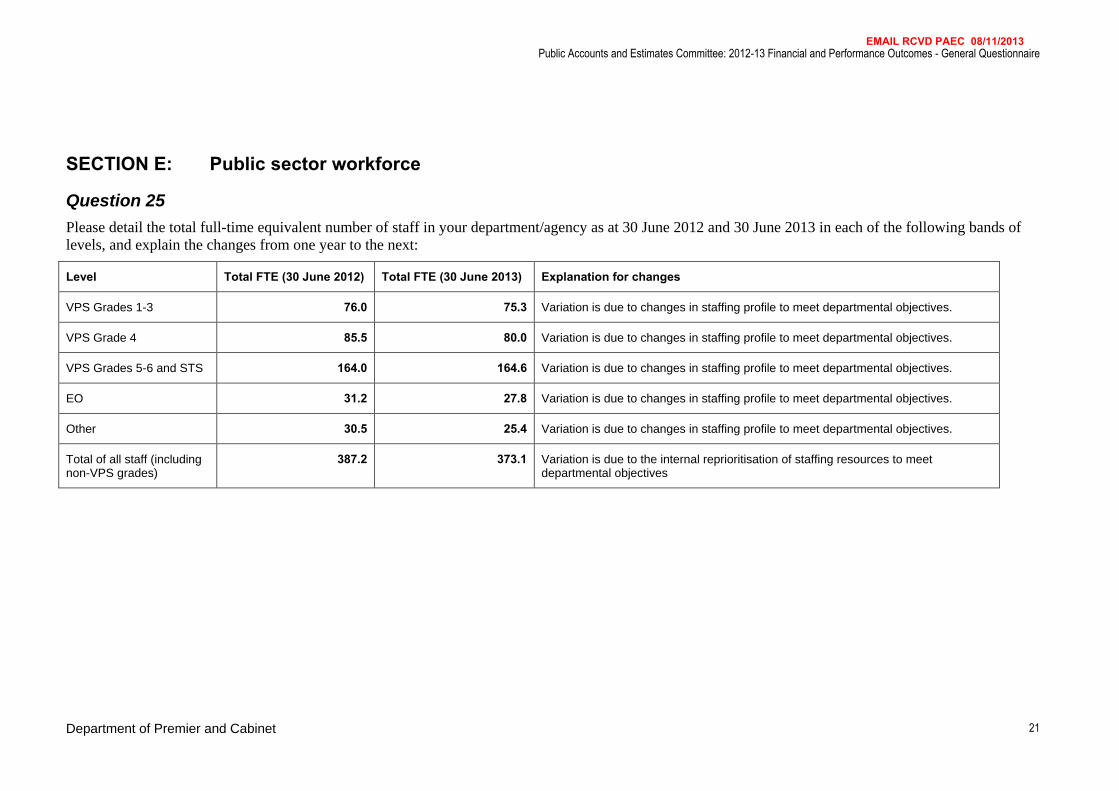
Question 25
Please detail the total full-time equivalent number of staff in your department/agency as at 30 June 2012 and 30 June 2013 in each of the following bands of
levels, and explain the changes from one year to the next:
Level Total FTE (30 June 2012) Total FTE (30 June 2013) Explanation for changes
VPS Grades 1-3 76.0 75.3 Variation is due to changes in staffing profile to meet departmental objectives.
VPS Grade 4 85.5 80.0 Variation is due to changes in staffing profile to meet departmental objectives.
VPS Grades 5-6 and STS 164.0 164.6 Variation is due to changes in staffing profile to meet departmental objectives.
EO 31.2 27.8 Variation is due to changes in staffing profile to meet departmental objectives.
Other 30.5 25.4 Variation is due to changes in staffing profile to meet departmental objectives.
Total of all staff (including non-VPS grades)
387.2 373.1 Variation is due to the internal reprioritisation of staffing resources to meet departmental objectives
EMAIL RCVD PAEC 08/11/2013
Public Accounts and Estimates Committee: 2012-13 Financial and Performance Outcomes - General Questionnaire
Department of Premier and Cabinet 22
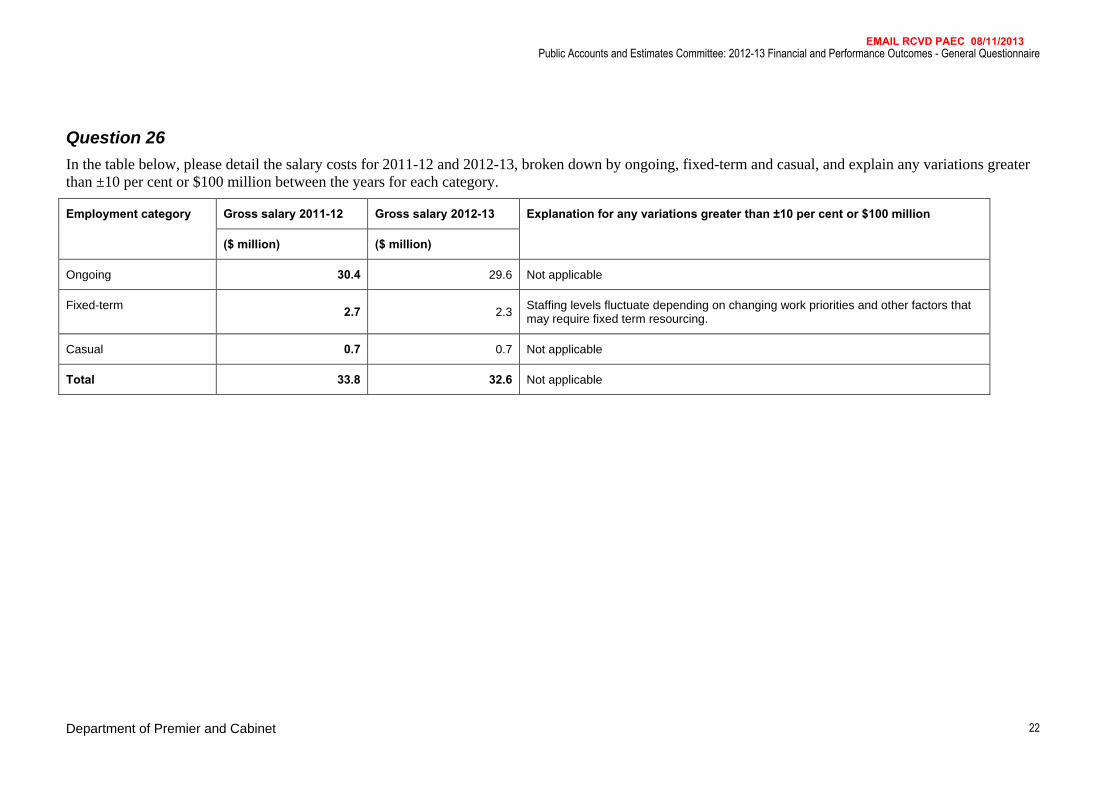
Question 26
In the table below, please detail the salary costs for 2011-12 and 2012-13, broken down by ongoing, fixed-term and casual, and explain any variations greater
than ±10 per cent or $100 million between the years for each category.
Employment category Gross salary 2011-12 Gross salary 2012-13 Explanation for any variations greater than ±10 per cent or $100 million
($ million) ($ million)
Ongoing 30.4 29.6 Not applicable
Fixed-term 2.7 2.3 Staffing levels fluctuate depending on changing work priorities and other factors that may require fixed term resourcing.
Casual 0.7 0.7 Not applicable
Total 33.8 32.6 Not applicable
EMAIL RCVD PAEC 08/11/2013
Public Accounts and Estimates Committee: 2012-13 Financial and Performance Outcomes - General Questionnaire
Department of Premier and Cabinet 23
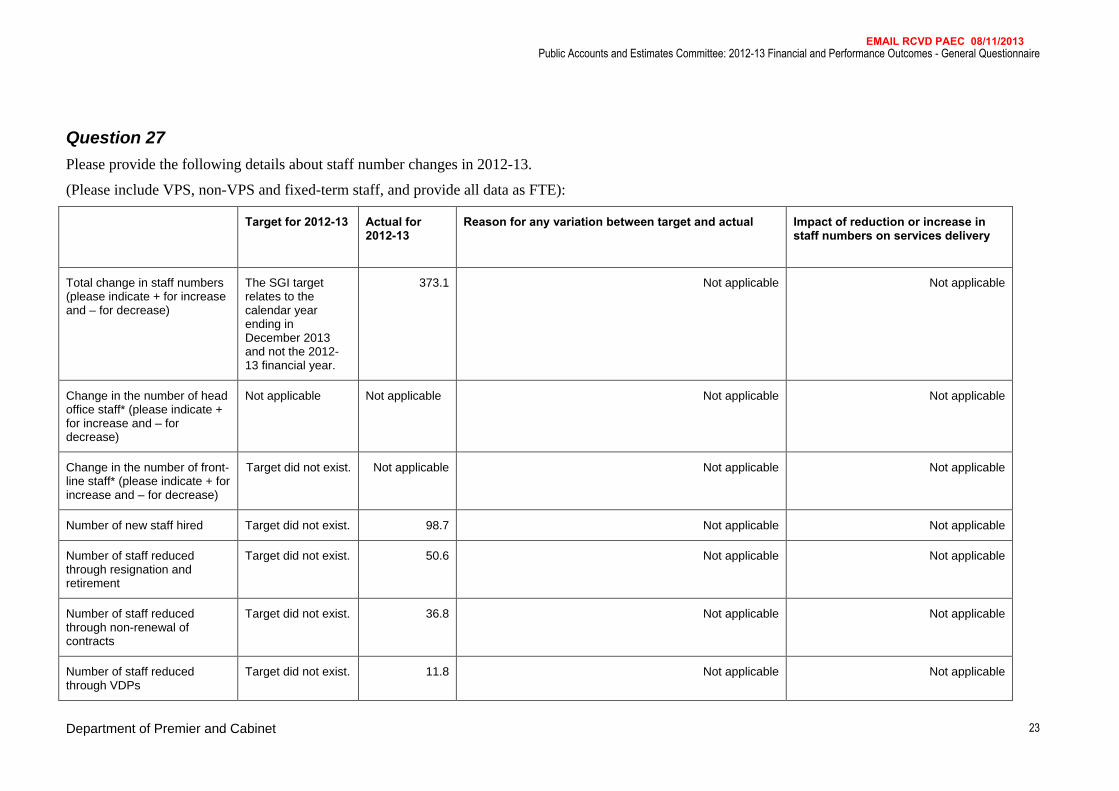
Question 27
Please provide the following details about staff number changes in 2012-13.
(Please include VPS, non-VPS and fixed-term staff, and provide all data as FTE):
Target for 2012-13 Actual for 2012-13
Reason for any variation between target and actual Impact of reduction or increase in staff numbers on services delivery
Total change in staff numbers (please indicate + for increase and – for decrease)
The SGI target relates to the calendar year ending in December 2013 and not the 2012-13 financial year.
373.1 Not applicable Not applicable
Change in the number of head office staff* (please indicate + for increase and – for decrease)
Not applicable Not applicable Not applicable Not applicable
Change in the number of front-line staff* (please indicate + for increase and – for decrease)
Target did not exist. Not applicable Not applicable Not applicable
Number of new staff hired Target did not exist. 98.7 Not applicable Not applicable
Number of staff reduced through resignation and retirement
Target did not exist. 50.6 Not applicable Not applicable
Number of staff reduced through non-renewal of contracts
Target did not exist. 36.8 Not applicable Not applicable
Number of staff reduced through VDPs
Target did not exist. 11.8 Not applicable Not applicable
EMAIL RCVD PAEC 08/11/2013
Public Accounts and Estimates Committee: 2012-13 Financial and Performance Outcomes - General Questionnaire
Department of Premier and Cabinet 24
Target for 2012-13 Actual for 2012-13
Reason for any variation between target and actual Impact of reduction or increase in staff numbers on services delivery
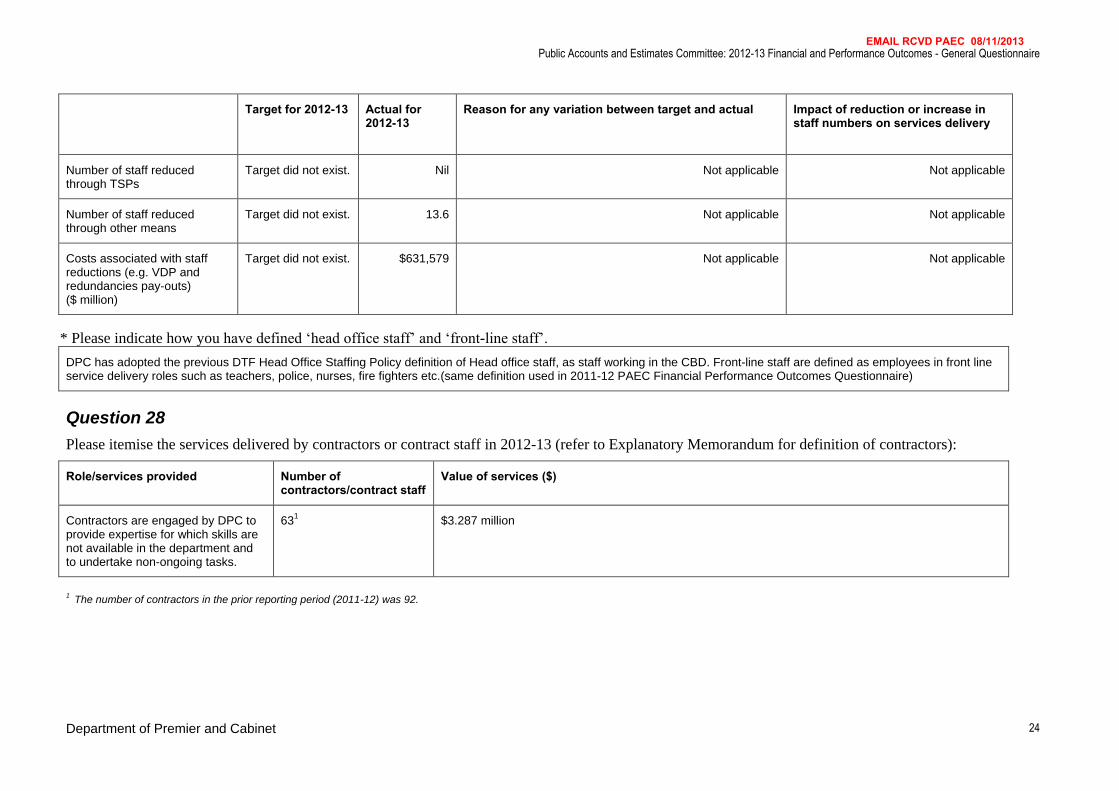
Number of staff reduced through TSPs
Target did not exist. Nil Not applicable Not applicable
Number of staff reduced through other means
Target did not exist. 13.6 Not applicable Not applicable
Costs associated with staff reductions (e.g. VDP and redundancies pay-outs) ($ million)
Target did not exist. $631,579 Not applicable Not applicable
* Please indicate how you have defined ‘head office staff’ and ‘front-line staff’.
DPC has adopted the previous DTF Head Office Staffing Policy definition of Head office staff, as staff working in the CBD. Front-line staff are defined as employees in front line service delivery roles such as teachers, police, nurses, fire fighters etc.(same definition used in 2011-12 PAEC Financial Performance Outcomes Questionnaire)
Question 28
Please itemise the services delivered by contractors or contract staff in 2012-13 (refer to Explanatory Memorandum for definition of contractors):
Role/services provided Number of contractors/contract staff
Value of services ($)
Contractors are engaged by DPC to provide expertise for which skills are not available in the department and to undertake non-ongoing tasks.
631 $3.287 million
1 The number of contractors in the prior reporting period (2011-12) was 92.
EMAIL RCVD PAEC 08/11/2013
Public Accounts and Estimates Committee: 2012-13 Financial and Performance Outcomes - General Questionnaire
Department of Premier and Cabinet 25
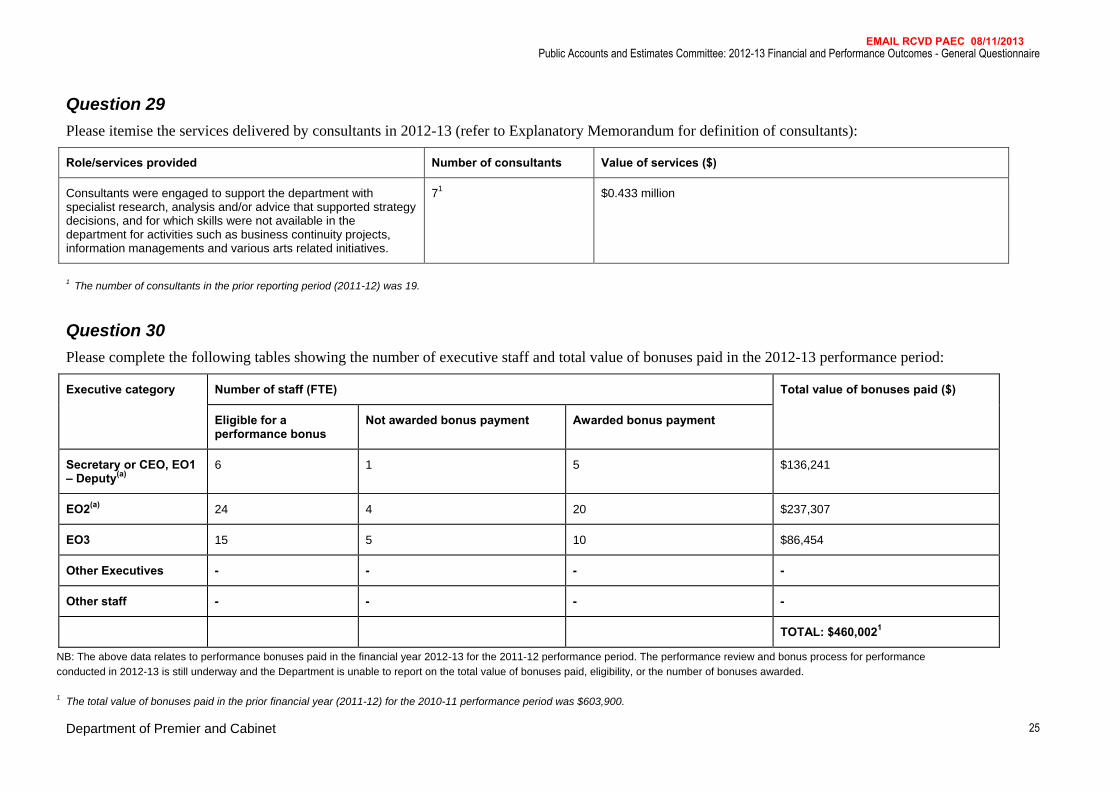
Question 29
Please itemise the services delivered by consultants in 2012-13 (refer to Explanatory Memorandum for definition of consultants):
Role/services provided Number of consultants Value of services ($)
Consultants were engaged to support the department with specialist research, analysis and/or advice that supported strategy decisions, and for which skills were not available in the department for activities such as business continuity projects, information managements and various arts related initiatives.
71 $0.433 million
1 The number of consultants in the prior reporting period (2011-12) was 19.
Question 30
Please complete the following tables showing the number of executive staff and total value of bonuses paid in the 2012-13 performance period:
Executive category Number of staff (FTE) Total value of bonuses paid ($)
Eligible for a performance bonus
Not awarded bonus payment Awarded bonus payment
Secretary or CEO, EO1 – Deputy(a)
6 1 5 $136,241
EO2(a) 24 4 20 $237,307
EO3 15 5 10 $86,454
Other Executives - - - -
Other staff - - - -
TOTAL: $460,0021
NB: The above data relates to performance bonuses paid in the financial year 2012-13 for the 2011-12 performance period. The performance review and bonus process for performance
conducted in 2012-13 is still underway and the Department is unable to report on the total value of bonuses paid, eligibility, or the number of bonuses awarded.
1 The total value of bonuses paid in the prior financial year (2011-12) for the 2010-11 performance period was $603,900.
EMAIL RCVD PAEC 08/11/2013
Public Accounts and Estimates Committee: 2012-13 Financial and Performance Outcomes - General Questionnaire
Department of Premier and Cabinet 26
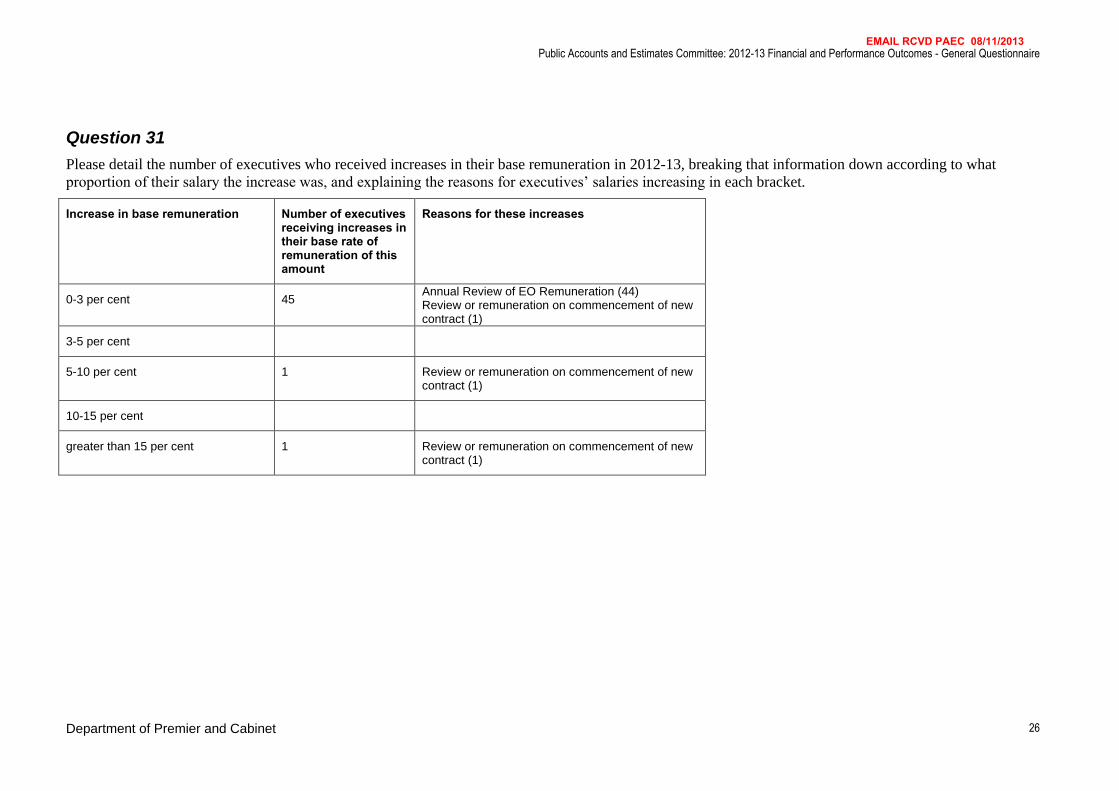
Question 31
Please detail the number of executives who received increases in their base remuneration in 2012-13, breaking that information down according to what
proportion of their salary the increase was, and explaining the reasons for executives’ salaries increasing in each bracket.
Increase in base remuneration Number of executives receiving increases in their base rate of remuneration of this amount
Reasons for these increases
0-3 per cent 45 Annual Review of EO Remuneration (44) Review or remuneration on commencement of new contract (1)
3-5 per cent
5-10 per cent 1 Review or remuneration on commencement of new contract (1)
10-15 per cent
greater than 15 per cent 1 Review or remuneration on commencement of new contract (1)
EMAIL RCVD PAEC 08/11/2013
Public Accounts and Estimates Committee: 2012-13 Financial and Performance Outcomes - General Questionnaire
Department of Premier and Cabinet 27
SECTION F: Program outcomes (departments only)
Outcomes and objectives reflect the impact on the community of the goods and services provided by a department. The questions in this section all relate to
the outcomes and objectives that your department contributed to in 2012-13.
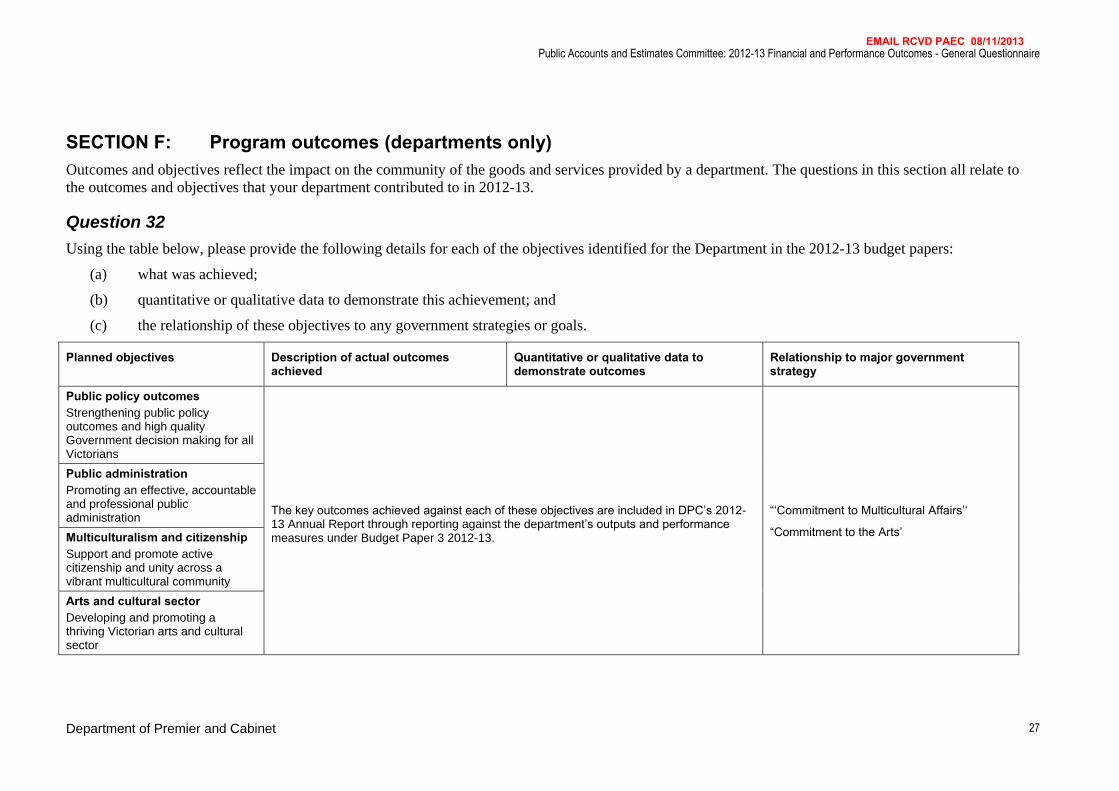
Question 32
Using the table below, please provide the following details for each of the objectives identified for the Department in the 2012-13 budget papers:
(a) what was achieved;
(b) quantitative or qualitative data to demonstrate this achievement; and
(c) the relationship of these objectives to any government strategies or goals.
Planned objectives Description of actual outcomes achieved
Quantitative or qualitative data to demonstrate outcomes
Relationship to major government strategy
Public policy outcomes Strengthening public policy outcomes and high quality Government decision making for all Victorians
The key outcomes achieved against each of these objectives are included in DPC’s 2012-13 Annual Report through reporting against the department’s outputs and performance measures under Budget Paper 3 2012-13.
“‘Commitment to Multicultural Affairs’‘
“Commitment to the Arts’
Public administration Promoting an effective, accountable and professional public administration
Multiculturalism and citizenship Support and promote active citizenship and unity across a vibrant multicultural community
Arts and cultural sector Developing and promoting a thriving Victorian arts and cultural sector
EMAIL RCVD PAEC 08/11/2013
Public Accounts and Estimates Committee: 2012-13 Financial and Performance Outcomes - General Questionnaire
Department of Premier and Cabinet 28
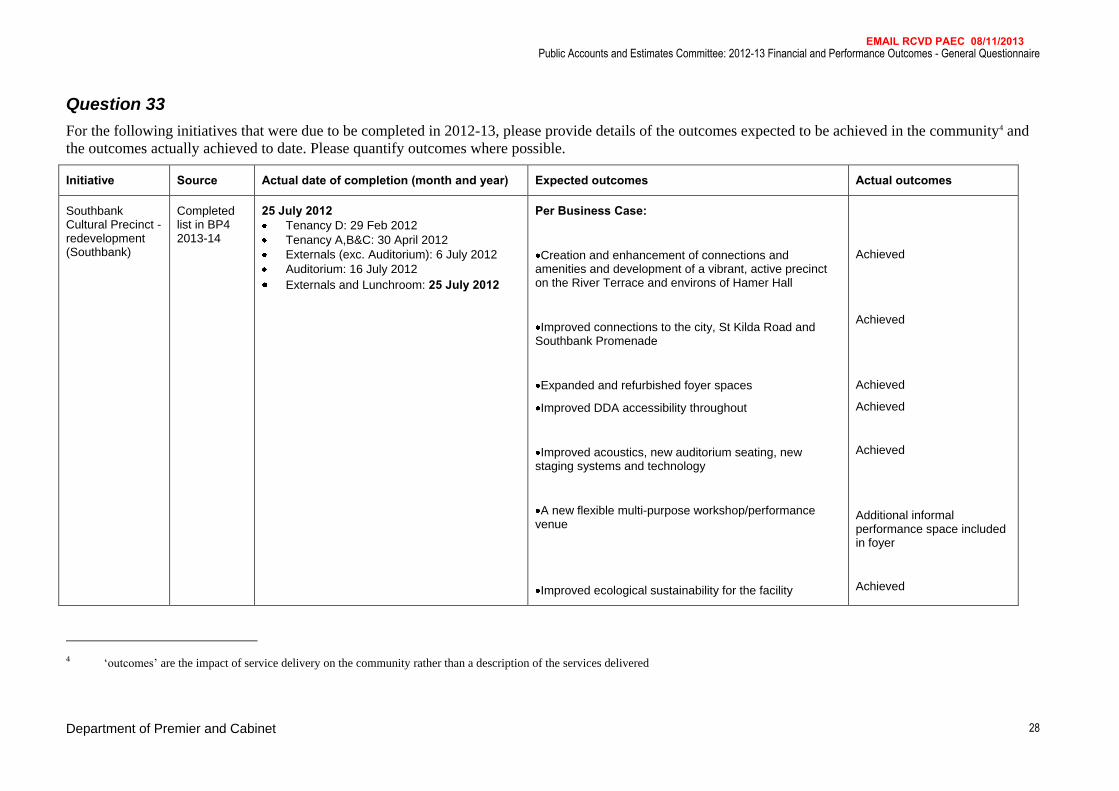
Question 33
For the following initiatives that were due to be completed in 2012-13, please provide details of the outcomes expected to be achieved in the community4 and
the outcomes actually achieved to date. Please quantify outcomes where possible.
Initiative Source Actual date of completion (month and year) Expected outcomes Actual outcomes
Southbank Cultural Precinct - redevelopment (Southbank)
Completed list in BP4 2013-14
25 July 2012 Tenancy D: 29 Feb 2012
Tenancy A,B&C: 30 April 2012
Externals (exc. Auditorium): 6 July 2012
Auditorium: 16 July 2012
Externals and Lunchroom: 25 July 2012
Per Business Case:
Creation and enhancement of connections and amenities and development of a vibrant, active precinct on the River Terrace and environs of Hamer Hall
Improved connections to the city, St Kilda Road and Southbank Promenade
Expanded and refurbished foyer spaces
Improved DDA accessibility throughout
Improved acoustics, new auditorium seating, new staging systems and technology
A new flexible multi-purpose workshop/performance venue
Improved ecological sustainability for the facility
Achieved
Achieved
Achieved
Achieved
Achieved
Additional informal performance space included in foyer
Achieved
4 ‘outcomes’ are the impact of service delivery on the community rather than a description of the services delivered
EMAIL RCVD PAEC 08/11/2013
Public Accounts and Estimates Committee: 2012-13 Financial and Performance Outcomes - General Questionnaire
Department of Premier and Cabinet 29
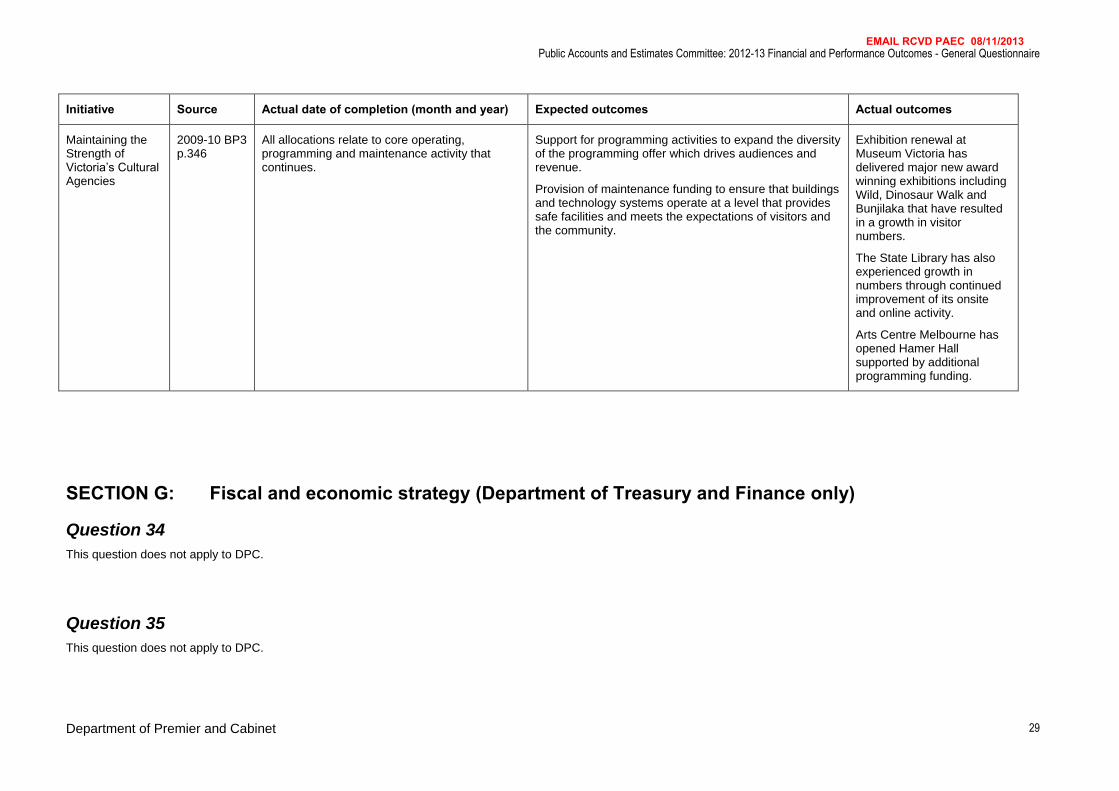
Initiative Source Actual date of completion (month and year) Expected outcomes Actual outcomes
Maintaining the Strength of Victoria’s Cultural Agencies
2009-10 BP3 p.346
All allocations relate to core operating, programming and maintenance activity that continues.
Support for programming activities to expand the diversity of the programming offer which drives audiences and revenue.
Provision of maintenance funding to ensure that buildings and technology systems operate at a level that provides safe facilities and meets the expectations of visitors and the community.
Exhibition renewal at Museum Victoria has delivered major new award winning exhibitions including Wild, Dinosaur Walk and Bunjilaka that have resulted in a growth in visitor numbers.
The State Library has also experienced growth in numbers through continued improvement of its onsite and online activity.
Arts Centre Melbourne has opened Hamer Hall supported by additional programming funding.
SECTION G: Fiscal and economic strategy (Department of Treasury and Finance only)
Question 34
This question does not apply to DPC.
Question 35
This question does not apply to DPC.
EMAIL RCVD PAEC 08/11/2013
Public Accounts and Estimates Committee: 2012-13 Financial and Performance Outcomes - General Questionnaire
Department of Premier and Cabinet 30
SECTION H: Previous recommendations
Question 36 (departments only)
For each of the following recommendations from the Committee’s Report on the 2009-10 and 2010-11 Financial and Performance Outcomes (report number
109) or Report on the 2011-12 Financial and Performance Outcomes (report number 115) that relates to an area relevant to your department or one of its
portfolio agencies, please indicate:
(a) whether or not the action specified in the recommendation has been implemented;
(b) if so, how it has been implemented and what publicly available information (if any) demonstrates the implementation of the recommendation; and
(c) if not, why not.
Report No.
Rec. No.
Recommendation Has the action specified in the recommendation been implemented?
If yes: If no:
How has it been implemented?
What publicly available information, if any, shows the implementation?
Why not?
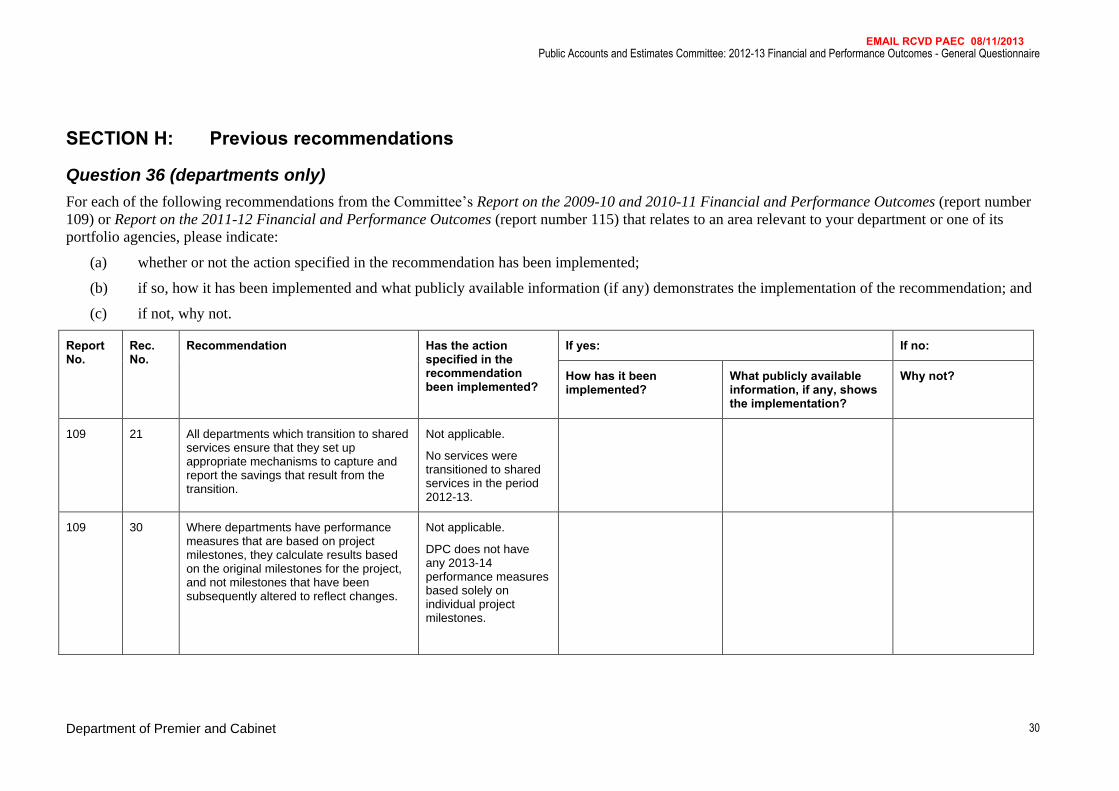
109
21 All departments which transition to shared services ensure that they set up appropriate mechanisms to capture and report the savings that result from the transition.
Not applicable.
No services were transitioned to shared services in the period 2012-13.
109
30 Where departments have performance measures that are based on project milestones, they calculate results based on the original milestones for the project, and not milestones that have been subsequently altered to reflect changes.
Not applicable.
DPC does not have any 2013-14 performance measures based solely on individual project milestones.
EMAIL RCVD PAEC 08/11/2013
Public Accounts and Estimates Committee: 2012-13 Financial and Performance Outcomes - General Questionnaire
Department of Premier and Cabinet 31
Report No.
Rec. No.
Recommendation Has the action specified in the recommendation been implemented?
If yes: If no:
How has it been implemented?
What publicly available information, if any, shows the implementation?
Why not?
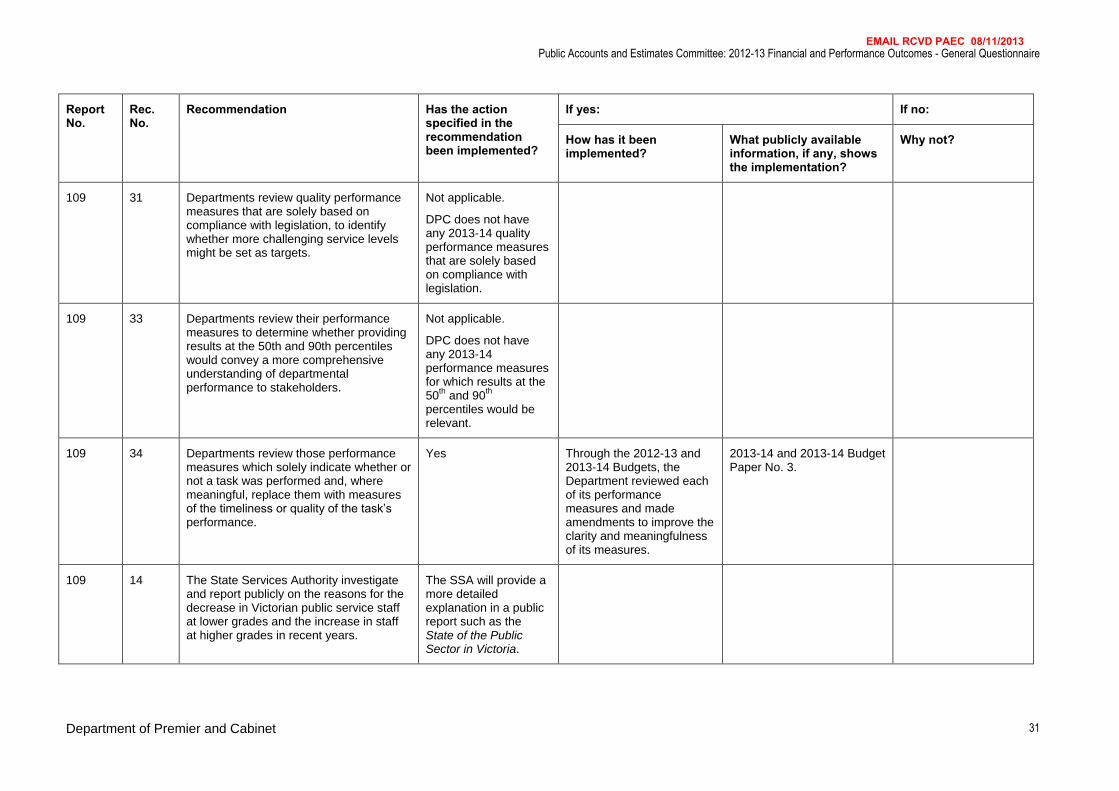
109
31 Departments review quality performance measures that are solely based on compliance with legislation, to identify whether more challenging service levels might be set as targets.
Not applicable.
DPC does not have any 2013-14 quality performance measures that are solely based on compliance with legislation.
109
33 Departments review their performance measures to determine whether providing results at the 50th and 90th percentiles would convey a more comprehensive understanding of departmental performance to stakeholders.
Not applicable.
DPC does not have any 2013-14 performance measures for which results at the 50
th and 90
th
percentiles would be relevant.
109
34 Departments review those performance measures which solely indicate whether or not a task was performed and, where meaningful, replace them with measures of the timeliness or quality of the task’s performance.
Yes Through the 2012-13 and 2013-14 Budgets, the Department reviewed each of its performance measures and made amendments to improve the clarity and meaningfulness of its measures.
2013-14 and 2013-14 Budget Paper No. 3.
109
14 The State Services Authority investigate and report publicly on the reasons for the decrease in Victorian public service staff at lower grades and the increase in staff at higher grades in recent years.
The SSA will provide a more detailed explanation in a public report such as the State of the Public Sector in Victoria.
EMAIL RCVD PAEC 08/11/2013
Public Accounts and Estimates Committee: 2012-13 Financial and Performance Outcomes - General Questionnaire
Department of Premier and Cabinet 32
Report No.
Rec. No.
Recommendation Has the action specified in the recommendation been implemented?
If yes: If no:
How has it been implemented?
What publicly available information, if any, shows the implementation?
Why not?
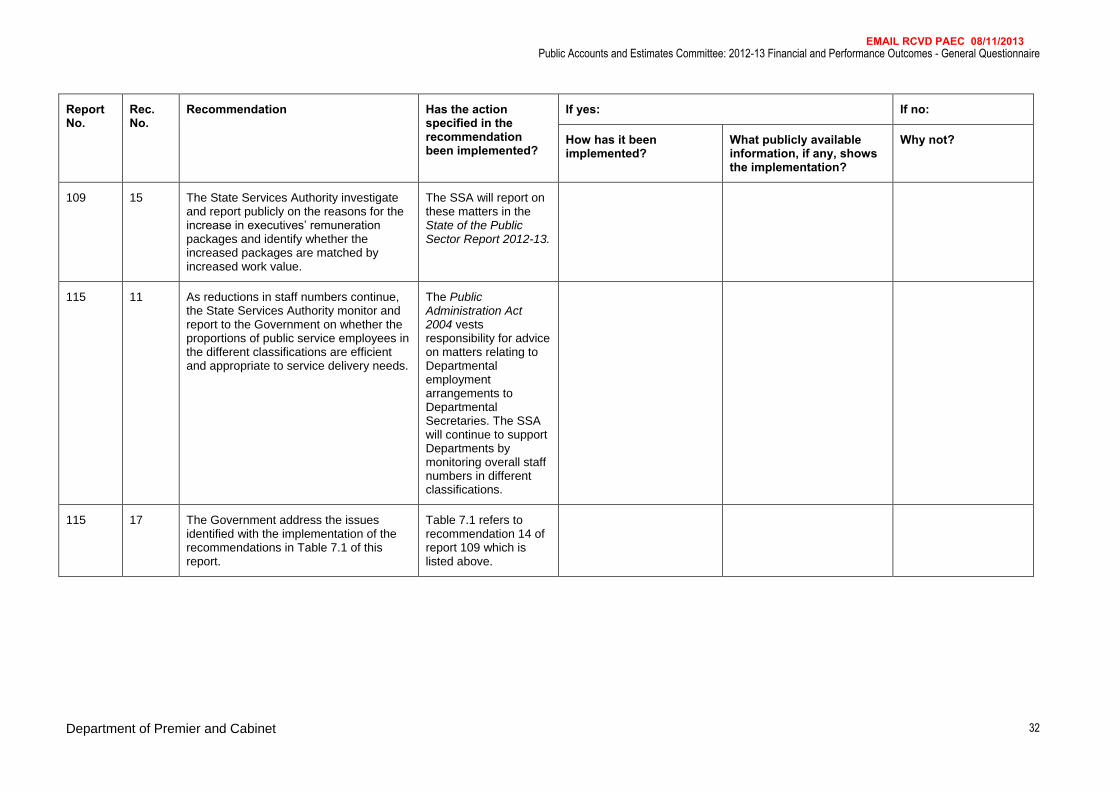
109
15 The State Services Authority investigate and report publicly on the reasons for the increase in executives’ remuneration packages and identify whether the increased packages are matched by increased work value.
The SSA will report on these matters in the State of the Public Sector Report 2012-13.
115
11 As reductions in staff numbers continue, the State Services Authority monitor and report to the Government on whether the proportions of public service employees in the different classifications are efficient and appropriate to service delivery needs.
The Public Administration Act 2004 vests responsibility for advice on matters relating to Departmental employment arrangements to Departmental Secretaries. The SSA will continue to support Departments by monitoring overall staff numbers in different classifications.
115
17 The Government address the issues identified with the implementation of the recommendations in Table 7.1 of this report.
Table 7.1 refers to recommendation 14 of report 109 which is listed above.
EMAIL RCVD PAEC 08/11/2013