Embed Size (px)
Citation preview
Public Accounts and Estimates Committee: 2015-16 Financial and Performance Outcomes General Questionnaire
1
PUBLIC ACCOUNTS AND ESTIMATES COMMITTEE
2015-16 FINANCIAL AND PERFORMANCE OUTCOMES GENERAL QUESTIONNAIRE
VICTORIA POLICE
email rcvd 13/12/2016
Public Accounts and Estimates Committee: 2015-16 Financial and Performance Outcomes General Questionnaire
2
SECTION A: Output variances and program outcomes
Question 1 (all departments) Completed initiatives from past budgets This question does not apply to your agency.
Question 2 (departments only) Treasurer’s advances and other budget supplementation This question does not apply to your agency.
Question 3 (Department of Treasury and Finance only) Revenue certification This question does not apply to your agency.
email rcvd 13/12/2016
Public Accounts and Estimates Committee: 2015-16 Financial and Performance Outcomes General Questionnaire
3
SECTION B: Asset investment (departments only)
Question 4 Details of actual investment and variance against budget – current projects This question does not apply to your agency.
Question 5 Details of actual investment and variance against budget – projects completed (or expected to be completed) This question does not apply to your agency.
Question 6 Major Projects Victoria and high-value high-risk projects This question does not apply to your agency.
Question 7 PPP expenditure and line items This question does not apply to your agency.
Question 8 Net cash flows from investments in financial assets for policy purposes – GGS This question does not apply to your agency.
Question 9 Net cash flows from investments in financial assets for policy purposes – SoV This question does not apply to your agency.
Question 10 (Department of Treasury and Finance only) Purchases of non-financial assets – government purpose classification This question does not apply to your agency.
email rcvd 13/12/2016
Public Accounts and Estimates Committee: 2015-16 Financial and Performance Outcomes General Questionnaire
4
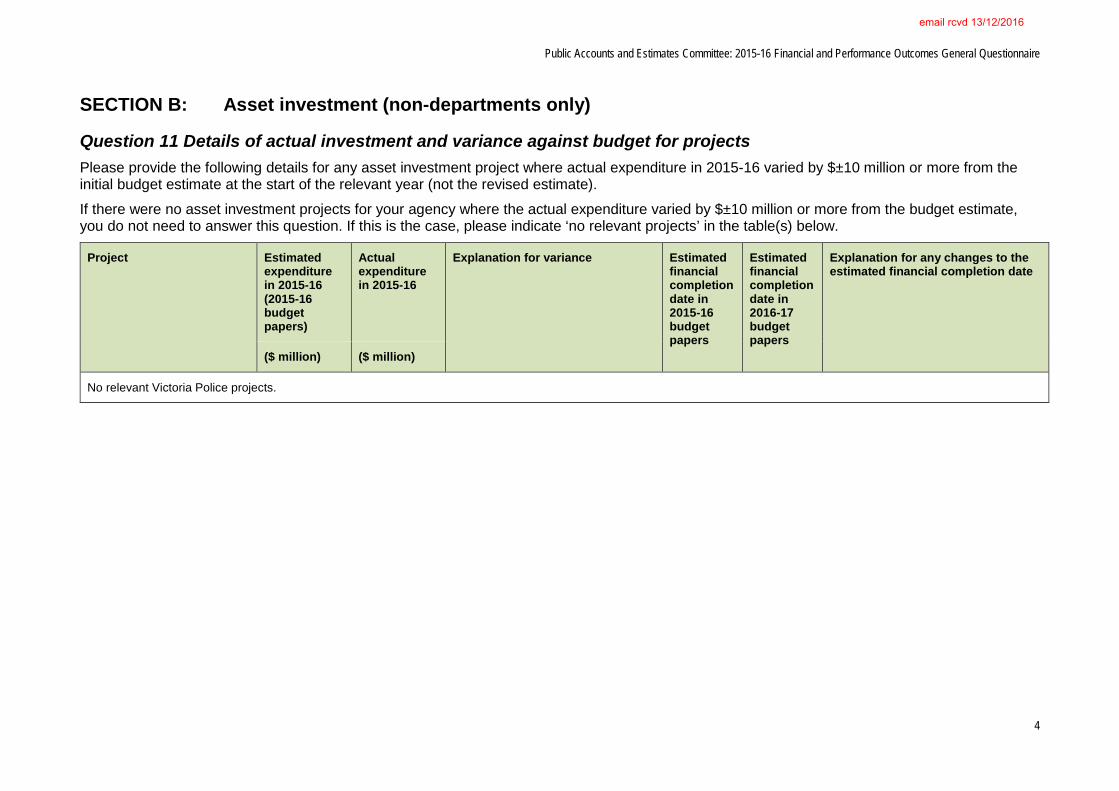
SECTION B: Asset investment (non-departments only)
Question 11 Details of actual investment and variance against budget for projects Please provide the following details for any asset investment project where actual expenditure in 2015-16 varied by $±10 million or more from the initial budget estimate at the start of the relevant year (not the revised estimate). If there were no asset investment projects for your agency where the actual expenditure varied by $±10 million or more from the budget estimate, you do not need to answer this question. If this is the case, please indicate ‘no relevant projects’ in the table(s) below.
Project Estimated expenditure in 2015-16 (2015-16 budget papers)
Actual expenditure in 2015-16
Explanation for variance Estimated financial completion date in 2015-16 budget papers
Estimated financial completion date in 2016-17 budget papers
Explanation for any changes to the estimated financial completion date
($ million) ($ million)
No relevant Victoria Police projects.
email rcvd 13/12/2016
Public Accounts and Estimates Committee: 2015-16 Financial and Performance Outcomes General Questionnaire
5
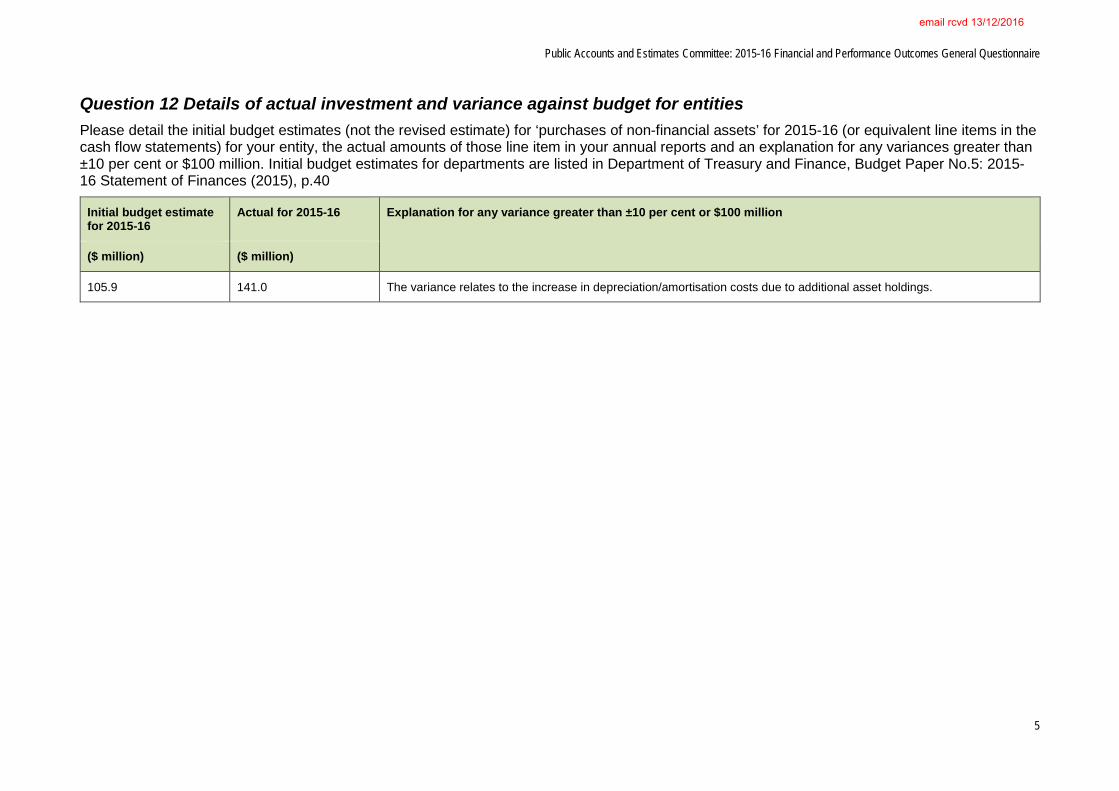
Question 12 Details of actual investment and variance against budget for entities Please detail the initial budget estimates (not the revised estimate) for ‘purchases of non-financial assets’ for 2015-16 (or equivalent line items in the cash flow statements) for your entity, the actual amounts of those line item in your annual reports and an explanation for any variances greater than ±10 per cent or $100 million. Initial budget estimates for departments are listed in Department of Treasury and Finance, Budget Paper No.5: 2015-16 Statement of Finances (2015), p.40
Initial budget estimate for 2015-16
Actual for 2015-16 Explanation for any variance greater than ±10 per cent or $100 million
($ million) ($ million)
105.9 141.0 The variance relates to the increase in depreciation/amortisation costs due to additional asset holdings.
email rcvd 13/12/2016
Public Accounts and Estimates Committee: 2015-16 Financial and Performance Outcomes General Questionnaire
6
SECTION C: Revenue and appropriations
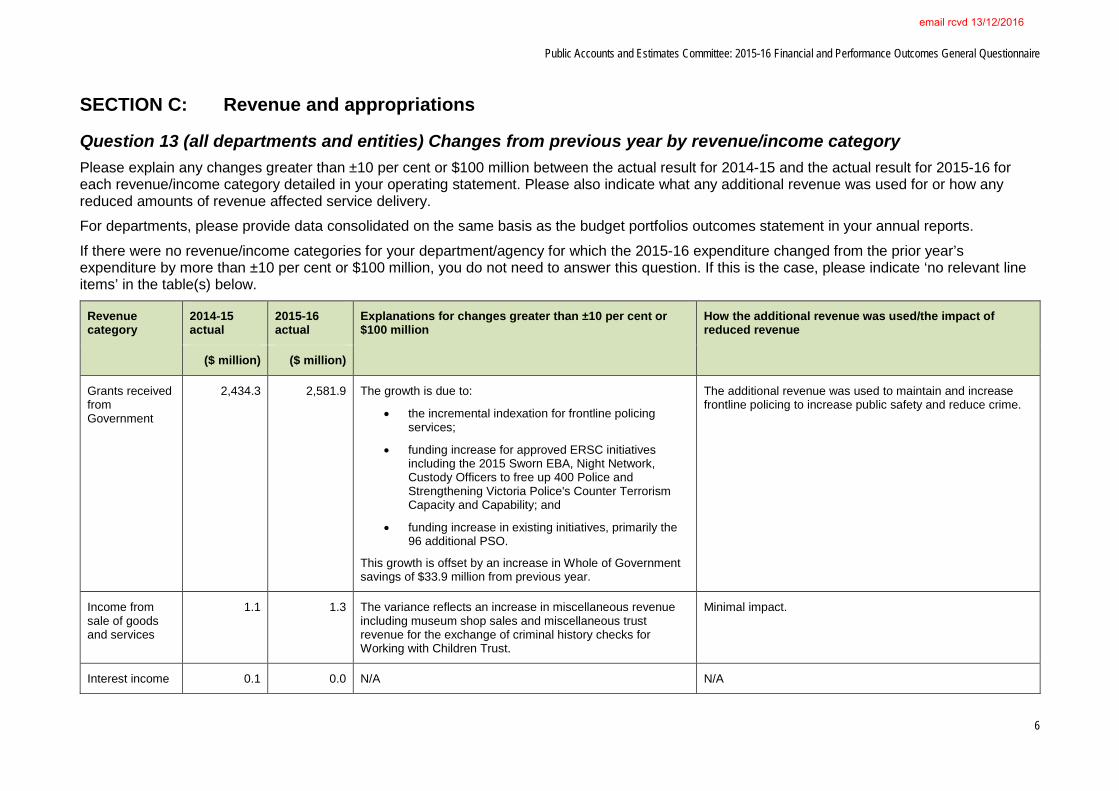
Question 13 (all departments and entities) Changes from previous year by revenue/income category Please explain any changes greater than ±10 per cent or $100 million between the actual result for 2014-15 and the actual result for 2015-16 for each revenue/income category detailed in your operating statement. Please also indicate what any additional revenue was used for or how any reduced amounts of revenue affected service delivery. For departments, please provide data consolidated on the same basis as the budget portfolios outcomes statement in your annual reports. If there were no revenue/income categories for your department/agency for which the 2015-16 expenditure changed from the prior year’s expenditure by more than ±10 per cent or $100 million, you do not need to answer this question. If this is the case, please indicate ‘no relevant line items’ in the table(s) below.
Revenue category
2014-15 actual
2015-16 actual
Explanations for changes greater than ±10 per cent or $100 million
How the additional revenue was used/the impact of reduced revenue
($ million) ($ million)
Grants received from Government
2,434.3 2,581.9 The growth is due to:
• the incremental indexation for frontline policing services;
• funding increase for approved ERSC initiatives including the 2015 Sworn EBA, Night Network, Custody Officers to free up 400 Police and Strengthening Victoria Police's Counter Terrorism Capacity and Capability; and
• funding increase in existing initiatives, primarily the 96 additional PSO.
This growth is offset by an increase in Whole of Government savings of $33.9 million from previous year.
The additional revenue was used to maintain and increase frontline policing to increase public safety and reduce crime.
Income from sale of goods and services
1.1 1.3 The variance reflects an increase in miscellaneous revenue including museum shop sales and miscellaneous trust revenue for the exchange of criminal history checks for Working with Children Trust.
Minimal impact.
Interest income 0.1 0.0 N/A N/A
email rcvd 13/12/2016
Public Accounts and Estimates Committee: 2015-16 Financial and Performance Outcomes General Questionnaire
7
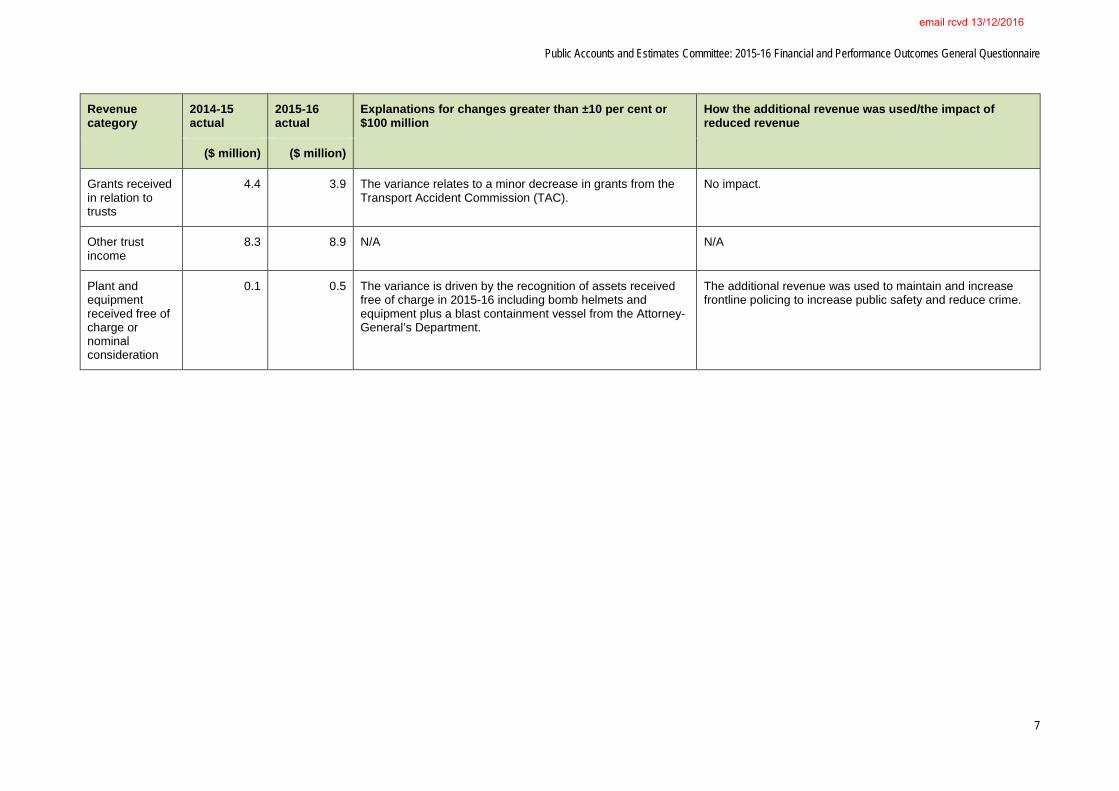
Revenue category
2014-15 actual
2015-16 actual
Explanations for changes greater than ±10 per cent or $100 million
How the additional revenue was used/the impact of reduced revenue
($ million) ($ million)
Grants received in relation to trusts
4.4 3.9 The variance relates to a minor decrease in grants from the Transport Accident Commission (TAC).
No impact.
Other trust income
8.3 8.9 N/A N/A
Plant and equipment received free of charge or nominal consideration
0.1 0.5 The variance is driven by the recognition of assets received free of charge in 2015-16 including bomb helmets and equipment plus a blast containment vessel from the Attorney-General’s Department.
The additional revenue was used to maintain and increase frontline policing to increase public safety and reduce crime.
email rcvd 13/12/2016
Public Accounts and Estimates Committee: 2015-16 Financial and Performance Outcomes General Questionnaire
8
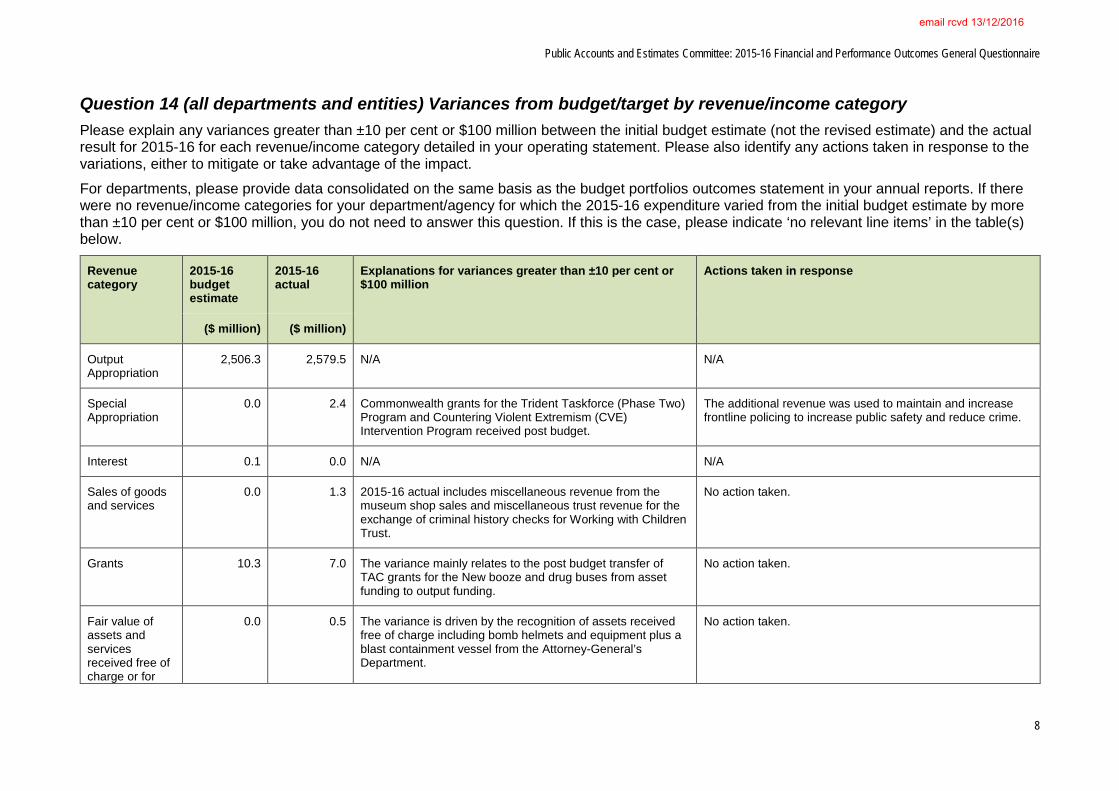
Question 14 (all departments and entities) Variances from budget/target by revenue/income category Please explain any variances greater than ±10 per cent or $100 million between the initial budget estimate (not the revised estimate) and the actual result for 2015-16 for each revenue/income category detailed in your operating statement. Please also identify any actions taken in response to the variations, either to mitigate or take advantage of the impact. For departments, please provide data consolidated on the same basis as the budget portfolios outcomes statement in your annual reports. If there were no revenue/income categories for your department/agency for which the 2015-16 expenditure varied from the initial budget estimate by more than ±10 per cent or $100 million, you do not need to answer this question. If this is the case, please indicate ‘no relevant line items’ in the table(s) below.
Revenue category
2015-16 budget estimate
2015-16 actual
Explanations for variances greater than ±10 per cent or $100 million
Actions taken in response
($ million) ($ million)
Output Appropriation
2,506.3 2,579.5 N/A N/A
Special Appropriation
0.0 2.4 Commonwealth grants for the Trident Taskforce (Phase Two) Program and Countering Violent Extremism (CVE) Intervention Program received post budget.
The additional revenue was used to maintain and increase frontline policing to increase public safety and reduce crime.
Interest 0.1 0.0 N/A N/A
Sales of goods and services
0.0 1.3 2015-16 actual includes miscellaneous revenue from the museum shop sales and miscellaneous trust revenue for the exchange of criminal history checks for Working with Children Trust.
No action taken.
Grants 10.3 7.0 The variance mainly relates to the post budget transfer of TAC grants for the New booze and drug buses from asset funding to output funding.
No action taken.
Fair value of assets and services received free of charge or for
0.0 0.5 The variance is driven by the recognition of assets received free of charge including bomb helmets and equipment plus a blast containment vessel from the Attorney-General’s Department.
No action taken.
email rcvd 13/12/2016
Public Accounts and Estimates Committee: 2015-16 Financial and Performance Outcomes General Questionnaire
9
Revenue category
2015-16 budget estimate
2015-16 actual
Explanations for variances greater than ±10 per cent or $100 million
Actions taken in response
($ million) ($ million)
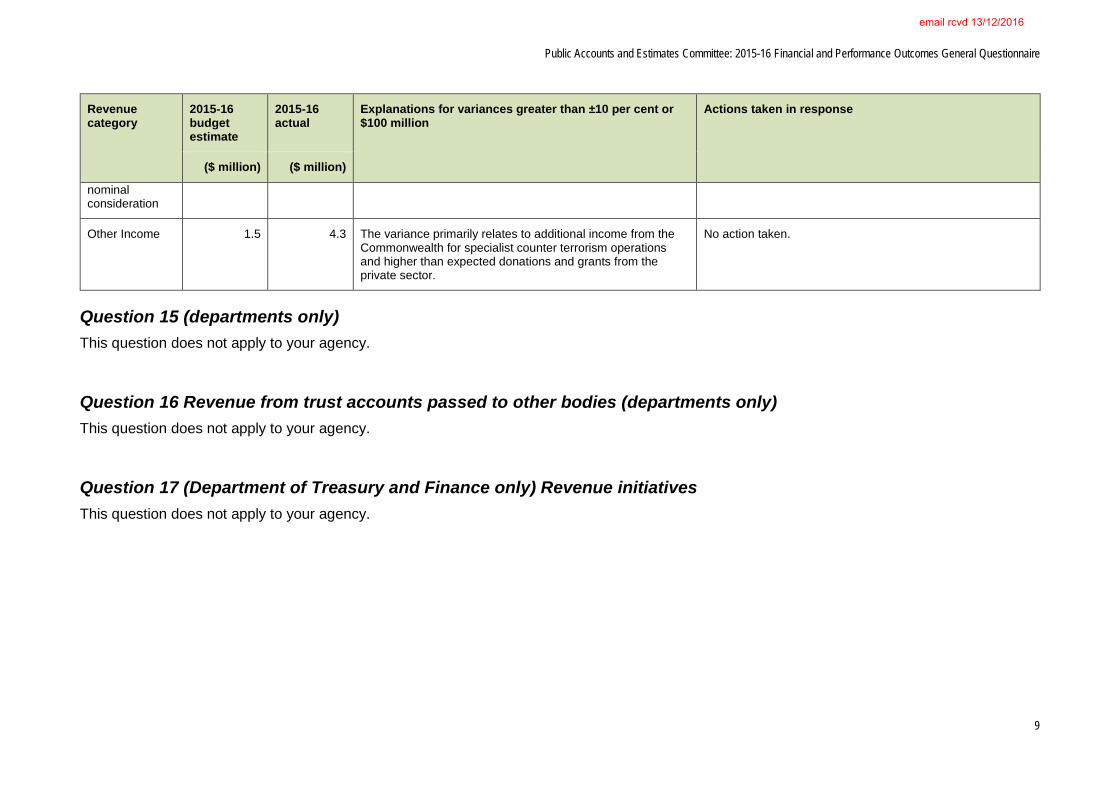
nominal consideration
Other Income 1.5 4.3 The variance primarily relates to additional income from the Commonwealth for specialist counter terrorism operations and higher than expected donations and grants from the private sector.
No action taken.
Question 15 (departments only) This question does not apply to your agency.
Question 16 Revenue from trust accounts passed to other bodies (departments only) This question does not apply to your agency.
Question 17 (Department of Treasury and Finance only) Revenue initiatives This question does not apply to your agency.
email rcvd 13/12/2016
Public Accounts and Estimates Committee: 2015-16 Financial and Performance Outcomes General Questionnaire
10
SECTION D: Expenses
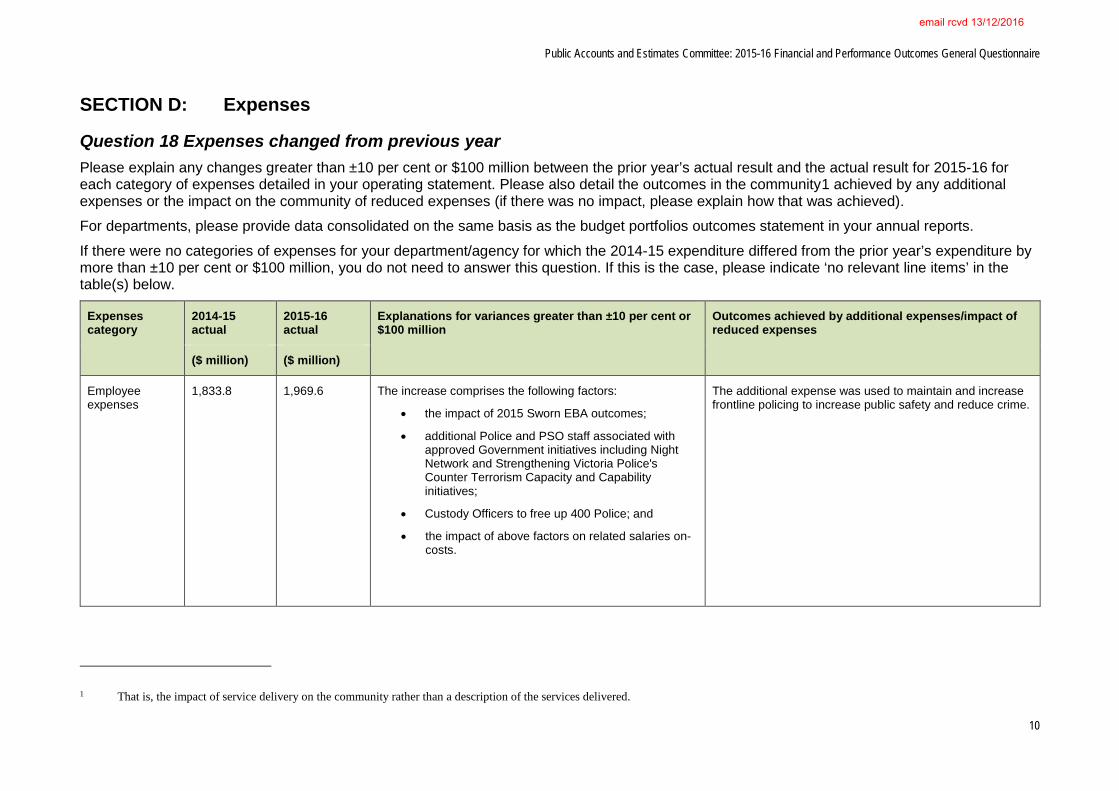
Question 18 Expenses changed from previous year Please explain any changes greater than ±10 per cent or $100 million between the prior year’s actual result and the actual result for 2015-16 for each category of expenses detailed in your operating statement. Please also detail the outcomes in the community1 achieved by any additional expenses or the impact on the community of reduced expenses (if there was no impact, please explain how that was achieved). For departments, please provide data consolidated on the same basis as the budget portfolios outcomes statement in your annual reports. If there were no categories of expenses for your department/agency for which the 2014-15 expenditure differed from the prior year’s expenditure by more than ±10 per cent or $100 million, you do not need to answer this question. If this is the case, please indicate ‘no relevant line items’ in the table(s) below.
Expenses category
2014-15 actual
2015-16 actual
Explanations for variances greater than ±10 per cent or $100 million
Outcomes achieved by additional expenses/impact of reduced expenses
($ million) ($ million)
Employee expenses
1,833.8 1,969.6 The increase comprises the following factors:
• the impact of 2015 Sworn EBA outcomes;
• additional Police and PSO staff associated with approved Government initiatives including Night Network and Strengthening Victoria Police's Counter Terrorism Capacity and Capability initiatives;
• Custody Officers to free up 400 Police; and
• the impact of above factors on related salaries on-costs.
The additional expense was used to maintain and increase frontline policing to increase public safety and reduce crime.
1 That is, the impact of service delivery on the community rather than a description of the services delivered.
email rcvd 13/12/2016
Public Accounts and Estimates Committee: 2015-16 Financial and Performance Outcomes General Questionnaire
11
Expenses category
2014-15 actual
2015-16 actual
Explanations for variances greater than ±10 per cent or $100 million
Outcomes achieved by additional expenses/impact of reduced expenses
($ million) ($ million)
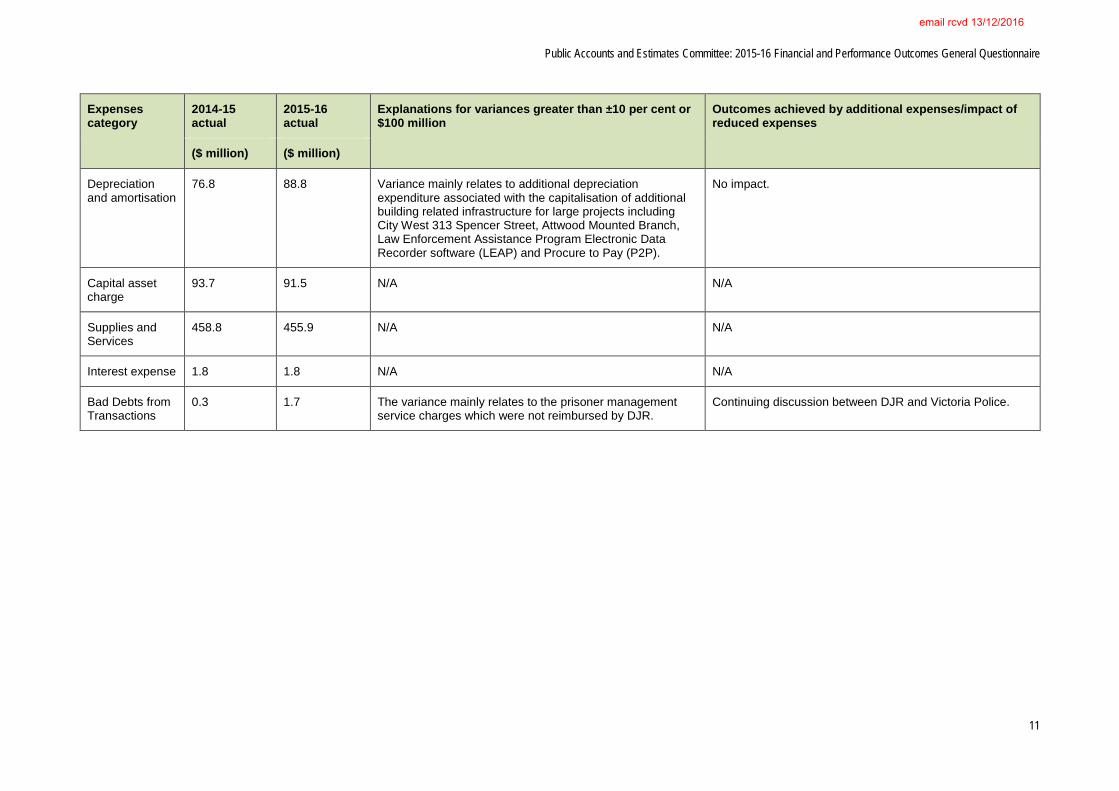
Depreciation and amortisation
76.8 88.8 Variance mainly relates to additional depreciation expenditure associated with the capitalisation of additional building related infrastructure for large projects including City West 313 Spencer Street, Attwood Mounted Branch, Law Enforcement Assistance Program Electronic Data Recorder software (LEAP) and Procure to Pay (P2P).
No impact.
Capital asset charge
93.7 91.5 N/A N/A
Supplies and Services
458.8 455.9 N/A N/A
Interest expense 1.8 1.8 N/A N/A
Bad Debts from Transactions
0.3 1.7 The variance mainly relates to the prisoner management service charges which were not reimbursed by DJR.
Continuing discussion between DJR and Victoria Police.
email rcvd 13/12/2016
Public Accounts and Estimates Committee: 2015-16 Financial and Performance Outcomes General Questionnaire
12
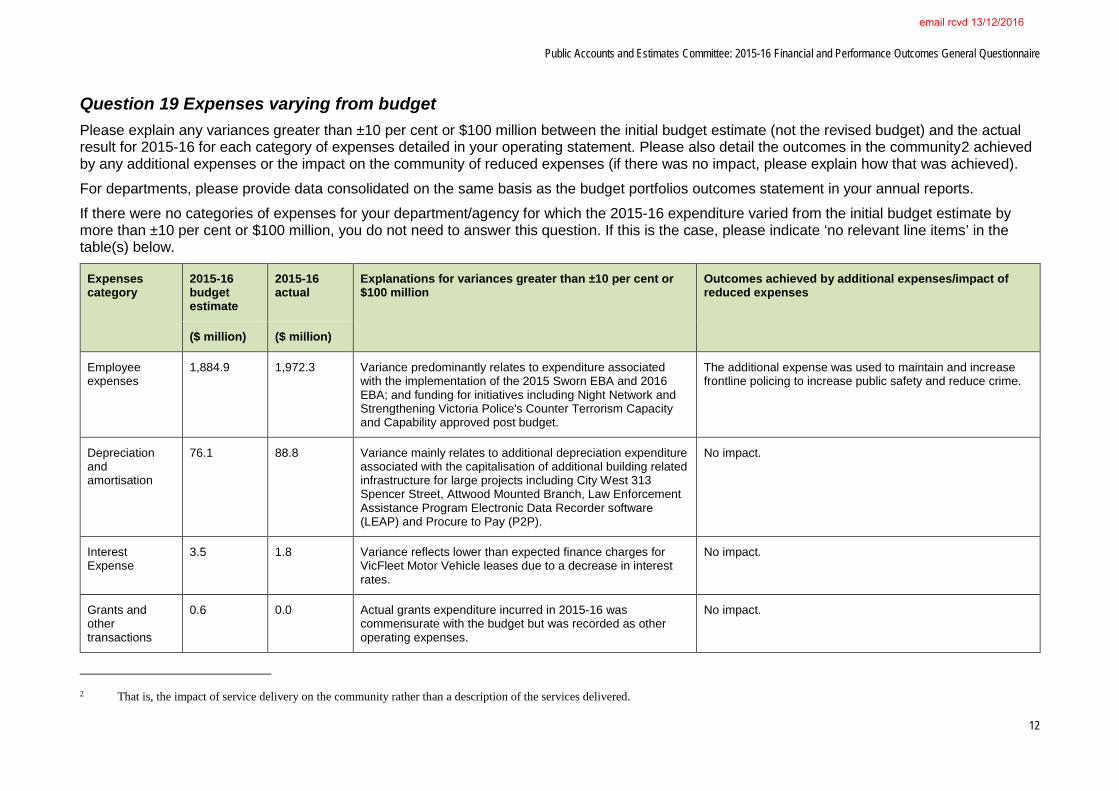
Question 19 Expenses varying from budget Please explain any variances greater than ±10 per cent or $100 million between the initial budget estimate (not the revised budget) and the actual result for 2015-16 for each category of expenses detailed in your operating statement. Please also detail the outcomes in the community2 achieved by any additional expenses or the impact on the community of reduced expenses (if there was no impact, please explain how that was achieved). For departments, please provide data consolidated on the same basis as the budget portfolios outcomes statement in your annual reports. If there were no categories of expenses for your department/agency for which the 2015-16 expenditure varied from the initial budget estimate by more than ±10 per cent or $100 million, you do not need to answer this question. If this is the case, please indicate ‘no relevant line items’ in the table(s) below.
Expenses category
2015-16 budget estimate
2015-16 actual
Explanations for variances greater than ±10 per cent or $100 million
Outcomes achieved by additional expenses/impact of reduced expenses
($ million) ($ million)
Employee expenses
1,884.9 1,972.3 Variance predominantly relates to expenditure associated with the implementation of the 2015 Sworn EBA and 2016 EBA; and funding for initiatives including Night Network and Strengthening Victoria Police's Counter Terrorism Capacity and Capability approved post budget.
The additional expense was used to maintain and increase frontline policing to increase public safety and reduce crime.
Depreciation and amortisation
76.1 88.8 Variance mainly relates to additional depreciation expenditure associated with the capitalisation of additional building related infrastructure for large projects including City West 313 Spencer Street, Attwood Mounted Branch, Law Enforcement Assistance Program Electronic Data Recorder software (LEAP) and Procure to Pay (P2P).
No impact.
Interest Expense
3.5 1.8 Variance reflects lower than expected finance charges for VicFleet Motor Vehicle leases due to a decrease in interest rates.
No impact.
Grants and other transactions
0.6 0.0 Actual grants expenditure incurred in 2015-16 was commensurate with the budget but was recorded as other operating expenses.
No impact.
2 That is, the impact of service delivery on the community rather than a description of the services delivered.
email rcvd 13/12/2016
Public Accounts and Estimates Committee: 2015-16 Financial and Performance Outcomes General Questionnaire
13
Expenses category
2015-16 budget estimate
2015-16 actual
Explanations for variances greater than ±10 per cent or $100 million
Outcomes achieved by additional expenses/impact of reduced expenses
($ million) ($ million)
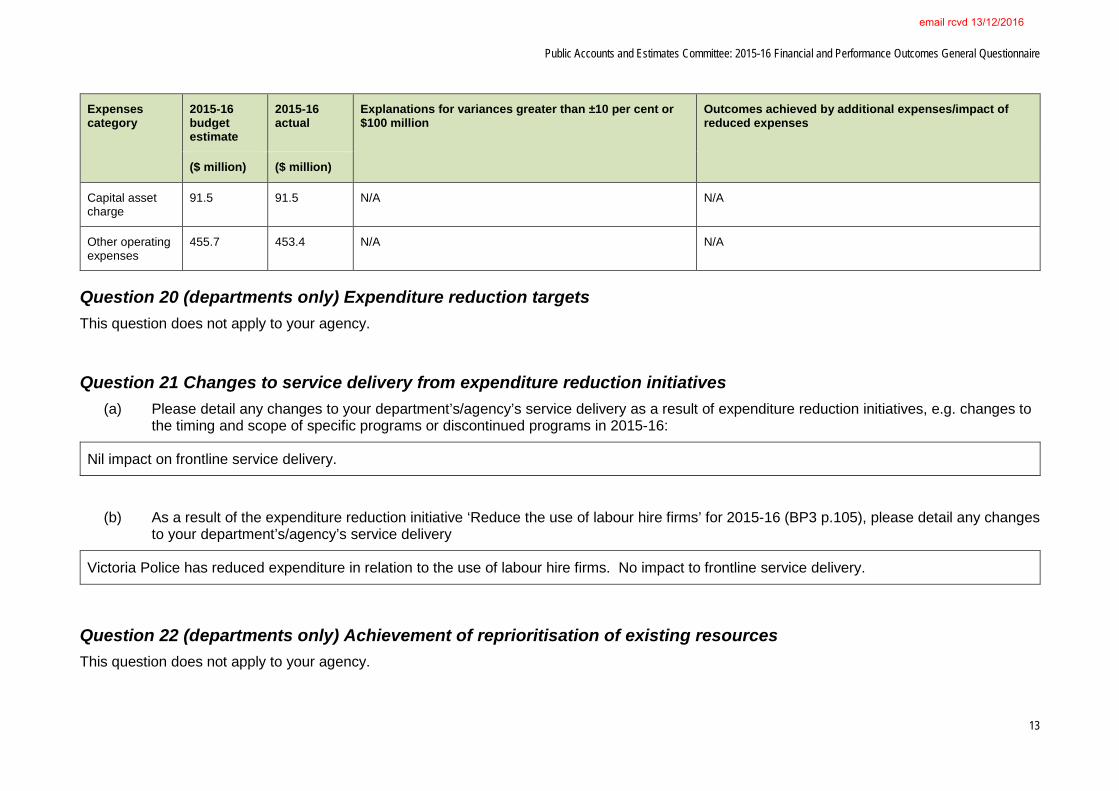
Capital asset charge
91.5 91.5 N/A N/A
Other operating expenses
455.7 453.4 N/A N/A
Question 20 (departments only) Expenditure reduction targets This question does not apply to your agency.
Question 21 Changes to service delivery from expenditure reduction initiatives (a) Please detail any changes to your department’s/agency’s service delivery as a result of expenditure reduction initiatives, e.g. changes to
the timing and scope of specific programs or discontinued programs in 2015-16:
Nil impact on frontline service delivery.
(b) As a result of the expenditure reduction initiative ‘Reduce the use of labour hire firms’ for 2015-16 (BP3 p.105), please detail any changes
to your department’s/agency’s service delivery
Victoria Police has reduced expenditure in relation to the use of labour hire firms. No impact to frontline service delivery.
Question 22 (departments only) Achievement of reprioritisation of existing resources This question does not apply to your agency.
email rcvd 13/12/2016
Public Accounts and Estimates Committee: 2015-16 Financial and Performance Outcomes General Questionnaire
14
Question 23 (Department of Treasury and Finance only) Expenses by government purpose classifications This question does not apply to your agency.
Question 24 (PNFC and PFC entities only) Dividends paid to the general government sector This question does not apply to your agency.
email rcvd 13/12/2016
Public Accounts and Estimates Committee: 2015-16 Financial and Performance Outcomes General Questionnaire
15
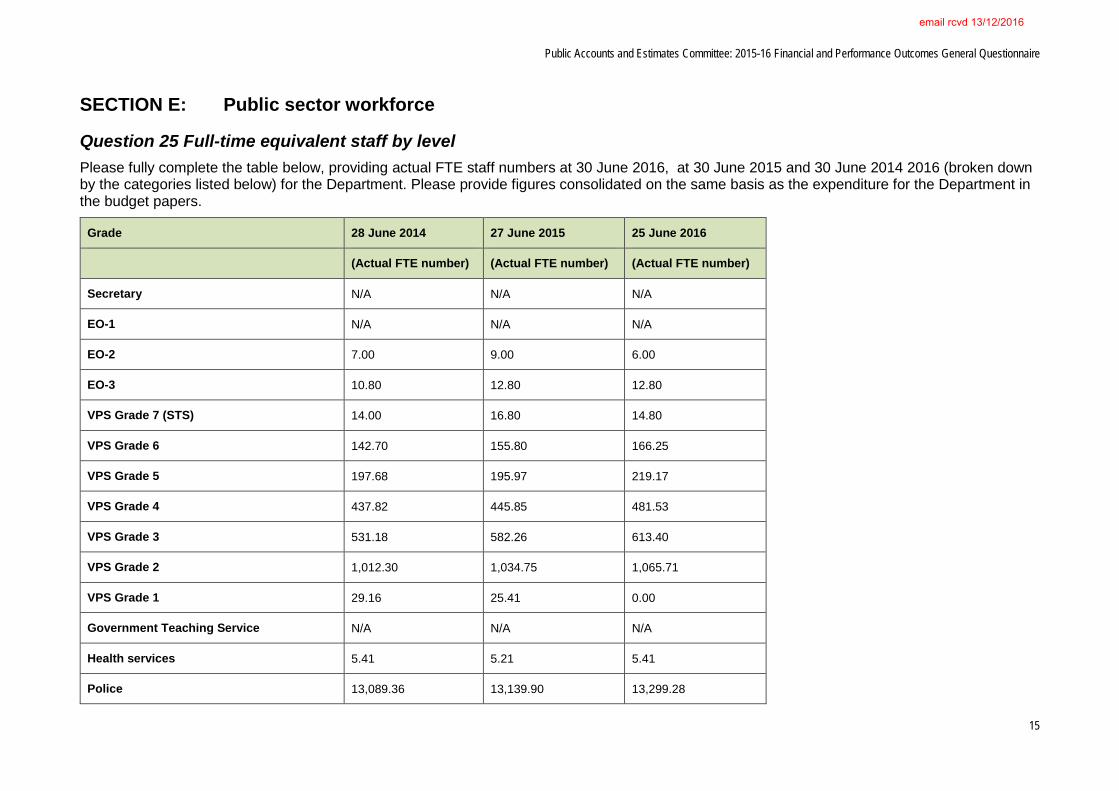
SECTION E: Public sector workforce
Question 25 Full-time equivalent staff by level Please fully complete the table below, providing actual FTE staff numbers at 30 June 2016, at 30 June 2015 and 30 June 2014 2016 (broken down by the categories listed below) for the Department. Please provide figures consolidated on the same basis as the expenditure for the Department in the budget papers.
Grade 28 June 2014 27 June 2015 25 June 2016
(Actual FTE number) (Actual FTE number) (Actual FTE number)
Secretary N/A N/A N/A
EO-1 N/A N/A N/A
EO-2 7.00 9.00 6.00
EO-3 10.80 12.80 12.80
VPS Grade 7 (STS) 14.00 16.80 14.80
VPS Grade 6 142.70 155.80 166.25
VPS Grade 5 197.68 195.97 219.17
VPS Grade 4 437.82 445.85 481.53
VPS Grade 3 531.18 582.26 613.40
VPS Grade 2 1,012.30 1,034.75 1,065.71
VPS Grade 1 29.16 25.41 0.00
Government Teaching Service N/A N/A N/A
Health services 5.41 5.21 5.41
Police 13,089.36 13,139.90 13,299.28
email rcvd 13/12/2016
Public Accounts and Estimates Committee: 2015-16 Financial and Performance Outcomes General Questionnaire
16
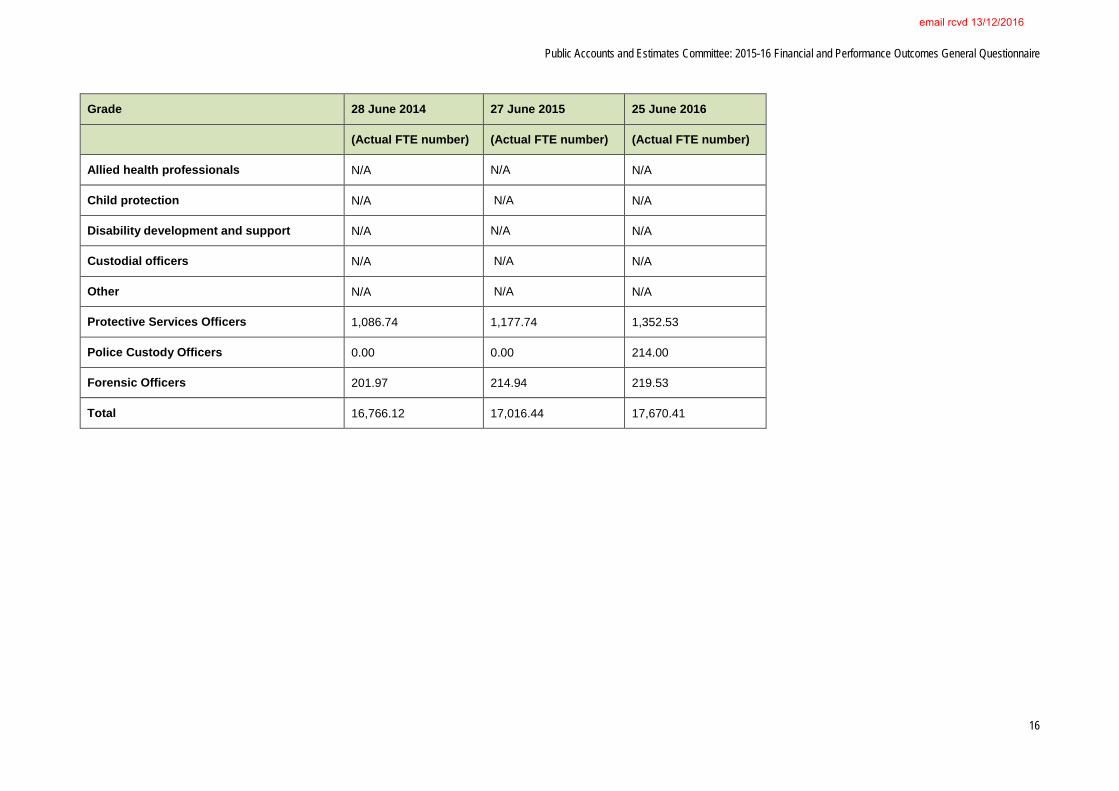
Grade 28 June 2014 27 June 2015 25 June 2016
(Actual FTE number) (Actual FTE number) (Actual FTE number)
Allied health professionals N/A N/A N/A
Child protection N/A N/A N/A
Disability development and support N/A N/A N/A
Custodial officers N/A N/A N/A
Other N/A N/A N/A
Protective Services Officers 1,086.74 1,177.74 1,352.53
Police Custody Officers 0.00 0.00 214.00
Forensic Officers 201.97 214.94 219.53
Total 16,766.12 17,016.44 17,670.41
email rcvd 13/12/2016
Public Accounts and Estimates Committee: 2015-16 Financial and Performance Outcomes General Questionnaire
17
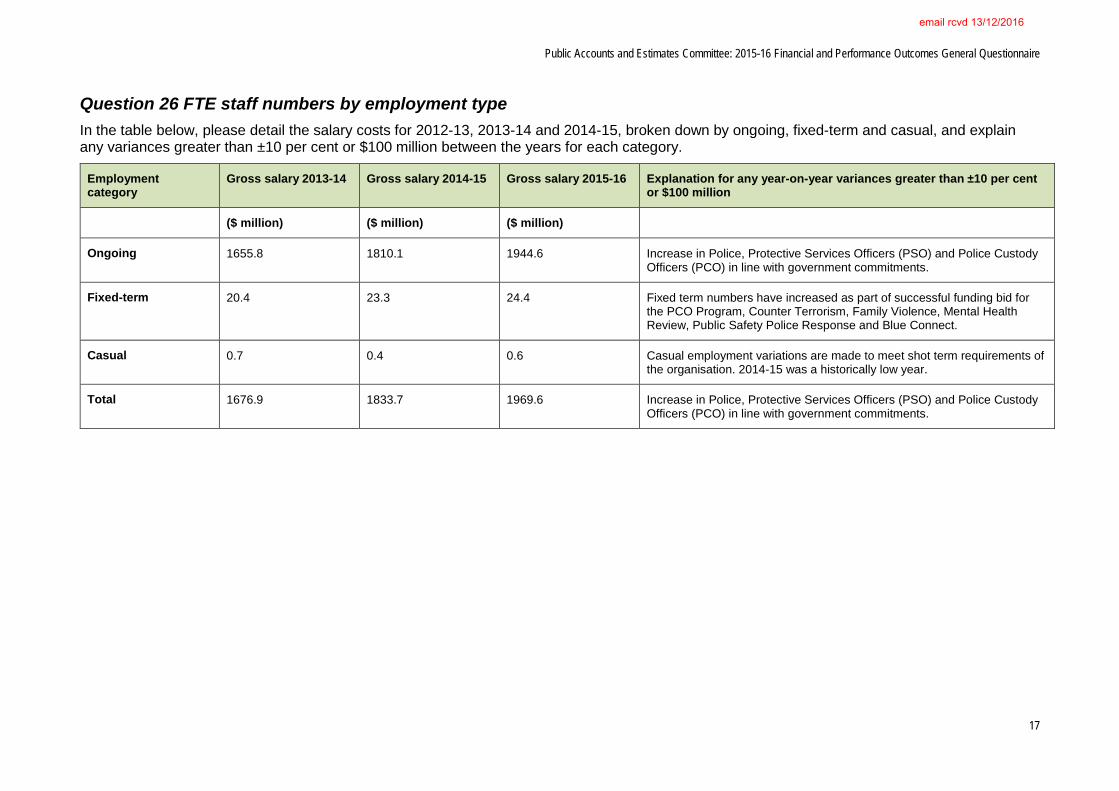
Question 26 FTE staff numbers by employment type In the table below, please detail the salary costs for 2012-13, 2013-14 and 2014-15, broken down by ongoing, fixed-term and casual, and explain any variances greater than ±10 per cent or $100 million between the years for each category.
Employment category
Gross salary 2013-14 Gross salary 2014-15 Gross salary 2015-16 Explanation for any year-on-year variances greater than ±10 per cent or $100 million
($ million) ($ million) ($ million)
Ongoing 1655.8 1810.1 1944.6 Increase in Police, Protective Services Officers (PSO) and Police Custody Officers (PCO) in line with government commitments.
Fixed-term 20.4 23.3 24.4 Fixed term numbers have increased as part of successful funding bid for the PCO Program, Counter Terrorism, Family Violence, Mental Health Review, Public Safety Police Response and Blue Connect.
Casual 0.7 0.4 0.6 Casual employment variations are made to meet shot term requirements of the organisation. 2014-15 was a historically low year.
Total 1676.9 1833.7 1969.6 Increase in Police, Protective Services Officers (PSO) and Police Custody Officers (PCO) in line with government commitments.
email rcvd 13/12/2016

Public Accounts and Estimates Committee: 2015-16 Financial and Performance Outcomes General Questionnaire
18
Question 27 Executive salary increases Please detail the number of executives who received increases in their base remuneration in 2015-16, breaking that information down according to what proportion of their salary the increase was, and explaining the reasons for executives’ salaries increasing in each bracket.
Increase in base remuneration Number of executives receiving increases in their base rate of remuneration of this amount in 2015-16
Reasons for these increases
0-3 per cent 21 Received the 2.5% annual remuneration review effective 1 July 2015.
3-5 per cent 0 N/A
5-10 per cent 6 These 6 members (5x sworn, 1x VPS) gained increases as a result of moving to new roles or successfully applying for ad-hoc remuneration reviews, also received the annual remuneration review on 1 July 2015.
10-15 per cent 2 These 2 VPS members received remuneration reviews with new contract/successful ad-hoc remuneration review request, also received the annual remuneration review on 1 July 2015.
greater than 15 per cent 5 These 5 members (4x sworn, 1x VPS) were all promoted or moved to Executive Command roles which attract significantly increased responsibility, also received the annual remuneration review on 1 July 2015.
email rcvd 13/12/2016
Public Accounts and Estimates Committee: 2015-16 Financial and Performance Outcomes General Questionnaire
19
Question 28 Enterprise bargain agreements (EBA)(Department of Treasury and Finance only) This question does not apply to your agency.
email rcvd 13/12/2016
Public Accounts and Estimates Committee: 2015-16 Financial and Performance Outcomes General Questionnaire
20
SECTION F: Inter-sector flows
Question 29 (Department of Treasury and Finance only) Inter-sector flows This question does not apply to your agency.
email rcvd 13/12/2016
Public Accounts and Estimates Committee: 2015-16 Financial and Performance Outcomes General Questionnaire
21
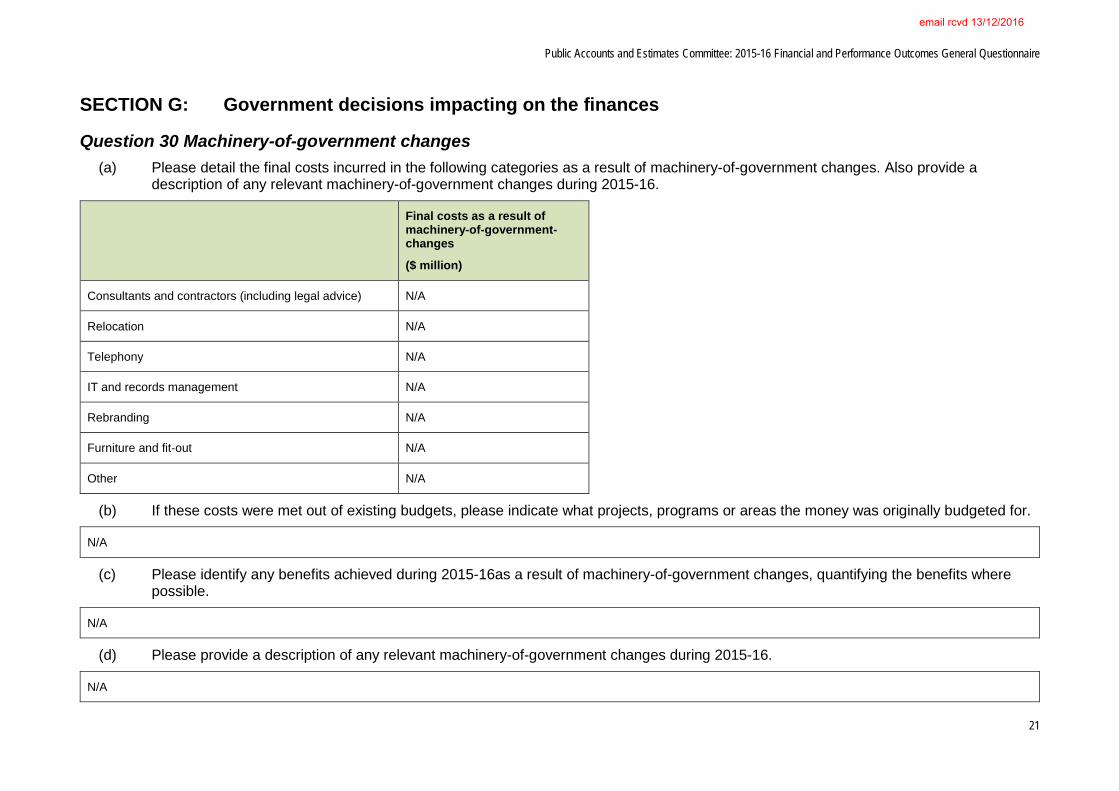
SECTION G: Government decisions impacting on the finances
Question 30 Machinery-of-government changes (a) Please detail the final costs incurred in the following categories as a result of machinery-of-government changes. Also provide a
description of any relevant machinery-of-government changes during 2015-16.
Final costs as a result of machinery-of-government-changes
($ million)
Consultants and contractors (including legal advice) N/A
Relocation N/A
Telephony N/A
IT and records management N/A
Rebranding N/A
Furniture and fit‐out N/A
Other N/A
(b) If these costs were met out of existing budgets, please indicate what projects, programs or areas the money was originally budgeted for.
N/A
(c) Please identify any benefits achieved during 2015-16as a result of machinery-of-government changes, quantifying the benefits where possible.
N/A
(d) Please provide a description of any relevant machinery-of-government changes during 2015-16.
N/A
email rcvd 13/12/2016
Public Accounts and Estimates Committee: 2015-16 Financial and Performance Outcomes General Questionnaire
22
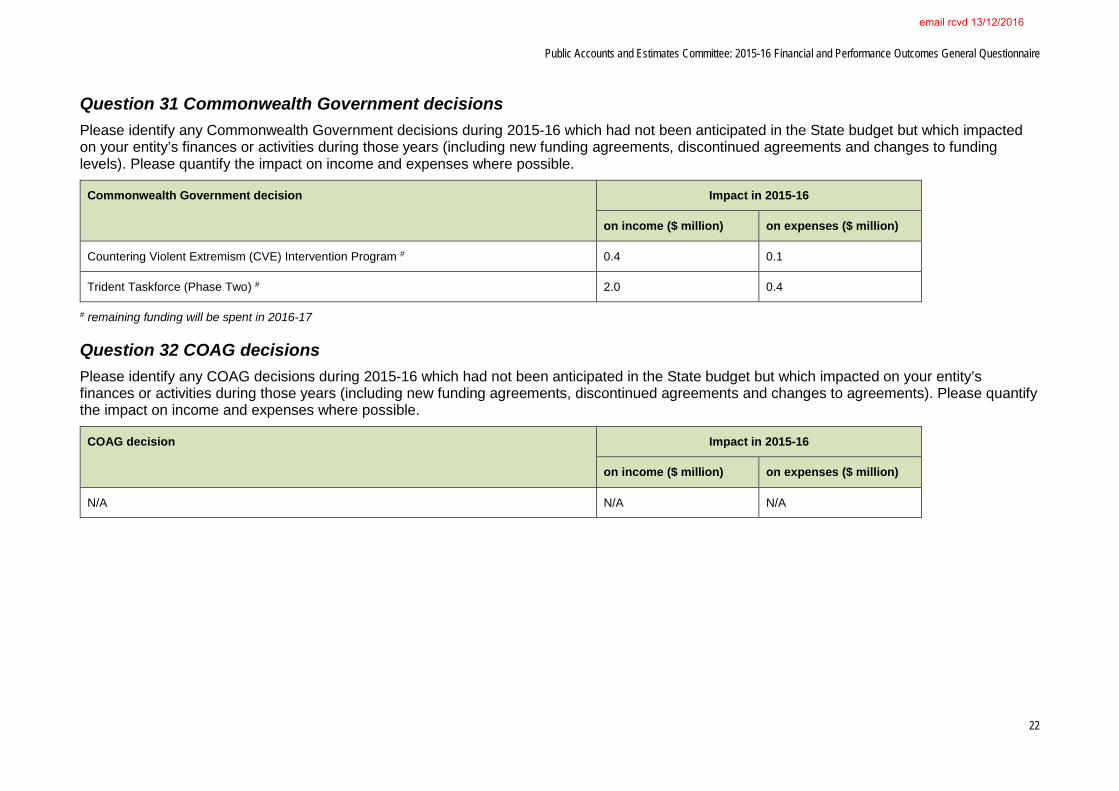
Question 31 Commonwealth Government decisions Please identify any Commonwealth Government decisions during 2015-16 which had not been anticipated in the State budget but which impacted on your entity’s finances or activities during those years (including new funding agreements, discontinued agreements and changes to funding levels). Please quantify the impact on income and expenses where possible.
Commonwealth Government decision Impact in 2015-16
on income ($ million) on expenses ($ million)
Countering Violent Extremism (CVE) Intervention Program # 0.4 0.1
Trident Taskforce (Phase Two) # 2.0 0.4
# remaining funding will be spent in 2016-17
Question 32 COAG decisions Please identify any COAG decisions during 2015-16 which had not been anticipated in the State budget but which impacted on your entity’s finances or activities during those years (including new funding agreements, discontinued agreements and changes to agreements). Please quantify the impact on income and expenses where possible.
COAG decision Impact in 2015-16
on income ($ million) on expenses ($ million)
N/A N/A N/A
email rcvd 13/12/2016
Public Accounts and Estimates Committee: 2015-16 Financial and Performance Outcomes General Questionnaire
23
SECTION H: Fiscal and financial management strategies (Department of Treasury and Finance only)
Question 33 Financial measures This question does not apply to your agency.
Question 34 Long-term financial management objectives This question does not apply to your agency.
email rcvd 13/12/2016
Public Accounts and Estimates Committee: 2015-16 Financial and Performance Outcomes General Questionnaire
24
SECTION I: Economic environment
Question 35 (Department of Treasury and Finance only) Economic variables This question does not apply to your agency.
Question 36 (Department of Treasury and Finance only) Actual impact on GGS of variances in economic variables This question does not apply to your agency.
Question 37 (Department of Treasury and Finance only) Impact on PFC net result of variances in economic variables This question does not apply to your agency.
Question 38 (Department of Treasury and Finance only) Impact on PNFC net result of variances in economic variables This question does not apply to your agency.
email rcvd 13/12/2016
Public Accounts and Estimates Committee: 2015-16 Financial and Performance Outcomes General Questionnaire
25
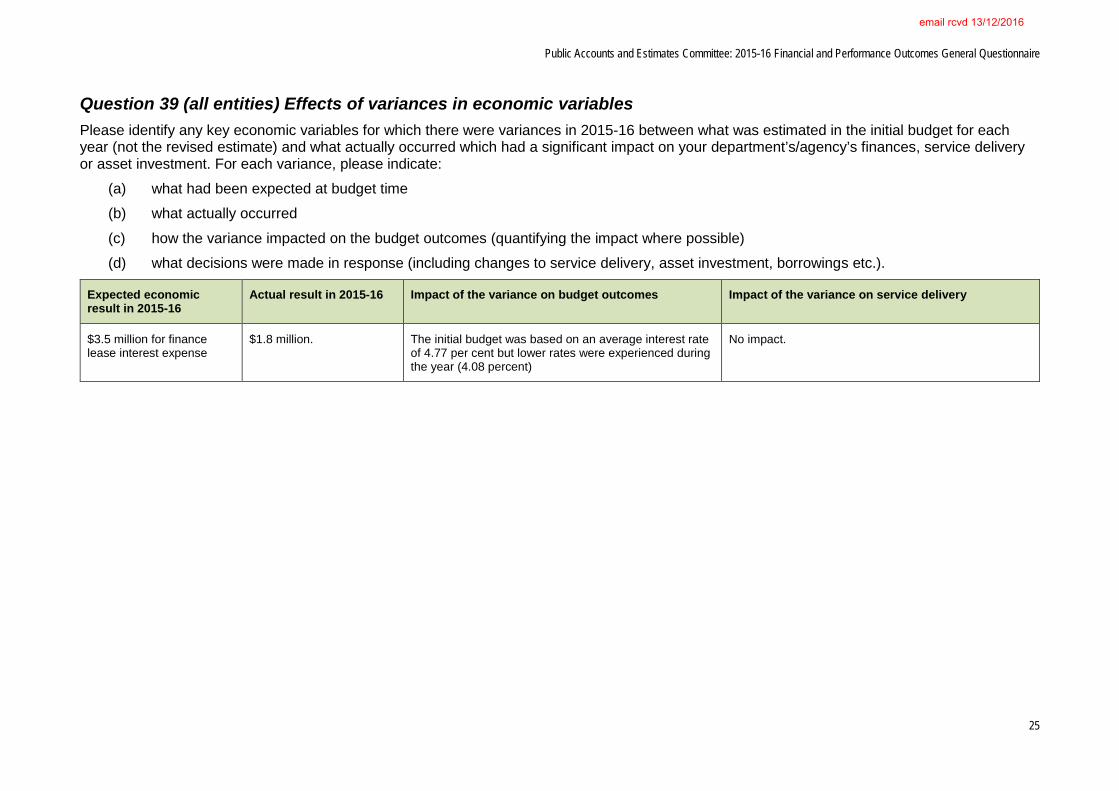
Question 39 (all entities) Effects of variances in economic variables Please identify any key economic variables for which there were variances in 2015-16 between what was estimated in the initial budget for each year (not the revised estimate) and what actually occurred which had a significant impact on your department’s/agency’s finances, service delivery or asset investment. For each variance, please indicate:
(a) what had been expected at budget time (b) what actually occurred (c) how the variance impacted on the budget outcomes (quantifying the impact where possible) (d) what decisions were made in response (including changes to service delivery, asset investment, borrowings etc.).
Expected economic result in 2015-16
Actual result in 2015-16 Impact of the variance on budget outcomes Impact of the variance on service delivery
$3.5 million for finance lease interest expense
$1.8 million. The initial budget was based on an average interest rate of 4.77 per cent but lower rates were experienced during the year (4.08 percent)
No impact.
email rcvd 13/12/2016