Embed Size (px)
Citation preview

PT Indosat Tbk 1Q 2015 Results
2 Indosat Presentation 1Q 2015 Results
Agenda
Financial and Operational Highlights
Management Focus and Key Updates
Supplemental Information

3
Financial and Operational Highlights

4 Indosat Presentation 1Q 2015 Results
1Q15 QoQ Overview
Consolidated Revenue decreased 4.3% to IDR 6,093 billion
EBITDA increased 5.9% to IDR 2,604 billion, EBITDA Margin reached 42.7%
Loss Attributable to Owners of The Company decreased to a loss of IDR 456 billion
Free Cash Flow increased to IDR 481 billion

5 Indosat Presentation 1Q 2015 Results
1Q15 YoY Overview
Consolidated Revenue increased 5.5% to IDR 6,093 billion
EBITDA flat at IDR 2,604 billion, EBITDA Margin reached 42.7%
Profit Attributable to Owners of The Company decreased to a loss of IDR 456 billion
Free Cash Flow decreased to IDR 481 billion
6 Indosat Presentation 1Q 2015 Results
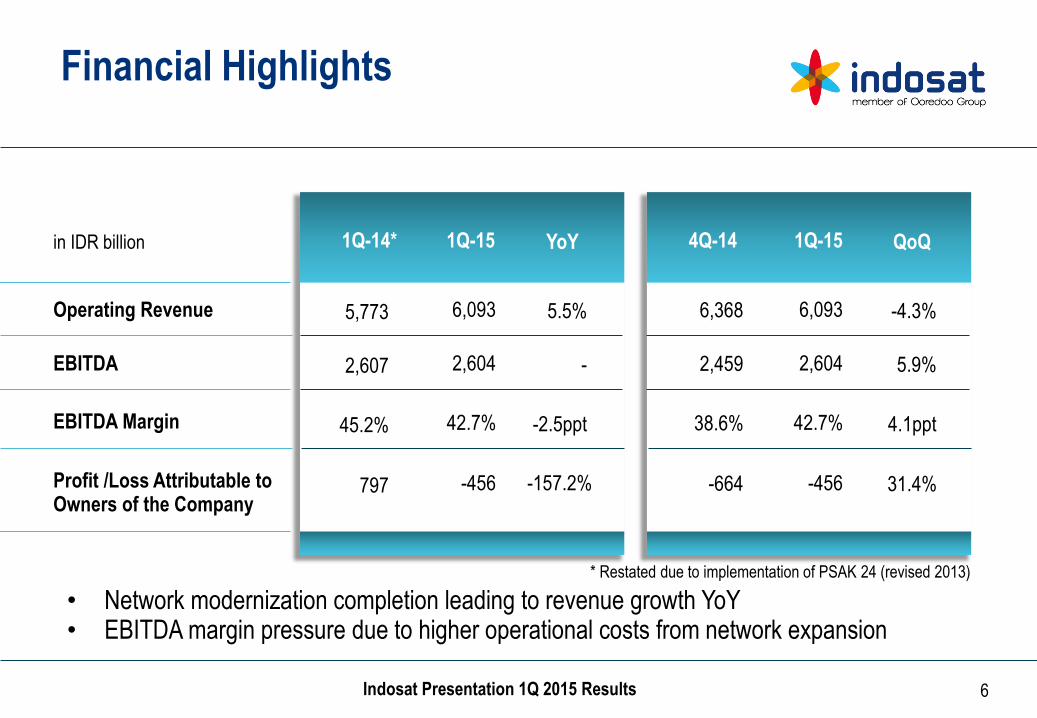
Financial Highlights
Operating Revenue
EBITDA
EBITDA Margin
Profit /Loss Attributable to Owners of the Company
6,093
1Q-14* 1Q-15 YoY
5.5%
2,604 -
42.7% -2.5ppt
-456 -157.2%
6,093
4Q-14 1Q-15 QoQ
-4.3%
2,604 5.9%
42.7% 4.1ppt
-456 31.4%
in IDR billion
• Network modernization completion leading to revenue growth YoY • EBITDA margin pressure due to higher operational costs from network expansion
5,773
2,607
45.2%
797
6,368
2,459
38.6%
-664
* Restated due to implementation of PSAK 24 (revised 2013)

7 Indosat Presentation 1Q 2015 Results
833 861 845 887 916 900
328 261 281 292 262 290
Segment Revenue Overview
Operating Revenue Breakdown
in IDR billion
3Q-14
-4.3% QoQ +5.5% YoY
4Q-14
5,840 5,773
2Q-14 1Q-14 4Q-13
Cellular
Fixed Data
Fixed Voice
+10.8% / +11.4%
-1.8% / +4.5%
-5.5% / +5.4%
• All revenue segments developing well in Q1 compared to same period last year
QoQ / YoY
6,056
4,895 4,714 4,651 4,925
6,104
1Q-15
5,190
6,368
4,903
6,093

8 Indosat Presentation 1Q 2015 Results
Cellular revenue performance
Voice
SMS
Data
VAS
-2.6%
1Q15 YoY
-3.3%
54.5%
28.6%
-5.0%
1Q15 QoQ
0.5%
0.6%
-4.0% Increase VAS usage from various gaming & content packages
Migration to data continues to impact voice and SMS usage and revenue
Increase data usage from attractive data offerings.

9 Indosat Presentation 1Q 2015 Results
59.6 59.7 54.9 54.2
63.2 66.5
Cellular customer base
4Q-14
+11.4% YoY +5.3% QoQ
3Q-14 2Q-14 1Q-14 4Q-13
Number of cellular customers
in million
4Q-14 3Q-14 2Q-14 1Q-14 4Q-13
in million
• Significant customer additions due to aggressive acquisition campaigns following improved network quality perception
5.8
0.1
-4.8
-0.7
9.0
3.3
1Q-15 1Q-15
Net cellular customers additions

10 Indosat Presentation 1Q 2015 Results
89 79 80 78 78
67
137 140 143 148 142 140
14.8 13.5 13.6 13.1 13.6 13.2
ARPU decreased in 1Q15
Voice traffic and MOU
-2.4% YoY
4Q-14
-3.2% QoQ
3Q-14 2Q-14 1Q-14 4Q-13
Voice Traffic
in billion minutes (Voice Traffic) in minute/subscriber (MOU)
MOU
• ARPU decline temporarily due to increasing customer base • MOU decreasing in line with expectation and general industry trend
ARPU and ARPM
27.7 25.8 26.6 28.3 28.0 24.0
3Q-14 2Q-14 1Q-14 4Q-13
-14.2% QoQ -6.9% YoY
4Q-14
ARPU
in thousand IDR (ARPU) in IDR (ARPM)
ARPM
1Q-15 1Q-15

11 Indosat Presentation 1Q 2015 Results
67 60 61
57 59 56
12,871 15,372
19,185 20,911
29,891
39,880
Strong data usage
Data usage
in TByte
+33.4% QoQ +159.4% YoY
4Q-14 3Q-14 2Q-14 1Q-14 4Q-13
SMS delivered
in billion
-6.4% YoY
4Q-14 3Q-14
-4.6% QoQ
2Q-14 1Q-14 4Q-13
• Number of data users growing, stimulated by improved network and customer experience and higher smartphone penetration
1Q-15 1Q-15

12 Indosat Presentation 1Q 2015 Results
Operational expenses
Cost of Service (CoS)
Depreciation and Amortization
Personnel
Marketing
as percentage of revenue
General and Administration
Total Expenses
• Network related expenses increasing with a wider modernized network • Moderate go to market expenses in Q1 vs. a traditional festive Q4 season
Total Operating Expenses
4Q-13
42.4%
38.9%
8.7%
4.0%
5.1%
99.1%
60.2%
1Q-14*
41.4%
34.4%
7.3%
2.8%
3.4%
89.3%
54.9%
2Q-14*
43.4%
33.6%
7.4%
3.6%
4.1%
115.5%
58.6%
3Q-14*
42.7%
33.4%
7.4%
4.9%
3.0%
91.4%
58.0%
Provision for IM2 Legal Case 23.3%
4Q-14*
45.2%
35.1%
6.9%
5.9%
3.8%
96.8%
61.7%
1Q-15
42.9%
33.9%
7.4%
3.0%
3.8%
91.2%
57.3%
* Restated due to implementation of PSAK 24 (revised 2013)

13 Indosat Presentation 1Q 2015 Results
2,410 2,607 2,425 2,569 2,459 2,604
EBITDA Performance
EBITDA and EBITDA margin
+5.9% QoQ -0.1% YoY
4Q-14 3Q-14 2Q-14 1Q-14* 4Q-13
EBITDA
in IDR billion
39.8%
EBITDA Margin
• 1Q15 EBITDA margin in line with guidance • Revenue development improving with
continued good cost management
45.1% 41.5% 42.1%
38.6% 42.7%
1Q-15
* Restated due to implementation of PSAK 24 (revised 2013)

14 Indosat Presentation 1Q 2015 Results
Normalized net loss bridge
-71
797
-456 -456
Normalized net profit
Net profit
-157.2% YoY +1219.9% YoY
1Q-15 1Q-14* 1Q-13
in IDR billion in IDR billion 1Q-15
• 1Q15 net loss impacted mainly by IDR depreciation
Normalized Net – FX Loss Reported
375
* Restated due to implementation of PSAK 24 (revised 2013)
-81

15 Indosat Presentation 1Q 2015 Results
2.31 2.58
2.72
25,042 27,174 27,398
2.05 2.25
2.38
22,226 23,649 23,924
Balance sheet
Gross debt* and gross debt/EBITDA Net debt* and net debt/EBITDA
1Q-14 1Q-13 1Q-15
+0.8% YoY
Gross Debt
in IDR billion
Gross Debt/EBITDA
1Q-15 1Q-13 1Q-14
+1.2% YoY
Net Debt Net Debt/EBITDA
in IDR billion
• Slight increase on debt level YoY due to Rupiah depreciation
* IDR 3.4tn, IDR 3.7tn and IDR 4.1tn of obligation under finance lease are included in 1Q13, 1Q14 and 1Q15 respectively

16 Indosat Presentation 1Q 2015 Results
24.0 27.5
28.6 25.7 25.4
23.1
1,452 1,590 1,669 1,566 1,618
1,409
Free Cash Flow & Capex
Free cash flow
in IDR billion
-1,045
1,319
876
356
-206
481
4Q-14 3Q-14 2Q-14 1Q-14 4Q-13
Capex and Capex/Revenue
4Q-14 3Q-14 2Q-14 1Q-14 4Q-13
Capex
in IDR billion
Capex/Revenue
• FCF strengthening with improved operating CF generation and moderating capex • Capex to revenue trend improving
1Q-15
1Q-15

17 Indosat Presentation 1Q 2015 Results
286 261 177
120 111 99
Network Development
Number of BTS
18,871 19,892 20,585 21,420 22,166 22,212
5,409 6,363 13,328
15,962 18,063 18,544
+1.3 QoQ +55.2% YoY
4Q-14 3Q-14 2Q-14 1Q-14 4Q-13
2G 3G
Cellular Revenue per BTS
In IDR million
1Q 2015 1Q 2014
XL
Indosat
Telkomsel
• Network modernization, phase 2 in Java, to be completed in Q3 2015 • Strong network performance in already modernized areas
24,280 26,255
33,913 37,382
1Q-15
40,229 40,756

18 Indosat Presentation 1Q 2015 Results
1Q in summary

Management Focus and Key Updates
20 Indosat Presentation 1Q 2015 Results
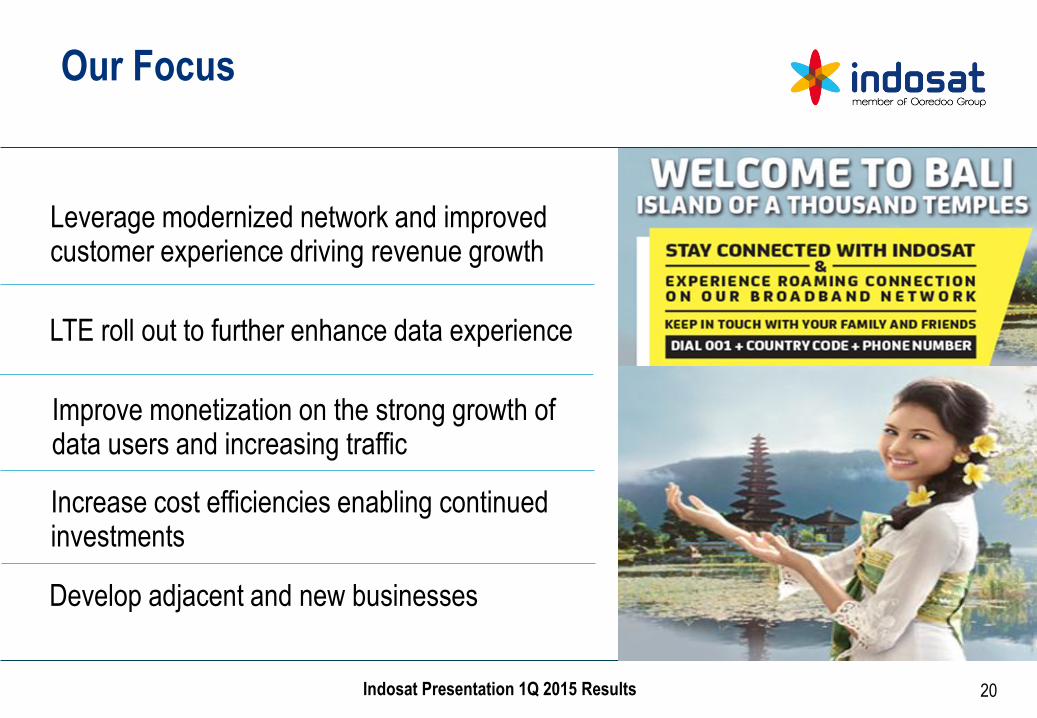
Develop adjacent and new businesses
Increase cost efficiencies enabling continued investments
Improve monetization on the strong growth of data users and increasing traffic
Leverage modernized network and improved customer experience driving revenue growth
Our Focus
LTE roll out to further enhance data experience

21 Indosat Presentation 1Q 2015 Results
2015 Guidance
FY 2014 Actual FY 2015 Guidance
Consolidated Revenue Growth 1.0% In line with market
EBITDA Margin* 41.7% Low to Mid 40’s
Cash CAPEX IDR 6.4 trillion IDR 6.5 - 7.5 trillion
* Restated due to implementation of PSAK 24 (revised 2013)

22 Indosat Presentation 1Q 2015 Results
Thank You
Any further questions?
Upcoming events AGMS 2015
Indosat Investor Relations Jl. Medan Merdeka Barat No. 21 Jakarta - 10110 Tel: +62 21 30442615 [email protected]
23 Indosat Presentation 1Q 2015 Results
Disclaimer
• PT Indosat Tbk ( “Indosat” or “Company” ) cautions investors that certain statements contained in this document state its management's intentions, hopes, beliefs, expectations, or predictions of the future are forward-looking statements
• The Company wishes to caution the reader that forward-looking statements are not historical facts and are only estimates or predictions. Actual results may differ materially from those projected as a result of risks and uncertainties including, but not limited to:
• The Company’s ability to manage domestic and international growth and maintain a high level of customer service
• Future sales growth
• Market acceptance of the Company’s product and service offerings
• The Company’s ability to secure adequate financing or equity capital to fund our operations
• Network expansion
• Performance of the Company’s network and equipment
• The Company’s ability to enter into strategic alliances or transactions
• Cooperation of incumbent local exchange carriers in provisioning lines and interconnecting our equipment
• Regulatory approval processes
• Changes in technology
• Price competition
• Other market conditions and associated risks
• The company undertakes no obligation to update publicly any forward-looking statements, whether as a result of future events, new information, or otherwise
• Please be also advised that the information provided herein are merely issued to coincide with the release of Ooredoo QSC (formerly known as Qatar Telecom QSC) results for the year ended 31 December 2013, as the Company’s indirect majority shareholder that consolidates Indosat’s results in its financial statements. Subject to the completion of, including but not limited to the audit by the Public Accountant Firm on the Company’s consolidated financial statements which are prepared in accordance with the Indonesian Financial Accounting Standards (IFAS), Indosat expects to file and release its consolidated financial statements for the year ended 31 December 2013 on 30 April 2014 at the latest (“Indosat’s Official Release”). Accordingly, the information provided herein may differ from what is contained in Indosat's Official Release.


Supplemental Information

26 Indosat Presentation 1Q 2015 Results
IM2 case development
On September 16, 2014, the South Jakarta Attorney Office (“Kejaksaan
Negeri Jakarta Selatan”), without preliminary notification, executed the
Supreme Court’s Decision on Mr. Indar Atmanto. The execution was done
based on a quotation of the Supreme Court’s Decision, which states, among
others, that (i) Mr. Indar Atmanto is found guilty and sentenced to eight
years imprisonment and charged with penalty of Rp300,000,000,- (if the
penalty is not paid, Mr. Indar Atmanto would serve an additional six months
imprisonment), and (ii) IM2 pay the losses sustained by the State amounting
to Rp1,358,343,346,674,-.
Subsequently, on January 16, 2015, Mr.Indar Atmanto and/or his lawyer or
IM2 received the document on the Supreme Court’s decision regarding the
litigation case. As of the issuance date of the consolidated financial
statements, Mr. Indar Atmanto and IM2 plan to conduct further legal act by
submitting a reconsideration request peninjauan kembali (”PK”).
On March 16, 2015, Mr. Indar Atmanto’s submission of judicial review
[Peninjauan Kembali (”PK”)] was officialy registered at the Corruption Court
under No. 08/AKTA.PID.SUS/PK/TPK/2015/PN.Jkt.Pst.

27 Indosat Presentation 1Q 2015 Results
Credit ratings improved Upgrade to AAA by Pefindo
On 7 January 2015, Standard and Poor’s (“S&P”) has affirmed its rating and outlook on Indosat (BB+/Stable/NR; axBBB+/--). The stable outlook reflects the outlook on the sovereign credit rating on Indonesia (BB+/Stable/B; axBBB+/axA-2). S&P expects Indosat's operating performance to remain stable over the next two years, given the company's focus on the data business. S&P assess Indosat's liquidity as "adequate" because the company's sources of liquidity are likely to cover its needs by more than 1.2x in the 12 months to Sept. 30, 2015.
On 3 February 2015, PEFINDO has affirmed “idAAA” rating of PT. Indosat Tbk’s Bond VI Year 2008 Seri B amounting to IDR320 billion that will mature on April 9, 2015. ISAT should be able to repay the maturing bond using its internal fund. At the end of 2014, it had cash and cash equivalent amounting to IDR3.5 trillion and unused credit facilities totalling almost IDR3.0 trillion.
On 1 April 2015, Moody's Investors Service says that PT Indosat Tbk's (Ba1 stable) overall FY2014
financial performance is in line with expectations, with an improved operating performance in the
second half of the year offsetting a weaker first half.
On 27 March 2015: Fitch Ratings has affirmed PT Indosat Tbk's (Indosat) Long-Term Foreign- and Local-Currency Issuer Default Ratings (IDR) at 'BBB'. The agency has also affirmed the Indonesia-based company's National Long-Term Rating at 'AAA(idn)'. The Outlook is Stable on the IDR and the National Long-Term Rating. Fitch has also affirmed the foreign-currency senior unsecured rating of 'BBB' and the National Long-Term Ratings on its IDR9trn bond programme and IDR1trn sukuk ijarah programme at 'AAA(idn)'.

28 Indosat Presentation 1Q 2015 Results
Debt maturity profile
Debt maturity profile*
In IDR trillion
2019 2018 2022 2017 2016 2015
IDR
USD in IDR
* Excluding obligation under capital lease
2021
9.13
1.47 0.52 0.26 0.26
1.92
1.97 2.78 0.50 2.27
0.36 1.50 0.36
2024

29 Indosat Presentation 1Q 2015 Results
Spectrum overview for top 4 cellular operators
10.0
900 Mhz
7.5
7.5
Indosat
Telkomsel
XL Axiata
20.0
1800 Mhz
22.5
22.5
10.0
2100 Mhz
15.0
15.0
in Mhz
Hutchison - 10.0 10.0
2.5
850 Mhz
3.5 – 5.0*
-
-
* Telkom and Bakrie Telekom have the same spectrum, differentiated by its operational areas
15.0**
2300 Mhz
15.0**
-
-
** Indosat/IM2: West Java exclude Bogor, Depok & Bekasi ; Telkom/Telkomsel: Maluku & North Maluku