Embed Size (px)
Citation preview

Prepared by: Portland State University (PSU) Center for Public Service (CPS) with the PSU Northwest Economic Research Center (NERC) PSU Contract #: 606030 Project Manager: Rick Williams Faculty Advisor: Hal T. Nelson Primary authors (in alphabetical order): Bill Henry, Peter Hulseman, Katelyn Kelley, Hal T. Nelson, Rick Williams
Prepared for: NW Natural (NWN) Purchase Order No. 4500023995 Date 12/18/2018 Project Manager: Chris Kroeker Preface & Acknowledgements: This report is the result of a collaborative study effort between PSU and NWN.
October 4, 2019
Mark O. Hatfield School of Government Center for Public Service (CPS)
PSU CPS PROJECT: NW Natural Energy System Resilience Initiative
Renewable/Compressed Natural Gas (R/CNG) for Transportation System Resilience

2
CONTENTS
I. Introduction and Project Context 6
a. The Policy Environment for Fuel Diversity & Resilience 8
II. Current Uses of CNG for Transportation 9
a. Background on Natural Gas Powered Vehicles 10
b. Natural Gas Vehicle Types and Availability 11
c. CNG Compressor Stations and Fleet Operations in Oregon 13
d. Valuing Decentralized Energy Systems 14
e. Transportation Fuel Diversity 16
f. The R/CNG Value Stack: Cost and Benefit Analysis 18
f.1. Cost Analysis 19
f.2. Risk Analysis 19
f.3. Net Benefit Analysis 20
III. Renewable Energy & Natural Gas Infrastructure 22
a. Renewable Natural Gas in Oregon 22
b. Sources of RNG and Resilience Attributes 23
IV. Overview of NWN System Resilience 24
a. NW Natural Transmission and Distribution System 24
a. NWN Gas Operation Practices 27
b. NW Natural Gas Storage Capabilities 28 1. Mist Underground Storage Facility 29 2. Liquefied Natural Gas (LNG) Facilities 29 3. Transmission and Distribution Linepack 30
V. Evaluation of Alternatives 31
a. Problem Statement 31
c. Comparison of Natural Gas and Liquid Fuel Supply for Recovery 34
d. Natural Gas-Supported Electricity Generation 35 1. NW Natural Storage to Serve PGE Electricity Generation 35 2. NWN Service to Standby and Emergency Generators 36 3. Mitigating Risks from Building Electrification Mandates 36
VI. Conclusions 39
VII. Policy and Program Recommendations 41
a. Increase Transportation Fuel Supply Diversity 41
b. Invest in Resilient Clean Vehicles and Infrastructure 45

3
VIII. Areas for Future Study 46
1. CNG Fleet Use-Cases, Operating Results, and Procurement Recommendations 46
2. Barrier Analysis and Stakeholder Modeling for Transportation R/CNG 46
3. Transportation Fuel Diversity Modeling 46
4. Clean Vehicle Infrastructure Investment Policy 47
5. Analysis of Natural Gas System Resilience 47
6. Design for the Disaster Resilient Fueling Hub Pilot Project 47
7. Quantify Distributed Generation from Natural Gas Generators 48
8. R/CNG Vehicle, Generator, Compressor and Microgrid Technician and Engineer Education and Training Collaborative 48

4
EXECUTIVE SUMMARY
Portland State University’s Center for Public Service conducted a study that analyzed the resilience benefits of renewable/compressed natural gas (R/CNG) for transportation system resilience that the Northwest Natural (NWN) energy system supports. One key driver for the study was the recognized vulnerabilities of liquid fuel supplies at the Critical Energy Infrastructure (CEI) Hub in Northeast Portland that was highlighted in the Oregon Resilience Plan (2013) as updated in 2018. Another key driver is the significant probability of an extended disruption to the electrical grid from a major earthquake. Current transportation electrification initiatives risk compounding regional vulnerabilities from vehicle fuel shortages during recovery from a disaster. These three considerations reveal the need for this analysis of R/CNG for energy resilience. The study employed literature reviews and stakeholder interviews to describe the capabilities, interpret the findings in the context of resilience with a focus on transportation, and evaluate R/CNG for its resilience capabilities. PSU’s Northwest Economic Research Center (NERC) conducted a literature review and examined the value of decentralized fuel systems, the costs of centralized fuel systems, the current state of fuel diversity within Oregon, and the costs/benefits of R/CNG vehicles. The study has determined that there is a strong case for a least cost, least risk framework associated with R/CNG to enhance transportation fuel diversity. The NERC findings indicate 1) net social benefits from R/CNG compared to diesel on a per-gallon under Business as Usual (BAU) conditions. 2) A least-risk case from R/CNG is also likely. The risk reduction conclusion stems from three sources. The first is energy system fuel diversification where R/CNG reduces the dominance of liquid fuels in Oregon’s BAU transportation mix. The second risk reduction stems from R/CNG providing natural gas generator charging for electric/plug in hybrid vehicles during a disaster event. While the primary focus of the study was transportation, the results indicate that the key enabler to R/CNG fuel diversity is compressor stations. But, compressor stations require the continuity of natural gas supply and/or electricity for the compressors. As a result, the key role of compressor stations expanded the current study to stationary infrastructure using failure modes and effects criticality analysis. The third source of risk reductions is the grid-scale energy storage represented by the NWN system. The natural gas system is designed and managed with path diversity for continuity of gas supply as well as backup generators for continuity of power for pipeline compressors. NWN includes operational procedures for damage response and restoration in the event of a disaster. The study concludes that the estimated 1.0 million therms of pressurized gas in the NWN energy system, known as “linepack”, represents significant distributed stored energy capabilities. When combined with the estimated 2,789 natural gas powered generators in the NWN service area, that conservatively equates to 8,800 MWh of electrical generation capacity. This combination of distributed storage and distributed generation equates to grid-scale storage and generating reserve that has not been previously identified in the public record. The current emphasis on transportation electrification increases risk during disasters with extended electrical grid outages. Further, the emerging role of renewable natural gas is not articulated in literature on deep decarbonization that emphasizes transportation and building electrification. The

5
Oregon Fuel Action Plan (2017) does not mention CNG, R/CNG, or electricity as a transportation fuel. Agency silos could be responsible for this: the Oregon Department of Energy is responsible for the petroleum sector. and the Oregon Public Utility Commission is responsible for the electricity and natural gas sectors. The Fuel Action Plan and other policies and plans need to recognize the geographic diversity described in the NWN Integrated Resource Plan, including significant stored energy capabilities of the natural gas energy system in Oregon for R/CNG-fueled transportation, as well as natural gas fueled distributed generation for electric vehicle charging. Oregon is unprepared for a major earthquake.1 The state also gets a D+ on its energy report card from the American Society of Civil Engineers.2 Policy and program actions are desperately needed that utilize, and build from, the inherent resilience of distributed R/CNG resources. Seven policy and program recommendations are presented that recognize the public benefit from R/CNG for transportation fuel diversity and distributed energy supplies. The recommendations begin to enable Oregon to capture a potential “virtuous cycle” for resilience between distributed energy storage, transportation fuel diversity, and resilient fueling stations. These policy actions are of particular importance given Oregon Executive Orders and legislation that emphasize electrification of transportation. The recommendations include:
1. Reduce Reliance on Liquid Fuels Stored at the Portland CEI Hub
2. Expand Dual-Fuel Infrastructure for R/CNG Natural Gas Compressors
3. Analyze Internal and External Stakeholder Roles and Opportunities
4. Increase Public Access to R/CNG Compressors
5. Increase Fuel Supply Diversity through RNG and Hydrogen
6. Invest in Disaster-Resilient Fueling Hubs
7. Invest in Resilient Clean Vehicles Through Procurement Standards and Pilot Programs
A series of future research is presented that expands on the findings and recommendations of this report.
1. CNG Fleet Use-Cases, Operating Results, and Procurement Recommendations
2. Barrier Analysis and Stakeholder Modeling for Transportation R/CNG
3. Transportation Fuel Diversity Modeling
4. Clean Vehicle Infrastructure Investment Policy
5. Analysis of Natural Gas System Resilience
6. Design for the Disaster Resilient Fueling Hub Pilot Project
7. Quantify Distributed Generation from Natural Gas Generators
8. R/CNG Vehicle,Generator, Compressor, and Microgrid Technician and Engineer Education and Training Collaborative
1 Harbarger, Molly. Oregon is Unprepared to Deal with a Major Earthquake, Tsunami, Says Audit. https://www.oregonlive.com/politics/2018/01/oregon_is_unprepared_to_deal_w.html 2 ASCE. Oregon 2019 Report. https://www.infrastructurereportcard.org/state-item/oregon/ Accessed 15 Aug, 2019

6
I. INTRODUCTION AND PROJECT CONTEXT
The Portland State University (PSU) Center for Public Service (CPS) was contracted by Northwest Natural Gas (NWN) to analyze the possible resiliency benefits of compressed natural gas in transportation. One of the ways envisioned to achieve resiliency benefits was to increase the use of renewable/compressed natural gas (R/CNG) in essential service fleets, which could increase transportation fuel diversity. CPS agreed to provide professional services, project management, and project administration to perform a systems-level study of resilience focusing on renewable/compressed natural gas for transportation. Energy system resilience has been a key topic with the Federal Energy Regulatory Commission, the US Department of Energy, the Oregon Legislature, and the Oregon Public Utility Commission. All have addressed energy storage and resilience. The Oregon Resilience Plan (2013) states that Oregon’s energy systems are likely to be disrupted following a disaster event, including electricity, natural gas distribution systems, and liquid fuel supplies. As discussed below, the region’s liquid fuels for transportation are also likely to be disrupted. Because of the particularly high vulnerability of liquid fuel points of delivery and storage in Oregon, alternatives are needed that enable substitution of natural gas, compressed natural gas, and electricity for applications that currently rely on gasoline and diesel liquid fuels. Government initiatives are progressing for transportation electrification that are beneficial, and dependent on intact electrical transmission and distribution grids. An opportunity exists to improve the resilience performance of Oregon’s transportation system by taking steps to diversify the fuels used in vehicles that will be used by first responders and for disaster response and recovery purposes. By taking a systems approach, this study explored the public benefit value of the resilience provided by the NWN energy system in its different forms (natural gas, renewable natural gas, power-to-gas using Hydrogen, compressed natural gas, and liquefied natural gas). The approach considered the role of natural gas in disaster response and recovery, both for transportation fuel diversity as well as a form of storage and generating reserve during extended electrical grid outages with severely limited liquid fuel supply. While energy system reliability and system resiliency are related, they differ both in scope and regulatory requirement. “Reliability, according to the U.S. Department of Energy (DOE), is the ability of the system or its components to withstand instability, uncontrolled events, cascading failures, or unanticipated loss of system components. Resilience, as defined by DOE, is the ability of a system or its components to adapt to changing conditions and withstand and rapidly recover from disruptions. Resilience includes the ability to withstand and recover from deliberate attacks, accidents, or naturally occurring threats or incidents.”3 In the past several years, the understanding of the vulnerabilities faced by Oregon with respect to the fuel supply following disasters, including a Cascadia Subduction Zone (CSZ) event, has improved. The attention paid to this issue is increasing. It is now widely known that Oregon’s total liquid fuel supply is highly concentrated at a single point in Portland called the Critical Energy Infrastructure
3 https://obamawhitehouse.archives.gov/the-press-office/2013/02/12/presidential-policy-directive-critical-infrastructure-security-and-resil

7
(CEI) hub. At this location, at least 90% of the liquid fuel consumed in Oregon enters the state via pipeline or ship, is stored in a tank farm located in the seismically vulnerable Northwest industrial waterfront district of Portland, and is distributed by pipeline, truck, and barge throughout the state. Furthermore, the transportation of diesel fuel for emergency generators is also likely to be compromised. Figure 1-1 shows simulations to Portland Metro area roads from a 9.0 earthquake4.
Findings from a 2012 study by the Oregon Department of Geology and Mineral Industries, show that these stored fuel quantities and connection points to their supply networks will be severely compromised following a CSZ event.5 It is assumed herein that liquid fuel from the CEI Hub will not be available and fuel supplies needed for recovery must be obtained from other sources. The 2017 ODOE Oregon Fuel Action Plan, determined that no fuel set-aside volumes would be implemented for Oregon’s liquid fuel supply companies for a CSZ event because it is assumed no fuel will be available.6 Furthermore, the storage of liquid fuels as well movement of liquid fuels in pipelines, trains, ships, and barges, represent the potential for leakage of liquid fuel products into the Willamette and Columbia rivers.
4 Open-File Report O-18-02 Earthquake Regional Impact Analysis For Clackamas, Multnomah, And Washington Counties, Oregon by John M. Bauer1, William J. Burns1, and Ian P. Madison. 2018. P. 84 https://www.oregongeology.org/pubs/ofr/O-18-02/O-18-02_report.pdf Accessed 13 Aug 2019 5 "Earthquake Risk Study for Oregon's Critical Energy Infrastructure Hub." https://www.oregongeology.org/earthquakes/CEI-Hub-report.pdf. Accessed 12 Jun. 2019. 6 "Oregon Fuel Action Plan - Oregon.gov." 1 Oct. 2017, https://www.oregon.gov/energy/safety-resiliency/Documents/Oregon-Fuel-Action-Plan.pdf. Accessed 4 Jun. 2019.
Figure 1-1: Risks to Metro Surface Transportation from a 9.0 Earthquake

8
a. The Policy Environment for Fuel Diversity & Resilience
The risks from a CSZ event have not gone unnoticed by Oregon Policymakers. The Fuel Action Plan (2017) sets forth an ODOE-led structure to coordinate delivery, distribution, and prioritization of fuel supplies that are brought into the state by FEMA, industry, the military and others by air, truck, and ship transport. River access for ships and barges is expected to be delayed pending hydrographic surveys. Because most of the previous works relating to the CEI Hub and energy supply have been primarily focused on Oregon’s liquid fuel supply, there is currently an opportunity to gain a deeper understanding of the role of natural gas supply in recovery. For example, the 2017 Plan does not include electric or natural gas vehicles. The State of Oregon issued the Oregon Resilience Plan (2013), updated in 2018, that identified vulnerabilities and risks associated with liquid fuels stored at the CEI Hub. The Plan identifies a potential for critical shortages of fuels, and does not distinguish between liquid fuels and gaseous fuels. However, the Oregon Resilience Plan does not fully address NWN path diversity or the role of CNG in transportation fuel diversity. A complex regulatory environment applies to the CEI Hub, resulting in a range of requirements that liquid fuel industry participants must follow, but little to no direct regulation that stands to improve CSZ resilience outcomes. The City Club of Portland’s 2017 report “Big Steps Before the Big One” provided a summary of the gaps in authority that are present for the CEI Hub concluding that “No federal, state, or local agency requires companies that own tanks to assess and report the vulnerability of their facilities, nor do they require companies to retrofit or replace tanks to reduce risk.” A challenge for the CEI Hub that stems from this regulatory setting is the difficulty in establishing a workable planning framework among the companies, local jurisdictions, state and federal regulatory bodies to improve CEI Hub resilience outcomes. It remains unclear who will ultimately take the lead or how a comprehensive plan to reinforce the facilities would come about, but this is not for lack of trying. As awareness of the issue grows, the level of effort to address the CEI Hub is increasing. The City Club called for Oregon legislative action to require assessments and certain mitigation activities at the CEI Hub, and bills have been introduced, but none have advanced. Gov. Brown’s office called for the Oregon Seismic Safety Policy Advisory Committee (OSSPAC) to assess the hub and produce a report on a range of mitigations and improvements.7 OSSPAC has established a working group on the CEI Hub and holds regular meetings to convene a range of agencies and interested parties in search of solutions, but a pathway toward substantive action on the CEI Hub has yet to emerge. A May 2019 Oregon Solutions assessment sought to compile and synthesize stakeholder views and recommendations about the CEI Hub, at the request of the Portland Bureau of Emergency Management (PBEM).8 The report asked a range of stakeholders, including the liquid fuel companies, about ways to align incentives in such a way as to motivate parties to invest in seismic reinforcements. The results did not indicate progress is imminent and further highlighted the lack of
7 "Resiliency 2025 - Oregon.gov." 16 Oct. 2018, https://www.oregon.gov/gov/policy/Documents/resiliency-policy-agenda.pdf. Accessed 12 Jun. 2019. 8 "Critical Energy Infrastructure Hub – Oregon Solutions." https://orsolutions.org/osproject/critical-energy-infrastructure-hub. Accessed 13 Jun. 2019.

9
coordination with respect to regulatory authority and planning, which appears to continue to hamper efforts to find solutions. Recent legislation by Oregon (House Bill 5050) authorized $300,000 for a study of fossil fuel risk at the CEI Hub by Oregon’s Office of Emergency Management (OEM):
The Oregon Office of Emergency Management, in coordination with the Oregon Department of Energy and the Oregon Department of Environmental Quality, should commission a risk abatement study to evaluate real-time options to mitigate product flow from the CEI Hub into the Columbia and Willamette Rivers immediately following a major earthquake. The study should include multiple scenarios based on expected earthquake size and liquefaction conditions at individual facilities. Following the study, the agencies should propose specific mitigation options, including rapid containment and recovery.
In contrast to Oregon’s liquid fuel supply, Oregon’s natural gas supply arguably fits within a more well defined and actionable framework of regulatory and legislative authority. NWN is an investor-owned utility that is regulated by the OPUC and the US Department of Transportation Office of Pipeline and Hazardous Materials Safety Administration (PHMSA). The OPUC receives authority from the Oregon legislature that defines the factors that it must consider in the course of its regulatory activities. To the extent that the legislature decides that resilience is a priority in this regulatory arena, an avenue exists to motivate Oregon’s regulated natural gas and electric utilities to improve resilience capabilities. This pathway toward enhanced resilience of Oregon’s public utilities has already been utilized by the legislature, a trend that appears likely to continue in future years. In 2013, the Oregon legislature passed SB 33, which included recommendations for natural gas utilities to conduct seismic vulnerability assessments of their critical energy infrastructure, including pipelines and the Mist storage facility. This is an example of how direction from the legislature can effectively steer resources toward resilience planning. In the case of NWN’s work pursuant to SB 33, undertaking resilience assessments and planning activities was a natural extension of the transmission integrity, distribution integrity, and safety-related processes that natural gas utilities must have in place under state and federal regulations.
II. CURRENT USES OF CNG FOR TRANSPORTATION
As seismic reinforcements and alternatives are considered for the CEI Hub, momentum is building for consideration of different fuel sources and types to fulfill Oregon’s transportation needs during both normal operations and disaster response and recovery. A range of alternative options are available for vehicles, including battery electric, hydrogen fuel cells, and natural gas engines as well as multi-fuel and hybrid vehicles. The emergence of new transportation options that stand to reduce reliance on petroleum fuel in general and shift this demand to natural gas and electricity provide the dual benefits of reducing GHG emissions and improving resilience. This section provides an overview of the use of CNG in transportation, the types of vehicles in the current inventories, and R/CNG use in Oregon based on data calls to major fleet operators.

10
During the course of the study, PSU conducted literature reviews, in-person interviews with six individuals employed by NWN, visited two compressor stations, conducted approximately ten email/telephone interviews with fleet operators and other facility managers, and attended four related conferences and meetings. Original research included the systems approach to transportation and stationary infrastructure, failure modes and effects criticality analysis, and disaster-resilient fueling hub concept presented below.
a. Background on Natural Gas Powered Vehicles
The use of natural gas as a transportation fuel is a well-established practice that uses mature technology to compliment and displace gasoline and diesel consumption in commercial and personal use applications. In order to be used as a vehicle fuel, natural gas must be either compressed or liquefied to increase the energy density of the quantity of fuel stored onboard the vehicle. Natural gas is commonly compressed to 3,600 PSI before it is transferred to a vehicle, which must be configured to accommodate a pressure vessel. Alternately, gas may be cryogenically cooled to a liquid state, which allows for higher quantities of energy to be stored and may be attractive for long haul trucking applications. This report only addresses compressed natural gas (CNG) applications. Vehicle fleets have been the primary driver behind the increase in natural gas use in transportation in the past 20 years, as shown in Figure 2-1 below. There are a range of motivations behind fleet owner decisions to adopt natural gas fuel instead of gasoline or diesel. Often, a key factor is the reduction in emissions compared to heavy duty diesel vehicles. Both greenhouse gas (GHG) and locally damaging oxides of nitrogen and fine particulate matter are reduced when using CNG. As Oregon pursues policies to reduce these local pollutants, CNG vehicles offer the opportunity of lower emissions than is currently possible from diesel vehicles. For example, the California Air Resource Board established an optional near-zero low NOx standard in 2013, to which only 10 vehicles have been certified to date, all of them using natural gas or liquid petroleum gas engines.9
Figure 2-1: U.S. Natural Gas for Vehicle Consumption. Source: EIA10
9 CARB April 18, 2019 Staff White Paper – Technical Feasibility of Lower NOx Standards. https://ww3.arb.ca.gov/msprog/hdlownox/white_paper_04182019a.pdf 10 https://www.eia.gov/dnav/ng/hist/n3025us2m.htm

11
b. Natural Gas Vehicle Types and Availability
The engine types used for CNG vehicles are very similar to those employed in gasoline and diesel-powered vehicles. Therefore, CNG as a fuel source stands to benefit from the substantial and ongoing research and development efforts to refine, increase efficiency, and incorporate elements of system electrification into engine design and vehicle integration. While the technology barriers to CNG vehicles are not substantial, the commercial availability of some types of CNG vehicles is limited. In general, original equipment manufacturers of light duty vehicles do not offer CNG vehicles directly for sale.11 As a result, aftermarket (‘upfit’) solutions are marketed by companies that install CNG fuel tanks and other modifications to allow the vehicle to run on CNG, or a combination of CNG and gasoline. Heavy duty truck manufacturers commonly allow for buyers to specify CNG engines or dual-fuel diesel/CNG engines. For light duty vehicles, primarily pickup trucks and vans, original equipment manufacturers (OEM) such as Ford and General Motors offer ‘CNG prep’ packages for specific engines in several vehicles that allow for aftermarket conversion by authorized companies without voiding the warranty. CNG vehicle operators may purchase these vehicles and obtain CNG conversion services from several upfit companies. The USDOE Alternative Fuels Data Center’s search function displays 12 CNG conversion providers.12 Table 2-1 displays a summary of the pickup trucks and vans that are currently available.
Table 2-1: Currently Available CNG Light Duty Vehicles13
11 The RAM 2500 Pickup is currently the only light duty CNG vehicle offered for sale directly from an OEM. Source: NGV America https://www.ngvamerica.org/vehicles/ 12 Alternative Fuel and Advanced Vehicle Search using ‘conversion & hybrid systems’ and ‘natural gas’ https://afdc.energy.gov/vehicles/search/ 13 USDOE Alternative fuel vehicle database 2019
Category Manufacturer Model
Pickup Chevrolet Silverado 2500 HD 2WD/4WD
Van Chevrolet Express 2500
Pickup Ford F-150 2WD/4WD
Pickup Ford Super Duty F-250 2WD/4WD
Van Ford Transit Connect Van/Wagon
Van Ford Transit 150/250 Van/Wagon
Pickup GMC Sierra 2500 HD 2WD/4WD
Van GMC Savana 2500
Pickup Ram 2500 HD

12
For medium and heavy-duty vehicles, manufacturers typically offer a range of engine choices, among which CNG options have become commonly available. CNG engines used for medium duty vehicles may be the same or similar units as those provided by OEMs for the light duty class, with a similar requirement to perform a CNG conversion. Heavy duty vehicles typically use dedicated CNG engines. Cummins Westport is currently the dominant supplier of these engines. Table 2-2 below provides a summary of the types of medium and heavy-duty vehicles available and the number of manufactures that are currently active in offering CNG fuel options.
Table 2-2:: Summary of Medium and Heavy Duty CNG Vehicles
Vehicle Category Number of Manufacturers
Refuse 4
School Bus 2
Shuttle Bus 5
Street Sweeper 6
Tractor 8
Transit Bus 7
Vocational/Cab Chassis 13

13
c. CNG Compressor Stations and Fleet Operations in Oregon
Because of the need to compress the gas to pressures higher than those used in NW Natural’s transmission and distribution pipelines, the presence of compressor stations is therefore a central component of any system to fuel either centralized fleets or individual CNG vehicles. The use of CNG vehicle fleets that are managed in conjunction with a compressor station is a common commercial vehicle use case, of which several examples are currently operational in Oregon.
The largest number of natural gas vehicles in Oregon are part of private and publicly owned fleets. In general, these fleet operators employ their own CNG compressor from a NW Natural pipeline source. Along with NW Natural-owned compressors used for its own CNG vehicles, and a small number of publicly available compressor stations, the general location CNG filling stations are shown in Figure 2-2.
Figure 2-2: Locations of CNG Compressors in the NW Natural Service Area

14
d. Valuing Decentralized Energy Systems
In the last decade, the sources of energy used for electricity the United States has shifted from high-carbon emitting fossil fuels to a mix that includes low-carbon and carbon-free sources. Today, more than two-thirds of all the electricity produced in the nation comes from sources other than coal - half of which are entirely carbon-free.14 Environmental benefits from a diverse selection of power are extremely attractive, but these are not the only positive outcomes that arise when shifting from centralized energy and fuel systems to decentralized energy and fuel systems. Energy is a unique product in all modern economies due to its central role in virtually every sector - this makes energy infrastructures that are resilient to outside shocks a key factor in building sustainable economies. In order to understand the economic costs and benefits associated with decentralized and diverse energy systems we first need to quantify the value of the existing centralized, fossil fuel dominant systems. Valuing the diversity of energy supply remains a nuanced task given the many uses of energy and fuels involved. Looking to the electrical power systems for comparison, there exist some electrical power system performance metrics that are relevant when judging the effectiveness of electrical generation portfolios. These are: short-run marginal and average costs of electric production and production cost variability. IHS Markit, a global information group, used these metrics to model the impact of US energy diversity using a two-step process, first by way of a substitution effect enabled by a diverse energy portfolio. Their results estimate an annual consumer savings of over $2.8 billion from substitution based on fuel price changes15 - this follows standard economic intuition that higher prices result from a lack of available substitutes. Next, the model quantifies the additional value created by the portfolio effect. All else held constant, it simulates a case of “reduced diversity”, thereby increasing the portfolio’s risk. Figure 2-3 illustrates the results of both the individual and combined effects at the national level from I.H.S. Energy (2014). Overall, they find the situation with fuel and technology diversity can provide roughly $93 billion per year in benefits relative to the case of reduced diversity (where among other decreases, the share of nuclear and coal-fired power is set to zero.)16
Figure 2-3: Costs of Reductions in US Power from Supply Diversity (2014)
14 “A Diverse Energy Mix Helps Keep Electricity Affordable. Fuel Diversity.” Edison Electric Institute. April 2019. https://www.eei.org/issuesandpolicy/generation/fueldiversity/Documents/ 15 “The Value of US Power Supply Diversity.” IHS Energy, July 2014, pp 37-40. https://www.globalenergyinstitute.org/sites/default/files/USPowerSupplyDiversityStudy.pdf 16 IHS Energy, 2014.
Diversity cases cost results
Substitution Effect
Portfolio Effect Total
Output (2011, TWh) 3,978 3,978 3,978
Marginal cost increases ($/MWh)
$20.90 $4.46 $25.36
Average cost increase ($/MWh)
$0.71 $22.76 $23.47
Marginal cost increases split
82% 18% 100%
15
Source: IHS Energy, https://www.globalenergyinstitute.org/sites/default/files/USPowerSupplyDiversityStudy.pdf
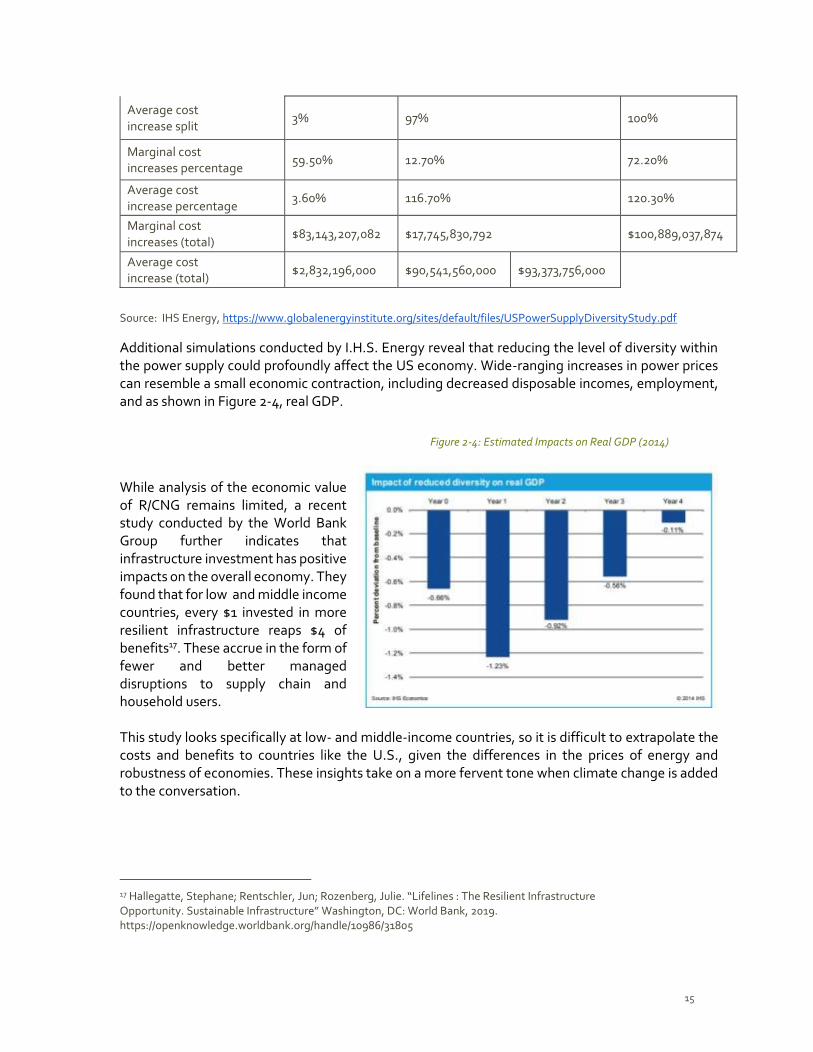
Additional simulations conducted by I.H.S. Energy reveal that reducing the level of diversity within the power supply could profoundly affect the US economy. Wide-ranging increases in power prices can resemble a small economic contraction, including decreased disposable incomes, employment, and as shown in Figure 2-4, real GDP.
Figure 2-4: Estimated Impacts on Real GDP (2014)
While analysis of the economic value of R/CNG remains limited, a recent study conducted by the World Bank Group further indicates that infrastructure investment has positive impacts on the overall economy. They found that for low and middle income countries, every $1 invested in more resilient infrastructure reaps $4 of benefits17. These accrue in the form of fewer and better managed disruptions to supply chain and household users. This study looks specifically at low- and middle-income countries, so it is difficult to extrapolate the costs and benefits to countries like the U.S., given the differences in the prices of energy and robustness of economies. These insights take on a more fervent tone when climate change is added to the conversation.
17 Hallegatte, Stephane; Rentschler, Jun; Rozenberg, Julie. “Lifelines : The Resilient Infrastructure Opportunity. Sustainable Infrastructure” Washington, DC: World Bank, 2019. https://openknowledge.worldbank.org/handle/10986/31805
Average cost increase split
3% 97% 100%
Marginal cost increases percentage
59.50% 12.70% 72.20%
Average cost increase percentage
3.60% 116.70% 120.30%
Marginal cost increases (total)
$83,143,207,082 $17,745,830,792 $100,889,037,874
Average cost increase (total)
$2,832,196,000 $90,541,560,000 $93,373,756,000

16
e. Transportation Fuel Diversity
Regional and state bodies have introduced policies to transition their respective energy systems off traditional fossil fuels. The Western Governors Association’s sets forth eight goals in their annual Energy Vision for the West. Of particular interest is “Goal 2: Ensure energy is clean, affordable, and reliable by providing a balanced portfolio of renewable, non-traditional, and traditional resources”18. California has been at the forefront of this movement away from carbon intensive fuels. Senate Bill 350 (2015) sets a target of 50 percent petroleum reduction in the transportation fuel mix by 2030.19 Justifications for this reduction come from the added stability it creates in the California fuel market and the economy as a whole. Gasoline prices are historically among the most volatile of all fuels (Figure 2-5). Most of this price volatility can be attributed to fluctuations in crude oil prices, concentration of supply amongst a few firms, and a lack of basic fuel diversification. The last cause creates a circular benefit to diversifying the fuel mix: rely less on petroleum and its fluctuations have less relative impact, at the same time shifting away from petroleum makes fuel prices more stable. Moreover, economists have documented a robust negative correlation between fuel price volatility and economic growth.20 Increasing consumer options and mitigating the impacts of price shocks are two overall net benefits for the economy that decentralizing the transportation fuel mix can provide.
Figure 2-5: Average Retail Fuel Prices in the United States (2018)
Source: U.S. Department of Energy, 2018
Oregon is especially vulnerable to gasoline disruptions as there are no refineries in the state; and, as such, more than 90% of all refined petroleum in the state comes from the Puget Sound area of Washington21. During times of crisis this could lead to extreme shortages in liquid fuels supply and further highlights the need for fuel diversity within the state.
18 “Energy Vision for the West.” Western Governors' Association, June 2018. http://westgov.org/reports/2018-energy-vision-for-the-west 19“Transportation Fuel Prices and 50 Percent Reduction in California.” Environmental Defense Fund, September 2015. https://www.edf.org/sites/default/files/50_percent_petroleum_use_fuel_price_memo_sep_1.pdf 20 Environmental Defense Fund, 2015. 21 “Oregon Fuel Action Plan.” Oregon Department of Energy, October 2017. https://www.oregon.gov/energy/safety-resiliency/Documents/Oregon-Fuel-Action-Plan.pdf

17
One sector of the economy with a unique reliance on petroleum is transportation. In 2016, petroleum-based products accounted for 93.3% of the transportation fuel mix in Oregon22 (Figure 2-6). Combine this with the fact that transportation accounts for 38% of all Oregon’s energy consumption, and the state’s reliance on gasoline becomes more evident. One way to measure the dominance of gasoline within the transportation fuels market is the Herfindahl-Hirschman Index. This simple index is used to measure market concentration by summing the squares of the market share held by each firm or good. 23 Using U.S. Energy Information Administration estimates, petroleum accounted for 98.14% of Oregon’s transportation fuel consumption in 2016 while natural gas and electric vehicles made up 1.8% and 0.03% respectively. We calculate Oregon’s HerfindahI Index for transportation fuels at 9,634, out of a max of 10,000. According to the Department of Justice and Federal Trade Commission’s Horizontal Merger Guideline an HHI above 2,500 is considered “highly concentrated”.24 For reference we have surveyed several public fleets to analyze their vehicle mix. We collected data from five departments, Oregon Department of Administrative Services (DAS), Oregon Military Department, Clackamas County, City of Portland, and Waste Management Forest Grove, which again revealed an overwhelming reliance on gasoline vehicles. DAS relies most heavily on gasoline (4,033 of their 4,180 fleet or 96%) and currently employs 16 CNG vehicles (0.38%); DAS also noted that their CNG fleet has been declining rapidly in recent years due to expiring tanks. Waste Management Forest Grove’s fleet is the least dependent on traditional gasoline, making up only 5% of their 83 vehicle fleet. They also have the only fleet in the survey with over half CNG vehicles (61%). Of the three other organizations surveyed, only City of Portland has CNG vehicles in their current fleet (0.42%). In regards to R/CNG, this local sampling provides a snapshot of the lack of transportation fuel diversity within government fleets.
Figure 2-6: Oregon’s Transportation Fuel Mix (2016)
Source: Oregon Department of Energy, 2018
22 “Biennial Energy Report.” Oregon Department of Energy, November 2018. https://www.oregon.gov/energy/Data-and-Reports/Documents/2018-Biennial-Energy-Report.PDF 23 Andrew Chin. “Herfindahl-Hirschman Index Calculator.” University of North Carolina School of Law, December 2010. https://www.unclaw.com/chin/teaching/antitrust/herfindahl.htm 24 Andrew Chin, 2010.

18
In an effort to diverge from this dependence on gasoline and diesel, Oregon Department of Energy amended Key Performance Measure #6 in 2017. The change shifted the focus from evaluating alternative fuels in Oregon large fleets to measuring the diversification of the transportation fuel mix more broadly. The stated goal of this measure is to “diversify fuel used in Oregon in the transportation sector to include alternative and renewable fuels for the economic, health, and environmental benefit of all Oregonians”. 25 Like California, they note diversification of transportation fuels helps reduce economic risk caused by price volatility and increases overall fuel resilience. However, the state has not set any tangible targets related to transportation fuel diversification.26
f. The R/CNG Value Stack: Cost and Benefit Analysis
In fuel diversification, particularly in transportation, R/CNG appears to be an attractive alternative. In this section, we try to quantify and analyze the main costs and benefits of CNG vehicles, compared to traditional diesel vehicles. All data on fuel economy and cost differences between the two types of vehicles used in analyses are provided by Northwest Natural (NWN). The selection of diesel for the comparison is, to a large extent, due to data availability.
Benefit Analysis One benefit of CNG vehicles is their low fuel expenses caused by the relatively stable and low prices of natural gas. Natural gas’ cost per Diesel Gallon Equivalent (DGE) is estimated at $0.75, which is $1.97 lower than diesel fuel price ($2.72 per gallon). Under the typical assumption that CNG is 15% less efficient than diesel in terms of fuel economy, using CNG fuel can save $0.44 per mile relative to diesel.
Figure 2-7: Fuel Expenses per Mile ($)
Source: NERC with data provided by Northwest Natural (NWN)
The use of natural gas also has environmental benefits, which stems from its lower Greenhouse Gas (GHG) and other air pollution emissions. California’s peer reviewed well-to-wheel (life-cycle) GHG emissions analysis showed about a 23% reduction in GHGs for CNG buses compared to diesel buses
25 “Annual Performance Progress Report.” Oregon Department of Energy, 2017. https://www.oregon.gov/energy/Data-and-Reports/Documents/2017-Annual-Performance-Reports.pdf 26 “Annual Performance Progress Report.” Oregon Department of Energy, 2018. https://www.oregon.gov/energy/About-Us/Documents/2018-Annual-Performance-Progress-Report.pdf

19
(in 2012).27 Each DGE of natural gas used can save between 0.0047 and 0.0088 metric tons of CO2 relative to diesel. Given the Oregon Clean Fuel Program Price Per Ton CO2 of $160, the CO2 reduction can provide a cost advantage of $0.12 - 0.30 per mile for natural gas over diesel.
Figure 2-8: GHG Expense per Mile
Source: NERC with data provided by Northwest Natural (NWN)
f.1. Cost Analysis
While saving fuel expense, CNG vehicles require extra deployment and operational costs. First, CNG vehicles are typically more expensive than comparable vehicles using traditional fuels. Compared to diesel, for example, the extra cost for acquiring a CNG vehicle is approximately $50,000 on average, ranging from $10,000 for a half-ton truck to $100,000 for a transit bus. Second, compared to diesel vehicles, the CNG vehicles need compression electricity costing $0.148 per DGE, extra maintenance expense of $0.171 per DGE, and additional insurance of $0.003 per mile. Under the assumption that CNG is 15% less efficient in terms of fuel economy than diesel, the three operational categories add up to roughly $0.093 per mile. For large fleets, which may consider fueling and maintaining their CNG vehicles themselves, additional costs on infrastructure should be accounted for. First, CNG vehicles require fueling stations different from those using gasoline, diesel and other traditional fuels. The cost of designing and installing a CNG fueling system can reach $1,000,000. Second, infrastructure has to be changed for maintenance purpose. Each maintenance bay retrofit for gaseous fuels can cost $75,000, depending on the activities being done.
f.2. Risk Analysis
In assessing the costs and benefits of the CNG fuel vehicles, a number of risk factors must be considered as well. The first is fuel market fluctuations. Apart from environmental benefits, the biggest advantage of the CNG fuel vehicles has to do with their low fuel costs. This advantage however, heavily relies on the stability of the natural gas market, in contrast to the high volatility of refined petroleum. Second, CNG fuel tanks expire after 15-25 years, and must be disposed of and replaced when reaching the expiration dates. 28 Most CNG vehicles are retired when their tanks
27 Tiaxx. “Full Fuel Cycle Assessment: Well-To-Wheels Energy Inputs, Emissions, And Water Impacts.” California Energy Commission, February 2007. www.energy.ca.gov/2007publications/CEC-600-2007-004/CEC-600-2007-004-REV.PDF 28 “Alternate Fuels Data Center.” U.S. Department of Energy. https://afdc.energy.gov/vehicles/natural_gas_cylinder.html

20
expire, making the number of CNG vehicles decline rapidly (e.g. DAS Fleet had 151 CNG Honda GX’s at one point, but now only has 11 left in service. It also had 13 CNG cargo vans in 1997, 12 in 2004, and now only has one left in service - which is predicted to be gone by the end of the year). It is not clear from the data whether new CNG vehicles are used to replace the disposed ones, and how the tank-expired CNG vehicles will be used after their disposal. While we do not have data on the cost of CNG fuel tank replacement, given the large operational benefit of the CNG vehicles as analyzed above, it is clear that replacing tanks to retain the used vehicles is not likely to be cost effective.29 At this point, the lifetime of the CNG fuel vehicles seems to be closely linked to the lifetime of the tanks. Therefore, while data on vehicle-miles traveled per year are needed to calibrate the net benefit of the CNG vehicles, accounting for higher cost of vehicle deployment, the type of businesses and economies of scale certainly plays an important role in cost-effectiveness of the CNG vehicle fleet. Third, CNG fuel vehicles require fueling stations that are different from traditional vehicles, which seem to be expensive, and thus may not be widely available. The cost of designing and installing a CNG fueling system can reach up to $1,000,000. Data from NWN indicates that there are five public CNG fueling stations and 12 private stations in the NWN region (mostly refuse haulers and transit authorities) in Oregon, as well as one public station just over the river in Washington state. Although it is hard to tell if a total of 18 fueling stations are adequate to fuel all CNG vehicles in Oregon, we find some qualitative assessment from fleet managers that CNG fueling infrastructure is limited, causing the CNG vehicles to not be utilized to their full potential. If that is the case, then their operation benefits will be suboptimal relative to their large initial acquisition expenses.
f.3. Net Benefit Analysis
The above analyses demonstrate that using CNG fuel vehicles significantly saves operational costs, but incurs substantial initial investment on infrastructure, compared to diesel fuel counterparts. Overall, each CNG fuel vehicle can accrue a net benefit of $0.465 per mile traveled relative to a diesel fuel one. Given the extra average cost of $50,000 to acquire one CNG fuel vehicle, after about 108,000 miles, the operational benefit would fully cover the initial deployment expense, assuming that the CNG fuel vehicle is utilized to its full potential. Should the percentage of utilization be only 80 percent, then the break-even distance can increase to nearly 135,000 miles. Similar analyses can also be done for fueling and maintenance infrastructure. However, such analyses require data on the size of the fleets.
Table 2-3: Net Benefit of CNG Vehicles Compared to Diesel Vehicles in Operation Expenses
29 Cheryl Knight. “What Happens When Your CNG Tanks Expire?” Government Fleet, May 2010. https://www.government-fleet.com/146620/what-happens-when-your-cng-tanks-expire
Categories Benefit per Mile
Fuel Saving $ 0.442
Environmental Benefit $ 0.116
Maintenance $ (0.093)
Net $ 0.465

21
In sum, fuel diversity provides a potentially significant risk reduction. Oregon currently does not have a diverse fuel mix—indicating that increased diversity could substantially lower economic risks to global fuel price changes or disaster events. However, CNG vehicles’ net benefits are dependent on a number of factors including the intensity of their use and the availability of refueling stations.

22
III. RENEWABLE ENERGY & NATURAL GAS INFRASTRUCTURE
Given the high levels of public support for decarbonization policies in Oregon and neighboring states, a range of legislative and regulatory actions have led to substantive progress in some areas, and identification of targeted carbon reductions for other sectors. Among the most difficult sectors to decarbonize that are commonly identified in the literature are transportation and building heating. Addressing the role of natural gas as a fuel source stands to have important impacts for both as renewable natural gas sources are further integrated. The central role natural gas plays in building heating will cause the natural gas industry to be tightly coupled with policies and technical solutions to building decarbonization. The role of natural gas in transportation decarbonization is less clear. This is because of the relatively low penetration of natural gas in the transportation fuel market dominated by gasoline and diesel, and uncertainty as to what trends and policies, if any, will cause an increase in R/CNG use to displace these fuels. Complicating the transportation picture further is the emergence of vehicle electrification and the prospect of alternatives to personal vehicles as the primary means of transportation. In keeping with the trend of an ever-broadening set of options that are becoming available for the decarbonization push, a new effort to reduce the GHG intensity of the natural gas system is underway in Oregon through the integration of renewable natural gas sources.
a. Renewable Natural Gas in Oregon
The 2019 Oregon legislative passed Senate Bill 98, which was signed in to law in June. This bill sets forth a framework for large gas utilities, NWN in particular, to pursue investments and acquisitions of renewable natural gas (RNG), in accordance with rules to be developed by the OPUC. The bill extends the renewable portfolio standard (RPS) concept, which was first applied to electric utilities in 2007 with SB 838, and extended in 2016 with SB 1547, which established a 50% RPS by 2040. SB 98 establishes natural gas RPS targets for years 2020 through 2050, which start at 5% and rise to 30% over that time. SB 98 authorizes NWN to invest 5% of its annual revenue requirement in incremental costs to meet the targets each year, and costs in excess of 5% must be approved by the OPUC. Upon completion of OPUC proceedings to set forth rules for the natural gas RPS program, NWN will be able to invest in RNG capabilities. For purposes of comparing natural gas provided by NWN with potential future RPS levels with traditional gasoline and diesel fuels, as shown in Table 3-1.30
30 These GHG intensity figures assume a GHG intensity of zero for the additions of RNG to the natural gas supply.

23
b. Sources of RNG and Resilience Attributes
While RNG production is a young industry in Oregon, mature and readily deployable technologies are available to NWN in the near term for acquisition of RNG in pursuit of the targets identified above. To support quantities of RNG above what can be achieved with these existing technologies, several new production methods are under development and may become commercially available for future deployment. A 2018 study by the Oregon Department of Energy assessed anaerobic digestion and thermal gasification technologies for their potential in converting feedstocks to biogas.31 The study found that there is sufficient compatible feedstock volume in Oregon to provide 4.6% of Oregon’s natural gas use via anaerobic digestion, which converts non-woody biomass, food waste, agricultural manure, and wastewater into methane. SB 98 is likely to encourage efforts to equip facilities such as wastewater treatment plants, dairies, landfills and several other types of sites with the equipment to capture and clean produced biogas such that it meets standards for injection into NWNs pipelines. Because anaerobic digester plants are typically sited close the feedstock source, and NWN’s pipeline network reaches many of these locations, digester-produced RNG is a distributed resource. The ODOE study also looked at thermal gasification and methane conversion of woody biomass, which is generally not compatible with anaerobic digestion. This feedstock type has a larger potential at 17.5% of Oregon’s annual natural gas use, but the conversion technology is less commercially mature with no production facilities currently operating in the U.S. and exhibits higher uncertainty in feasibility and construction cost. There is greater experience in operating and assessing thermal gasification technology in the European RNG sector. A recent report by Navigant Research on a net-zero GHG gas supply sponsored by a group of European gas transport companies found that costs to build and operate thermal gasification RNG plants have the potential to be reduced by 53% by scaling up the industry and improving economies of scale. If such an outcome proves to be valid, Oregon could benefit due to its large resource potential in forestry and wood products residuals. This resource is also likely to be distributed due to the inherent presence of a distance tradeoff in collection of forest products and transporting them to production facilities. Other emerging technologies for production of RNG are electrolysis of water to produce hydrogen, which may be directly injected into natural gas pipelines, and conversion of this hydrogen to synthetic natural gas by combining it with CO2 to create methane, which is entirely compatible with natural gas pipelines and end uses. This compatibility attribute makes synthetic RNG (when the electricity is provided from renewable and zero-GHG sources) an attractive option. However, like thermal gasification, there are currently commercial, technological and scale barriers in place to implementation of the methane conversion component of the process. Research efforts are underway to deepen the scientific and chemical engineering knowledge needed to bring the process into commercial viability.32 The efficiencies of water electrolysis and methane conversion are 70% and 80%, respectively, which results in 56% of input electrical energy being available for injection into NWN’s pipeline and storage network. While other storage technologies have higher efficiencies,
31 “Biogas and Renewable Natural Gas Inventory 2018 Report to the Oregon Legislature https://www.oregon.gov/energy/Data-and-Reports/Documents/2018-RNG-Inventory-Report.pdf 32 “The renaissance of the Sabatier reaction and its applications on Earth and in space” Nature Catalysis 2019 https://www.nature.com/articles/s41929-019-0244-4

24
methane may be stored indefinitely and could contribute to long duration and seasonal storage of renewable energy. The production of elemental hydrogen is a commercially viable process, with multiple projects in the EU.33 While hydrogen may be directly injected into natural gas pipelines, there will be limits to the proportion of hydrogen that may be blended with natural gas and transported in transmission and distribution pipelines due to pipeline materials and end use device compatibility. In contrast to synthetic methane conversion, production of elemental hydrogen is much closer to commercial maturity, with many operating examples of electrolyzer plants around the world. In the Pacific Northwest, pilot projects are in the planning stages around the region.34 Siting of hydrogen and synthetic methane production facilities pursuant to RNG goals is somewhat flexible so long as access to sufficient electricity transmission or distribution capacity and natural gas pipelines are both available. Therefore it is possible to take resilience attributes into account when selecting locations for production facilities. These attributes may include storage associated with these production facilities or in NWN’s existing system, probability of system disruption, as discussed in section IV below, and the value of increased diversity with respect to natural gas sources.
IV. OVERVIEW OF NWN SYSTEM RESILIENCE
The purpose of this section is to provide the reader with a description and basic understanding of NWN’s transmission and distribution system that supports CNG use for transportation, how the system works in normal conditions, as well as an introduction into the factors that stand to influence its performance following a range of service disruptions including the worst-case disaster scenario such as a CSZ earthquake and tsunami event.
a. NW Natural Transmission and Distribution System
NWN operates a natural gas transmission and distribution system in Oregon and Washington, serving over 740,000 customers. While NWN’s planning objectives include the future production of renewable natural gas within its service territory, the company is not currently a significant producer of natural gas. Therefore, NWN purchases gas from suppliers in other states and Canada and takes delivery via the interstate pipeline system. NWN’s primary connection to the larger interstate gas transmission network is the Williams Northwest Pipeline Corporation (NWP) interstate transmission pipeline. The Williams pipeline routes access both the Canadian and Rocky Mountain Basins providing source diversity. The Williams pipelines have over 40 interconnection points. These points are called gate stations, and include metering, pressure regulation, and ordorization functions as the gas enters NWN’s system
33 Dragoon, K. (2019). Power to Gas: Opportunities for Greening the Natural Gas System. 23 Feb 2019. www.flinkenergy.com/resources/Power%20to%20Gas.pdf 34 Douglas PUD in Washington State is currently researching a 2-3 MW pilot plant. https://douglaspud.org/Pages/Renewable-Hydrogen.aspx

25
and provides path diversity. Gas from the Williams NWP that is injected into NWN’s system flows first through high pressure transmission pipelines and proceeds either to the lower pressure distribution system that connects to customer load or enters NWN’s storage facilities. The system design provides system integrity and isolation of disruptions. The combination of source and path diversity from the Williams piplelines, coupled with the path diveristy of NWN transmission and distribution systems and storage, enhances the resilience of the NWN energy system in Oregon. The Williams pipelines are likely to experience service interruptions during earthquakes. An assessment of the vulnerability of the Williams pipeline system to disaster events, particularly relative to the Columbia River crossing, would be an important future engineering study.
Table 4-1 below shows NWN’s transmission and distribution pipeline construction type, which is comprised of cathodically protected welded steel (which provides corrosion resistance), and polyethylene. Both of these pipeline types generally have good material properties that promote the ability to withstand some types of seismic stresses without failure .35 The NWN pipe replacement program, conducted in partnership withy the OPUC, replaced cast iron pipe in 1983-2000 and bare steel pipes in 2001-2015.
Table 4-1: Construction Types
35 "Natural gas pipeline technology overview. (Technical ... - OSTI.gov." 1 Nov. 2007, https://www.osti.gov/biblio/925391-natural-gas-pipeline-technology-overview. Accessed 14 Jun. 2019. https://www.oregon.gov/energy/safety-resiliency/Documents/Oregon-Fuel-Action-Plan.pdf
Type Miles Pipeline Construction
Transmission 660 100% Cathodically protected welded steel
Distribution 13,867 47.3% Cathodically protected welded steel 52.7% Polyethylene
Figure 4-1: Williams NWP Transmission Network

26
Figure 4-2: NWN Transmission & Distribution Network

27
a. NWN Gas Operation Practices
Maintaining gas pressure within the correct range at every tier of transmission and distribution networks is a core competency of a gas utility. Natural gas must be pressurized to cause it to flow through the system, and in turn its pressure must be maintained within specific ranges to ensure reliable operation. Every type of pipeline in NWN’s system, from high pressure transmission to low pressure distribution, has upper and lower bound pressure limits that must be respected during operation. Because gas pressure may vary within these bounds, a certain quantity of gas is effectively stored in the pipelines. For example, when gas pressure is near the upper pressure bound, a certain quantity of gas may be extracted from the system to serve customer load until the lower bound is reached, without injection of any additional gas from supply sources. This quantity of gas that is stored in the pressurized piping system is known as “linepack.” During normal operation, a combination of NWN linepack, interstate supply pipelines, and injections/withdrawals from storage facilities are key tools used by NWN to maintain pressure balance across its system. Figure 4-3 below shows an example of pressure variations that regularly occur within a natural gas transmission pipeline system as supply enters the system to increase pressure and customer load draws pressure down, often occurring over a diurnal cycle.36
Figure 4-3 Daily Pressure Variations within a Pipeline Network. Source: NW Natural
As part of its safety project plan , NWN’s operations capabilities include pressure monitoring and isolation valve controls at a growing number of points across its distribution system and at pipeline gates. Federal regulations pertaining to natural gas safety focus on operation practices and planning
36 "Aliso Canyon Risk Assessment Technical Report - California Public ...." 4 Apr. 2016, http://www.cpuc.ca.gov/uploadedFiles/CPUC_Public_Website/Content/News_Room/News_and_Updates/AC%20Risk%20Assessment%20Technical%20Report%20%204-4-16_clean.pdf. Accessed 19 Apr. 2019.

28
procedures that ensure that gas is contained in pipelines. These regulations are prescribed and administered by the US Department of Transportation Office of Pipeline and Hazardous Materials Safety Administration (PHMSA). The high levels of natural gas pipeline safety required by PHMSA at the interstate level and by NWN and the OPUC at the local transmission and distribution level results in regularly occurring safety assessment and improvement activities that are supported by NWN’s Transmission Integrity Program and Disiribution Integreity Program and enhance system resilience capabilities. These capabilities may be further enhanced as greater levels of understanding are developed of the system vulnerabilities and opportunities to mitigate those vulnerabilities are developed. NWN’s crews are trained and equipped to respond to outages, isolate disruptions, tap into pipelines, and sectionalize the system to minimize the extent of a disruption. The skills and competencies of NWN’s crews in performing ordinary operations activities, and localized disruptions, will continue to be applicable following a worse-case CSZ event. NWN crews can repair, replace, or install temporary pipelines to bridge, or jumper, across disrupted sections. NWN can mobilize dedicated CNG transport vehicles to provide an alternate source of supply to disrupted sections. For example, when service disruptions occur in NWN’s system today, such as if excavation equipment strikes a gas distribution line and cuts off service to a section of the distribution system, NWN can mobilize a CNG tube trailer that connects to that section to provide continued service while the damaged section is being repaired.
b. NW Natural Gas Storage Capabilities
NWN currently has multiple gas storage resources available for use that enable both daily management of gas deliveries to customers and the ability to respond to periods of peak gas demand during cold weather. NWN owns three of these facilities, two LNG facilities in Portland and Newport, and one underground storage field in Mist, Oregon. NWN also has contracts for use of capacity at the Jackson Prairie underground storage facility in Washington. The table below shows NWN’s storage facilities in Oregon and Washington that includes a portion of the Mist facility that provides storage service to PGE generators.
Table 4-2: NWN Gas Storage Facilities
Facility Location Type Maximum Daily
Deliverable ( Mtherm/day)
Designed Storage Capacity (Bcf)
Owned: Mist NW Oregon Underground
depleted gas field 3.1 10.6
Contracted: Jackson Prairie
SW Washington
Underground depleted aquifer
0.5 1.1
Newport LNG Newport, Oregon Liquefied Natural
Gas
0.6 1.0
Portland LNG Portland, Oregon
1.3 0.6

29
1. Mist Underground Storage Facility
NWN’s largest storage facility accepts injections and delivers withdrawals of gas via the Miller Station compressor and dehydrator equipment located near Mist, Oregon. It is connected to three of NWN’s transmission pipelines to transport the gas north to Port Westward and southeast to Portland. The Mist facility entered service as a storage asset in 1989, that accesses depleted natural gas reservoirs. It was expanded in 2018 in an agreement with PGE. When it began operation, Mist’s withdrawal capacity -- the peak flow rate capability to serve high gas demand -- totaled 520,000 dekatherms per day. This capacity was in excess of NWN’s needs then, and today, allowing NWN to offer commercial gas storage service. Some of the Mist capability is offered to gas shippers that do not serve NWN’s core customers. Currently, NWN reserves 305,000 Dth/day of capacity from Mist for its core gas customers, a number that it can increase by reducing the capacity available to its commercial gas storage business and reallocating it for use by core customers. The total quantity of gas contained in the Mist facility (including PGE’s storage component) is 16 million dekatherms, which is the energy content equivalent to approximately 133 million gallons of diesel fuel. In comparison, the entire state of Oregon consumes 250 million gallons per month of petroleum liquid fuels. 37 The location of Mist’s stored gas deep underground places it at an advantage for seismic resilience. The depth of the depleted gas field is approximately 4000 feet, which is overlain by layers comprised of shale, mudstone, and siltstone that average 2,200 feet in thickness and provide a tight seal above the field.38
2. Liquefied Natural Gas (LNG) Facilities
NWN maintains LNG facilities in Portland and Newport that are primarily used to provide gas during very high demand periods in the winter. They were built during the late 1960s and mid-1970s, respectively and while NWN has stated that the foundations for at least the Portland facility are designed to a high standard to resist liquefaction damage, NWN is not depending on this gas being available for use following a CSZ event. NWN has stated that it expects the gas stored in the Mist facility to remain available following a CSZ event. This assessment is in contrast to that of the Portland LNG facility, for which NWN has stated it does not expect to make use of following a CSZ event.39 This suggests that a higher priority for assessment and potential mitigation activities with regard to pipeline resilience should be placed on the pipelines connecting to Mist compared to other locations that are associated with known resilience risk factors. In the event that the gas supply is not available
37 "Oregon Fuel Action Plan - Oregon.gov." 1 Oct. 2017, https://www.oregon.gov/energy/safety-resiliency/Documents/Oregon-Fuel-Action-Plan.pdf. Accessed 6 Jun. 2019. 38 "Mist underground storage site certificate application - Oregon.gov." 5 Feb. 1981, https://www.oregon.gov/energy/facilities-safety/facilities/Facilities%20library/1981-02-05-MST-ASC.pdf. Accessed 6 Jun. 2019. 39 "Special Public Meeting Seismic Updates from PGE, PAC & NWN - Oregon PUC” 12 Jan. 2016, http://oregonpuc.granicus.com/AgendaViewer.php?view_id=1&clip_id=61. Accessed 11 Jun. 2019.

30
from the interstate pipeline system following a disaster event or disruption, NWN will need to rely upon its stored gas to support continued service and recovery activities.
3. Transmission and Distribution Linepack
There is a quantity of gas in NWN’s transmission and distribution system pipeline network that can be considered to have storage attributes. Linepack is important in the context of resilience given the ability of NWN to isolate pipeline segments that are disrupted, thereby limiting the quantity of gas that is lost. A preliminary estimate of stored energy in linepack is estimated by NWN to be 1.0 million therms.40 This quantity, which equates to approximately 8,800 MWh of electricity generation, far exceeds the capability of currently operational grid-scale electricity storage batteries.
40 NWN’s estimate of linepack was provided to CPS and is reflects average conditions

31
V. EVALUATION OF ALTERNATIVES
a. Problem Statement
Understanding NW Natural and the region’s ability to withstand and recover from a range of disasters, including the worse-case CSZ event, will enable planners to incorporate natural gas into transportation fueling and stationary fuel recovery scenarios. In regard to natural gas service, the State of Oregon Resilience Plan states:
“Following the Cascadia event, the coastal communities will be cut off from the rest of the state and from each other. The coastal area’s transportation system, electrical power transmission and distribution grid, and natural gas service will be fragmented and offline, with long-term setbacks to water and wastewater services.” (p. 52).
To the extent NWN’s current and future resilience study activities can enhance the ability of planners to understand how and where the natural gas network will be disrupted, their recovery plans can incorporate strategies to mitigate the loss of gas used for power generation, building heating, and vehicle fueling. Alternatively, the studies could identify areas where continuity of service is most likely to be available, such as network segments that have few identified vulnerabilities and/or segments where seismic reinforcements may be implemented such that these segments will be expected to stay in service following a CSZ event. In addition, NWN is capable of mitigating service disruptions through use of temporary jumpers around disruptions and mobilizing alternative supply sources with CNG and LNG transport vehicles. In the past several years, NWN has increased its understanding of where and how its transmission and distribution network faces seismic vulnerabilities, and how these issues can be addressed. NW Natural is currently in the initial stages of performing a pipeline resilience study for a portion of its transmission pipeline network above 60 PSI to identify vulnerable areas such as bridge crossings, liquefiable soils, mechanical connections (rather than welded connections), landslide-prone sections, and tsunami inundation zones as noted in the NWN safety project plan.41 An improved understanding of network vulnerabilities will inform analysis of the types, quantities, and locations of equipment installations that should be undertaken in a resilience investment program. Identification of key points of vulnerability such as river crossings or faults allows for subsequent assessments to determine whether those vulnerabilities should be mitigated to assure continued integrity following a CSZ event, or whether isolation valves should be installed to contain any failure to a discrete zone. Comprehensive deployment of monitoring and real-time control equipment on segments of its transmission and distribution network that NWN identifies as having seismic vulnerabilities, or are otherwise designated as areas that may be in need of enhanced seismic performance to withstand CSZ events, would provide substantial disaster resilience and safety public benefits.
41 "NW Natural annual gas safety project plan - State of Oregon: Public ...." https://apps.puc.state.or.us/edockets/docket.asp?DocketID=21045. Accessed 13 Jun. 2019.
32
The widely distributed nature of NWN’s pipeline network is an asset in terms of resilience capability and recovery. While specific predictions of failure probabilities have not yet been assessed or calculated, the question of how to perform a vulnerability/risk and resilience assessment of the risk profile at certain points of gas delivery was viewed through a systems approach. Synthesis of the interviews conducted and literature reviews yielded an initial interpretation of steps that may be taken to develop a deeper understanding of how post-disaster energy services may be provided to critical facilities and transportation functions. The steps include:
Define a process to select post-disaster gas delivery points. A prioritization methodology could select locations of the highest importance, such as hospitals and other critical healthcare facilities, along with their associated transportation requirements. In a parallel effort to fuel priority designations provided by ODOE, the OPUC is tasked with overseeing natural gas resilience, and could provide guidance on locations with the most critical natural gas energy needs for power generation, heating, and transportation.
Define discrete points of gas delivery to be assessed. Because of interdependencies relating to recovery resource allocation tradeoffs, defining a discrete and limited number of gas delivery points to be analyzed is likely to result in greater accuracy and a more manageable assessment process.
Define natural gas source continuity probability. NW Natural’s current gas sources are primarily the Williams Pipeline and Mist storage facility. In the future, distributed RNG sources will likely be added.
Define mission-critical pipeline segments between sources and delivery points. Identify a set of mission-critical pipeline segments that can connect all sources to all delivery points.
Perform seismic performance analysis on the mission-critical segments. This step would identify potential failure modes and associated probabilities and result in a vulnerability-risk assessment.
Perform post-disaster mitigation exercise. Given the failure modes identified, simulate and exercise deployment of mitigations to evaluate the ability to restore the mission-critical network segments. Exercises will highlight capability gaps that should be addressed by either enhanced mitigation capabilities or pre-disaster seismic upgrades to prevent segments that prove to be vital to performance of the critical network segments from experiencing failures.
One of the outcomes of such an assessment could be the identification of key natural gas pipeline lifeline corridors that, like transportation lifeline corridors, are prioritized for both pre-disaster reinforcement, and post-disaster mitigation deployment. Identification of natural gas lifelines would assist planners in evaluating how best to use these potentially higher reliability natural gas sources to maintain service continuity to critical facilities by providing electricity generation, vehicle fueling, and building heating capabilities.

33
b. Examples of Mitigation for Pipeline Disruptions
To restore service to critical service locations, and to provide fuel to CNG vehicles, several mitigation types can be deployed by NWN crews following a disaster. Two examples are provided below. In the event that a pipeline segment is intact and operational but for a discrete failure location, temporary pipelines may be temporarily deployed to bridge across this failure so that the segment can return to service. An example can be seen in Figure 5-1. The use of jumper sections for recovery following a CSZ event is limited by the span length and the availability of NWN crews to access the location of the failure. As emergency plans are developed, more specific use cases based on the types and locations of expected failure points may be created to inform the need for further development of this competency by NWN crews.
Figure 5-1: Example of Flexible Jumper Pipeline
Another mitigation tool is the use of vehicles to move natural gas over the road from source locations that maintain service integrity at locations where gas is needed. 5-2 below shows a comparison of the energy quantities that may be transported via truck or trailer.
Figure 5-2: Comparison of Liquid Fuel and Natural Gas Transported by Vehicle

34
To achieve the similar energy deliveries, a trailer containing several CNG tanks, called a tube trailer, will take up more space on the road than a liquid fuel truck, however the distance that a CNG tube trailer will need to travel between source and delivery is likely to be less than for liquid fuel. This is assuming that liquid fuel from the CEI Hub will not be available and liquid fuel supplies will originate out of state.
Both jumper pipes and CNG trailers will need to be connected to the pipeline segments to which they will provide failure mitigation service. NWN crews are able to tap into both active and evacuated pipelines at any location that can be accessed. Certain locations have risers that enable crews to access the pipeline more quickly, which may be valuable to include on critical pipeline segments or along with isolation valves to enable injection or withdrawal of gas at these points.
c. Comparison of Natural Gas and Liquid Fuel Supply for Recovery
The above research identified several differences between the supply constraints and use-cases for both R/CNG and liquid fuel types. There is a major difference in how the fuels are used, with liquid fuels primarily used for transportation and natural gas primarily used for building and industrial heating and power generation. While natural gas-fueled vehicles represent a mature technology with widespread use, the current quantity and type of such vehicles on the road today would be insufficient to provide the desired disaster recovery capability. For example, one of the largest fleets of natural gas vehicles are garbage trucks that have proven to be useful in disaster recovery situations and augment emergency vehicles. Nonetheless, we will provide an assessment of the capability of natural gas as a fuel supply for vehicles to complement its current critical role in heating and power generation. The primary physical difference between the natural gas and liquid fuel supply situation is the path diversity, distributed resources, and availability of alternate points of natural gas supply. By comparison, natural gas has a higher likelihood of maintaining integrity than the centralized nature of liquid fuel supply. The reasons for this conclusion are three fold:
A high-level assessment of NWN’s Mist storage facility in comparison to the CEI Hub yields a superior level of resilience that should be further quantified as this fuel may be incorporated into future resilience and fuel supply planning.
The quantity of linepack, or gas stored in the pipelines, is sufficient in quantity to warrant closer consideration as grid-scale storage in resilience planning, especially due to the distributed nature of failure risk that is gained from the extensive pipeline network.
NWN’s pipelines have sufficient inherent resistance to failure that these material properties, along with certain upgrades, provide a reasonable opportunity for a recovery effort to access fuel from points of supply that retain their integrity.

35
d. Natural Gas-Supported Electricity Generation
In the past three decades natural gas has become the single largest energy source used by the power generation sector in the United States.42 Pacific Northwest electric utilities rely heavily on natural gas-fueled power generation, especially given the increasing penetration of intermittent renewables on the grid and constraints on hydropower. And, while the current policy efforts underway to reduce greenhouse gas (GHG) emissions in the region will likely result in a significant reduction in the overall GHG intensity of electricity, the capacity of existing natural gas-fueled power stations will likely be needed for many years to come. Similarly during the disaster recovery phase, restoration of the electricity grid will require the availability of natural gas to supply generators located in areas with sufficient electricity grid integrity to re-energize the system. The following sections describe NWN’s role in providing service to utility-scale generators and distributed and backup generators.
1. NW Natural Storage to Serve PGE Electricity Generation
In 2015 NWN reached an agreement with PGE to expand the Mist facility by including a new reservoir and an additional compressor station to provide 120,000 dekatherms/day to PGE’s Port Westward natural gas-fired power plants.43 The project included a new 13-mile pipeline and makes 2.5 BCF of stored gas available to PGE for use in the three power generation facilities served by the pipeline. The 2.5 BCF in non-core Mist storage provides enough energy to support operation of the 1,165 MW of generation located at PGE’s Port Westward for over approximately 230 hours, equating to over 275,000 MWh. PGE takes firm storage service from this facility under the new Rate Schedule 90 that was approved by the OPUC in October 2014. PGE’s decision to build the 220 MW Port Westward II generating plant was predicated on obtaining a Schedule 90 firm gas storage agreement with NWN for a 30+ year term44. The connection of PGE’s Port Westward generating plants to an expanded Mist facility provides these plants with firm gas service, which is becoming increasingly important to ensure reliability of the electricity system during periods of peak demand. Because this generation is not vulnerable to outages or supply constraints on the interstate pipeline network, it is resilient to a greater number of local or region-wide disaster and disruption scenarios. In addition, PGE’s portion of Mist storage represents a large quantity of stored energy that it may use to dispatch flexible generators to manage its system as renewable energy penetration increases.
42 "Electricity Data - EIA." https://www.eia.gov/electricity/monthly/epm_table_grapher.php?t=epmt_1_01. Accessed 12 Jun. 2019. 43 "NW Natural to Proceed with North Mist Expansion Project Permitting." 6 Feb. 2015, https://www.nwnatural.com/AboutNWNatural/PressRoom/2015PressReleases/NWNaturalToProceedWithNorthMistExpansionProjectPermitting. Accessed 5 Jun. 2019. 44 "NWN OPUC Advice No. 14-7 Initial Filing, May 5, 2014" https://apps.puc.state.or.us/edockets/docket.asp?DocketID=18989. Accessed 5 Jun. 2019.
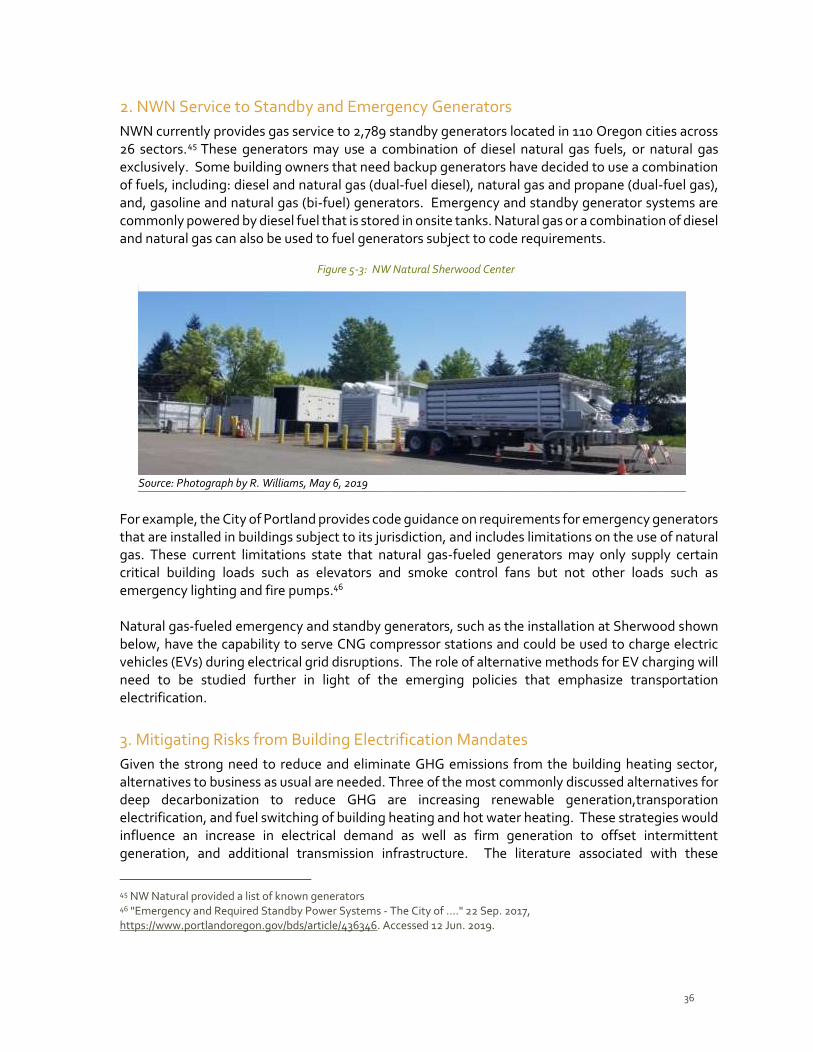
36
2. NWN Service to Standby and Emergency Generators
NWN currently provides gas service to 2,789 standby generators located in 110 Oregon cities across 26 sectors.45 These generators may use a combination of diesel natural gas fuels, or natural gas exclusively. Some building owners that need backup generators have decided to use a combination of fuels, including: diesel and natural gas (dual-fuel diesel), natural gas and propane (dual-fuel gas), and, gasoline and natural gas (bi-fuel) generators. Emergency and standby generator systems are commonly powered by diesel fuel that is stored in onsite tanks. Natural gas or a combination of diesel and natural gas can also be used to fuel generators subject to code requirements.
For example, the City of Portland provides code guidance on requirements for emergency generators that are installed in buildings subject to its jurisdiction, and includes limitations on the use of natural gas. These current limitations state that natural gas-fueled generators may only supply certain critical building loads such as elevators and smoke control fans but not other loads such as emergency lighting and fire pumps.46 Natural gas-fueled emergency and standby generators, such as the installation at Sherwood shown below, have the capability to serve CNG compressor stations and could be used to charge electric vehicles (EVs) during electrical grid disruptions. The role of alternative methods for EV charging will need to be studied further in light of the emerging policies that emphasize transportation electrification.
3. Mitigating Risks from Building Electrification Mandates
Given the strong need to reduce and eliminate GHG emissions from the building heating sector, alternatives to business as usual are needed. Three of the most commonly discussed alternatives for deep decarbonization to reduce GHG are increasing renewable generation,transporation electrification, and fuel switching of building heating and hot water heating. These strategies would influence an increase in electrical demand as well as firm generation to offset intermittent generation, and additional transmission infrastructure. The literature associated with these
45 NW Natural provided a list of known generators 46 "Emergency and Required Standby Power Systems - The City of ...." 22 Sep. 2017, https://www.portlandoregon.gov/bds/article/436346. Accessed 12 Jun. 2019.
Figure 5-3: NW Natural Sherwood Center
Source: Photograph by R. Williams, May 6, 2019

37
strategies reviewed diuring tis study does not address the potential role of renewable natural gas as a factor in decarbonization. RNG is a topic in the industry press as eveidenced by: https://www.sempra.com/newsroom/spotlight-articles/study-advises-renewable-natural-gas-use-low-carbon-building-strategy, https://www.socalgas.com/1443741887279/SoCalGas_Renewable_Gas_Final-
Report.pdf Table 5-1 below shows the total annual quantities of energy delivered to buildings and industry in the Pacific Northwest. While this is not specifically reflective of conditions that are present during the peak winter heating season, it is indicative of the magnitude of the problem of electrification of building and industrial heating.
A dilemma arises during the coldest days of the year when natural gas demand peaks. A robust push for building electrification would place high additional demands on the electricity generation, transmission and distribution systems. While these systems are generally operated with capacity utilization factors that would allow for greater total energy deliveries, a large increase in electricity load at peak winter hours would drive the need for new generation capacity and potentially new transmission and distribution capacity to deliver the energy. Continued installation of intermittent renewable energy generation from solar and wind, and associated expansion of the electrical gris, are likely outcomes of deep decarbonization strategies as eveidenced by the State of california goal of 100% carbon free energy by 2045 and GHG reduction targets in 2950. The role of renewable natural gas (RNG) in electrical generation to firm intermittent renewable energy generation has potential as an alternative and requires further analysis. The crux of the dilemma arises in a case when the electricity generation capacity expansion needed to serve winter peak loads is provided by natural gas-fired plants. While plans to acquire natural gas-fired generation facilities have generally fallen out of favor in electric utility integrated resource planning processes in recent years, there is reason to believe that the prospect of new natural gas generation capacity to support electric grid reliability should be considered. This is because of the absence of near-term alternative resources that can be considered “firm low carbon” electricity generating resources, or those that can operate continuously for extended durations during periods of low renewable energy production. Sepulveda et al. (2018) found that in deep and fully decarbonized electricity sector future scenarios the presence of firm low carbon resources reduced total costs by 42% to 163% compared to cases where only renewables, short duration storage, and demand flexibility are deployed. 48 Electricity storage resources are
47 Gas Consumption = Northwest Gas Association member deliveries 2017. https://www.nwga.org/wp-content/uploads/2017/11/Outlook2017WEB_REV.pdf Electricity Consumption = Pacific Northwest Utilities Conference Committee 2018 Regional Forecast http://www.pnucc.org/sites/default/files/2018%20Northwest%20Regional%20Forecast.pdf 48 “The role of firm low-carbon electricity resources in deep decarbonization of power generation” http://energy.mit.edu/news/study-adding-power-choices-reduces-cost-and-risk-of-carbon-free-electricity/
Table 5-1: Pacific Northwest Natural Gas Consumer Deliveries vs. Electricity47
Natural Gas Electricity
Delivered Site Energy (GWH) 239,000 181,500

38
generally not considered firm low carbon resources because they cannot operate continuously. For example, PGE’s 2019 IRP considers storage resources that operate from 2 to 8 hours. While there is currently no widely accepted definition of firm low carbon resources, the multi-day sustained energy demand for heating and electricity during winter peak conditions is most concerning from a resource planning and system reliability perspective. In the Pacific Northwest, the dominance of hydroelectric resources is an enormous asset which provides firm carbon-free electricity. However, a greater reliance on hydro resources, which is currently occurring due to the retirement coal-fired facilities, makes the region more vulnerable to water shortages. The Pacific Northwest hydro system is historically prone to large variations in river flows. River flow variations are forecasted to grow significantly with regional warming.49 To the extent that natural gas infrastructure is needed to support continued delivery of energy in support of electricity and building sector decarbonization policies, this delivery capacity may also be utilized to fuel CNG vehicles and reinforced to provide continued service to these vehicles following a CSZ event. Taken together, the complimentary use of natural gas for CNG vehicles, and deployment of larger numbers of fully electric and plug-in hybrid vehicles may signal the ability to begin to decouple transportation energy needs from reliance on the CEI Hub. That this shift is essential to improve resilience outcomes in the region, and is consistent with general public sentiment about the role of the CEI Hub in the community, provides a motivating factor to further explore the role of these alternatives.
49 Climate Change Impacts Will Affect Timing, Volume of River Flows And Hydropower, Study Asserts. 2018. https://www.nwcouncil.org/news/climate-change-impacts-will-affect-hydropower-river-flows-study-asserts Accessed 13 Aug 2019

39
VI. CONCLUSIONS
This study has determined that renewable/compressed natural gas enhances the region’s disaster resilience through transportation fuel diversity as well as distributed grid-scale storage and distributed generation. In addition to resilience considerations, this report has found that increasing the number of R/CNG vehicles meets least-cost, least risk criteria under Business as Usual (BAU) conditions. These vehicles are less expensive for fleet operations given standard operating assumptions regarding equipment lifetime and miles driven. This analysis finds that if used to its full potential (roughly 100,000 miles), the savings on operational costs outweigh the initial infrastructure investments - leading to a possible net benefit of $0.465 per mile traveled for CNG vehicles compared to their diesel counterparts. They also possess favorable carbon and air pollution emissions compared to diesel vehicles: yet these air pollution benefits are very unlikely to be directly monetized or recognized except through reduced cardiopulmonary events, asthma, or other respiratory disease burdens. The second source of cost reductions comes from transportation fuel diversification, which protects against fuel price increases. Increases in energy prices can lead to decreased personal income, employment, and GDP. In the case of electricity, several studies have demonstrated that investments that diversify energy infrastructure can lead to positive economic outcomes. The same logic can be applied to the transportation fuel mix. Unlike petroleum, R/CNG is an attractive transportation fuel alternative due in part to its relatively low, stable price. The social benefits from R/CNG associated with fuel diversification and petroleum market price risk reductions compliment the risk reductions from natural disasters. The Oregon Resilience Plan (2013 and 2018) states that Oregon’s energy systems are likely to be disrupted following a disaster event, including electricity, natural gas distribution systems, as well as liquid fuel supplies. Because of the particularly high vulnerability of liquid fuel points of delivery and storage in Oregon, alternatives are needed that enable substitution of natural gas, compressed natural gas, and electricity for applications that currently rely on gasoline and diesel fuels. An extended electrical grid outage will sideline electric vehicles. Adequate disaster response and recovery will require a range of vehicles from first responders, utility response, damage assessment, shuttles and buses. An opportunity exists to improve the resilience performance of Oregon’s energy and transportation system by taking steps to diversify the fuels used in vehicles, and emerging vehicle alternatives, that will be used by first responders and for disaster response and recovery purposes. Similar to the public benefits and risk reductions from transportation fuel diversity, we find risk reductions from fuel diversity for distributed electrical generation. The NWN energy system is designed and managed with path diversity for continuity of gas supply as well as backup generators for continuity of power for compressors during an extended electrical grid outage. R/CNG is likely to provide distributed generation during outages due to NWN’s operational procedures for damage response and restoration in the event of a disaster. Significant regulatory and planning barriers exist, and optimizing R/CNG in the fuel mix will be difficult due to siloed agency authority and existing policy initiatives. The current emphasis on

40
transportation electrification increases risk during disasters with extended electrical grid outages. The Oregon Fuel Action Plan (2017) does not mention CNG, R/CNG, or electricity as a transportation fuel, probably due to the fact that the Oregon Department of Energy that developed the plan is responsible for the petroleum sector, while the Oregon Public Utility Commission is responsible for the electricity and natural gas sectors. Existing plans do not recognize the capabilities and geographic diversity of the natural gas energy system in Oregon for R/CNG-fueled transportation, or natural gas fueled distributed generation for electric vehicle charging. While the primary focus of the study was transportation, the results indicate that the key enabler to R/CNG fuel diversity is compressor stations including both private (industry and government sites) and public access stations. But, compressor stations require the continuity of natural gas supply and/or electricity for the compressors. As a result, the key role of compressor stations expanded the current study to stationary infrastructure and failure modes and effects. The pressurized gas in the NWN energy systems represents significant distributed stored energy capabilities, and when combined with the 2,789 natural gas powered generators in the NWN service area, these assets represents a significant distributed electrical energy generation capability. This combination of distributed natural gas storage and electrical generation equate to grid-scale storage and generating reserve that has not been previously identified in the public record.

41
VII. POLICY AND PROGRAM RECOMMENDATIONS
Policy actions are needed to recognize that the natural gas system is distributed and inherently resilient and that there is a public benefit in transportation fuel diversity and distributed electrical generation fuel diversity. Investment is needed in compressor infrastructure to capture the value of fuel diversity including disaster-resilient fuel hubs, enabled by renewable energy microgrids, to support first responders and disaster response and recovery.
a. Increase Transportation Fuel Supply Diversity
A review of the existing literature reveals the stark reality that Oregon’s liquid fuel supply is highly concentrated in a single geographic location and access to these fuels by first responders, as well as disaster response and recovery vehicle operators, are expected to be in critical short supply. Further, electrification of transportation will not be useful during an extended electrical grid outage. While fuel allocation plans are in place and are being improved, the Oregon Fuel Action Plan (2017) does not even mention CNG or electricity as a transportation fuel. Accordingly, plans do not yet incorporate the capabilities and geographic diversity of the natural gas energy system in Oregon for CNG-fueled transportation or natural gas fueled distributed generation for electric vehicle charging. For these reasons, we recommend that Oregon’s disaster recovery planning activities begin to incorporate the inherent resiliency attributes of the natural gas system for supply of fuel to both transportation and stationary disaster recovery applications. The use of natural gas for fueling vehicles, recharging electric vehicles, and supporting critical stationary facilities will compliment resilient electricity services that are concurrently being pursued, such as grid-scale storage. Taken together, the use of natural gas and electricity as energy sources for recovery vehicles will significantly increase fuel diversity and provide a range of additional benefits.
Recommendation #1: Reduce Reliance on Liquid Fuels Stored at the Portland CEI Hub
Risks from the vulnerable CEI Hub can be reduced by encouraging R/CNG fuel diversity and alternatives that allow for a shift a portion of the region’s fuel reliance to other options. Policies that shift transportation fuel demand away from the vulnerable CEI Hub should be at the forefront of resiliency planning. During extended grid outages, liquid fuel stations with electric pumps may be offline.
Recommendation #2: Expand Dual-Fuel Infrastructure for R/CNG Natural Gas Compressors
Resilient infrastructure enables the use of R/CNG for transportation and ensures the continuity of natural gas supply and power for R/CNG compressor stations. Backup generators for R/CNG compressor stations should be capable of operating with multiple fuels. Investments in natural gas-powered compressor infrastructure is needed to capture the value of fuel diversity. Government interventions are needed to enhance infrastructure resilience and market transformation efforts are needed to reduce the barriers to fuel diversity and improve the availability of alternative fuel vehicles.

42
Recommendation #3: Analyze Internal and External Stakeholder Roles and Opportunities
To expand its resilience capabilities NWN should a) Develop table-top scenario planning and incident response exercises including a Failure Modes, Effects, and Criticality Analysis (FMECA). This includes a detailed review of primary, secondary, and tertiary power supplies for compressors during disasters and identify mission-critical pipeline segments for continuity of natural gas supply to compressor stations. b) Resilience efforts should also include a review of NWN organizational structures and processes that could be modified to enhance resilience practices. Responsibilities for facilities, fleets, and natural gas compressor stations spans several NWN departments and requires active engagement, requirements analysis, communication, budgeting, and project management. For instance, NWN personnel identified a need to provide backup generation to the liquid fuel pumps at the Sherwood Resource Center. c) Key external stakeholders as well as policy and regulatory barriers to expanded resilience efforts need to be identified and managed. The significant business opportunities from the wide social benefits associated with resilience programs and policies are likely to accrue to ratepayers as well as shareholders, and stakeholder consensus will likely be required to expand NWN’s resilience efforts.
Recommendation #4: Increase Public Access to R/CNG Compressors to Increase Fuel Diversity
The existing compressor installations are limited, as revealed by the stakeholder interviews for this report. Fuel diversity will be maximized when the market is engaged and regulatory barriers are minimized. There are also potential benefits to both NWN ratepayers and shareholders by improving access to R/CNG compressor stations to enhance the utilization of the NWN transmission and distribution system. For existing R/CNG compressor stations, NWN should explore regulatory approval for public access. In addition, to enhance the utilization of the NWN transmission and distribution system, NWN should reduce the barriers to the development of new public R/CNG compressor stations.
Recommendation #5: Increase Fuel Supply Diversity Through RNG/Hydrogen
In spite of its favorable GHG emissions compared to diesel, CNG is not viewed as a viable decarbonization option. Senate Bill 98 (2019) mandates 5% renewable natural gas in 2020 with increases over time. Since biomass-based sources of RNG in Oregon are limited, NWN should aggressively pursue electrolyzer-based sources of renewable natural gas and hydrogen. RNG for transportation can provide: a) Carbon-free fuel, b) Additional diversity to carbon-free transportation electrification initiatives, c) An added benefit of a higher probability of normal operations following a CSZ event, d) RNG/Hydrogen that is sourced through regional electrolyzers would further insulate the transportation system from fossil fuel price risks. There are likely significant co-benefits that would accrue to the

43
electricity grid that will be increasingly dominated by intermittent renewable electricity supplies. More information on these likely benefits from RNG/Hydrogen can be found in Dragoon (2018).50
In contrast to electric vehicles, consumer knowledge about RNG/Hydrogen is limited and this will reduce the uptake of RNG vehicles for decarbonization. Without education and customer choice, the use of RNG vehicles will remain limited. NWN should pursue an RNG/Hydrogen tariff option with the Public Utilities Commission to expand its Smart Energy and Carbon Offset offerings. The tariff would be the equivalent of PGE’s Clean Future Solar, and would enable NWN customers to buy RNG/Hydrogen output from electrolyzer projects. Additional customer demand could provide economies-of-scale for NWN electrolyzer-based RNG/Hydrogen projects.
Recommendation #6: Invest in Disaster-Resilient Fueling Hubs
Fuel diversity is essential for disaster response and recovery during extended grid outages: The design and location of the CEI Hub is a disaster waiting to happen. The vulnerability of the existing liquid fuel supply system points to the need for need for alternate points of fuel supply for emergency and recovery vehicle fleets. At a minimum, generators at compressor stations need to be dual-fueled. Fueling hubs in disaster-prone areas need to be spatially distributed and operationally resilient. Strategically located disaster-resilient fueling hubs, enabled by renewable energy and storage microgrids, can ensure that first responders and essential transportation functions are maintained. NWN is working to establish the level of confidence to which it will assign resilience attributes to certain pipeline supply points. Other utilities such as electric and water suppliers are conducting similar processes. The possibility of establishing supply points for which new analyses are conducted in order to assign these resilience attributes allows for the subsequent possibility of prioritization of resilient fueling hub locations.
The general strategy proposed for disaster-resilient fueling hub is to combine multiple energy sources. A fueling hub that is served by multiple natural gas transmission and distribution pipelines is likely to demonstrate higher resilience attributes by virtue of these redundant sources. A compounding effect occurs when combining infrastructure types such as the presence of multiple electricity distribution feeder lines or transmission lines, and distributed energy resources such as solar and battery storage. Taken together, a disaster-resilient fueling hub may be designed that will adapt to a range of disasters owing to energy system redundancy and multiple recovery modes.
For example, NWN is planning the Central Resource and Emergency Response Center in Southeast Portland. The plan calls for gasoline and diesel fueling and storage, CNG charging, and a dual-fuel diesel/natural gas standby generator sized for all anticipated loads. To fully-enable a disaster-resilient fueling hub concept,
50 Power to Gas: Opportunities for Greening the Natural Gas System. 23 Feb 2019. www.flinkenergy.com/resources/Power%20to%20Gas.pdf

44
we recommend that NWN add a large solar array that can support operations during daylight as well as charge a battery for night-time operation. Dual-fuel diesel/natural gas generators require diesel for ignition temperatures and can substitute natural gas to reduce diesel fuel burn rate. Diesel is always required for the units. So, operation will be limited to the supply of diesel fuel. A disaster-resilient fueling hub might add a natural gas turbine and a natural gas powered compressor, sized for critical loads, as redundant capabilities.
Figure 7-1: Disaster Resilient Fueling Hub
In the near-term concept, basic gasoline/diesel/CNG/EV fueling are included with a dual-fuel diesel-natural gas generator and failure modes and effects criticality analysis (FMECA) for redundancy and graceful degradation in a range of scenarios. Continuity of natural gas and power are critical. High reliability electricity sources are envisioned that would include onsite solar + storage and backup natural gas generation for the compressor station. In the future-term vision, additional capabilities are developed. Future fuel sources could include hydrogen and power to gas as well as site-specific on-site renewable energy sources (wind, geothermal, methane). Future vehicle types that are not available today would be supported, such as plug-in hybrid CNG trucks.
Vehicle Fleet
Bulk Electricity Network
NW Natural Storage
Hydrogen Production
Hydrogen Fuel Cell
Fleet Base Microgrid
Lifeline Energy
Corridors
Solar
Onsite Storage
Generation
Battery storage
CNG
Diesel
Gasoline
Distributed Biogas
Production
Battery Electric
Plug In Hybrid
CNG
Conventional
Compressor Hydrogen
Compressor
Fuel Pump
Fuel Pump

45
b. Invest in Resilient Clean Vehicles and Infrastructure
Public benefits are likely to result from reducing our reliance on liquid fuels in the full range of disaster scenarios, including the worst-case Cascadia Subduction Zone Event. Reduced GHG and particulate matter emissions can also be achieved by the replacement of gasoline and diesel with renewable energy derived from natural gas vehicle fleets. Specific investments should be targeted in areas where clean energy goals overlap with transportation resilience requirements As transportation energy supply alternatives to the CEI Hub are developed, resilience planners have the ability to influence the fuel types for which new supporting infrastructure will be built. This presents an opportunity to specify fleet procurement of bi-fuel CNG/gasolene vehicles. Because of the robust resilience requirements for first responders and disaster recovery transportation applications, the interdependencies between natural gas and electricity should be considered. For example, a fleet of electric vehicles that includes resilience capabilities must consider electricity sources during a prolonged outage following a disaster. In total, the set of challenges and opportunities facing resilience planners with respect to fuel types and technology availability points to the need for a multifaceted program of resilient clean energy investments for transportation applications. The primary justification for such an effort is to present resilience planners with defined pathway that will allow them to avoid use of single fuels in favor of CNG/ petroleum bi-fueled vehicles, RNG, and electricity. One of these opportunities is the resilient fueling hub described in the next section.
Recommendation #7: Invest in Resilient Clean Vehicles Through Procurement Standards and Pilot Programs
NWN and other stakeholders should initiate a study of the determinants of cost-effectiveness for CNG vehicles. The study should include historical CNG fleet operating use cases, CNG fuel supply availability, and surveys of fleet managers and procurement specialists. Based on the results of the study, public fleet procurement requirements should mandate fuel-diverse vehicles including redundant CNG/gasoline and CNG/diesel. These procurement requirements could also be extended to third-party government contractors for fleets that include first responders, buses and other vehicles that could provide critical services. These procurement standards would diversify the existing electric vehicle mandates in Oregon and provide net social benefits as well as resilience capabilities.
NWN should work with industry and other stakeholders to develop pilot programs for less commercially mature technologies such as R/CNG plug-in hybrid electric vehicles. Pilot programs that invest in R/CNG plug-in hybrids will enhance fuel diversity, disaster resilience, and decarbonization. Subsequent market transformation efforts based on the results of the pilot programs are likely to increase the availability of different types of R/CNG hybrid vehicles at reduced costs.

46
VIII. AREAS FOR FUTURE STUDY
The energy sector in Oregon is changing rapidly due to new technologies and policies to mitigate climate change. Energy resilience is a relatively new addition to an already crowded energy policy space. This study has identified resilience planning as a wide-open playing field for NWN as well as the State of Oregon. Because energy resilience planning resides at the intersection of electricity, transportation, and natural gas there is much work that needs to be done, both on technology development as well as resilience policy and programs. PSU has developed several ideas for future research but the following list is not anywhere near exhaustive.
1. CNG Fleet Use-Cases, Operating Results, and Procurement Recommendations
This proposed study is derived from Recommendation #6 and identifies the determinants of cost-effectiveness for CNG vehicles. The study would include historical CNG fleet operating use-cases (in Oregon and other jurisdictions) as well as CNG fuel supply availability. Based on the results of the study, the study would make recommendations about public fleet procurement requirements for CNG/gasoline and CNG/diesel. This would include which agencies and third party contractors would be subject to R/CNG procurement mandates, as well as the CNG supply infrastructure required to make the procurement program successful.
2. Barrier Analysis and Stakeholder Modeling for Transportation R/CNG
This proposed study is derived from Recommendation #3 and analyzes the external stakeholders and regulatory and market barriers to greater deployment of R/CNG fueling stations and vehicles. The study includes a literature review of barriers to new liquid fuel infrastructure from other jurisdictions, conducts surveys of US and Oregon experts on R/LNG barriers and barrier removal strategies. Using snowball sampling methods, it identifies the key external stakeholders required to further R/CNG infrastructure. Game theoretic tools can be used to simulate the probability of specific policies being enacted based on the stakeholders’ preferences, salience on the issue, as well as their influence in enacting the policy. This study could be extended to perform a similar analysis for RNG/Hydrogen as a bulk NG and electricity fuel. Collaborations with Portland Community College could be considered to increase the availability of CNG technicians and methods for the cost-effective replacement of CNG tanks in vehicles.
3. Transportation Fuel Diversity Modeling
The primary question under this proposed study is how much liquid fuel from the CEI Hub can be displaced if a major proportion of disaster recovery vehicles and other critical fleet vehicles use R/CNG? This study first identifies transportation fuel consumption from the population of disaster recovery vehicles. Then it develops feasible scenarios for the penetration of R/CNG vehicles and analyzes their possible use during a CSZ event. The social benefits from additional disaster response vehicles that remained in services due to R/CNG would be estimated. This study would leverage the recent NREL presentation about transporation fuel diversification for the DOE Clean City Coalitions.

47
4. Clean Vehicle Infrastructure Investment Policy
This proposed study performs and analysis of best-practice market transformation initiatives that can accelerate the business case for advanced clean vehicles with integrated fuel diversity. It uses program and policy outcomes from US and international jurisdictions. One task under the study is to develop policy and program effectiveness, efficiency and equity evaluation criteria. This study could be extended to examine the BAU macroeconomic effects of fuel and fleet diversity requirements on the regional economy.
5. Analysis of Natural Gas System Resilience
This proposed study is derived from Section V.A. to conduct a vulnerability-risk assessment to enhance the natural gas system resilience. The study would assist NWN with the following tasks:
Define a process to select post-disaster gas delivery points.
Define discrete points of gas delivery to be assessed.
Define natural gas source continuity probability.
Define mission-critical pipeline segments between sources and delivery points.
Perform seismic performance analysis on the mission-critical segments.
Perform post-disaster mitigation exercises.
6. Design for the Disaster Resilient Fueling Hub Pilot Project
This proposed study develops the design and location requirements for disaster resilient fueling hubs. Fueling hubs are not a new concept, as evidenced by the “West Coast Green Highway” in Oregon and Washington, led by the WA Department of Transportation.51 While in theory, these hubs along I-5 are supposed to supply biodiesel, hydrogen, and natural gas, they are largely EV charging stations. From a resilience standpoint, the existing hubs are not designed to provide fuel during an extended grid outage. The following analysis steps are pertinent to resilience planners in considering the merits of specific fueling hub locations:
Establish the minimum energy supply resilience attribute standards for a disaster resilient fueling hub.
Establish the methodology by which energy sources may be shown to meet these standards.
Design the hub to be profitable during BAU conditions, including acting as a distributed energy resource for the electricity grid.
Location selection criteria would also be developed to identify existing hubs or new locations to develop resilient hubs based on customer demand.
51 http://www.westcoastgreenhighway.com/#/find/nearest

48
The study would also explore financing options such as collaboration between NWN, PGE, Peterson Power/CAT, as well as government (US DOE, ODE, DOT, DEQ) incentives that can help develop a pilot project for a disaster resilient fueling hub. The study could also identify incentives and policies that would make the model of a disaster resilient fueling hub be attractive to large truck stops, such as Jubitz.
7. Quantify Distributed Generation from Natural Gas Generators
This proposed study option examines the electrical grid and disaster response benefits from the 2,789 NG standby generators and 3-3.5 million therms of linepack. Surveys for the standby generator owners would be developed that include the building type, kW rating, genset type to determine efficiency, the type of load served (emergency lighting and occupancy, space conditioning, transportation, etc), critical site kW load, as well as on-site liquid fuel supplies. The first goal is to inventory and characterize the NG genset resources, and to estimate their runtime following a CSZ event that disrupts the electrical grid. Another goal is to estimate the kWh export potential to the grid for support during disasters, given critical loads at each site. Electric utilities could partner on this portion of the study to simulate the potential benefits to local electrical circuits. The second goal is to estimate the supply potential for EV disaster response vehicle charging.
8. R/CNG Vehicle, Generator, Compressor and Microgrid Technician and Engineer Education and Training Collaborative
Fleet numbers are declining, largely due to the required recertification of CNG cylinders in vehicles. First responder vehicles with CNG alternatives are under development. Technical solutions exist, and are under development, for vehicles, generators, and compressors regarding fuel alternatives and hybridization that require technicians, engineers, and business case development. This proposed study would benchmark technician and engineering education and training in the United States, Canada, and Europe to determine best practices. For example, UBC……. The best practices would form the basis for a proposed Collaborative led by NW Natural with universities and technical colleges in the Pacific Northwest, centered in the Portland metropolitan area, as well as industry members who develop vehicles, generators, compressors, and microgridsprovide R/CNG conversion kits, and maintain fleets. The Collaborative’s mission would be to identify problems and barriers to R/CNG implementations that can be mitigated through education and training. The Collaborative would propose coursework and certifications, match problems with solutions, and deliver education and training.